Startup salaries are moving up and to the right. Across all ranks and all roles, the average salary for new hires at startups in June 2025 was 5.8% higher than it was roughly three years ago, back in April 2022.
Much of this growth in the compensation market has occurred in just the past year and a half. The average startup salary has now increased by nearly 5% since January 2024, reversing a trend of salary declines that extended through much of 2023.
Which employees are seeing the biggest gains? Between April 2024 and June 2025, the average salary for new hires in legal job functions increased by 10%, climbing to $183,000. The product, design, and marketing job functions have seen significant salary gains of their own. As of June, product is now tied with engineering as the function with the highest average new-hire salary, at $189,000.
And what about AI? Depending on the size of the company, the median salary for new AI/ML engineering hires rose by somewhere between 5.4% and 9.1% between January 2024 and June 2025.
These AI/ML salaries have been rising most quickly at younger companies: Among startups valued between $1 million and $10 million, the median salary for new AI/ML engineers is up 9.1% over the past year and a half, while the 90th percentile salary is up 9.5%.
H1 2025 key takeaways
Startup job movement continues to slow: Compared to the same period a year ago, companies on Carta logged fewer new hires, fewer job departures, and fewer layoffs during the first half of 2025. Changing jobs is considerably less common among startup employees today than it was during the hectic market that emerged in 2021 and 2022.
Hardware startups keep hiring: In the hardware sector, startups combined to make 1.3 new hires for every job departure they experienced during H1 2025. That’s the highest rate of headcount growth for any major startup sector so far this year, followed by medical devices (1.2 hires per departure).
New hires tilt toward engineering and sales: Over the past several years, engineering and sales roles have begun to make up a larger percentage of all new hires made by startups on Carta, while the frequency of new hires in operations has been in decline. In H1, about 29.7% of all new hires were in engineering, and another 16.6% were in sales.
Hiring & headcount
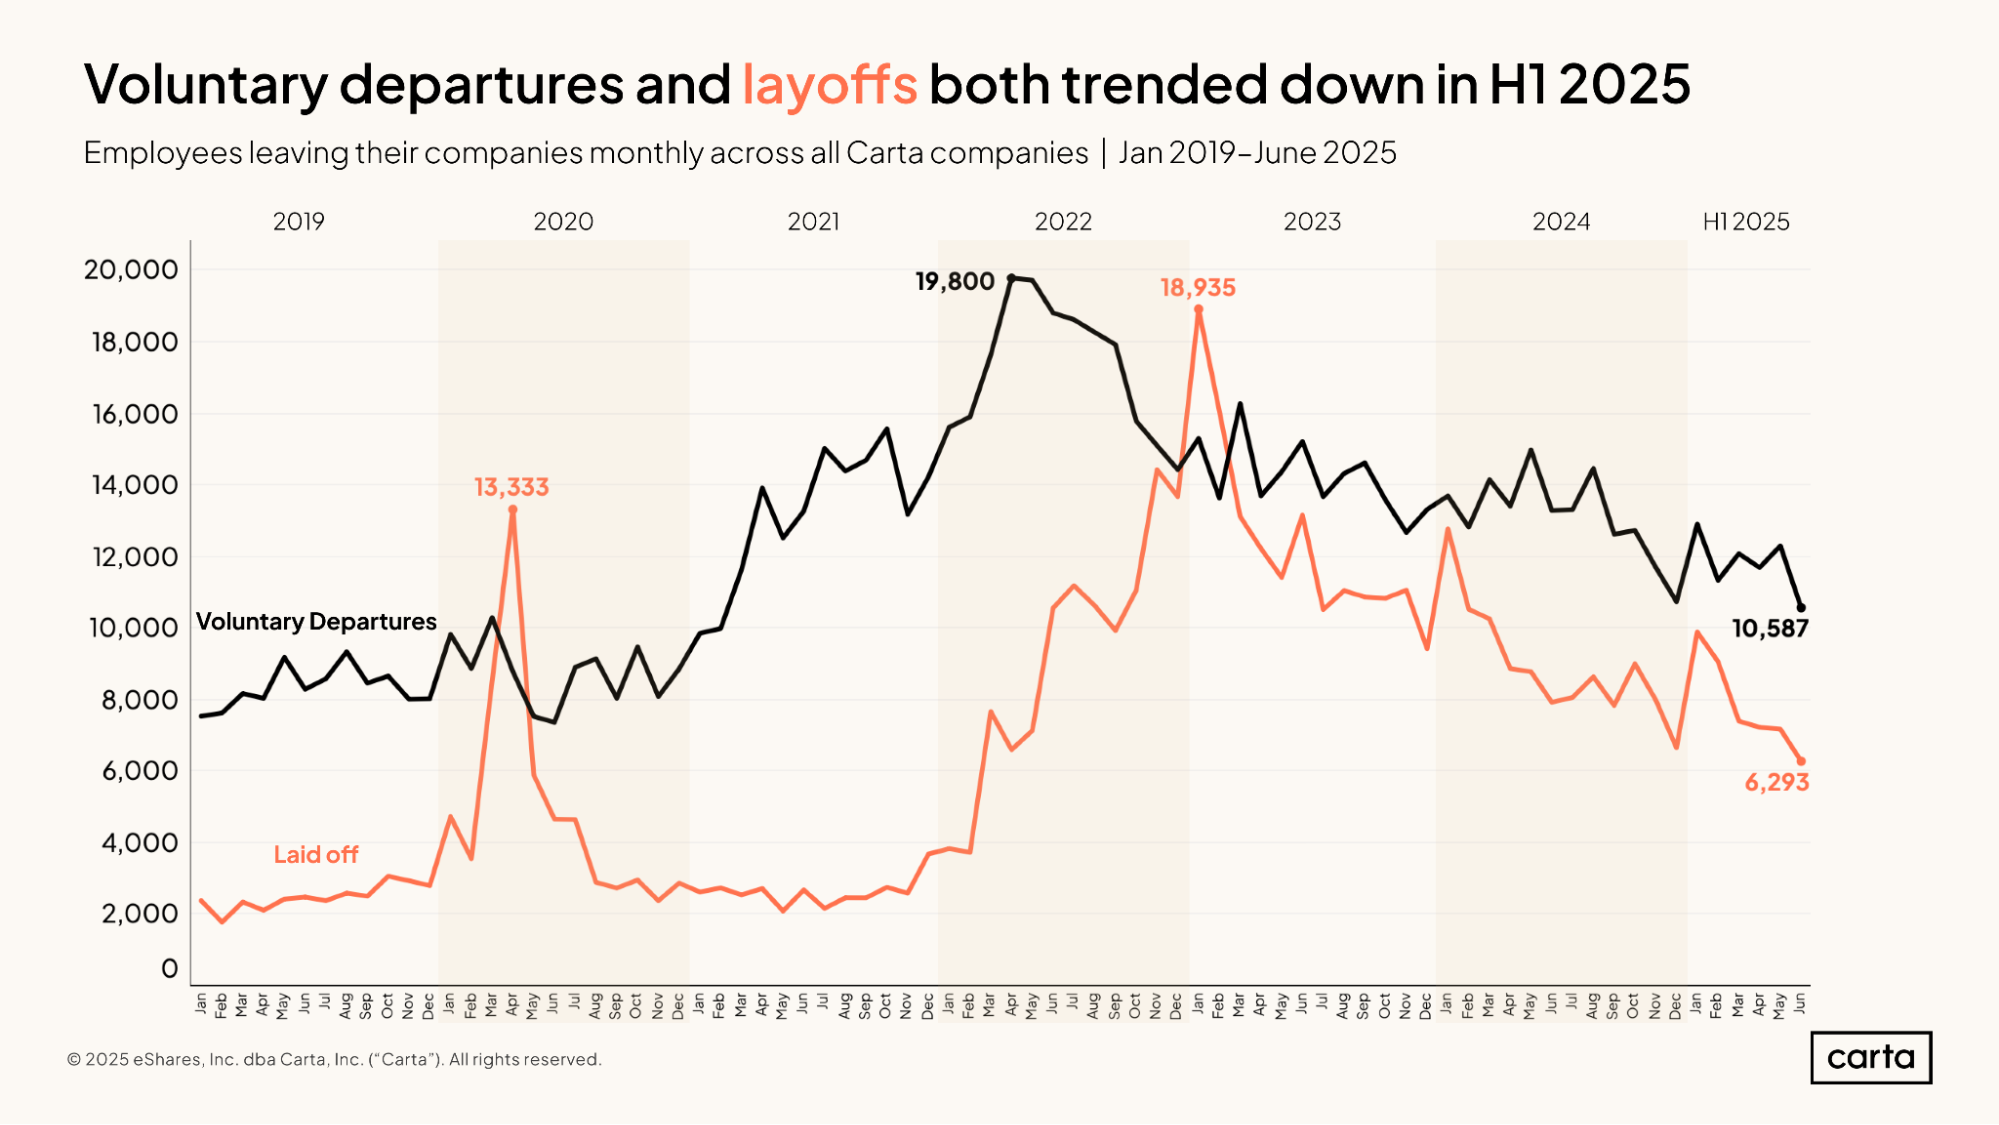
In June, companies on Carta combined to see 10,587 employees leave their roles by choice, while another 6,293 employees were laid off. Both of these figures will likely continue to rise in the weeks to come as more employee movement is logged on the platform. From a macro perspective, however, both figures continue a trend of reduced job movement among startup employees that has been underway for well over two years.
Compared to the recent peak of voluntary job departures that occurred in April 2022, the most recent month’s numbers are down 47%. Layoffs have fallen off even more sharply, with June’s results representing a 67% decline from the highs of January 2023.
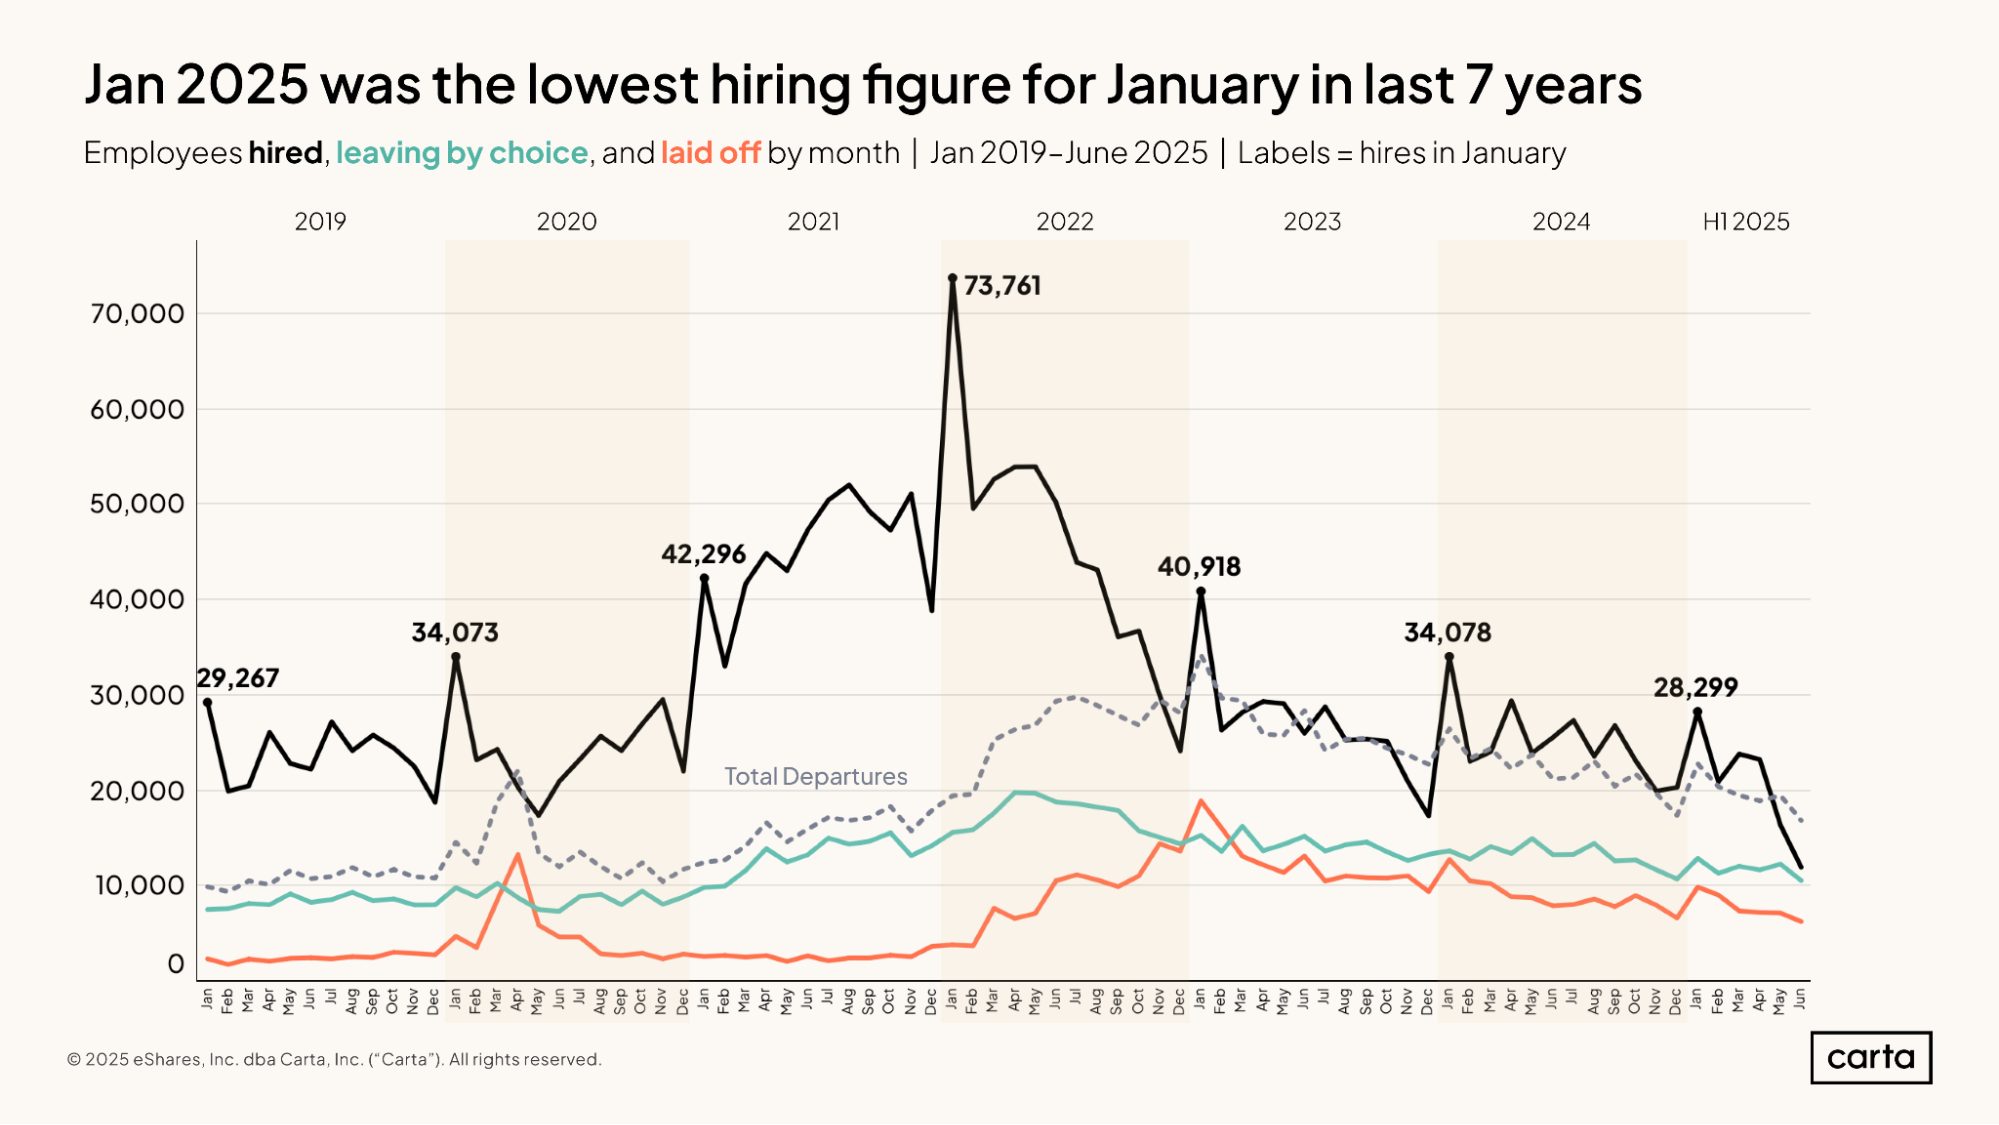
An ongoing trend of startups making fewer new hires has continued during the first half of 2025. In January, which is typically the busiest month for hiring, startups brought on 28,299 new workers, a 17% decline from January 2024. Hiring has now declined in three straight Januaries, falling off 62% from a recent high point of 73,761 new hires in January 2022.
For most of the past two and a half years, the total number of new hires by companies on Carta has tracked relatively closely with the total number of job departures. Both numbers have been generally trending down since a surge in job movement that occurred during the post-pandemic market of 2022 and 2023.
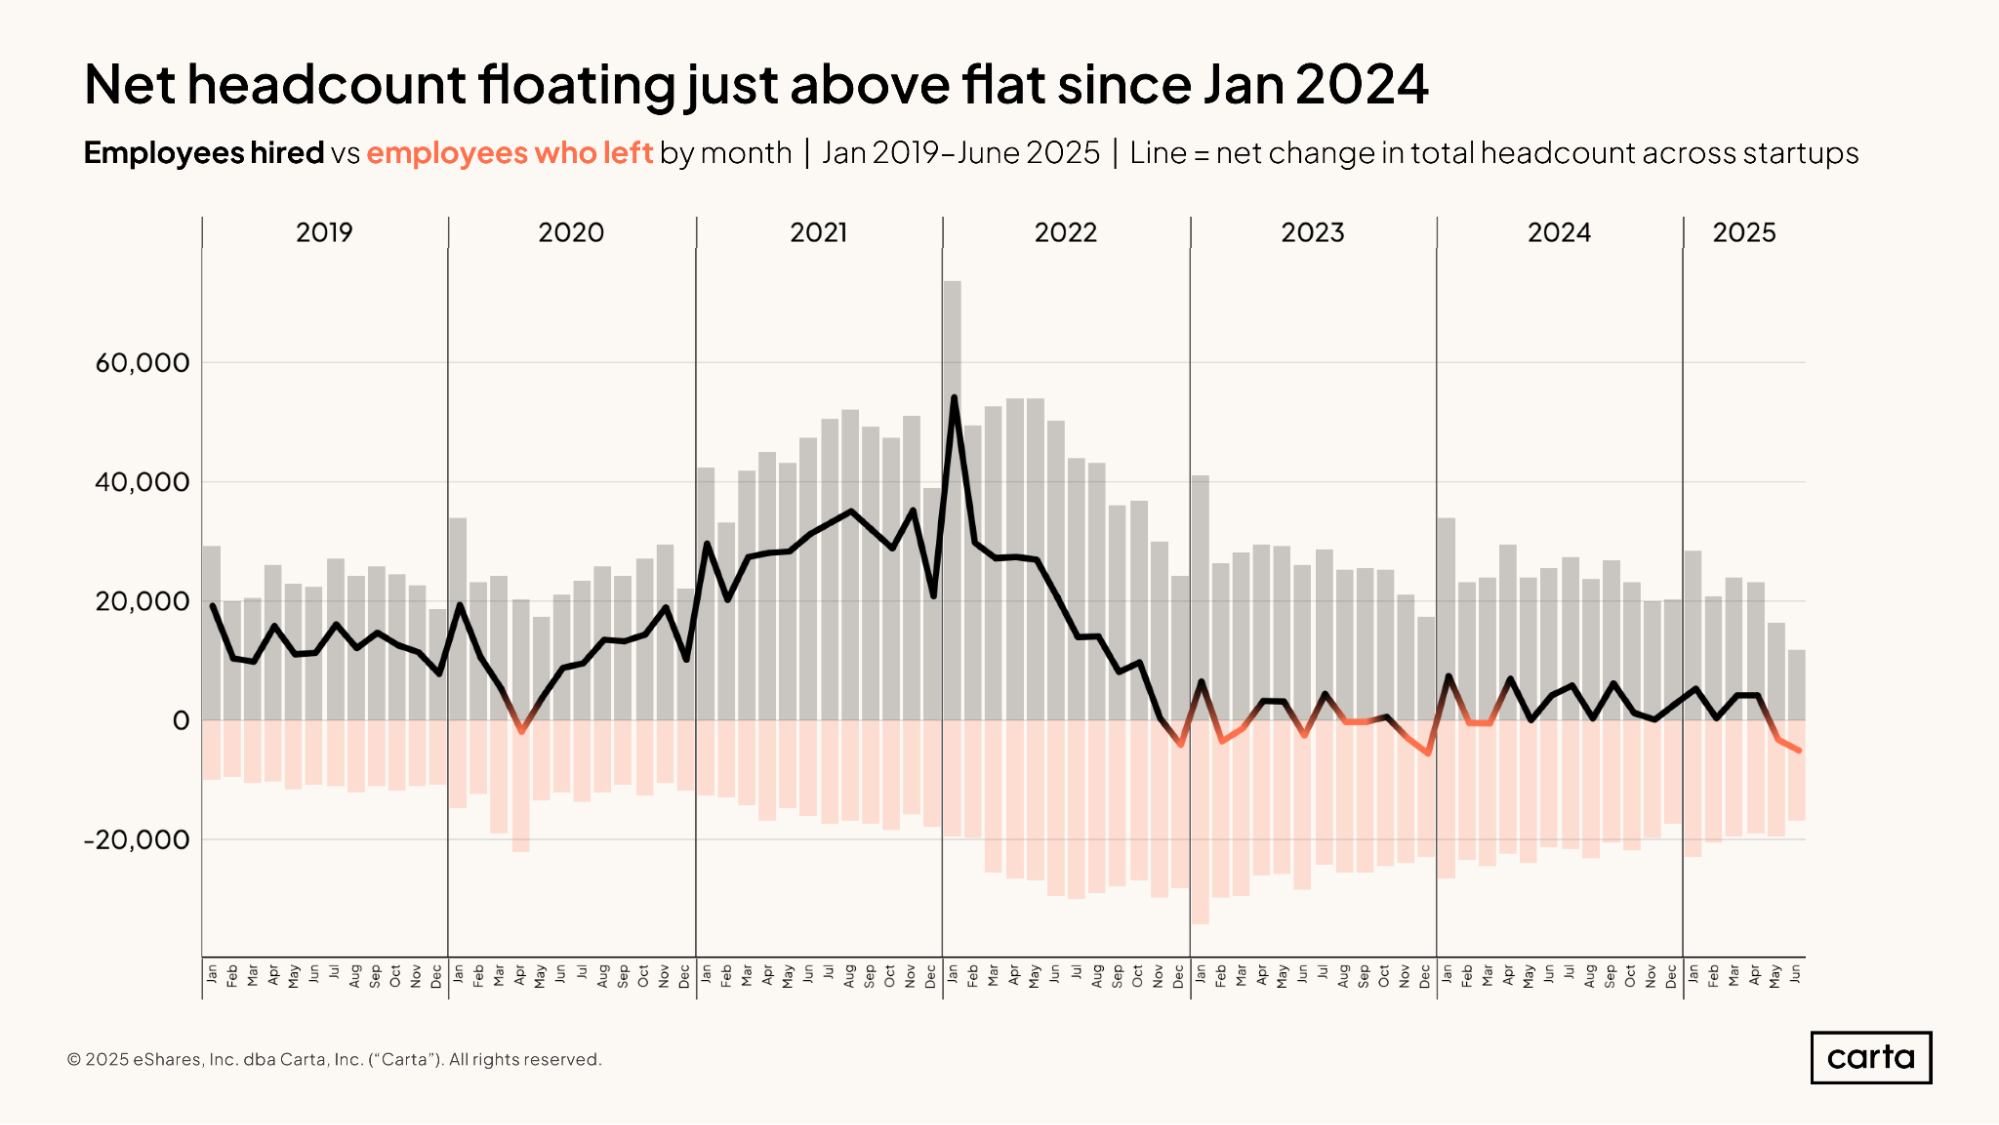
From the start of 2019 through the end of 2022, there were typically more new employees hired by companies on Carta each month than there were job departures. During 2021 and the first half of 2022, hiring sometimes outpaced departures by a rate of more than 25,000 employees per month.
Since the start of 2023, however, the job market has changed, with monthly net headcounts typically hovering closer to zero. After expanding rapidly for many years, the startup employment market has begun to grow at a much slower rate.
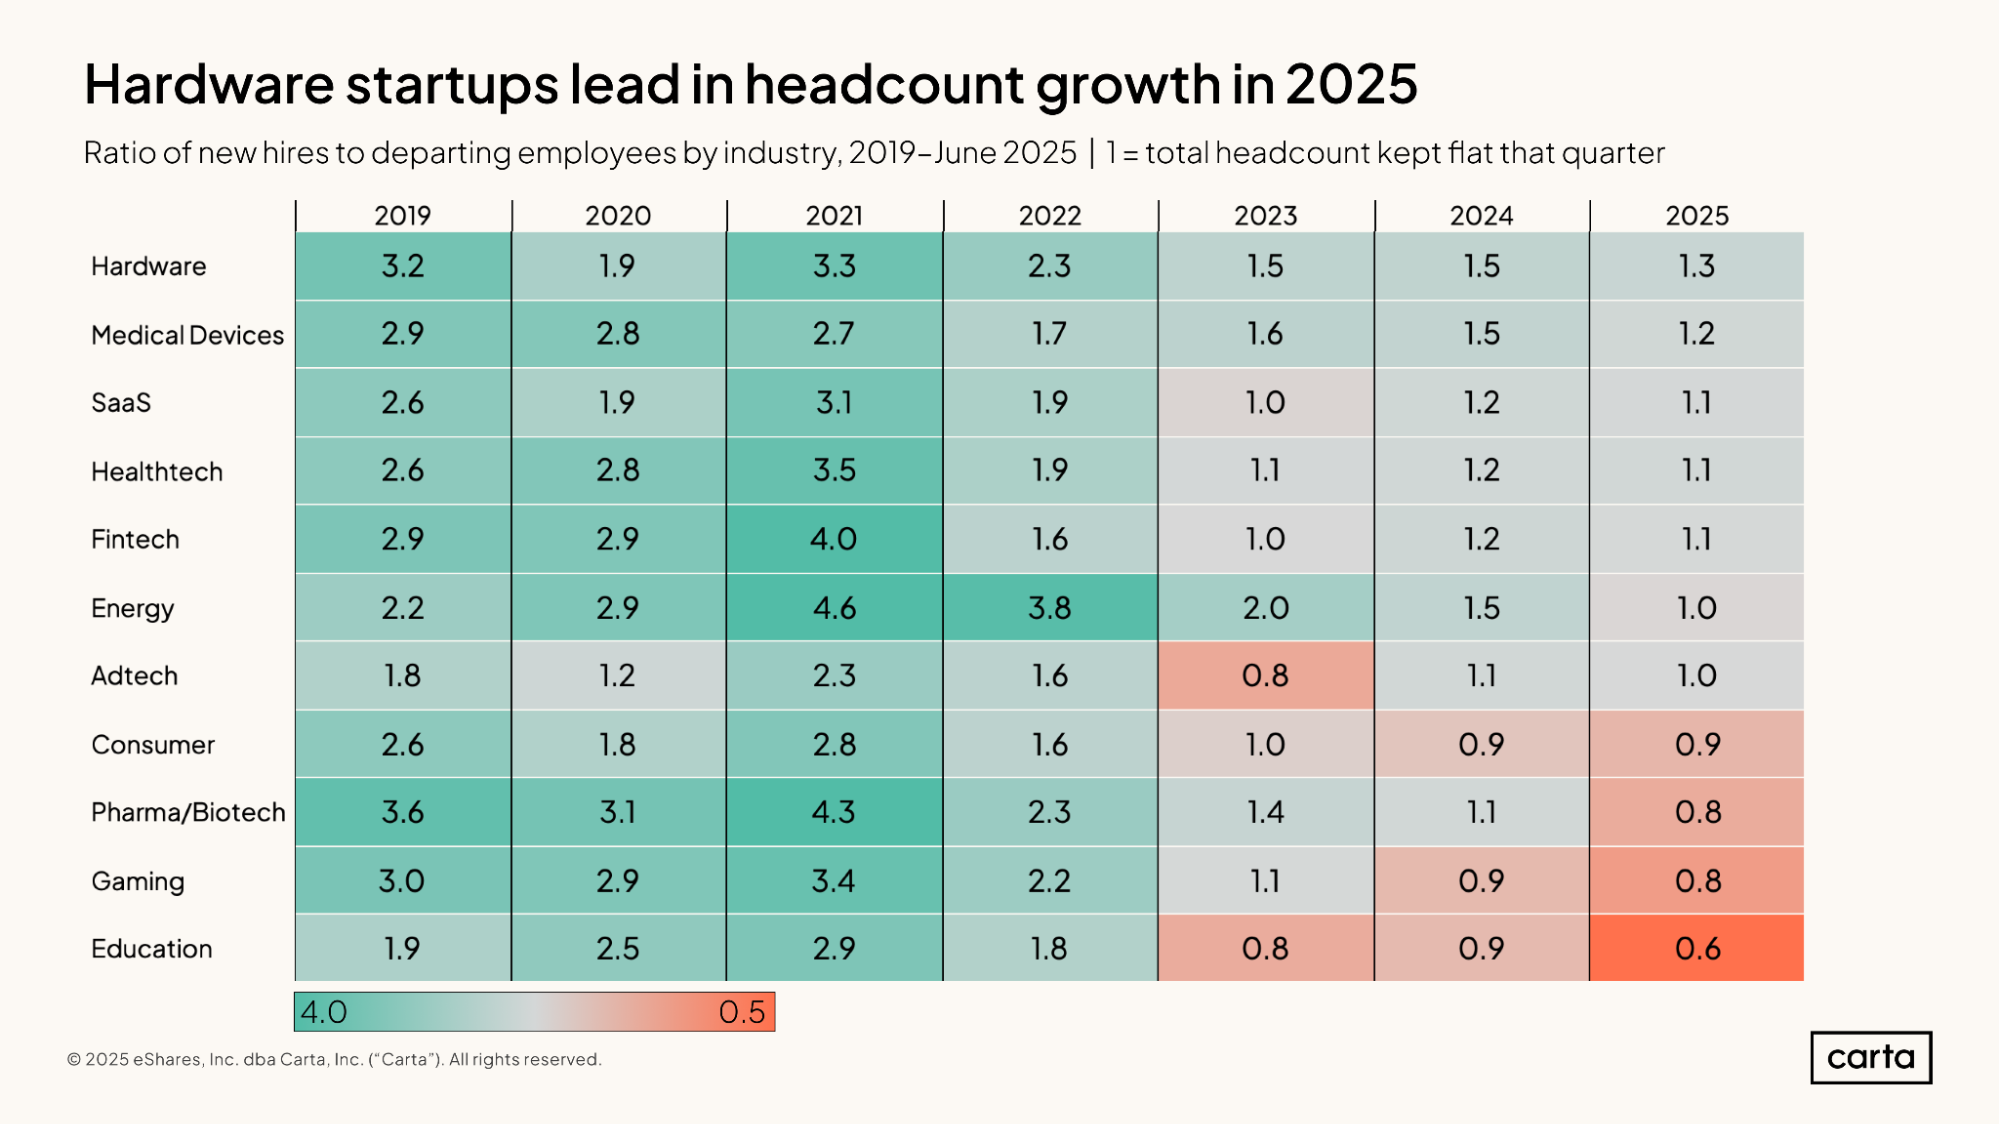
In 2025 so far, startups across the hardware sector have made 1.3 new hires for every one employee who has left their role. This is the highest ratio of hires to departures in any sector this year—but it’s also the lowest ratio of hires to departures within the hardware sector in the past seven years. In every sector, the ratio of hires to departures was lower in the first half of 2025 than in any full year from 2019 through 2022.
Headcount is shrinking the fastest in the education sector, where there were 0.6 new hires for every departure in H1 2025. This marks the third straight year that net headcount in education has been in decline. Net headcount is also dropping in consumer, pharma/biotech, and gaming.
Company composition
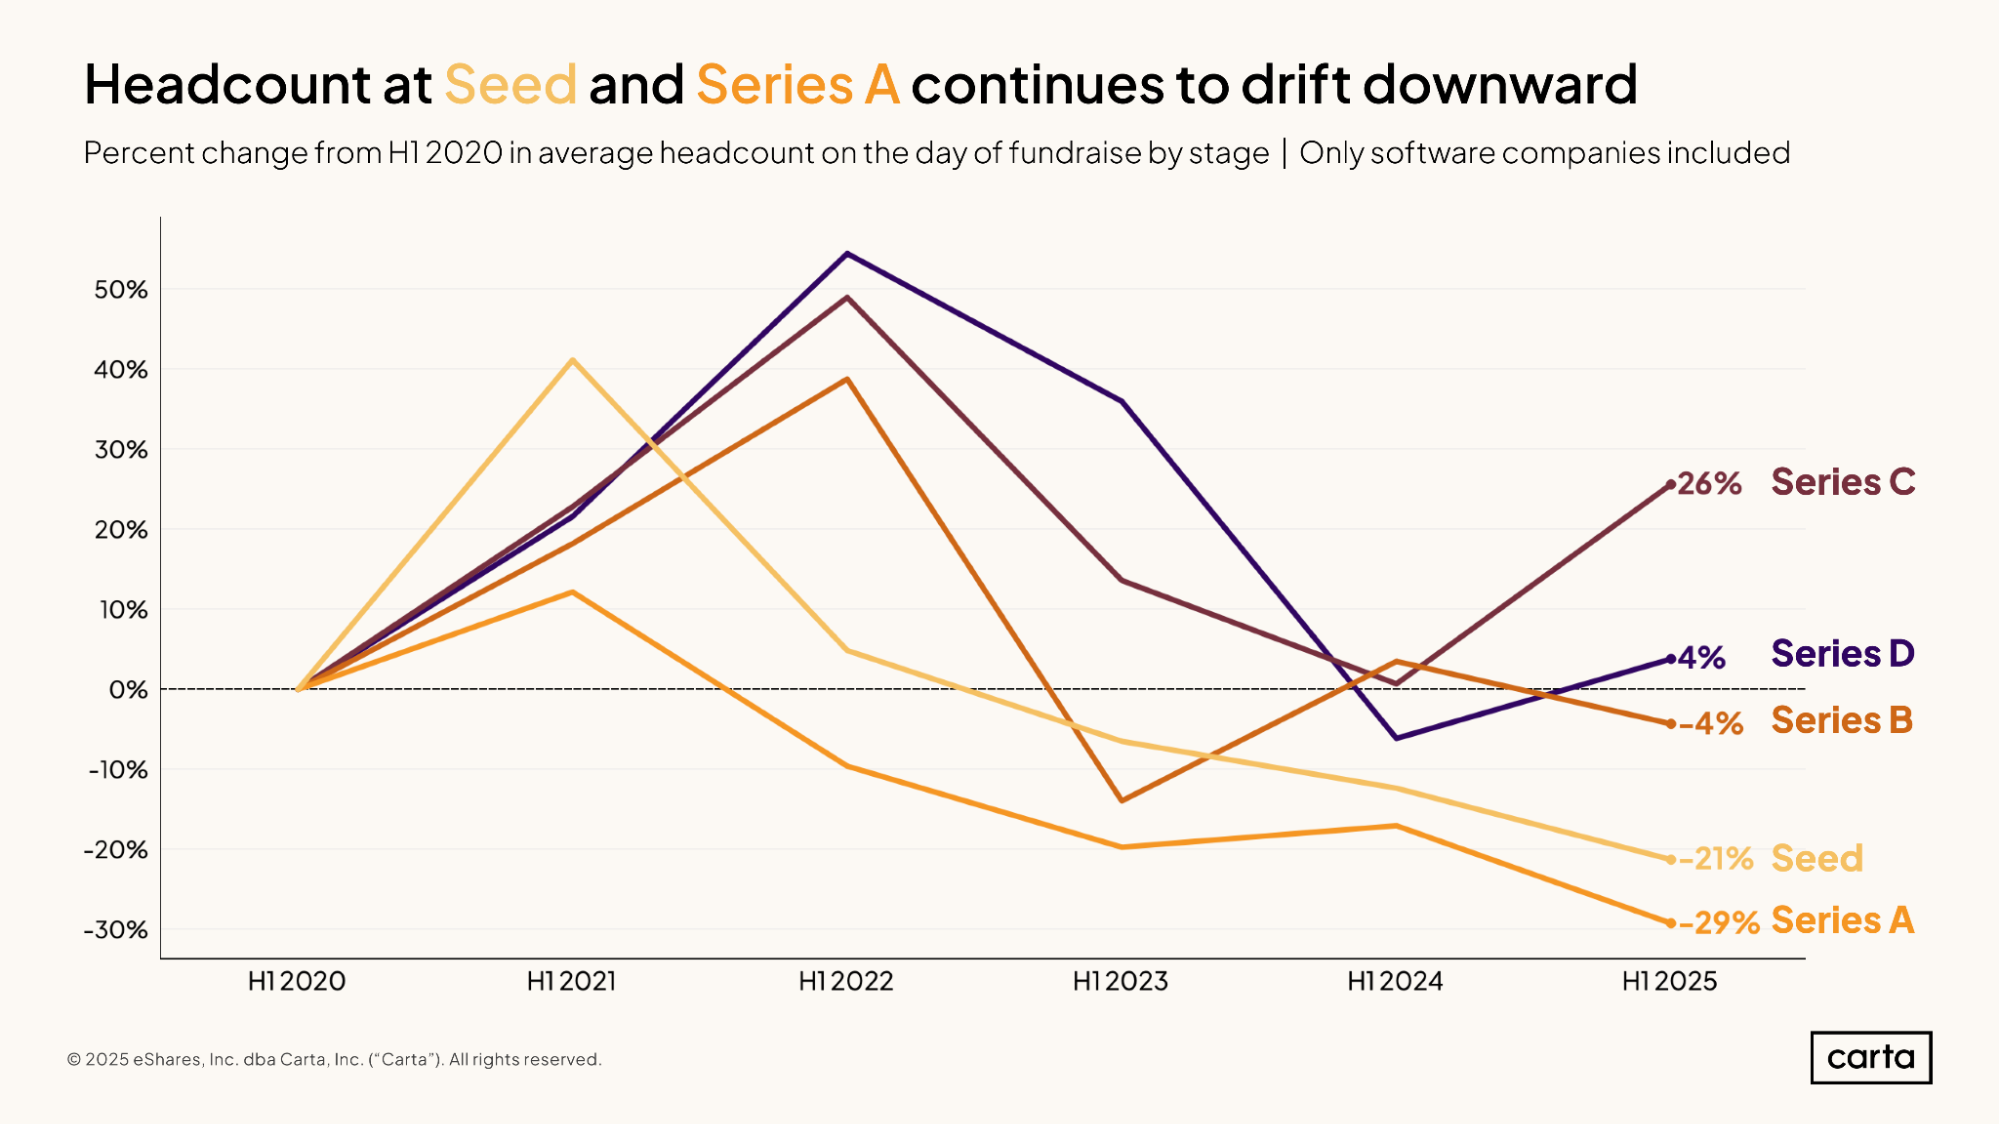
Compared to the same period five years ago, the average startup that raised a seed round in H1 2025 had 21% fewer employees, while the average Series A startup had 29% fewer employees. These reductions in early-stage headcount have largely been made possible by the rapid rise of AI: More and more founders are choosing to operate with leaner teams at the early stages, leveraging AI to accomplish much more with small staffs than was previously possible.
At later stages, however, average headcounts have held much more steady over the past five years—or, in the case of Series C, have increased significantly. While these later stages experienced explosive headcount growth between H1 2020 and H1 2022, both Series C and Series D have also seen renewed growth in average headcounts over the past year.
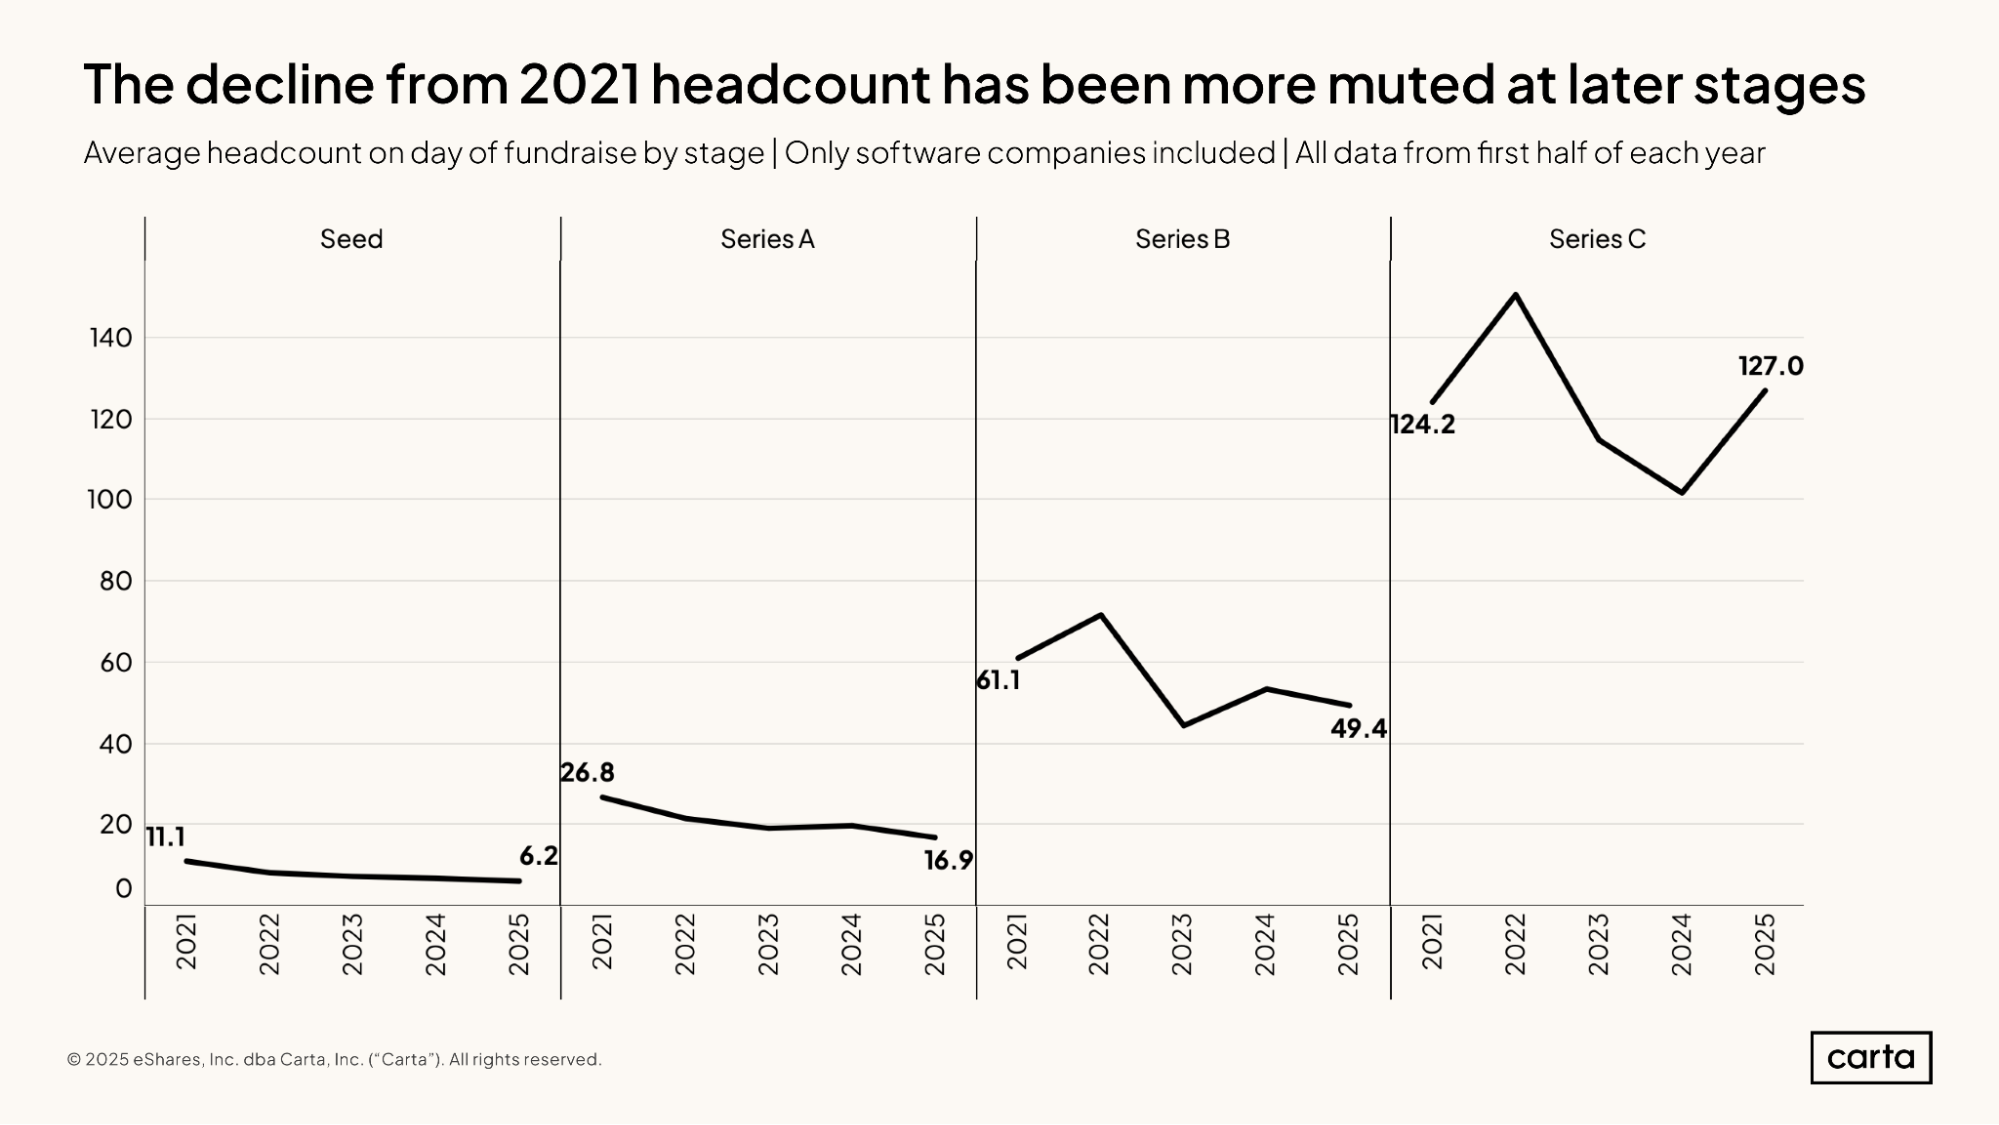
The average startup on Carta that raised seed funding in 2021 had 11.1 employees. So far this year, the average startup closing a seed round has just 6.2 employees. In the span of four years, the typical seed-stage team has shrunk by 44%.
This trend is less pronounced in the later stages of startup life. Compared to 2021, average team size in H1 2025 was down 37% at Series A and 19% at Series B. At Series C, average headcount is actually 2% higher so far this year. As startups move from one fundraising stage to the next, average headcount typically increases by somewhere between 2x and 3x.
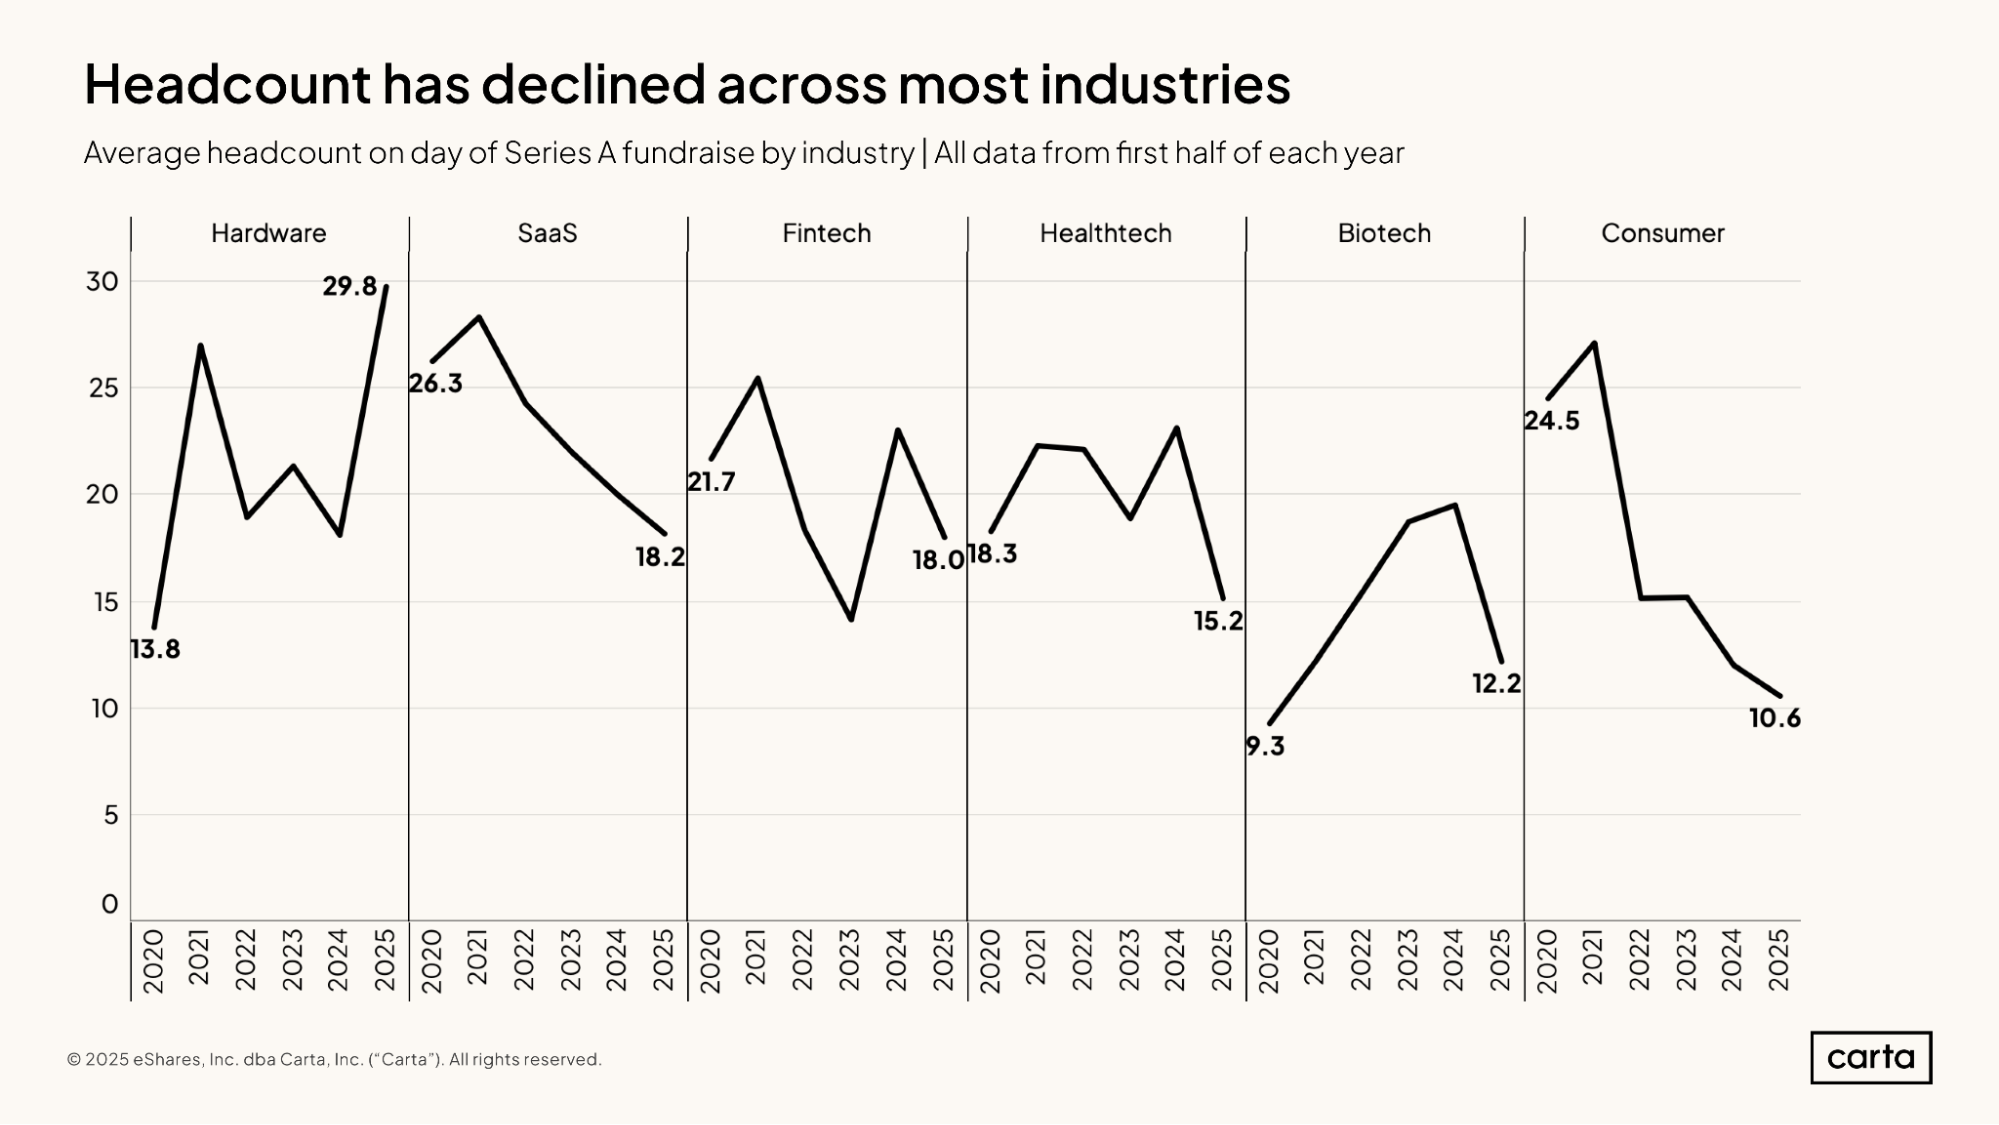
The average hardware startup that raised new Series A funding so far this year had 29.8 employees, up 116% compared to the average Series A headcount in the sector five years ago. But in this explosive recent headcount growth, the hardware sector is a clear exception.
In other key industries for startup fundraising—including SaaS, fintech, and healthtech—average Series A headcount is substantially lower in 2025 than it was back in 2020. The largest dropoff has occurred in the consumer space, where average headcount at Series A has declined by 57% over the past five years.
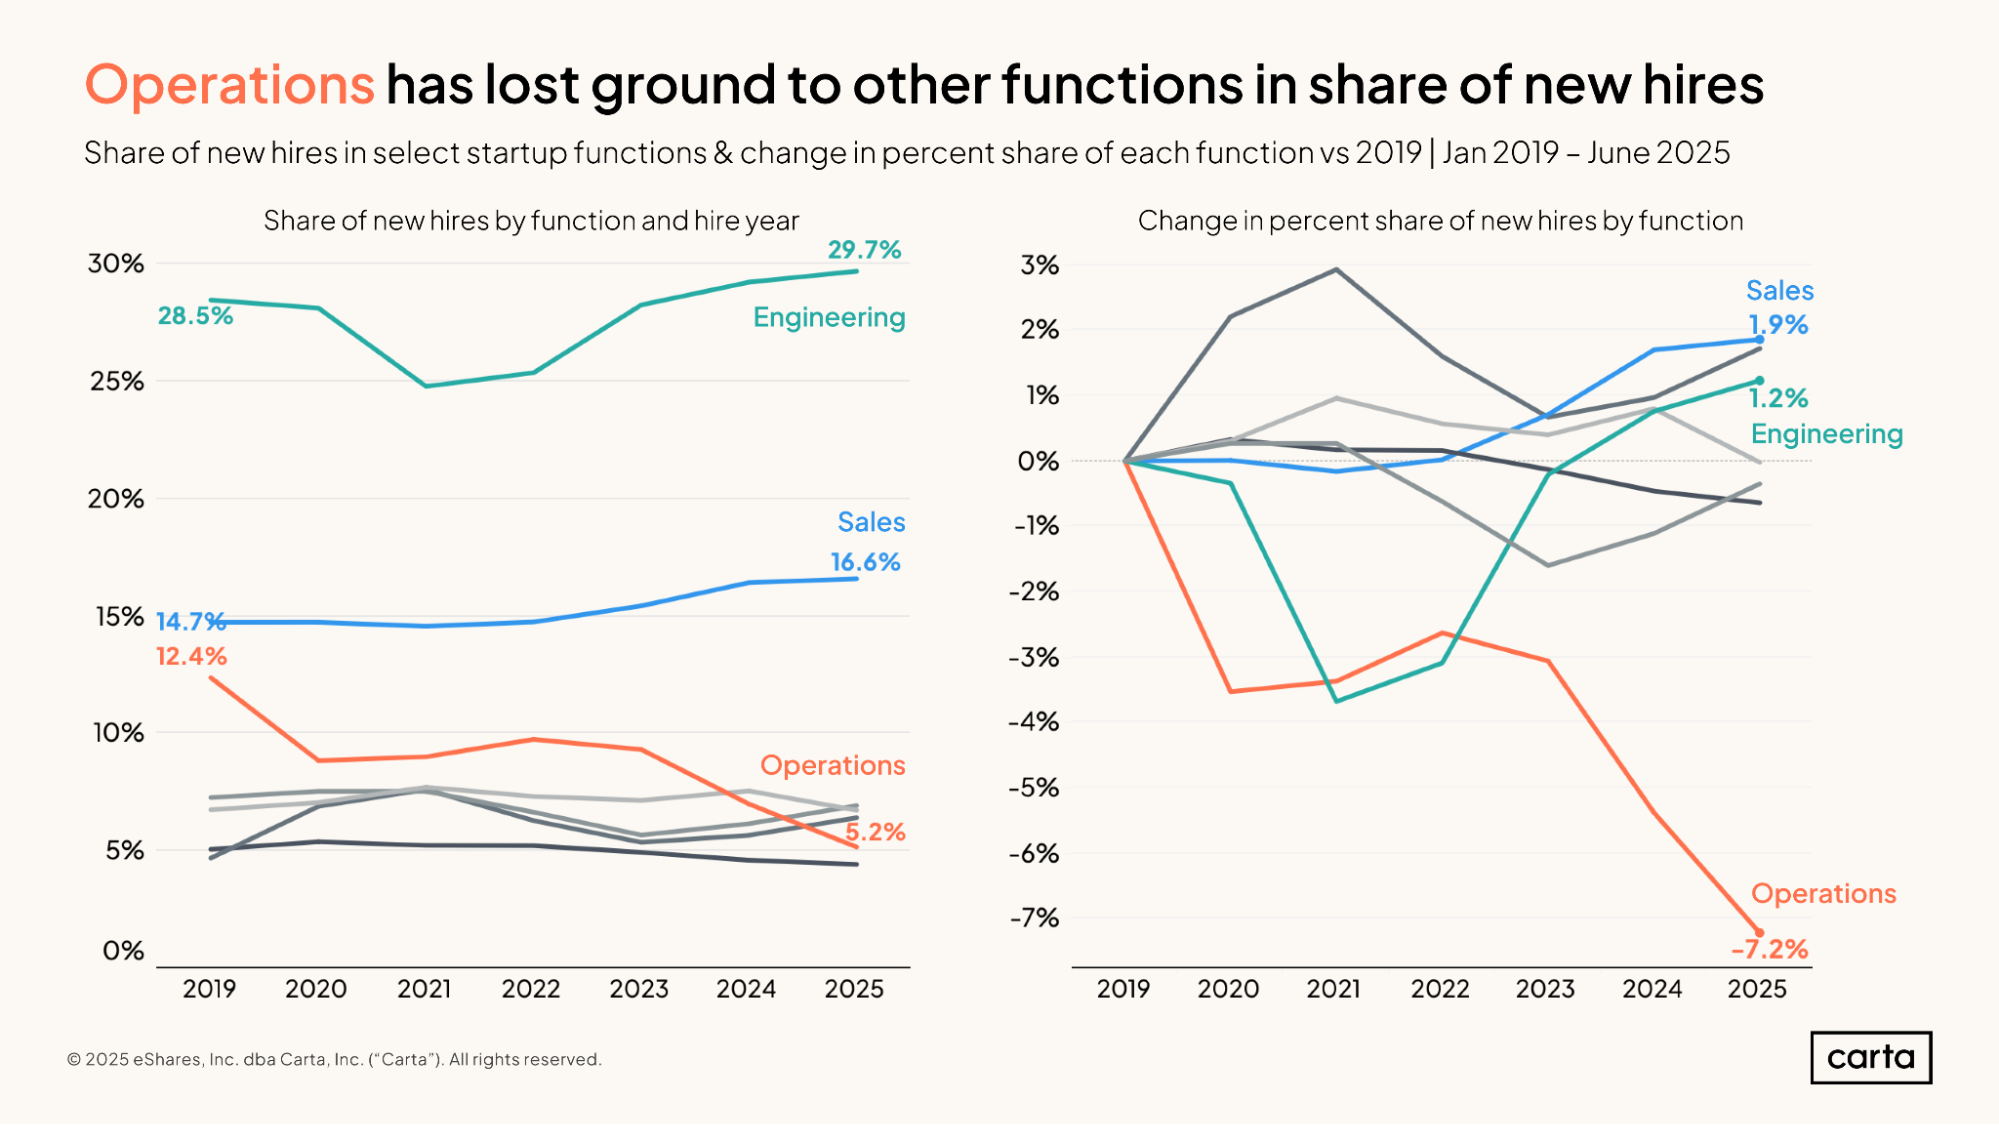
Compared to six years ago—and even compared to two years ago—startups on Carta are devoting a smaller percentage of new hires to operations functions and increasing their commitment to engineering and sales.
In the first half of 2025, about 5.2% of new hires were in operations roles, compared to 12.4% back in 2019. That’s a decline of 7.2 percentage points. Over the same span, the rate of new hires in sales has risen from 14.7% to 16.6%, and the rate of engineering hires has climbed from 28.5% to 29.7%. Engineering has always been the core job function for many tech startups, but today, engineers make up a higher percentage of new hires than ever before.
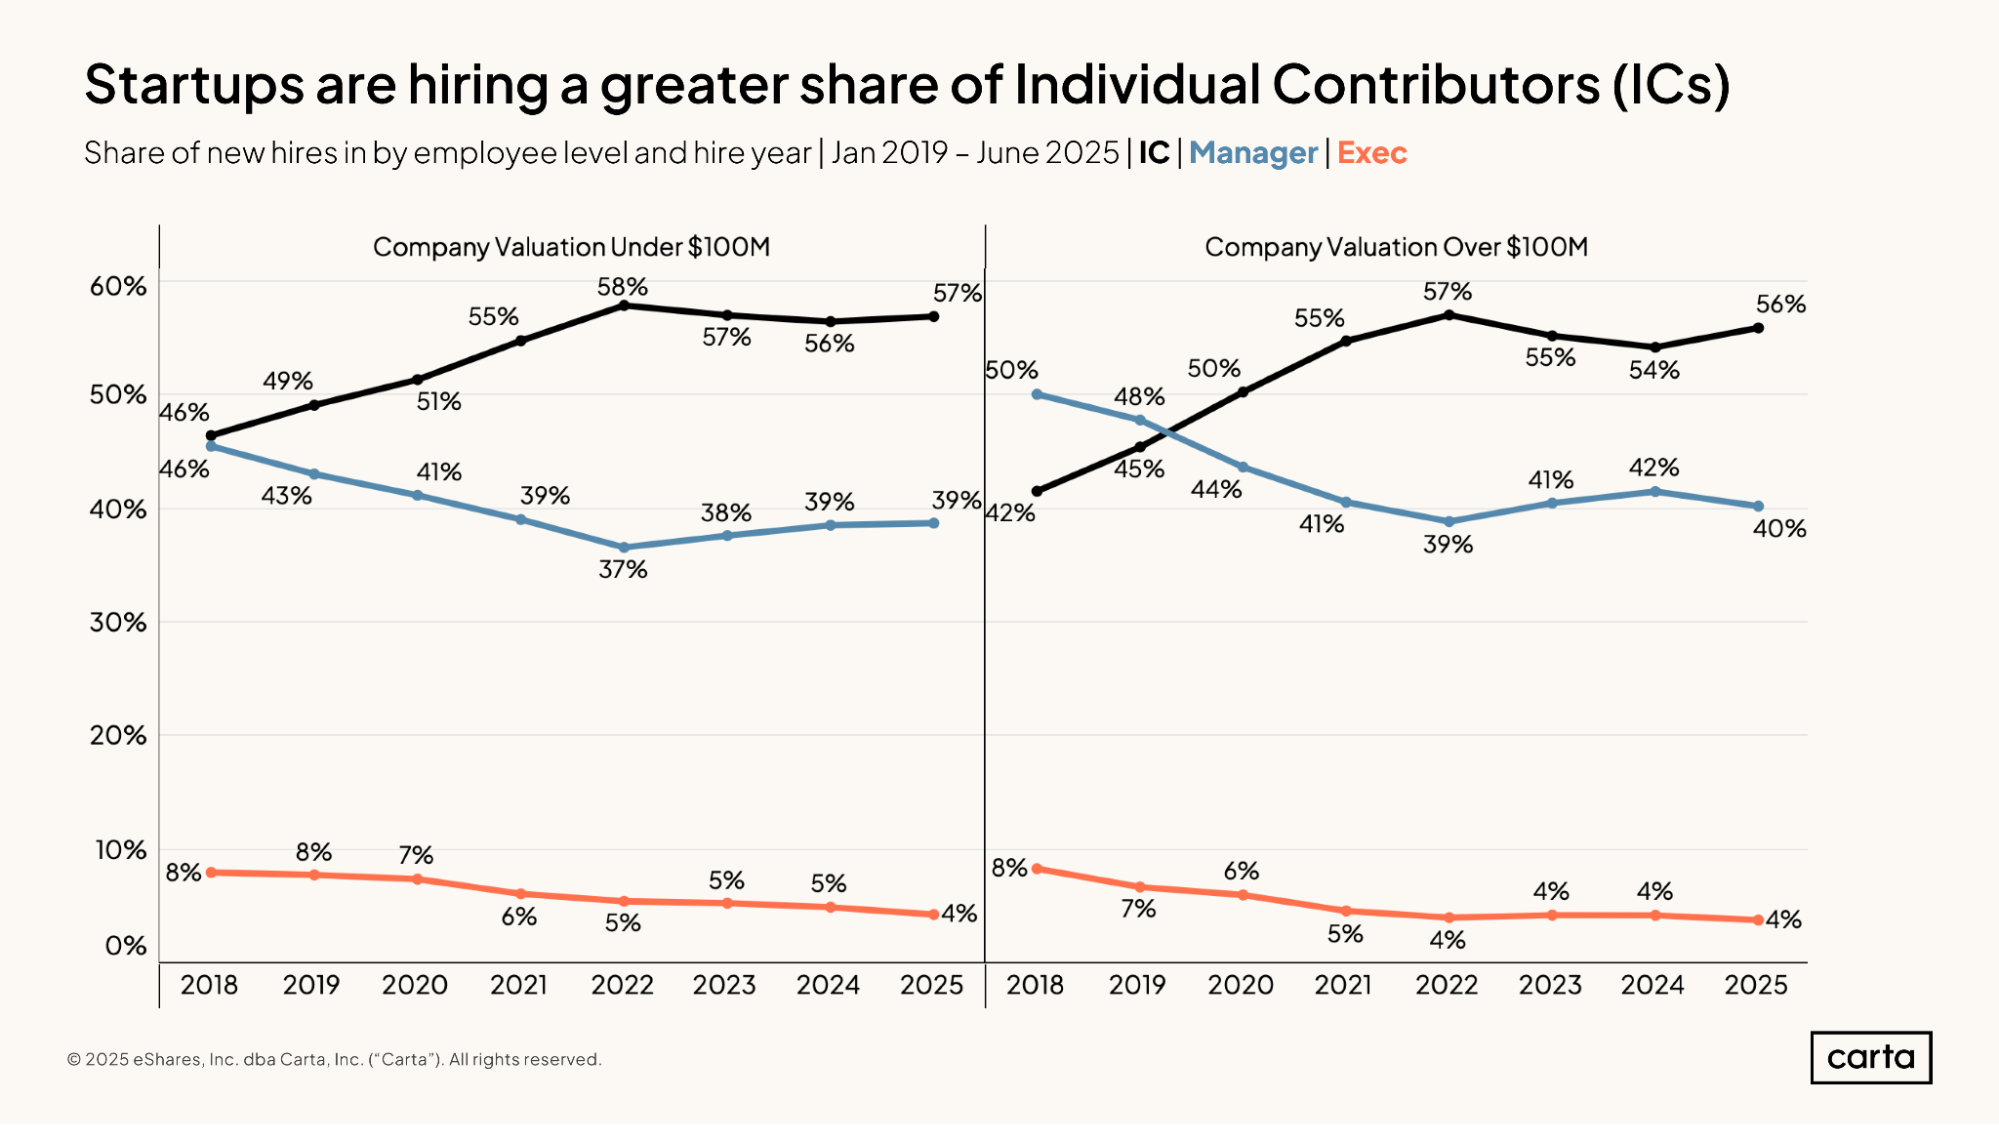
At companies that were most recently valued at less than $100 million, about 57% of new hires in H1 2025 were individual contributors, while another 39% were managers and 4% were executives. These percentages are almost identical at companies with valuations higher than $100 million. The only difference is that new manager hires were slightly more common and individual contributor hires slightly less common at higher valuations.
Today, individual contributors make up a substantially higher percentage of new hires on Carta than they did in the late 2010s, while the rates of new managers and executives have both declined. At least in part, this likely reflects an embrace of leaner corporate structures across startups of all sizes, with many companies trying to minimize or reduce the layers of management within their org charts.
Geographical trends
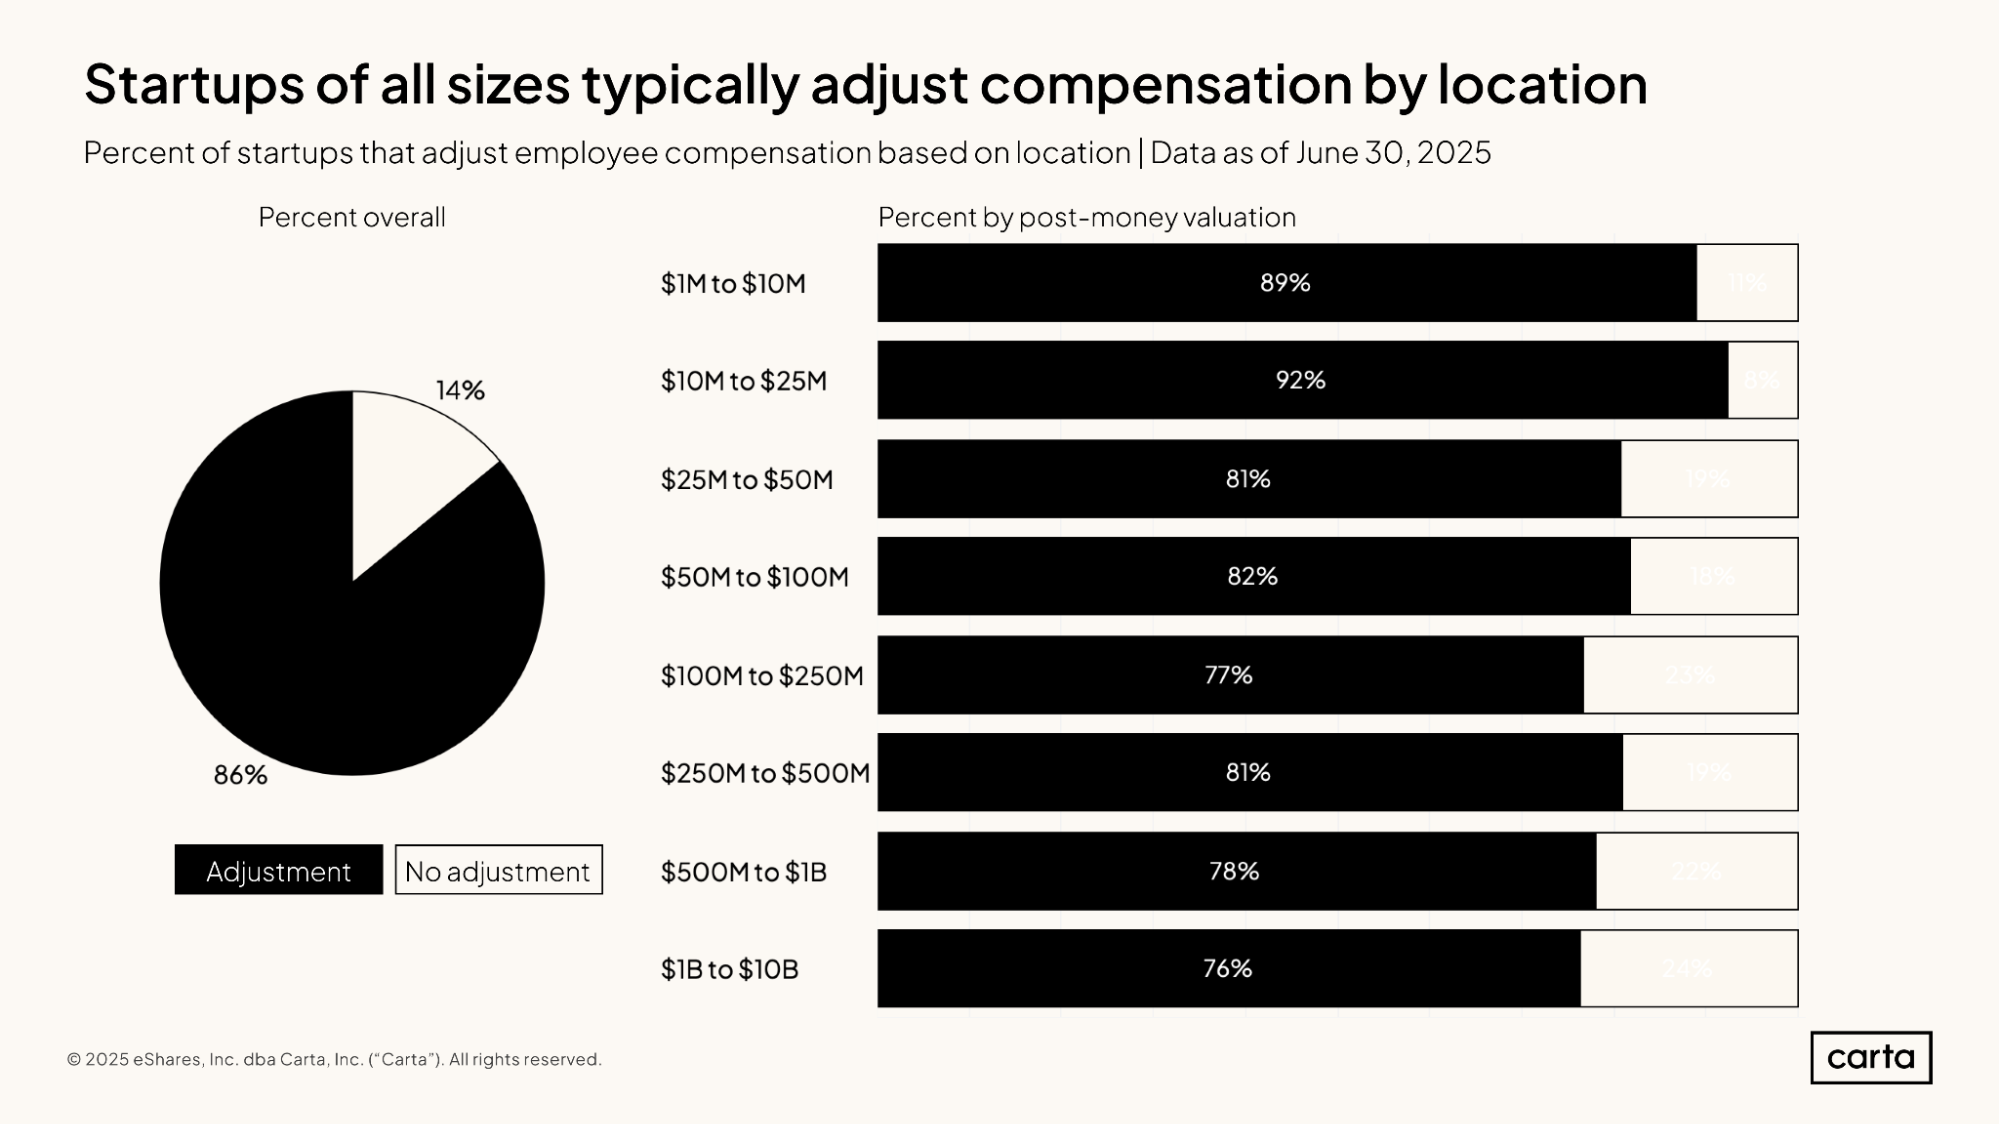
About 86% of all startups on Carta adjust the compensation they offer based on where an employee is located. This practice is a little more common at smaller startups: 89% of startups valued between $1 million and $10 million adjust their compensation based on geography, compared to 76% of startups valued between $1 billion and $10 billion.
The typical purpose of location-based pay is to give employees in the same role the financial ability to maintain roughly similar lifestyles regardless of where they happen to live. Compensation therefore tends to be a little higher for employees in areas like San Francisco or New York City, and a little lower in places with a lower cost of living.
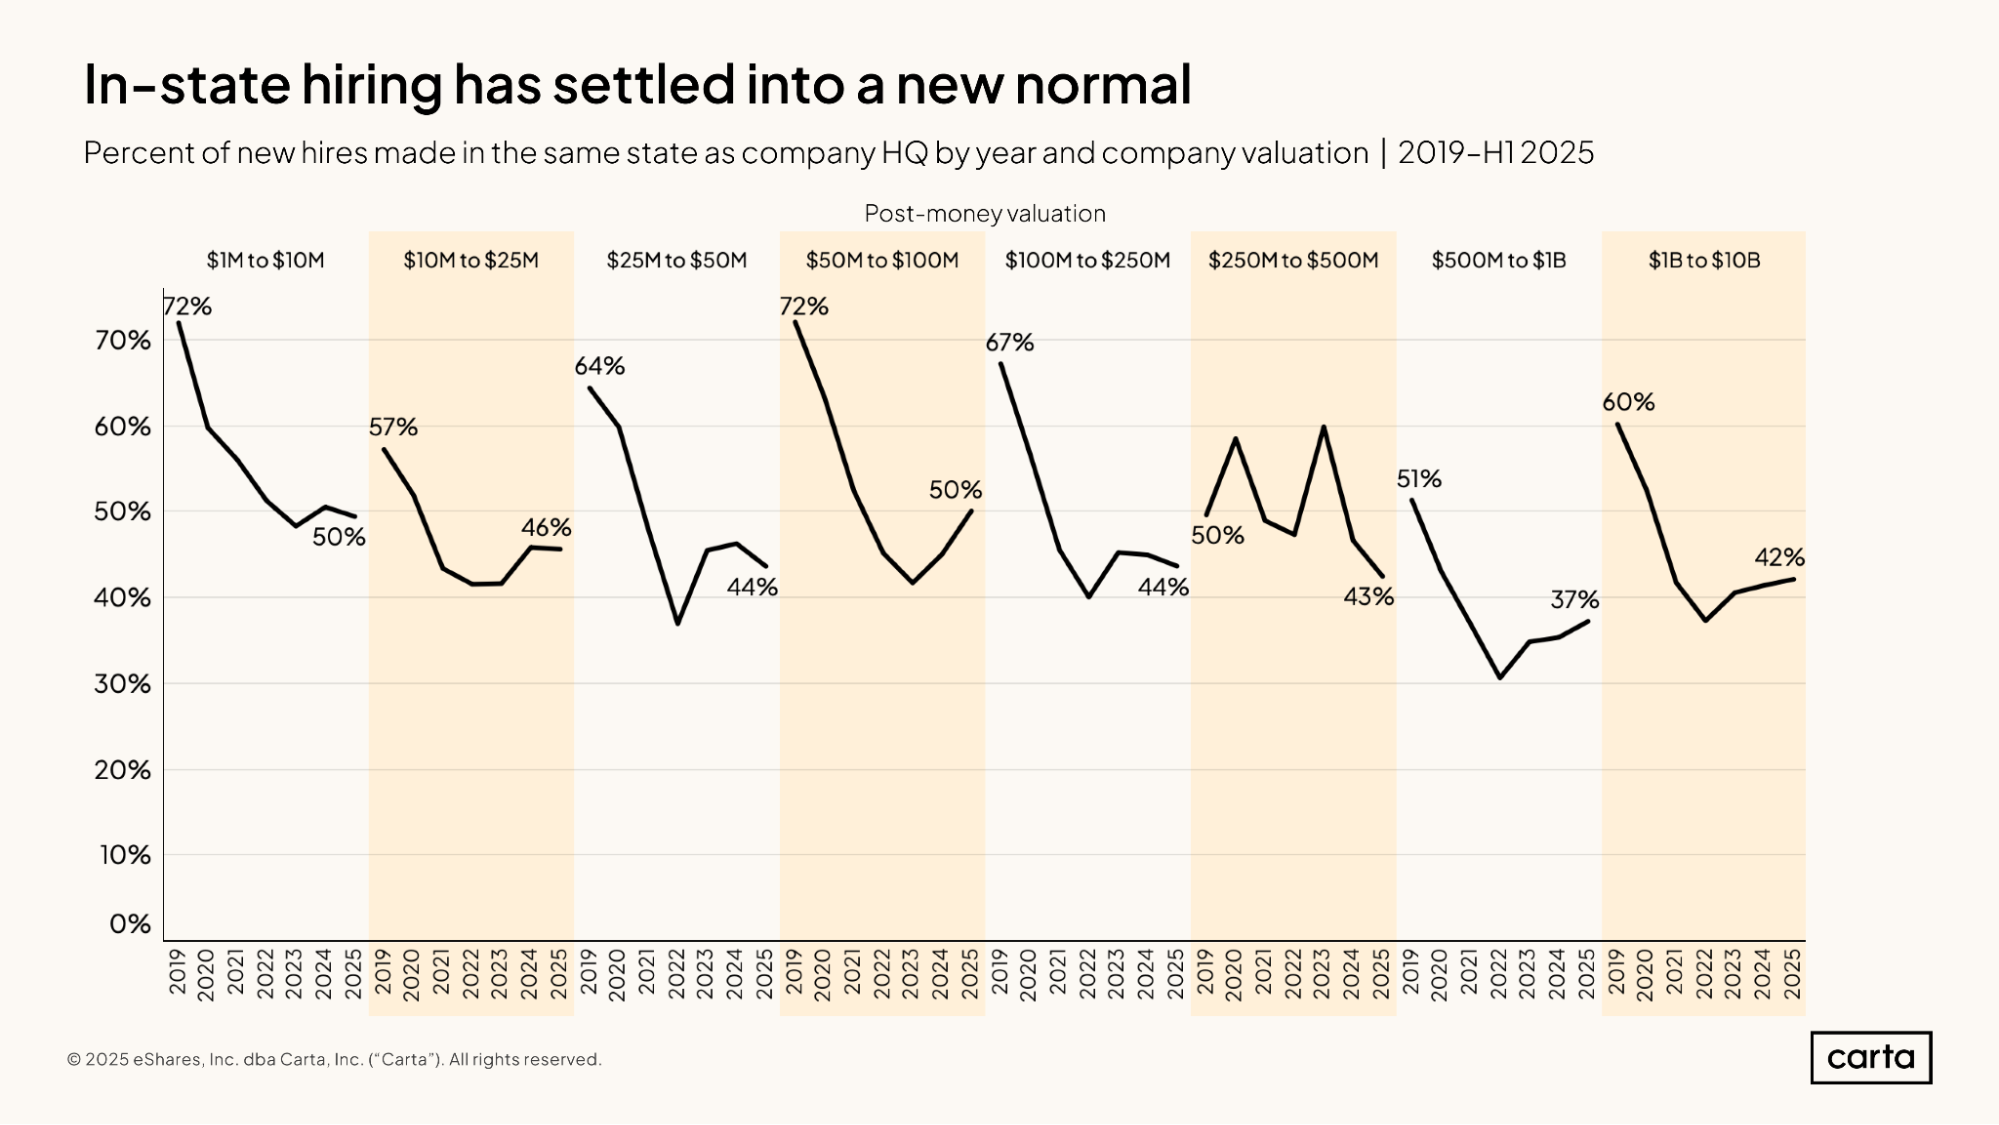
At larger startups—those with valuations of $500 million or higher—in-state hiring has grown more common this year. Among companies valued between $500 million and $1 billion, the percentage of hires that work in the state where their company is headquartered rose to 37% during the first half of 2025; among companies valued between $1 billion and $10 billion, the rate of in-state hires climbed to 42%.
At smaller companies, though, in-state hiring rates tended to decline in H1. In some cases, this H1 decline was a reversal in course after in-state hiring had become more popular during 2024. Across all valuation levels, the rate of in-state hiring typically tends to fall somewhere between 40% and 50%.
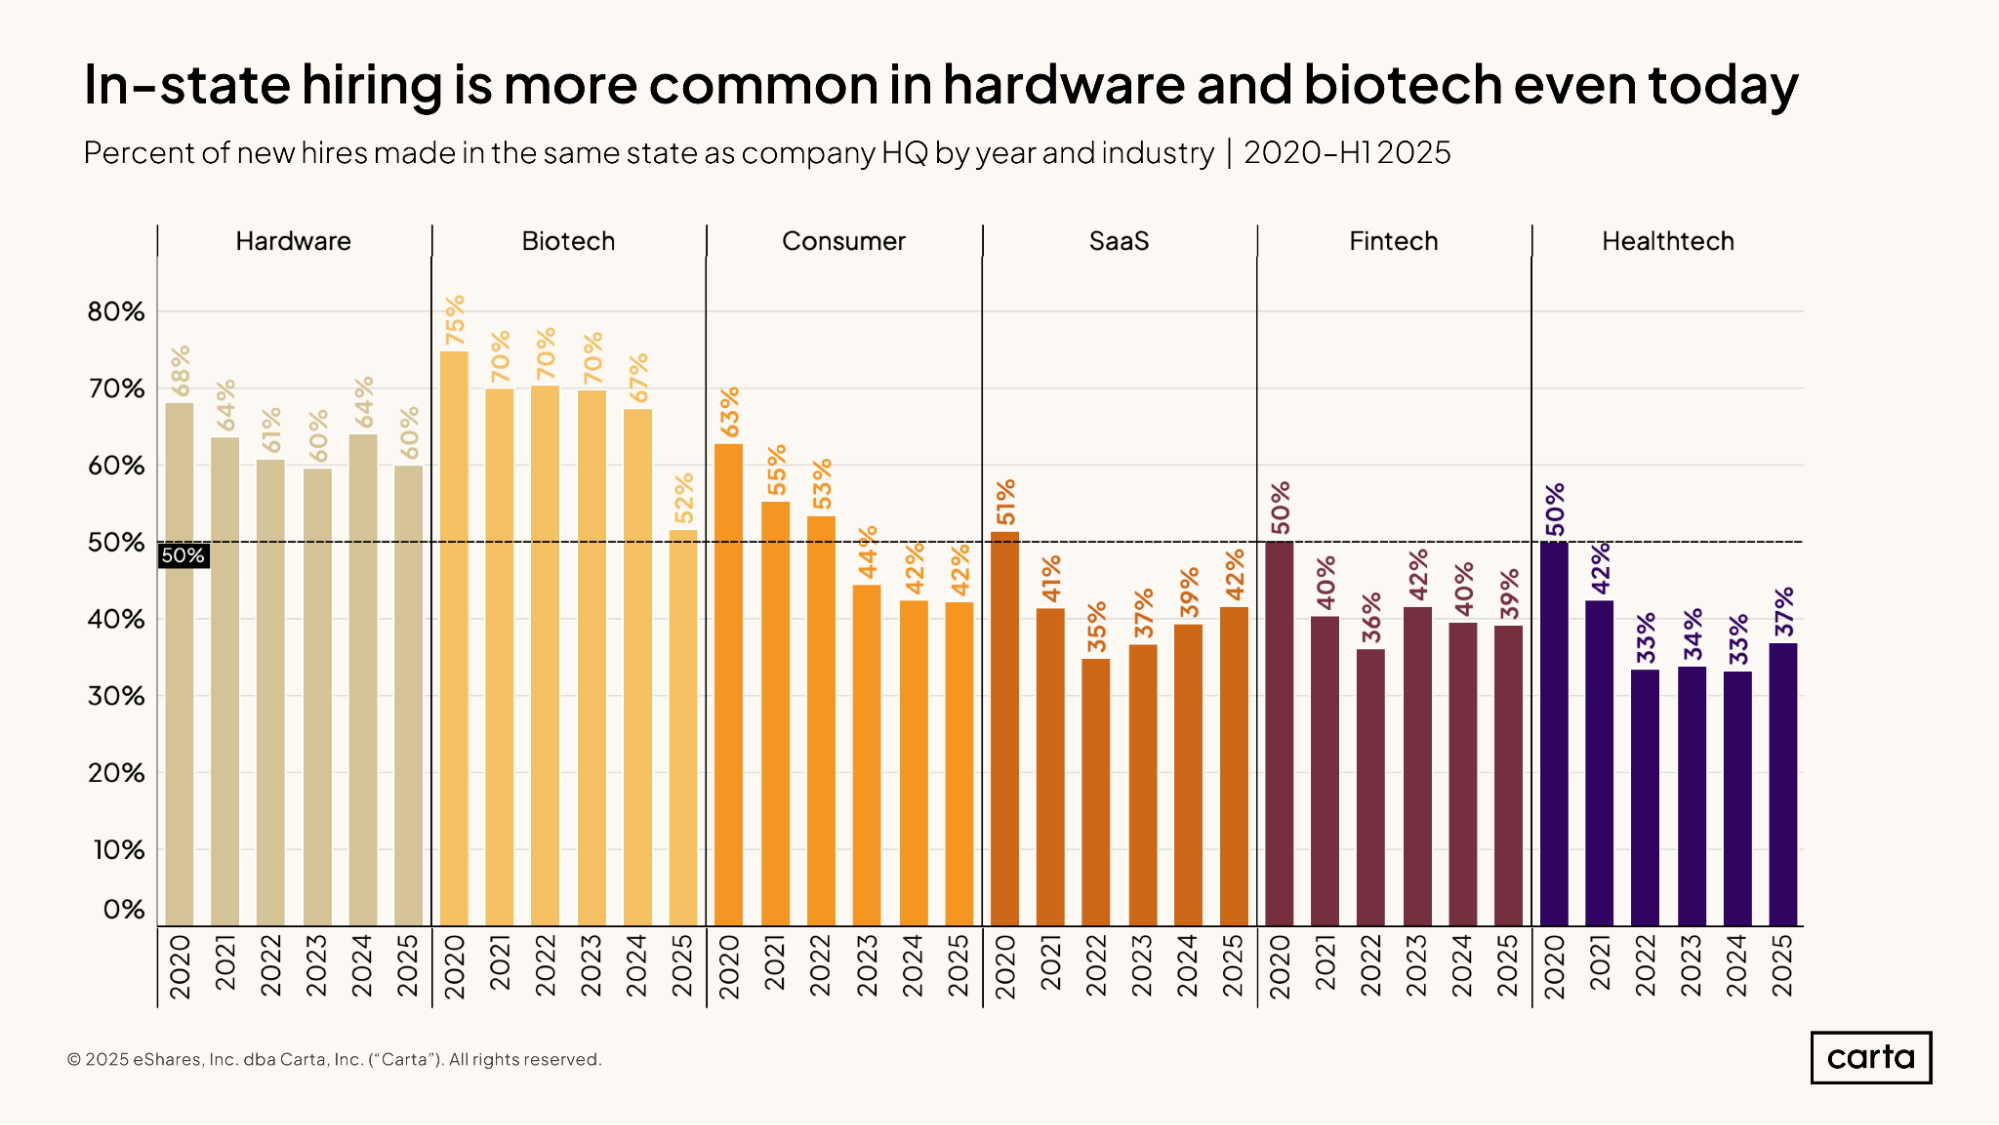
In-state hiring is significantly more common in some major startup industries than others. In hardware, for instance, at least 60% of all new hires have been based in the same state as their company headquarters in every year since 2020, including an even 60% rate in the first half of 2025. In healthtech, on the other hand, fewer than 40% of all new hires have been in-state in each of the past four years.
In most of these sectors, in-state hiring has become less common so far in the 2020s. The biotech sector in particular has shifted course in 2025, with just 52% of new hires this year being in-state, compared to a 75% rate back in 2020.
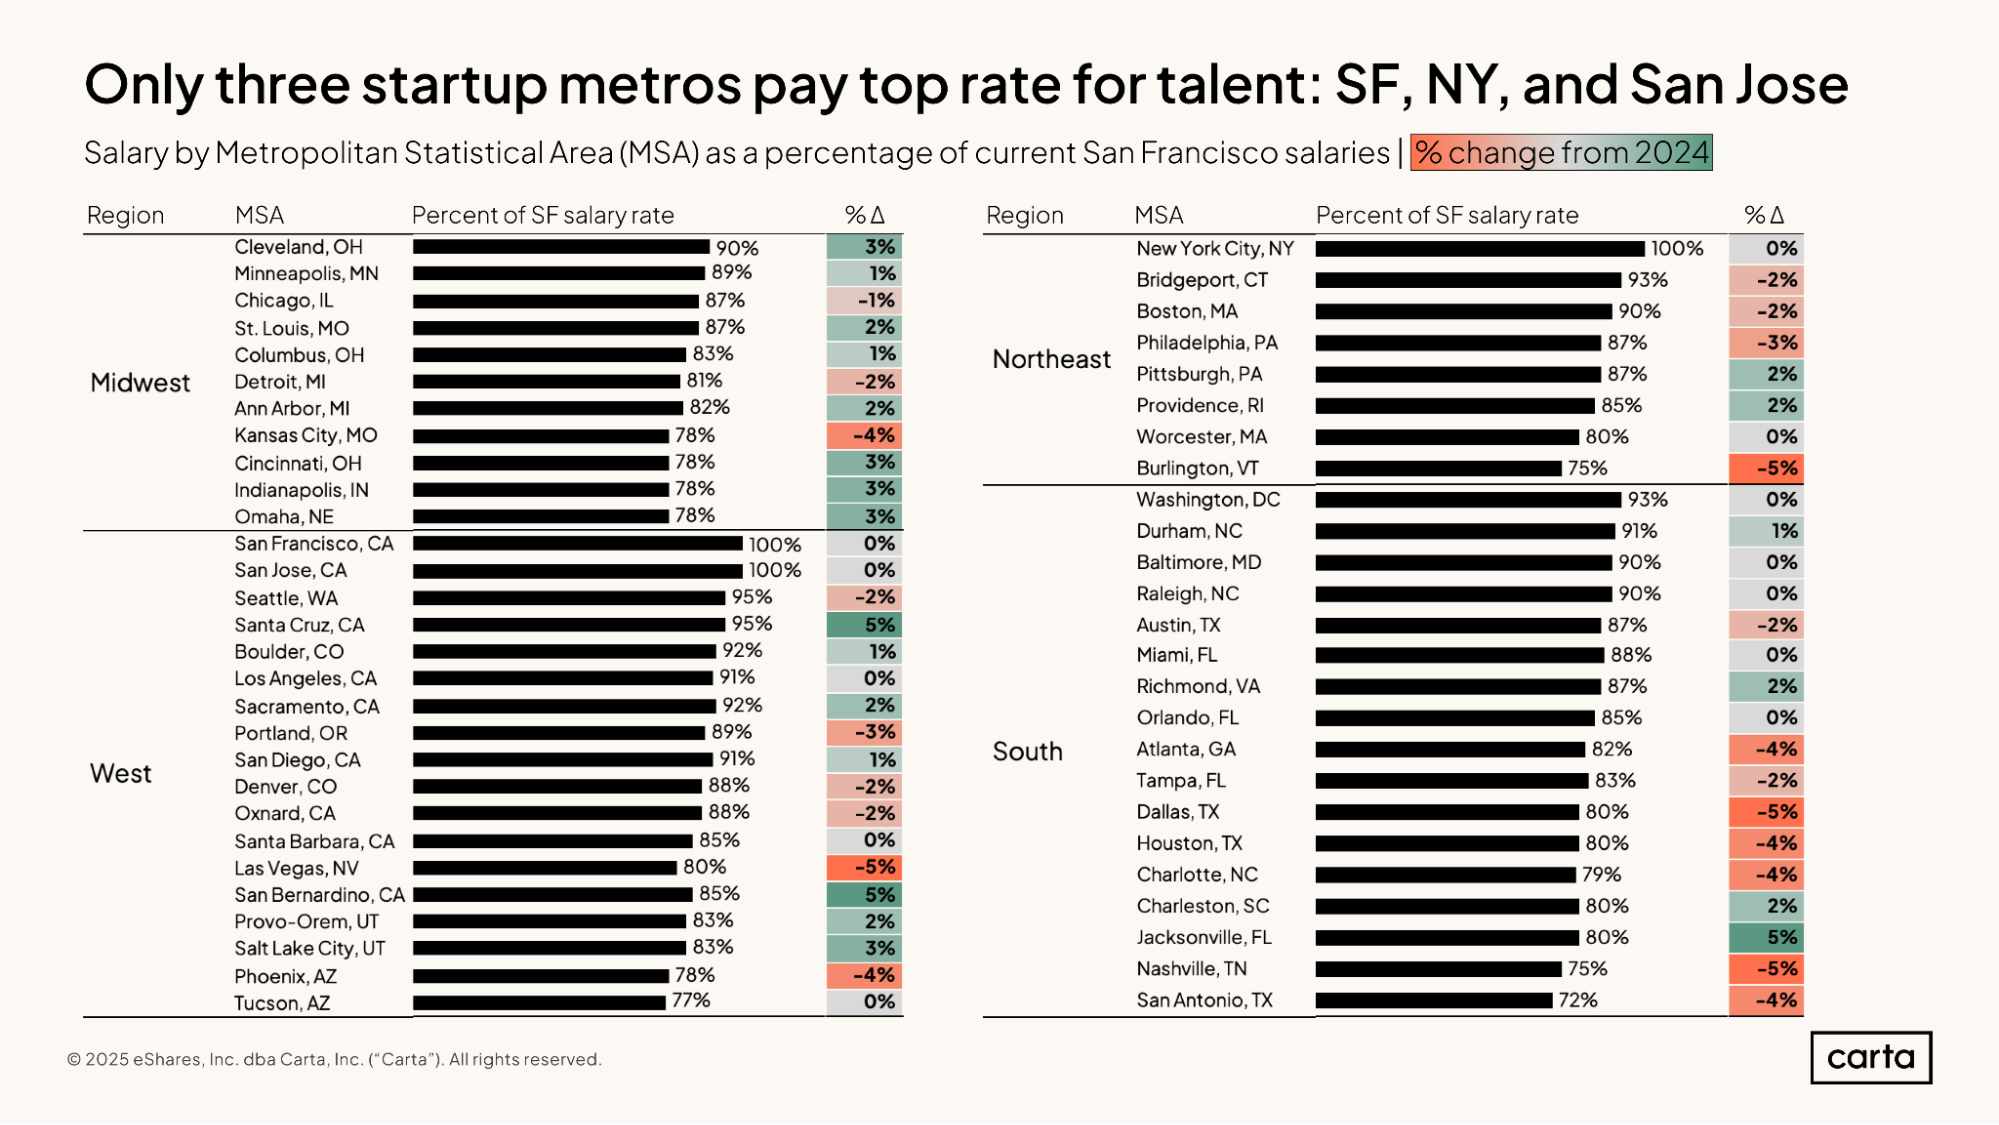
San Francisco, New York City, and San Jose are the three highest-paying metro areas for startup talent. Right behind them are Seattle and Santa Cruz, where typical salaries are about 95% as high as they are in San Francisco, New York, and San Jose.
In the above chart, metros labeled in green have seen their typical salaries increase so far this year relative to salaries in the three top-paying cities, while metros labeled in red have seen salaries decline on a relative basis. Some of the biggest gains in salary during H1 2025 have happened in Santa Cruz, San Bernardino, Calif., and Jacksonville, Fla. Some of the biggest declines can be found in Las Vegas, Dallas, and Nashville.
Salary
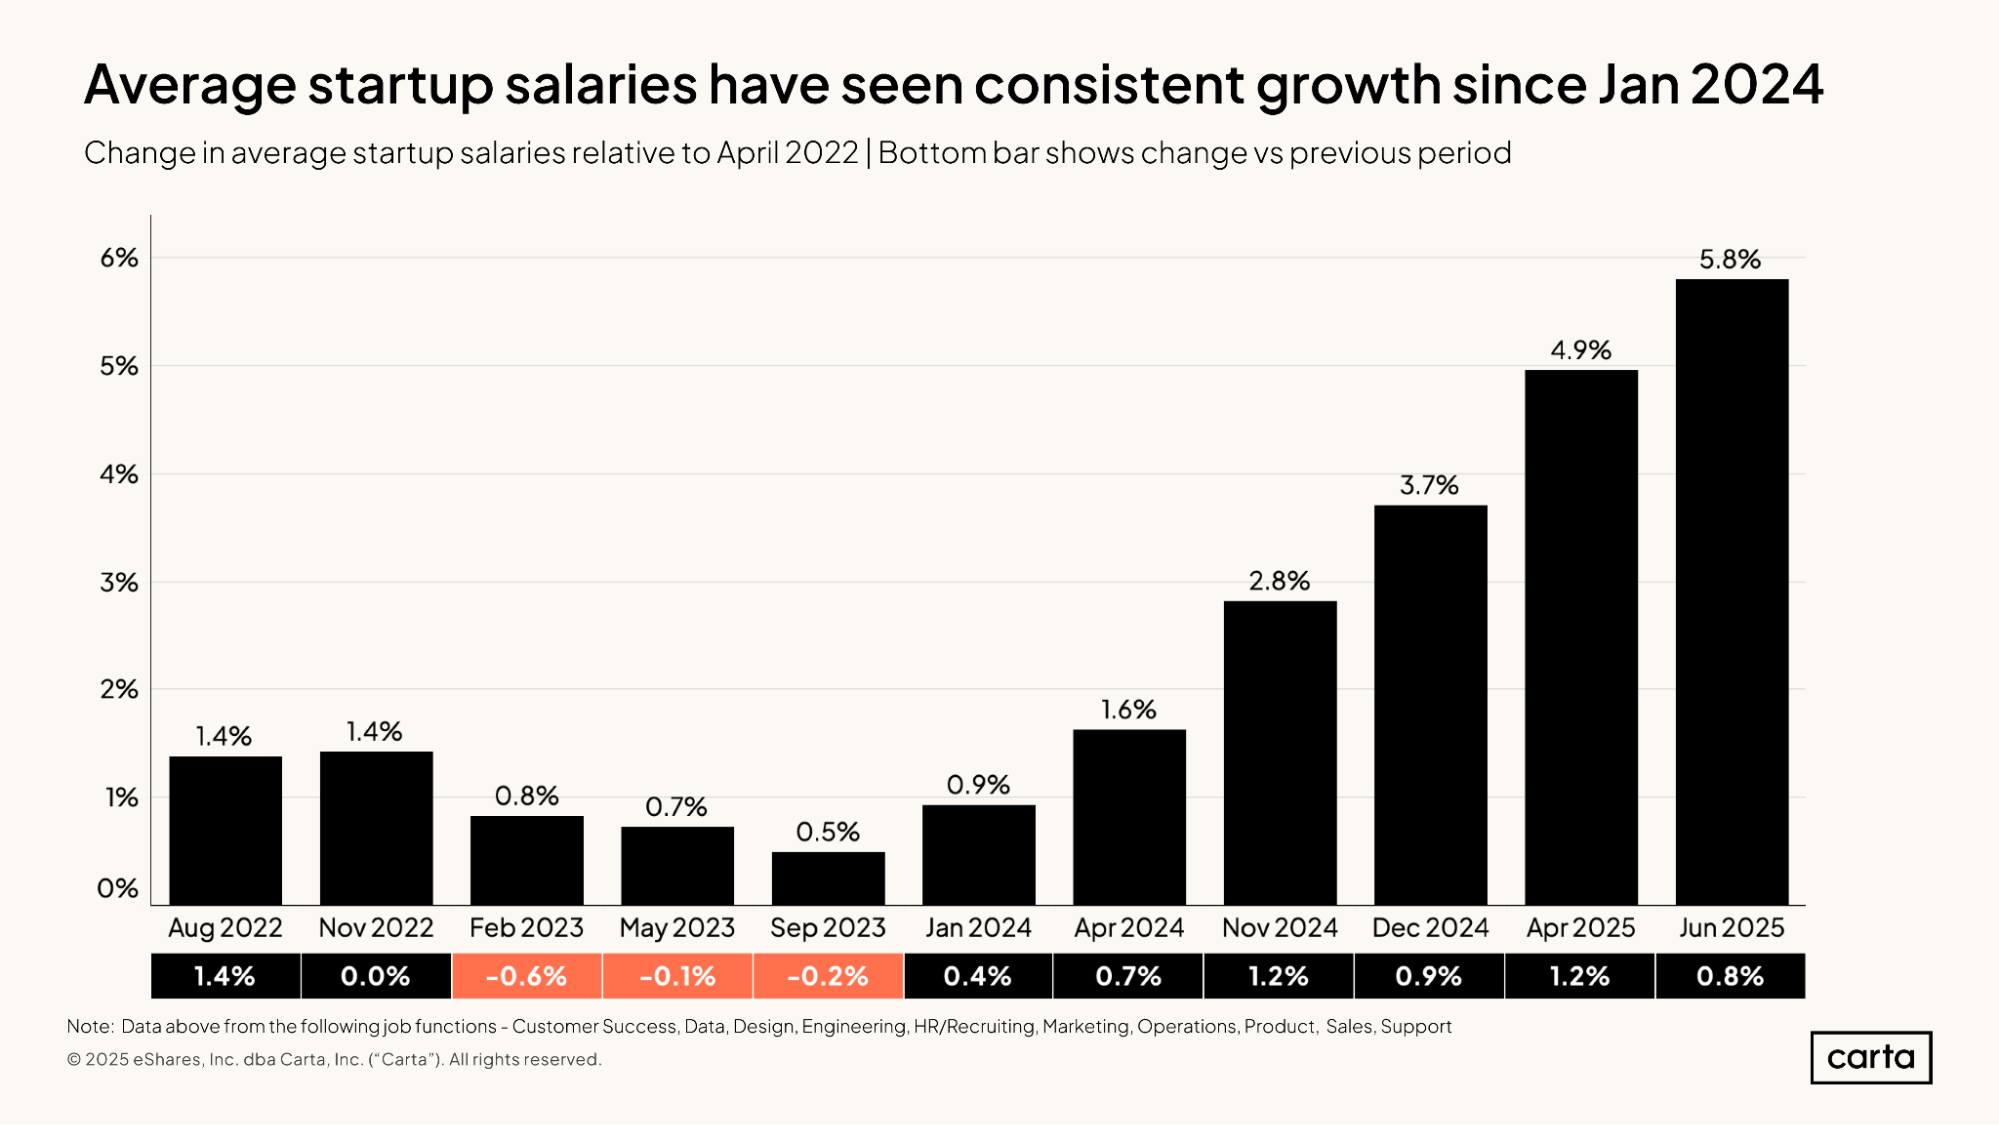
Across companies in all sectors, the average startup salary has been rising steadily for the past year and a half, with regular increases dating back to January 2024. This is a welcome change for new hires after 2023, when the average startup salary was in decline for several months in a row.
In June 2025, the average salary was 5.8% higher than it was back in April 2022. On a shorter timeline, the average startup salary rose by 0.8% between April 2025 and June 2025.
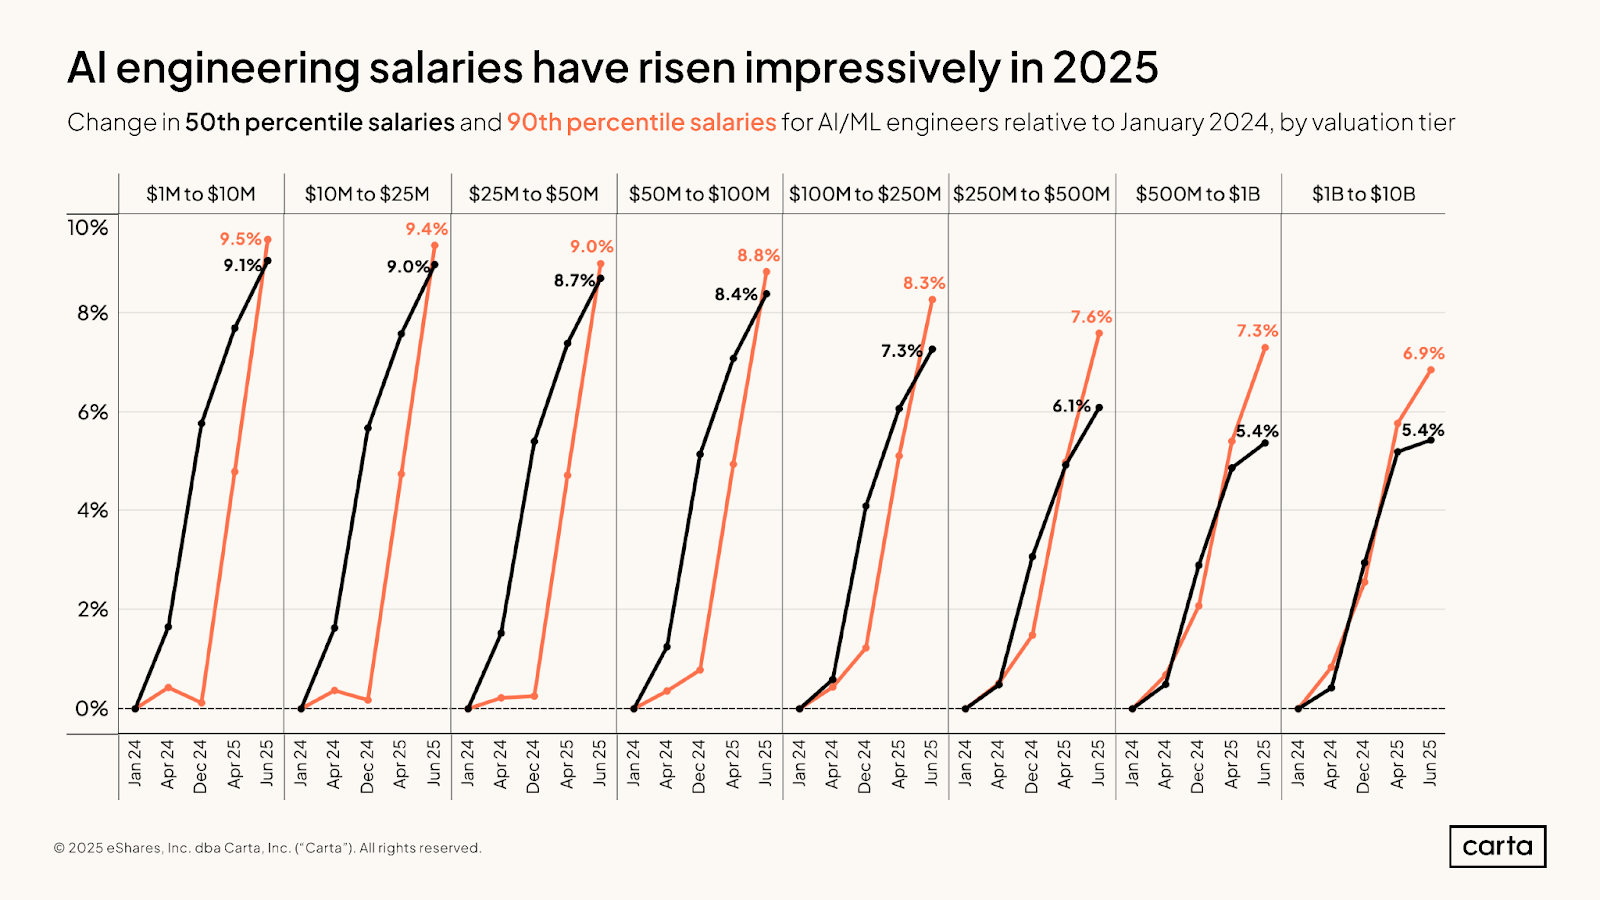
Over the past year and a half, salaries for artificial intelligence and machine learning engineers have boomed among startups of all sizes. The largest increases have come at the earliest stages: Among companies with a valuation between $1 million and $10 million, the median salary for an AI/ML engineer increased by 9.1% between January 2024 and June 2025. At the 90th percentile, engineering salaries among this cohort of startups were up 9.5%.
Among more valuable (and typically more mature) startups, there’s a larger gap between salaries at the median and the 90th percentile, suggesting that some of these companies have become willing to pay a larger premium for top performers. At unicorn startups valued between $1 billion and $10 billion, the median AI/ML engineering salary rose by 5.4% between January 2024 and June 2025, while the 90th percentile salary rose by 6.9%.
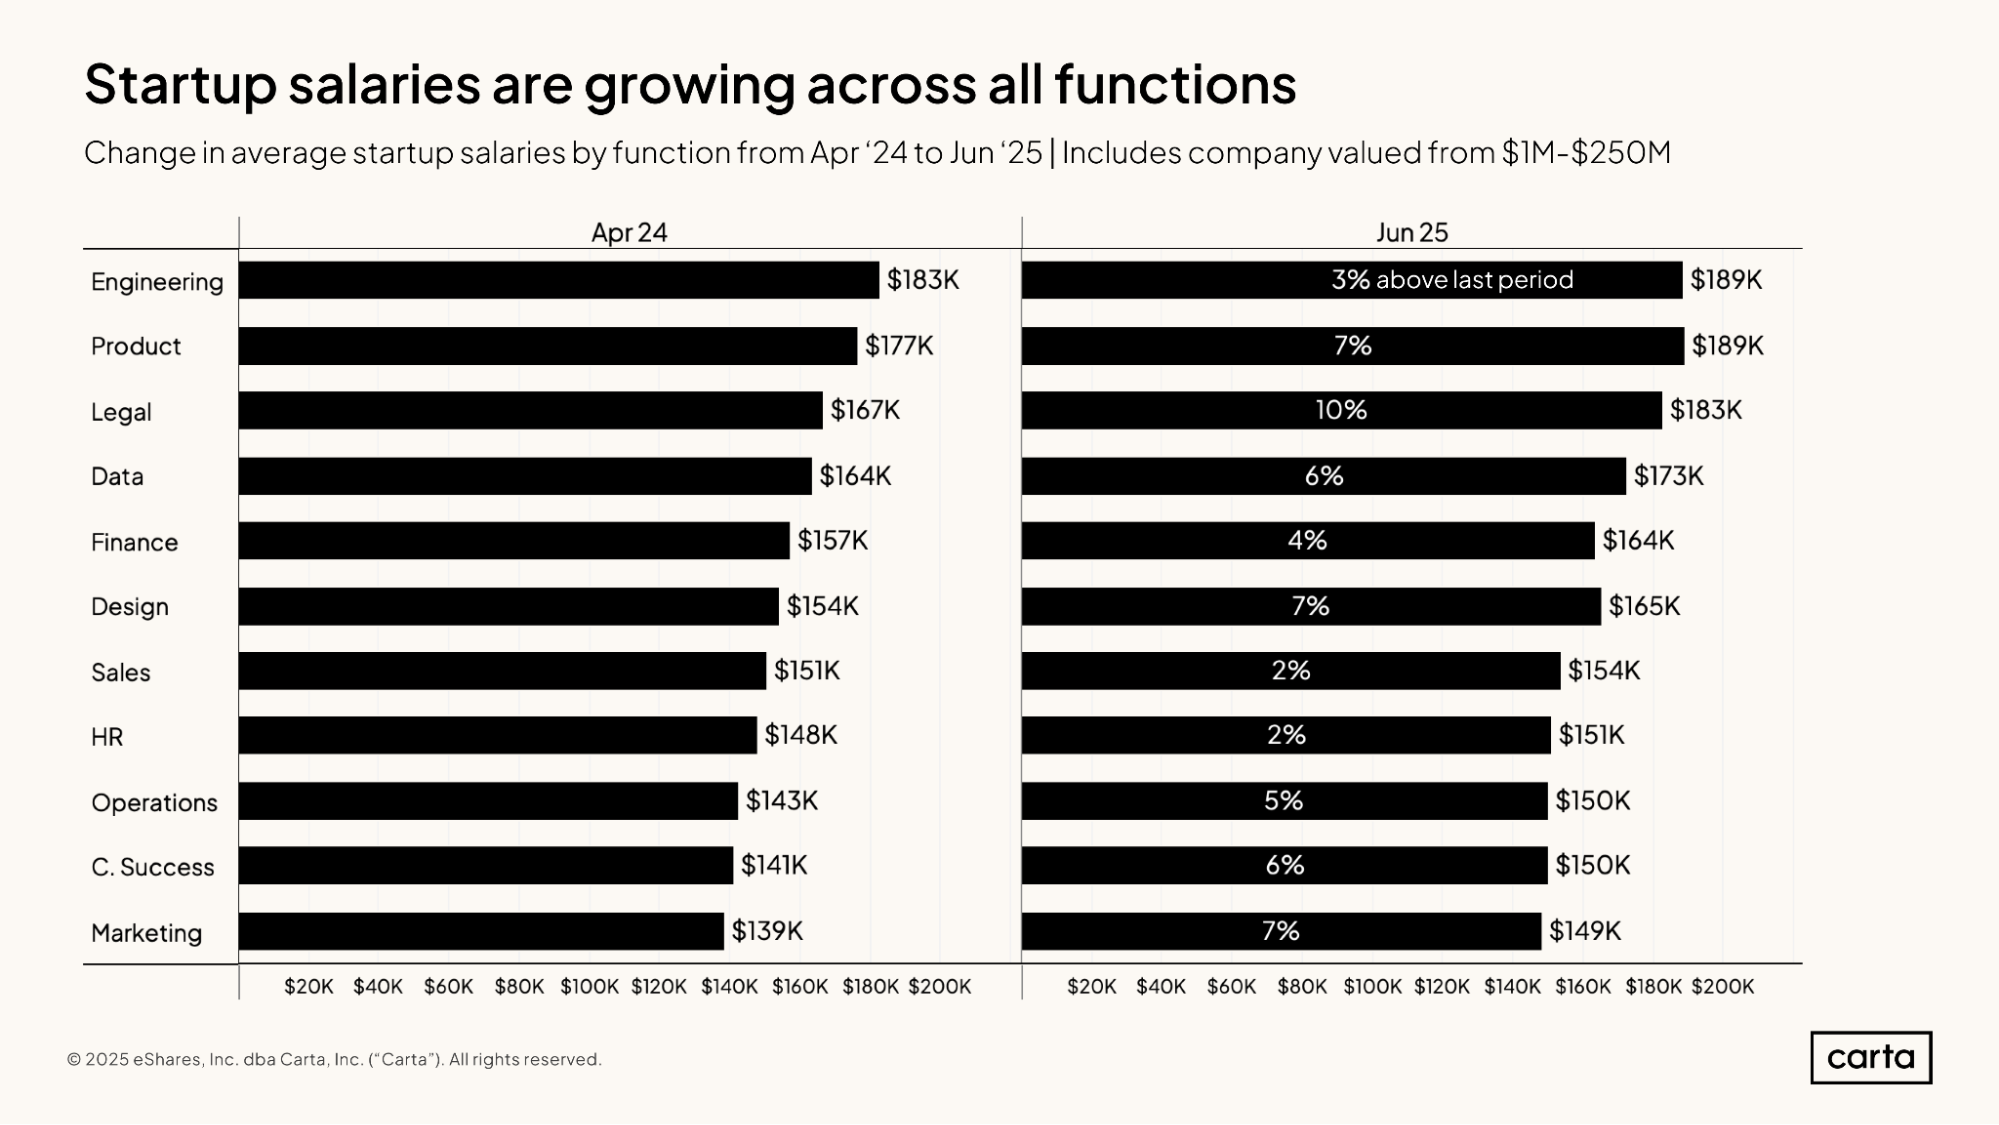
Between April 2024 and June 2025, the average startup salary was on the rise for employees in every major job function. The largest increase came in legal departments, where the average salary rose from $167,000 to $183,000, a 10% uptick. The next biggest gains came in product, design, and marketing, all of which saw average salaries increase by 7% over this span.
Historically, startups pay the highest salaries to their engineers. And as we saw previously, salaries for AI/ML engineers in particular have been on the rise. Yet across engineering as a whole, the average salary rose by a relatively scant 3% between April 2024 and June 2025. As of June, engineering and product were tied for the highest average salary of any job function, at $189,000.
Equity
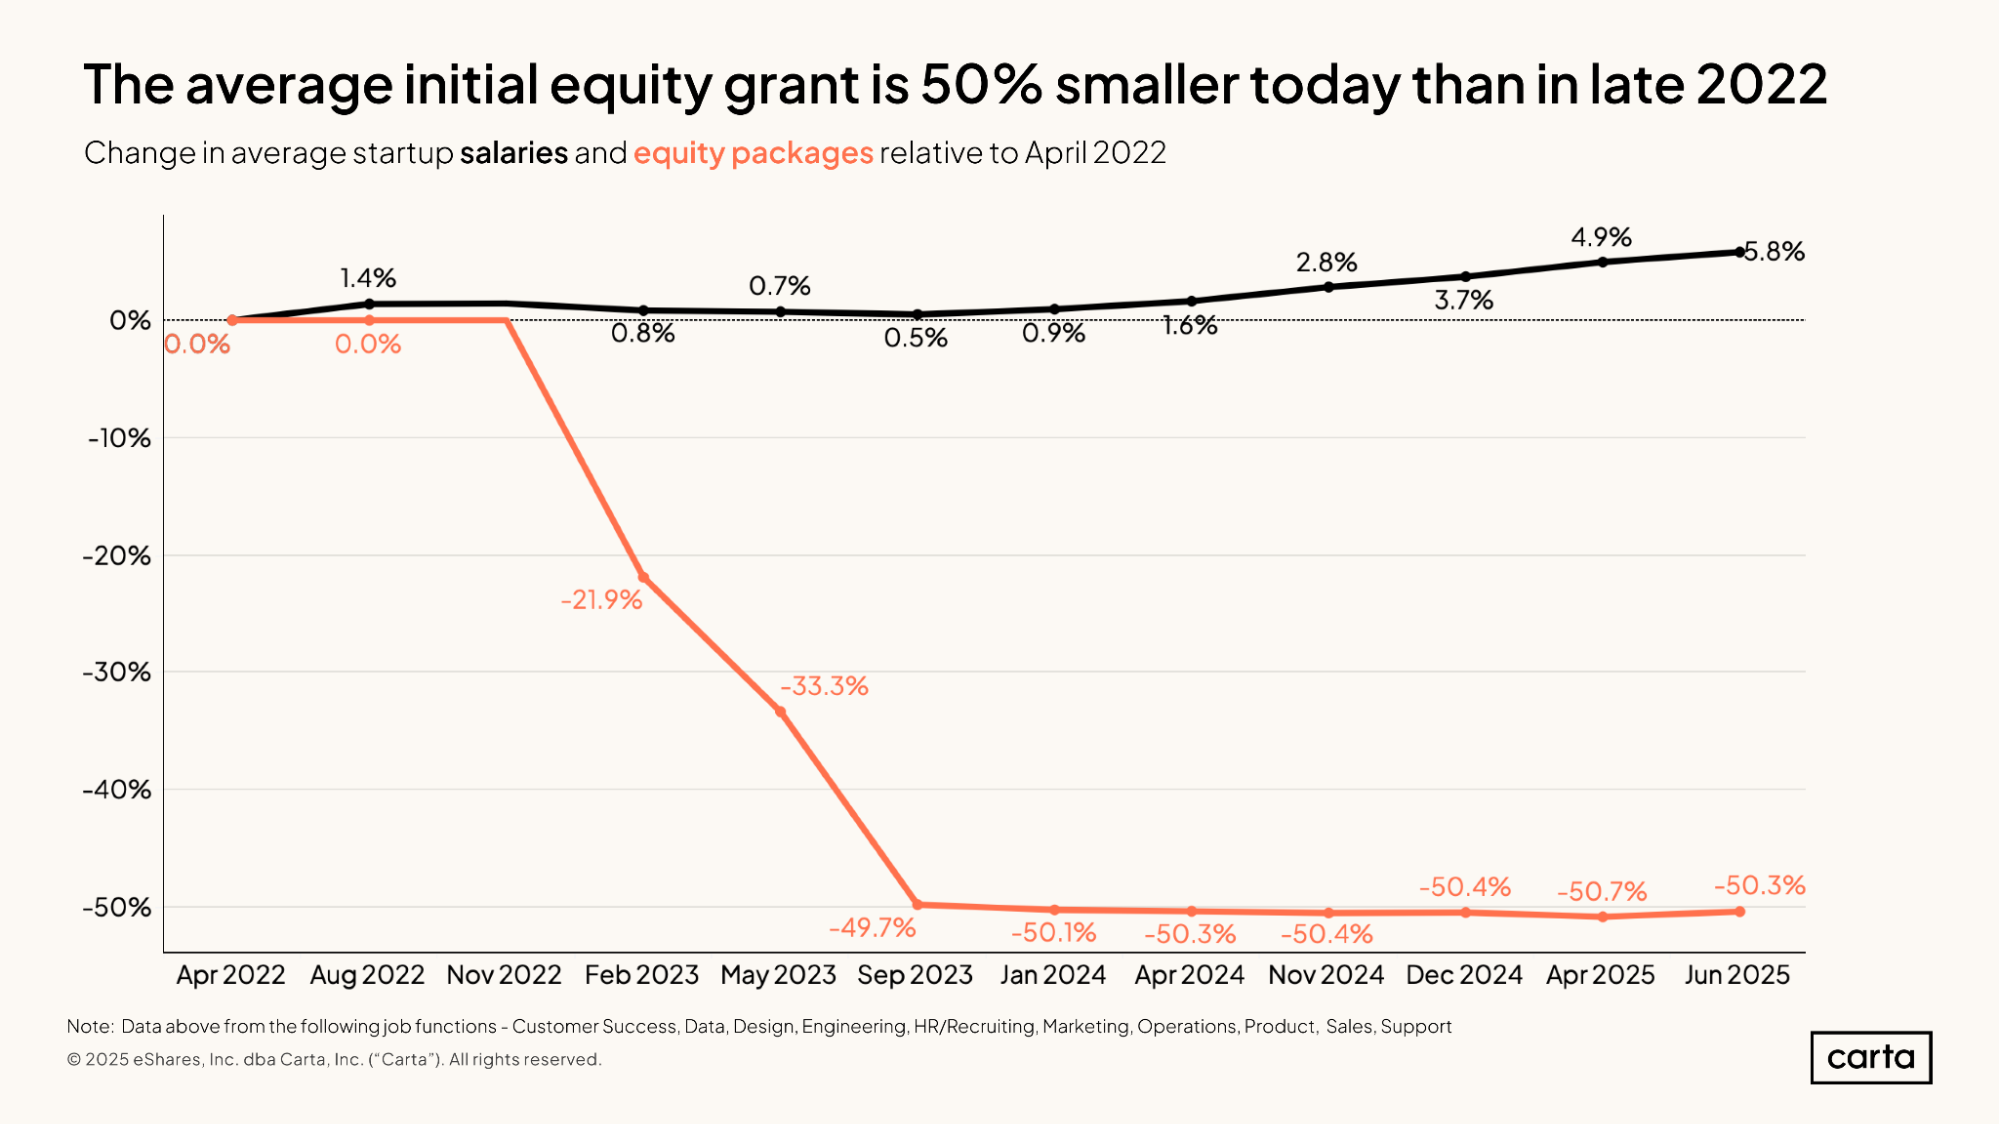
While the average salary that startups pay to new hires has been rising steadily over the past 18 months, the average equity package has remained almost unchanged for nearly two years. But this stretch of stasis came after a massive shift: From April 2022 through September 2023, the average equity package shrunk by almost 50%. These smaller grants have now become the norm.
This transition in the compensation market roughly coincides with the startup valuation reset of mid-2022, and also with a slowdown in the IPO market that began around the same time. At least in part, this resizing of compensation packages during the past two years reflects the fact that, for some new hires, startup equity might be a little less appealing as a form of compensation than it used to be.
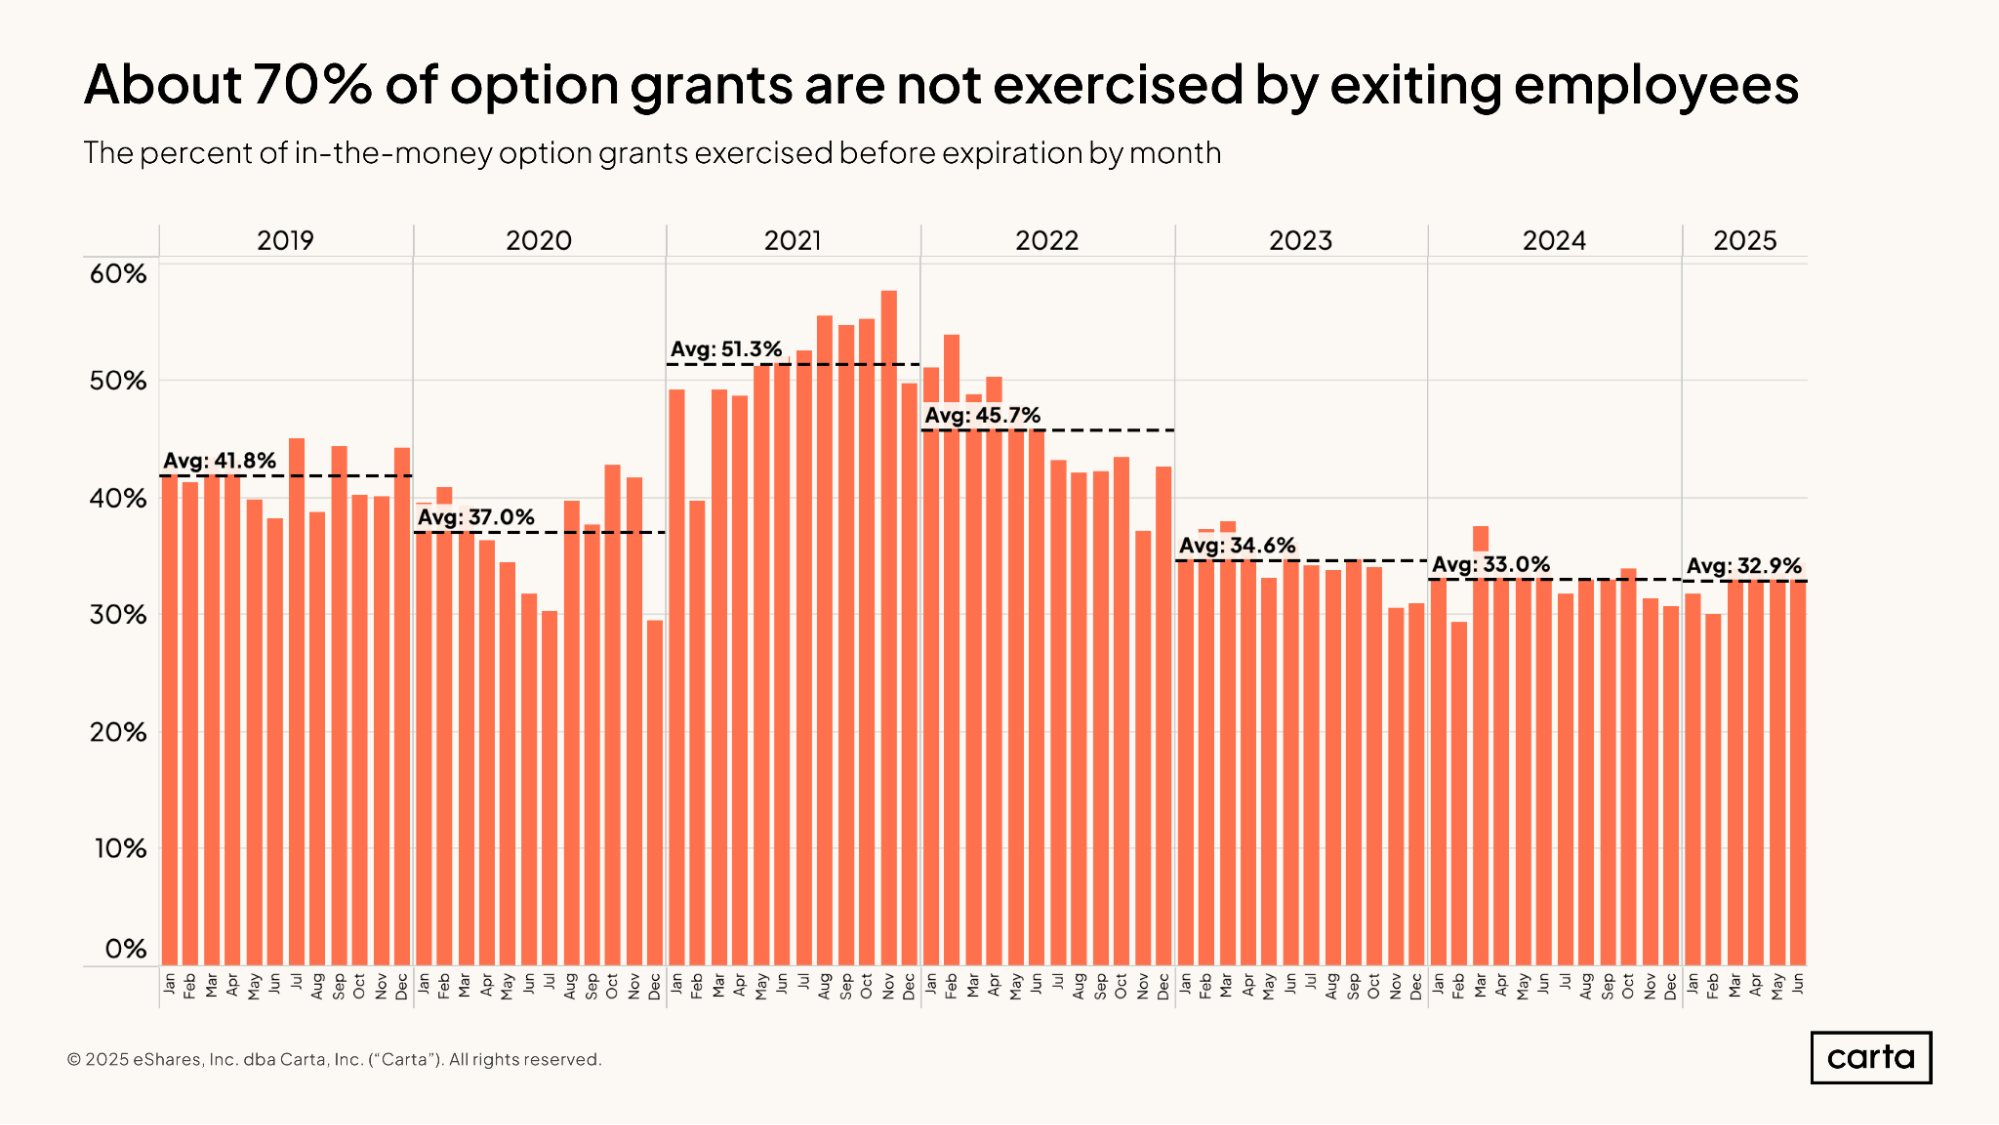
Shifting attitudes towards employee equity can also be seen in a recent increase in the percentage of in-the-money stock options that go unexercised. Through the first six months of 2025, employees chose to exercise about 32.9% of all vested, in-the-money option grants before those grants expired, leaving the other 67.1% unexercised. For now, that’s the highest rate of unexercised options (and thus the lowest rate of exercised options) in any year since at least 2019.
Back in 2021, when startup valuations were flying high and the IPO market was in the midst of a record-breaking year, startup employees chose to exercise 51.3% of their options before they expired, leaving just 48.7% unexercised. When the prospect of a fast, lucrative return seems more likely, employees are typically more willing to make the financial investment required to exercise their options.
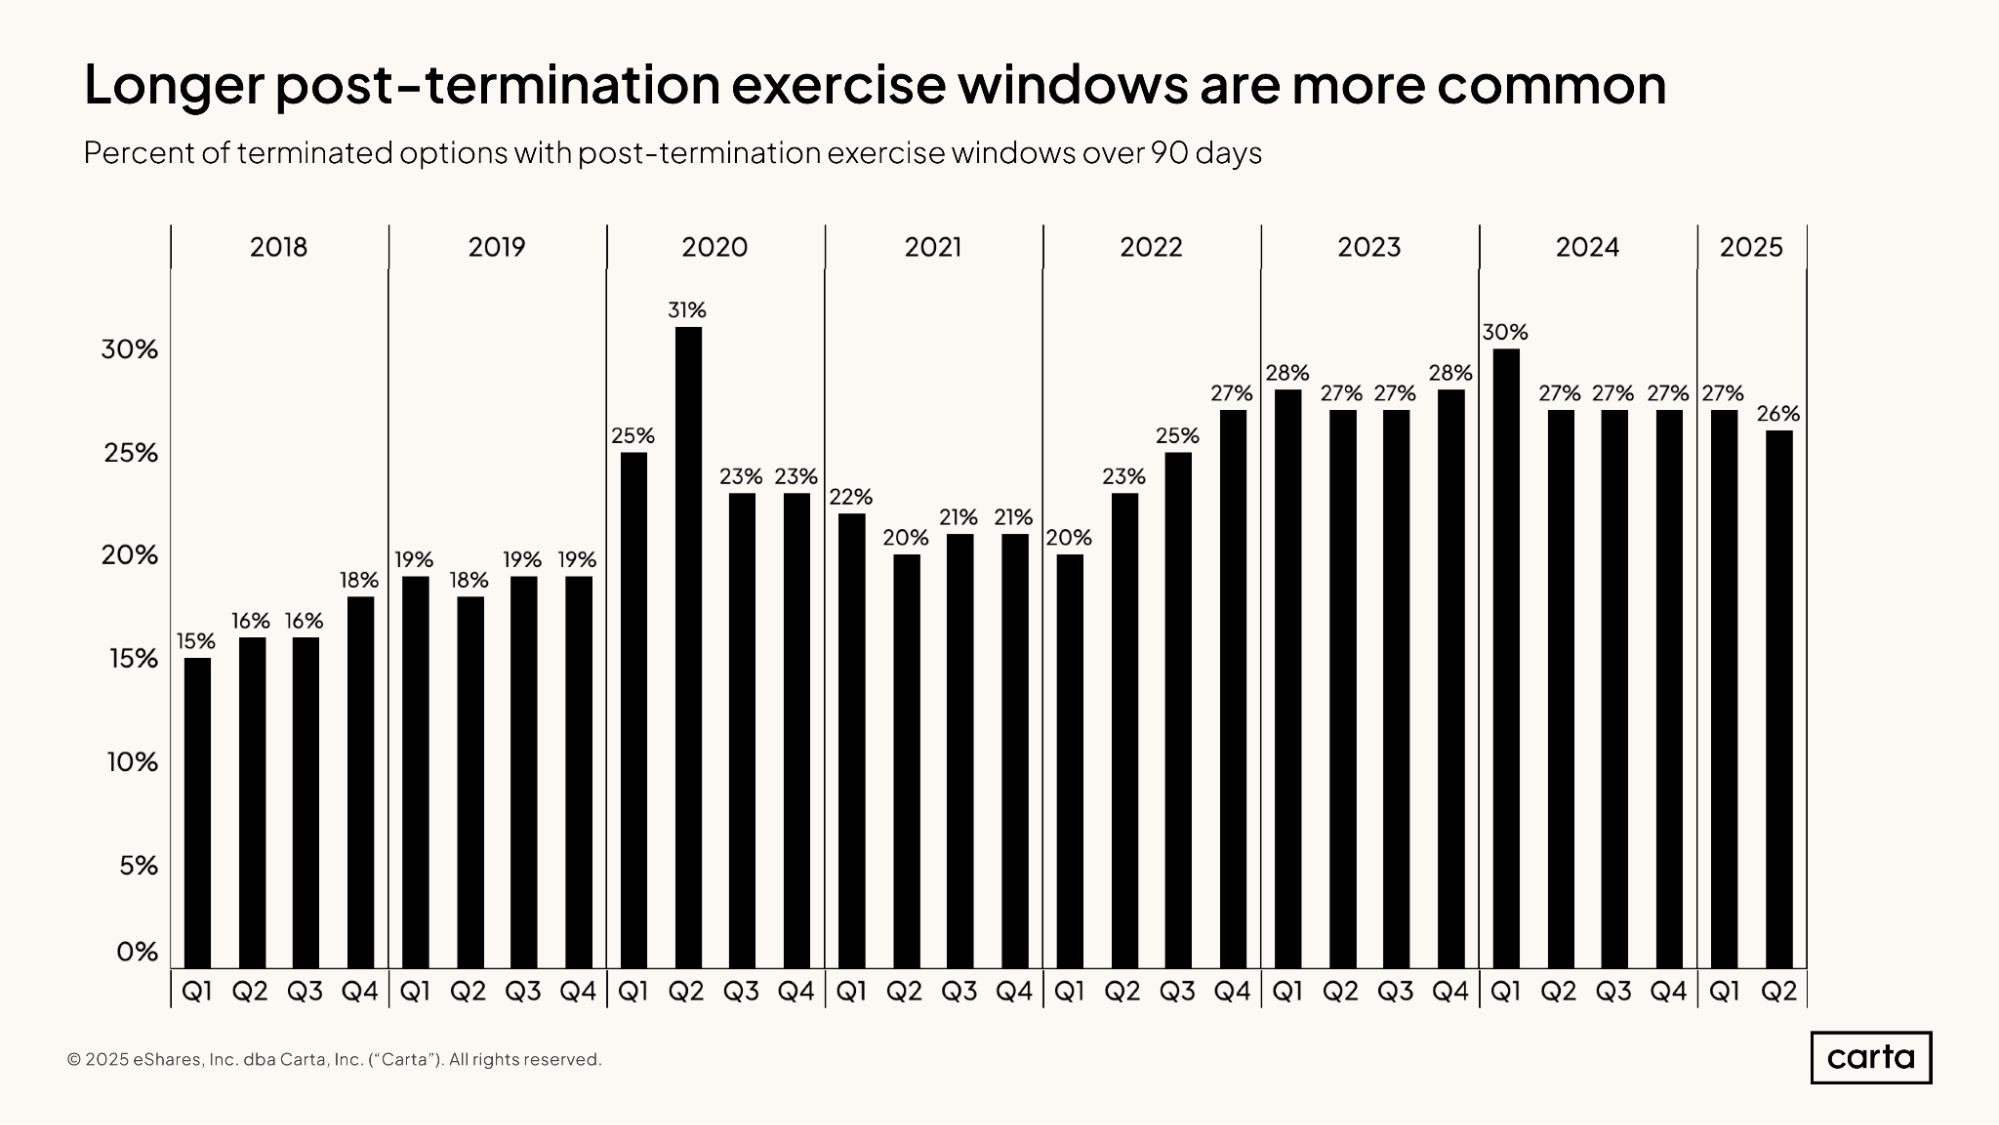
In Q2 2025, startups offered a post-termination exercise (PTE) window of longer than 90 days for 26% of stock options that were terminated when an employee left their role. This is in line with recent history: The rate of terminated options with a PTE window longer than 90 days has landed between 25% and 30% for the past 12 quarters, a few percentage points higher than the norm over the previous few years.
Longer PTE windows are typically seen as a benefit for employees, and they’re sometimes offered as part of layoffs to give workers added flexibility. It makes sense, then, that this recent increase in longer PTE windows coincides with an increase in the number of startup layoffs—which, as we saw earlier, started to climb in 2022 and has remained elevated ever since.
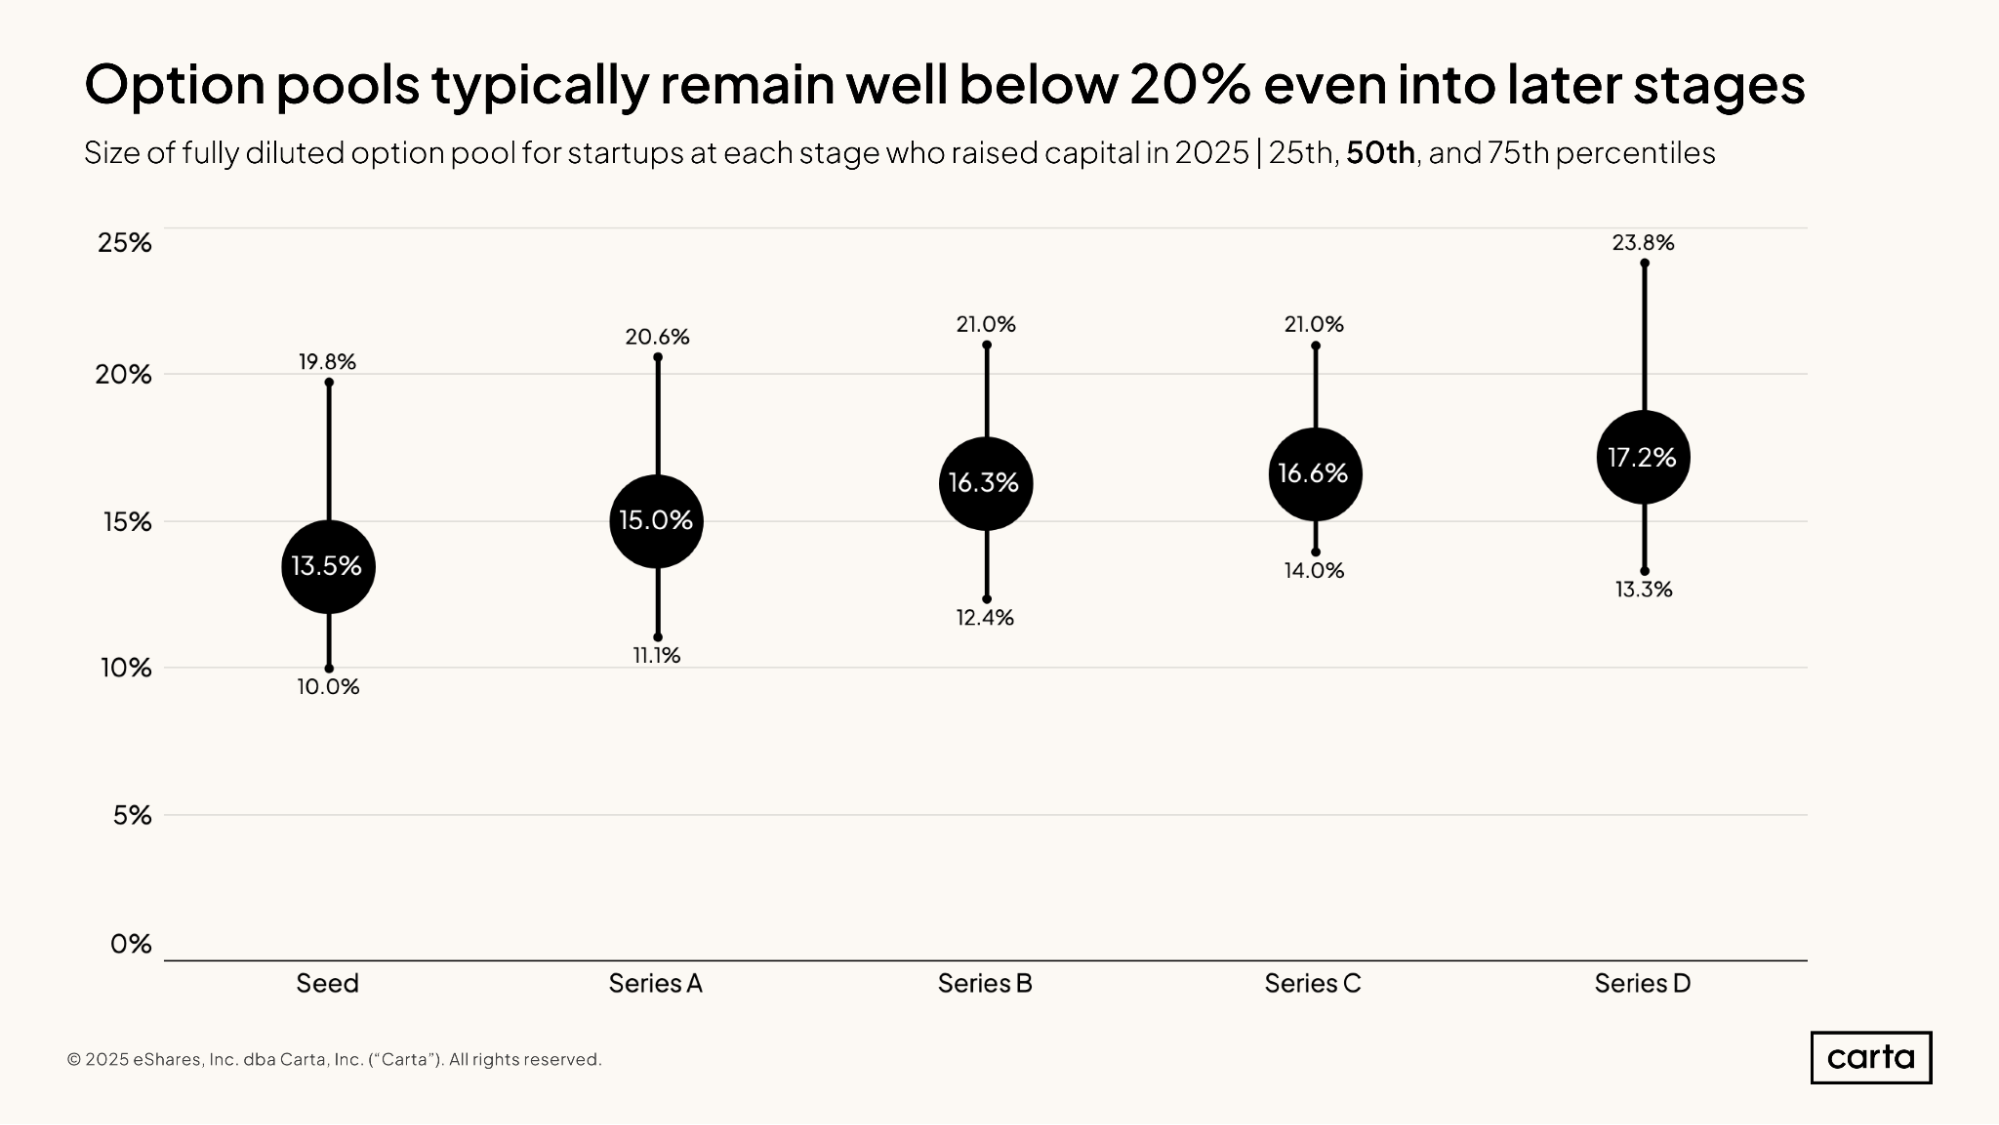
The median seed-stage startup that raised a round in 2025 had 13.5% of its total equity set aside for an employee option pool at the time of the fundraise. This proportion of equity that is set aside for the option pool tends to increase at each progressive stage of the fundraising cycle, but only by relatively small margins. By Series D, the median option pool comprises 17.2% of a company’s fully diluted equity.
Within each fundraising stage, however, there exists some variation. At seed, for instance, a company at the 25th percentile devotes 10% of its equity to the employee option pool, while an option pool at the 75th percentile contains 19.8% of all company equity. This means that another 50% of all seed-stage startups have an employee option pool that’s either less than 10% or more than 19.8% of their total equity.
Methodology
Overall dataset
This report comes from thousands of Carta Total Compensation customers with over 900,000 current salary and equity data points used by CTC . Other metrics in the report, such as those that describe employee movement, derive from the aggregate pool of more than 1 million employees currently working for the 53,000 startups that use Carta to manage their cap tables. In addition, certain metropolitan area data comes from the U.S. Bureau of Labor Statistics.
The data presented above represents an aggregated, anonymized view into the compensation practices of these startups. Companies that have contractually requested that we not use their data in anonymized and aggregated studies are not included in this analysis.
This report represents a snapshot as of August 1, 2025. Historical data may change in future studies. New companies signing up for Carta’s services will increase the amount of data available for the report.
Salary & equity
All salaries presented in this report are expressed in U.S. dollars. Except where indicated, total payroll numbers do not include any variable compensation, such as bonuses or commissions, that may be given to employees.
All equity values presented in this report are expressed as a percentage of fully diluted company shares.
In the sections on salary and equity trends, changes over time reflect updates to Carta Total Compensation bands. These benchmarks are updated once per quarter to incorporate data from newly hired employees as well as any adjustments to current employee compensation.


DISCLOSURE: This communication is on behalf of eShares, Inc. dba Carta, Inc. ("Carta"). This communication is for informational purposes only, and contains general information only. Carta is not, by means of this communication, rendering accounting, business, financial, investment, legal, tax, or other professional advice or services. This publication is not a substitute for such professional advice or services nor should it be used as a basis for any decision or action that may affect your business or interests. Before making any decision or taking any action that may affect your business or interests, you should consult a qualified professional advisor. This communication is not intended as a recommendation, offer or solicitation for the purchase or sale of any security. Carta does not assume any liability for reliance on the information provided herein. ©2026 Carta. All rights reserved. Reproduction prohibited.