In 2025, many conversations around venture capital fund management have eventually circled back to the same topic: the growing liquidity needs of LPs.
In the early 2020s, VCs rode the back of a bull market to raise record-breaking sums of capital from LPs. Then, the market for IPOs and other venture-backed exits largely dried up. With fewer exits, there were fewer opportunities to return cash to LPs. This meant LPs had less capital to invest in new VC funds, which in turn meant that VCs had less money to invest in new startups. Deal activity declined. The typical cycles of the startup ecosystem were slowing down, because LPs weren’t getting the returns they expected.
In Q2, VCs seemed to get the message.
The percentage of venture funds on Carta that have begun to return capital to their LPs jumped noticeably in Q2 for every vintage from 2017 through 2023, as investors demonstrated a new urgency around generating DPI. Among funds raised in 2017, some 85% have started to generate DPI. Among funds raised in 2019, some 53% have begun returning capital to LPs, including 8% of funds in the vintage that did so for the first time in Q2.
Noticeably, some of the most recent cohorts of funds on Carta are adapting most aggressively. In the 2023 vintage, about 15% of funds had begun generating DPI after six quarters of management. That’s a higher percentage than any other vintage from 2017 through 2022 at that same six-quarter threshold.
For the LPs who have been eagerly awaiting liquidity—and for any other investors or founders interested in greasing the skids for more VC dealmaking—this Q2 increase in DPI is a welcome sign.
Highlights
Key performance metrics are on the rise: Median net TVPI increased at every fund vintage from 2017 to 2023 in Q2. In other words, the value of the typical venture fund inched up. For the 2017 vintage, median TVPI rose to 1.95x. Net IRRs also mostly trended up in Q2, with the median for the 2017 vintage climbing to 13.5%.
Average LP check sizes have grown: Among VC funds with between $1 million and $10 million in commitments that were raised from 2018 to 2021, the average LP check size was $127,000. Among funds of that same size that were raised more recently, from 2022 through 2025, average check size rose to $165,000. This same trend of larger checks from 2022 on holds true for funds up to $100 million in size.
Dry powder is drying up: Most VC funds raised prior to 2021 have little dry powder remaining. Funds in the 2020 vintage, for instance, have just 11% of their total committed capital still available to invest. More recent funds are also deploying capital quickly. Funds in the 2023 vintage have 42% of their cash in reserve, while 33% of capital from the 2022 vintage remains as dry powder.
Fund details
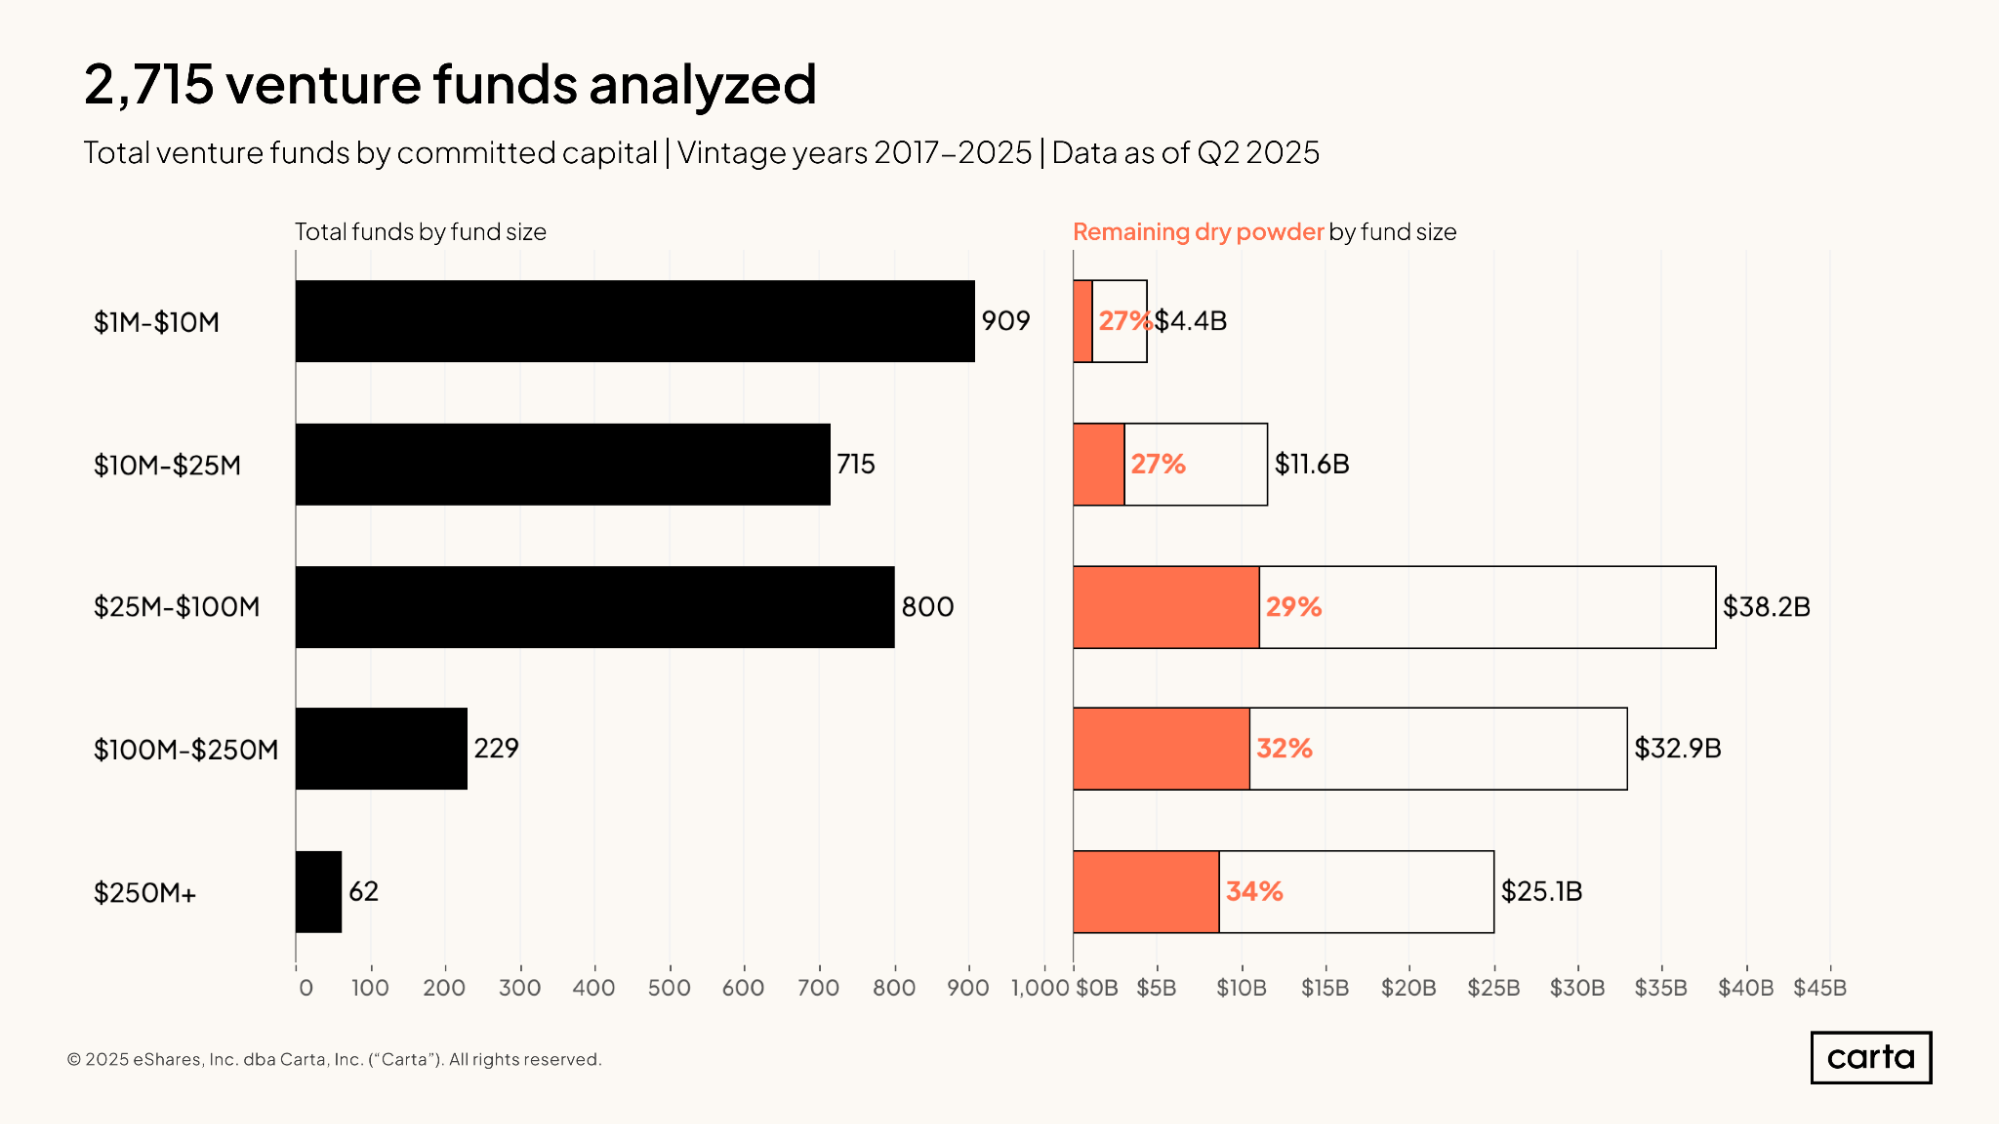
This report includes data from 2,715 venture funds with vintage years ranging from 2017 through 2025. Across all fund sizes, these vehicles combined to raise about $112.2 billion in capital commitments. Some $38.2 billion of this capital (about 34% of the total) is managed by funds between $25 million and $100 million in size, while another $32.9 billion (29% of the total) was raised by funds between $100 million and $250 million.
In each of the five size intervals shown here, somewhere between 27% and 34% of all committed capital remains uninvested and ready to deploy. The largest venture funds—those with more than $250 million in commitments—have the highest portion of remaining dry powder, at 34%.
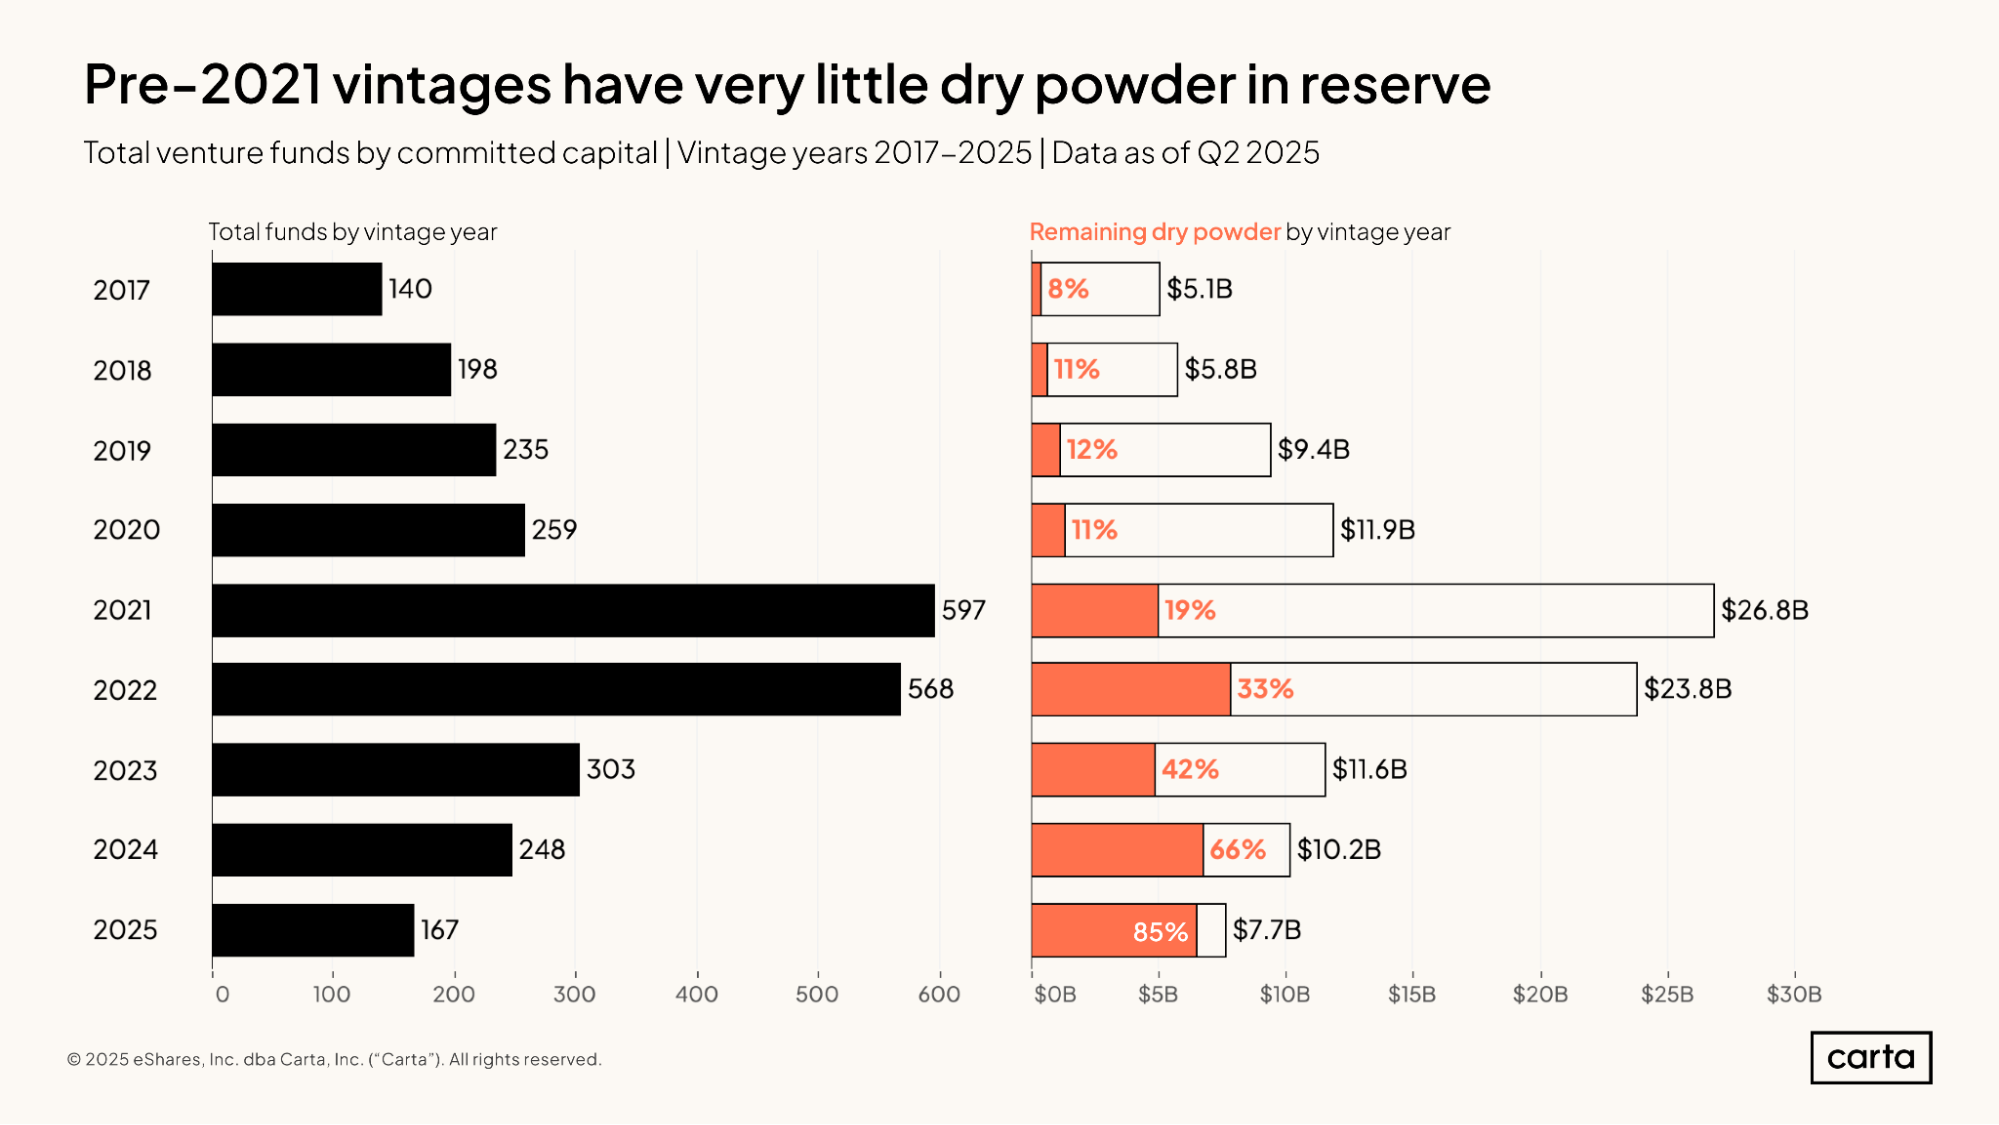
As a whole, venture funds that were raised prior to 2021 have now invested roughly 90% of their available capital. In the 2020 vintage, just 11% of committed capital across all funds remains as uninvested dry powder. This rate of dry powder is similar for the 2019, 2018, and 2017 vintages.
More recent vintages have more dry powder still in reserve. But venture funds tend to invest their capital on relatively rapid timelines. For instance, the two-year-old funds from the 2023 vintage have already deployed 58% of their committed capital, or about $6.7 billion, with the other 42% remaining as dry powder. Funds from the 2025 vintage have already put 15% of their committed capital to work.
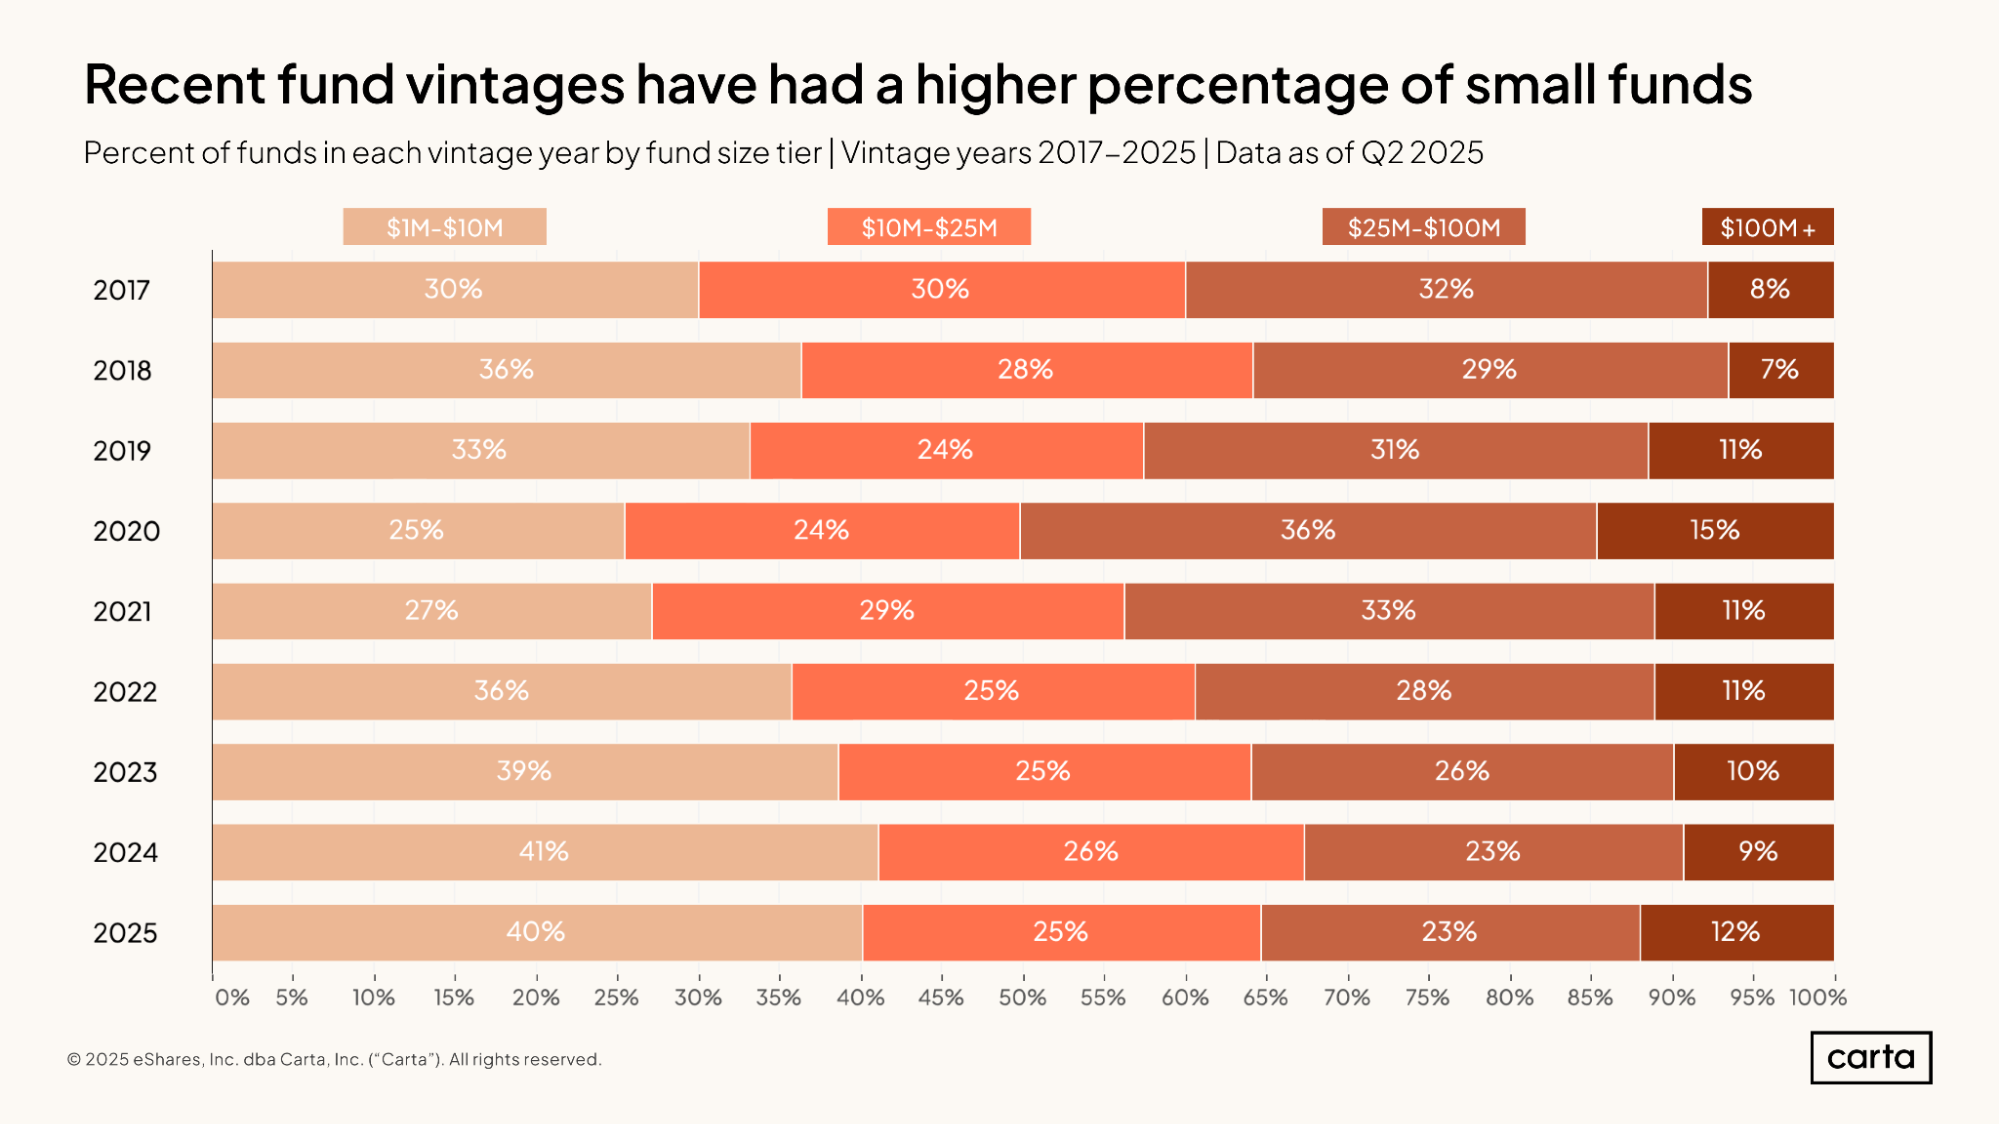
In both the 2024 and 2025 vintages, at least 40% of all closed funds on Carta had between $1 million and $10 million in committed capital. That percentage has increased markedly over the past five years, rising from 25% in 2020. At least in part, this shift in the market is due to the growing presence of solo GPs and other emerging managers, who are more likely than established managers to raise smaller funds.
In the first half of 2025, however, there was also a slight uptick in the frequency of the largest VC funds: Some 12% of vehicles closed during H1 had at least $100 million in commitments, on pace for the highest annual figure since 2020.
As both the smallest and largest funds have grown more common, mid-sized vehicles have felt the squeeze. Just 48% of funds closed in 2025 were between $10 million and $100 million in size, the smallest percentage in at least the past nine years.
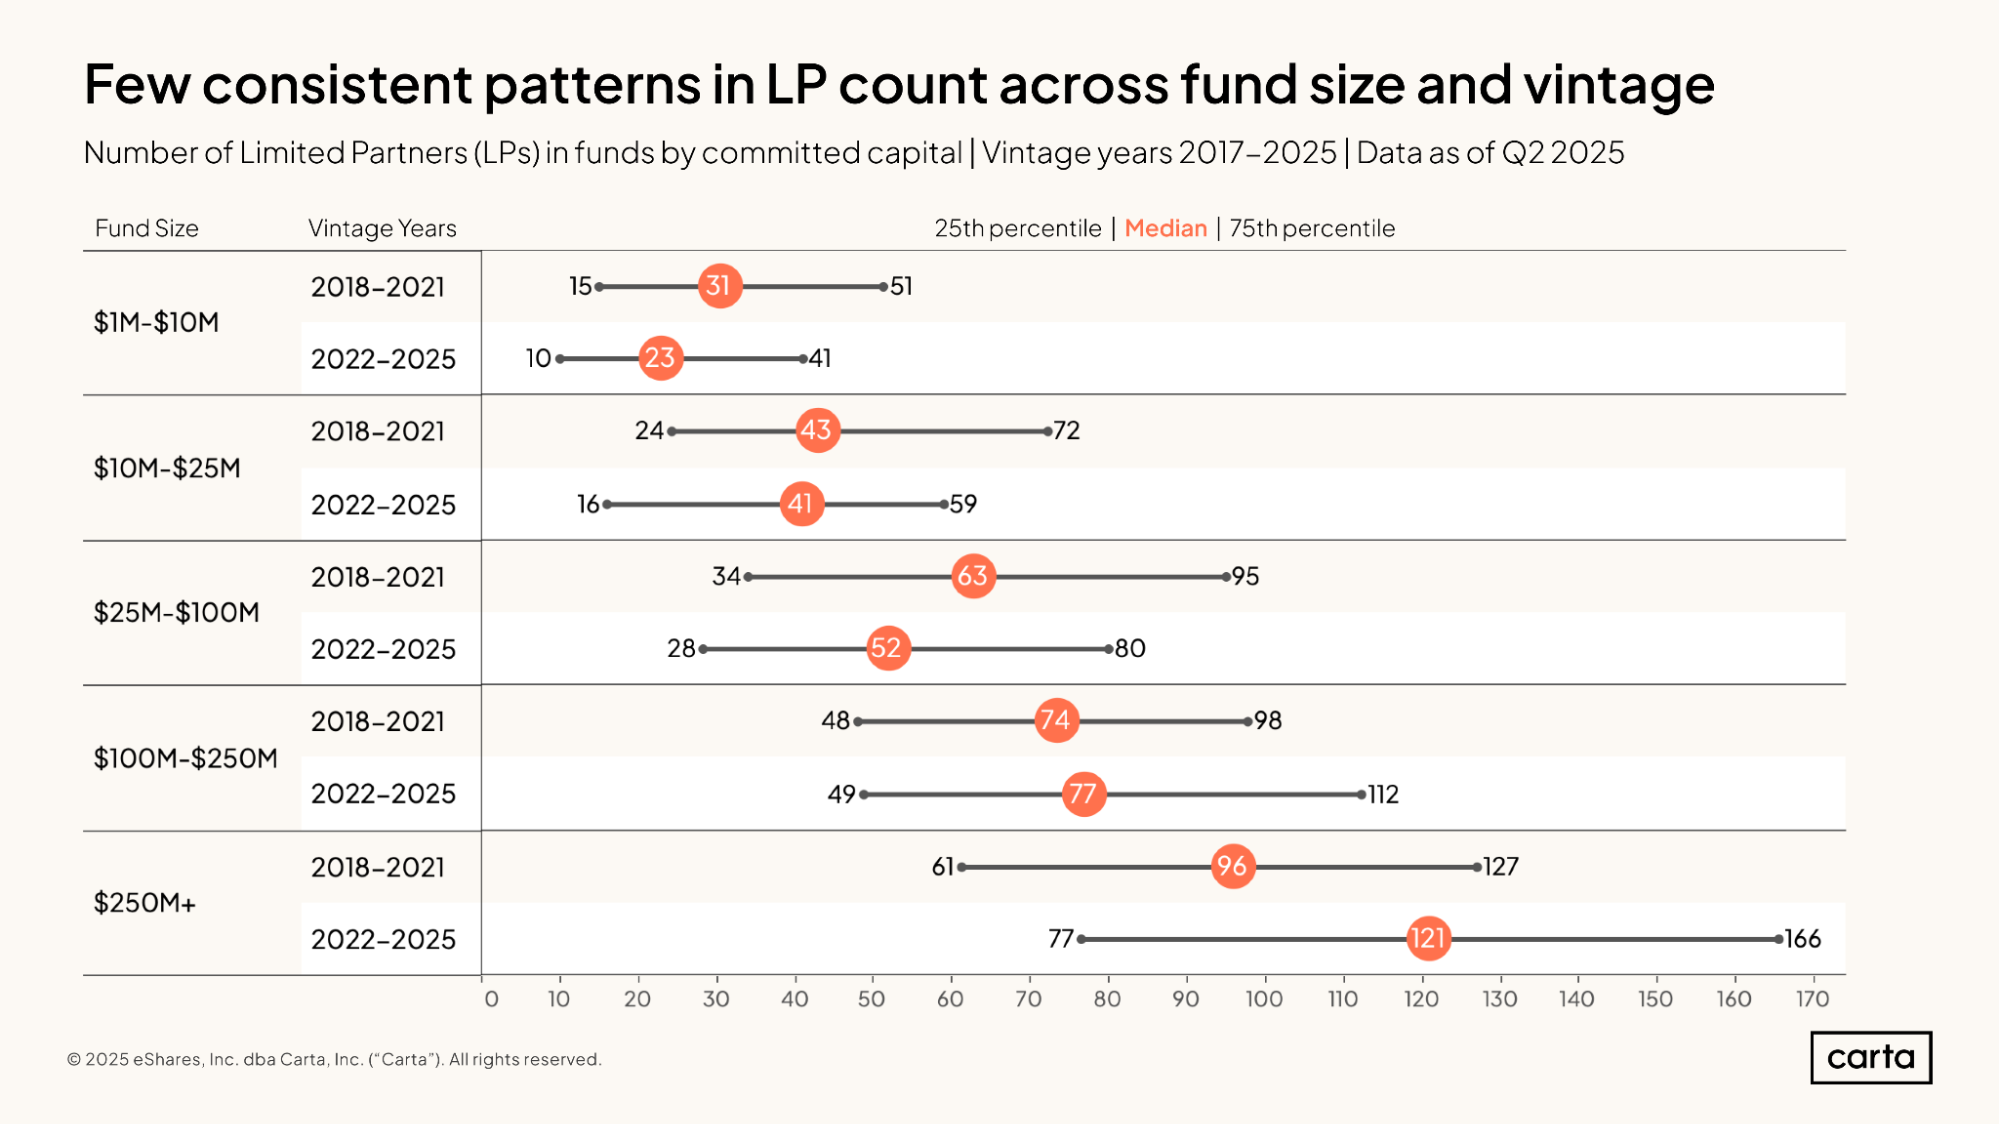
In general, larger venture funds tend to have more LPs. Among vehicles raised since the start of 2022, for instance, the median fund between $1 million and $10 million in size had 23 LPs. Over the same span, the median fund larger than $250 million had 121 LPs—about five times more than the median count among the smallest funds.
Within any given grouping of fund sizes, however, there tends to be substantial variation in the number of LPs. For the cohort of post-2022 funds that are larger than $250 million, the 25th percentile for LP count is 77, and the 75th percentile is 166. The gaps between the 25th percentile and 75th percentile for LP count are similarly vast at other fund-size intervals.
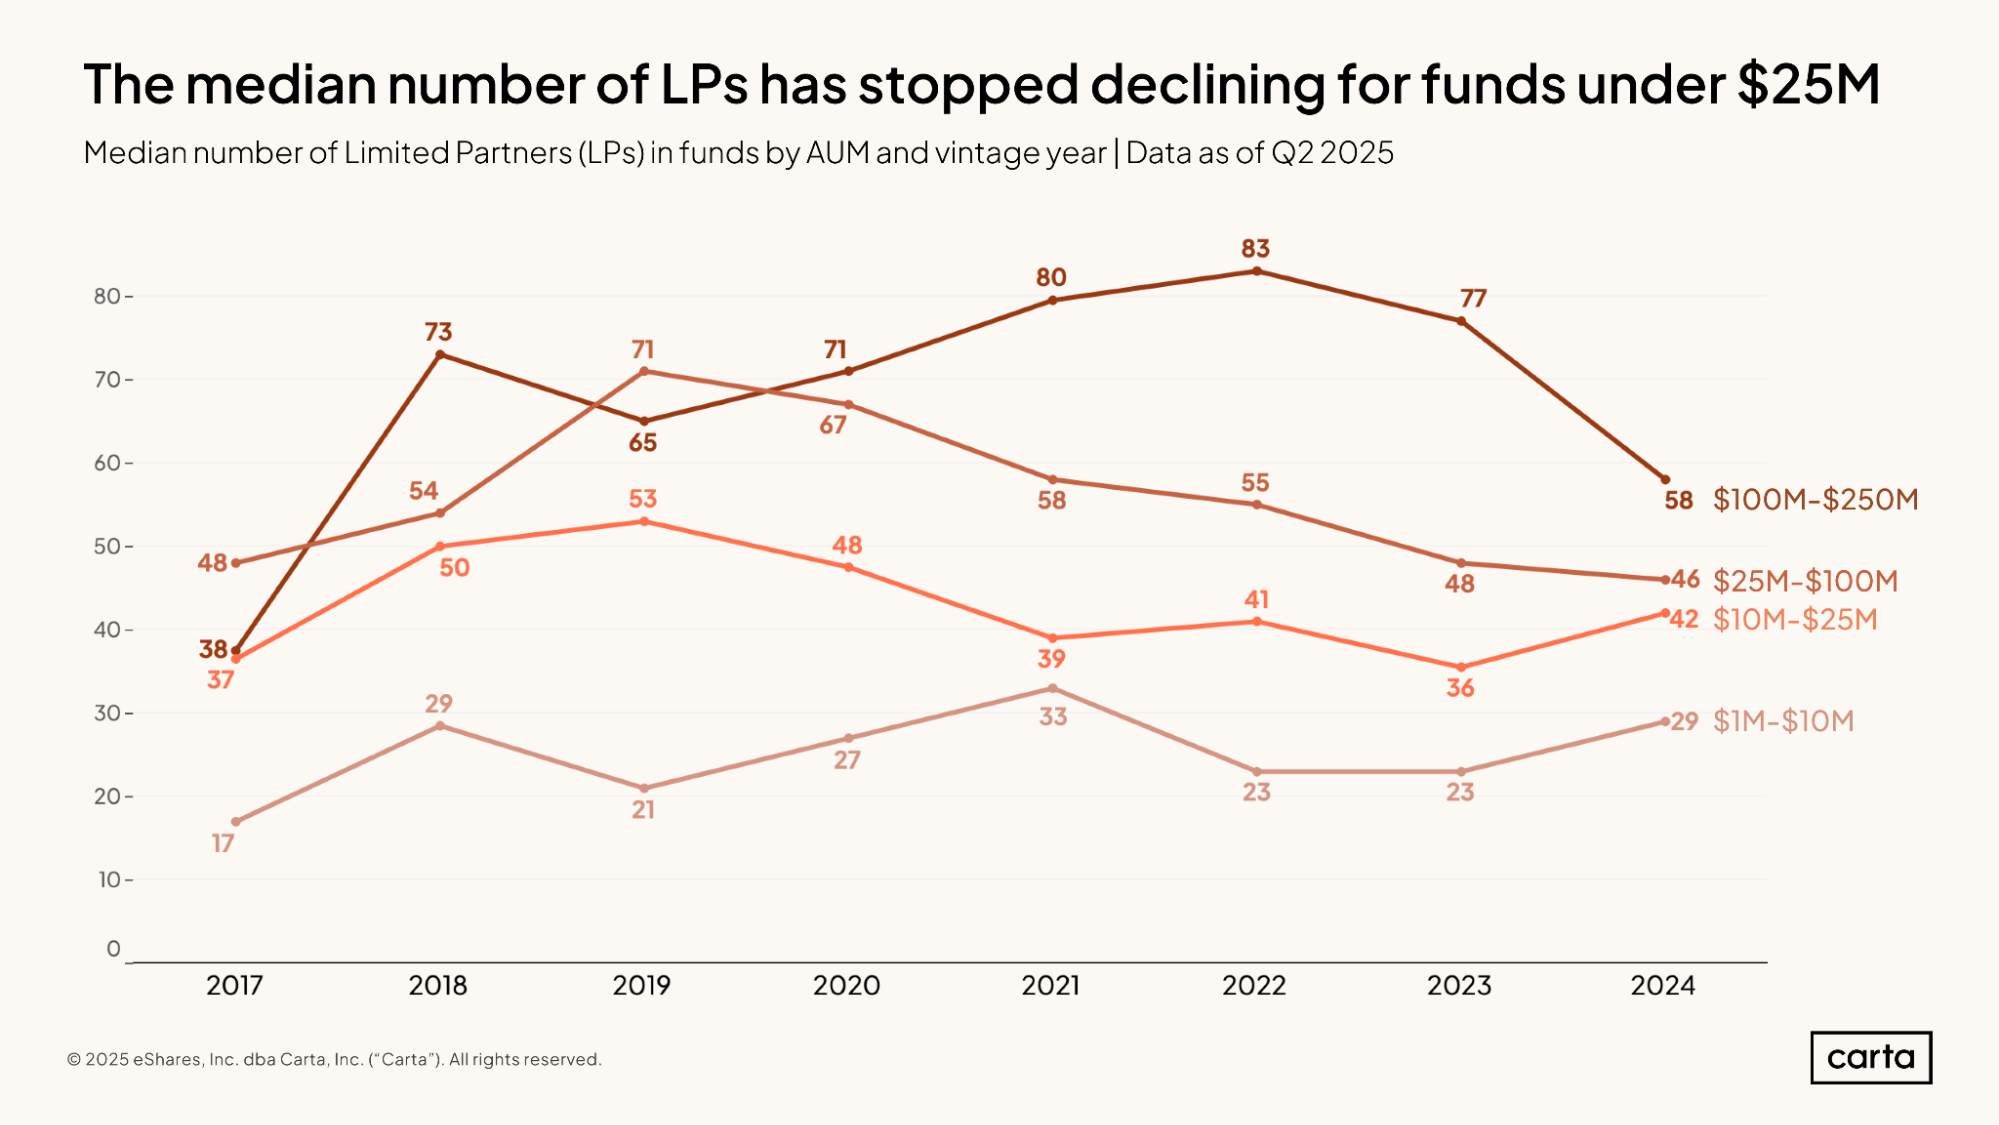
Among funds smaller than $25 million, the median number of LPs in newly closed VC vehicles increased in 2024. Conversely, among funds larger than $25 million, the median number of LPs decreased.
This means that the differences in LP count across different fund sizes are growing less severe. In 2024, the median LP count in the largest interval shown above ($100 million to $250 million) was only 2x larger than the median LP count in the smallest interval ($1 million to $10 million). That’s the tightest gap between these different fund sizes in recent history.
Last year’s biggest shift came among funds between $100 million and $250 million, where the median LP count dropped to 58—a 25% year-over-year decline. For funds between $10 million and $25 million, the median number of LPs increased for the second time in the past three years, rising to 42.
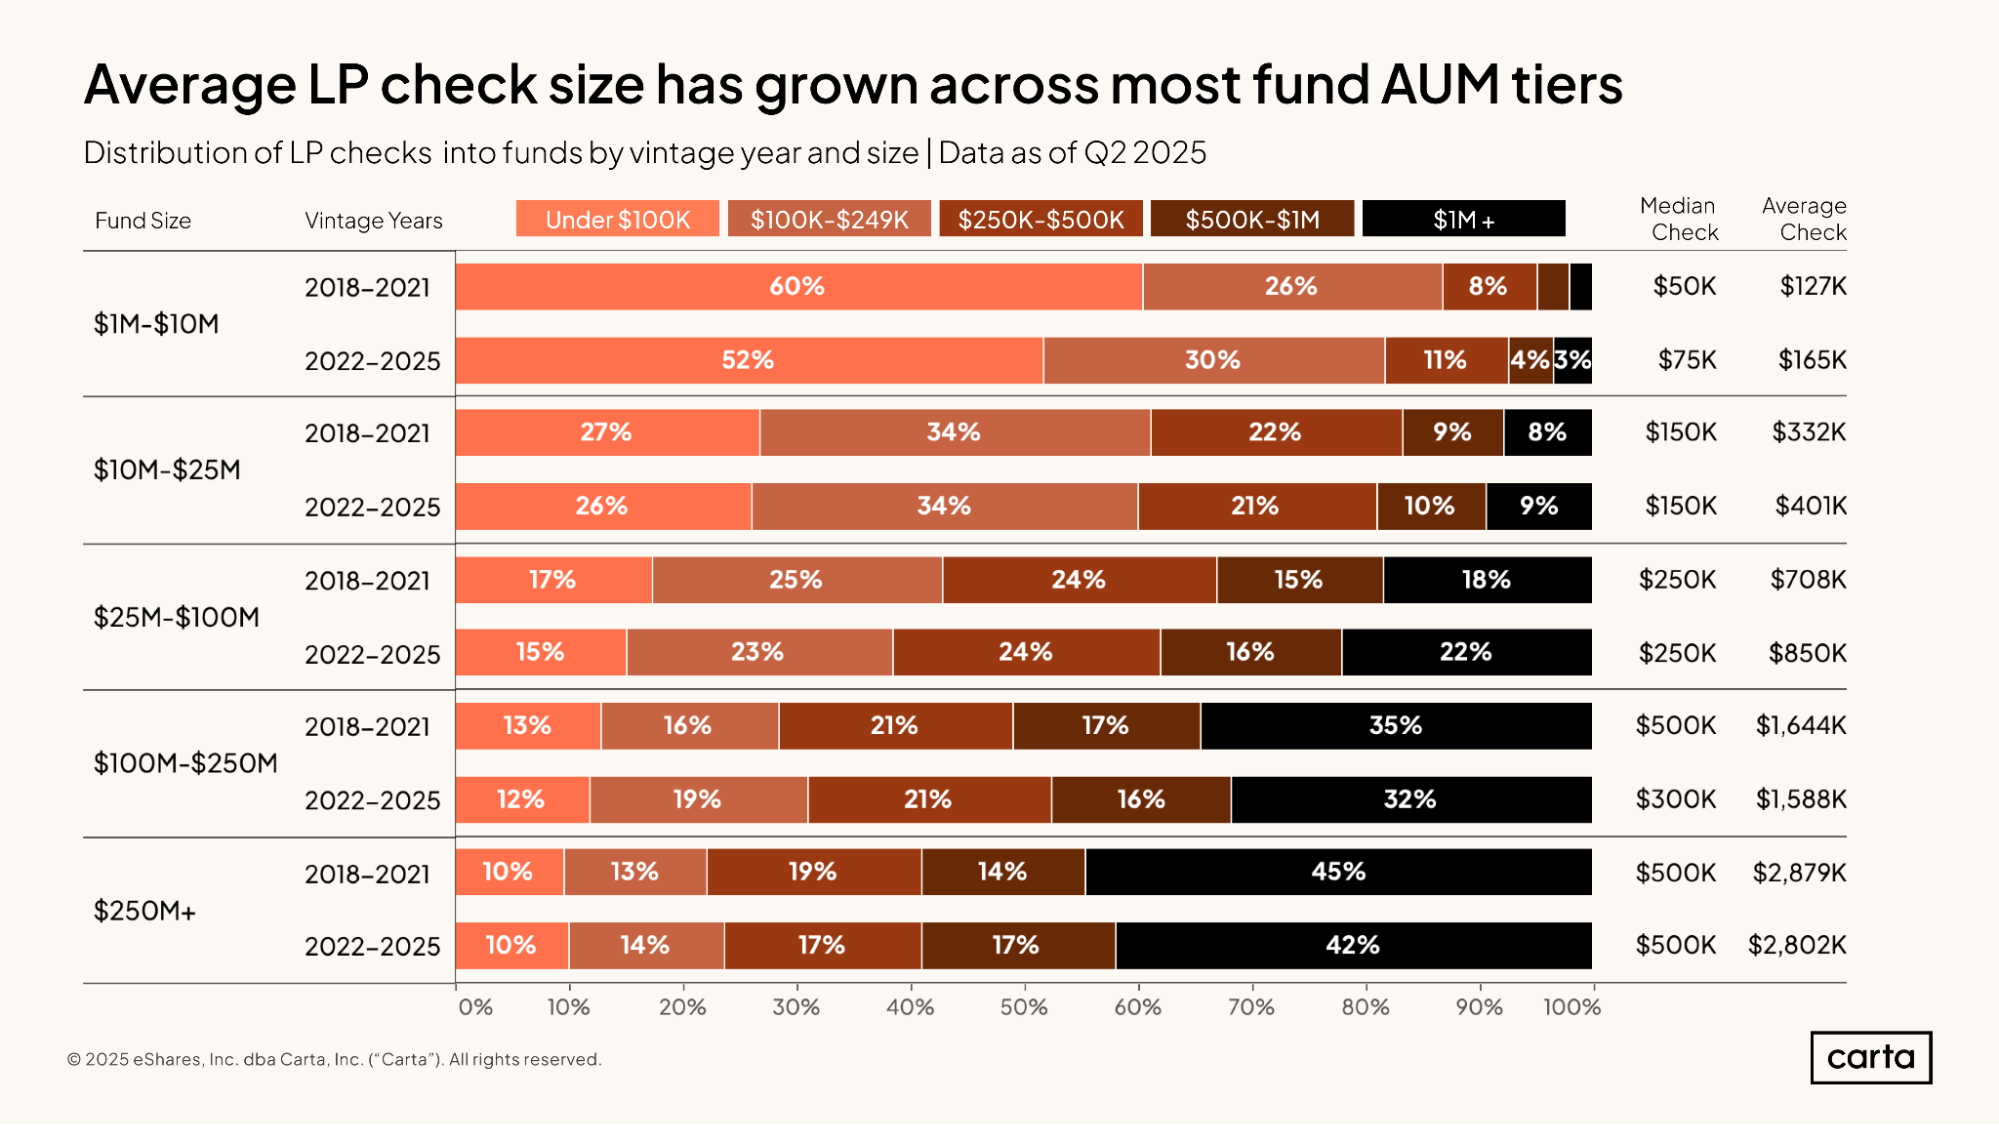
Among funds with less than $100 million in capital commitments, the average LP check size has been growing in recent years. For funds between $1 million and $10 million, the average LP check size for funds closed from 2022 through 2025 was about $165,000, up from $127,000 for funds closed from 2018 through 2021. For funds between $25 million and $100 million, average check size increased from $708,000 to $850,000 between the same two periods.
Larger VC funds rely on larger checks. The average LP check for funds over $250 million that were closed since 2022 was a little over $2.8 million, down slightly from an average of $2.88 million for funds of the same size that closed from 2018 through 2021. Regardless of vintage, among funds with at least $250 million in commitments, more than 40% of LP checks are at least $1 million in size.
IRR
Where C(t) = net cash flow at a given time t
C(0) = total initial cost of investments
NPV = net present value of the fund’s future cash distribution (set to 0 to numerically solve for IRR)
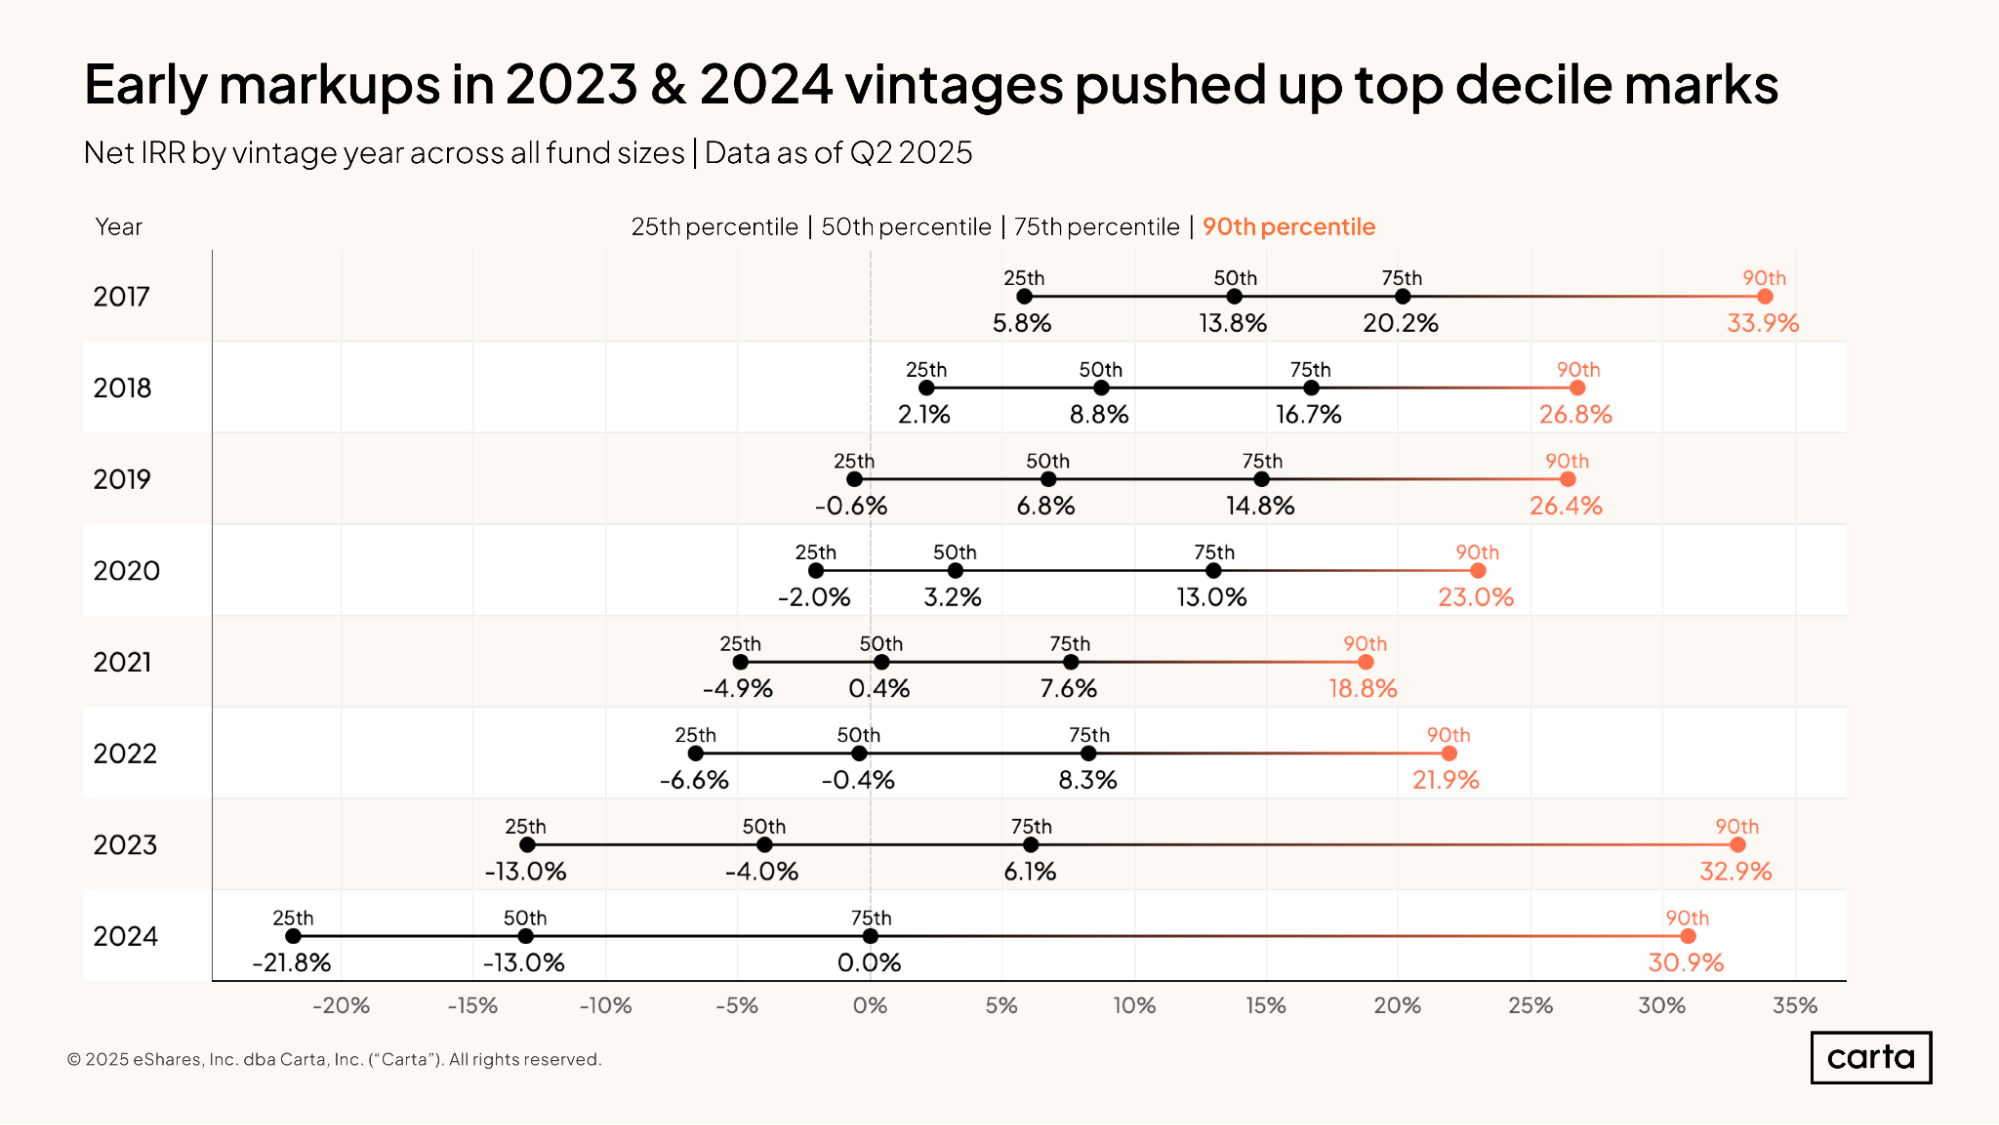
Since most of the funds in the vintages shown here are still actively managing their portfolios, it’s expected that older vintages will tend to boast better IRRs. Performance for active venture funds typically follows a J-curve, with returns improving as time goes on.
For instance, the 2017 vintage has a higher median net IRR than the 2018 vintage, which in turn has a higher median net IRR than the 2019 vintage, which in turn has a higher median net IRR than the 2020 vintage. The same trends tend to apply at other percentiles, too.
There are two clear exceptions, however. At the 90th percentile, funds from 2023 and 2024 have some of the highest IRRs of any vintage from 2017 on, rising above 30%. This strong early performance from these most recent vintages is due in large part to early markups on portfolio companies that have experienced rapid growth during the ongoing AI boom. As the valuations of these top-tier startups continue to rise, their investors’ performance metrics will do the same.
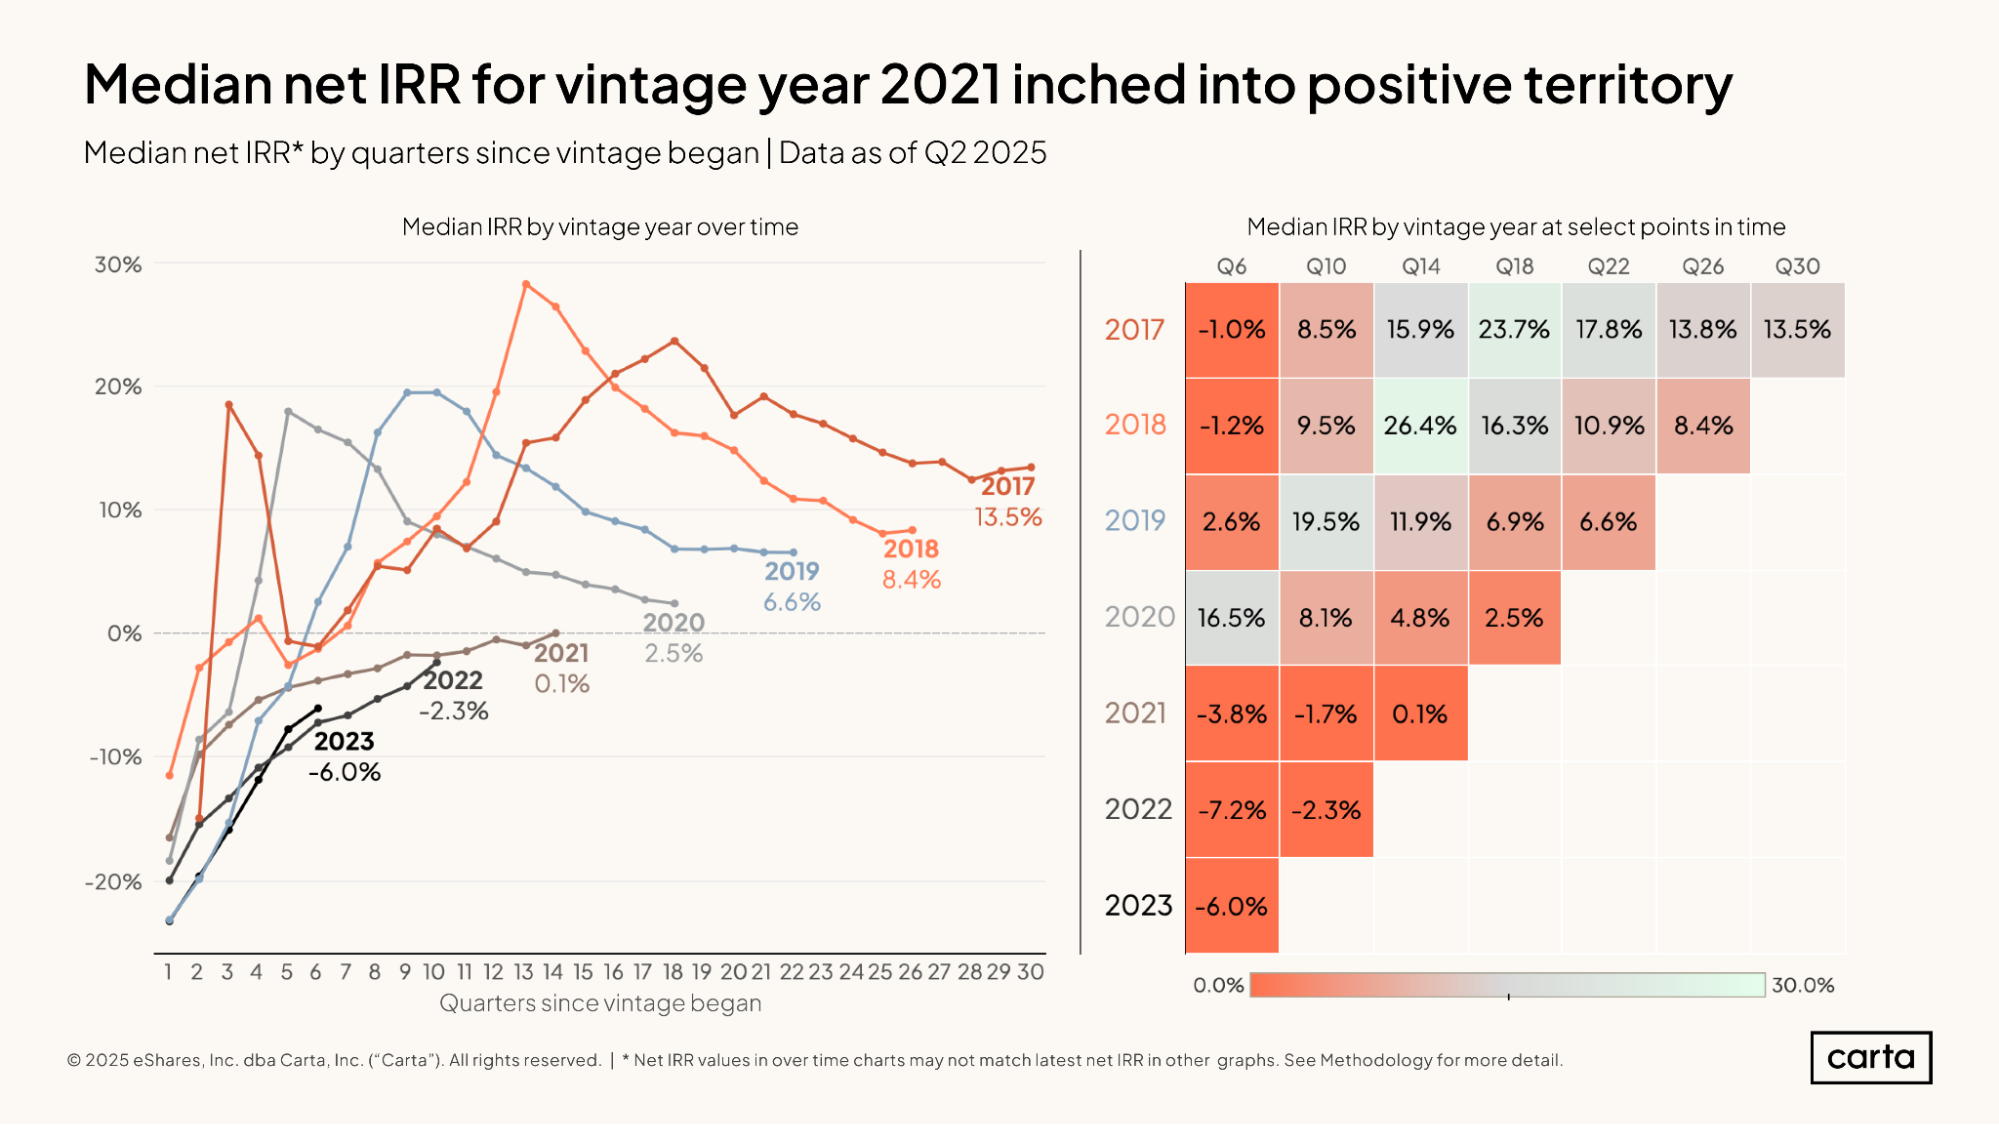
In terms of IRR performance, it was a strong Q2 for many of the most recent vintages of VC funds. Among 2018 funds, median net IRR increased to 8.4% last quarter, the most significant quarter-over-quarter improvement for that vintage in several years. Among 2021 funds, median net IRR rose to 0.1%, climbing above zero for the first time.
Median IRR increased last quarter for every vintage from 2021 through 2024. Still, each of these vintages is lagging well behind the IRR performance of vintages from 2017 through 2020 at similar milestones. For example, at 10 quarters after closing, median IRRs for vintages 2017 through 2020 were all at least 8.1%. At the same point in time, median IRRs for the 2021 and 2022 vintages were still below zero.
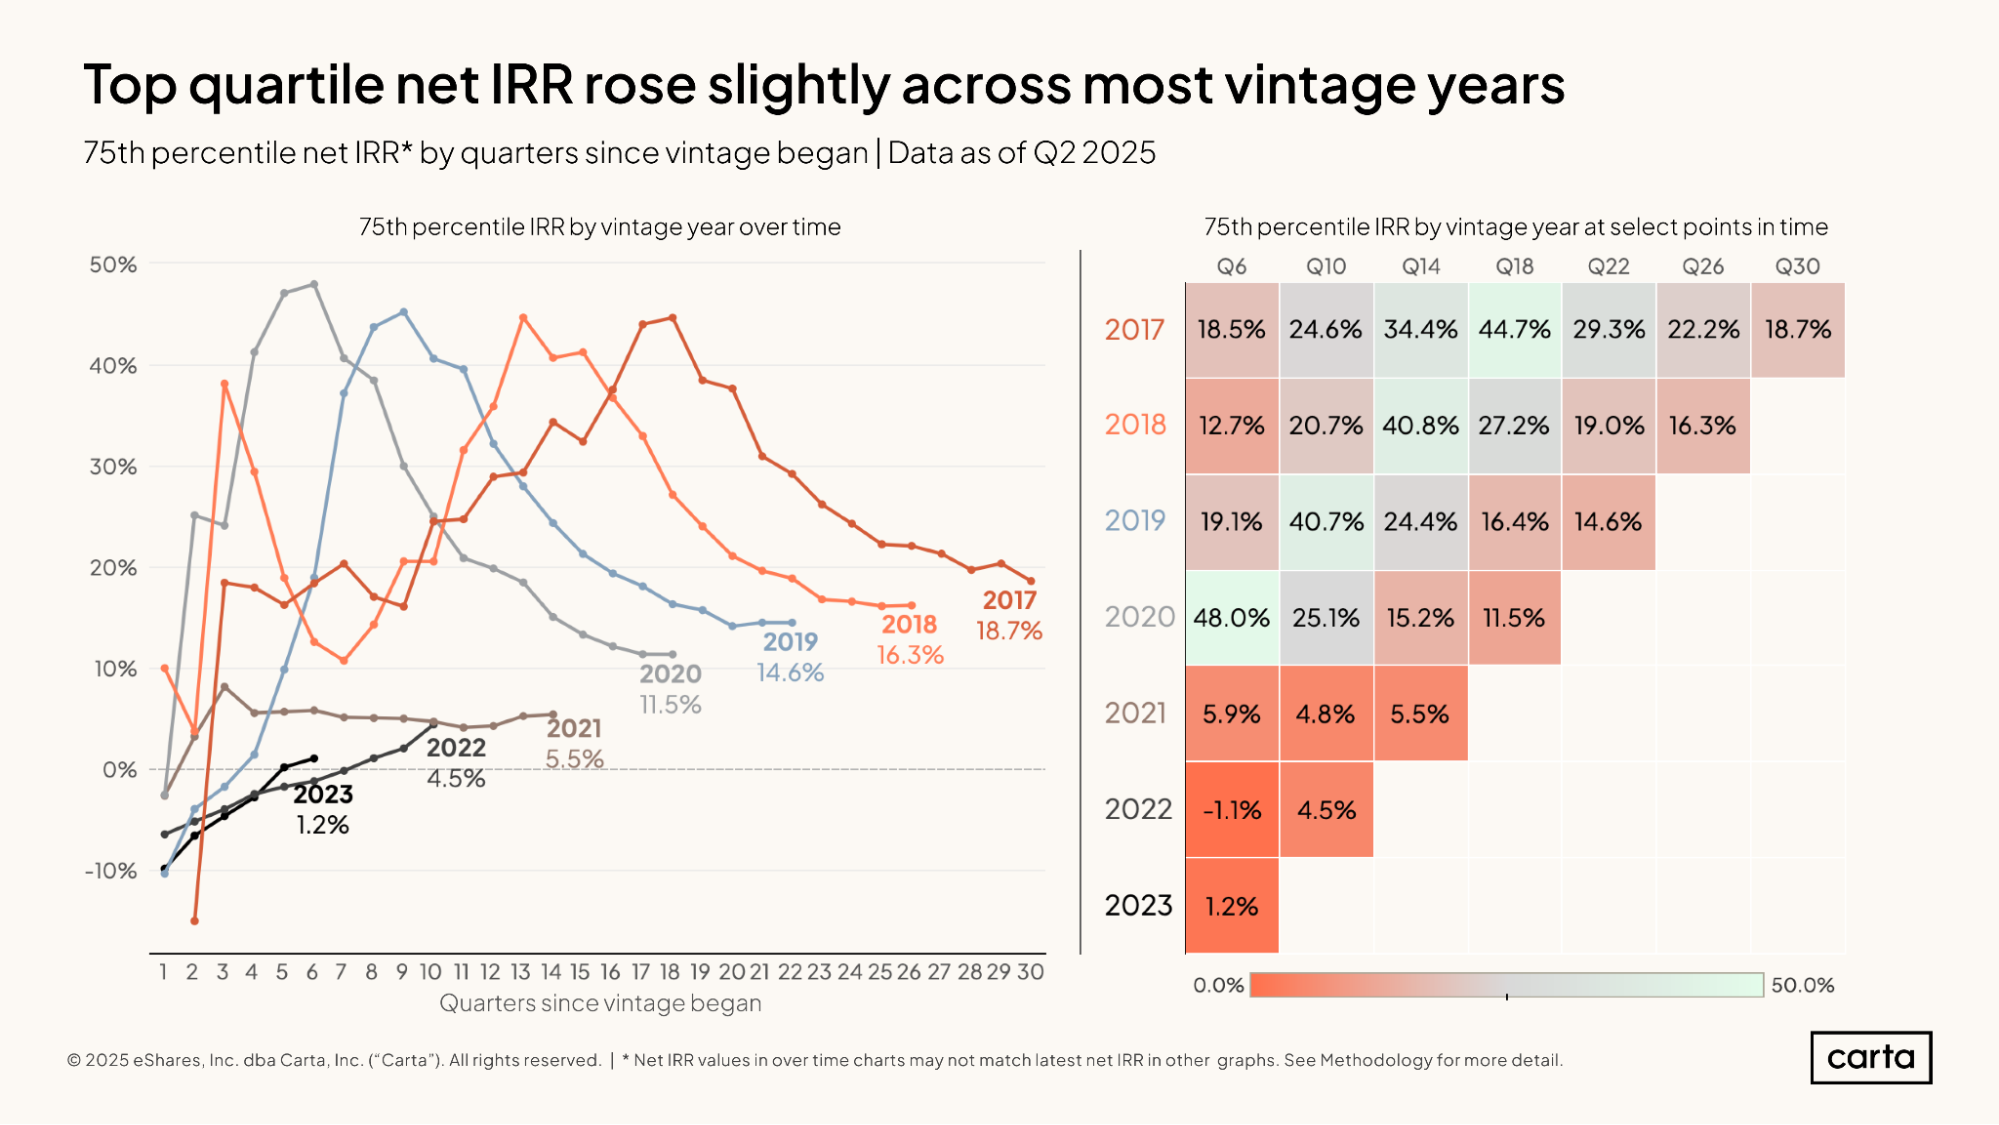
At the 75th percentile, IRRs increased or remained flat last quarter for every vintage shown above except for 2017, which experienced a slight decline. For vintages from 2020 and earlier, the 75th percentile for IRR has remained relatively steady over the past three quarters, arresting a prior trend of steep declines.
At 10 quarters since closing, the 75th percentile for net IRR in the 2022 vintage is 4.5%, about the same as the 75th percentile for net IRR in the 2021 vintage at the same point in time. But these vintages have been much slower to produce major returns than their immediate predecessors. At that same milestone of 10 quarters, the 75th percentile for IRR in the 2020 vintage was 25.1%.
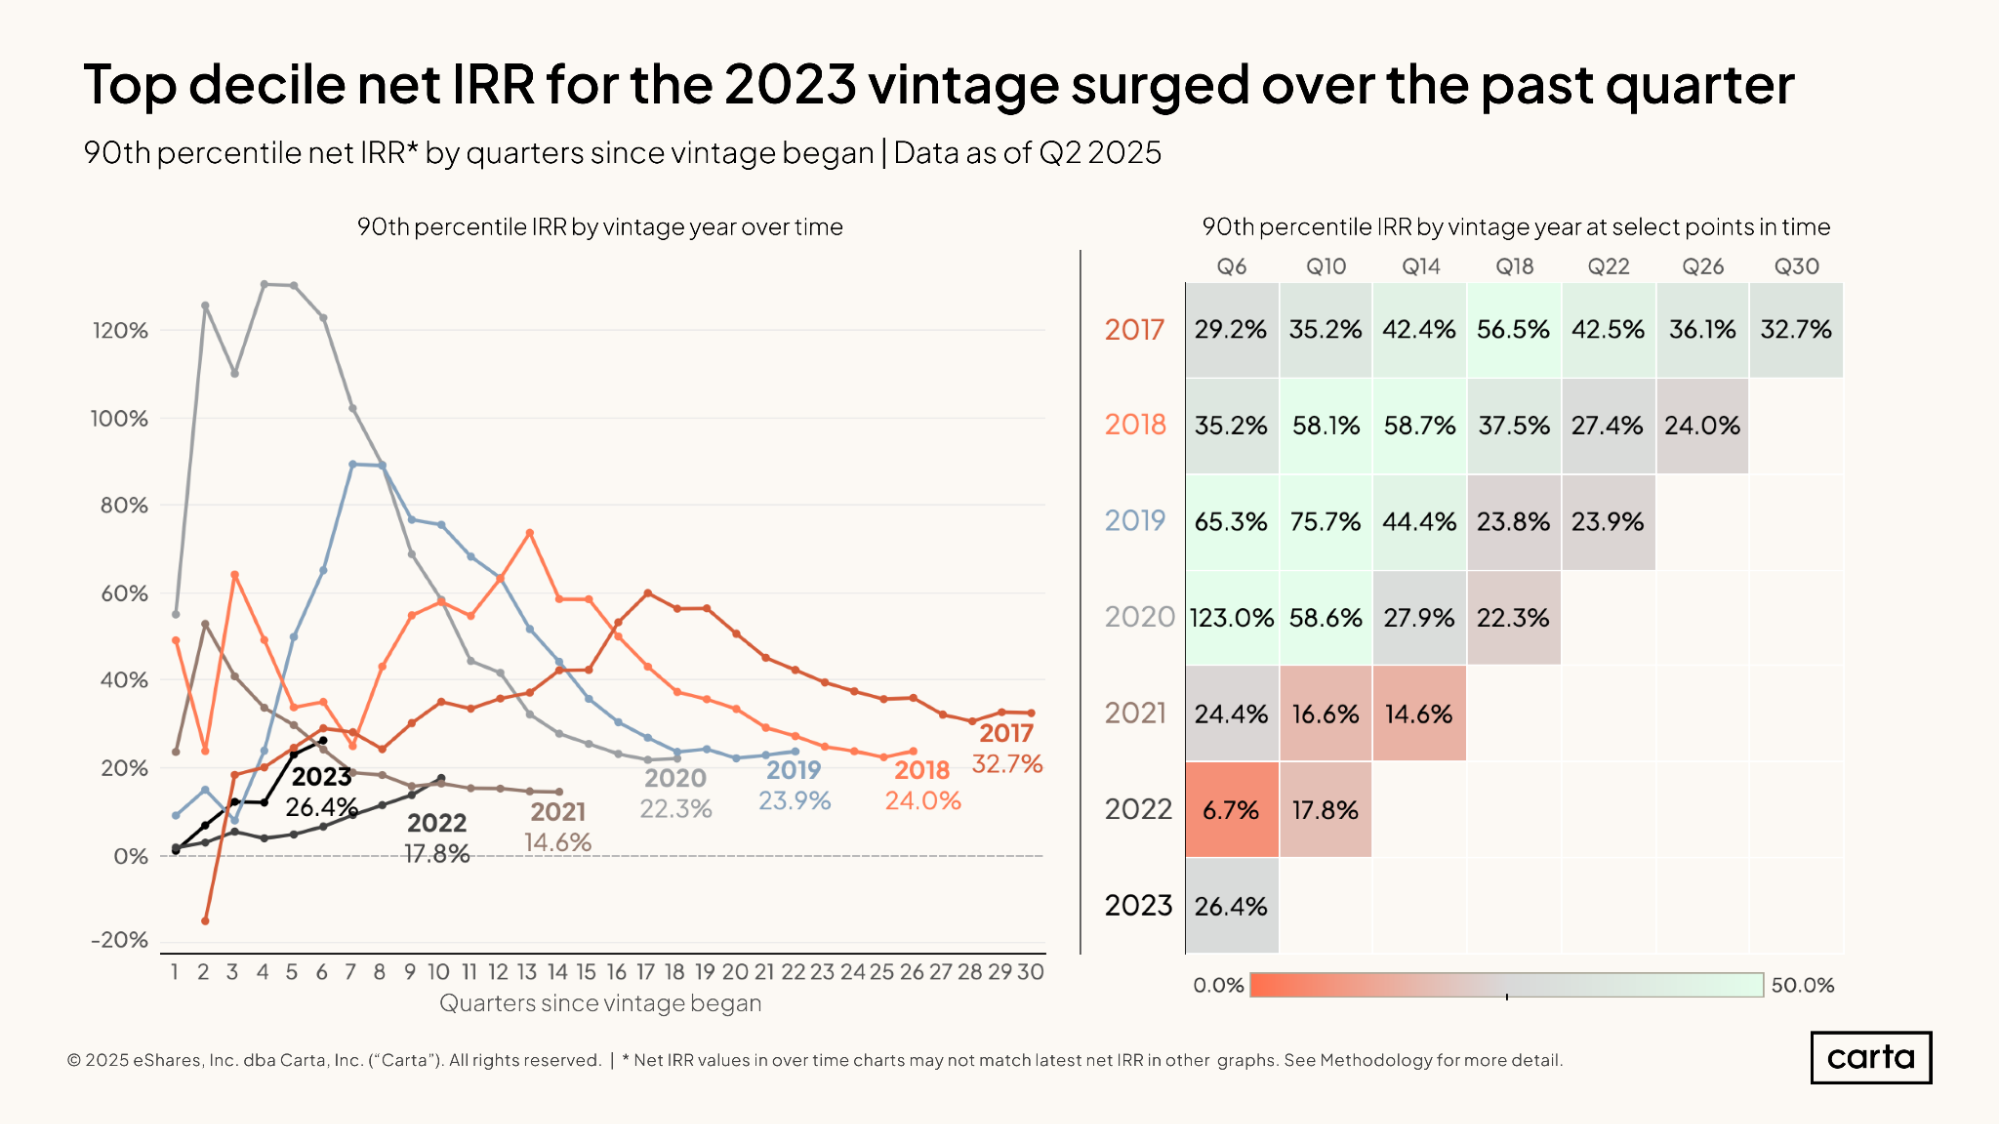
At the top decile of performance, the most recent fund vintages are outperforming some of their older peers. At six quarters after closing, for example, the 90th percentile for net IRR among the 2023 vintage was 26.4%, significantly higher than a 90th percentile IRR of 6.7% for the 2022 vintage at the same time. And at 10 quarters after closing, the 90th percentile for IRR among the 2022 vintage was 17.8%, compared to 16.6% for the 2021 vintage.
Again, this strong upper-decile performance in the 2022 and 2023 vintages is likely due to some significant valuation markups for some portfolio companies that have been able to ride the AI wave to increasingly lofty valuations. Since IRR factors in unrealized gains, these booming valuations can make an immediate mark.
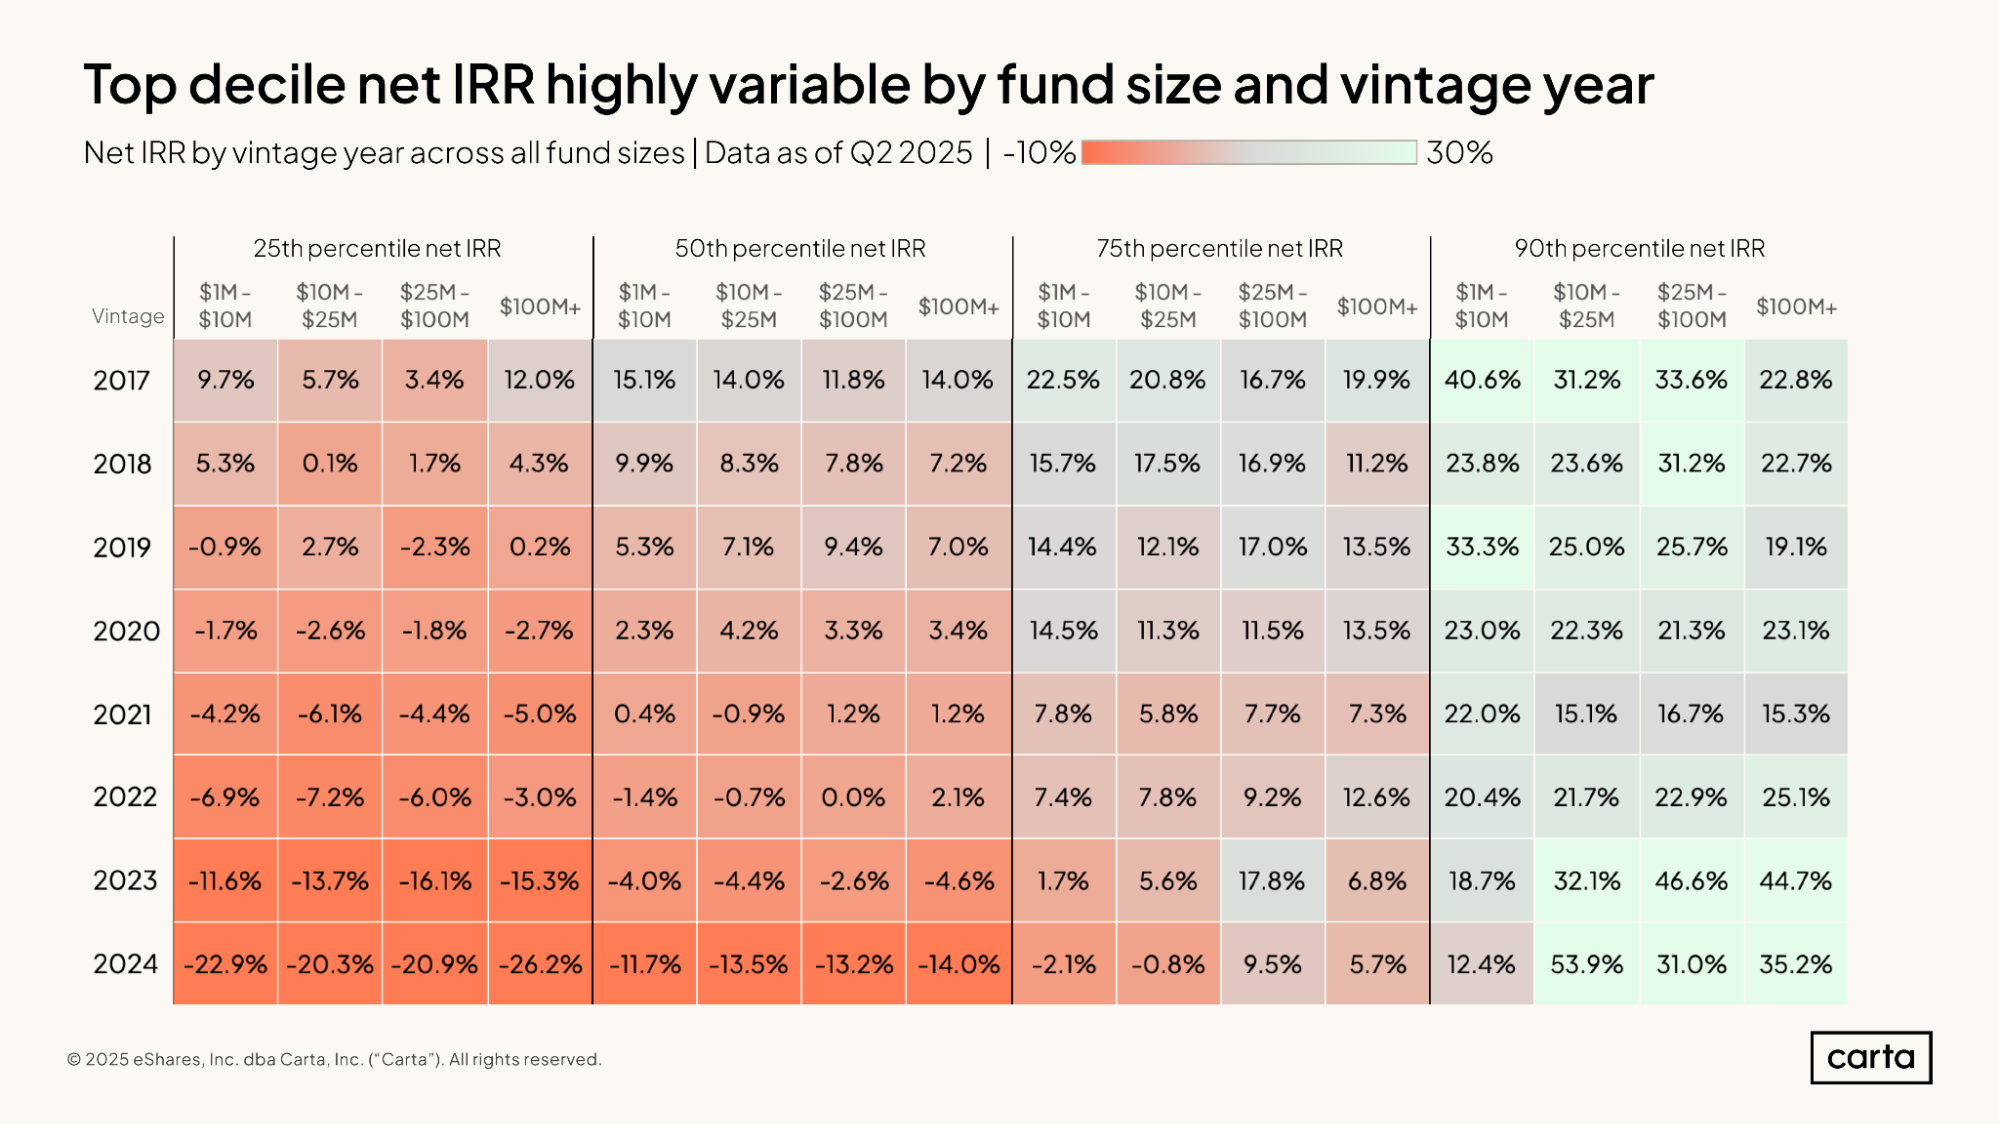
As a rule of thumb, smaller VC funds tend to have better IRRs than larger funds, and older funds tend to have better IRRs than newer funds, at least among vehicles that are still being actively managed. On both counts, however, recent data provides plenty of exceptions.
Among the 2019 vintage, for instance, the smallest funds (those from $1 million to $10 million in size) actually have the lowest median net IRR of any size cohort, at 5.3%. Funds from $25 million to $100 million lead the way in that vintage, with a median of 9.4%. And at the 90th percentile, many newer funds have higher IRRs than their older peers. For funds larger than $100 million, the best top-decile performance to date can be found in the 2023 vintage.
TVPI
TVPI (total value to paid-in capital) is another key metric used to track the performance of active funds. At a basic level, a TVPI multiple represents the growth in a fund’s value across both realized and unrealized investments. The 2017 fund vintage, for example, has a median TVPI of 2x, which means the current value of a fund’s assets is two times the total value of the capital that its LPs initially paid in.
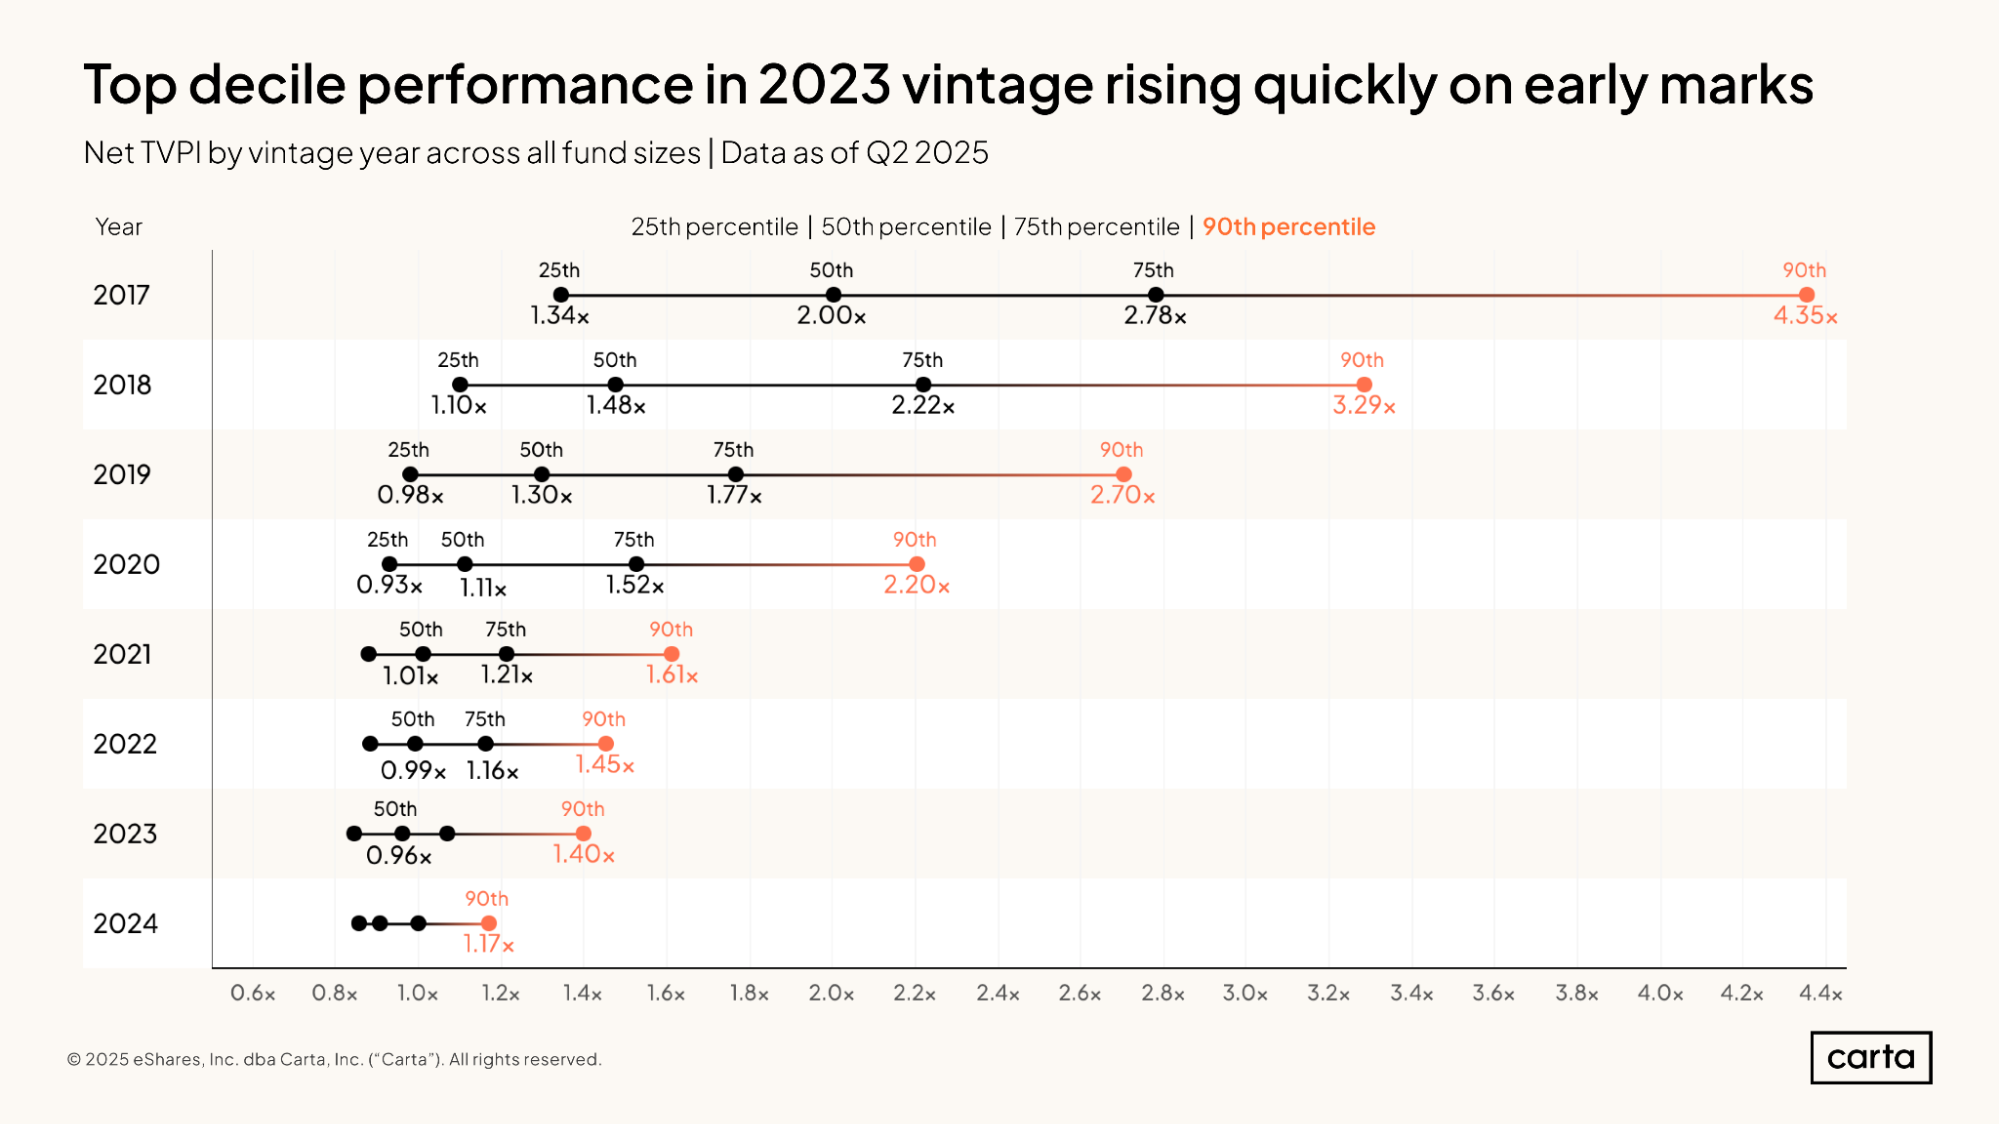
More recent fund vintages tend to have a tightly packed distribution of TVPIs, with relatively little variation between the 25th percentile and the 90th percentile. These funds and their portfolio companies simply haven’t had much time to create value. In older vintages, TVPIs tend to be higher, and the spectrum of performance tends to be wider.
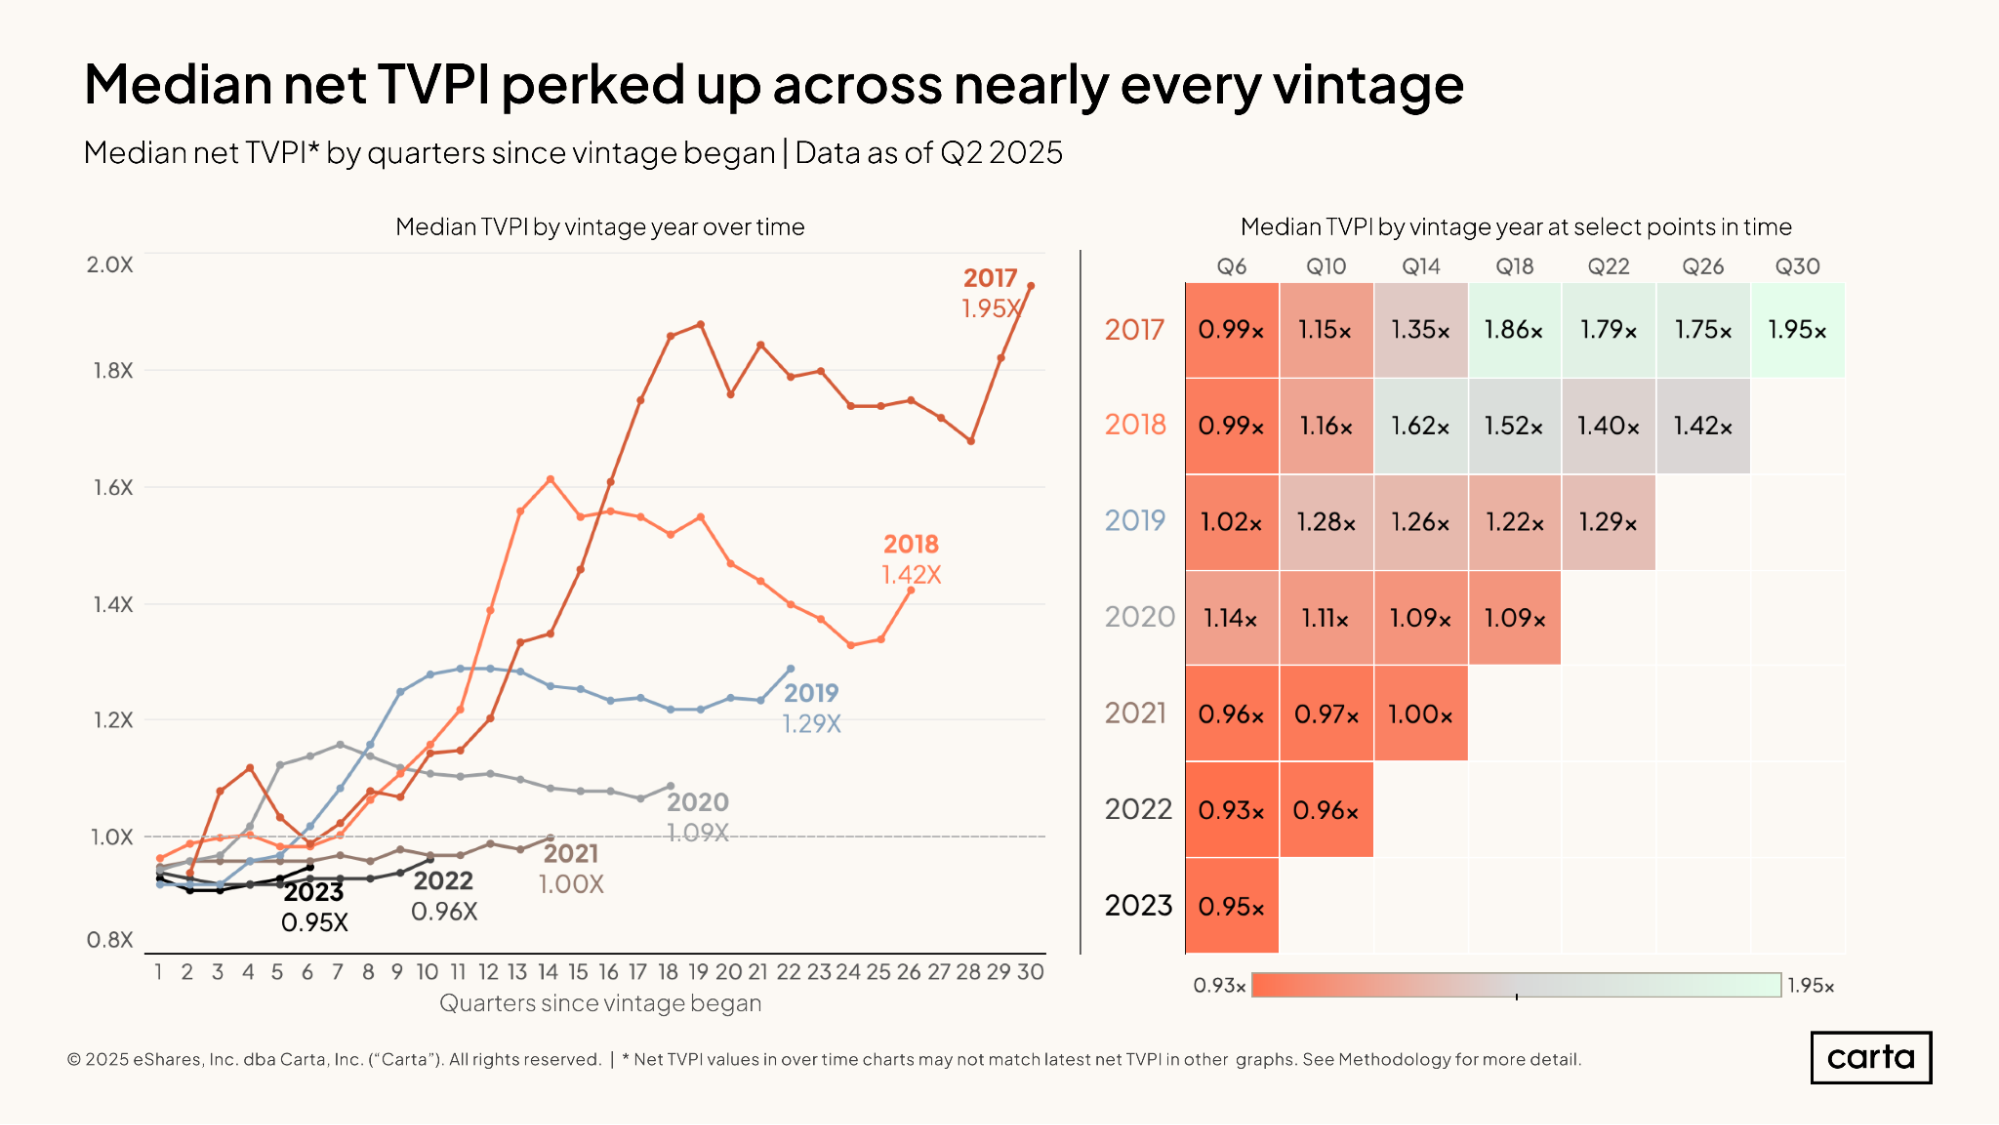
Median net TVPI increased across most VC fund vintages in Q2, with the largest gains coming among vintages from the late 2010s. In the 2017 vintage, median TVPI reached a new high last quarter, rising to 1.95x.
TVPIs for vintages from 2021 through 2024 seem to be following a typical J-curve, with slow performance in the initial quarters after inception followed by a gradual ascent toward positive territory. But the TVPIs for all four of these vintages lag well behind the performance of the 2017-2020 vintages at the same milestones in time.
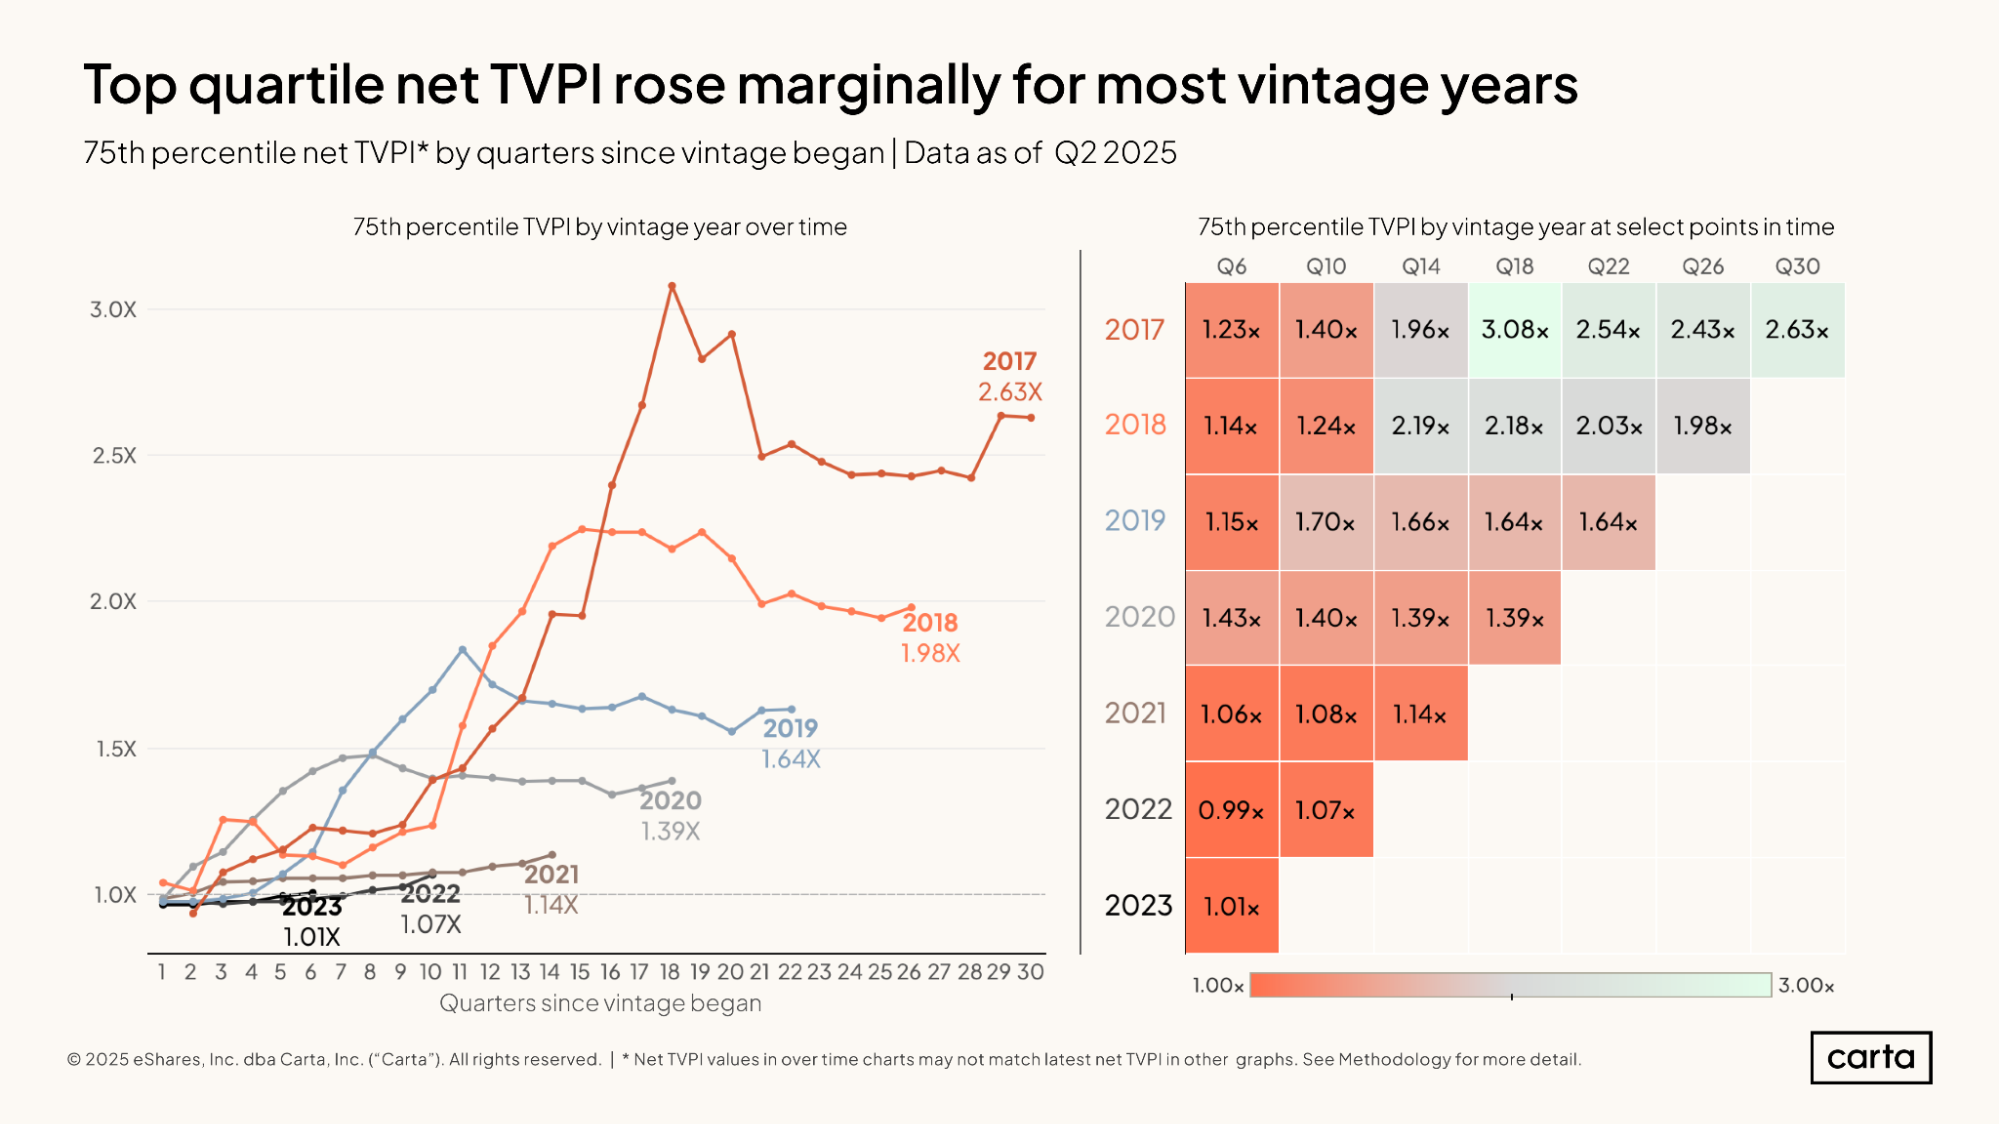
TVPI also trended up last quarter in most vintages at the top quartile of performance, just like they did at the median. In most cases, however, these increases were slight. Among 2018 funds, the 75th percentile of TVPI ticked up to 1.98x, nearing the 2x threshold. It was previously well above 2x for several quarters in 2022 and 2023.
The 75th percentile of TVPI is now higher than 1x for every vintage from 2017 through 2023.
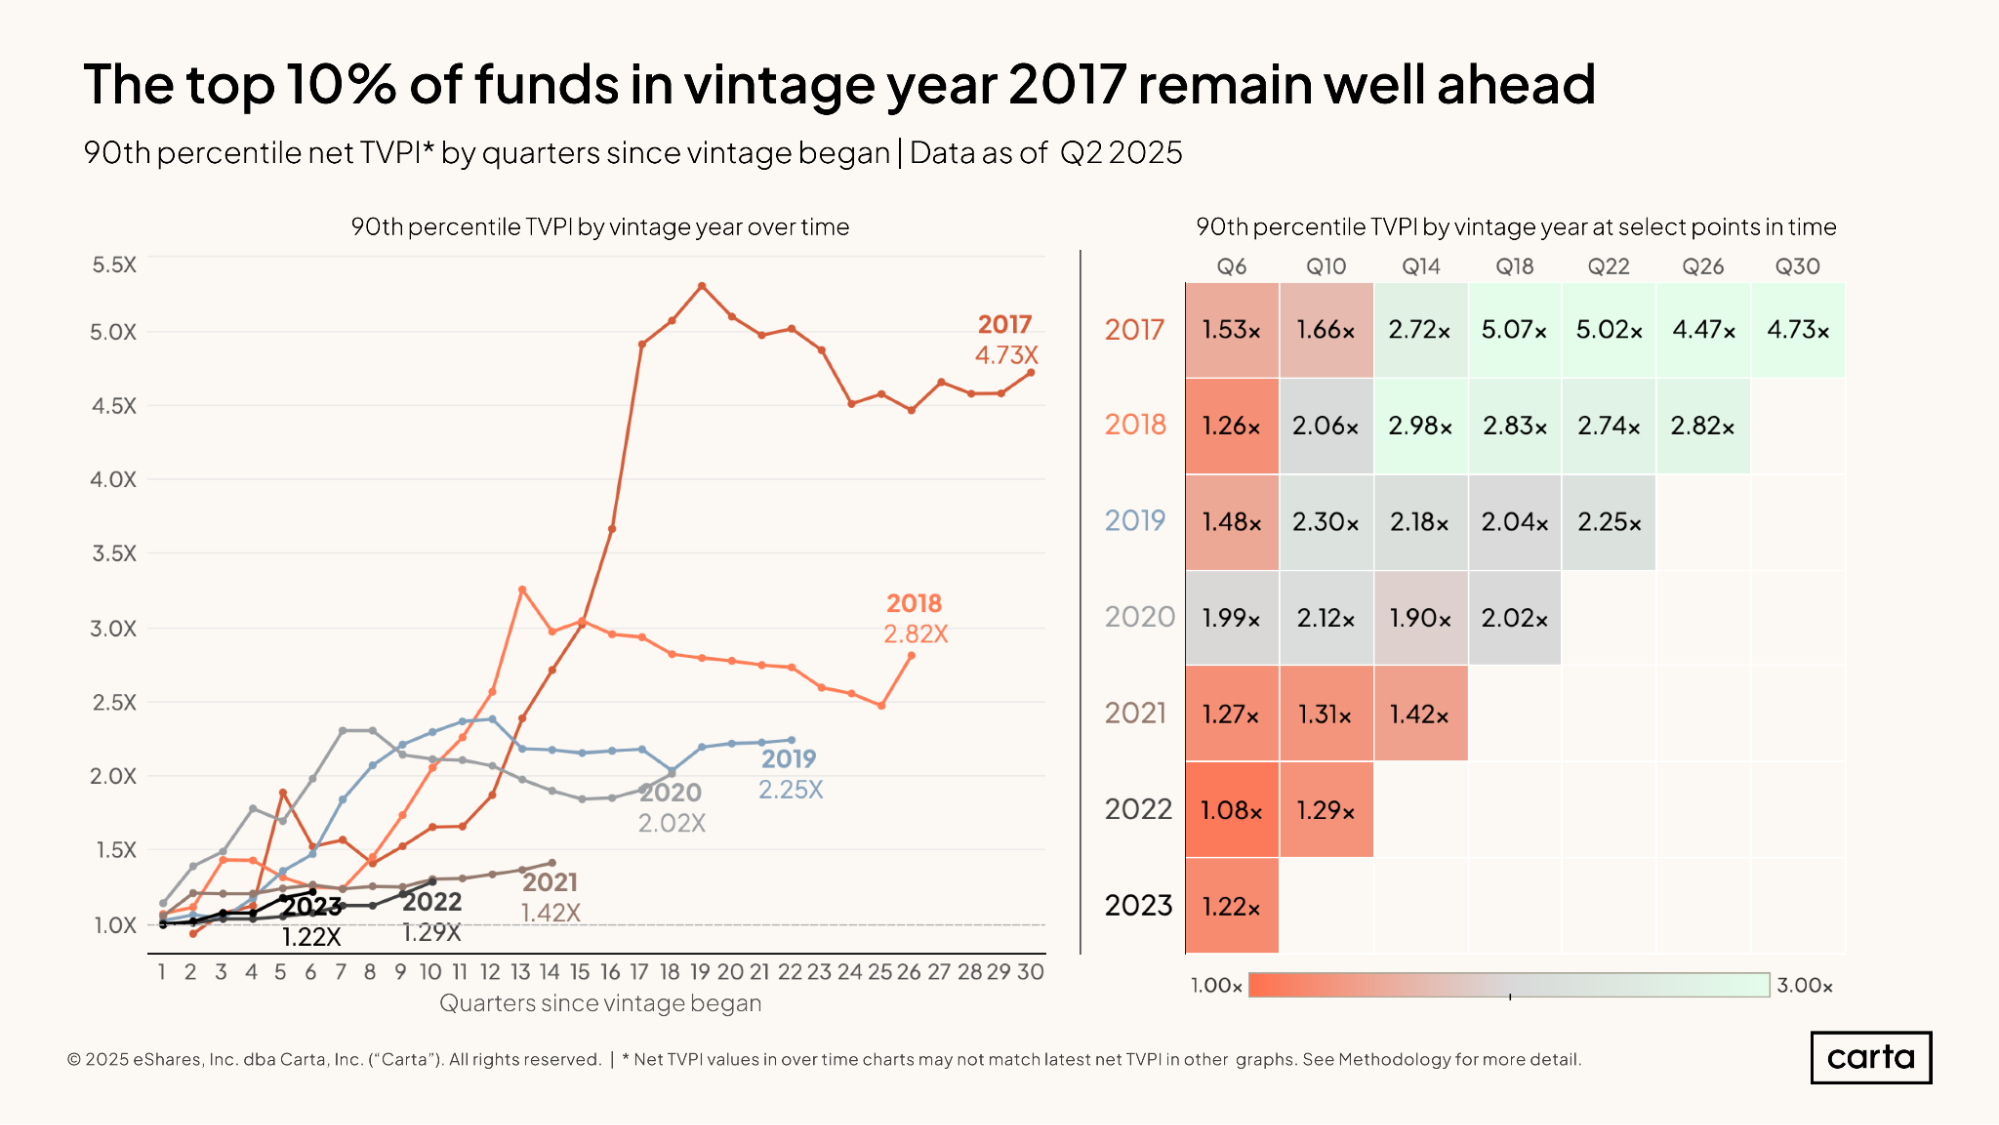
The top 10% of funds from the 2017 vintage all have TVPIs of 4.73x or higher. This upper decile of performance easily outstrips any other recent vintage; the 2018 cohort of funds is closest, with a 90th percentile TVPI of 2.82x.
This 90th percentile figure among the 2017 vintage has now been trending up for several quarters, reversing a decline that began a little less than three years ago. Even amid a market environment marked by tight valuations and limited exit opportunities, the best-performing VC funds and their portfolio companies have been finding ways to generate value.
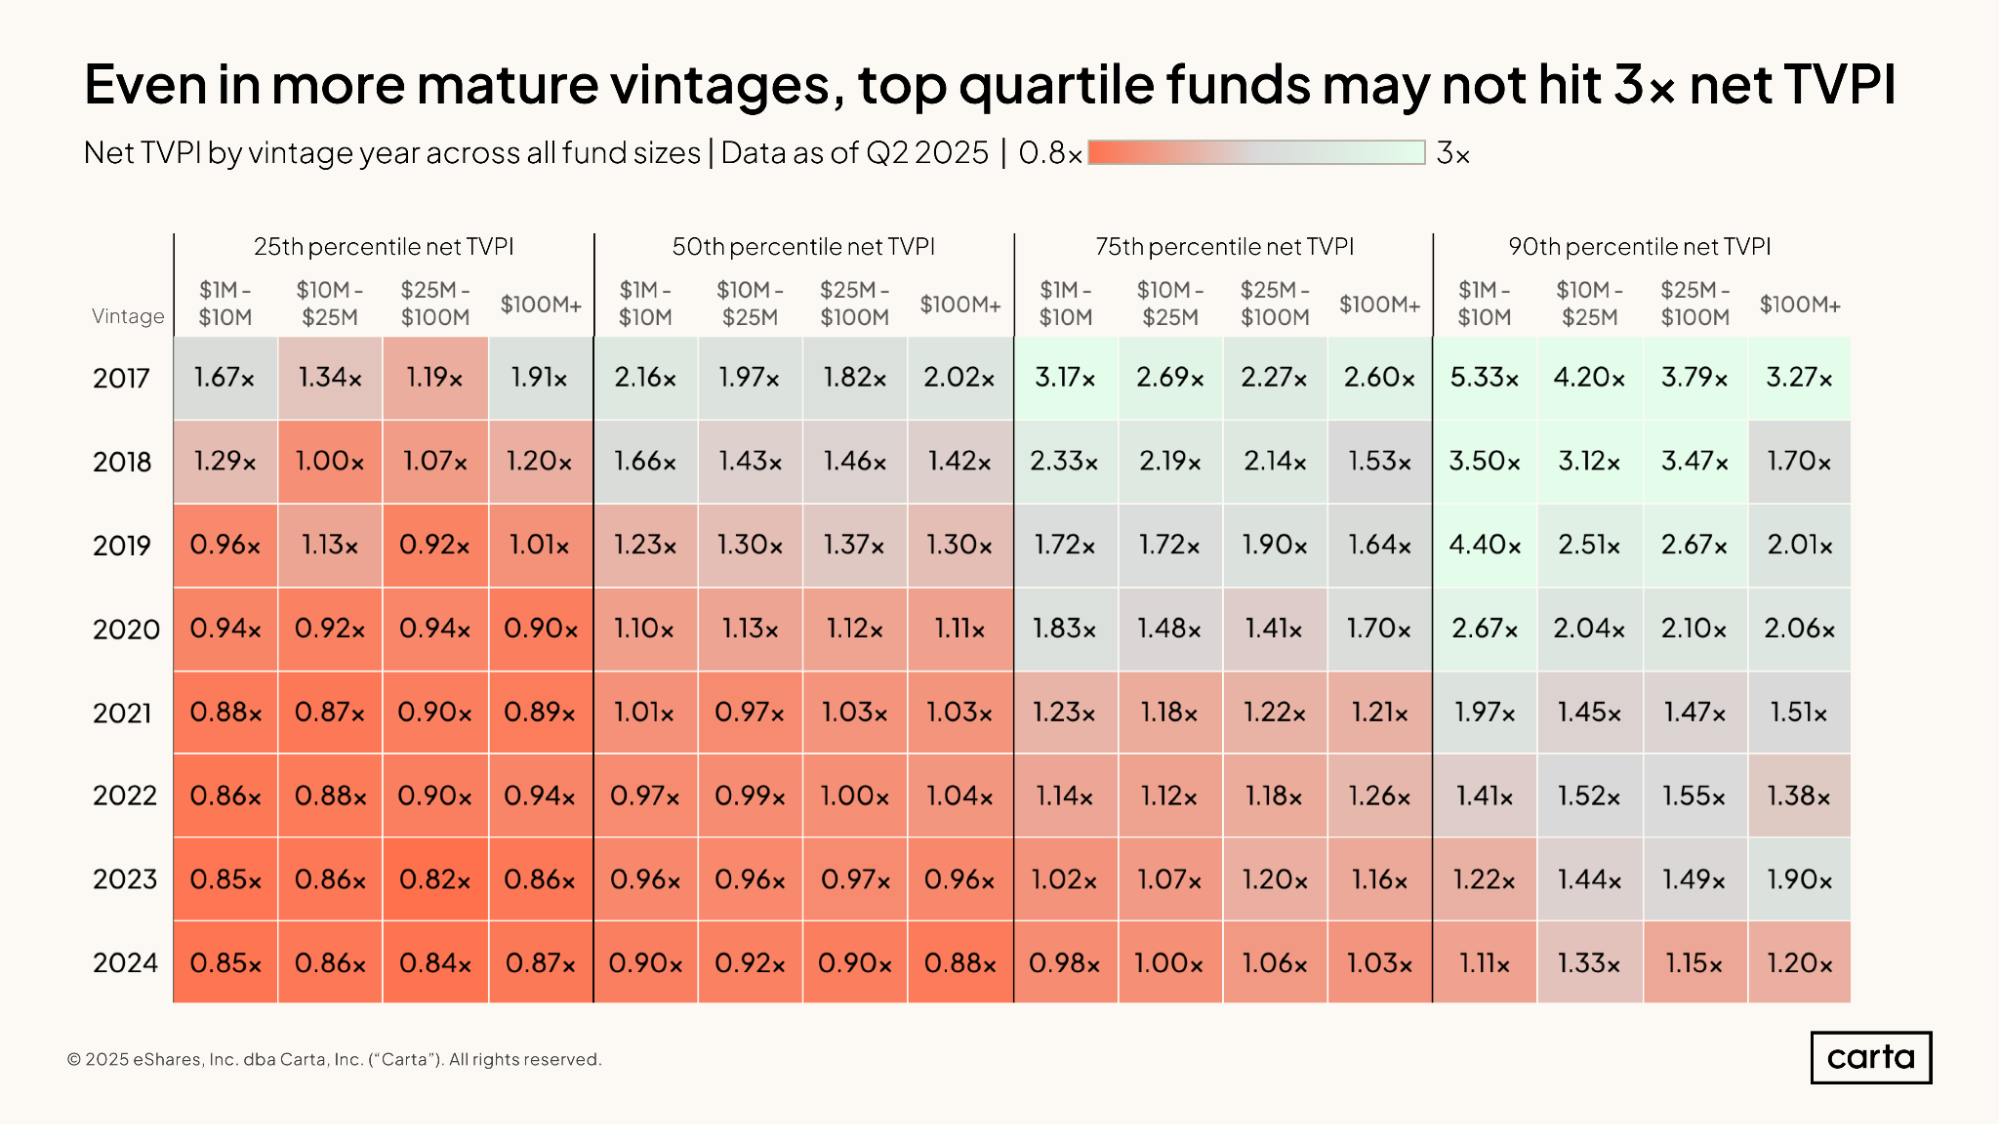
As of the end of Q2, most VC funds across all recent vintages had a TVPI somewhere between 0.8x and 2x. But there are some areas where standout TVPIs are surfacing.
In the 2017 vintage, the 90th percentile TVPI for small funds (those between $1 million and $10 million) is 5.33x. In the 2019 vintage, the 90th percentile TVPI for funds of that same size is 4.4x. Among the largest funds—those with more than $100 million in capital—the 90th percentile for TVPI is above 2x in each of the 2017, 2019, and 2020 vintages.
DPI
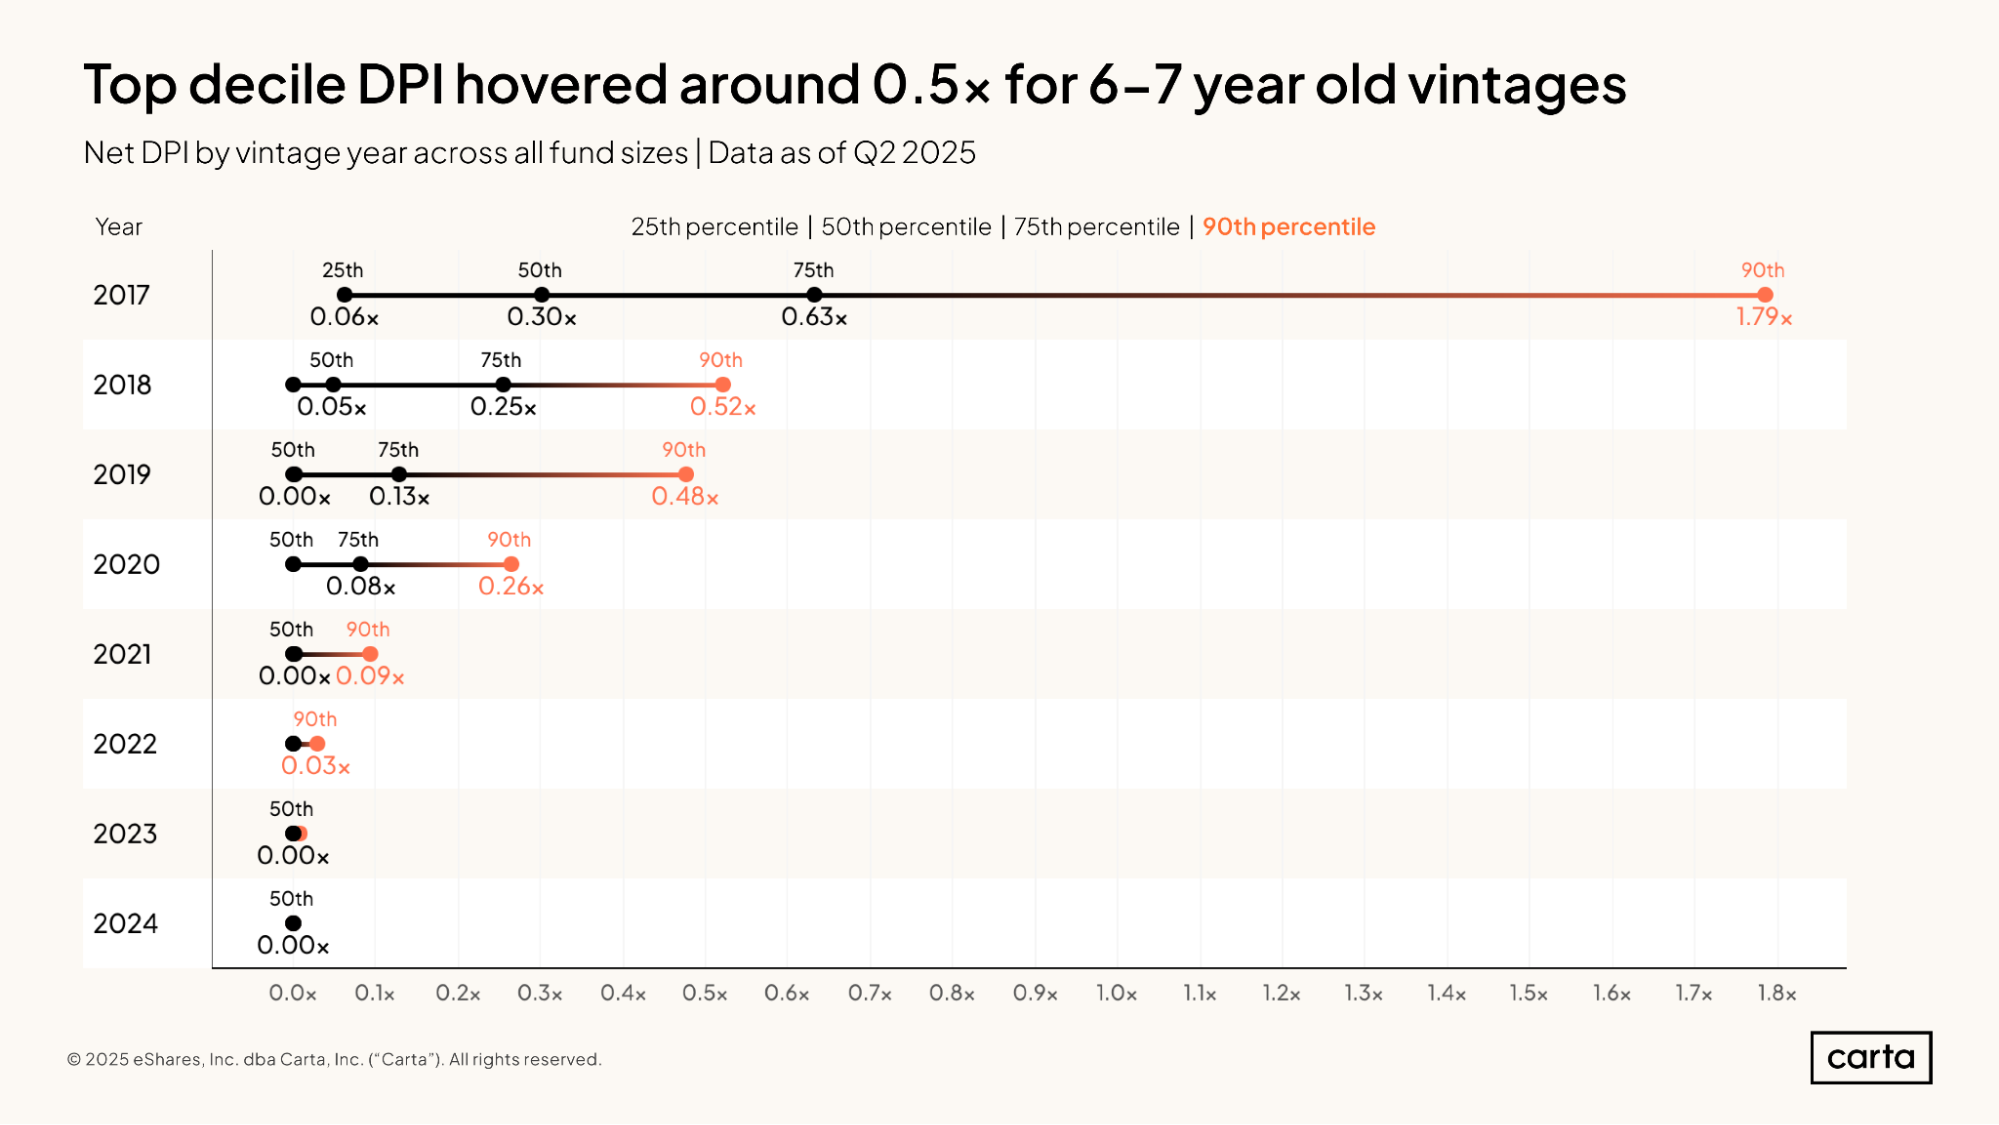
While TVPI tracks both realized and unrealized gains, DPI (distributions to paid-in capital) measures only the realized capital that a fund has distributed back to investors. For LPs, a positive DPI typically means a positive financial return.
Since many VC funds from 2017 and on are still managing large portions of their portfolios, the DPIs for these vintages tend to be below 1x. In the 2017 vintage, though, the top-performing funds are well above that key threshold: The 90th percentile of DPI for 2017 funds is 1.79x, more than three times higher than the 90th percentile of DPI for either 2018 (0.52x) or 2019 (0.48x).
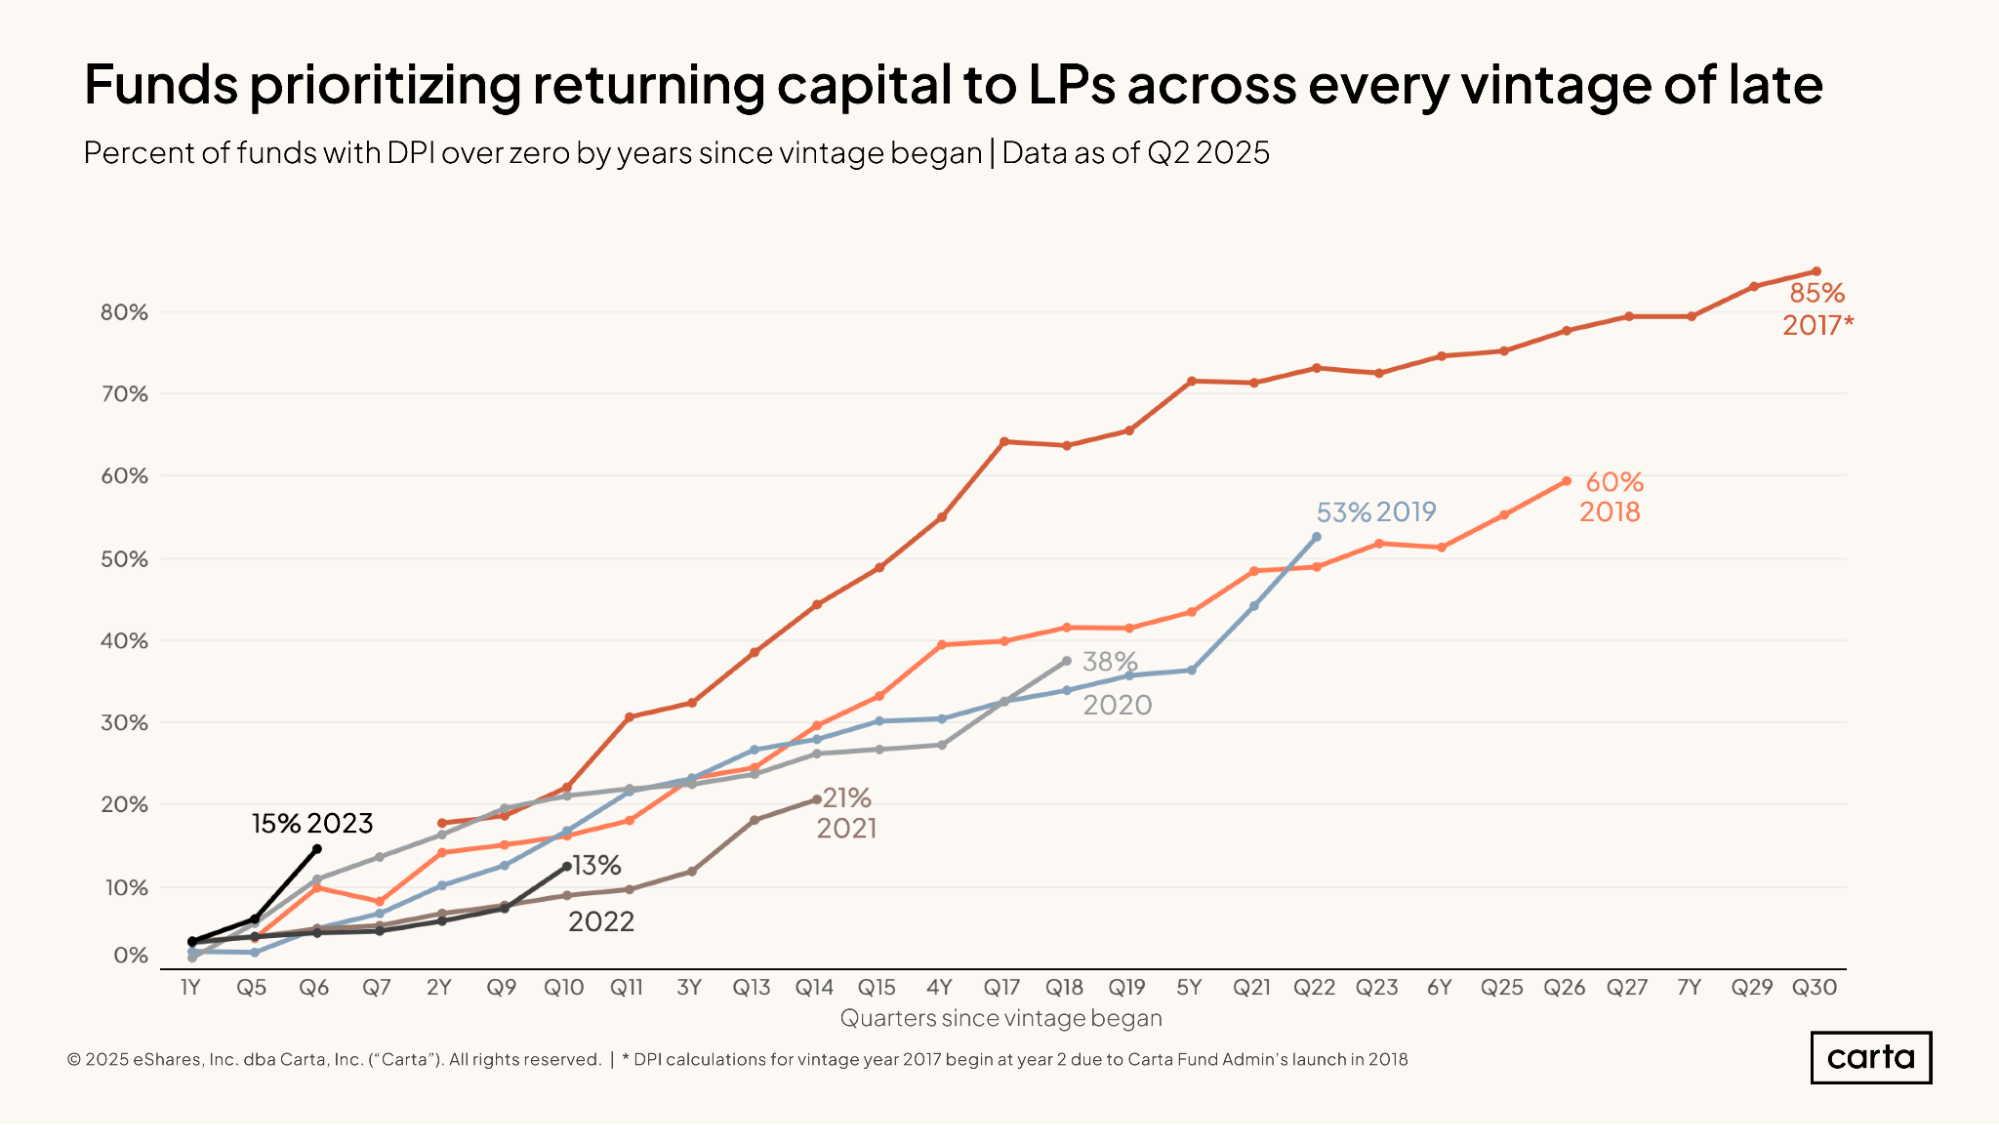
The percentage of funds that have begun to generate DPI climbed significantly at every vintage last quarter, a clear sign that funds are prioritizing the need to return capital to their LPs. This increase in liquidity is a welcome sign for LPs, who have felt the squeeze in recent years from a tight market for traditional exits.
The newest crop of VC funds seems especially focused on early returns. In the 2023 vintage, about 15% of funds had already begun to produce DPI at just six quarters since the fund’s inception. That’s a higher rate at the same stage than any other vintage from 2018 through 2022. For funds that were raised after the mood of the VC market had already begun to move away from the ebullience of the early 2020s, generating early liquidity may be a particular priority.
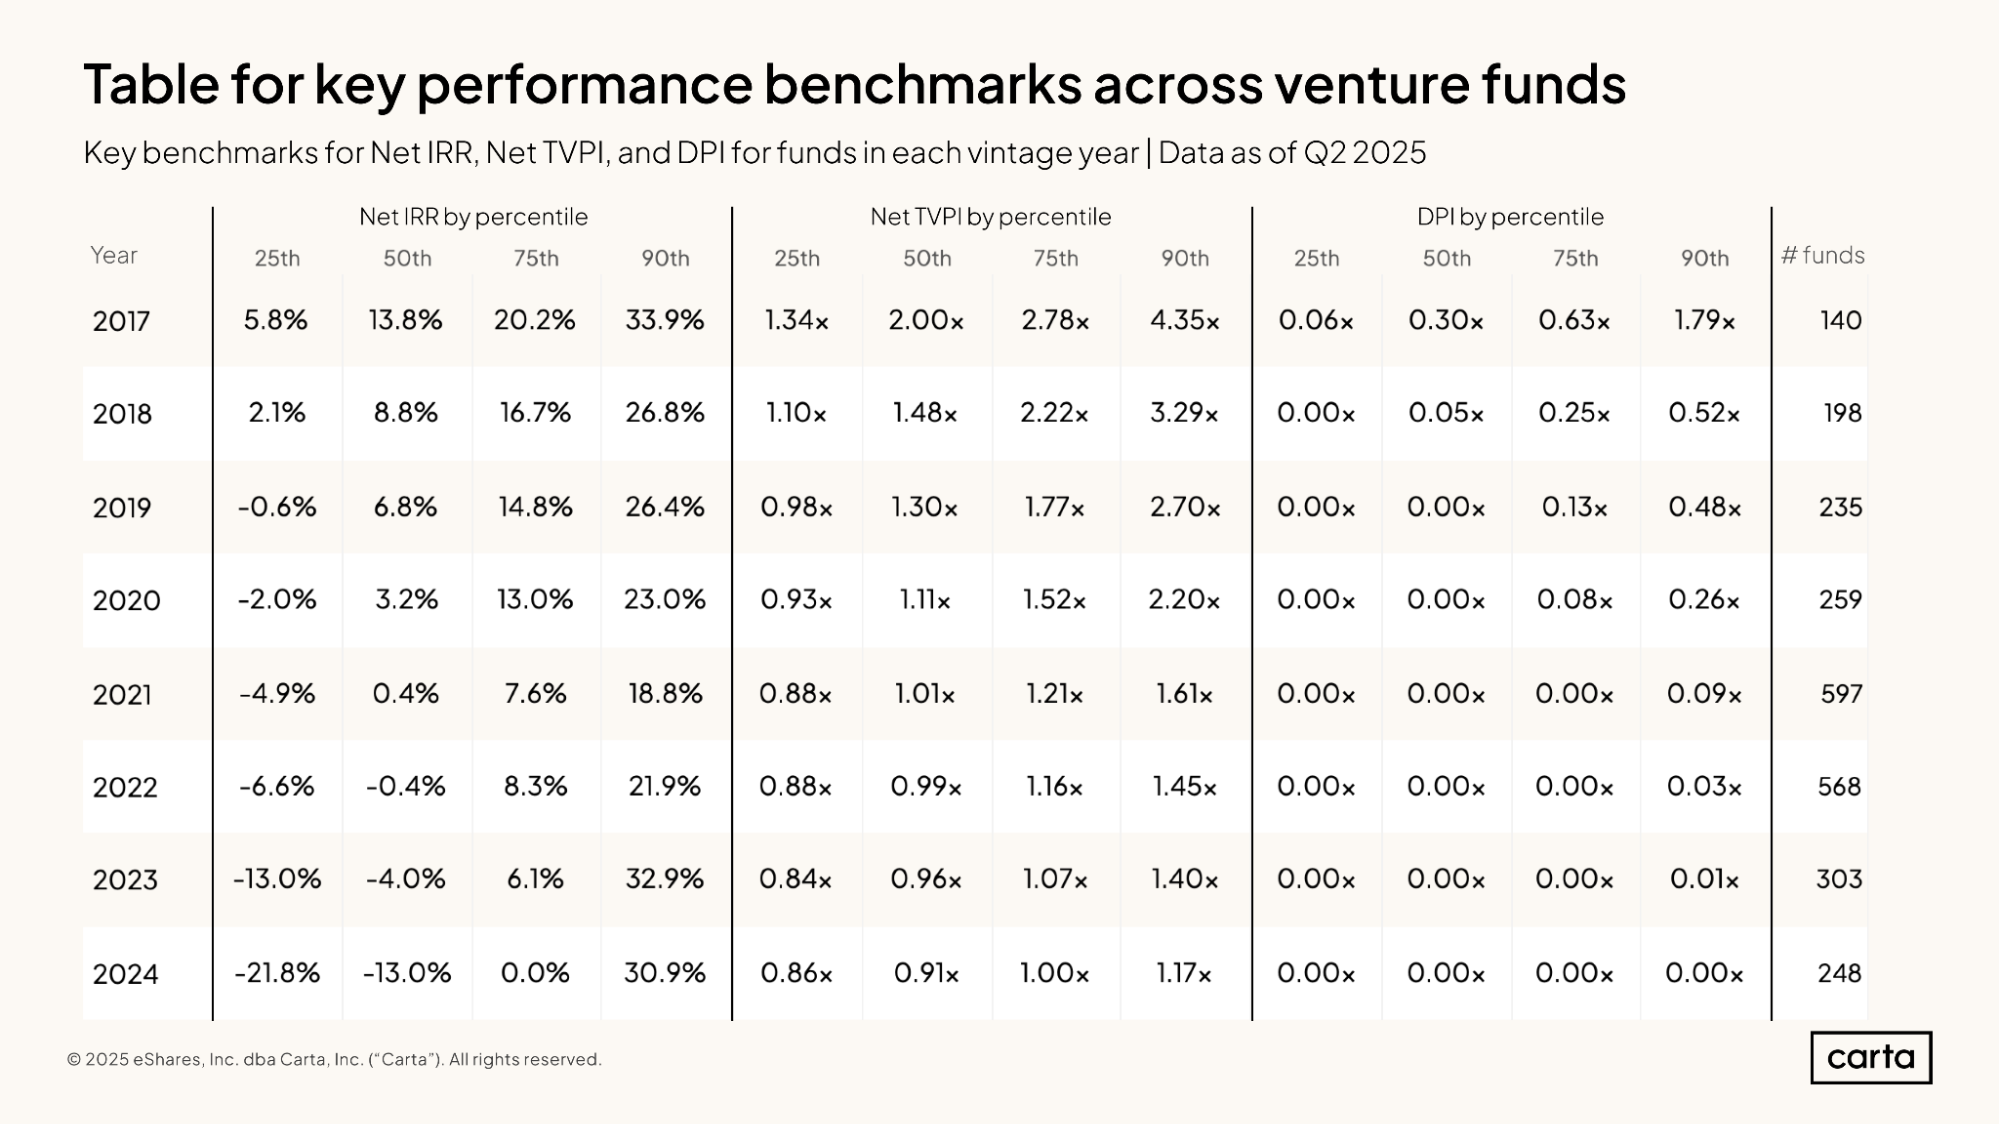
The above table combines many of the previously discussed statistics related to IRR, TVPI, and DPI in one place, including a count of the total number of funds included in each vintage.
In addition to providing a useful way to compare performance across different metrics and vintages, this view clearly demonstrates how active fund vintages tend to improve their performance over time.
Market context
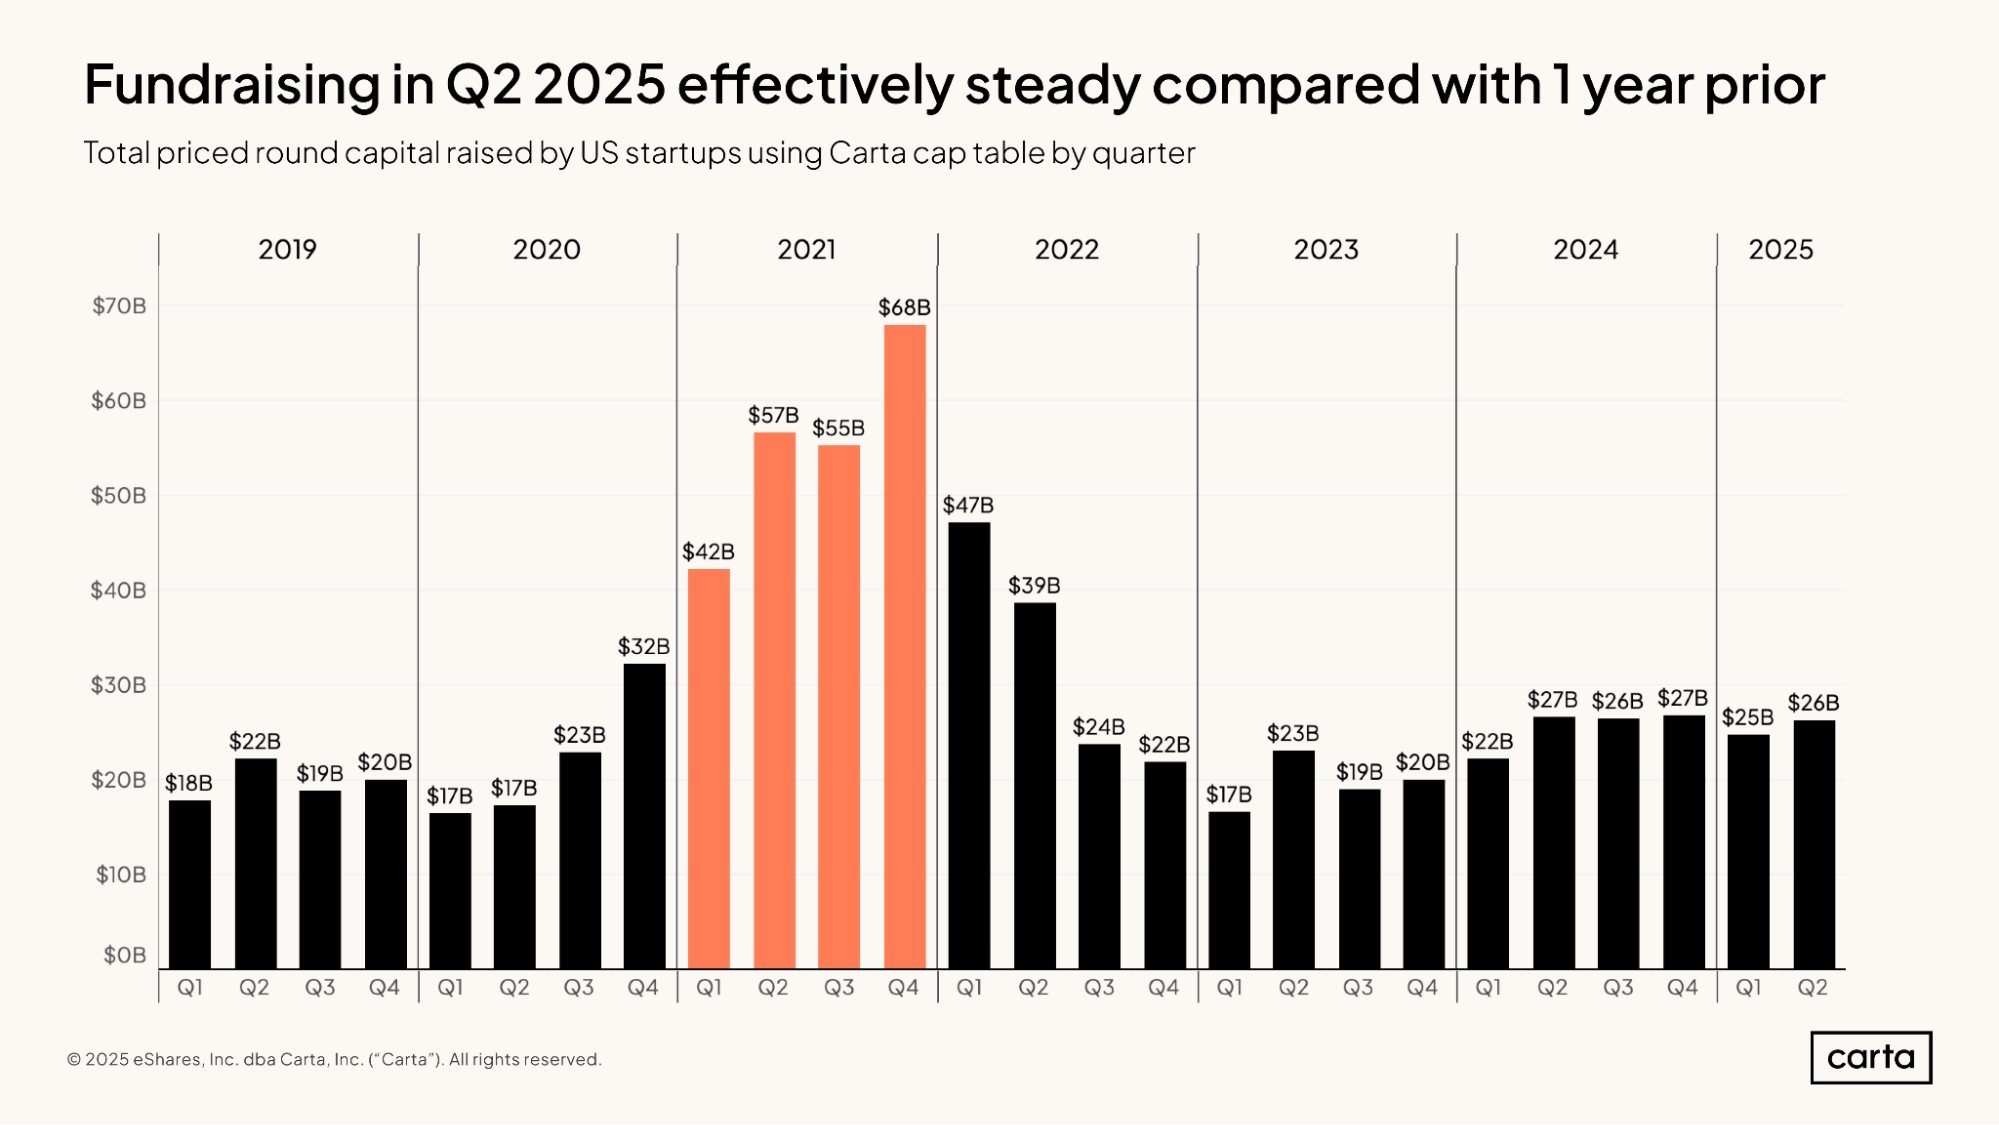
Startups on Carta combined to raise $26 billion in new funding in Q2, falling closely in line with the preceding four quarters. On a year-over-year basis, total funding in Q2 was down just 4%. Compared to four years ago, when the venture fundraising market was in the midst of its busiest year, Q2 investment was down 54%.
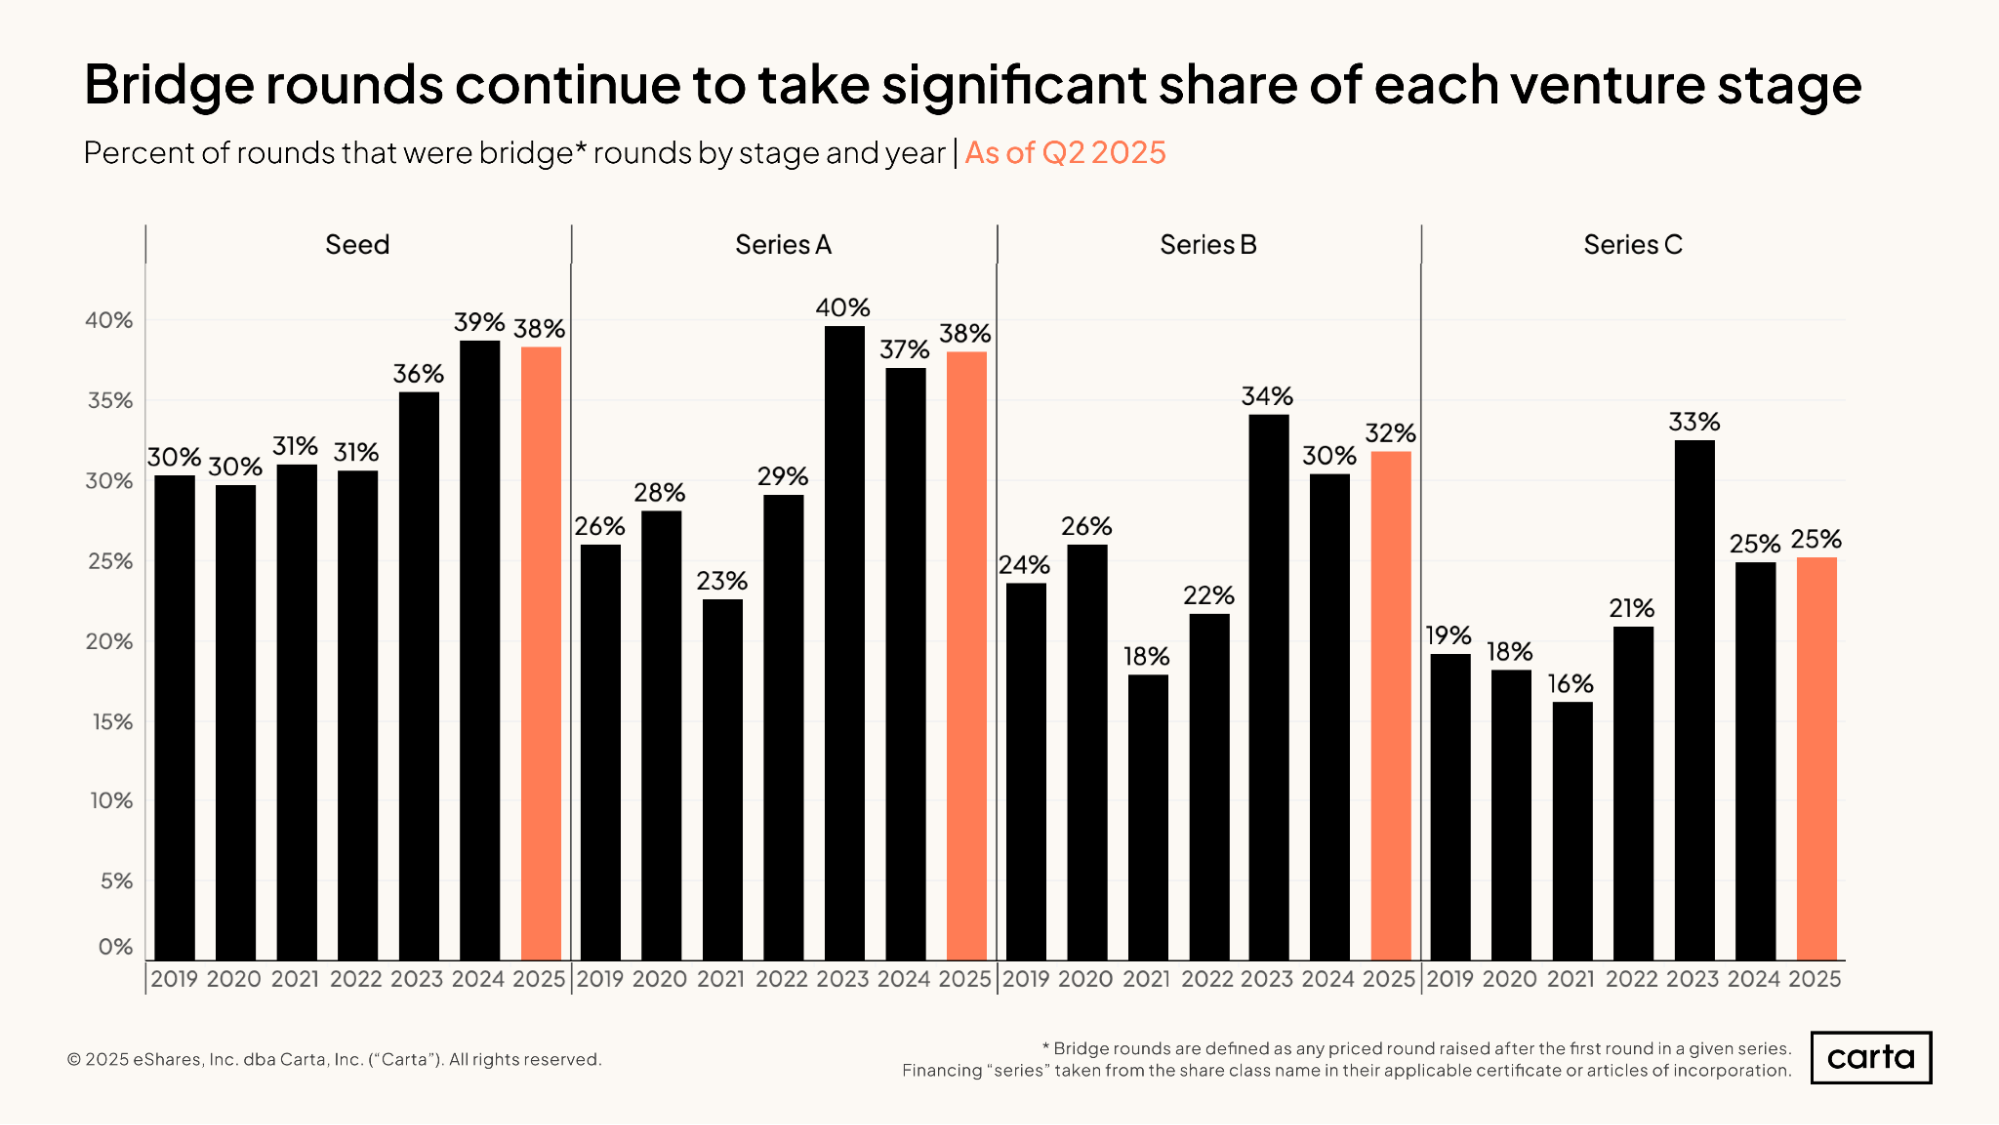
A recent boom in bridge rounds continued during the first half of 2025. At both Series A and Series B, the percentage of all funding events that are bridge rounds has ticked up slightly so far this year compared to the already-elevated rates of 2024. At Series C, the proportion of bridge rounds is holding steady, and at seed, it’s down by a single percentage point.
Compared to new primary rounds, bridge rounds are much more likely to come at a flat or reduced valuation. For some fund managers, this increase in bridge rounds over the past three years has likely contributed to slower fund performance.
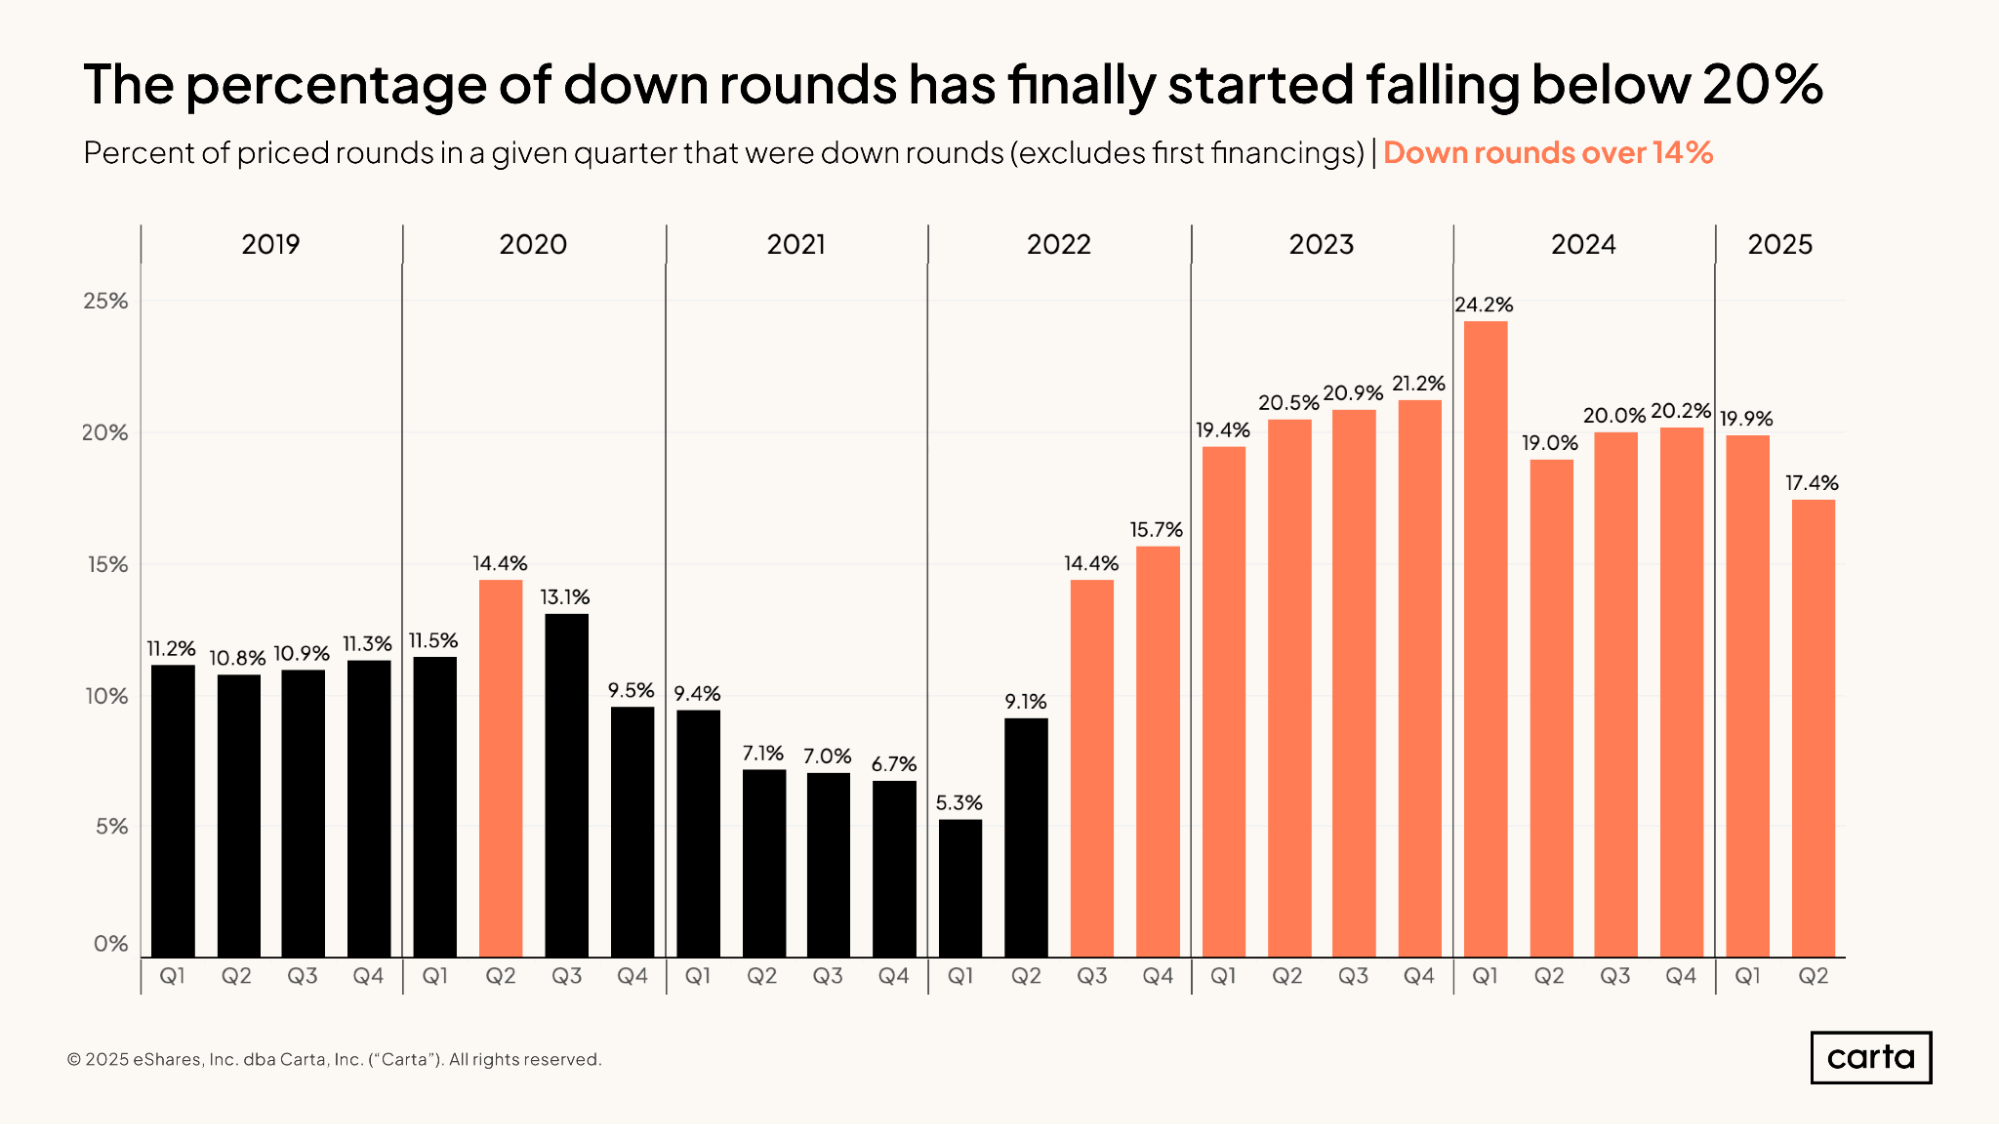
Like the rate of bridge rounds, the percentage of all rounds that are down rounds has also increased over the past three years. This proportion has remained relatively high in 2025, but it dropped by 2.5 percentage points in Q2—an encouraging sign for founders in the fundraising market.
Historically, the venture capital model relies on startups attaining higher valuations with each new round of funding they raise. The percentage of down rounds is typically low, around 10%. When there’s an abrupt shift in the valuation landscape, such as the one that occurred in 2022, more companies are forced to accept reduced valuations in exchange for raising new capital, and the rate of down rounds increases.
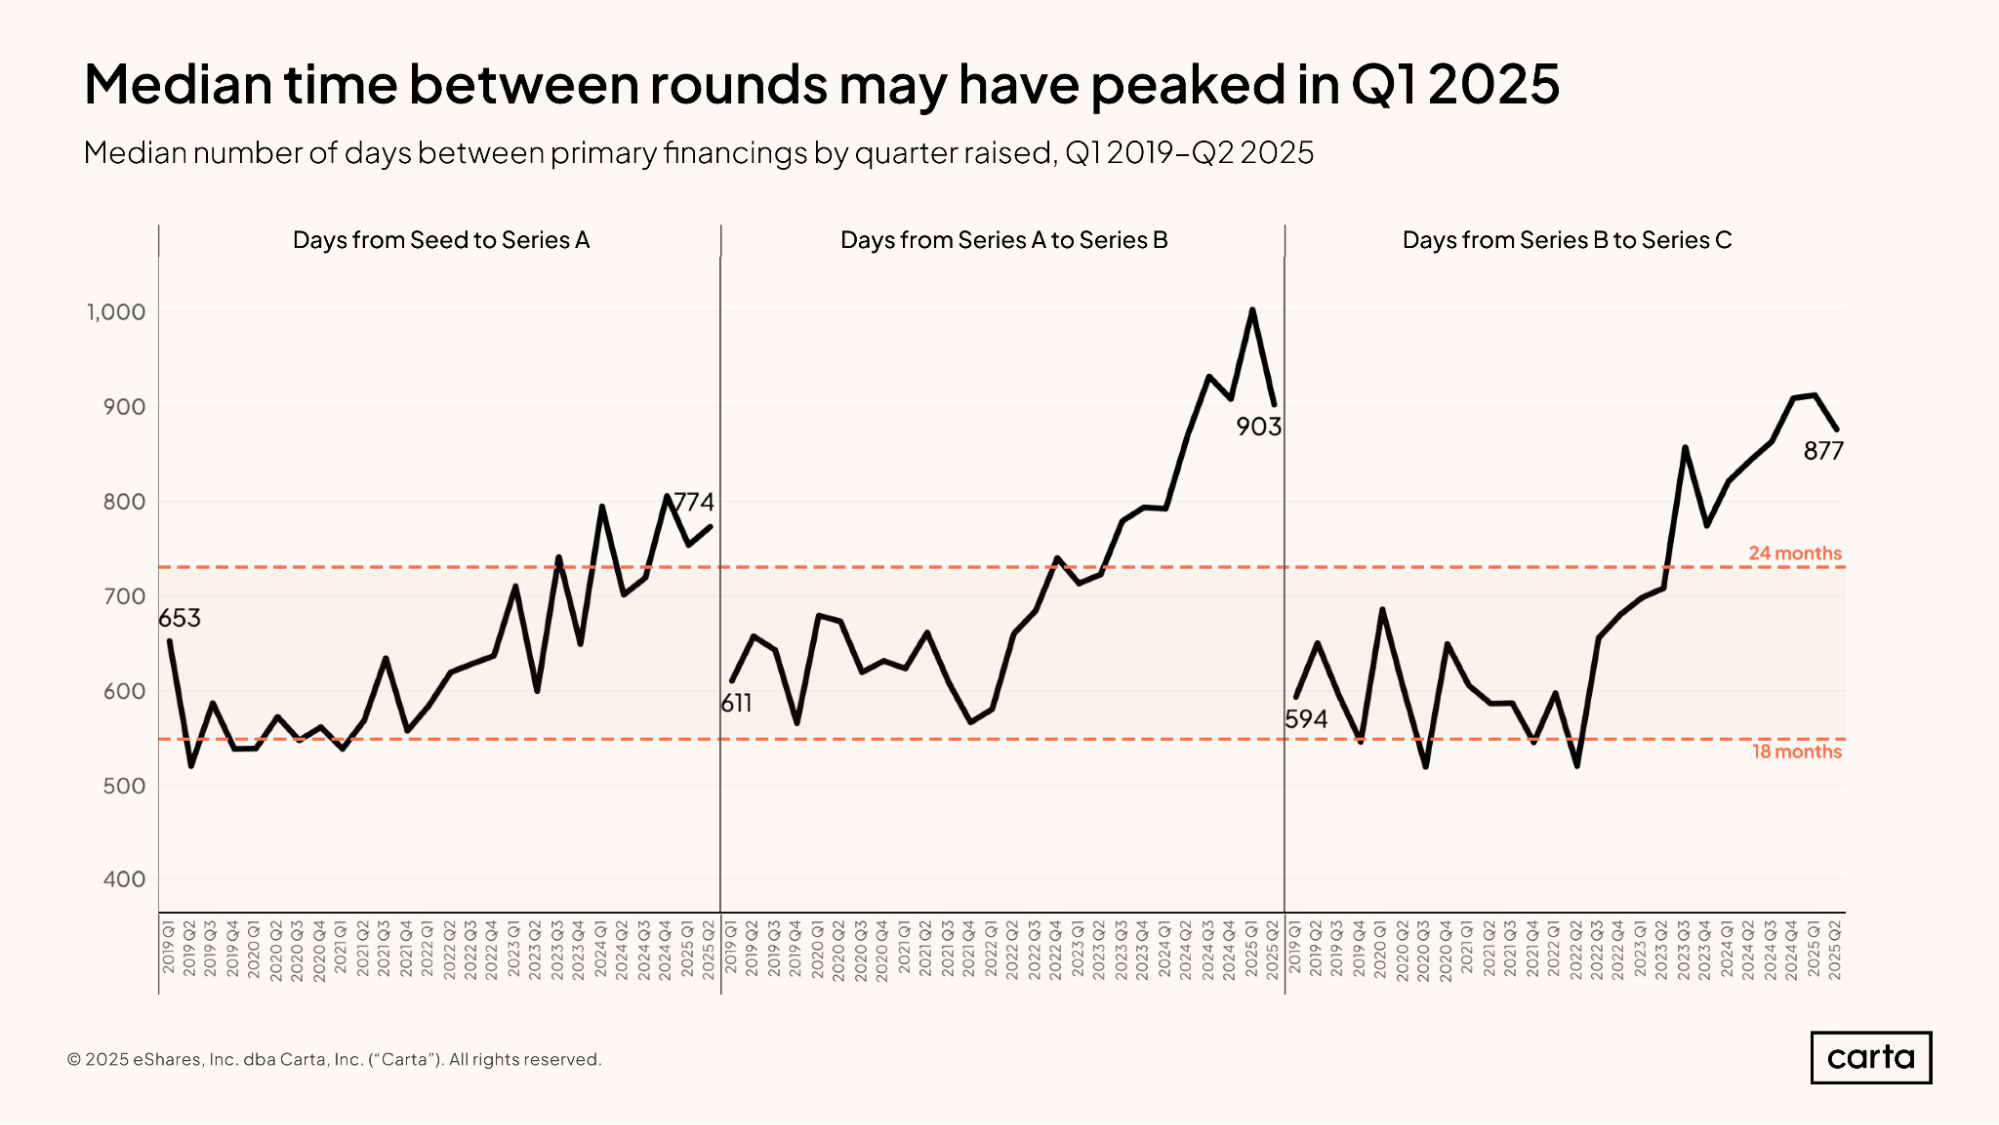
Among companies raising both Series B and Series C rounds, the median wait time since their previous primary funding round declined noticeably in Q2. If this proves the beginning of the trend, it would be a significant shift in the market. Previously, the typical time between rounds at both these stages has been steadily trending up for several years, redefining the way that early- and mid-stage startups think about cash burn and runway.
This extension of the time between primary funding rounds is linked to the increase in bridge rounds. As more companies opt for bridge rounds as a stopgap between new primary rounds, the length of time between those new primary rounds tends to rise.
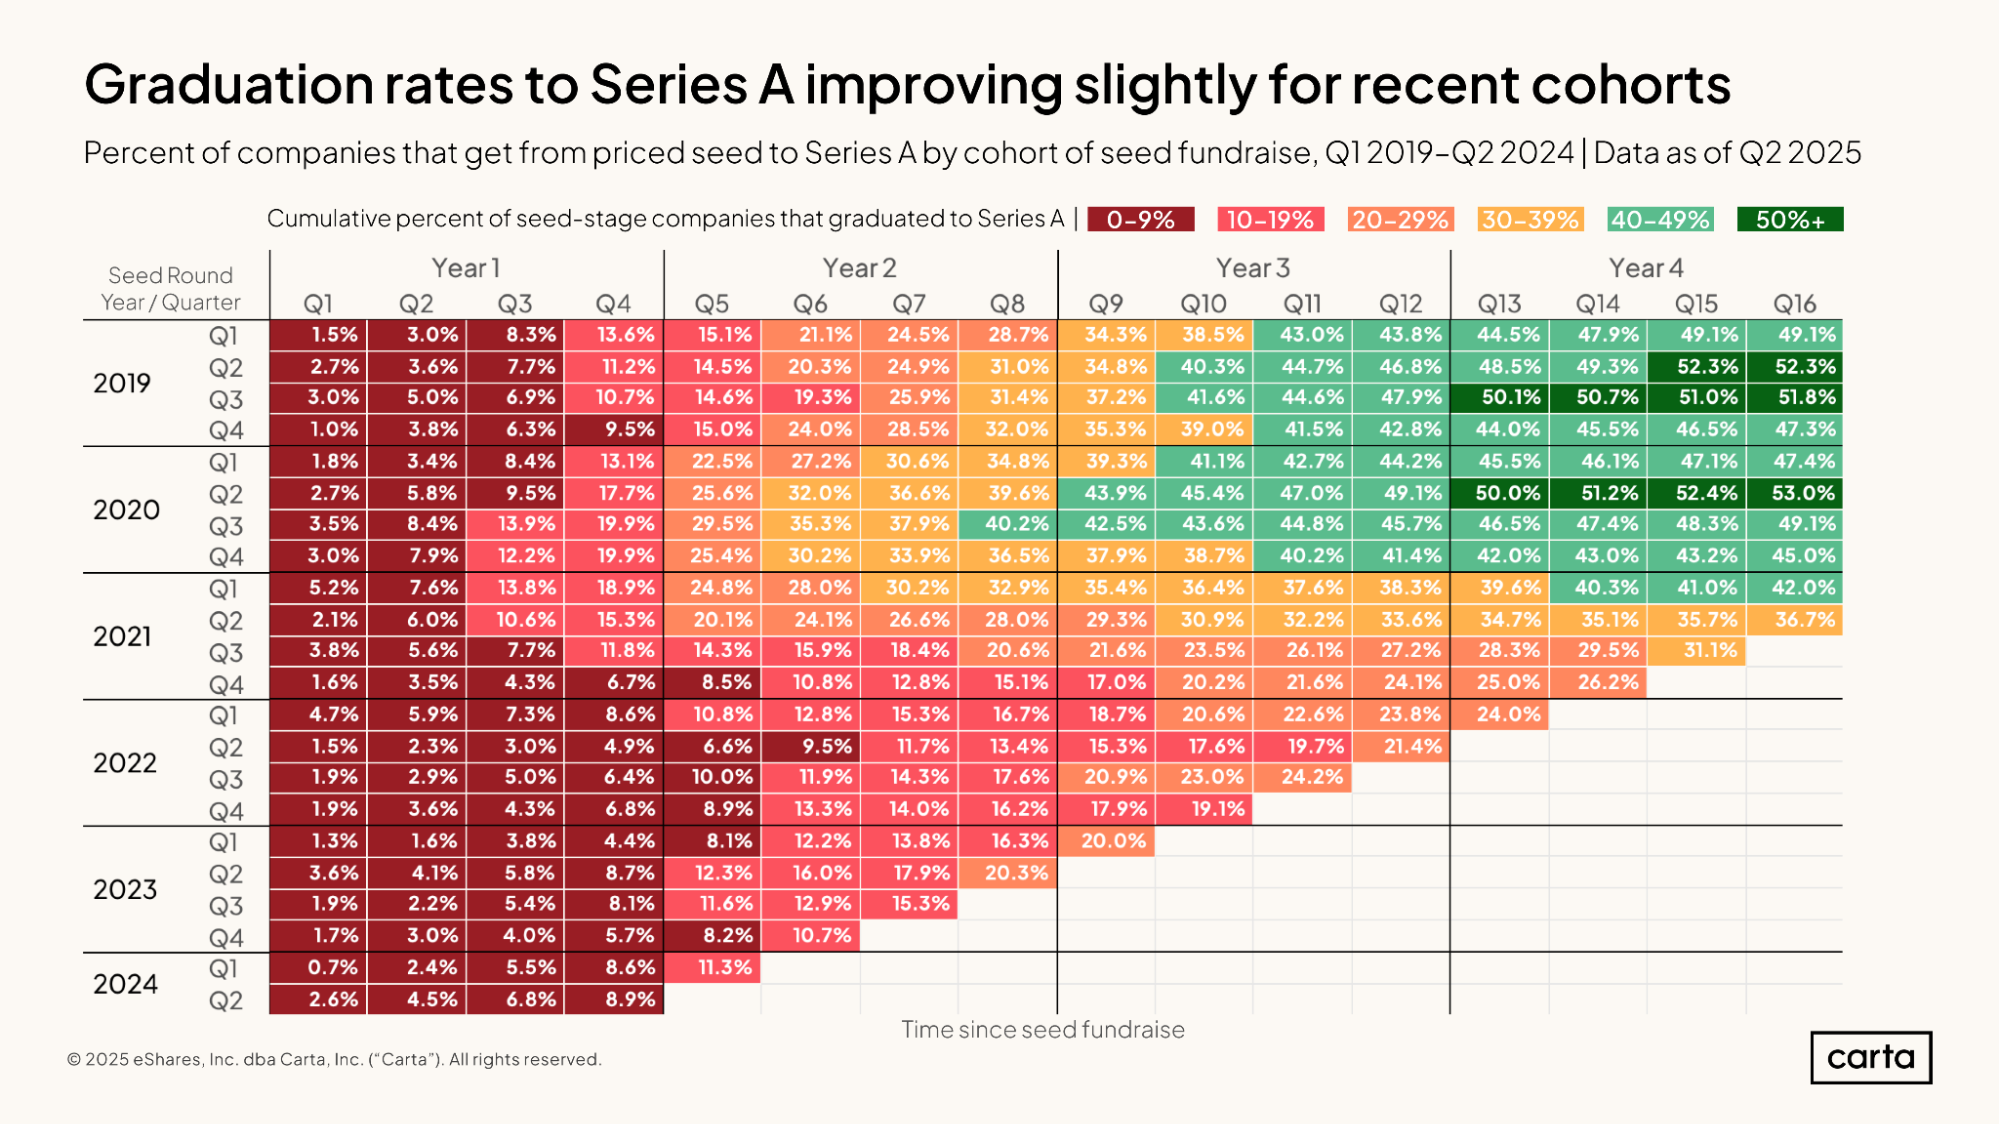
The above chart shows the percentage of seed-stage startups that have successfully moved on to a Series A round, broken down by both the date when the seed round was raised and the length of time between the seed and Series A.
For example, the top row tells us that 15.1% of all startups that raised a seed round in Q1 2019 went on to raise a Series A round within the next five quarters. Move from left to right, and we can also see that 28.7% of seed-stage startups had raised a Series A at the end of two years, and 49.1% had done so at the end of four years.
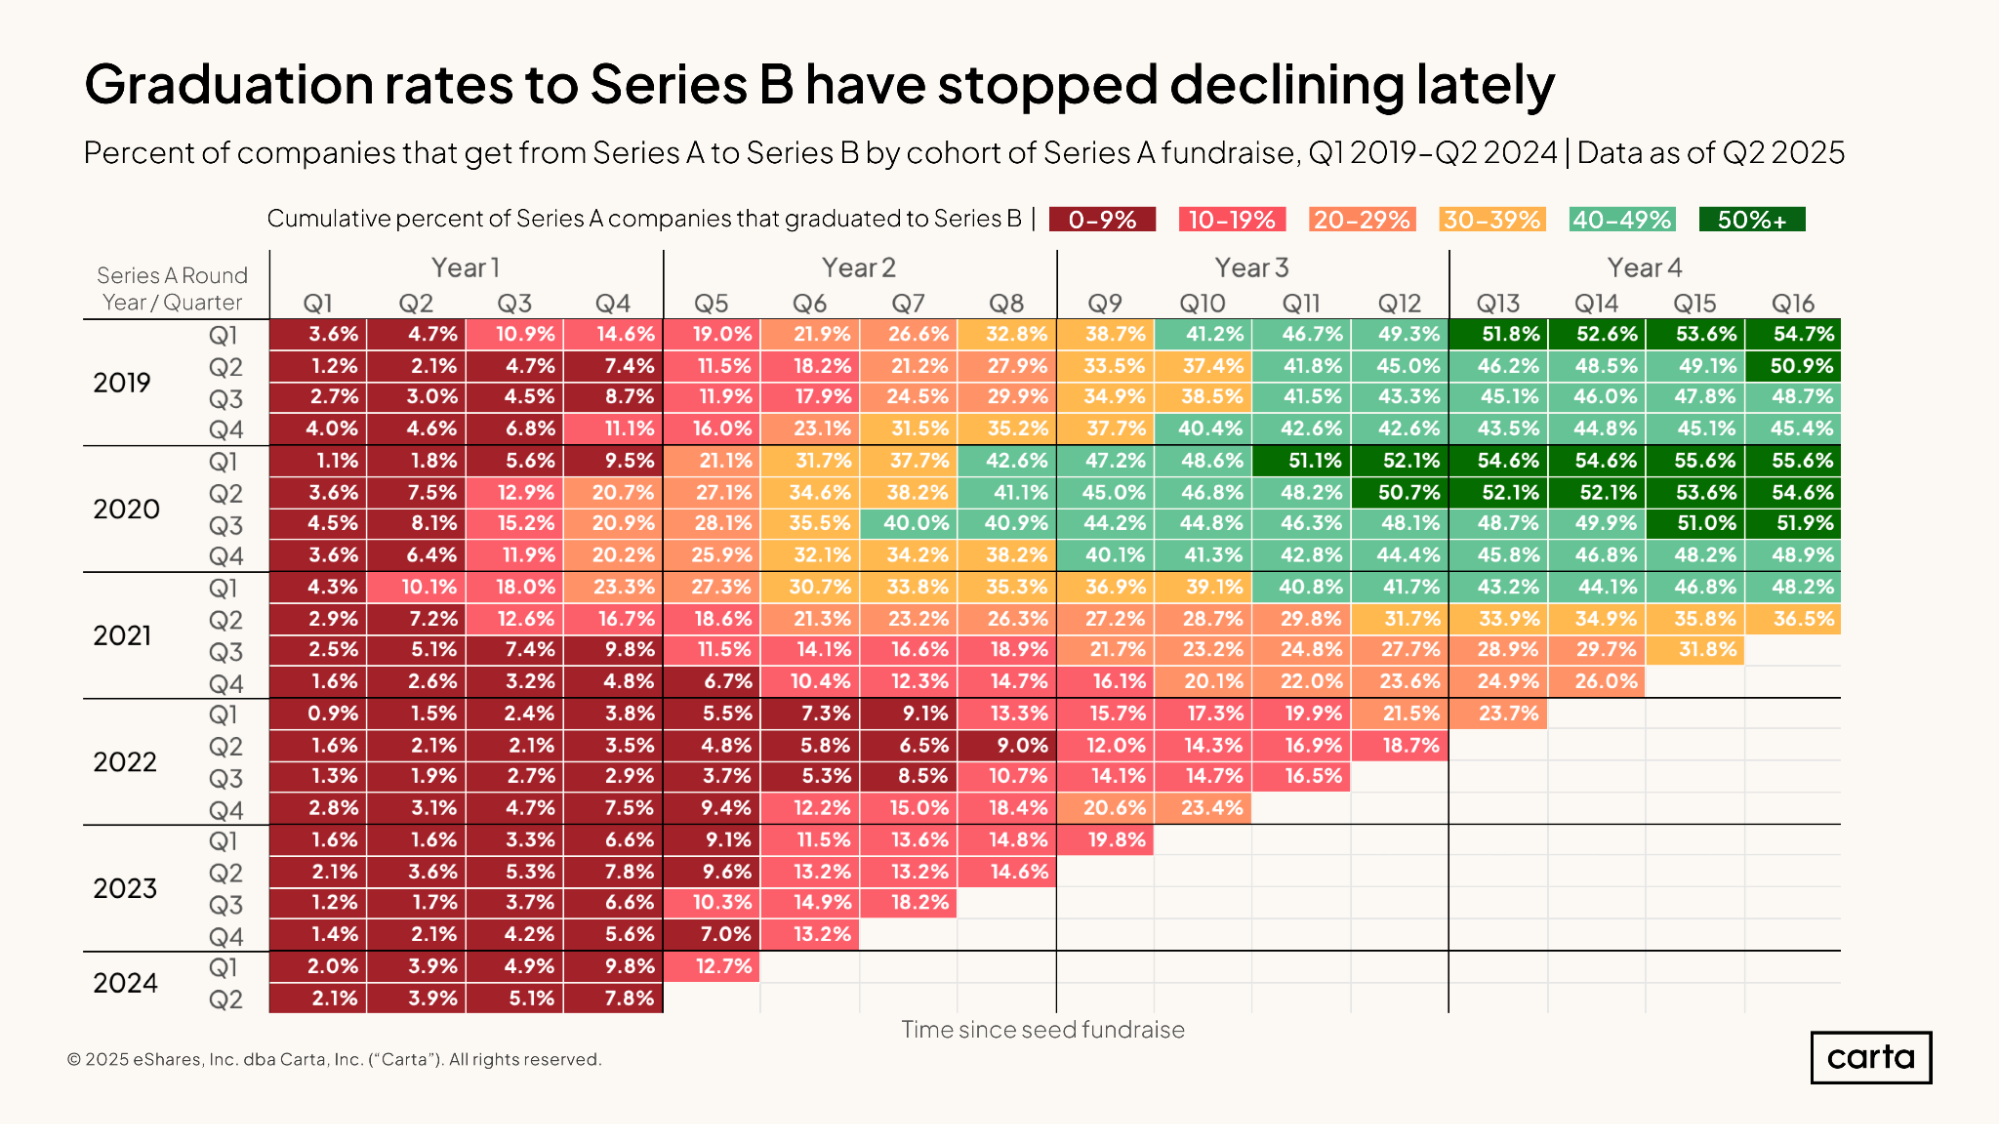
Over the past six years, graduation rates moving from Series A to Series B (shown above) and from seed to Series A (shown previously) have been roughly similar. In both cases, graduation rates have tended to decline over time, with more recent cohorts of startups having a more difficult time finding the next step on the fundraising ladder .
For instance, 21.5% of startups that raised a Series A in Q1 2022 had gone on to raise a Series B three years later. For startups that raised a Series A in Q1 2020, the graduation rate to a Series B after three years was more than two times higher, at 52.1%.
Methodology
Carta helps over 2,500 venture firms administer more than $150 billion in capital. We're setting a new standard in fund administration by sharing insights from our unmatched dataset about the private markets and venture ecosystem to help investors and limited partners make informed decisions and understand market conditions.
Overview
This study uses an aggregated and anonymized sample of Carta fund customer data. Funds that have contractually requested that we not use their data in anonymized and aggregated studies are not included in this analysis.
We use data through the end of Q2 2025. Historical data may change in future studies because there is typically an administrative lag between the time an event took place and when it is recorded in Carta. In addition, new funds signing up for Carta’s services will increase historical data available for the report.
Fund details
This report only includes funds domiciled in the United States. All funds must have reliable performance data dating back to fund inception and/or when they joined the Carta platform. Included funds are direct investors into startups and do not pursue fund of funds or other strategies. Only funds in vintage years between 2017 and 2025 were included. Funds must have at least $1M in AUM to be included.
We define vintage year as the year in which the first cost basis (either conversion or new investment) for a fund occurred.
Performance over time
In charts that use the quarters since vintage began framing, we limited the analysis to the most recent quarter in which all funds in a given vintage year had valid performance data. As such, these figures may not match exactly to the performance data displayed in charts without a similar time series framing.
Financings
Financings include equity deals raised in USD by U.S.-based corporations. The financing “series” (e.g. Series A) is taken from the share class name in their applicable certificate or articles of incorporation. Financing rounds that don’t follow this standard are not included in any data shown by series but are included in data not shown by series. Primary rounds are defined as the first equity round within a series. Bridge rounds are defined as any round raised after the first round in a given series.


DISCLOSURE: This communication is on behalf of eShares, Inc. dba Carta, Inc. ("Carta"). This communication is for informational purposes only, and contains general information only. Carta is not, by means of this communication, rendering accounting, business, financial, investment, legal, tax, or other professional advice or services. This publication is not a substitute for such professional advice or services nor should it be used as a basis for any decision or action that may affect your business or interests. Before making any decision or taking any action that may affect your business or interests, you should consult a qualified professional advisor. This communication is not intended as a recommendation, offer or solicitation for the purchase or sale of any security. Carta does not assume any liability for reliance on the information provided herein. ©2026 Carta. All rights reserved. Reproduction prohibited.