- Distributions to paid-in capital (DPI) in private equity and venture capital
- What is DPI?
- Why DPI matters to investors
- How to calculate DPI
- Distributions
- Paid-in capital
- Net vs. gross: the role of fees and carry
- A worked DPI example
- How to interpret DPI
- What is a good DPI?
- How DPI compares to other fund metrics
- DPI vs. IRR
- DPI vs. TVPI
- DPI vs. RVPI
- DPI vs. MOIC
- Advantages and disadvantages of DPI
- Strengths
- Limitations
- Reporting DPI
- Track DPI with real-time fund data
What is DPI?
Distributions to paid-in capital (DPI) is the ratio of cumulative distributions paid to investors in a fund relative to the total capital invested. Also called the realization multiple, DPI is one of the core financial metrics that fund managers in private equity, venture capital, and hedge funds use to evaluate performance.
DPI is expressed as a multiple. By the end of their lifespan, successful funds distribute more capital back to investors than investors paid in, meaning the multiple will be something above 1.0, such as 2.3x. Earlier in the fund's lifecycle, before investments have had sufficient time to yield returns, the multiple is typically below 1.0.
DPI counts only the cash a fund has actually returned, net of fees, not paper gains on holdings it still owns. That makes it a cash-on-cash measure of what investors have received, which is why it carries more weight late in a fund's lifecycle.
Carta's Q1 2026 VC Fund Performance report notes that unrealized valuations may be trending up, but realized gains remain few and far between. In a slow exit environment, DPI is the metric limited partners (LPs) watch most closely.
Why DPI matters to investors
DPI is a measure of a fund's liquidity and a manager's ability to convert portfolio gains into cash for investors.
LPs increasingly focus on realized cash over unrealized value. In a McKinsey survey of 333 LPs, 21% rated DPI as their most critical fund performance metric, tied with multiple on invested capital (MOIC) and behind only internal rate of return (IRR). Unrealized gains, sometimes called paper gains, can change with market conditions. DPI counts only the money that has already landed in an investor's account.

How to calculate DPI
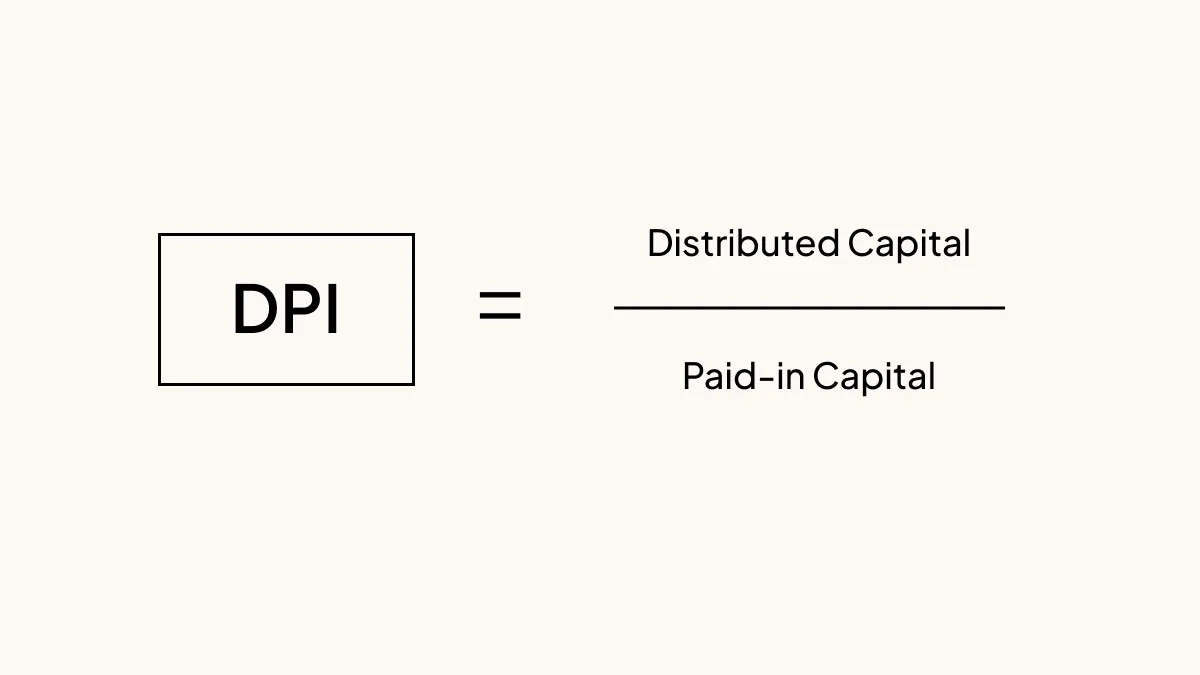
The formula to calculate DPI is:
DPI = Distributed capital / Paid-in Capital
Distributions
Distributions are any capital gains a fund realizes and returns to investors. Gains can come from interest and dividends on invested capital, or from selling fund assets through an M&A transaction or an initial public offering (IPO) for one of the fund's portfolio companies.
Distributions typically build as a fund matures and its holdings reach liquidity. U.S. private equity managers distributed more capital than they called in the first half of 2025. As Lu Zhang, founder and managing partner of Fusion Fund, describes: "Carta's automation capabilities fit where we are in year ten, because we've always managed a high volume of capital calls, but now we have more distributions following more liquidity events.
Paid-in capital
Paid-in capital is the total sum that investors have paid into the fund to date, including any reinvested returns. It is different from committed capital, which is the total amount LPs have pledged to contribute over time. Contributions from the general partner (GP) don't count toward paid-in capital.
Net vs. gross: the role of fees and carry
DPI is usually reported net of management fees and carried interest, so it reflects what LPs actually receive. Management fees compensate the GP for running the fund. Carried interest is the share of profits the GP earns when the fund exceeds a certain return threshold.
Subtracting these costs gives a net DPI figure that shows real cash to investors. Reliable net reporting depends on sound fund accounting, since fees and carry must be tracked accurately over the fund's life.
A worked DPI example
Say an investment fund's LPs pay in $50 million over the fund's life. The fund distributes $115 million back to them from exits and dividends. DPI equals $115 million divided by $50 million, or 2.3x. Every dollar of paid-in capital has returned $2.30 in realized cash.
How to interpret DPI
Any DPI value above 1.0 means that total distributions (net of any management fees) exceed the capital LPs invested. For example, a DPI of 2.3x means the fund returned $2.30 for every dollar of LP capital invested. A value below 1.0 means the fund has returned less than investors paid in, net of management fees and carried interest.
Timing matters. The same DPI figure means different things depending on where a fund is in its life. An early-stage fund with a low DPI may simply be in the period before exits; Carta data on thousands of U.S. venture capital funds shows that after five years, only about half of funds have returned any capital to LPs. A late-stage fund with the same figure may signal weaker performance.
What is a good DPI?
There is no single "good" number, because DPI depends heavily on the fund's vintage, its investment strategy, and its stage. A young fund with a DPI near zero is normal; a mature fund still below 1.0 is a warning sign.
Carta's proprietary benchmarks show how early most funds sit. In the Q1 2026 VC Fund Performance report, Carta found that median DPI for the 2019 and 2020 vintages was still barely above zero. Less than half of those funds had returned any capital to LPs.
DPI is typically near zero early in the fund's life and rises as exits occur. Unlike metrics such as TVPI and IRR—which can dip in early years as management fees erode NAV before value accrues (the pattern often called the J-curve)—DPI doesn't dip. It simply stays near zero until the fund begins returning cash, then rises.
Reaching 1.0 is rarer still. That is the point where LPs shift from recovering capital to earning a profit. Across the 2017 and 2018 vintages, fewer than 20% of funds had reached a 1x DPI. Carta's report draws on 2,775 venture funds that closed between 2017 and Q1 2026, raising roughly $119.3 billion combined—and across the 2017 and 2018 vintages specifically, fewer than 20% of those funds had reached a 1x DPI.
A DPI above 1.0 means a fund has returned more cash than investors paid in, and mature funds often target 1.5x or higher by the end of their life. In most cases, judge DPI against a fund's vintage and stage rather than a fixed threshold.
How DPI compares to other fund metrics
DPI is one of several related performance ratios, and each answers a slightly different question. The table below shows how DPI compares to IRR, total value to paid-in capital (TVPI), residual value to paid-in capital (RVPI), and MOIC.
Metric | What it measures | Key difference from DPI |
DPI | Realized cash distributed divided by paid-in capital | Counts only distributions, net of fees |
IRR | Annualized return that factors in the timing of cash flows | Accounts for the speed of returns; DPI ignores time |
TVPI | Total value (distributions plus remaining value) divided by paid-in capital | Also includes unrealized net asset value (NAV); equals DPI at wind-down |
RVPI | Remaining value of holdings divided by paid-in capital | Counts only unrealized holdings; the mirror image of DPI |
MOIC | Gross return on invested capital | Measured gross of fees; DPI is net |
IRR rewards funds that return capital quickly, while DPI treats a dollar returned in year two the same as one returned in year 10. TVPI and DPI converge at the end of a fund's life. Once a fund liquidates its holdings and distributes the proceeds, its NAV goes to zero and TVPI equals DPI.
MOIC is the gross counterpart to DPI. After a fund winds down, the two become the net and gross versions of the same ratio.
DPI vs. IRR
Both DPI and internal rate of return (IRR) measure investment performance. Unlike IRR, which accounts for the speed of returns by factoring in the time it takes for LPs to receive distributions, time is not a factor when calculating DPI.
DPI vs. TVPI
While DPI measures the ratio of distributions to capital paid in, total value to paid-in (TVPI) is the ratio of the fund's total value to capital paid in. That means TVPI also accounts for the fund's net asset value (NAV), or the value of investments that the fund still holds.
At the end of a fund's lifecycle, when it liquidates all remaining holdings and distributes the proceeds to investors, TVPI becomes irrelevant because it's equal to DPI.
DPI vs. RVPI
Residual value to paid-in capital (RVPI) is an expression of the remaining value of the fund's holdings to the total amount of capital investors have paid in to date. RVPI doesn't account for fund distributions at all, while DPI only accounts for distributions (and not any remaining fund holdings).
DPI vs. MOIC
DPI is similar to another fund metric: multiple on invested capital (MOIC), but there are some important differences:
First, MOIC expresses the gross returns of the fund to invested capital, whereas DPI only includes distributions net of any fees and expenses in the numerator.
Second, investors and LPs sometimes analyze MOIC at the level of individual portfolio investments. MOIC is usually only considered at the fund level after the conclusion of the fund's life, when TVPI becomes irrelevant. At fund wind-down, DPI and MOIC converge: Both express total return relative to capital, but MOIC is calculated gross of fees while DPI reflects what LPs actually received after fees and carried interest are deducted.
Advantages and disadvantages of DPI
DPI's appeal is its simplicity. Unlike IRR, which requires a discounted cash flow analysis, DPI is easy to calculate and hard to misread. The DPI ratio makes it easy for investors to understand when they've started to receive a positive cash return on the capital they've invested in the fund, and by what factor they've multiplied that capital.
It is also harder to inflate than metrics that lean on NAV, because it ignores unrealized value.
Strengths
Simple to calculate and explain: no model inputs, no time-value adjustments, just distributions divided by paid-in capital.
Harder to inflate than NAV-based metrics: it counts only actual cash and excludes subjective valuation assumptions.
Comparable across funds: the formula is consistent, making it straightforward to benchmark funds of similar vintage and strategy.
Limitations
Ignore the time value of money: a dollar returned in year two looks the same as one returned in year ten.
Misses unrealized holdings: a fund sitting on significant gains will not show them until exits occur.
Exit timing can be managed: GPs control when they sell, and optimizing for DPI does not always maximize total value.
NAV financing inflation: NAV-based financing can lift reported DPI without creating new underlying value.
Because of these limitations, DPI should be read alongside TVPI, RVPI, MOIC, and IRR for a complete performance picture.
Reporting DPI
For registered investment advisers (RIAs), the Securities and Exchange Commission's (SEC) Marketing Rule requires fund managers to report net performance metrics if they're also reporting gross performance metrics, using the same methodology and timeframe for both. In practice, that means an adviser reporting MOIC (which is equivalent to gross DPI) must also report DPI using the same timeframe and methodology.
→ Learn more about investor reporting
Track DPI with real-time fund data
Accurate DPI reporting starts with current fund accounting. Carta Fund Administration is built on event-based accounting and gives fund CFOs real-time performance metrics, including net and gross returns, so DPI and its companion ratios stay current as capital calls and distributions flow. To see how it works for your fund, request a demo.


DISCLOSURE: This communication is on behalf of eShares, Inc. dba Carta, Inc. ("Carta"). This communication is for informational purposes only, and contains general information only. Carta is not, by means of this communication, rendering accounting, business, financial, investment, legal, tax, or other professional advice or services. This publication is not a substitute for such professional advice or services nor should it be used as a basis for any decision or action that may affect your business or interests. Before making any decision or taking any action that may affect your business or interests, you should consult a qualified professional advisor. This communication is not intended as a recommendation, offer or solicitation for the purchase or sale of any security. Carta does not assume any liability for reliance on the information provided herein. ©2026 Carta. All rights reserved. Reproduction prohibited.