Executive summary
Across the tech ecosystem, executives have spoken repeatedly in recent months about the need to flatten their organizations in the age of AI. This typically means fewer management layers. It also means many companies are more sharply focused on the individual contributors (ICs) who perform the actual work.
This shift in priorities is apparent in Carta’s latest data on new-hire compensation.
Compared to where the market stood at the start of 2024, ICs have experienced bigger gains in both median salary and the median size of initial equity grants than any other level of employee seniority. For ICs one step below senior status, for instance, the median salary benchmark for new hires is up 18.5% over this span, while median initial grant size has risen by 25.4%.
This stands in stark contrast to compensation shifts for many more-senior roles. Take senior directors: Among this cohort, median salary benchmarks have climbed 6.3% since the start of 2024, while median equity grant size is up by just 3.9%. For employees at the VP level and above, meanwhile, the median size of initial grants has shrunk over the past two and a half years.
In terms of dollars and cents, of course, higher-ranking positions still earn substantially more. In fact, the median salary for new hires made in H1 2026 was more than twice as high for senior directors as it was for those ICs who are a step above entry level.
But the gap is narrowing. Many companies seem to believe that AI is simultaneously reducing the need for multiple layers of management and increasing the capabilities of top-level ICs. As the makeup of orgs transforms, their compensation practices are changing, too.
Key takeaways
Headcount growth is holding steady: At some companies, layoffs have been another side effect of the drive toward flatter organizations. Across the startup ecosystem as a whole, however, layoff figures from H1 2026 are actually down compared to both 2024 and 2025. On the whole, net headcount growth at Carta has held relatively steady from one month to the next since the start of 2024.
First hires are receiving more equity: Over the past two years, the median first hire made by startups on Carta received an initial equity grant equivalent to 1.75% of total company equity. This figure continues to climb from prior analyses. And for some first hires, it’s substantially higher: The 75th percentile for initial grant size among this cohort is 4.26% of fully diluted company equity.
Compensation remains highest in product and engineering: In terms of both salaries and initial equity grants, companies are still willing to pay more for talent in product and engineering than any other organization, with product at the top of the heap. Through the end of H1, the median benchmarks for a new hire in product were $180,600 in salary and an initial grant comprising about 0.024% of company equity.
Hiring and headcount
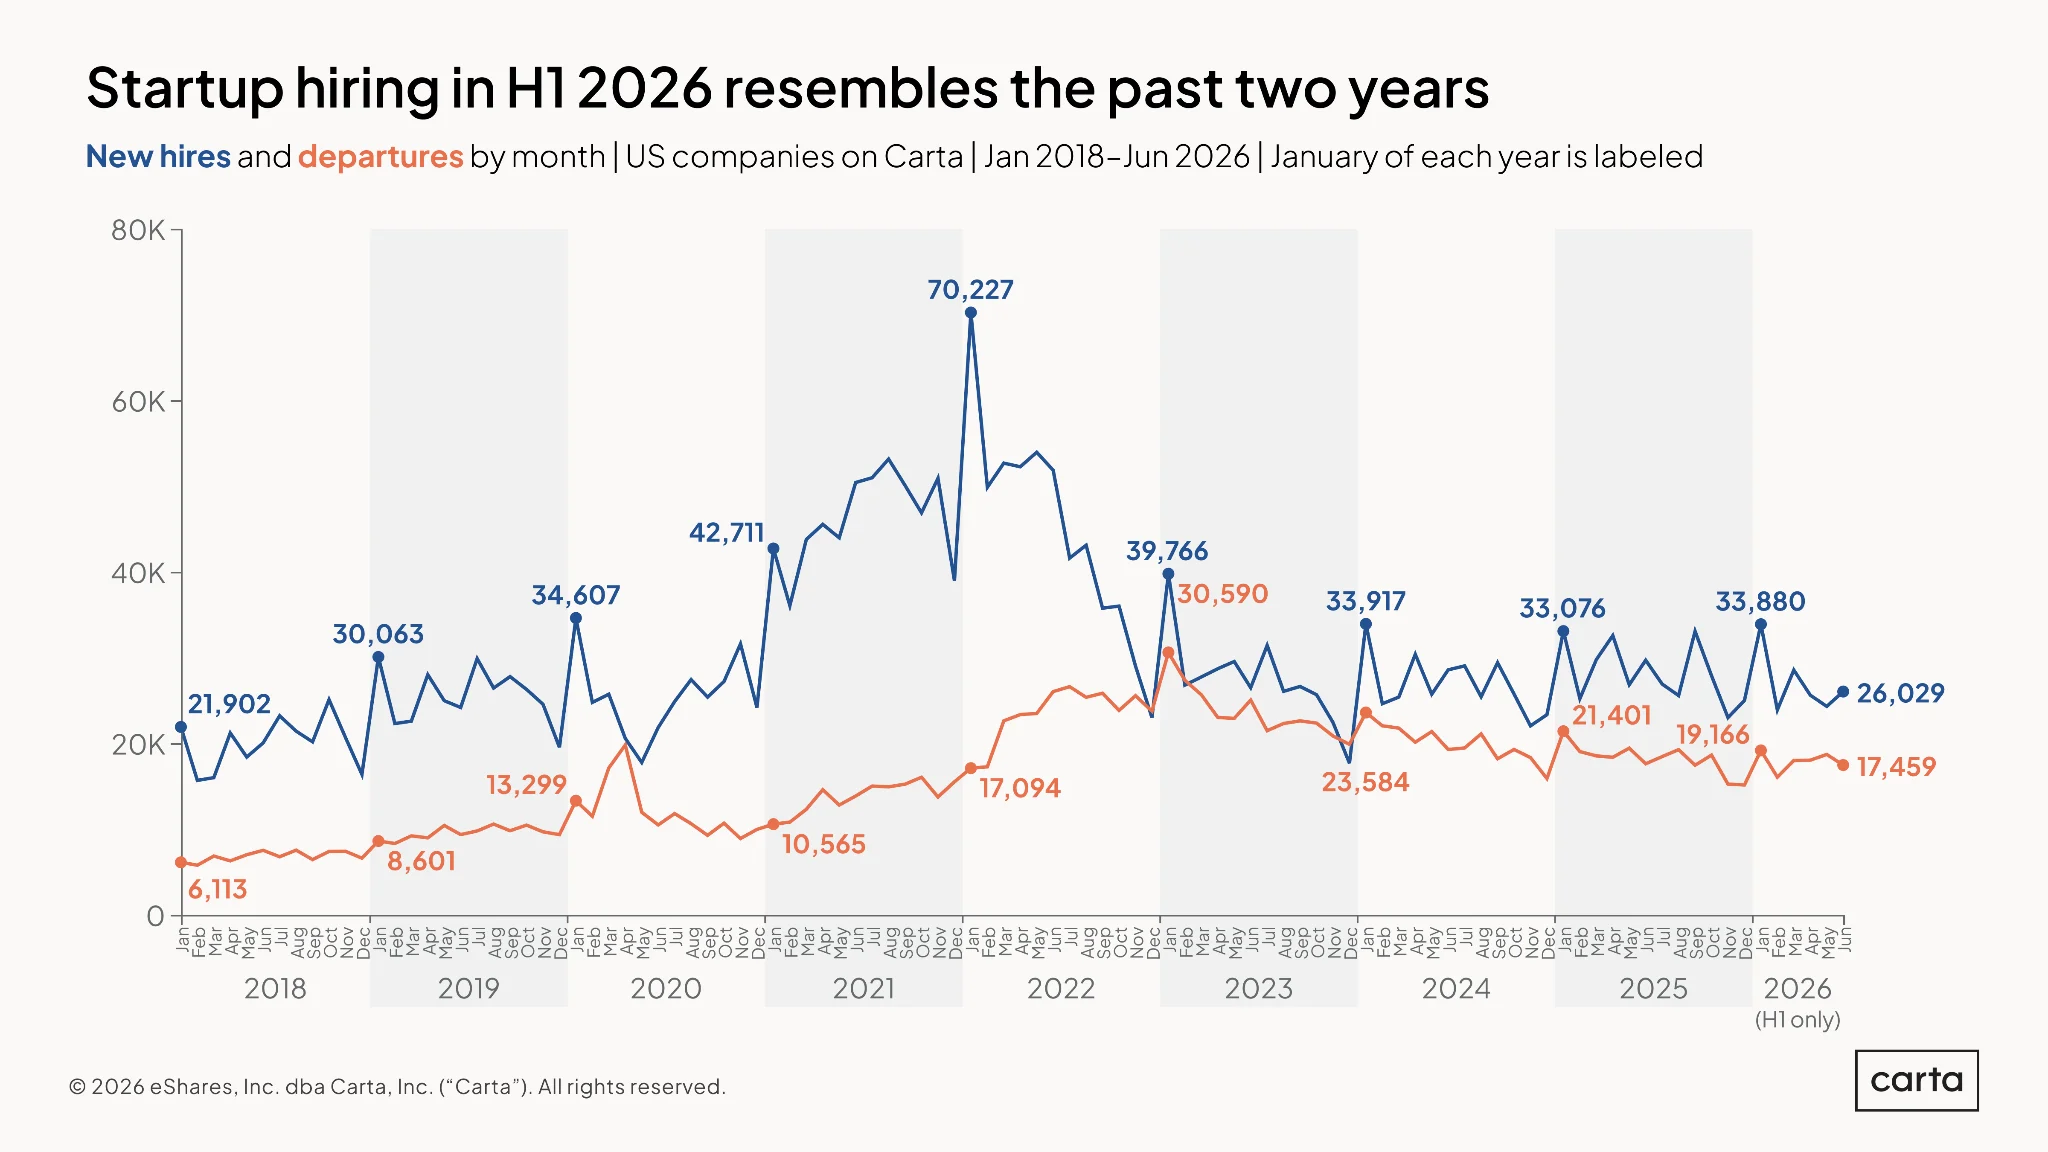
The startup job market has settled into a consistent rhythm in the past three years, with both new hires and departures peaking each January and then gradually declining as the rest of the year unfolds, with a few ups and downs in between. So far, 2026 is looking no different.
New hires have now outpaced employee exits for 30 straight months. In June, companies made 1.49 hires for each departure, representing a steady rate of growth across the startup industry. But employee growth rates in the age of AI still remain well below the levels seen from 2018 through 2022. For example, back in January 2019, companies made 3.49 hires for every departure.
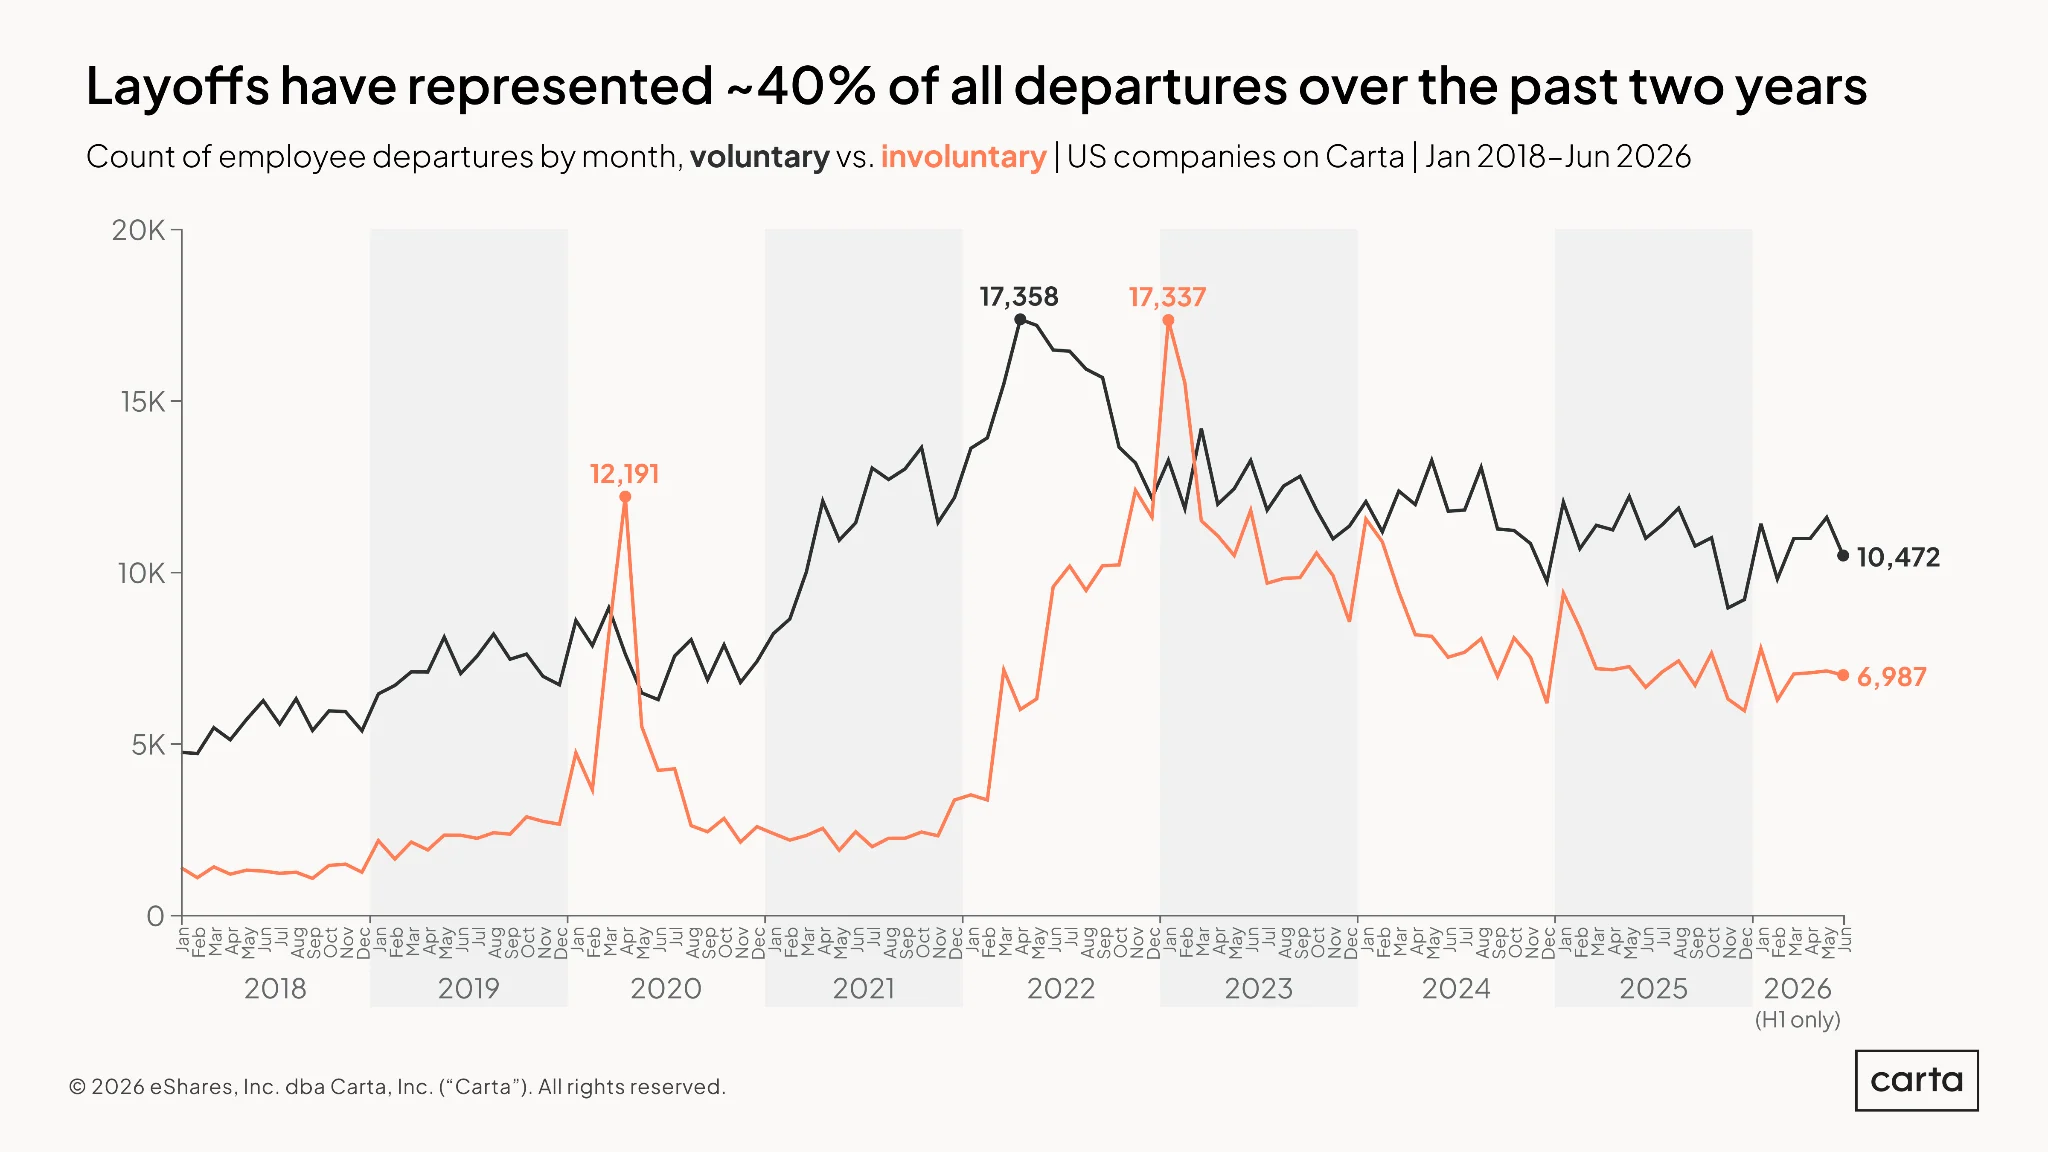
In June, 60% of all employee departures from companies on Carta were voluntary. The other 40% were involuntary, with layoffs accounting for most of these involuntary exits. This ratio of voluntary to involuntary departures has held relatively steady for the past two years.
Voluntary job departures have been more common than involuntary departures for most of recent history, with the exception of two market-wide spikes in layoffs that occurred in 2020 and 2023. Compared to that 2023 spike, the count of involuntary departures this June was down 60%. In general, the month-to-month pace of voluntary exits has been less volatile over the past several years than the pattern of involuntary departures.
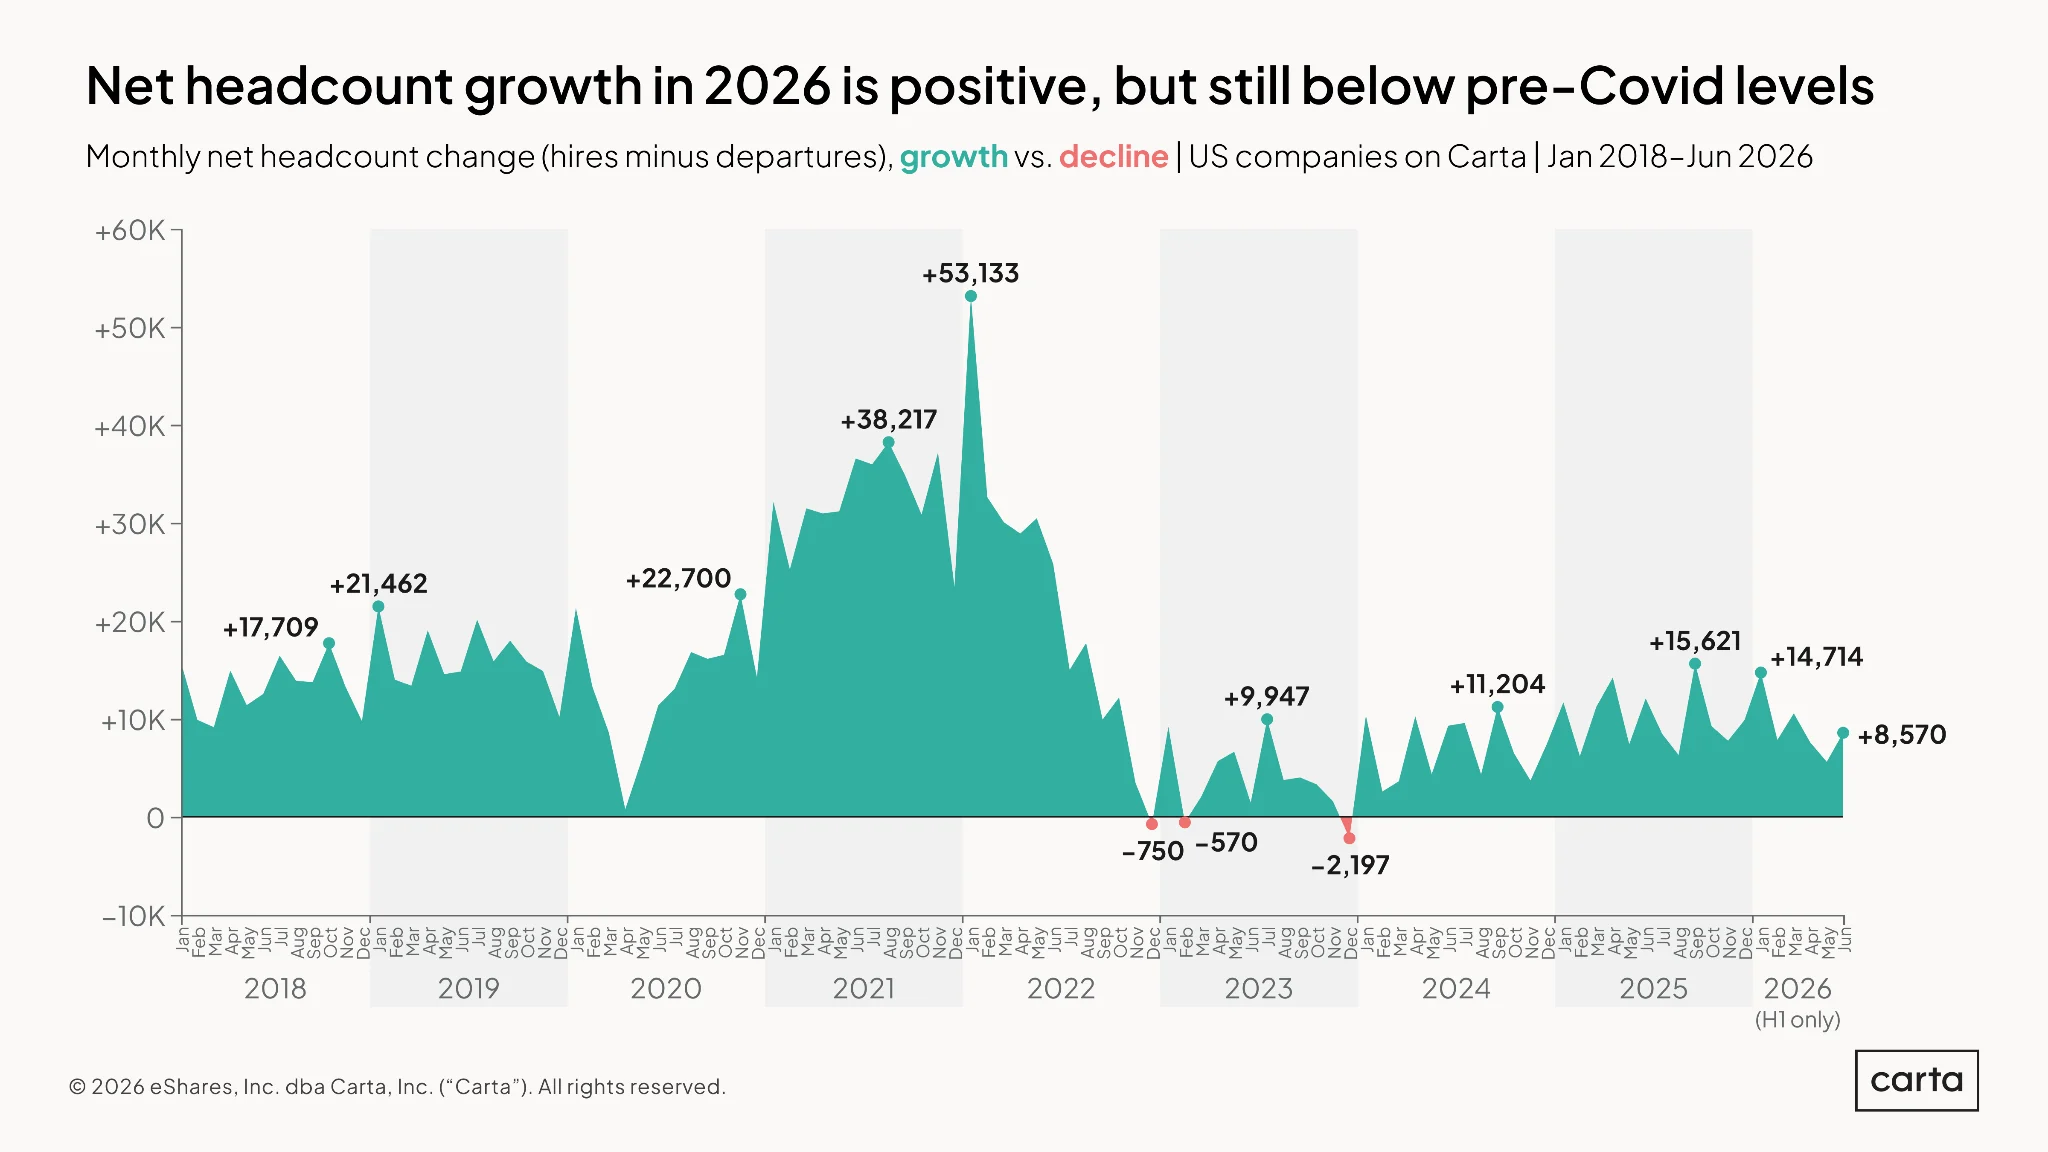
Over the past two and a half years, net headcount at startups on Carta has typically grown by somewhere between 5,000 and 15,000 people each month. The rate of growth in June was right in line with this recent trend, with companies making 8,570 more hires than they saw total departures.
From 2020 through 2023, headcount growth figures experienced wild ups and downs. The stability of the past two-plus years is more reminiscent of 2018 and 2019, the last time net headcount was growing at such an even rate from one month to the next. The difference: Total headcount was growing quite a bit quicker in the late 2010s. Hiring numbers in those years were roughly the same as in the mid-2020s, but departures in the late 2010s were far less frequent.
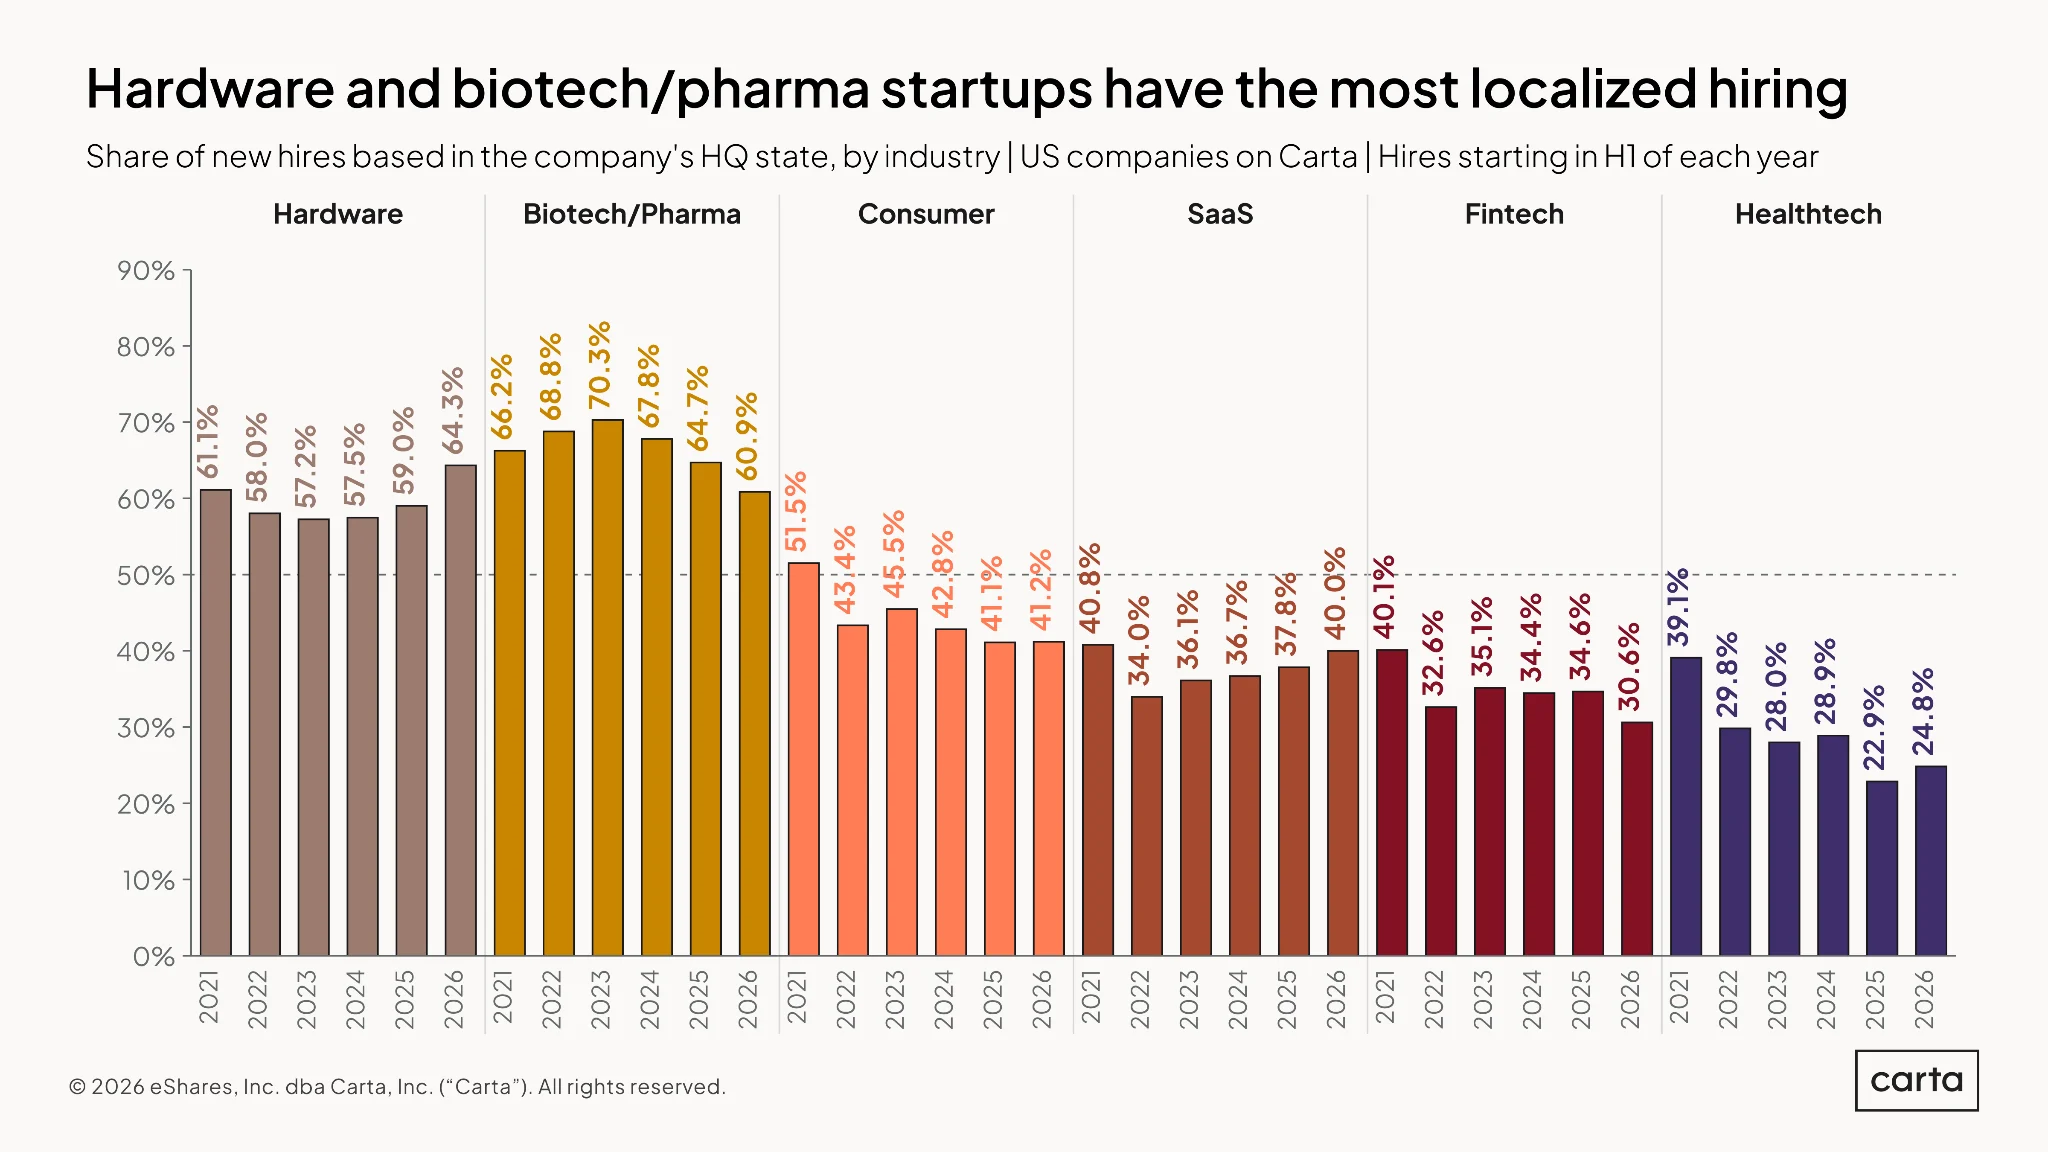
Some startup industries tend to be more open to satellite offices and remote work than others. In healthtech, for instance, fewer than 25% of all new hires made by startups on Carta in H1 2026 live in the same state where their employer is primarily based. Compare that to hardware, where 64.3% of new hires made in H1 2026 live in the same state as their company headquarters.
In five of the six major startup sectors shown here, it’s become more common over the past five years to make hires from outside a company’s home state. The lone exception is hardware. When it comes to building physical objects, the physical presence of employees is still important.
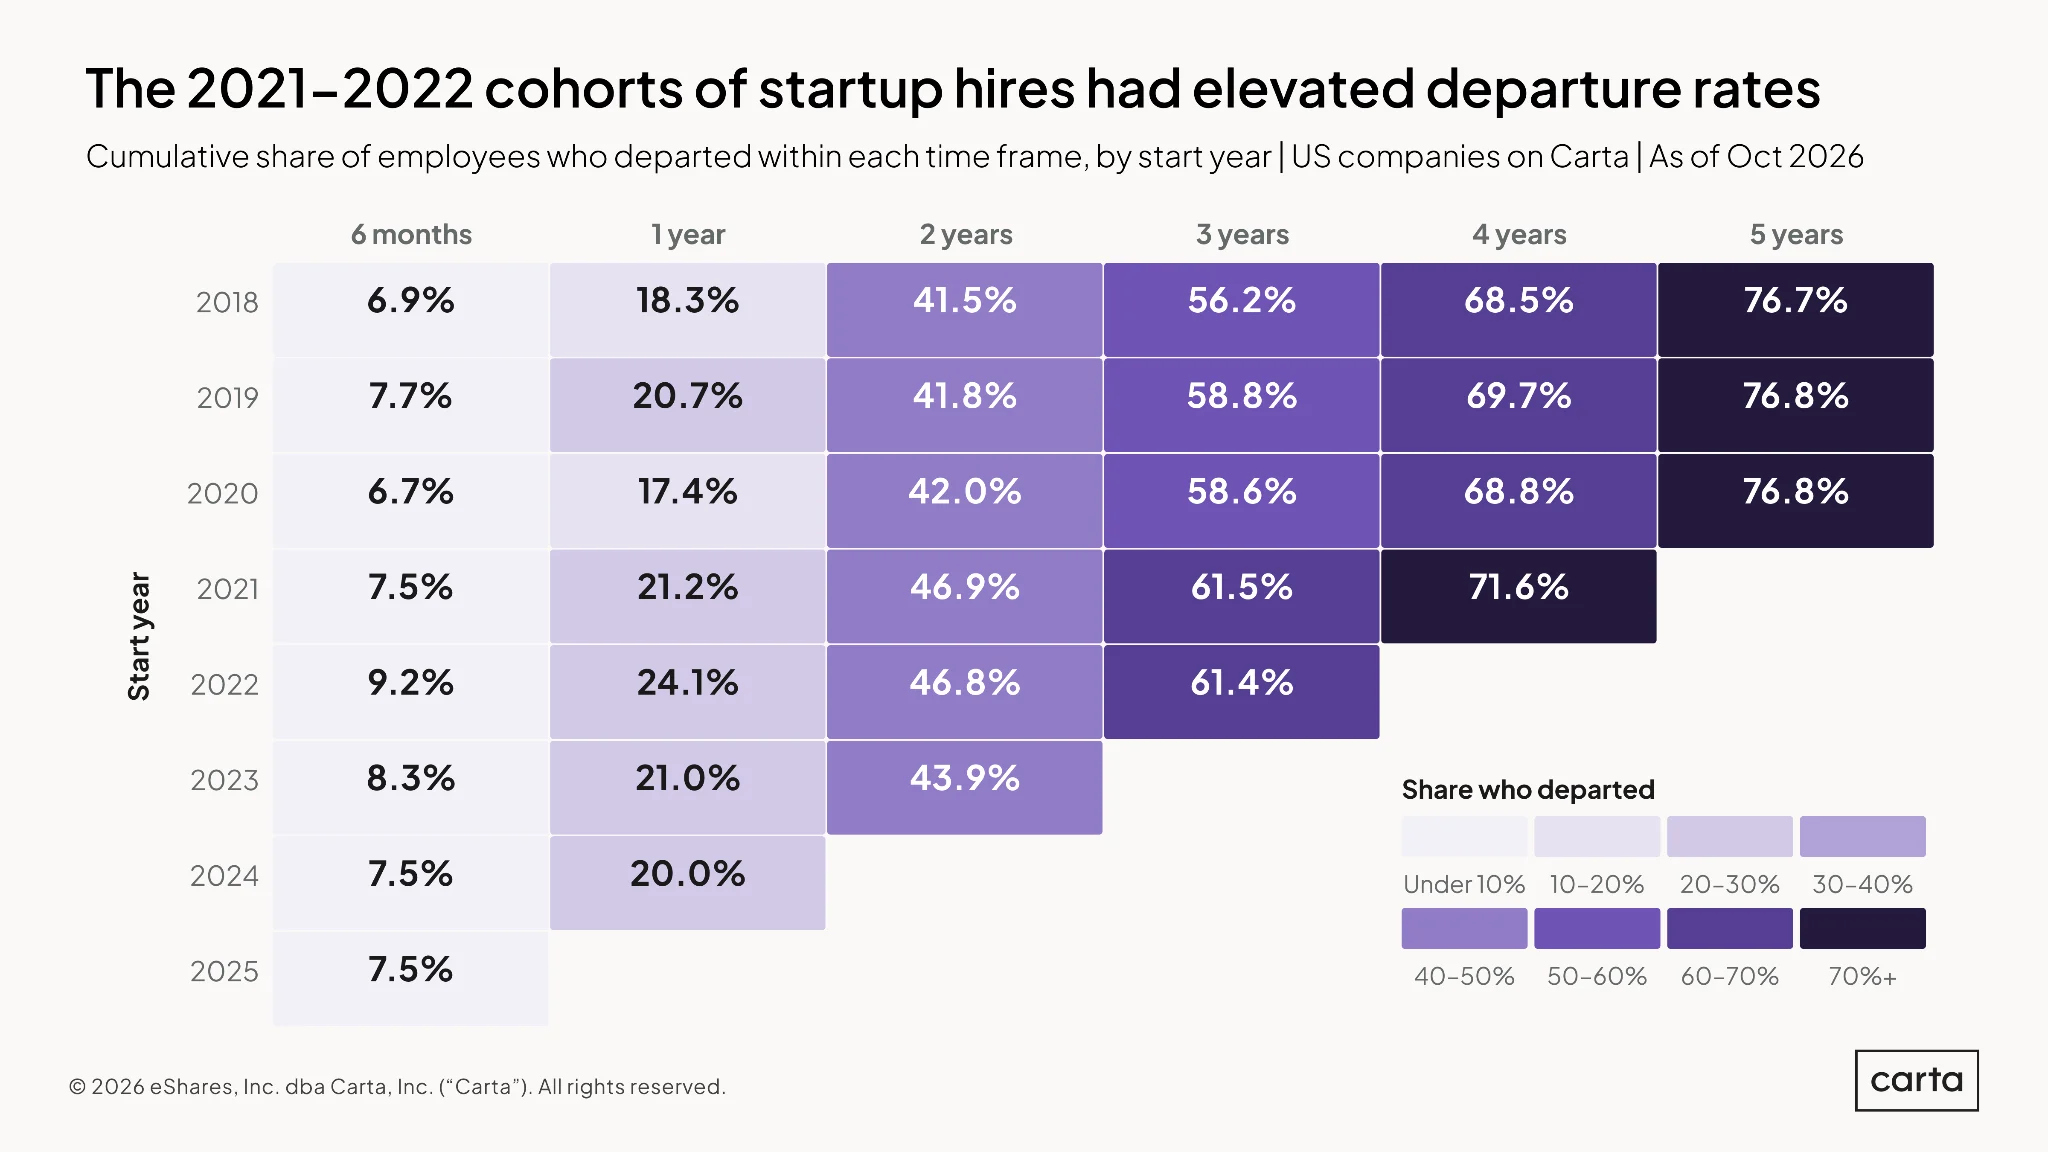
After one year on the job, 17.4% of employees hired by companies on Carta in 2020 had left their role. Among new hires made in 2022, that rate climbed to 24.1%.
This gap is representative of a larger trend across recent startup employment history, with the cohorts of hires made in 2021 and 2022 generally being more likely to have left their roles at the same point in time than new hires made in 2018-2020 and 2023-2025.
Of course, 2021 and 2022 were unusual years in startup history. First, hiring spiked to previously unprecedented levels. Shortly thereafter came an ecosystem-wide surge in layoffs that led to many involuntary departures in late 2022 and early 2023. For employees, this period of upheaval has resulted in slightly higher turnover rates.
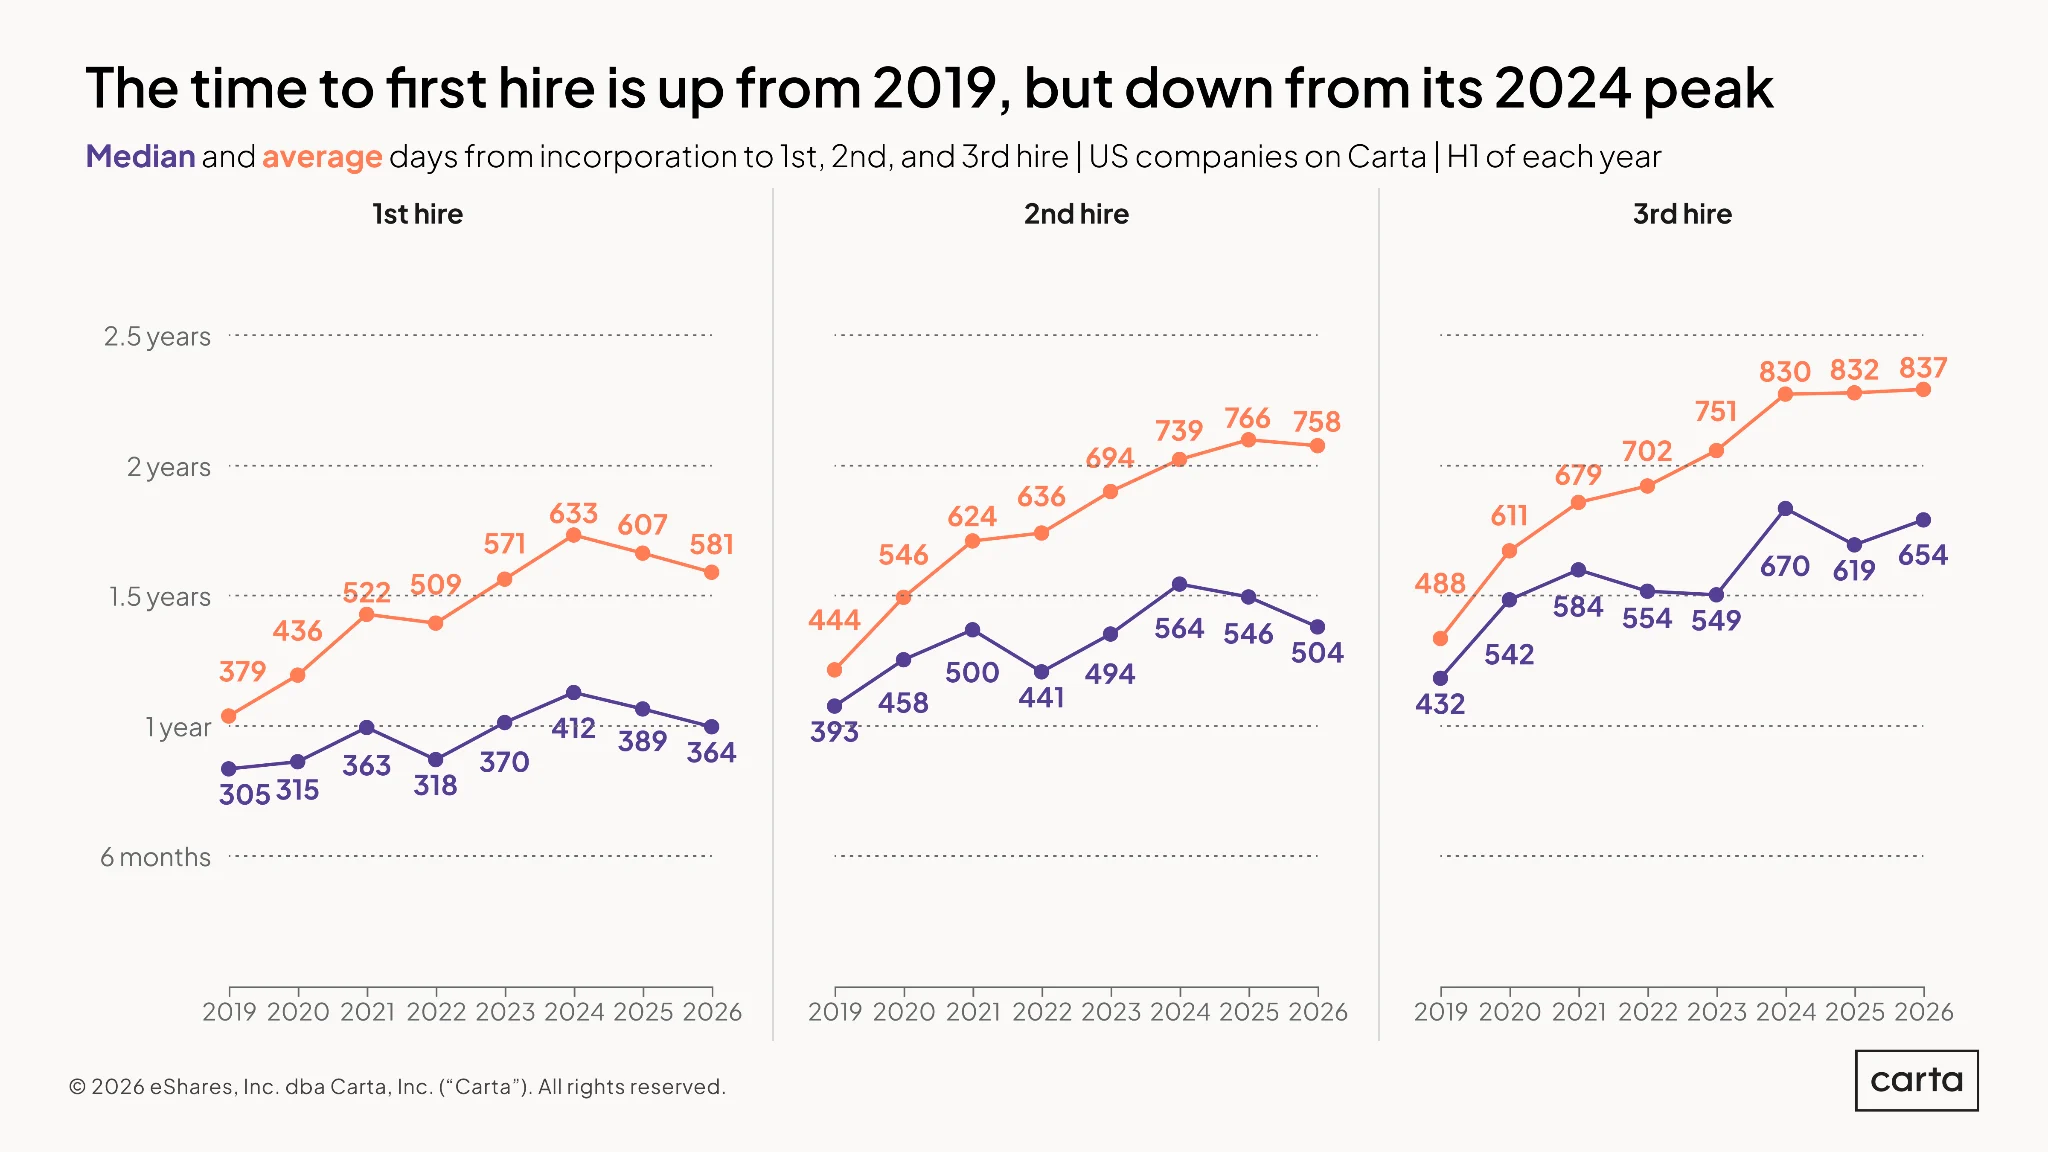
In the age of AI, startups on Carta are hiring more slowly than they used to. In the first half of this year, the average company making its first hire did so 581 days after the date of incorporation. Back in 2019, the average first hire came 379 days after incorporation. The multiyear trend is only more severe for second and third hires. Today, the average startup makes those additions nearly a year later than it did in 2019.
But this trend has a few complicating factors. Early hiring timelines had already begun to lengthen before the launch of ChatGPT in 2022, so the rise of AI isn’t the only contributing factor. The trend is less severe at the median, suggesting that the averages are being pulled up by some companies with very long hiring timelines.
And, most importantly, the trend has already begun to reverse course. At both the average and the median, timelines to both first hires and second hires are shorter in 2026 than they were in 2025. While early-stage startups are still more comfortable building with very small teams than they were five years ago, there may be limits to their appetite for leanness.
Salary trends
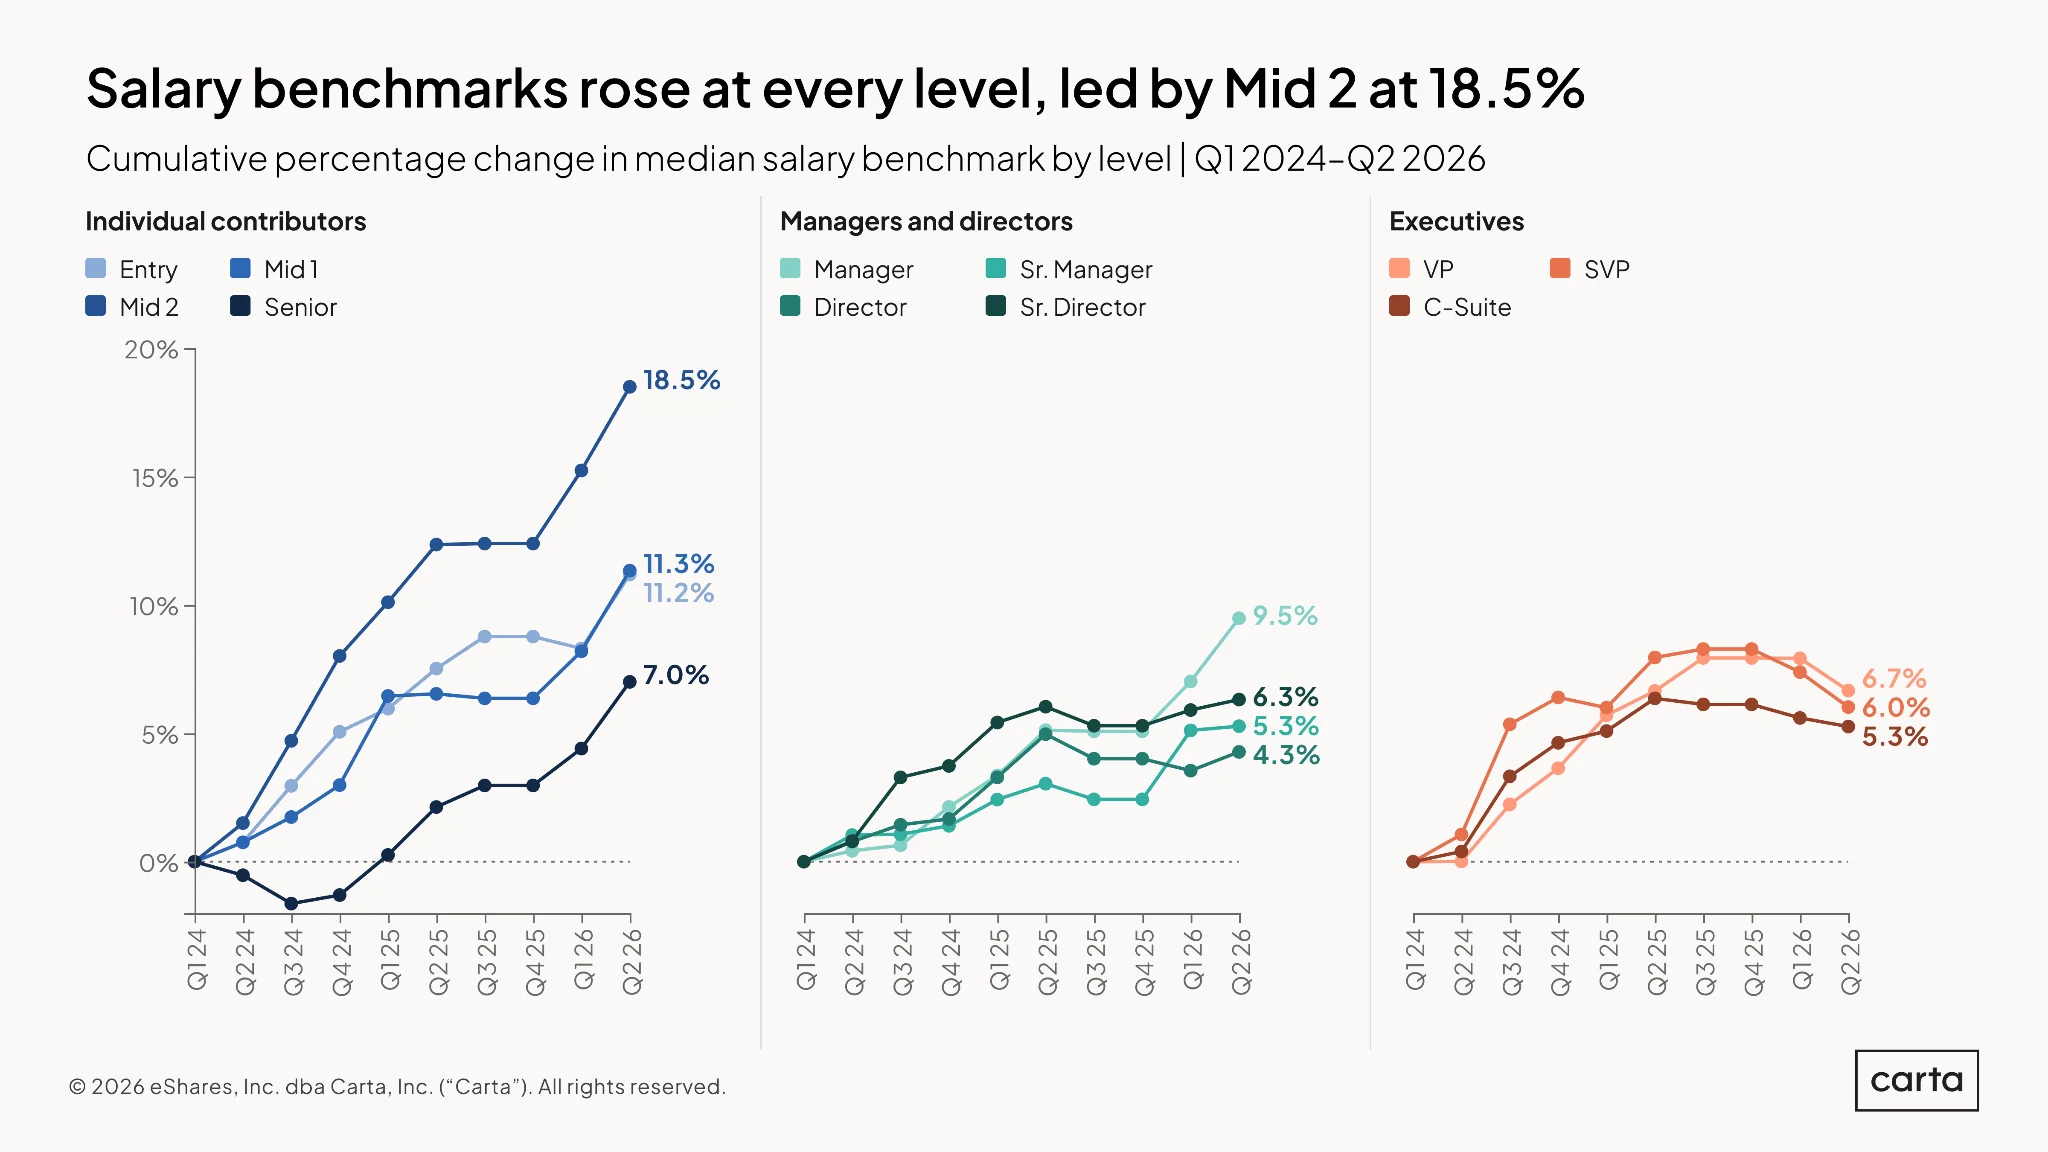
At every level of seniority from ICs up to members of the C-suite, median salary benchmarks have increased since the start of 2024. ICs have experienced the biggest gains, with salary benchmarks for those roles climbing particularly sharply over the past three quarters.
Salary benchmarks have also been on the rise in 2026 for managers and directors. For executives, however, salary expectations have declined this year. Even with that recent drop-off, median salary benchmarks for these most-senior roles have shown healthy growth on the longer two-and-a-half-year timeline shown here.
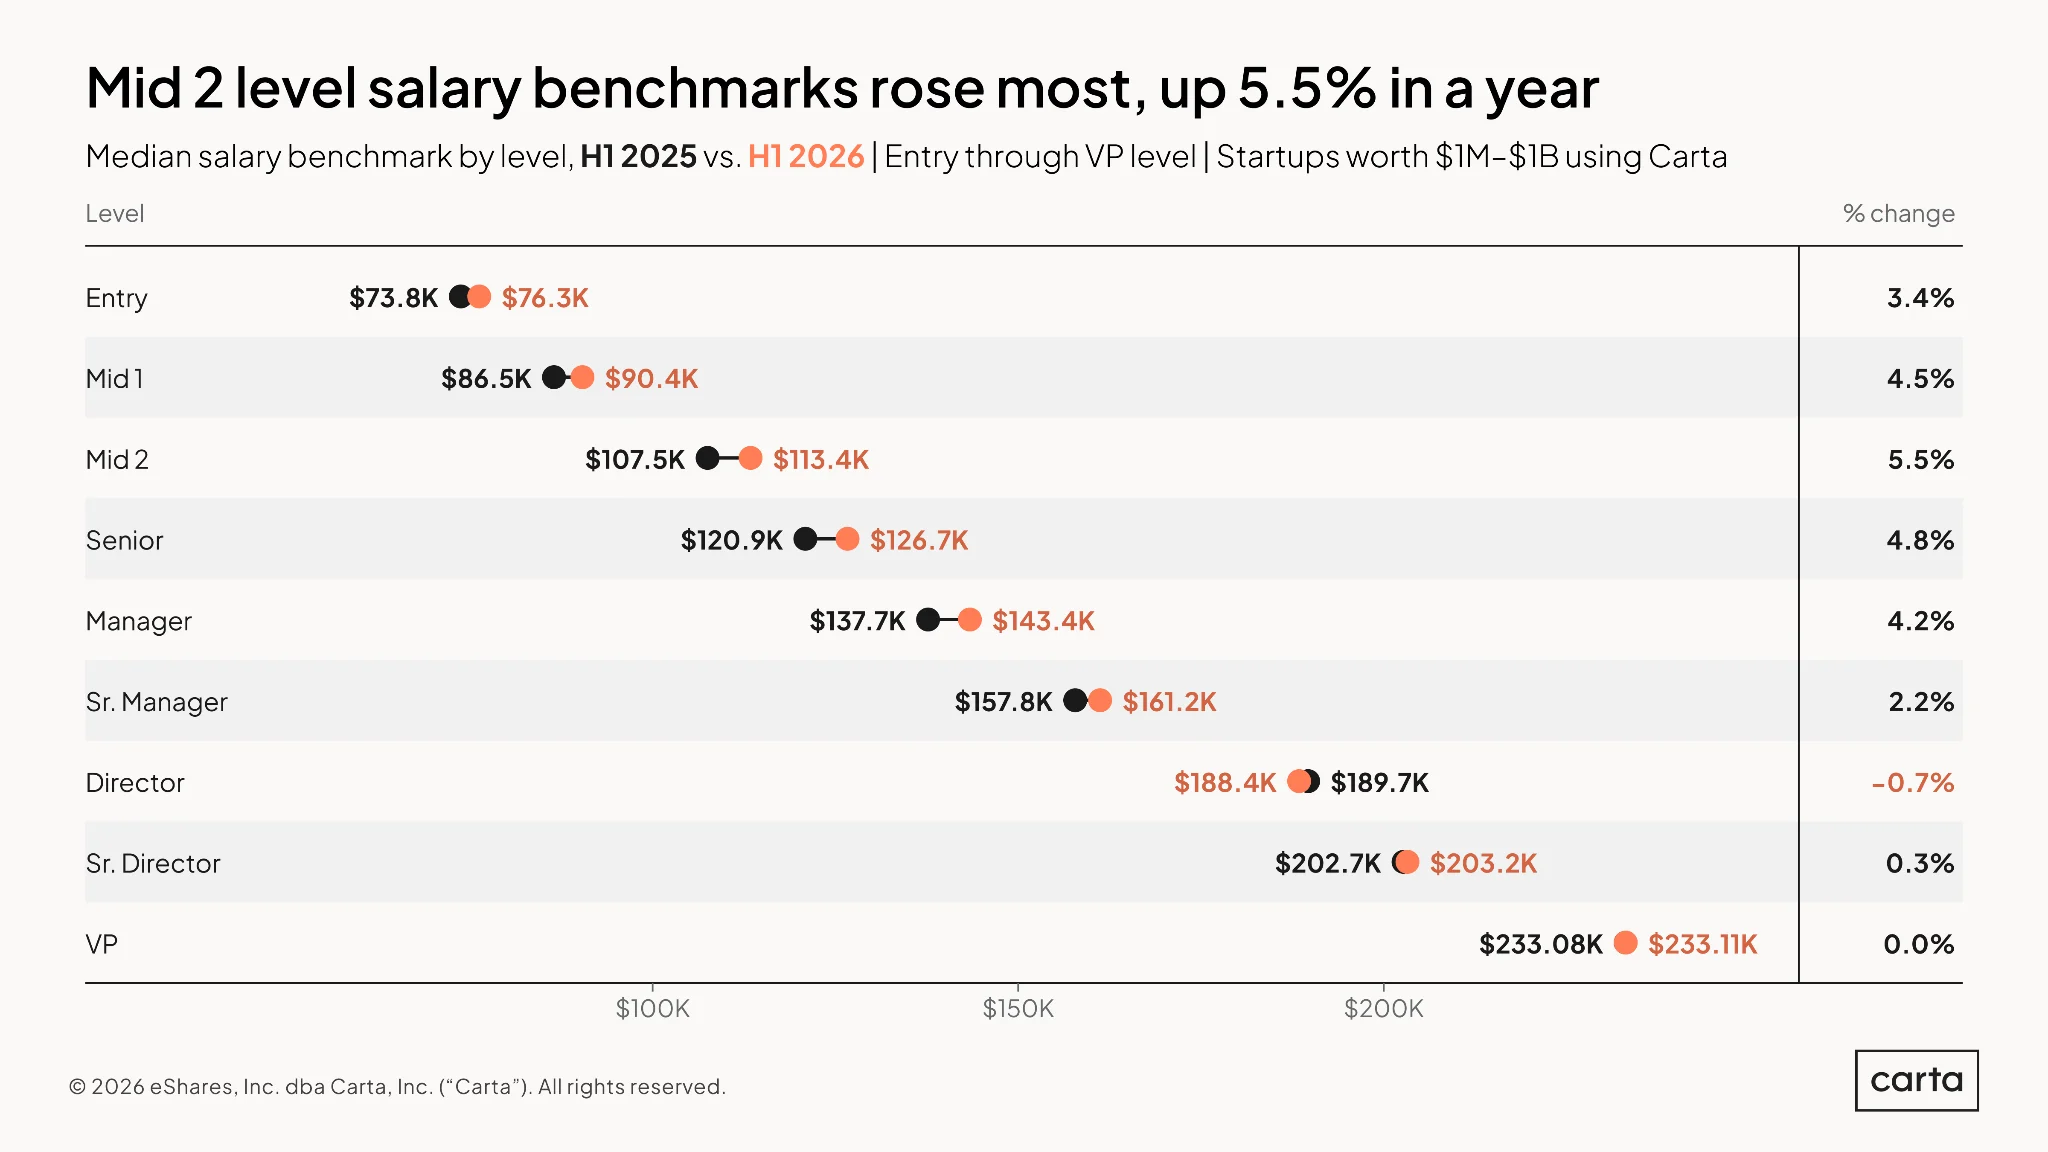
Most job levels saw median salary benchmarks increase from H1 2025 to H1 2026, with mid-level employees experiencing the most growth. For what we classify as Mid 2 employees—essentially ICs who are one step shy of senior-level status—the median benchmark grew 5.5% over this span, reaching roughly $113,400.
Yet there was one high-ranking exception to this general trend of rising salaries: For directors, the median salary benchmark declined over the past year. The other two highest-ranking positions shown here (senior directors and VPs) saw miniscule gains.
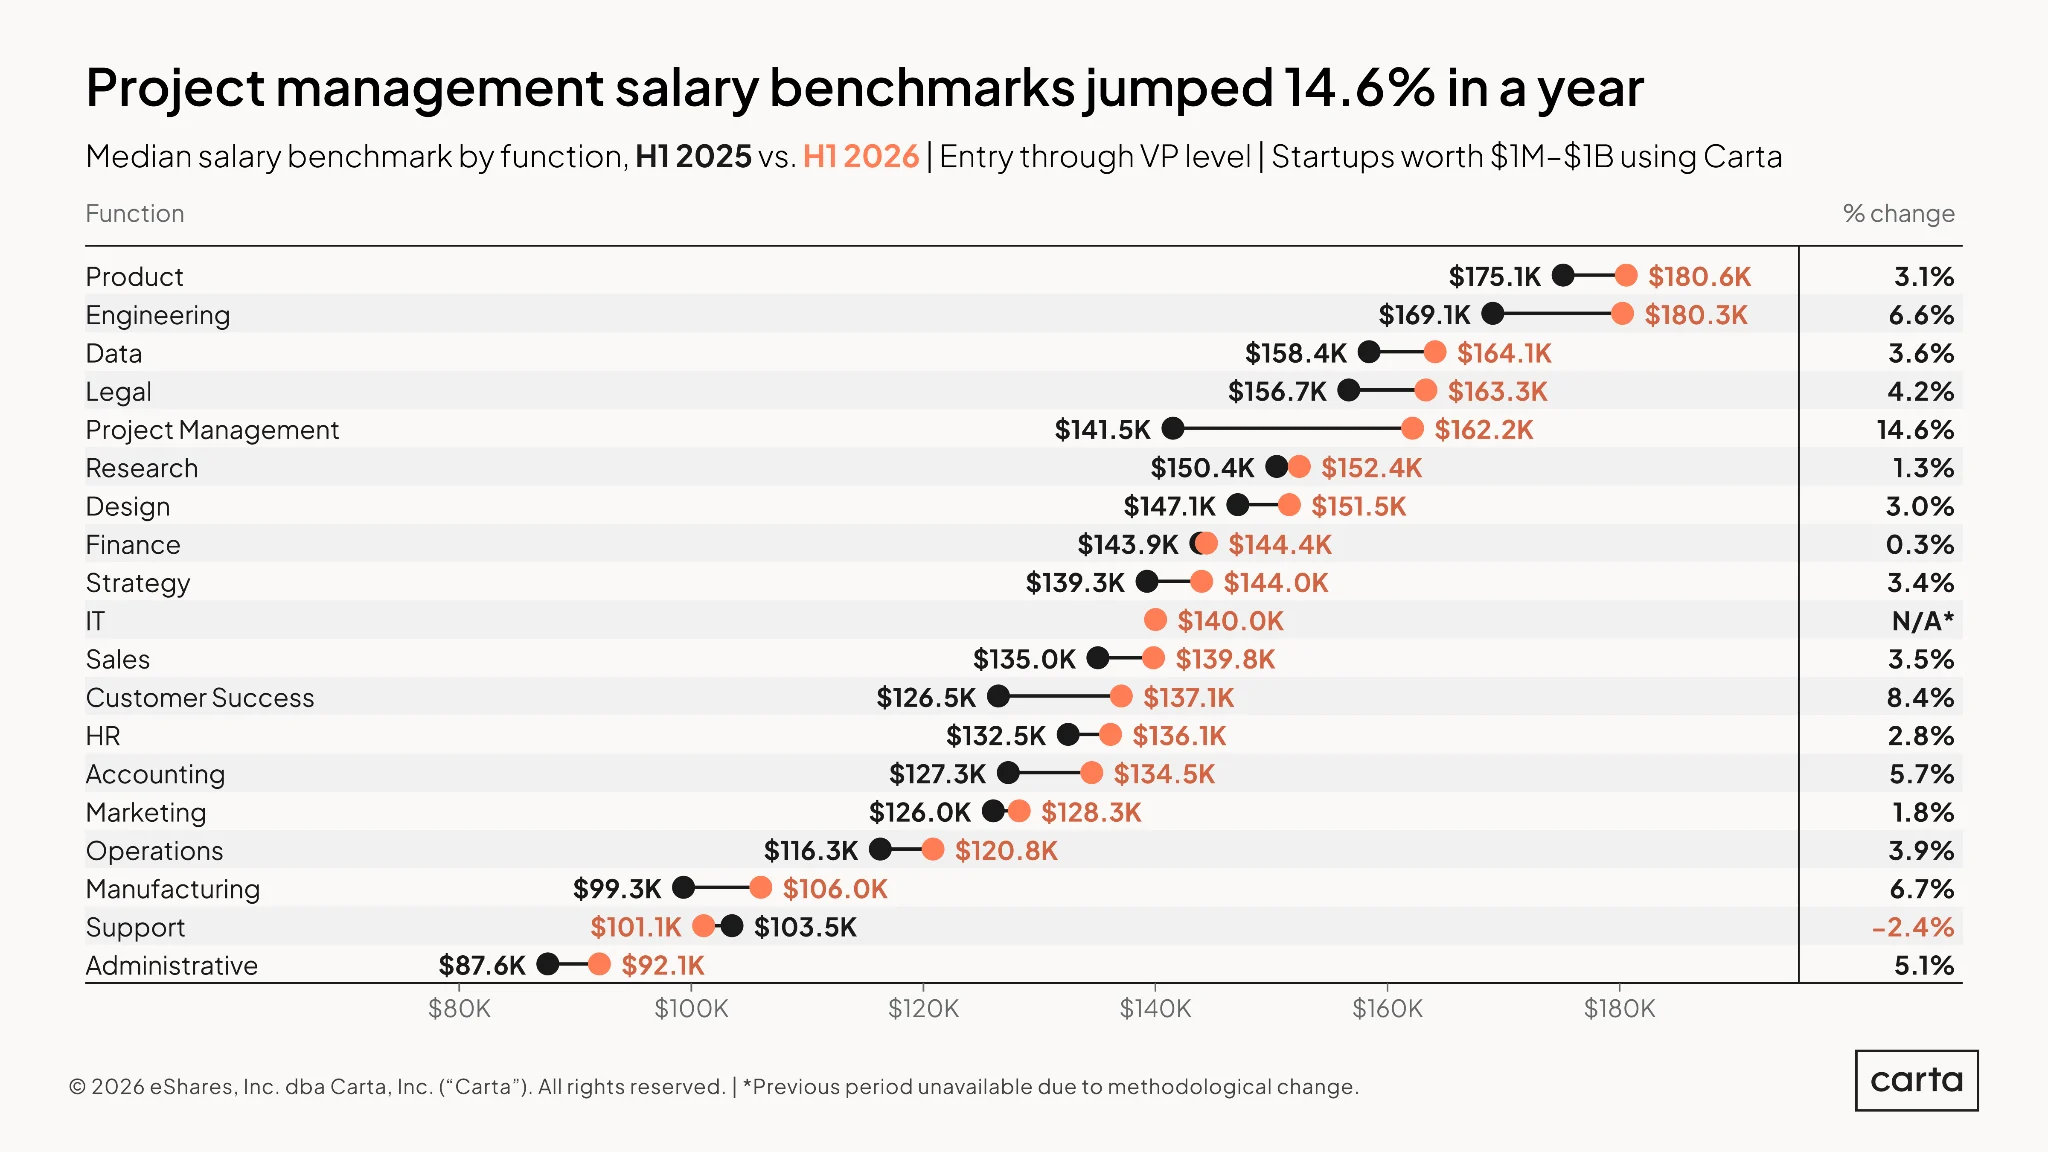
There’s been no change over the past year in which job functions typically receive the highest salaries: Product and engineering are still at the top of the list, with the median salary benchmark for both functions now topping $180,000.
But the gap between the two is closing, with engineering now almost equal to product. And there’s been significant movement in other job functions. Nowhere is this more true than project management, where the median salary benchmark leapt by 14.6% from H1 2025 to H1 2026, rising more than $20,000. That was by far the biggest year-over-year change for any job function.
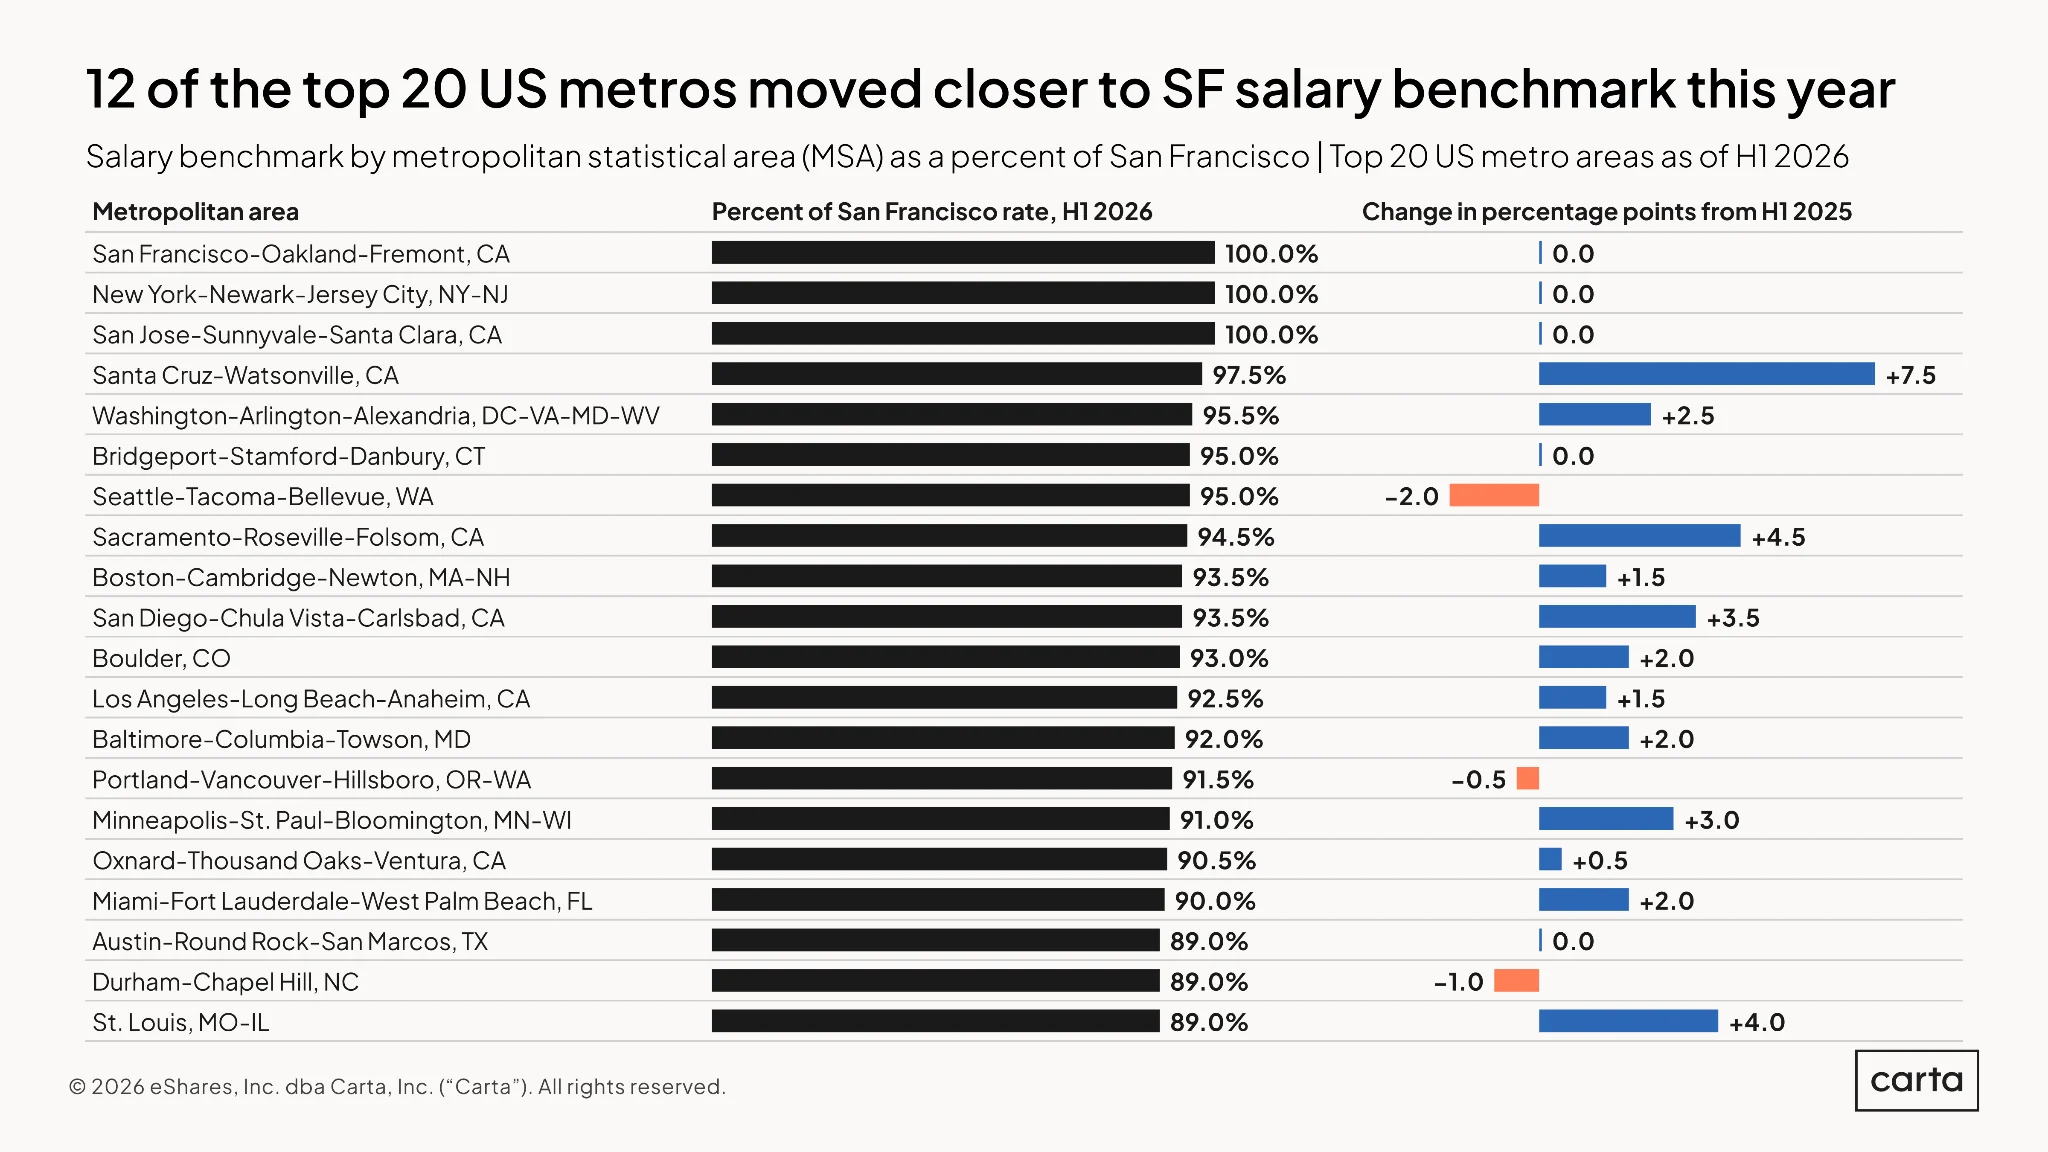
In recent years, employers have been able to find slight salary discounts by widening their nets just a few hours outside the Bay Area. But this pay gap among Northern California metro areas is rapidly tightening. In H1 2026, benchmark salaries in Santa Cruz were 97.5% the level of San Francisco, while benchmark salaries in Sacramento climbed to 94.5% of San Francisco’s market-leading pay.
A year previously, in H1 2025, benchmark salaries in both Santa Cruz and Sacramento were at 90% of San Francisco’s level. In terms of these salary benchmarks, they are the two fastest-growing regions among major U.S. metros, followed by St. Louis, San Diego, and Minneapolis/St. Paul.
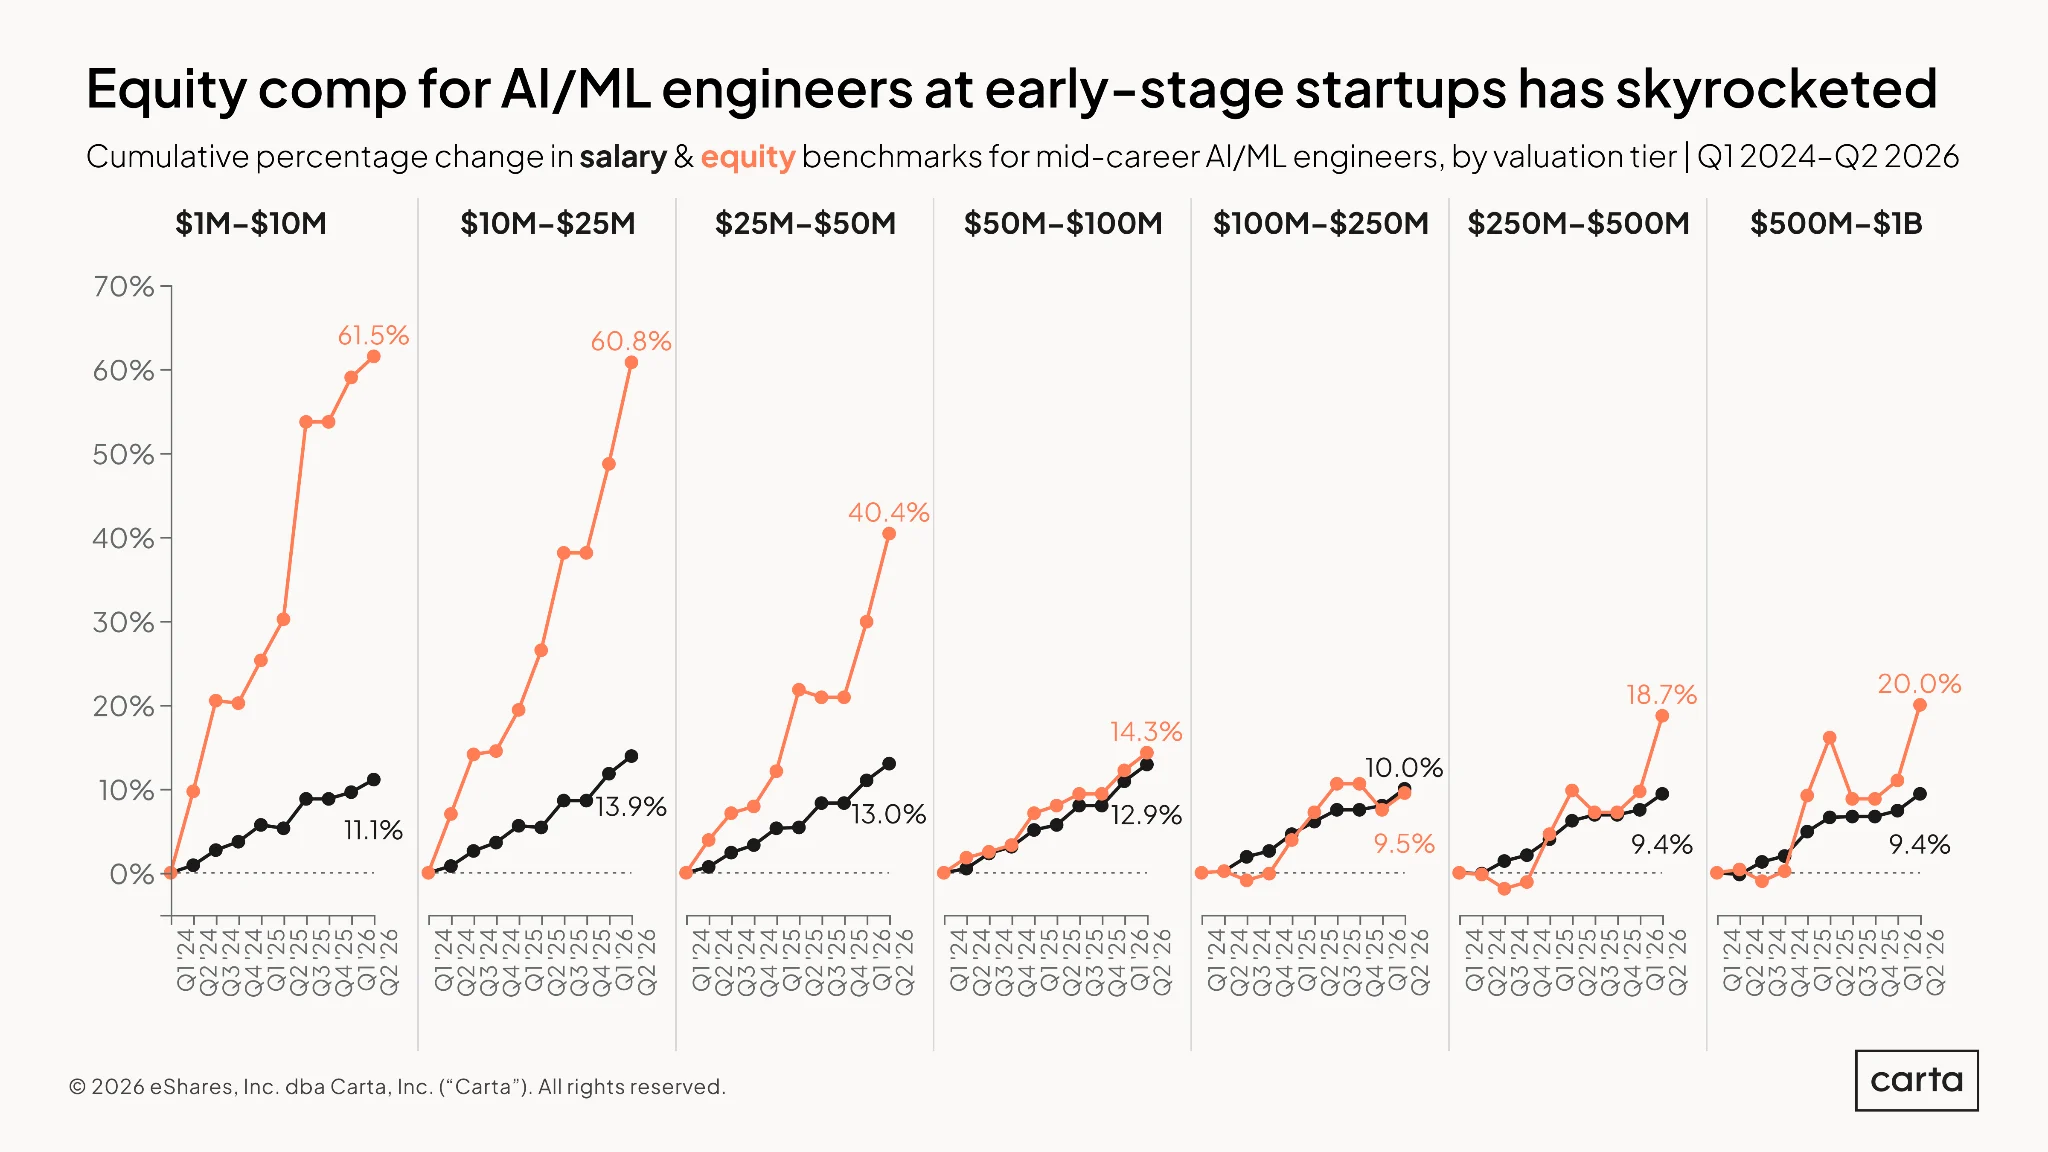
It’s little surprise that startups are offering larger pay packages these days to attract top AI engineering talent. But the scale of the shift has been huge: For companies valued below $25 million, the benchmark equity package offered to new AI/ML engineers is up more than 60% since the start of 2024.
For startups at every valuation tier up to $1 billion, equity packages have increased more quickly than salaries, which may reflect a desire to optimize for upside and more closely align incentives around a desire to achieve hockey-stick growth. Growth in equity has also been more volatile across valuation tiers for AI/ML engineers than growth in salaries, which varies only by a few percentage points.
Equity trends
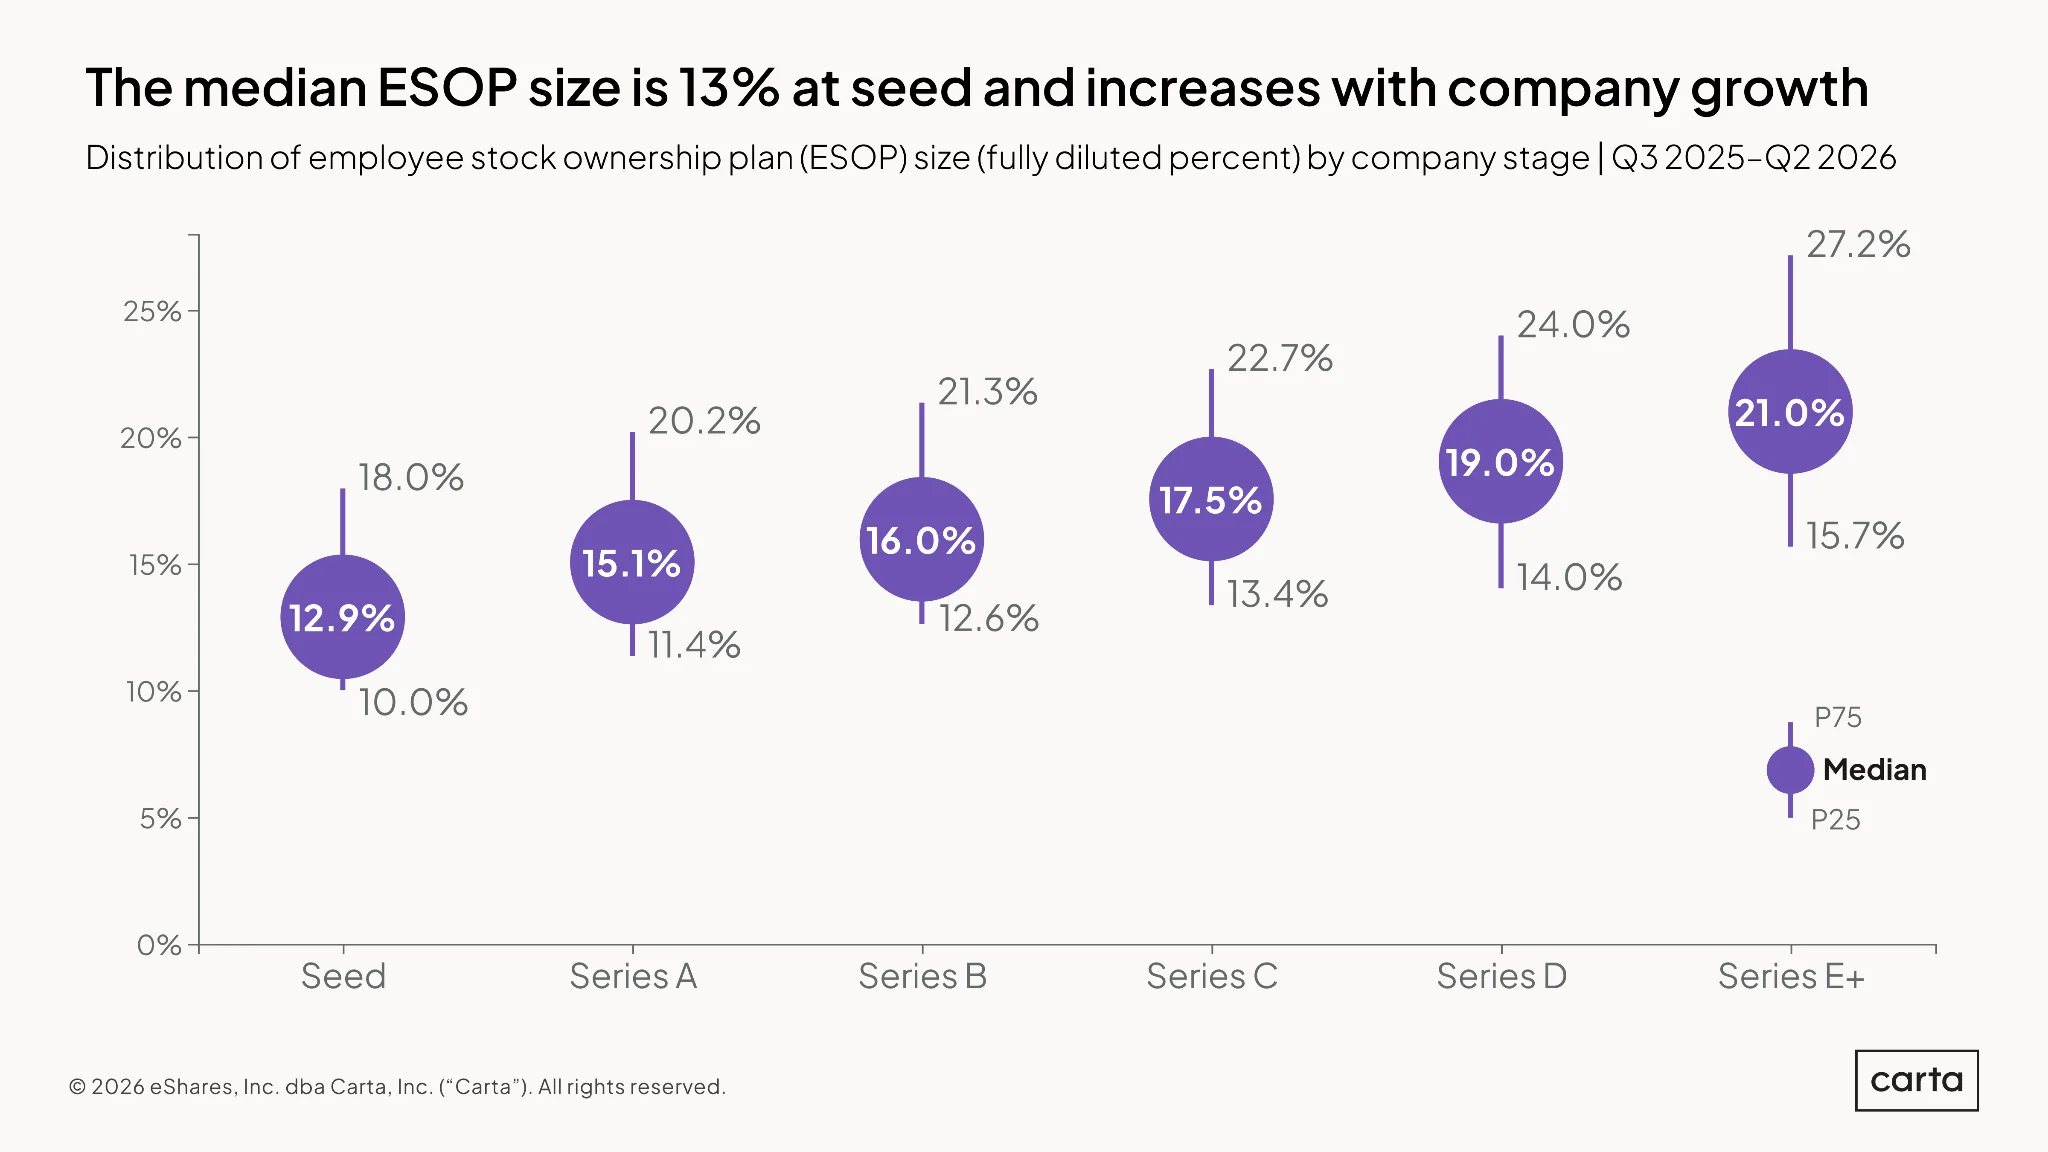
With each new round of venture fundraising, the typical startup increases the size of its employee stock ownership plan (ESOP) by somewhere between one and two percentage points of total company equity.
The biggest increase comes between the seed stage, where the median startup devotes 12.9% of its fully diluted equity to its ESOP, and Series A, where median ESOP size grows to 15.1%. At most stages, the gap between the median ESOP size and the 75th percentile is a little larger than the gap between the median and the 25th percentile. In other words, the distribution of ESOP sizes at a given stage is usually slightly right-tailed, with more variability among figures on the high end of the sample.
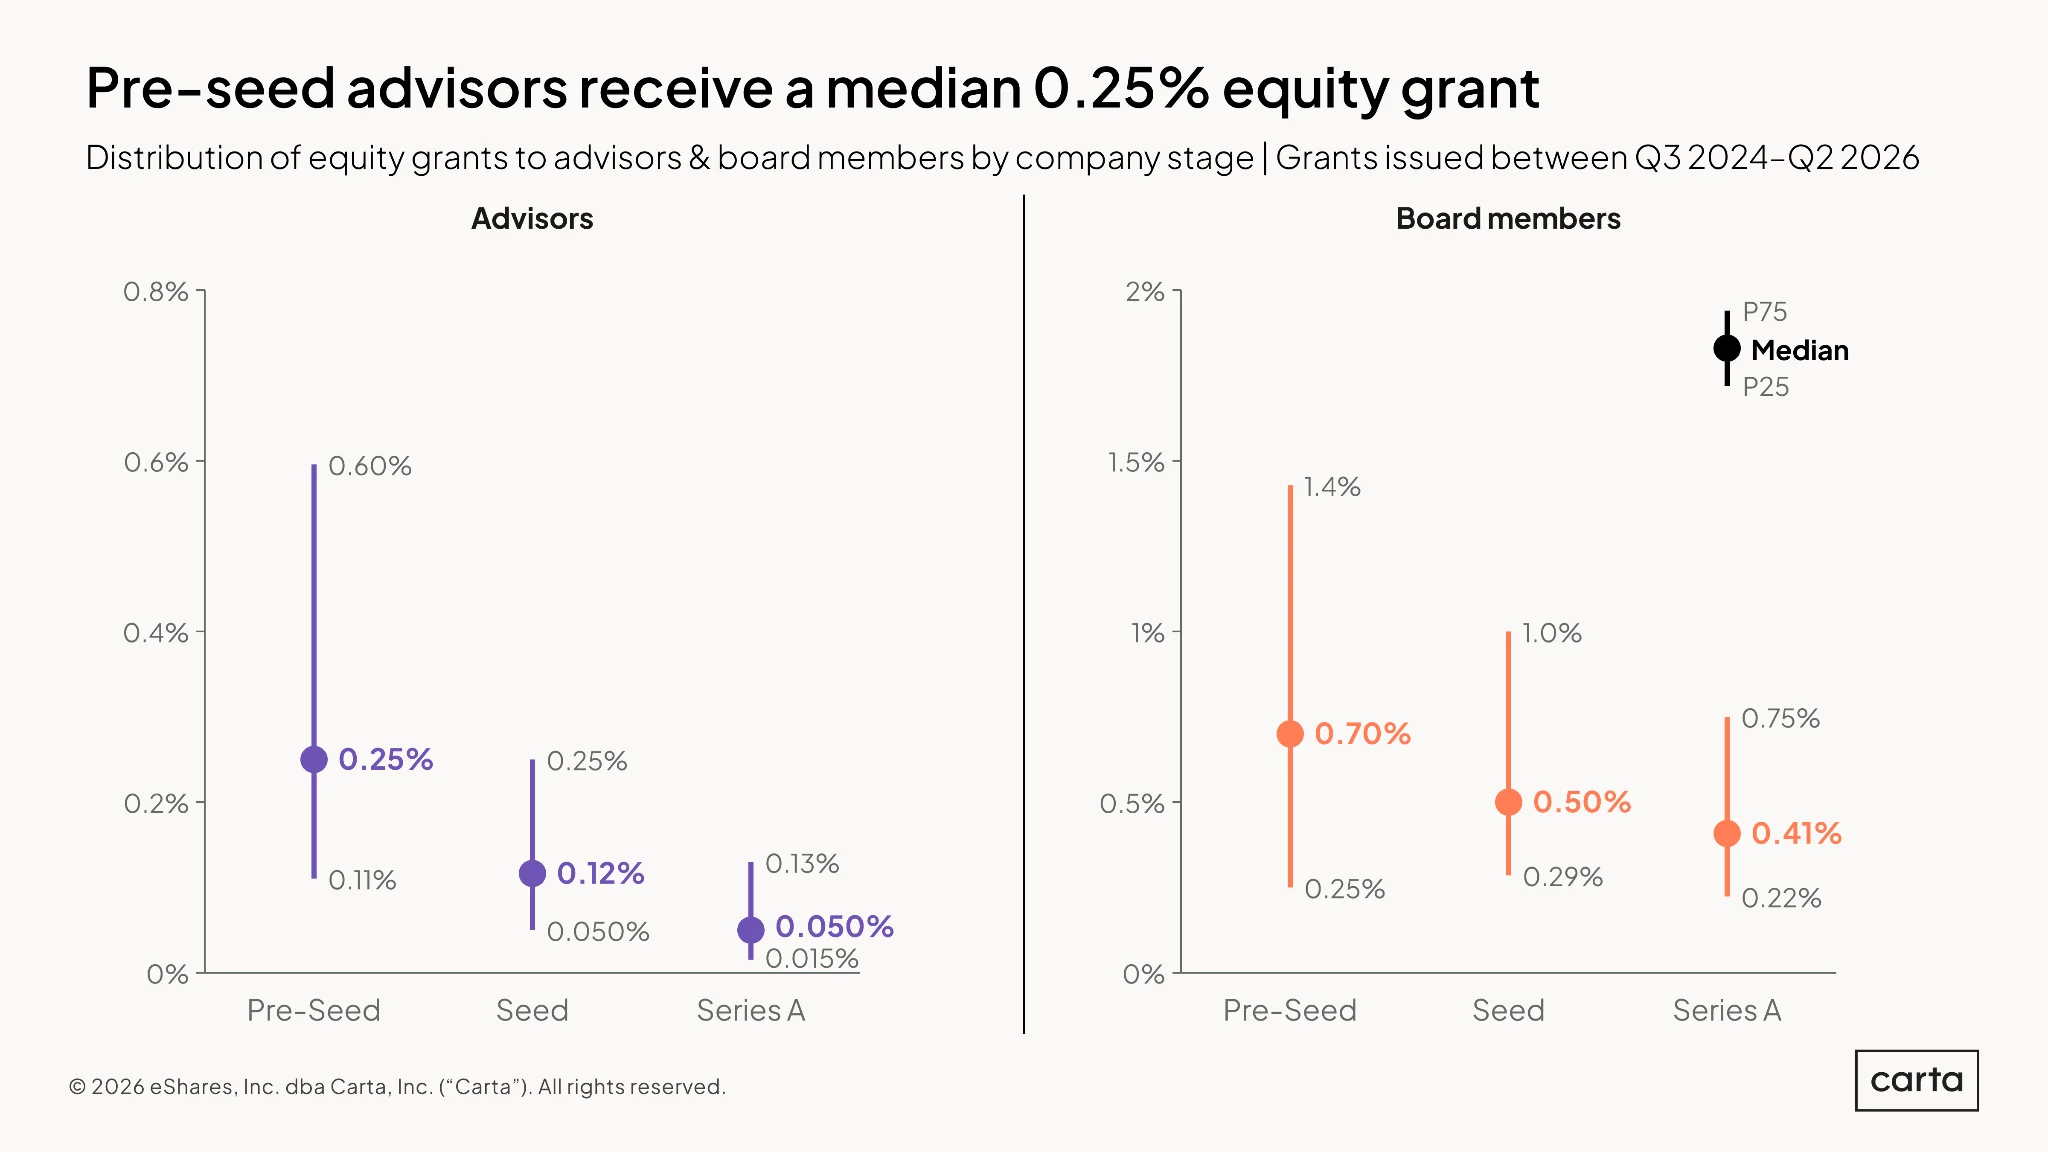
The median advisor who receives equity at a pre-seed company is granted 0.25% of company equity. That figure is just about halved for the median advisor at seed, then halved again for advisors at Series A. Regardless of stage, most grants issued to advisors fall well below the 1% threshold.
Board members tend to receive more equity than advisors, and company maturity also tends to have a smaller impact on the amount of equity they receive. At pre-seed and seed, it’s not uncommon for board members to receive 1% or more of company equity.
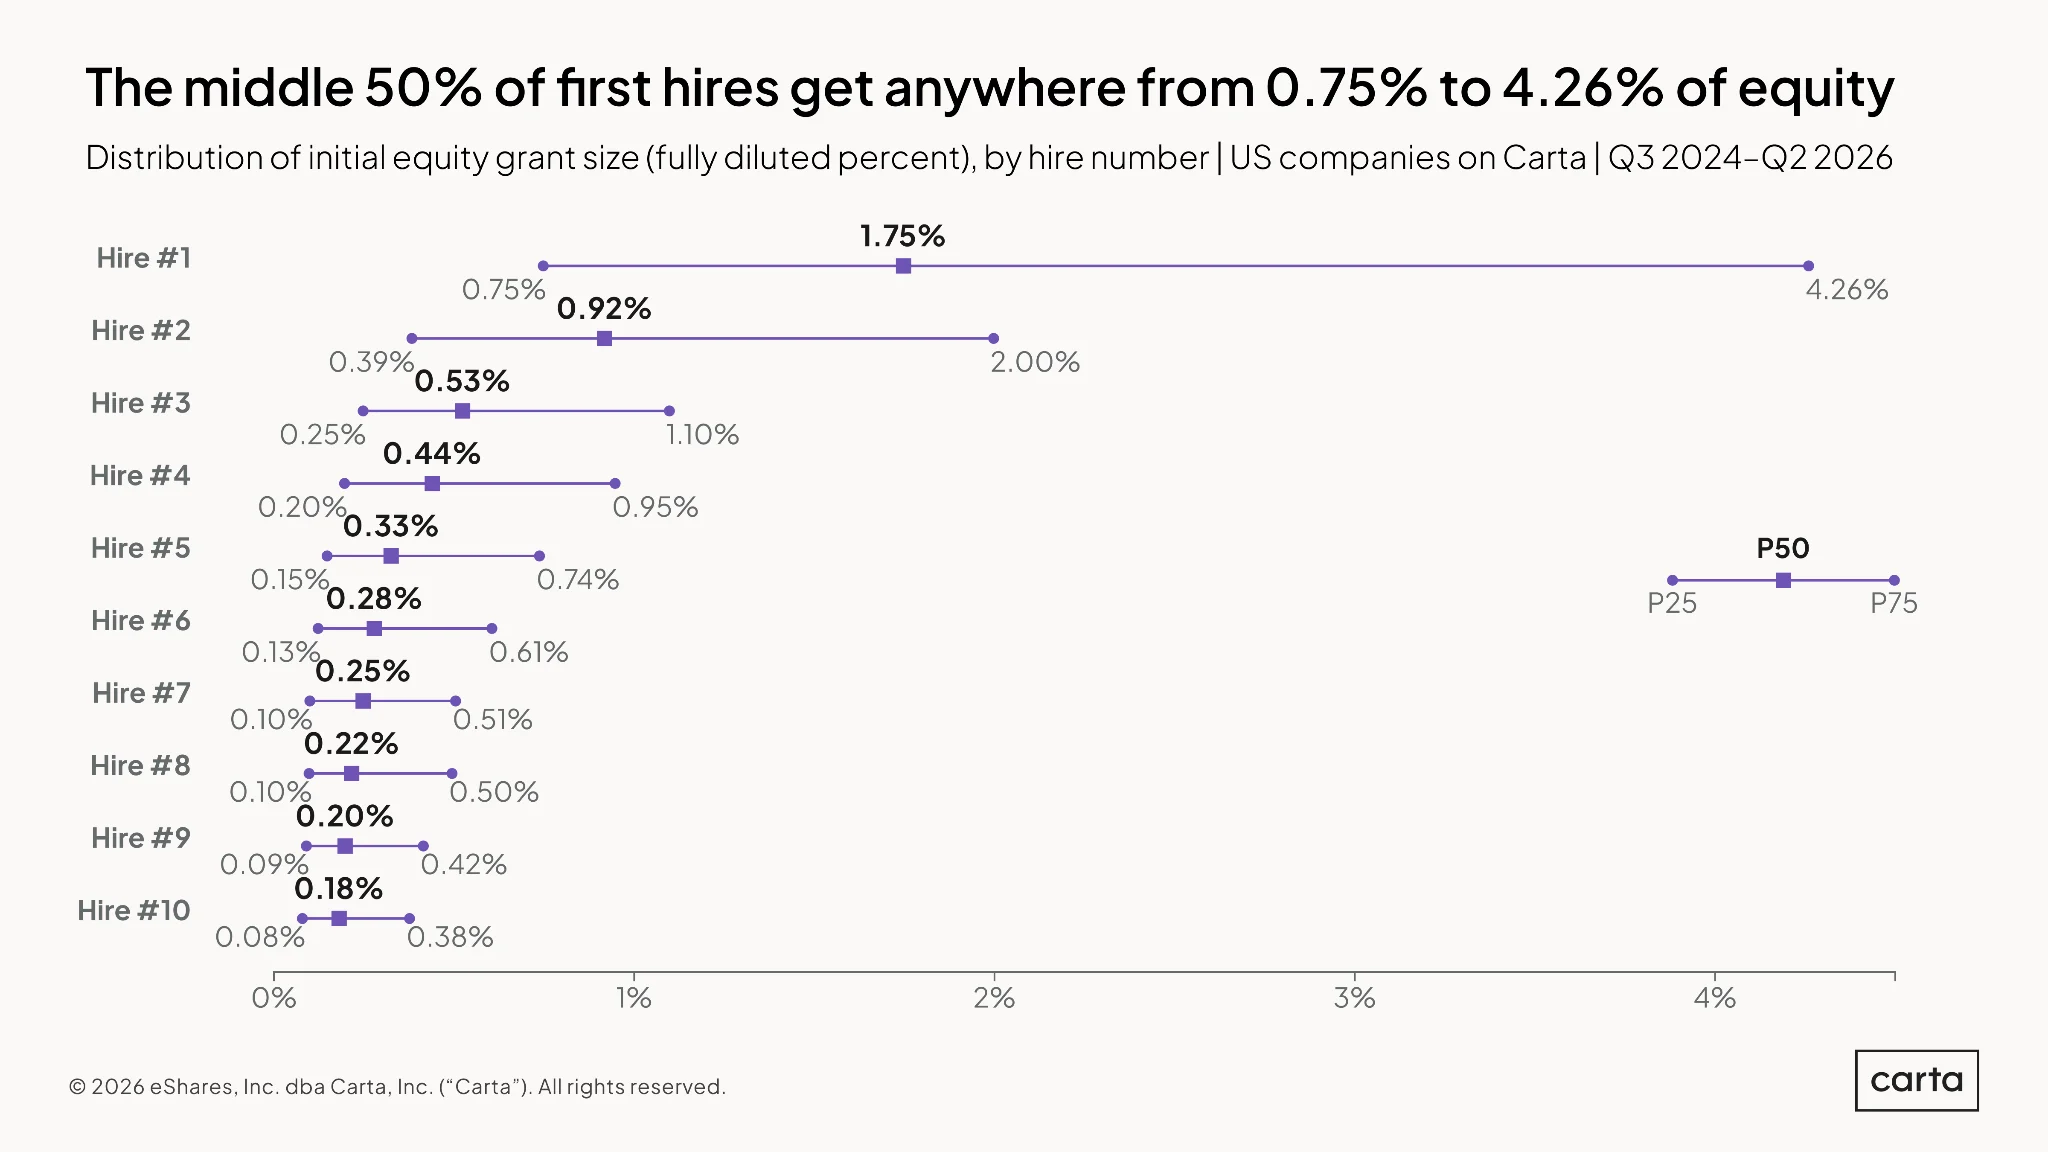
The first hire at a startup typically receives more than 1% of the company’s equity in their initial grant. In some cases, far more. The median initial grant size to first hire comprises 1.75% of company equity, while at the 75th percentile, that figure climbs all the way to 4.26%.
From there, the median sizes of initial equity packages decline at a roughly exponential rate. For hires eight, nine, and 10 at a startup, median initial grant sizes differ by only a couple basis points.
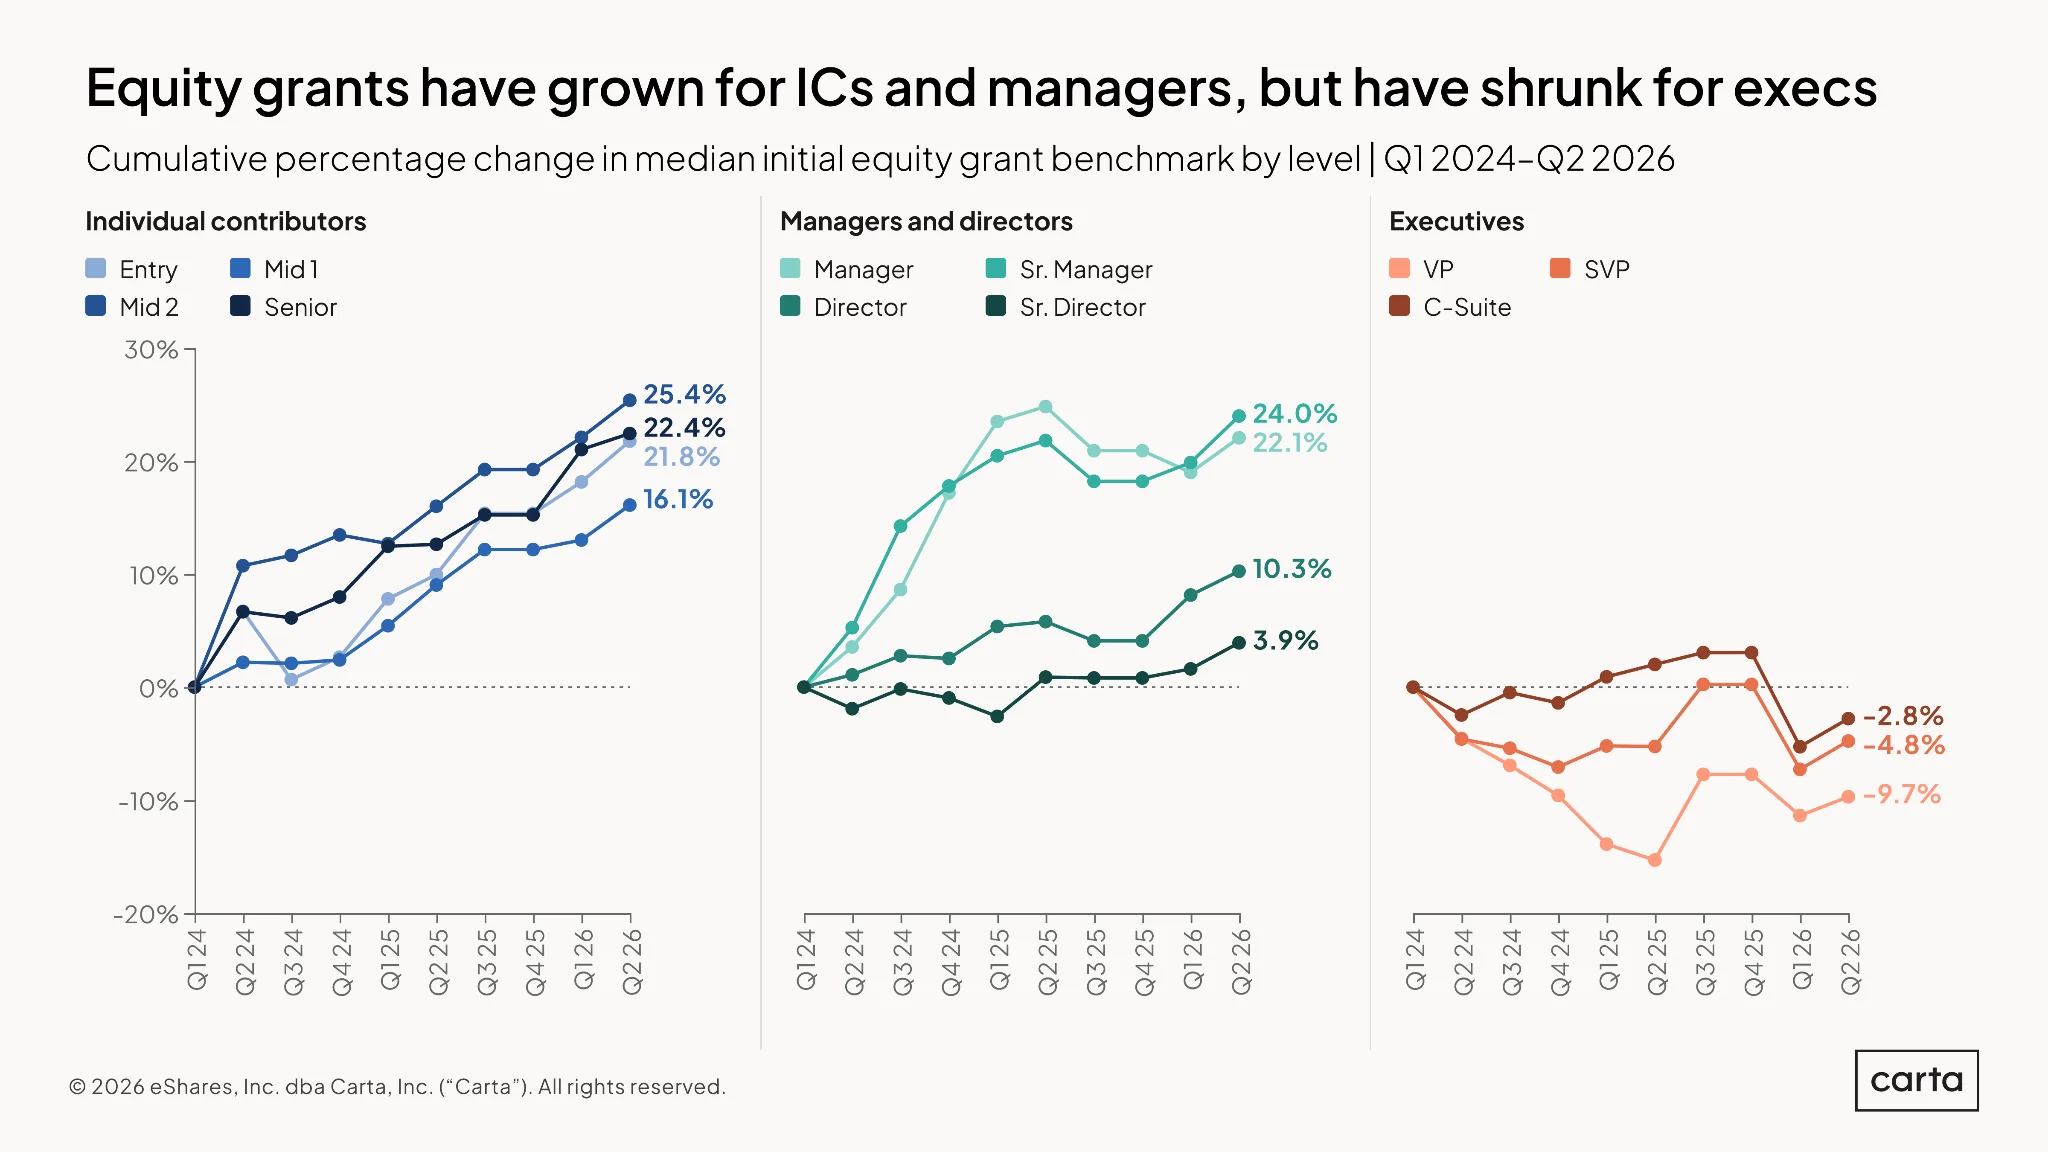
Compared to Q1 2024, the median initial equity package granted to upper mid-level ICs (defined as Mid 2 in the above chart) has gotten 25.4% bigger. Over that same period, the median initial grant issued to VPs has gotten 9.7% smaller.
In terms of initial grant size, these two figures represent a divergence over the past two and a half years between the lower and upper levels of the org chart. From entry-level ICs up through senior managers, every job level has seen median grant size increase by at least 16%. For senior directors on up, equity grants at every level have grown by 3.9% or less. The only position in the middle? Directors, who have seen median grant size climb by 10.3% over this span.
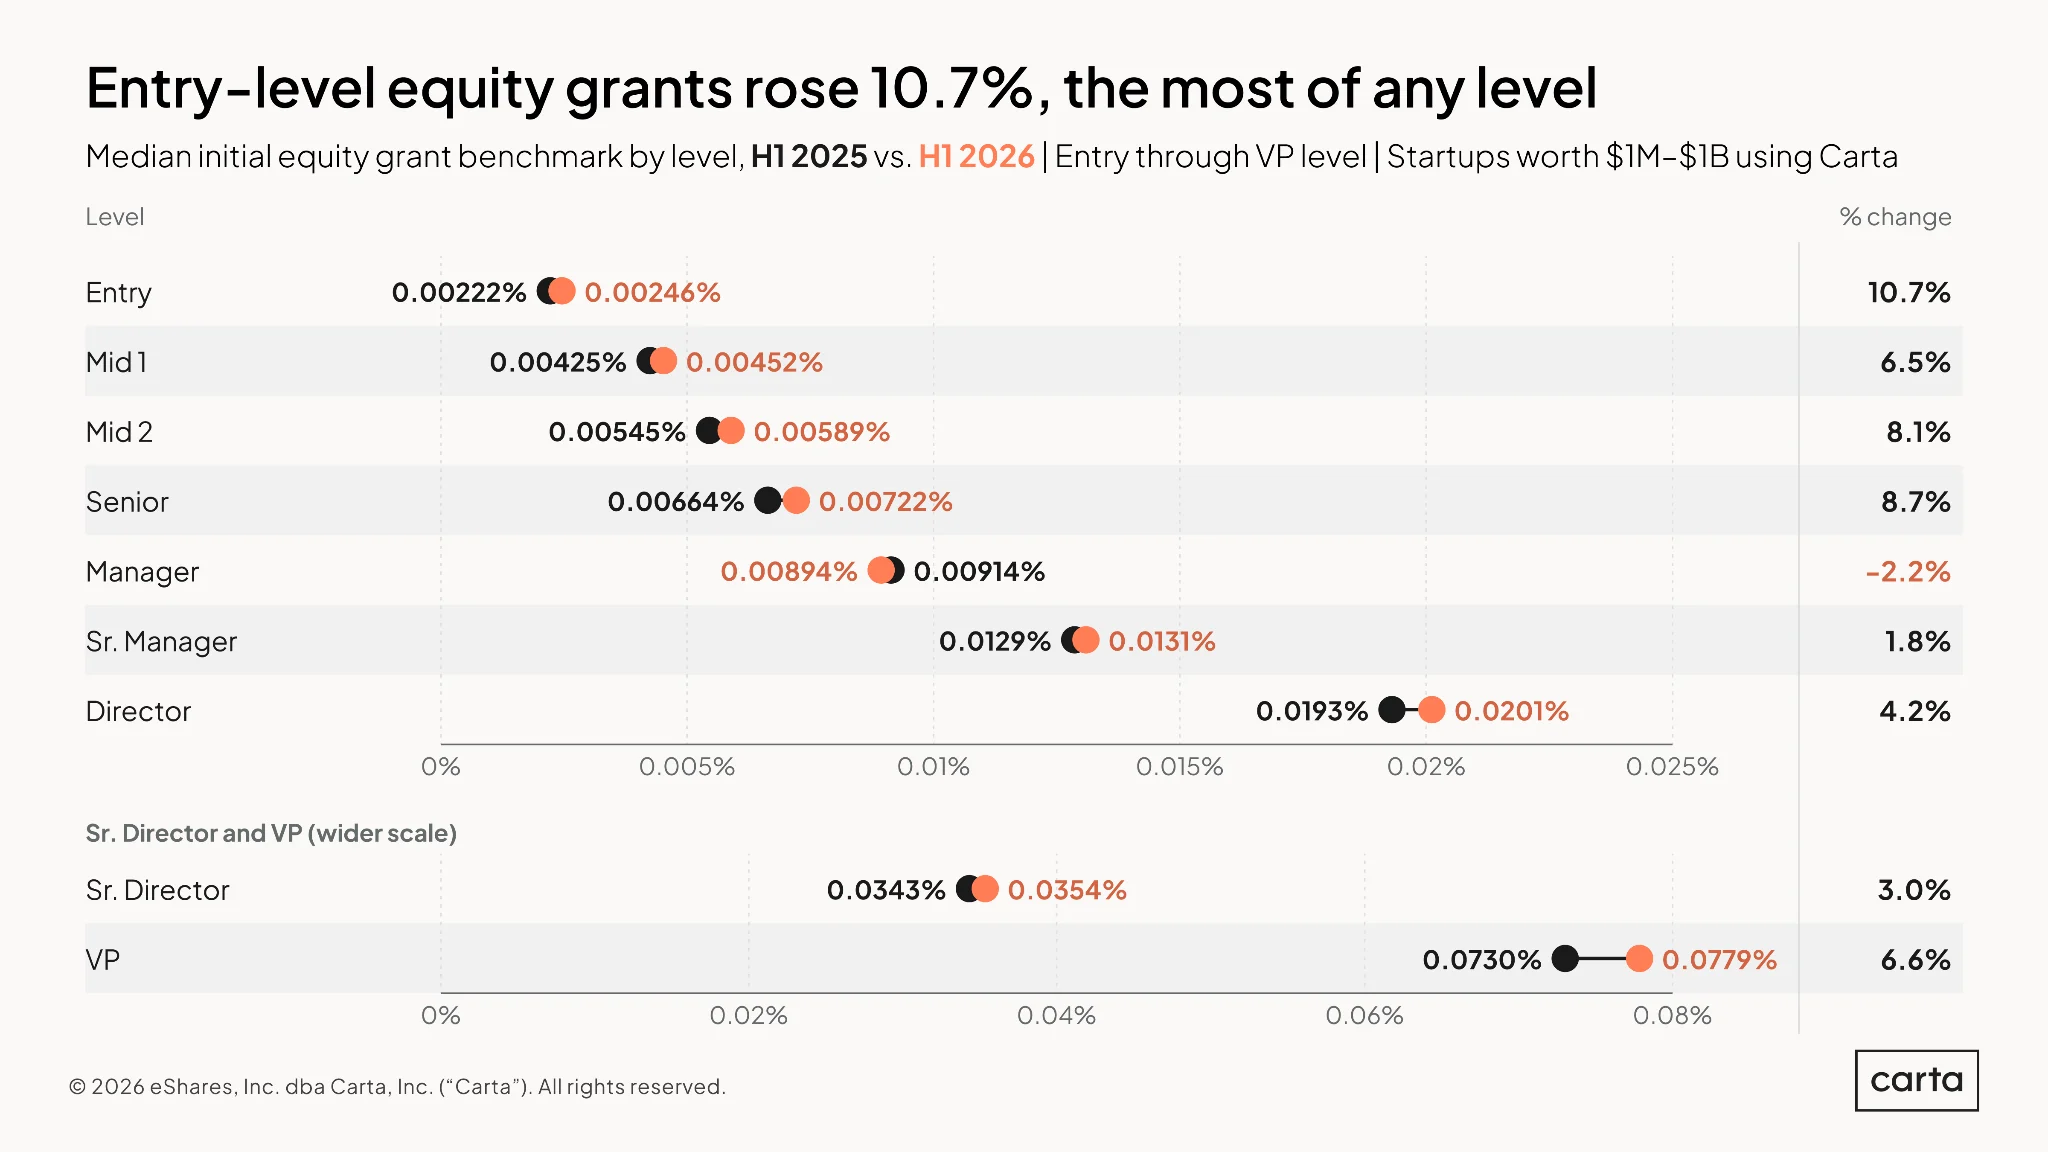
Looking just at the past year, the largest change in equity grant sizes occurred among entry-level ICs, who saw the median initial grant increase by 10.7%. Again, it’s been ICs in general who have experienced the biggest gains.
Median grant sizes at the middle-management level, on the other hand, have not grown at so robust a clip. Managers were the only group that experienced a decline in their initial equity grant size from H1 2025 to H1 2026, with the median grant shrinking by 2.2%.
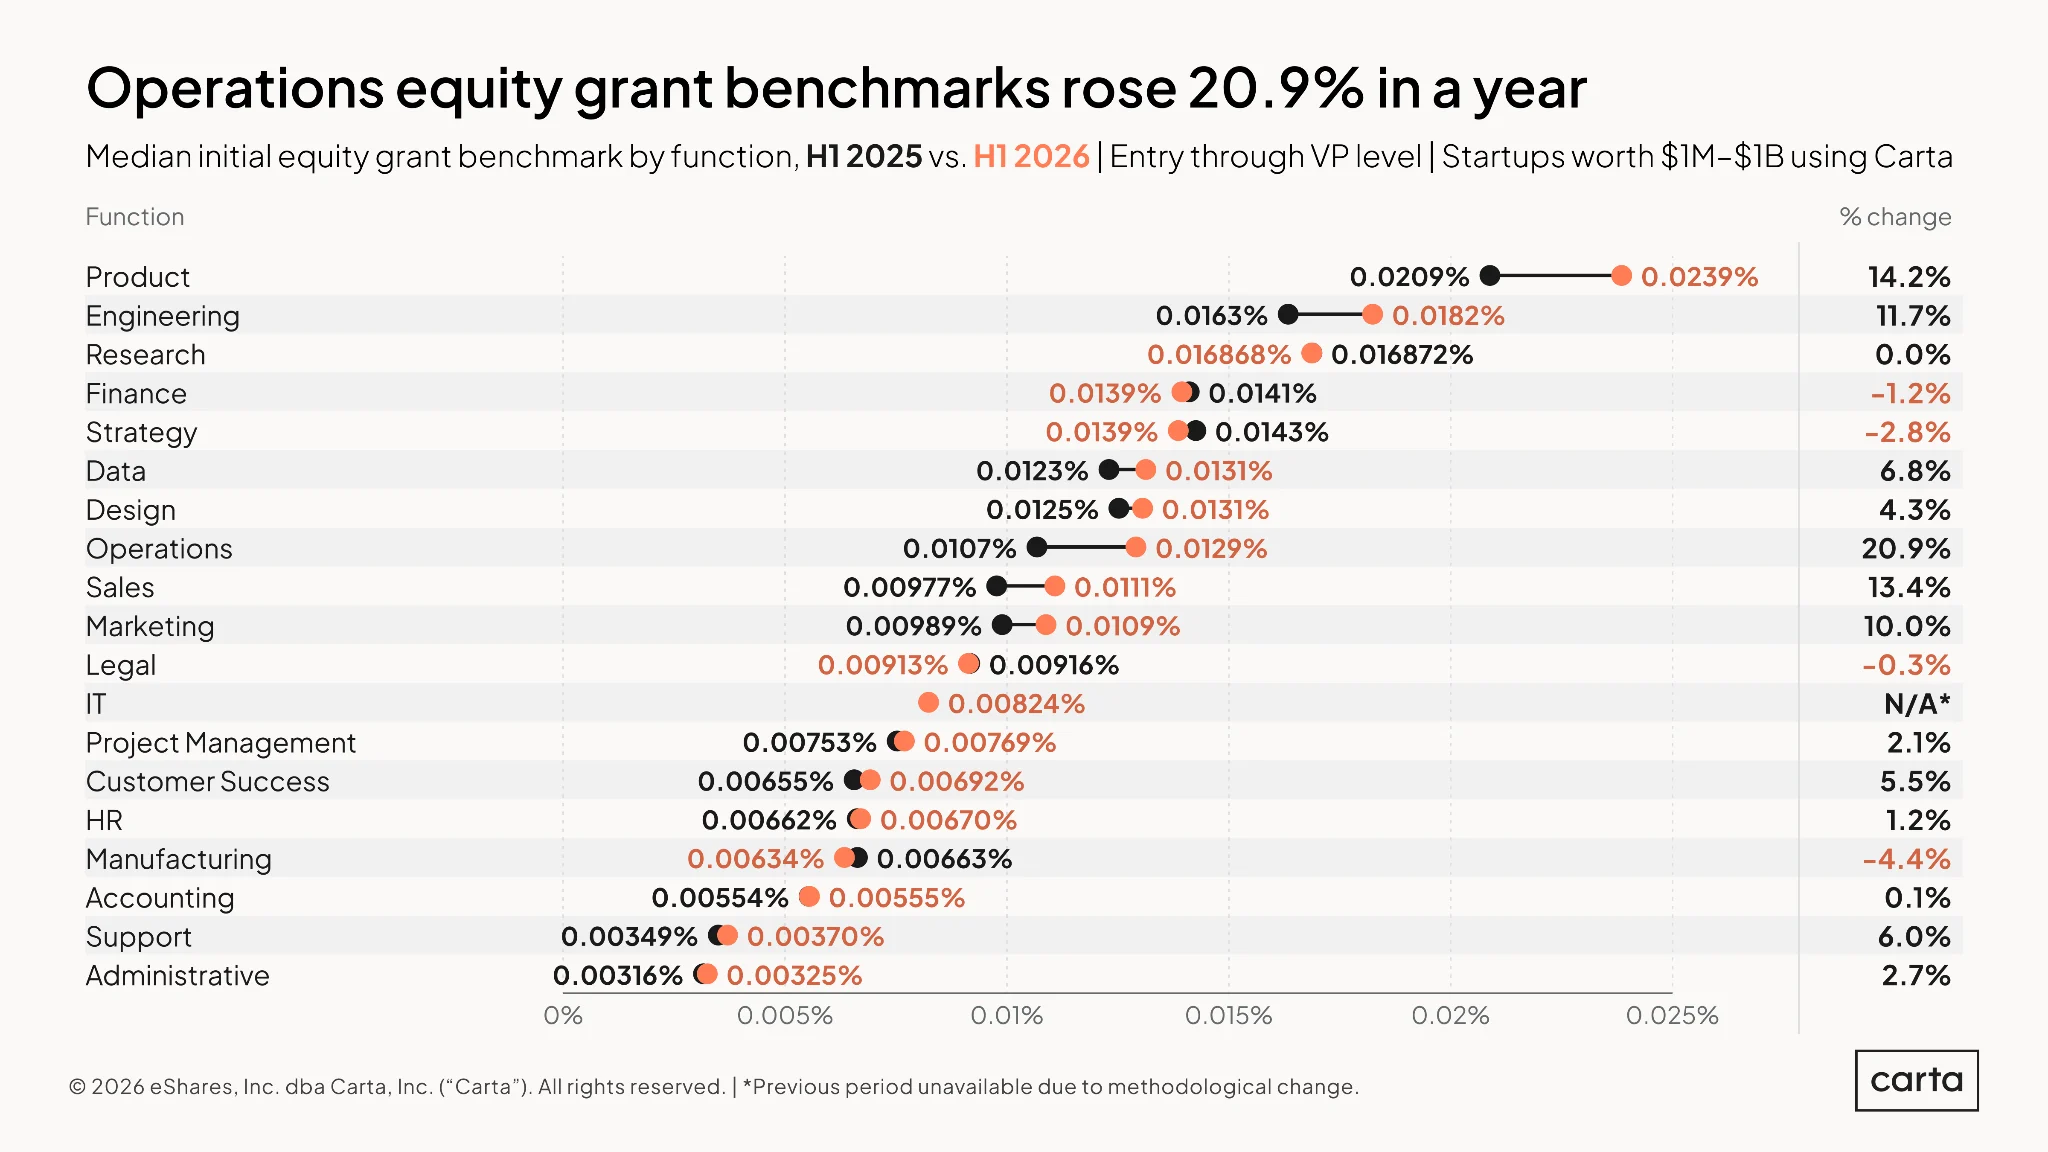
Some of the job functions that typically received the largest initial equity grants to begin with have also seen some of the biggest gains in grant size over the past year, with the product and engineering functions both experiencing double-digit gains in median grant size from H1 2025 to H1 2026. But the greatest growth over the past year was in operations, where median initial grant size surged by 20.9% over the past year.
Other traditionally well-compensated functions have seen grant sizes shrink. In finance, the median initial grant size was 1.2% smaller in H1 2026 than in H1 2025, while the strategy function experienced a 2.8% decline.
The spectrum of initial equity grants across functions is wide: A median new hire in product in H1 2026 received roughly seven times more equity than a median new administrative hire.
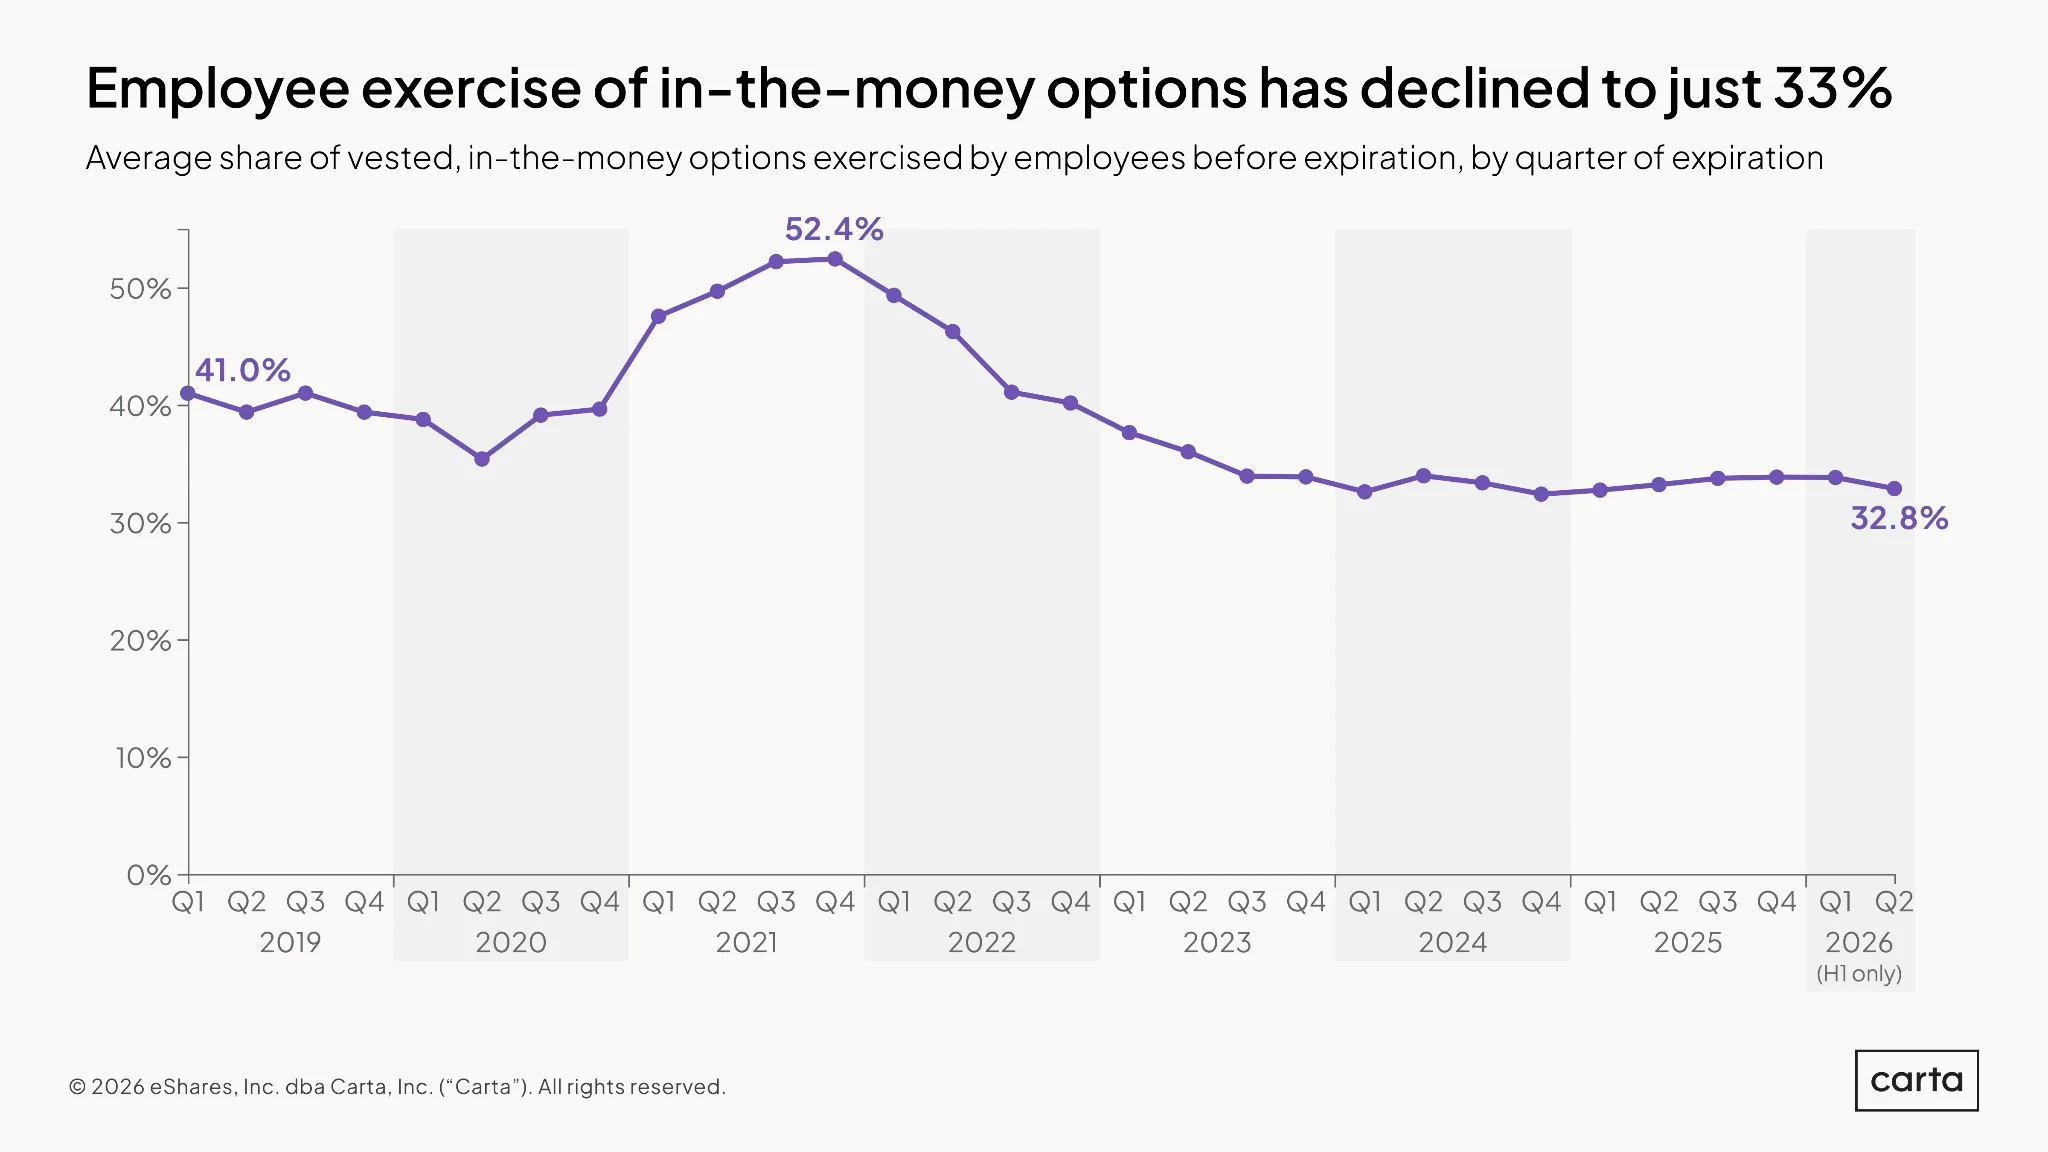
The percentage of vested, in-the-money stock options that employees are choosing to exercise has once again started to decline in 2026. This has been the overall trend ever since the peak of the pandemic bull market in late 2021, but in 2025, there were signs of a reversal, with the exercise rate stabilizing and starting to inch back up. Now, those meager gains are vanishing.
Several variables can influence an employee’s decision of whether or not to exercise in-the-money options before they expire, including the company’s valuation, the exercise price, the amount of cash an employee has to spend on exercising, and their confidence in the company’s future stock performance. Due to some combination of these factors and others, employees are less likely to exercise options today than they were in the pre-COVID era.
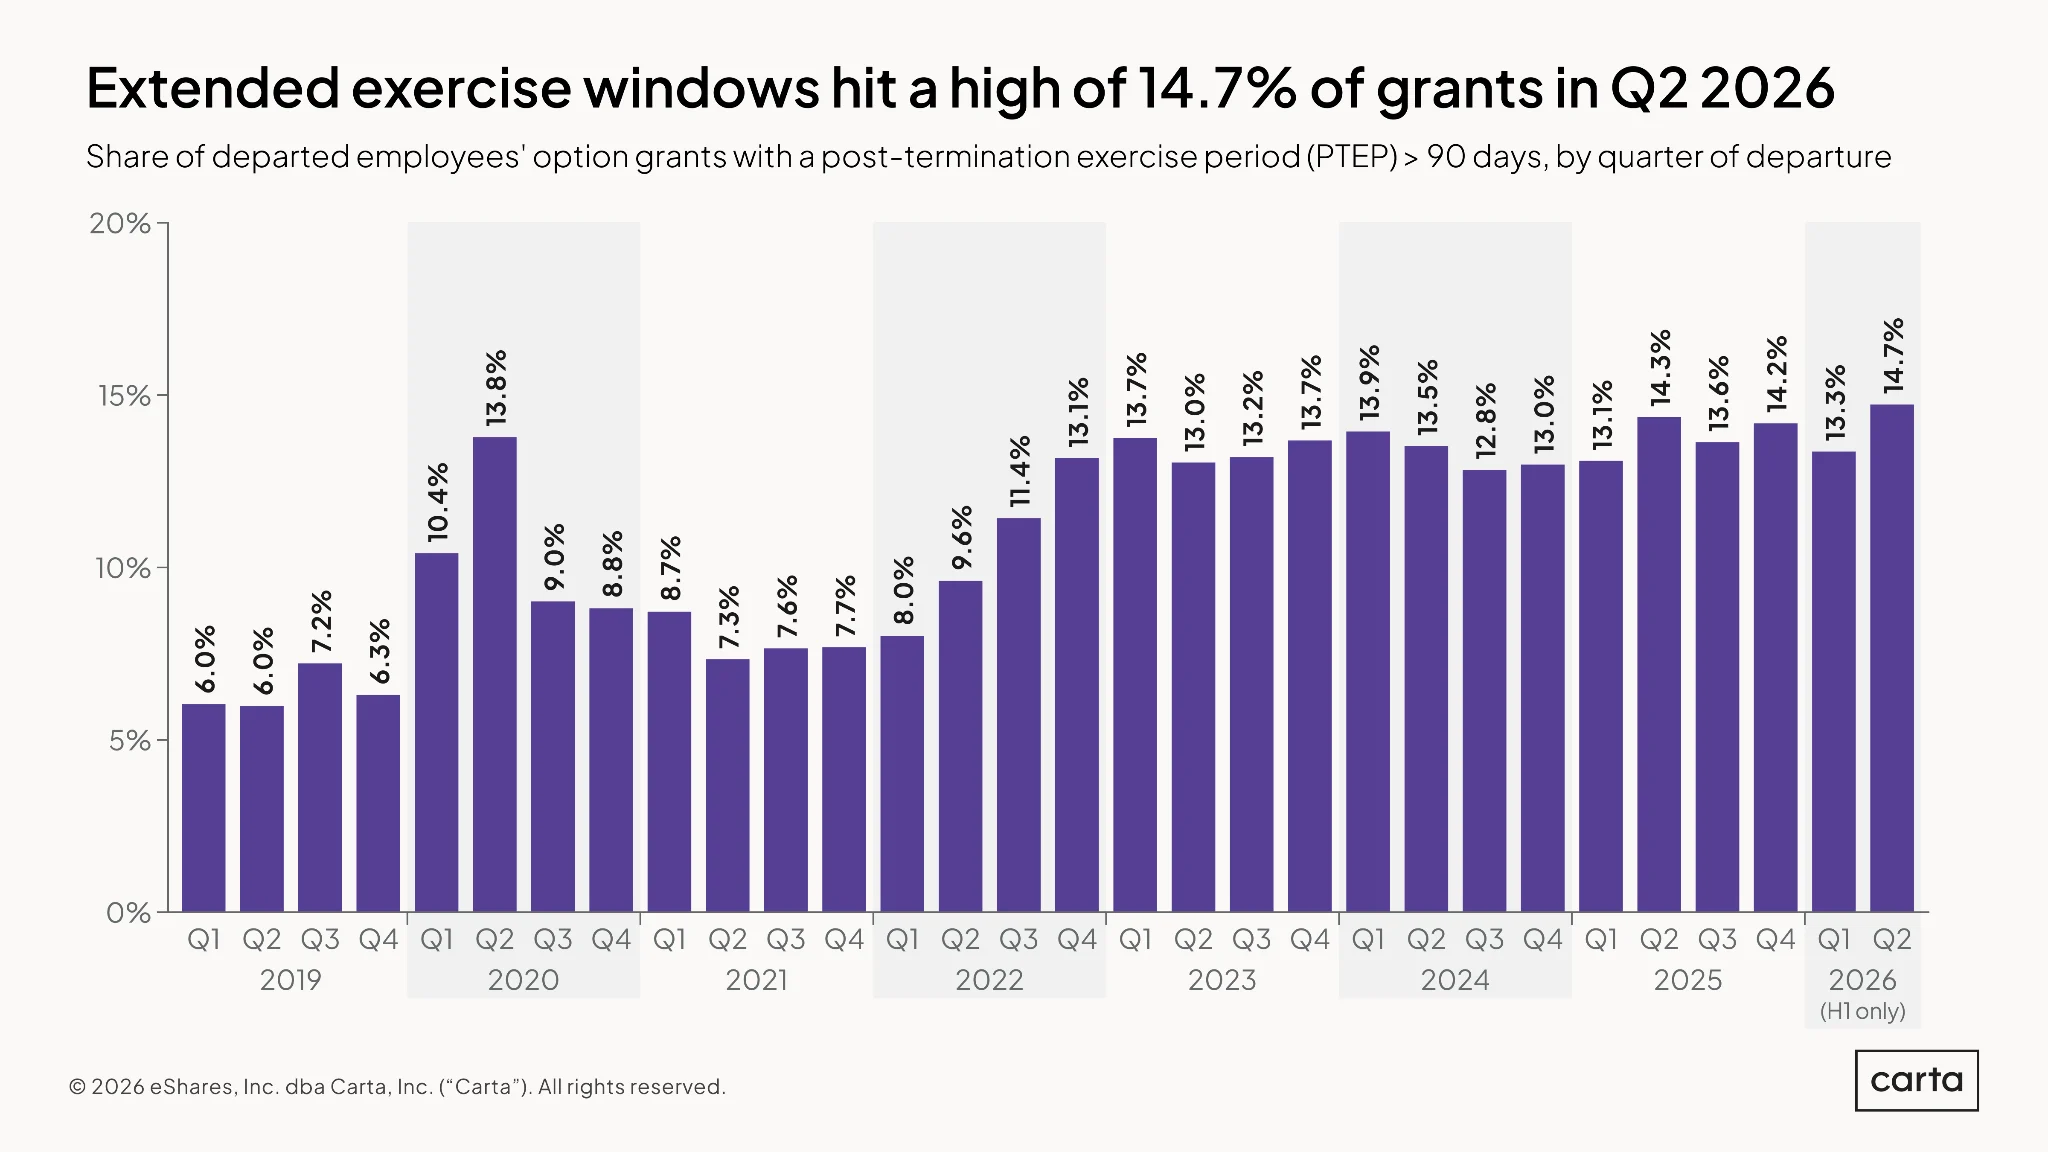
Over most of the past four years, the percentage of option grants held by departed employees that receive a post-termination exercise period (PTEP) longer than 90 days has held quite steady from one quarter to the next, typically landing between 13% and 14.5%. In Q2 2026, however, this rate ticked upward to 14.7%, the highest it’s been at any point in the 2020s.
Historically, a higher rate of extended PTEPs correlated with a higher layoff rate—when more employees were losing their jobs, employers were more likely to extend the typical PTEP window. In more recent years, though, this correlation has grown weaker: Layoff frequencies have declined in recent years, but the rate of extended PTEP has inched up. This could be due in part to a general shift in attitude among startup decision-makers toward a more generous view of how post-termination equity should be treated.
Methodology
Carta helps more than 50,000 primarily venture-backed companies and 1.7 million security holders manage over $4.5 trillion in equity. We share insights from this unmatched dataset about the private markets and venture ecosystem to help founders, employees, and investors make informed decisions and understand market conditions.
Overview
This study uses an aggregated and anonymized sample of Carta customer data. Companies that have contractually requested that we not use their data in anonymized and aggregated studies are not included in this analysis.
This report represents a snapshot as of October 26, 2026. Historical data may change in future studies because there is typically an administrative lag between the time a hiring, departure, or compensation update took place and when it is recorded in Carta. In addition, new companies signing up for Carta’s services will increase historical data available for the report.
The salary and equity benchmarks in this report come from Carta Total Compensation, which draws on thousands of companies and nearly a million data points. All other analyses, including the charts on hiring, departures, tenure, option pools, and option exercise, use data from the tens of thousands of U.S. startups that use Carta to manage their equity.
Employee counts only include full-time employees who have received equity, so staff who never received a grant are not included.
Salary & equity
Salaries are expressed in U.S. dollars and do not include variable compensation such as bonuses or commissions. Equity values are expressed as a percentage of fully diluted company shares.
For both metrics, changes over time reflect updates to Carta Total Compensation benchmarks, which are refreshed several times a year using data from new hires and compensation adjustments.


DISCLOSURE: This communication is on behalf of eShares, Inc. dba Carta, Inc. ("Carta"). This communication is for informational purposes only, and contains general information only. Carta is not, by means of this communication, rendering accounting, business, financial, investment, legal, tax, or other professional advice or services. This publication is not a substitute for such professional advice or services nor should it be used as a basis for any decision or action that may affect your business or interests. Before making any decision or taking any action that may affect your business or interests, you should consult a qualified professional advisor. This communication is not intended as a recommendation, offer or solicitation for the purchase or sale of any security. Carta does not assume any liability for reliance on the information provided herein. ©2026 Carta. All rights reserved. Reproduction prohibited.