The slow but steady growth of the U.S. venture capital industry continued in the third quarter of 2025. Startups on Carta combined to raise $27.3 billion in new funding in Q3, the highest quarterly sum in the past three years.
Compared to the same period one year ago, total cash raised is up 5% in Q3. Compared to two years ago, it’s up 48%.
Venture fundraising numbers experienced a sharp decline during the significant shakeup that occurred in 2022 and early 2023, as investors and startups alike grappled with new market realities brought on by a widespread reset in tech valuations. Since then, the market has proven its resilience, with the total cash raised inching higher and higher with each new quarter.
Even as most of the market is raising at more measured levels, a notable number of very large rounds—which, in many cases, are being raised by startups on the cutting edge of AI—continue to drive much of the growth in dollars invested. These mega-checks, sometimes reaching hundreds of millions or even billions, are meaningfully influencing quarterly fundraising totals and valuation benchmarks.
The $27.3 billion in total cash raised during Q3 was distributed fairly evenly across the fundraising spectrum. About 25% of all funding raised in the quarter went to Series A investments, while Series C rounds were responsible for another 20% of cash raised. Nearly 40% of all new venture rounds in Q3 were seed investments—but those seed rounds accounted for just 9.4% of cash raised.
In terms of sectors, the SaaS space remains dominant. Software startups on Carta brought in $8.98 billion in new funding in Q3, nearly twice as much as any other sector. Hardware ranked second, at $4.52 billion. In Q3, those two sectors alone combined to account for nearly half of all venture funding raised.
Q3 highlights
Early-stage valuations keep rising: The median pre-money valuation on new primary seed rounds on Carta rose to a new high of $16 million in Q3, an increase of 14% from the same period last year. The median pre-money valuation at Series A also climbed to its highest point ever in Q3, landing at $49.3 million.
Down rounds are growing less frequent: About 17% of all new venture rounds in Q3 were down rounds, the lowest quarterly rate of down rounds in nearly three years. From Q2 2023 through Q1 2025, the down-round rate was higher than 20% in seven out of eight quarters.
The Bay Area still reigns supreme: Startups on Carta that are based in the San Francisco metropolitan area combined to bring in $8.1 billion in new venture funding in Q3, up more than 100% from the same period two years ago. Thanks in no small part to the city’s central role in the AI industry, San Francisco was home to more venture fundraising in Q3 than the New York, Boston, and Los Angeles metros combined.
Key trends
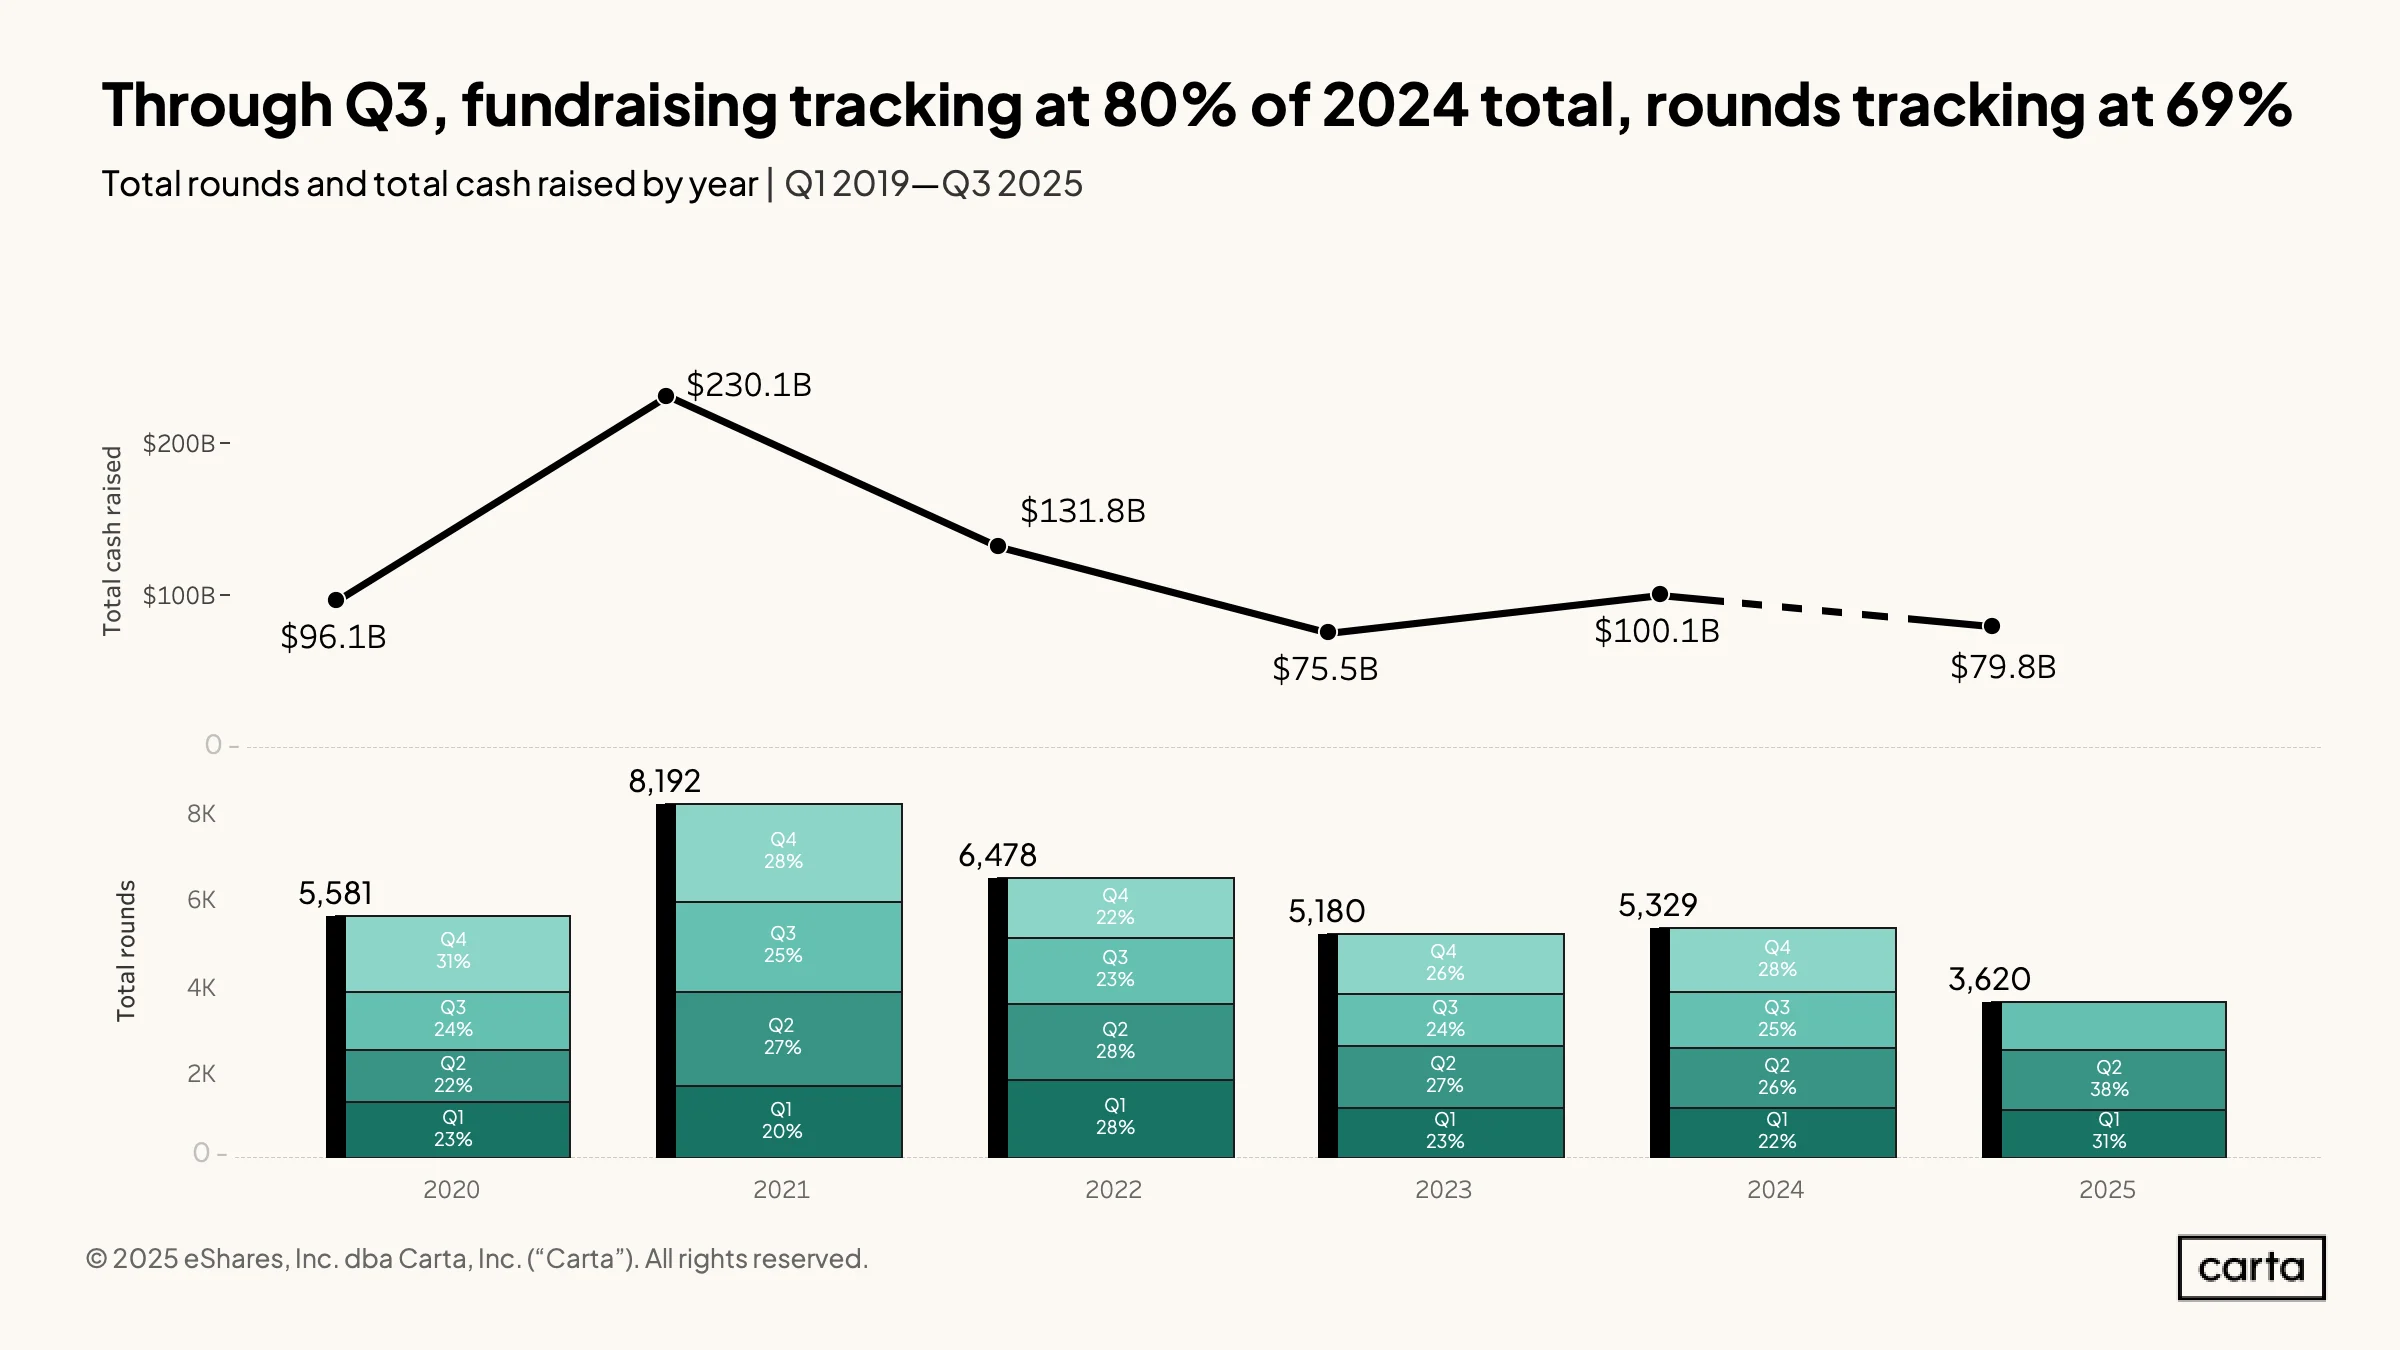
Through the first three quarters of the year, startups on Carta combined to raise $79.8 billion in new funding. That’s about 80% of the total venture funding raised during 2024, meaning this year’s market is on pace to surpass last year’s fundraising total. Startups have already raised more new capital in the first nine months of 2025 than they did during the full year of 2023.
That $79.8 billion in funding through Q3 2025 was spread across 3,620 venture rounds, lagging slightly behind the dealmaking pace of the previous two years. This combination of more capital raised across fewer rounds means the average venture funding in 2025 has been slightly larger than in 2024.
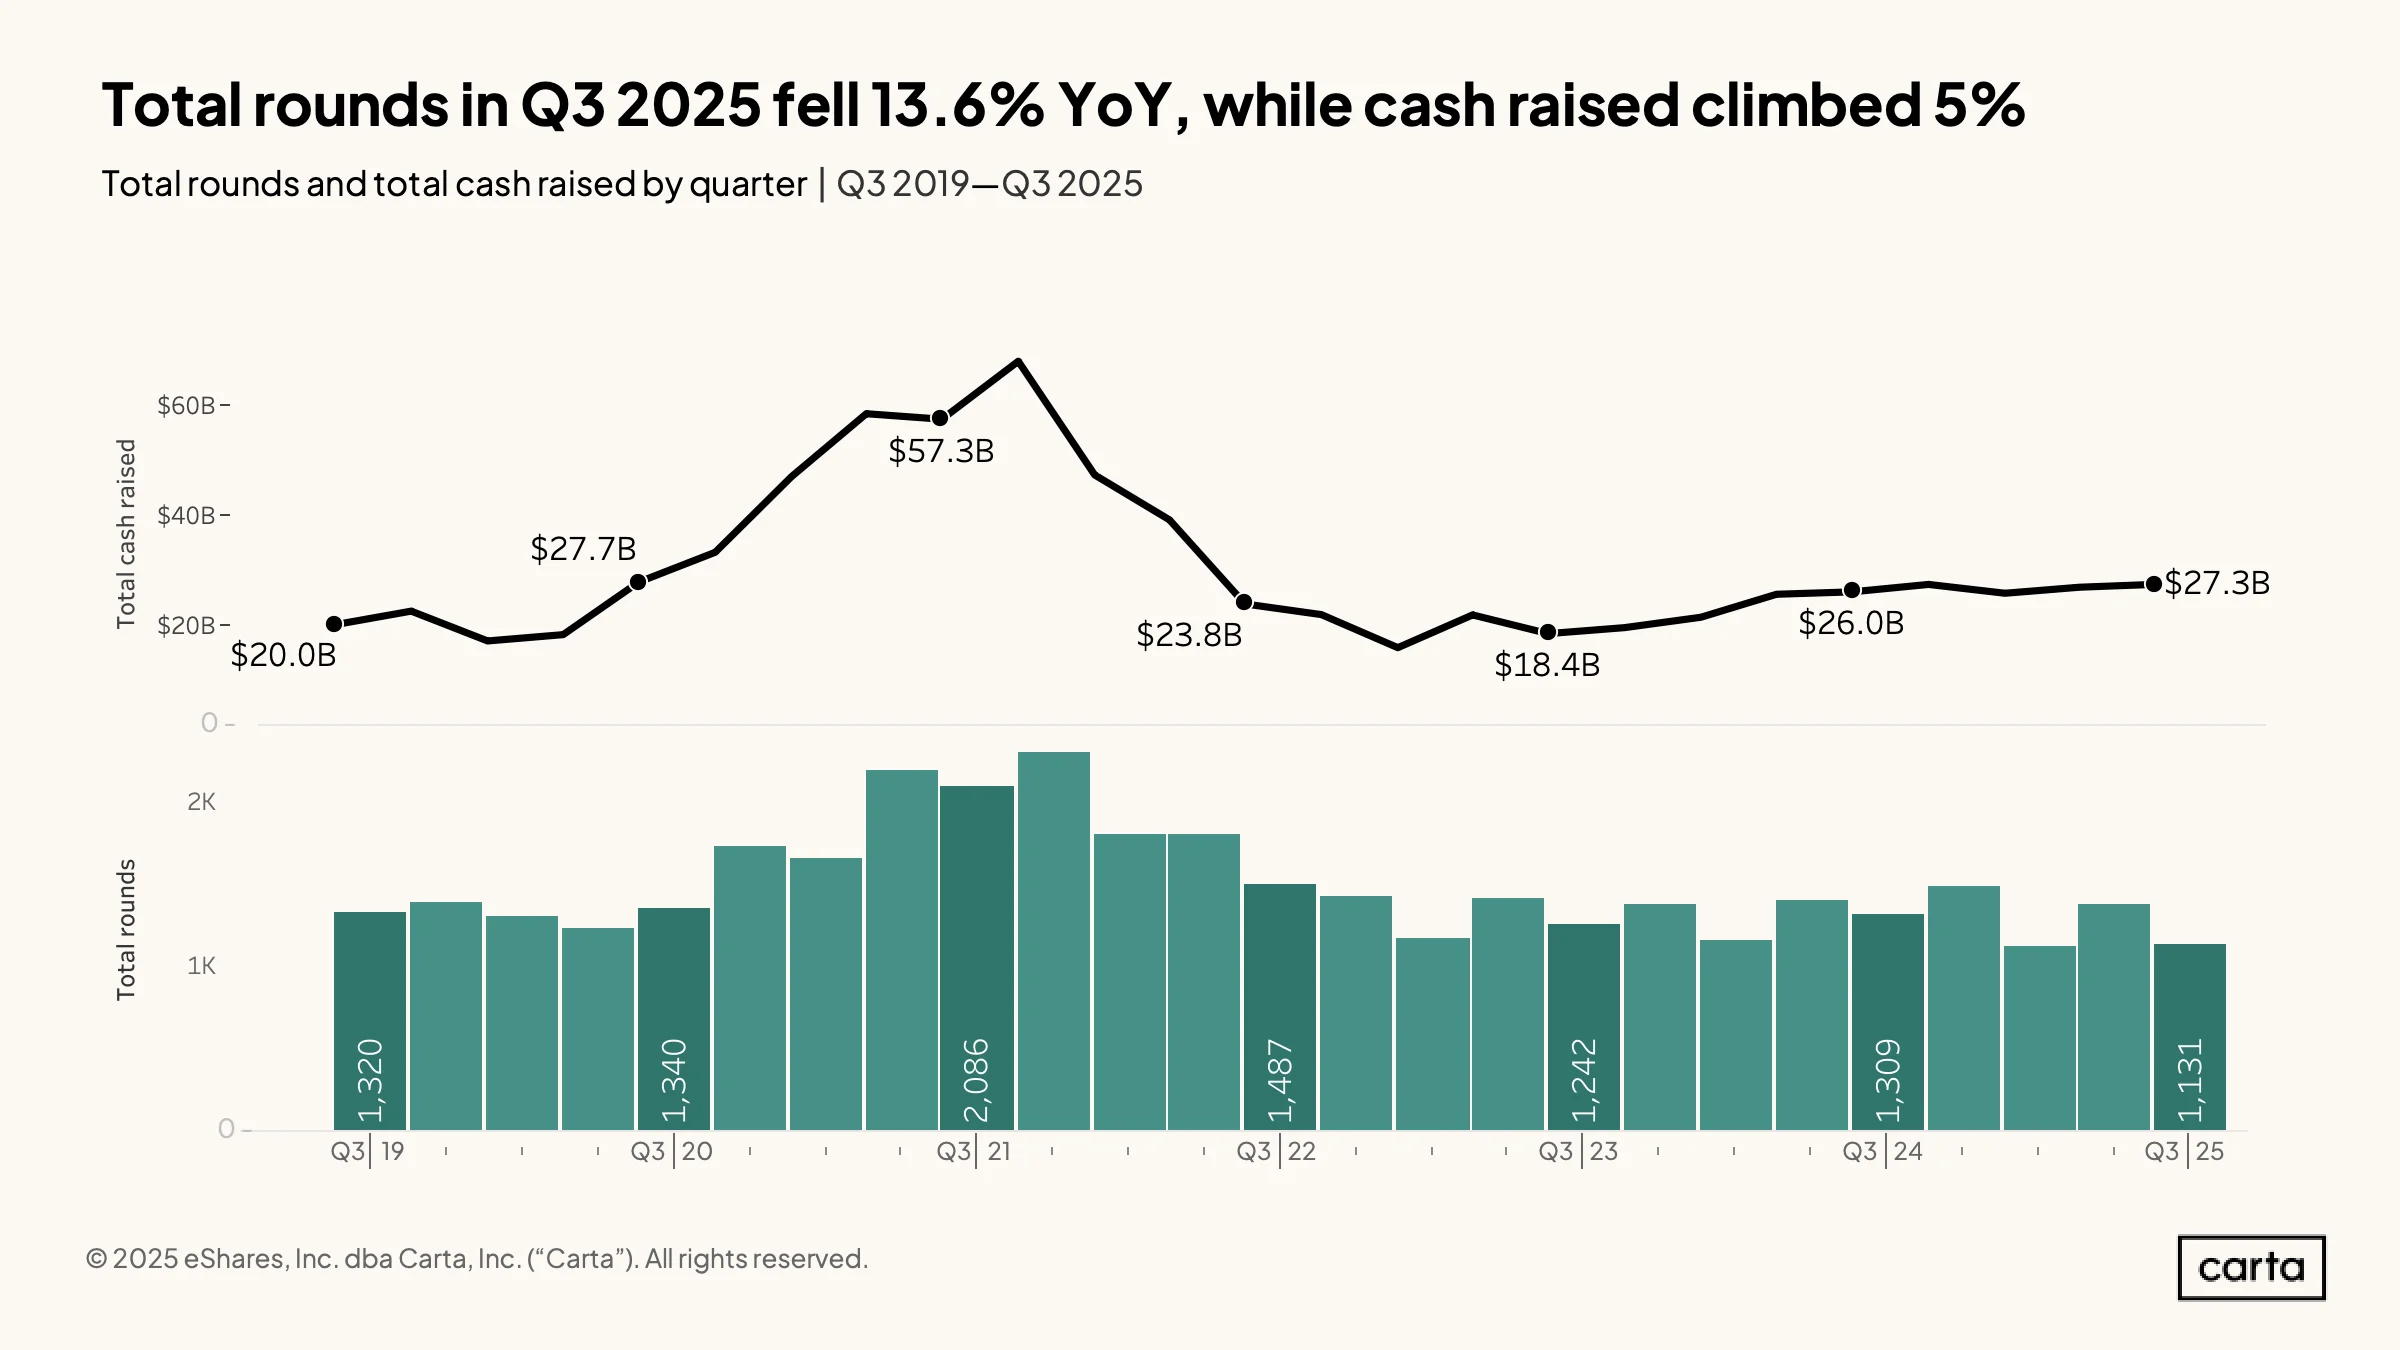
For the past two years, quarterly totals for cash raised by startups on Carta have been steadily trending up. Companies combined to bring in $27.3 billion in Q3, a 5% increase year over year and a 48% increase compared to the same period two years ago.
The number of new rounds, however, continues to fall, with just 1,131 new funding events in Q3. That number may continue to rise as more funding events are logged on the Carta platform, but for now, Q3 was the second-slowest quarter for dealmaking in the past six years. The only quarter that saw fewer transactions was Q1 2025, with 1,119 new rounds taking place.
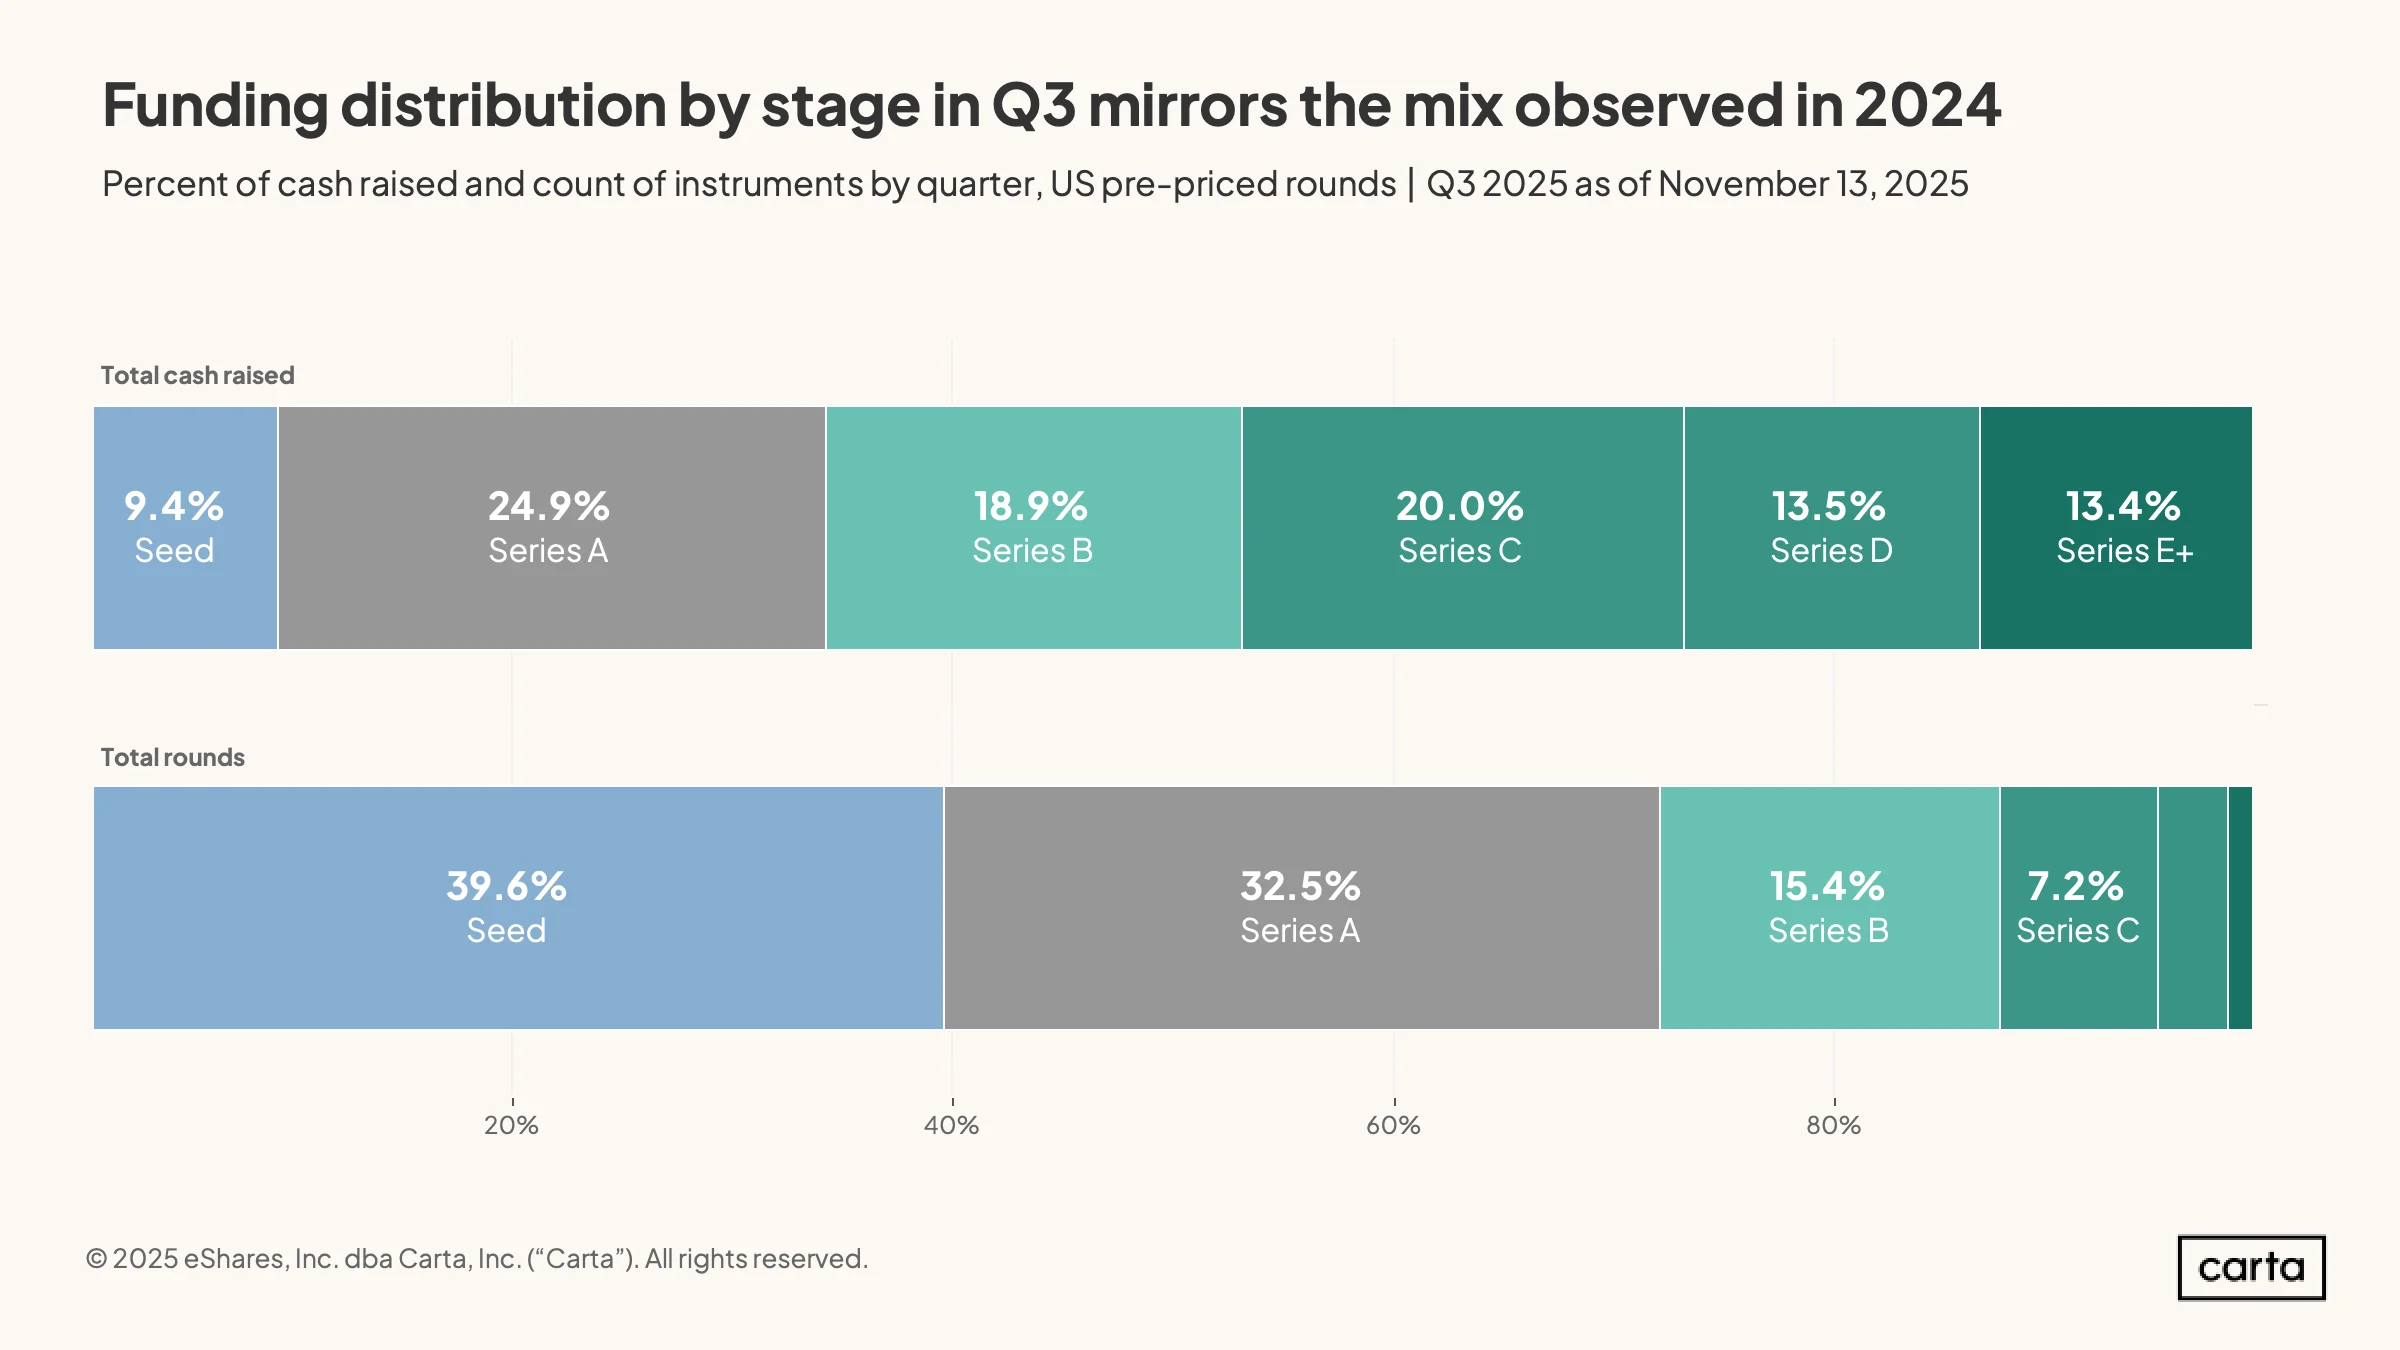
In Q3, VCs invested more capital in Series A deals (24.9%) than at any other stage, with Series C (20%) and Series B (18.9%) trailing closely behind. In total, about 63.8% of all venture capital invested last quarter went to transactions at one of these three stages.
In terms of deal count, nearly 40% of all new funding events on Carta were seed rounds. But those rounds accounted for just 9.4% of all cash raised in the quarter, reflecting the fact that seed rounds tend to be significantly smaller than later-stage financings. On the other end of the spectrum, just 2% of all new rounds in Q3 were at Series E and beyond. Yet these rounds were responsible for 13.4% of all cash raised.
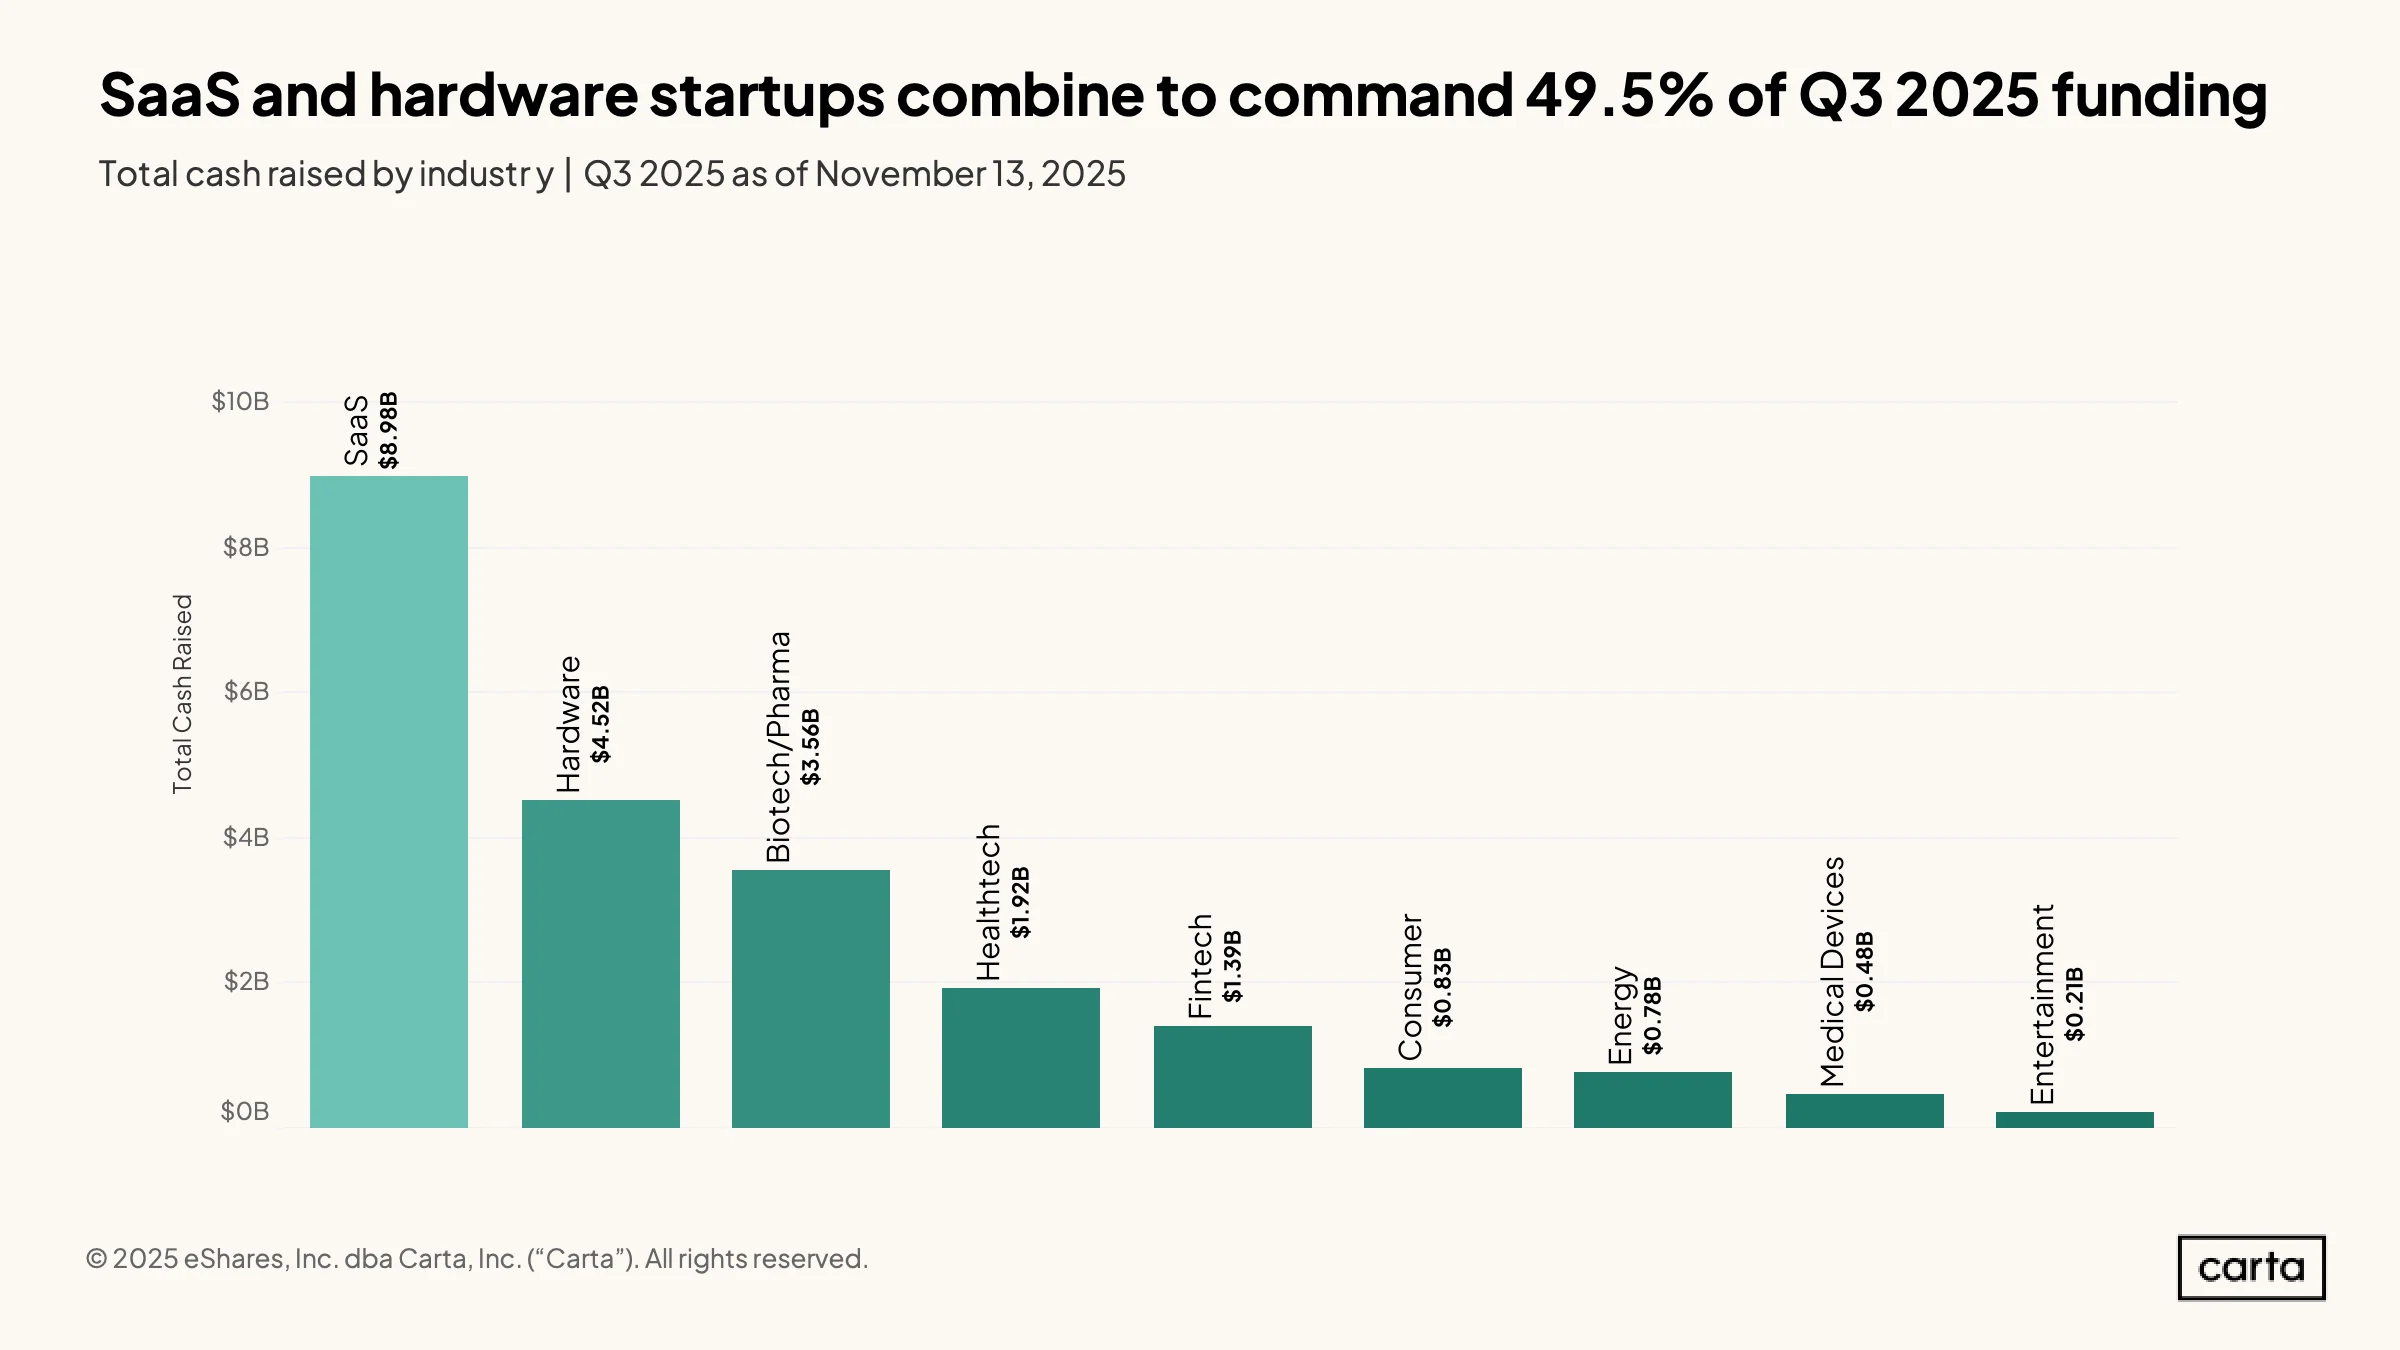
Startups in the SaaS industry combined to raise $8.98 billion in new venture funding in Q3, nearly double the amount of any other industry. Hardware was the second most popular sector for venture investment, with $4.52 billion in new capital raised, and biotech/pharmaceuticals was third, at $3.56 billion.
SaaS and hardware are two of the industries that have benefitted most from huge outflows of funding going to AI-focused startups. Combined, these two sectors accounted for $13.5 billion in new funding in Q3. The other seven sectors shown here combined for just $9.17 billion in Q3 funding.
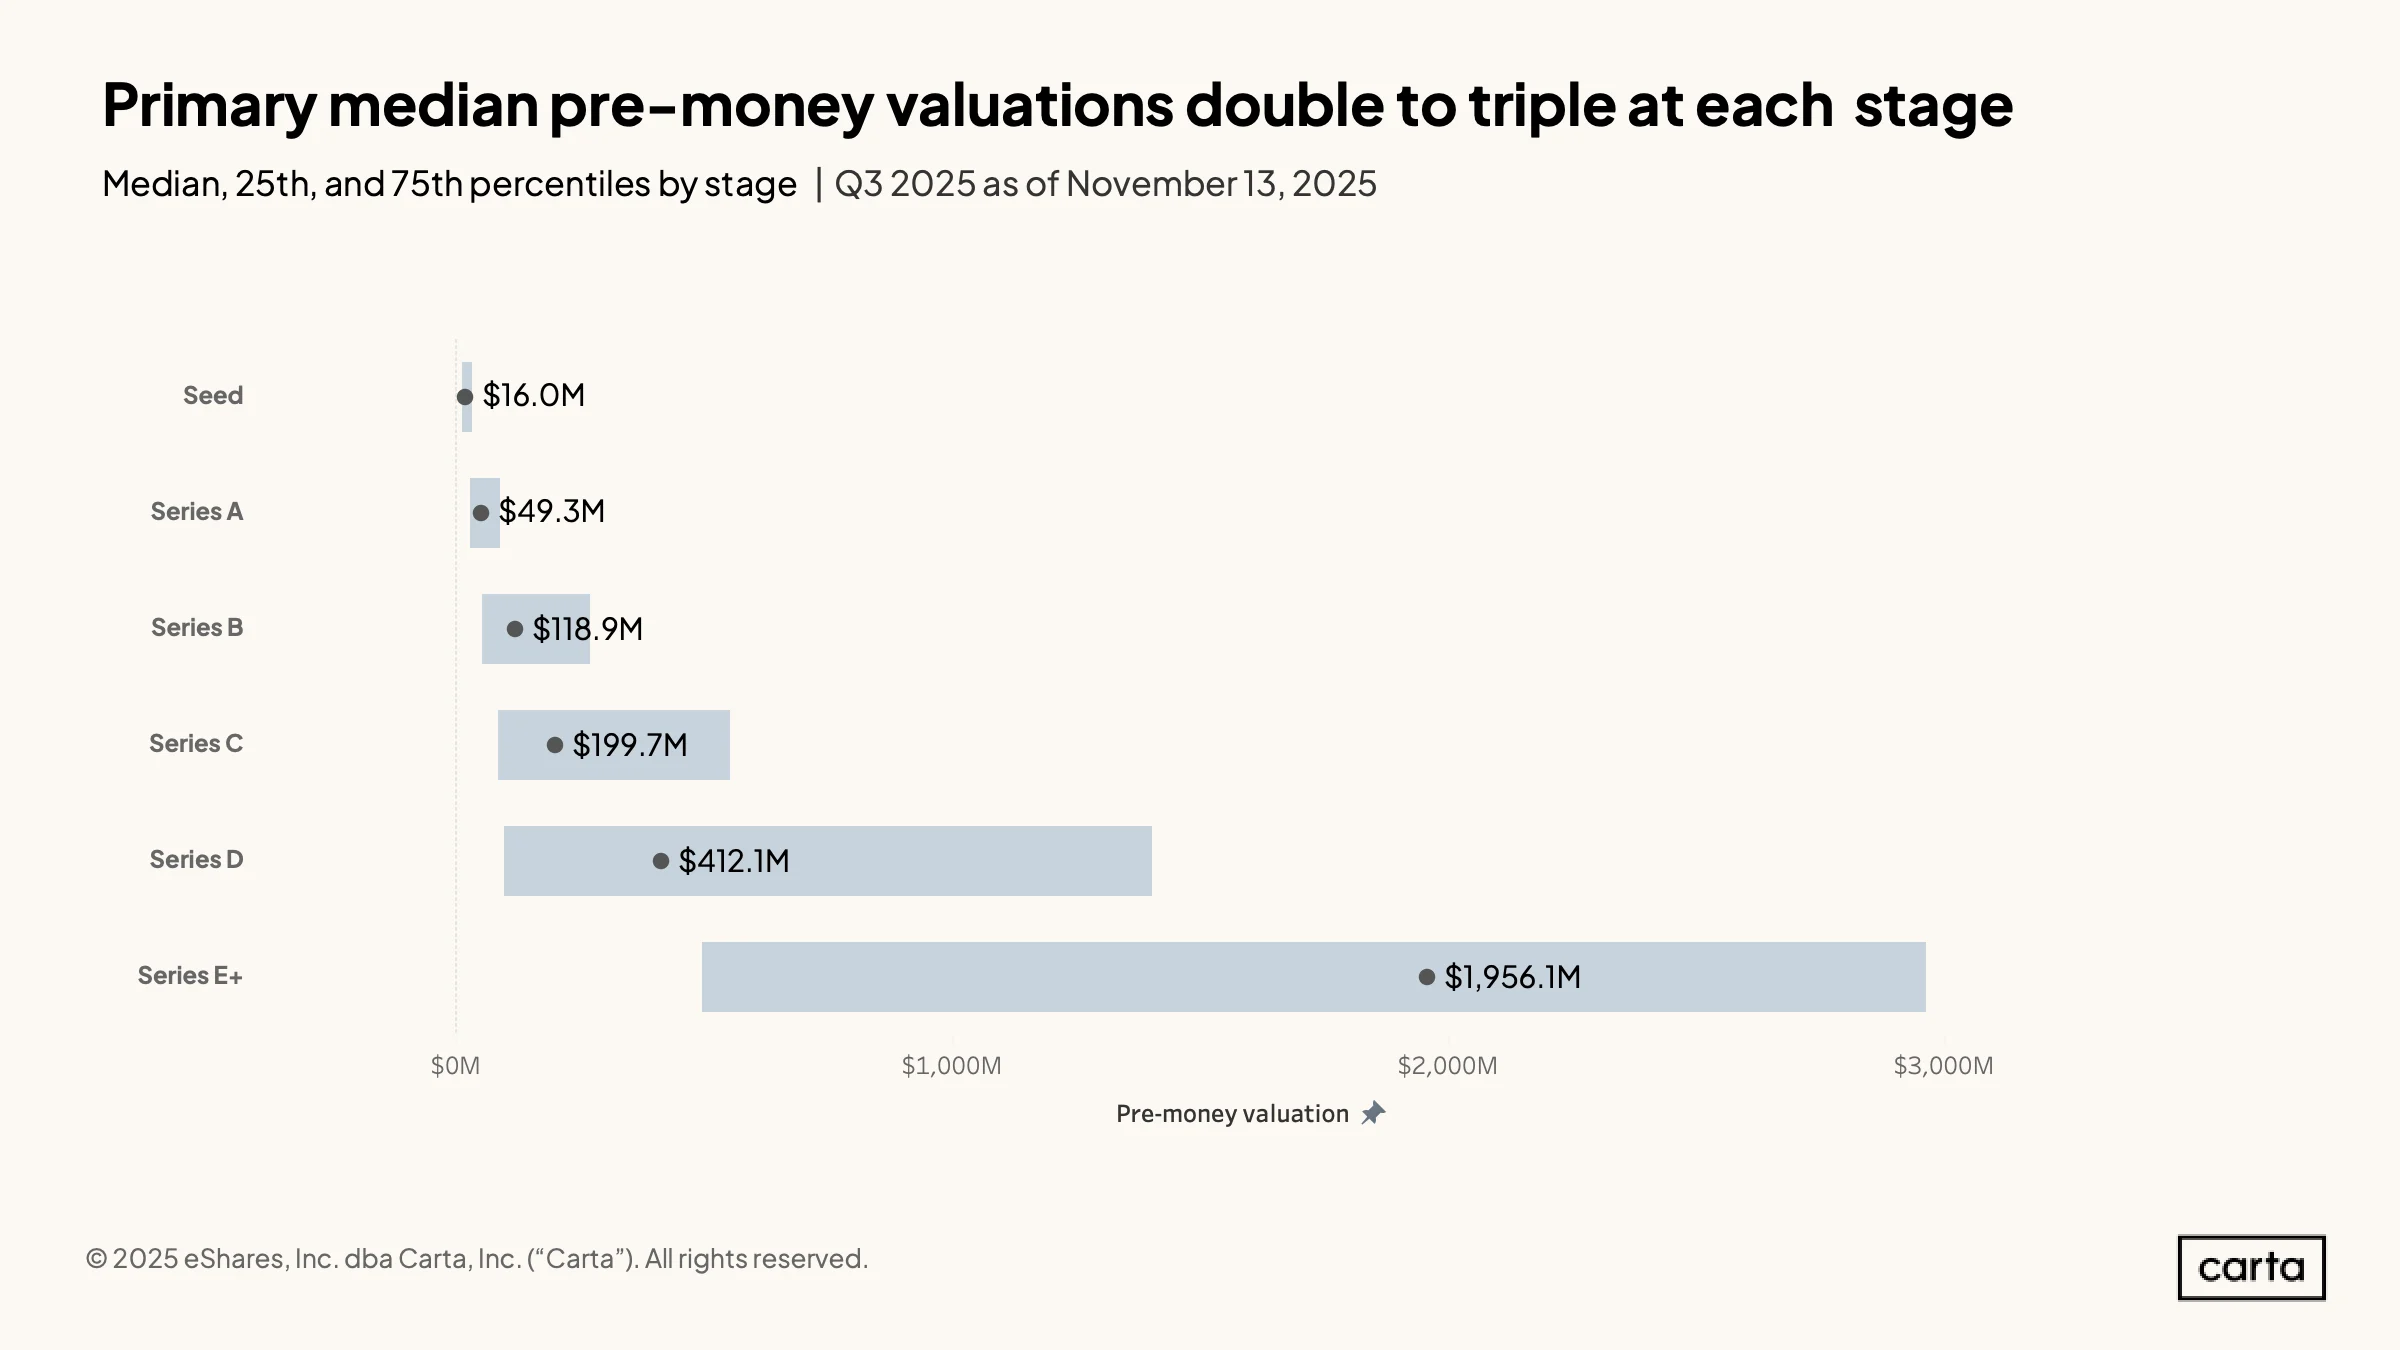
The above chart shows the median pre-money valuation for primary rounds at each major funding stage, with the gray bars indicating the gap between a 25th percentile valuation and a 75th percentile valuation.
At the seed stage, the distribution of valuations on either side of the $16 million median is quite narrow. At Series E+, meanwhile, the gap between the 25th percentile and the 75th percentile is well over $2 billion.
For every stage from Series A through Series D, the median pre-money valuation is noticeably closer to the 25th percentile than it is to the 75th percentile. This indicates a right-tailed distribution for valuations at these stages, with some data points skewing significantly higher than the median.
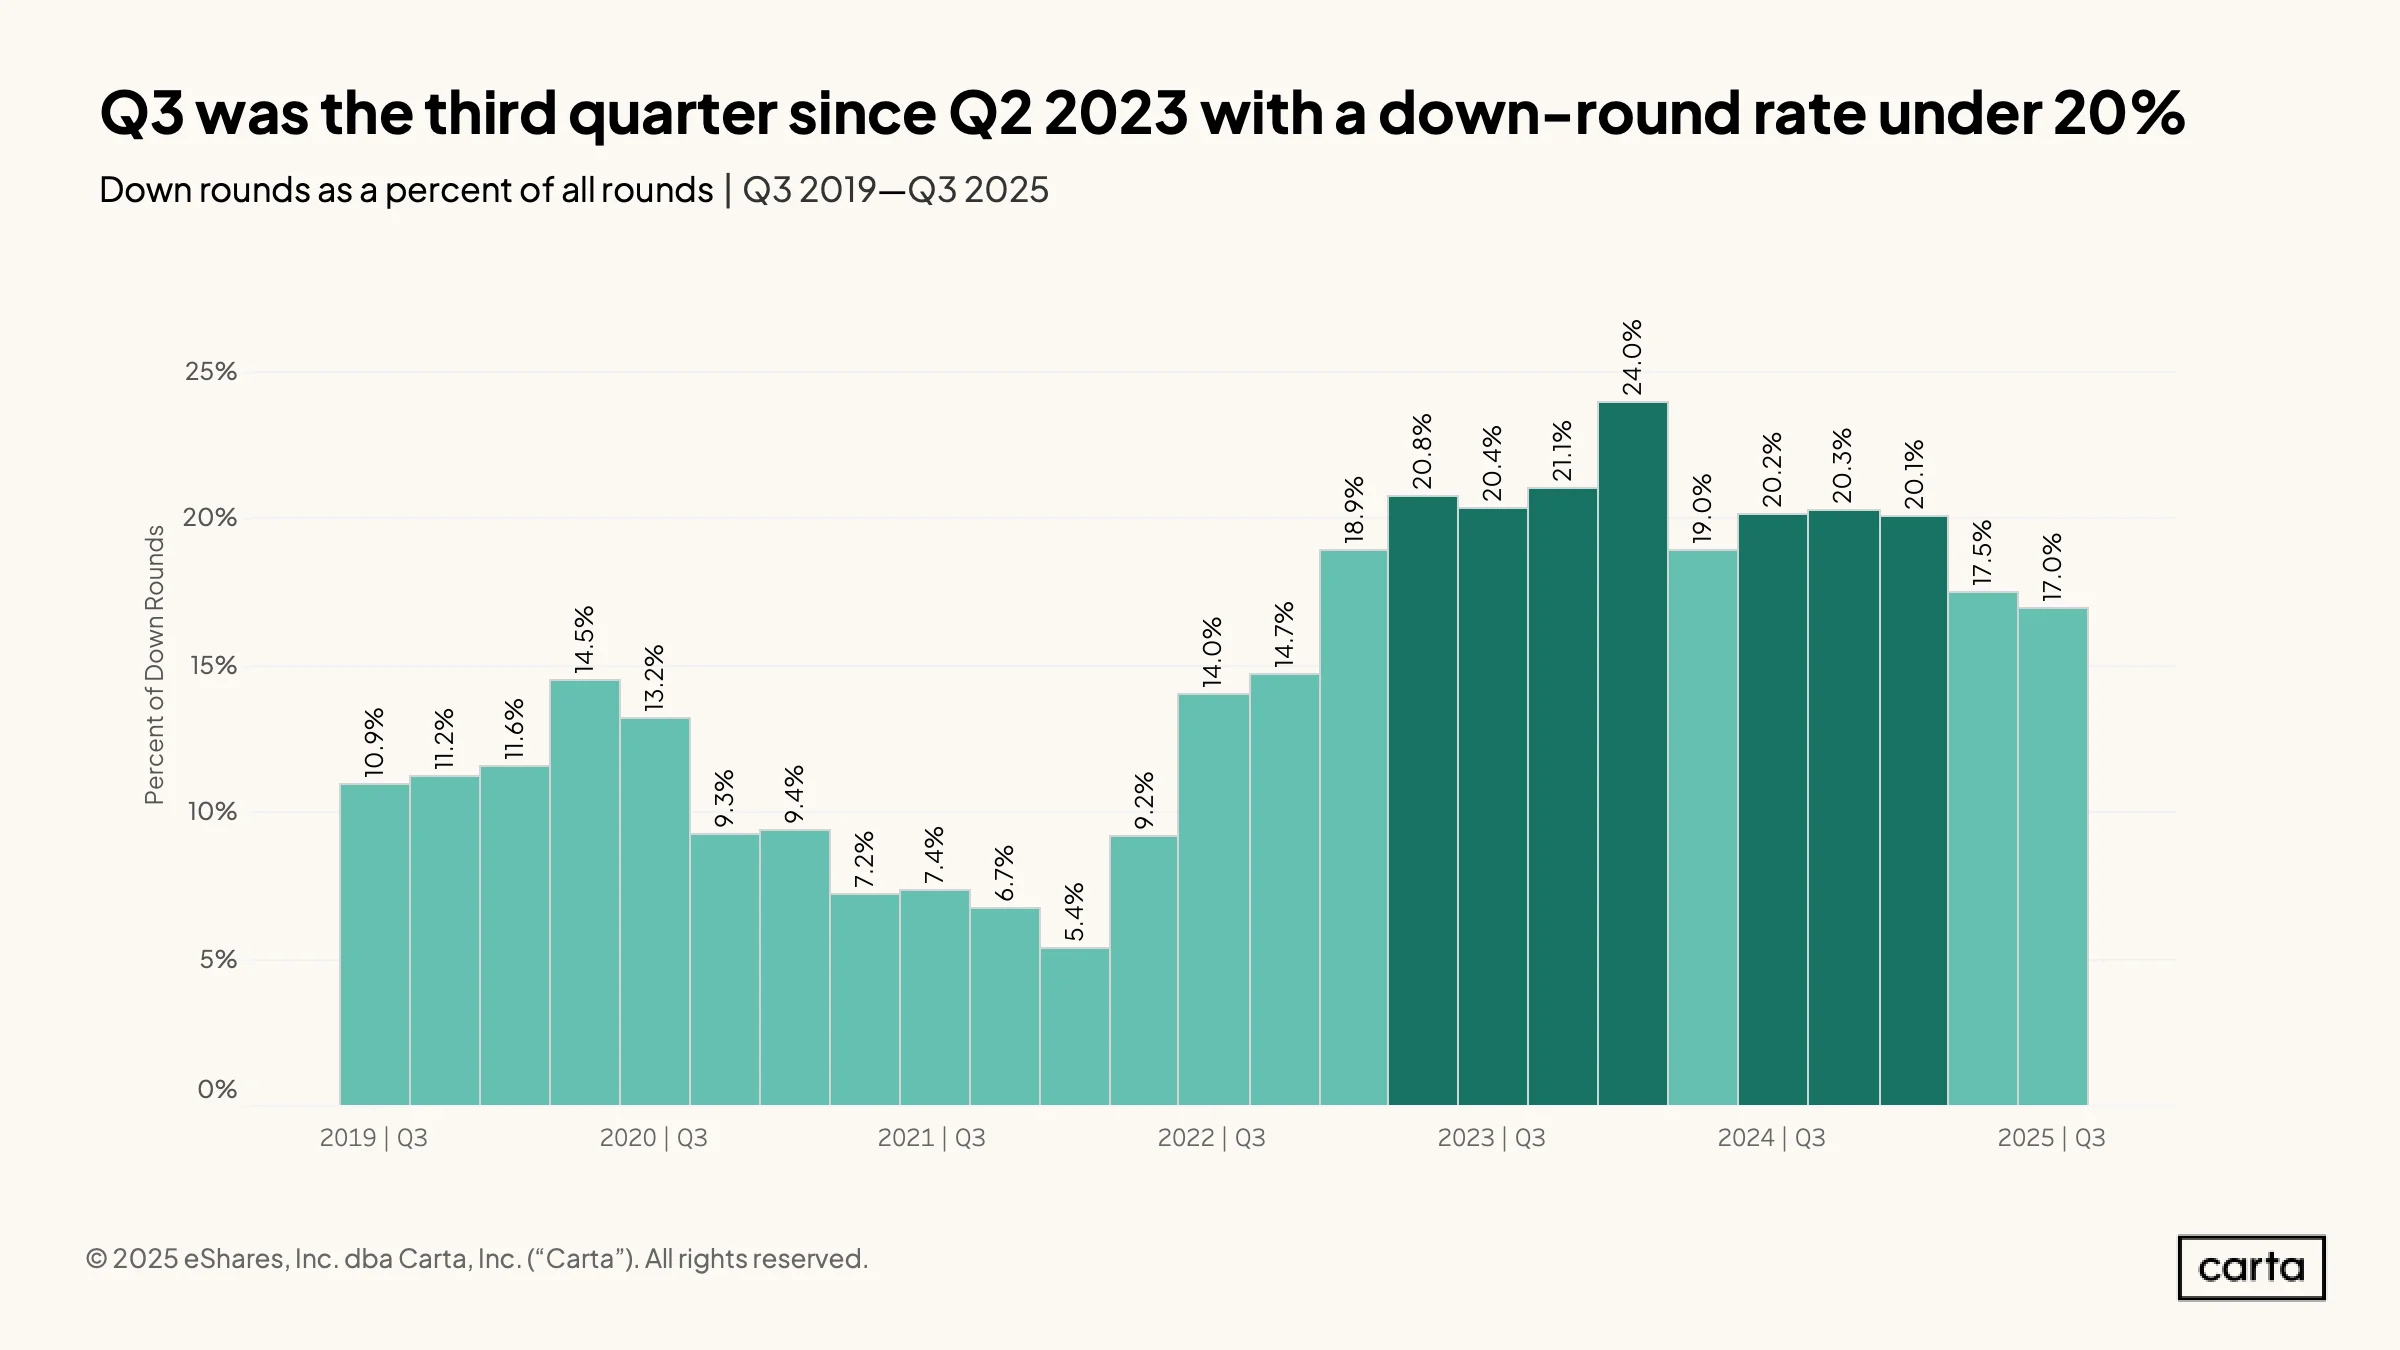
In the middle of 2022, down rounds started to become a much more common feature of the venture landscape, as a widespread reset in tech valuations forced many startups raising new funds to accept lower valuations than they’d seen in their previous primary round. Down rounds are still much more common than they were throughout most of 2020 and 2021—but the overall rate of down rounds has at last begun to decline.
In Q3, 17% of all new primary rounds on Carta were down rounds, marking the second straight quarter that the down-round rate was below 20%. Previously, at least 20% of all rounds had been down rounds in seven of the past eight quarters, peaking with a 24% rate in Q1 2024.
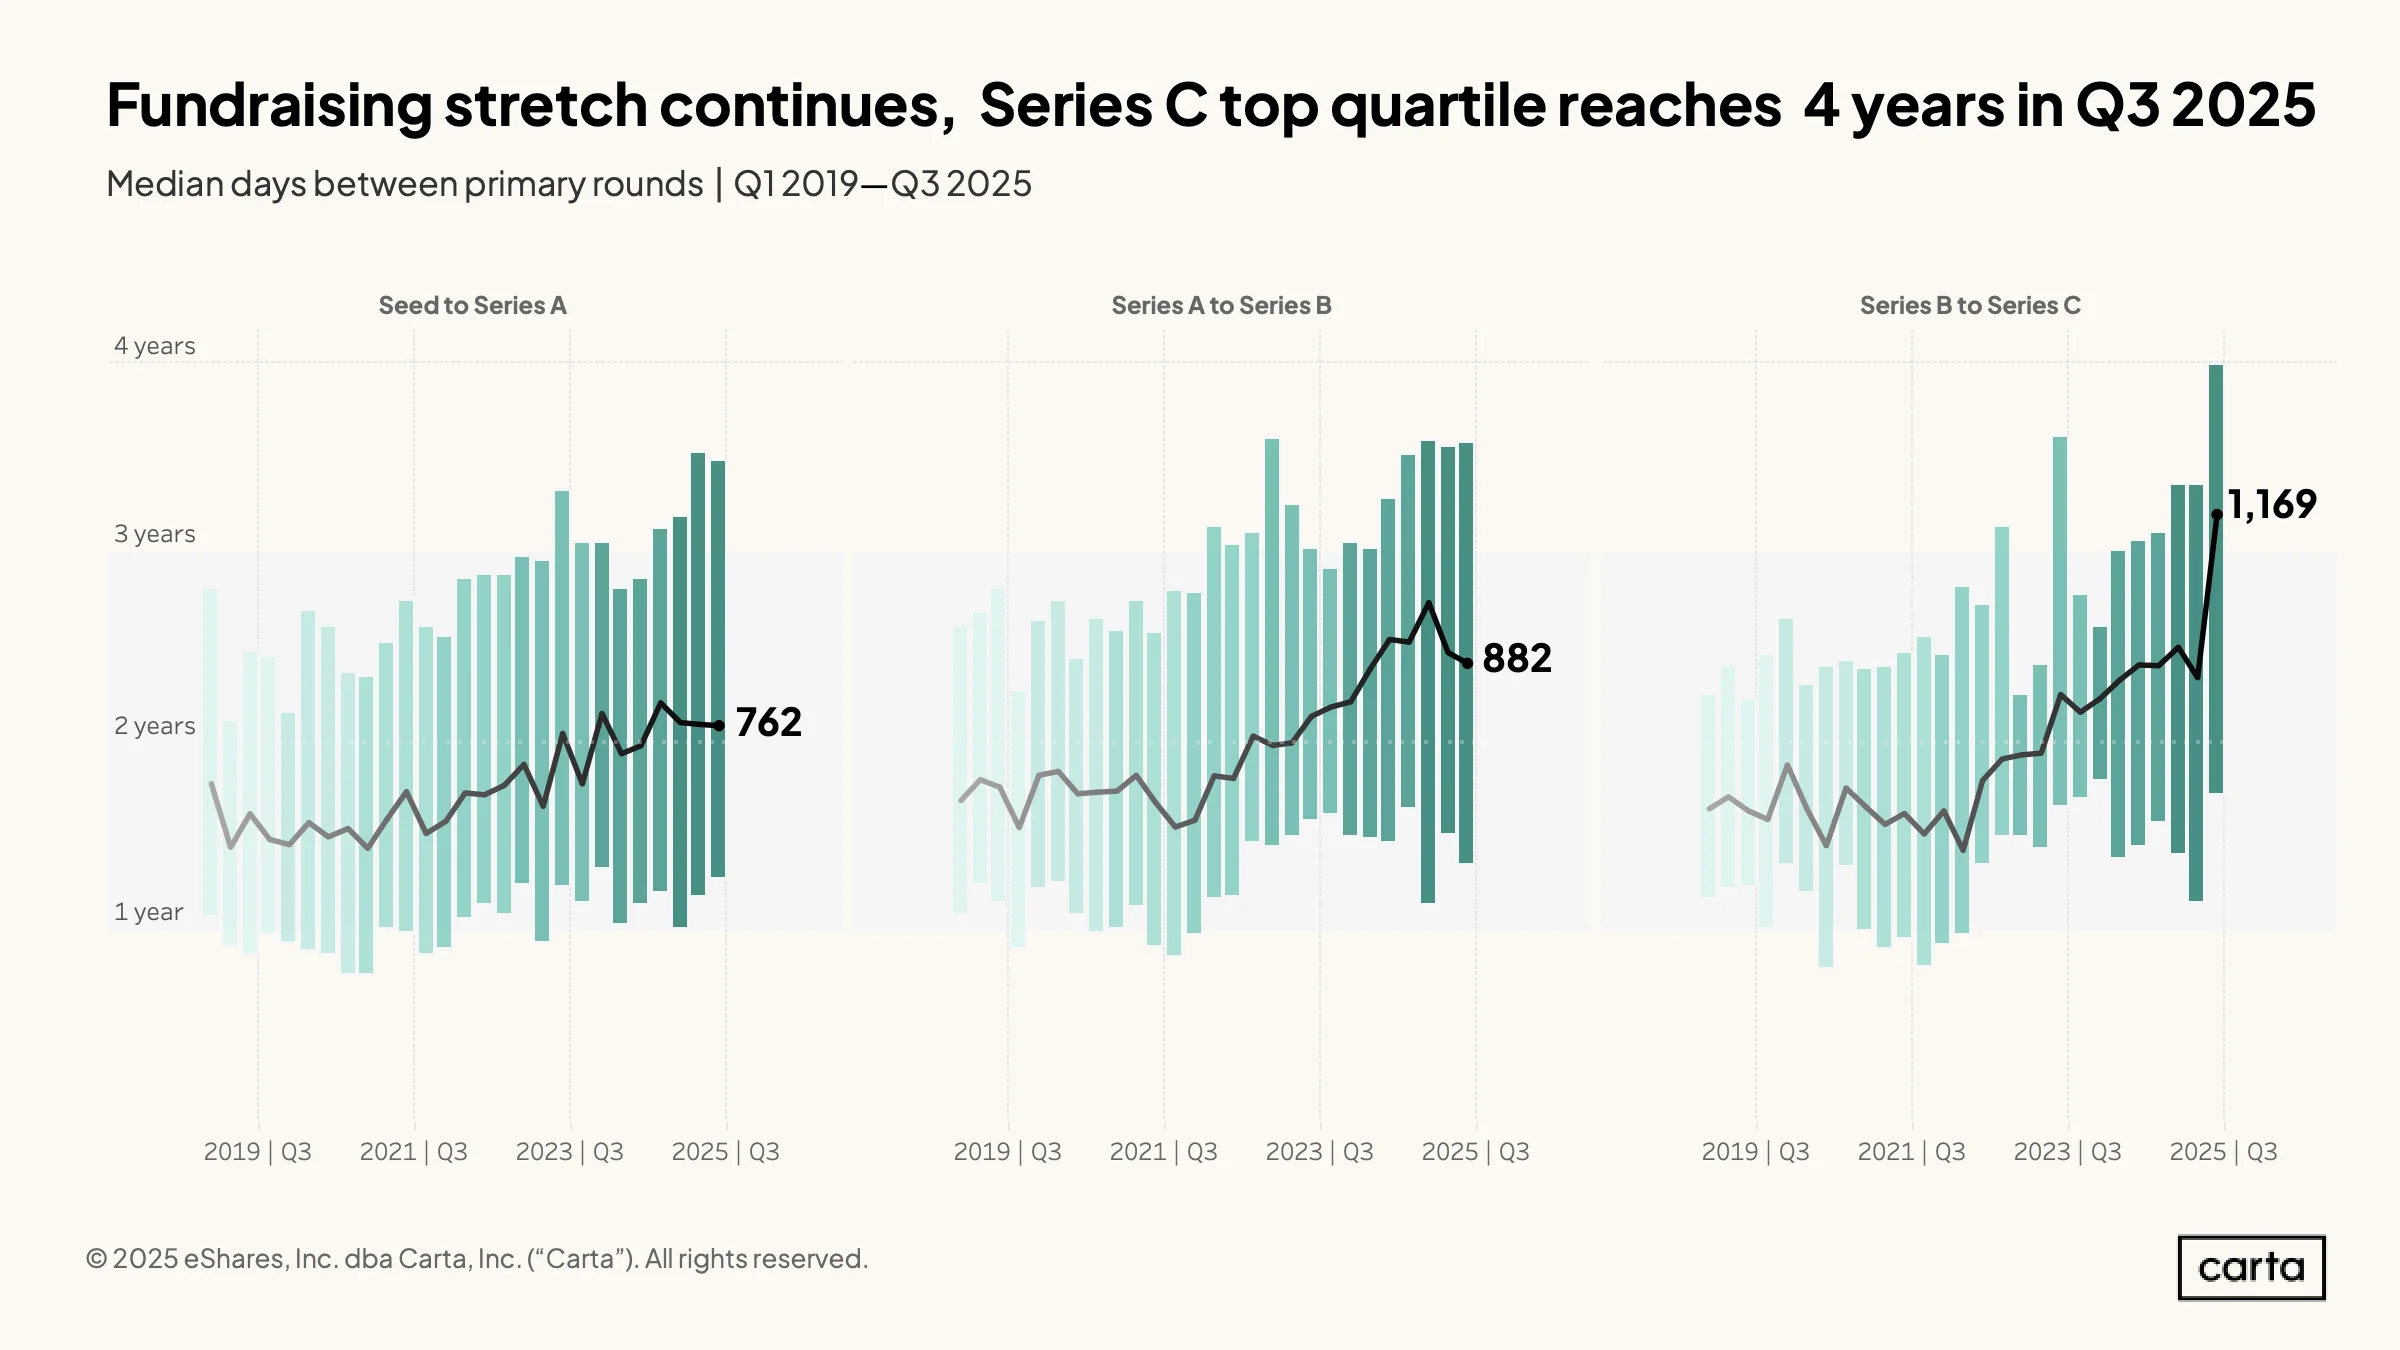
For startups on Carta raising a Series A or a Series B, the median time since the company’s previous primary funding round declined slightly in Q3 2025 compared to Q2. For startups raising a Series C, however, the median time between rounds saw a 37% spike, climbing to 1,169 days—the equivalent of more than three years and two months.
Over the past few years, the typical time between new primary rounds has increased at each of these stages. But the jump has been particularly pronounced among startups raising a Series C. Five years ago, in Q3 2020, the median time between a Series B and a Series C was just 531 days, or a little less than a year and a half. Since then, the median interval between these stages has more than doubled.
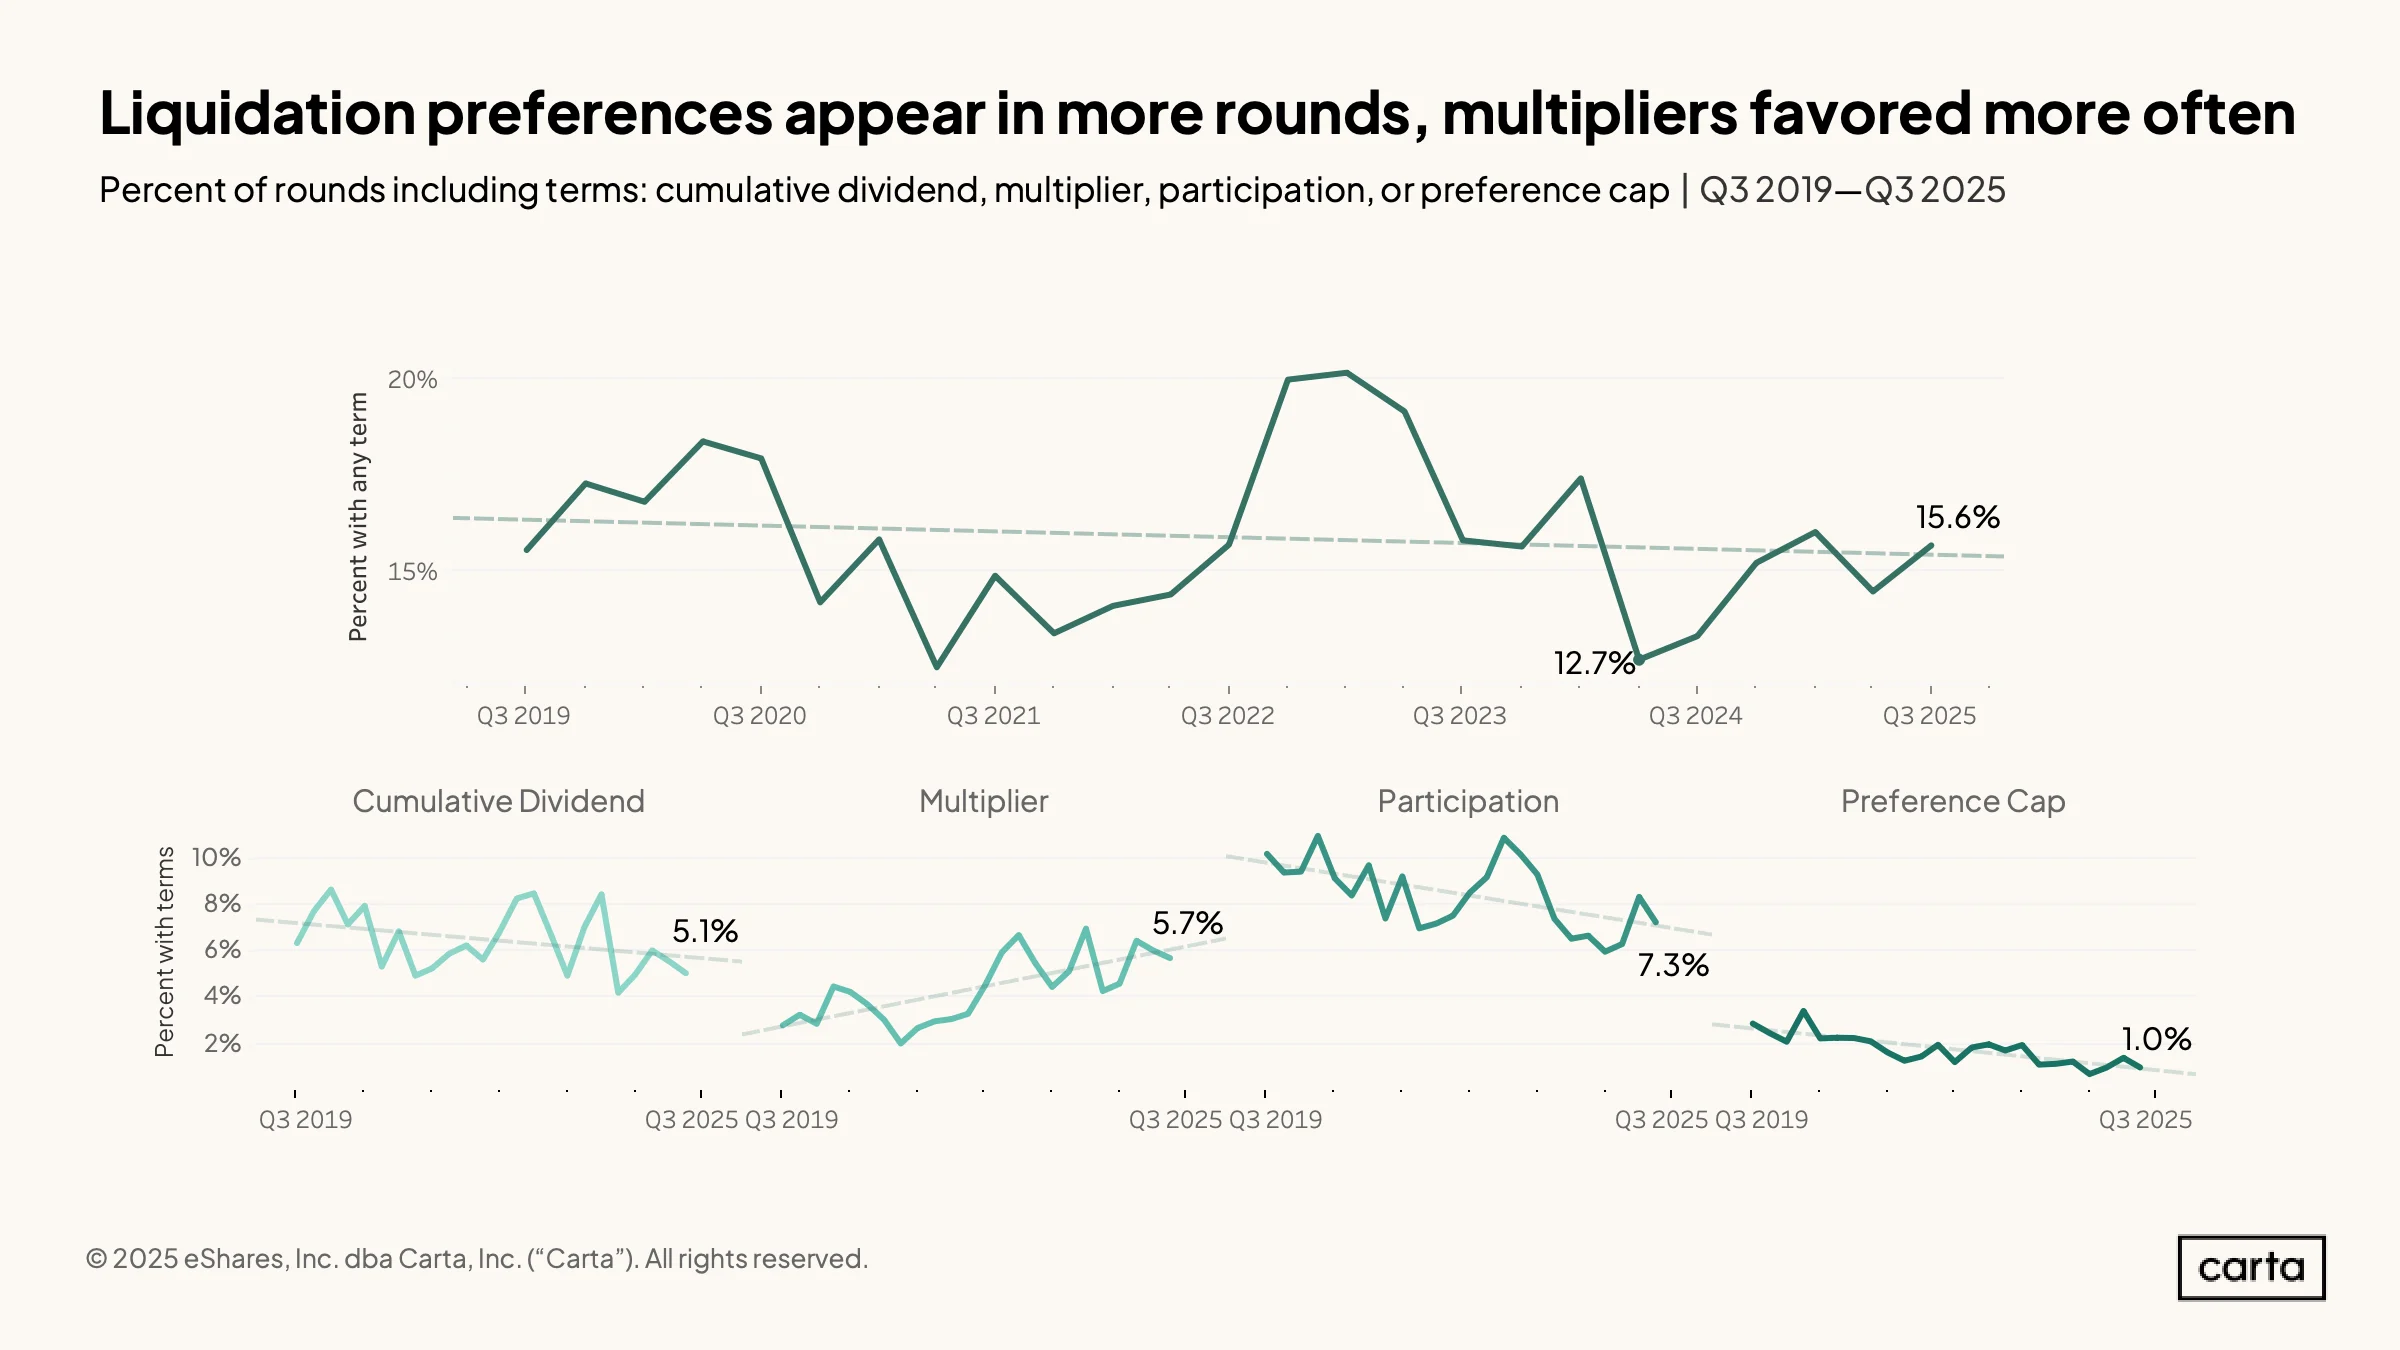
About 5.1% of all venture rounds logged on Carta in Q3 2025 included a cumulative dividend, while 5.7% included a multiplier, 7.3% included participating preferred shares, and 1% had a preference cap. Overall, 15.6% of new rounds in Q3 included one of these four investor-friendly terms, while the vast majority of new rounds (84.4%) did not include any of the four.
Over the past six years, multipliers have grown increasingly common in VC term sheets, while the other three terms shown here—cumulative dividends, participating preferred shares, and preference caps—have all grown less common over that span. The frequency of multipliers has more than doubled since Q3 2019, when they were a feature of just 2.8% of new venture deals.
Fundraising volumes
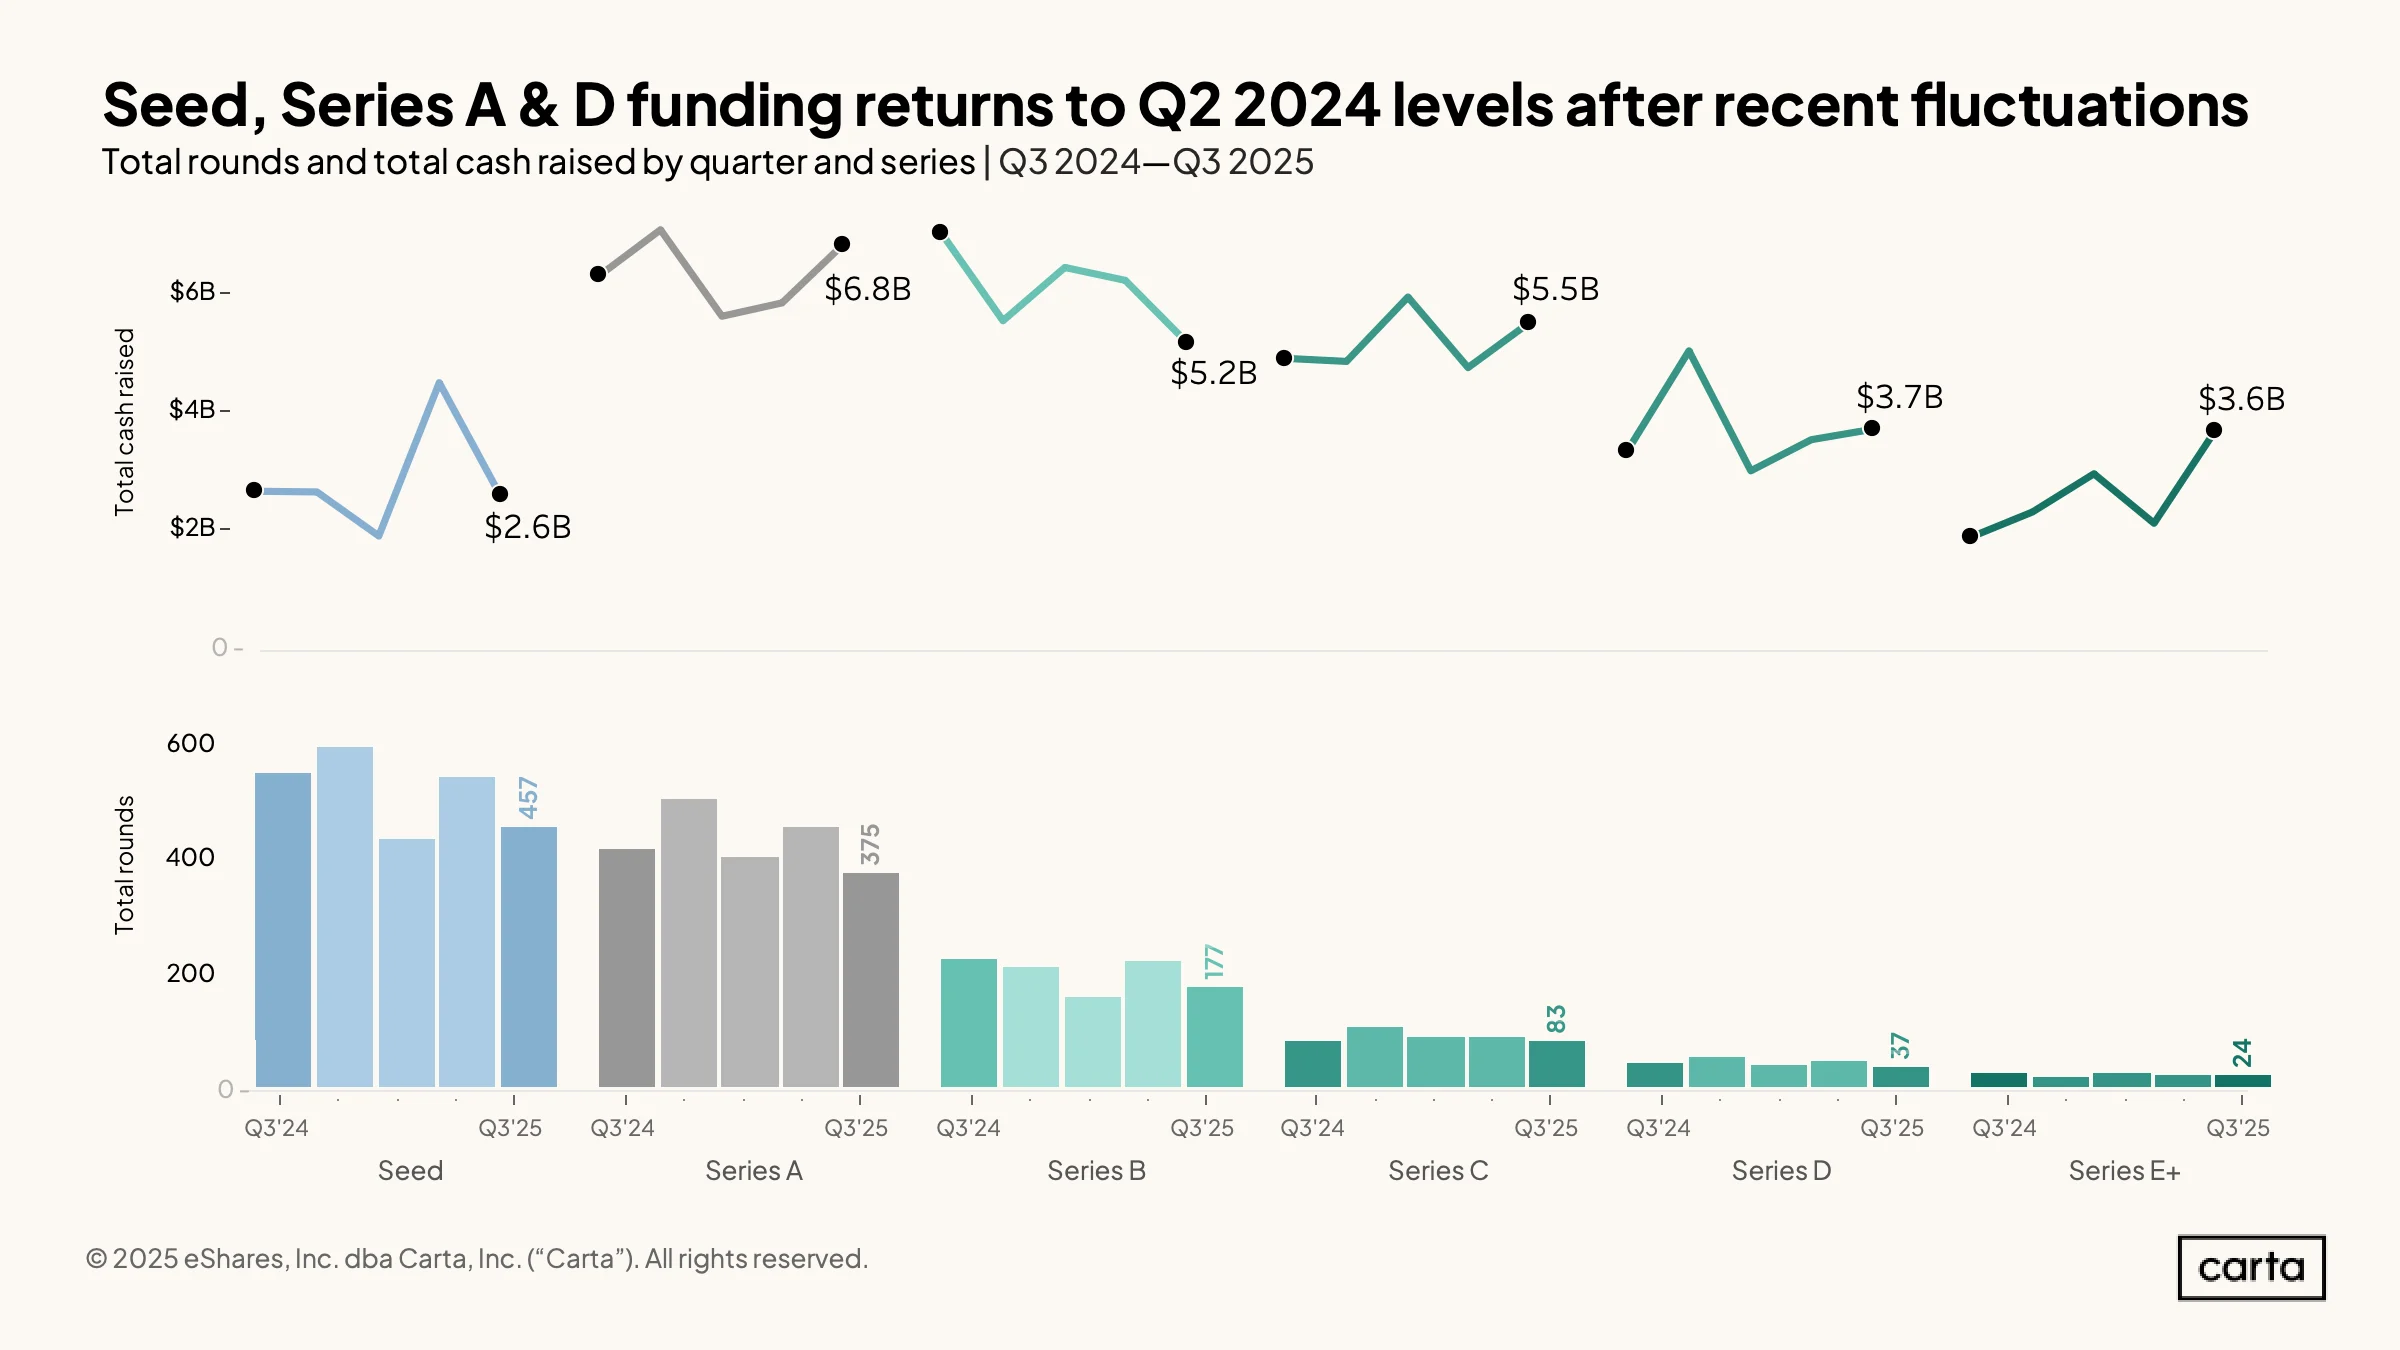
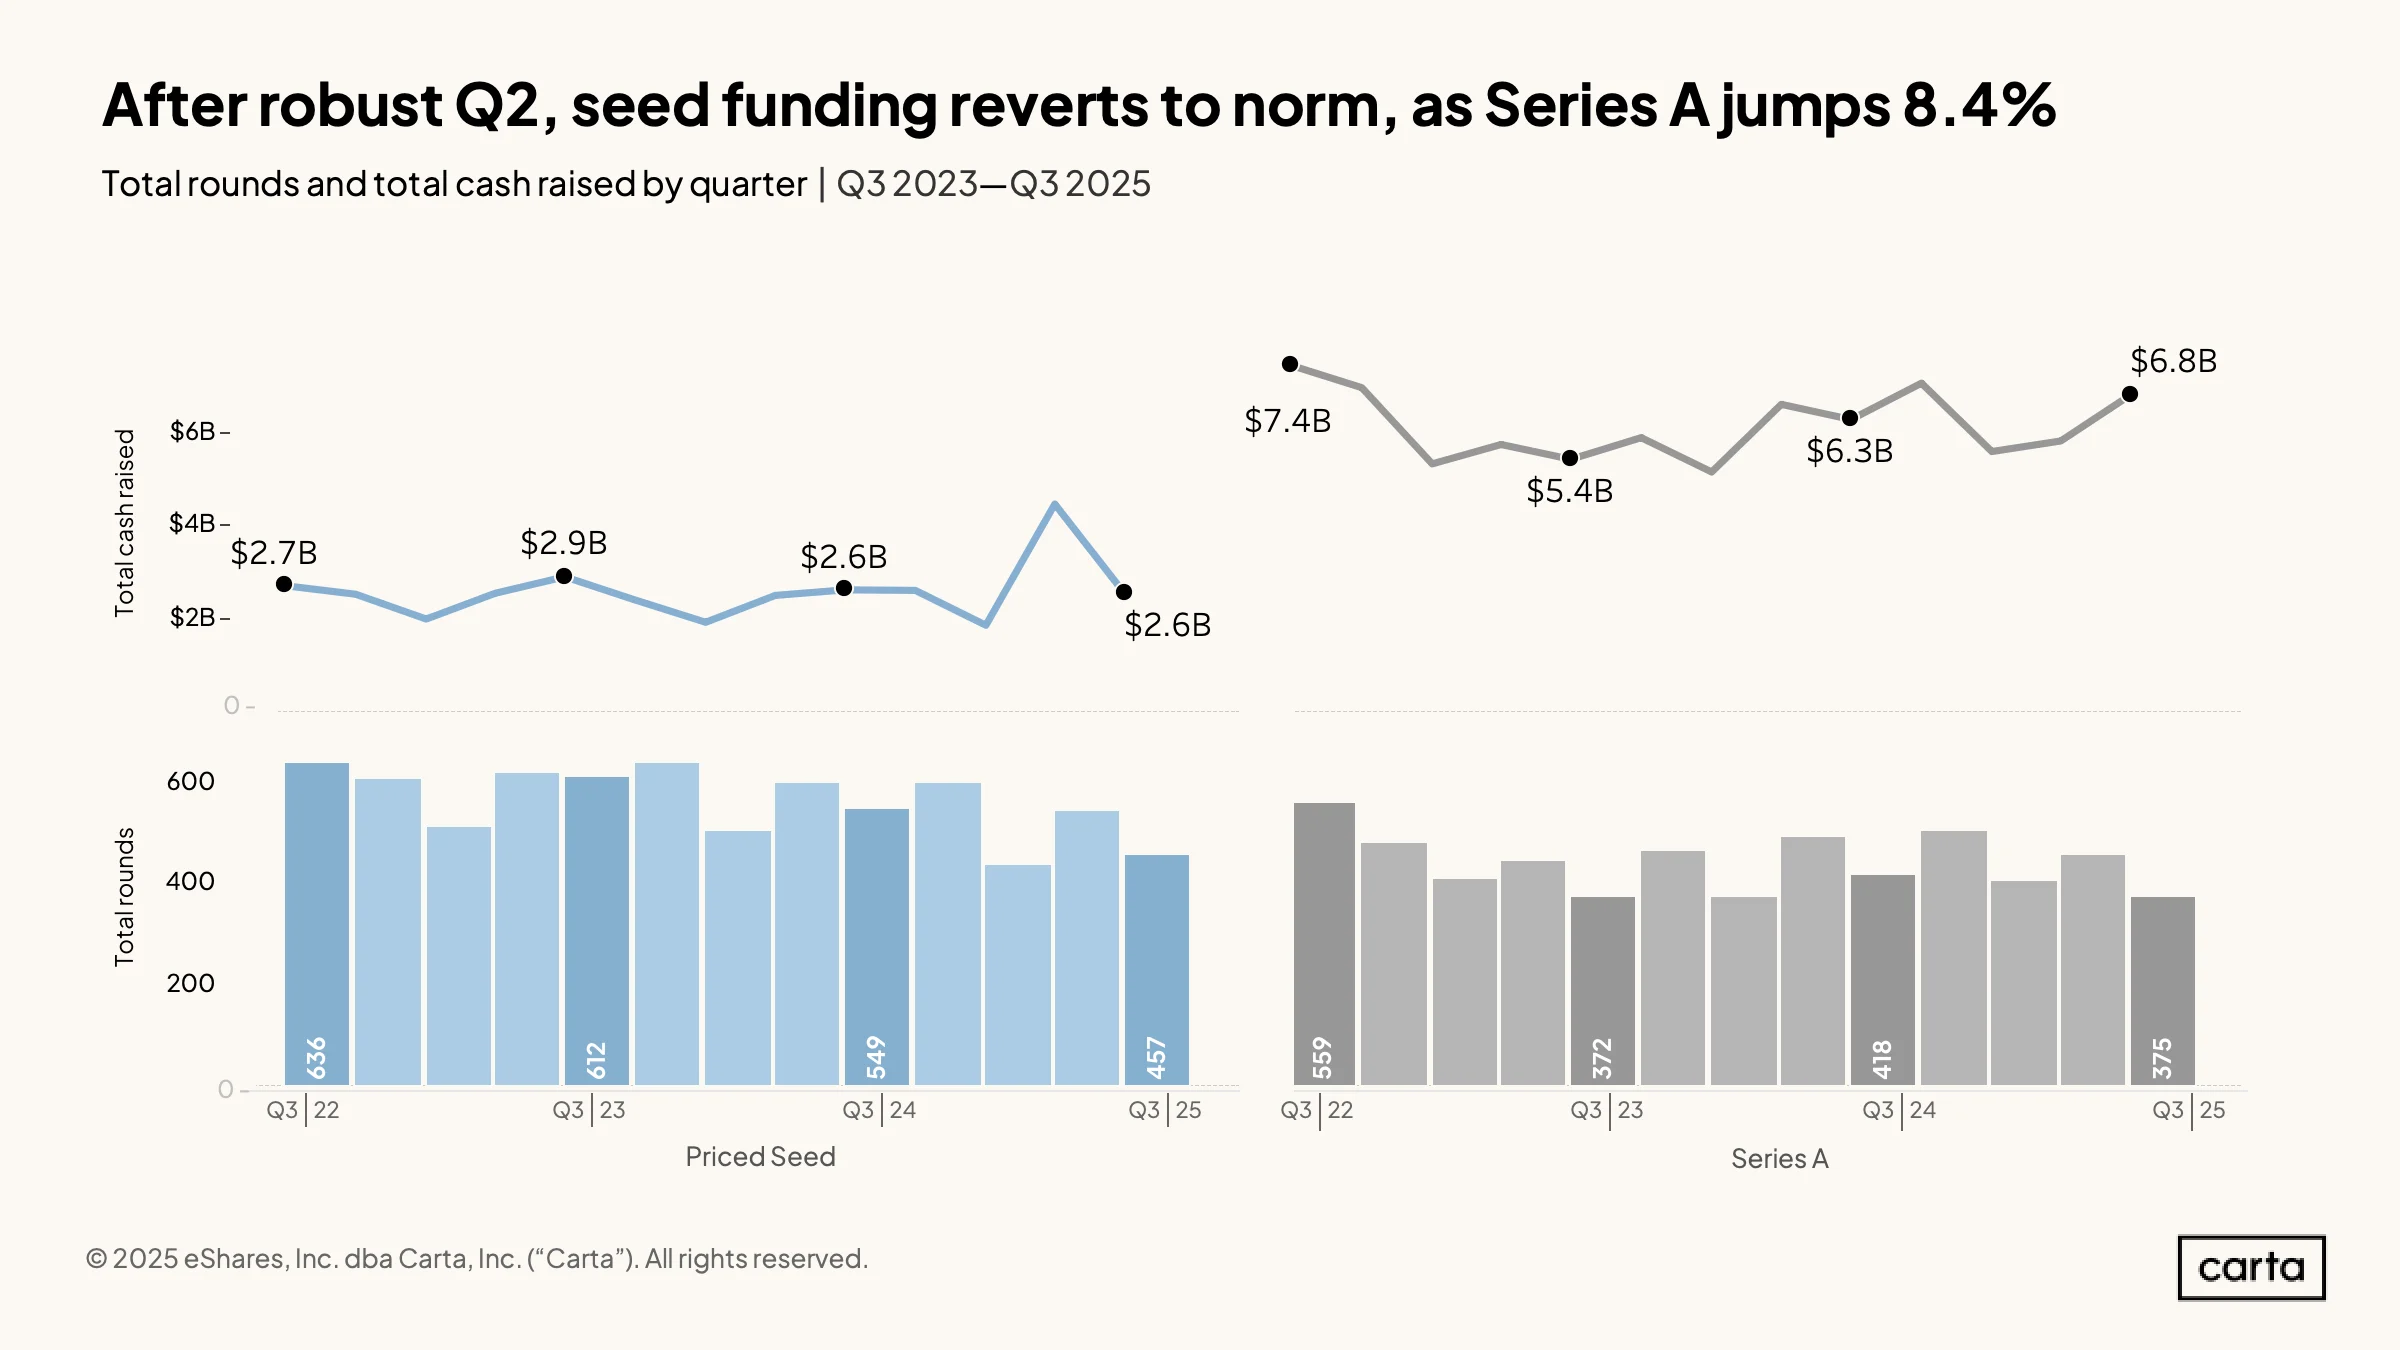
After leaping to $4.5 billion in Q2, fundraising totals at the seed stage were back in line with recent norms in Q3, with $2.6 billion in new cash raised. The number of seed rounds taking place, meanwhile, continued to decline, falling to 457 in Q3—down 17% year over year.
Deal counts are also declining at Series A. Startups on Carta closed 375 new Series A rounds in Q3, a year-over-year drop of about 10%. But even with fewer fundings, the amount of cash going toward Series A rounds continued to grow. Series A startups combined to bring in $6.8 billion throughout the quarter, a year-over-year leap of about 8%.
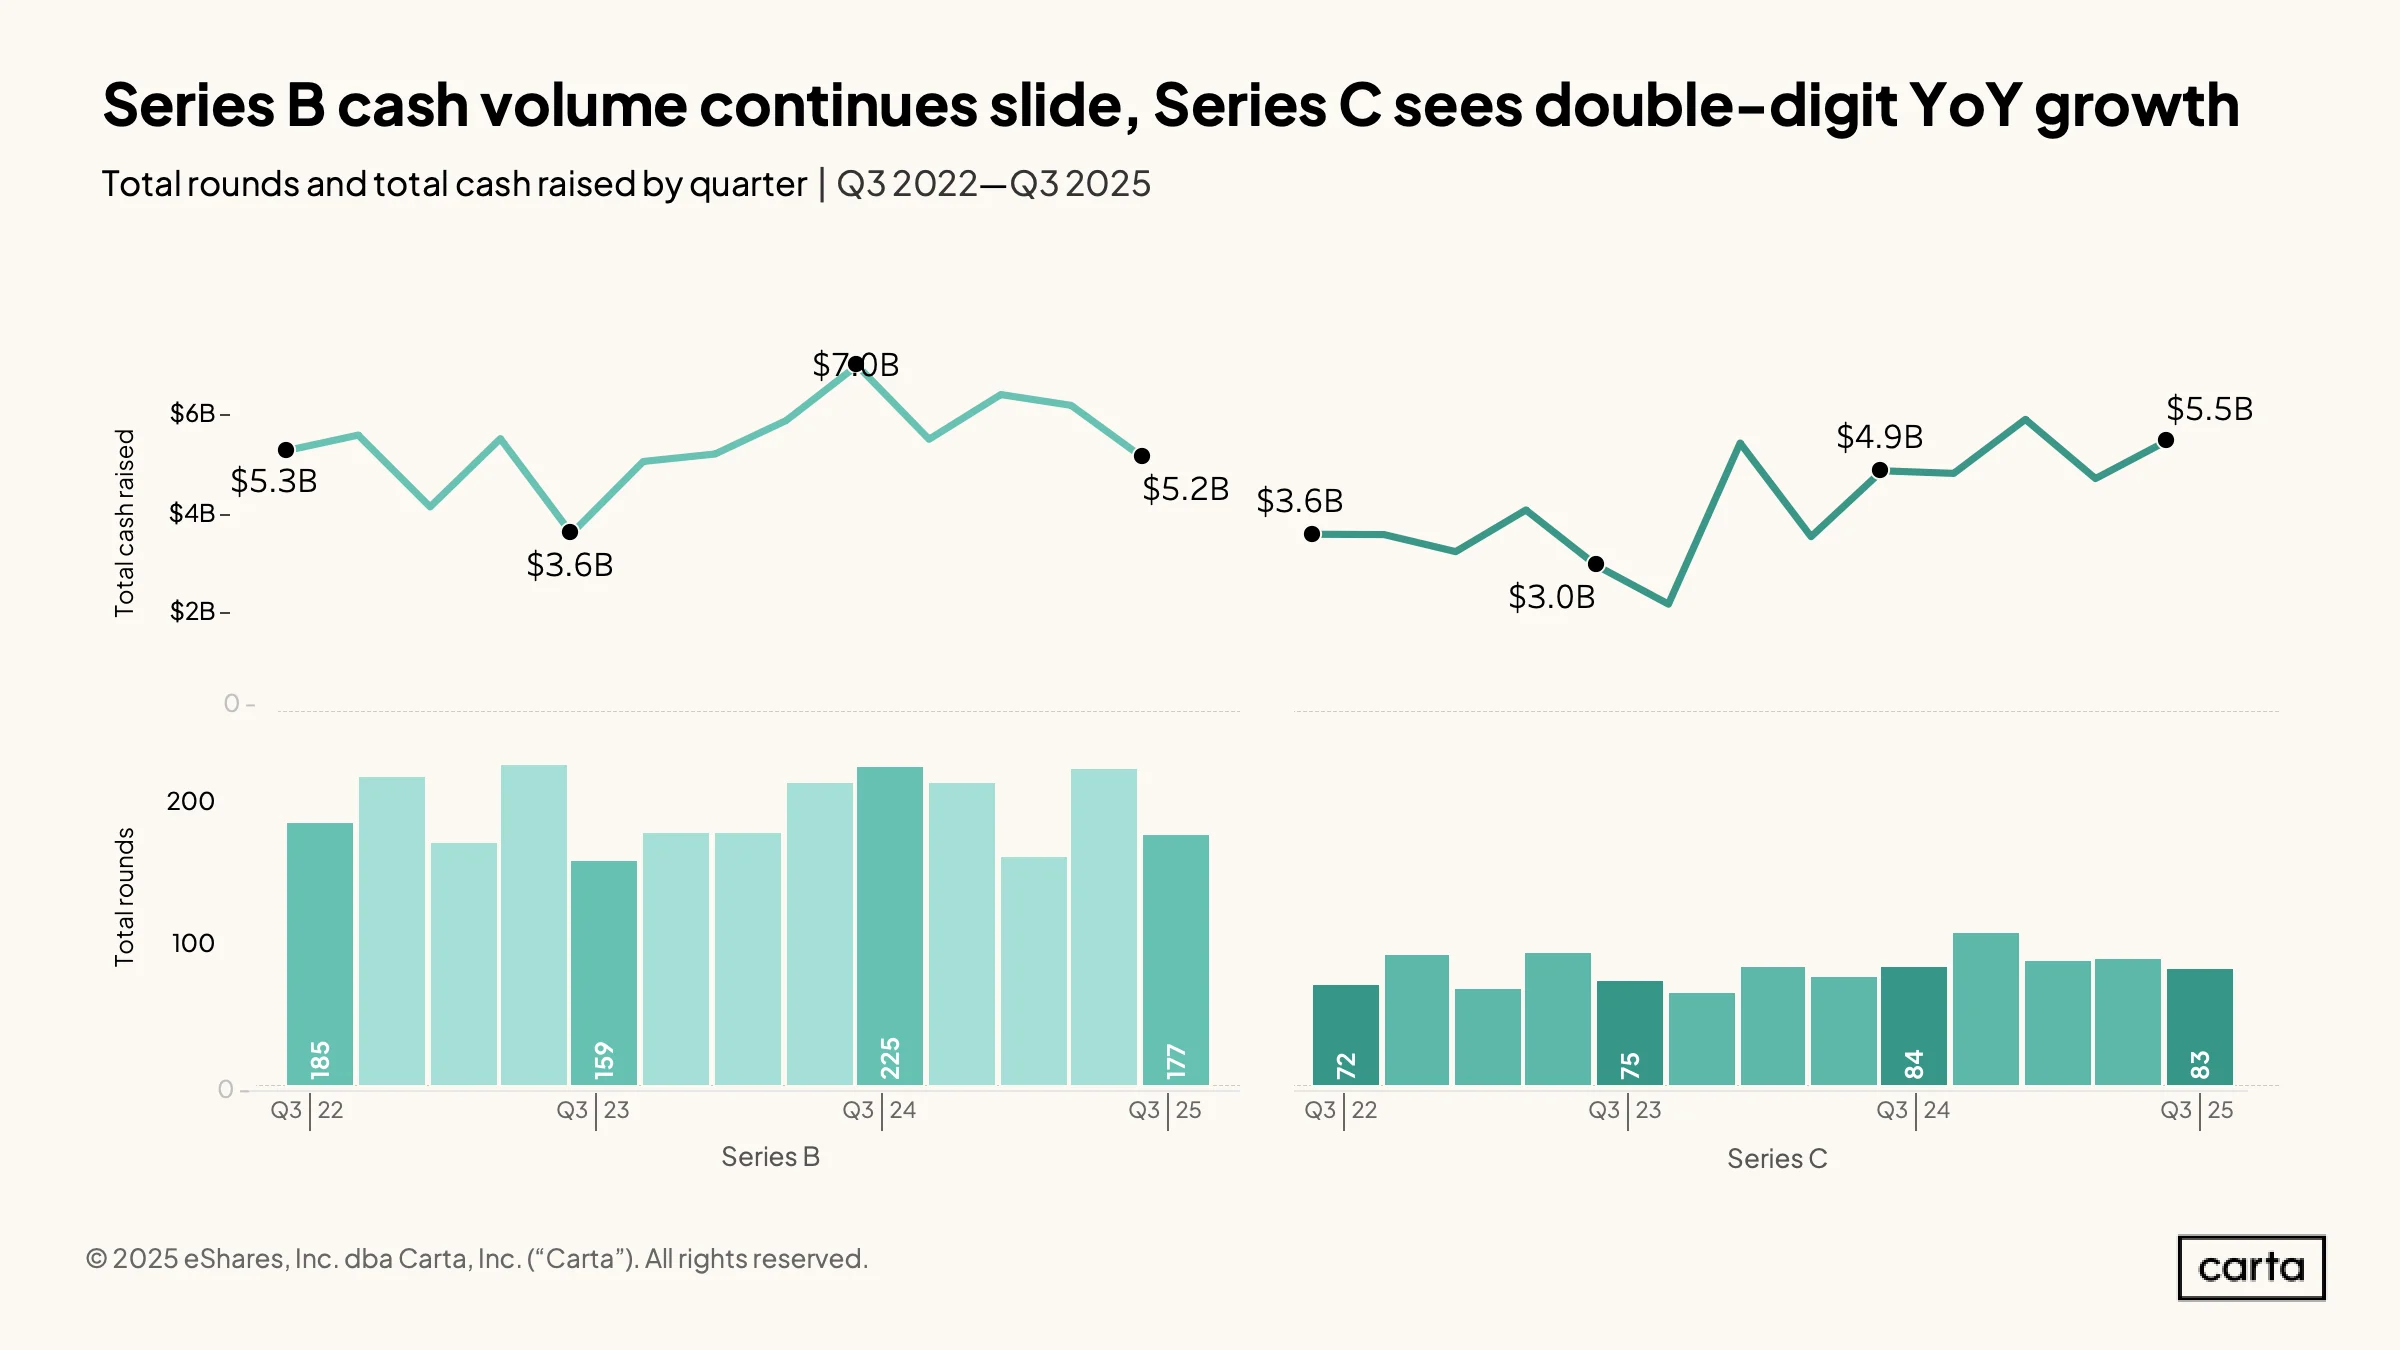
Activity in the Series B market continued to decline in Q3. Startups on Carta combined to raise $5.2 billion in Series B funding in the quarter, down 26% year over year and 16% quarter over quarter. That capital raised was spread across 177 new Series B rounds, marking a 21% decline on both an annual and a quarterly basis.
The amount of capital invested into new Series C rounds, on the other hand, continues to rise. Q3 saw $5.5 billion in new cash raised at Series C, up 12% compared to one year earlier and 83% from the same period two years ago. Over those past two years, deal count at Series C has held relatively steady, indicating that this spike in cash raised is due mostly to the presence of significantly larger rounds.
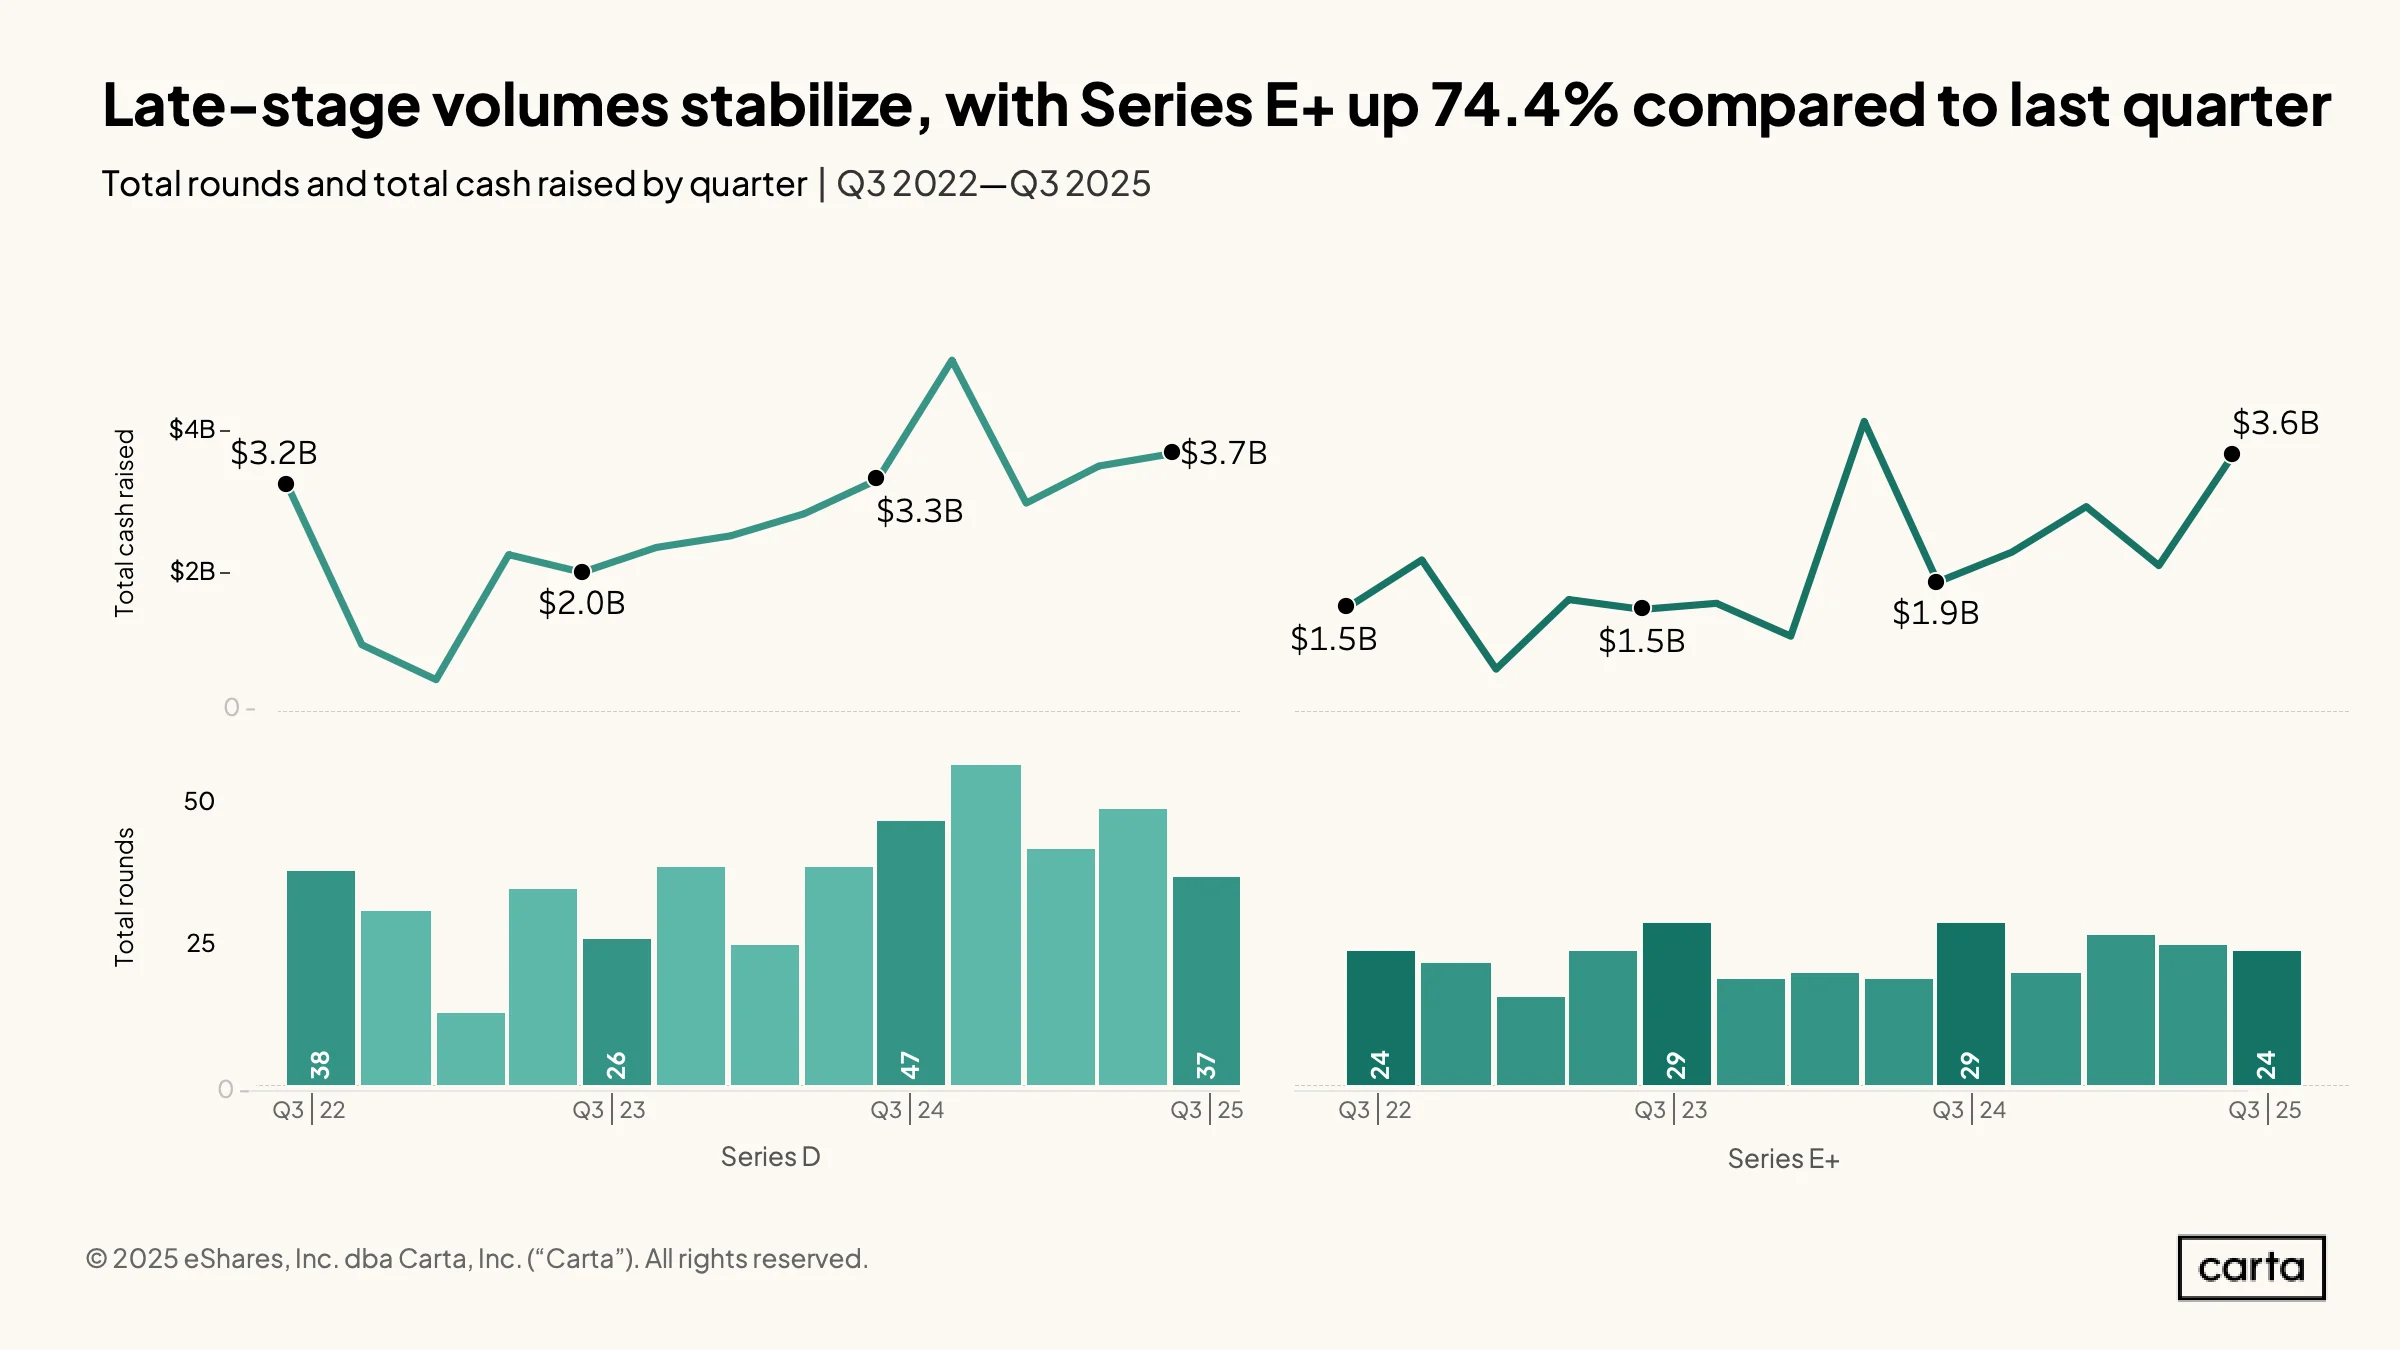
Startups on Carta combined to raise $3.7 billion in new funding at Series D and another $3.6 billion at Series E and beyond during Q3 2025. Both of those figures represent double-digit increases in investment on an annual basis: At Series D, cash raised was up 12% year over year in Q3, and at Series E+, it increased by 89%.
At the same time, the number of new rounds taking place at both stages declined compared to the same period a year ago, with a 27% dip at Series D and a 17% drop at Series E+. At Series E+, however, deal volumes seem to have stabilized over the past two years, with somewhere between 19 and 29 new rounds closing in each of the past eight quarters.
Valuations
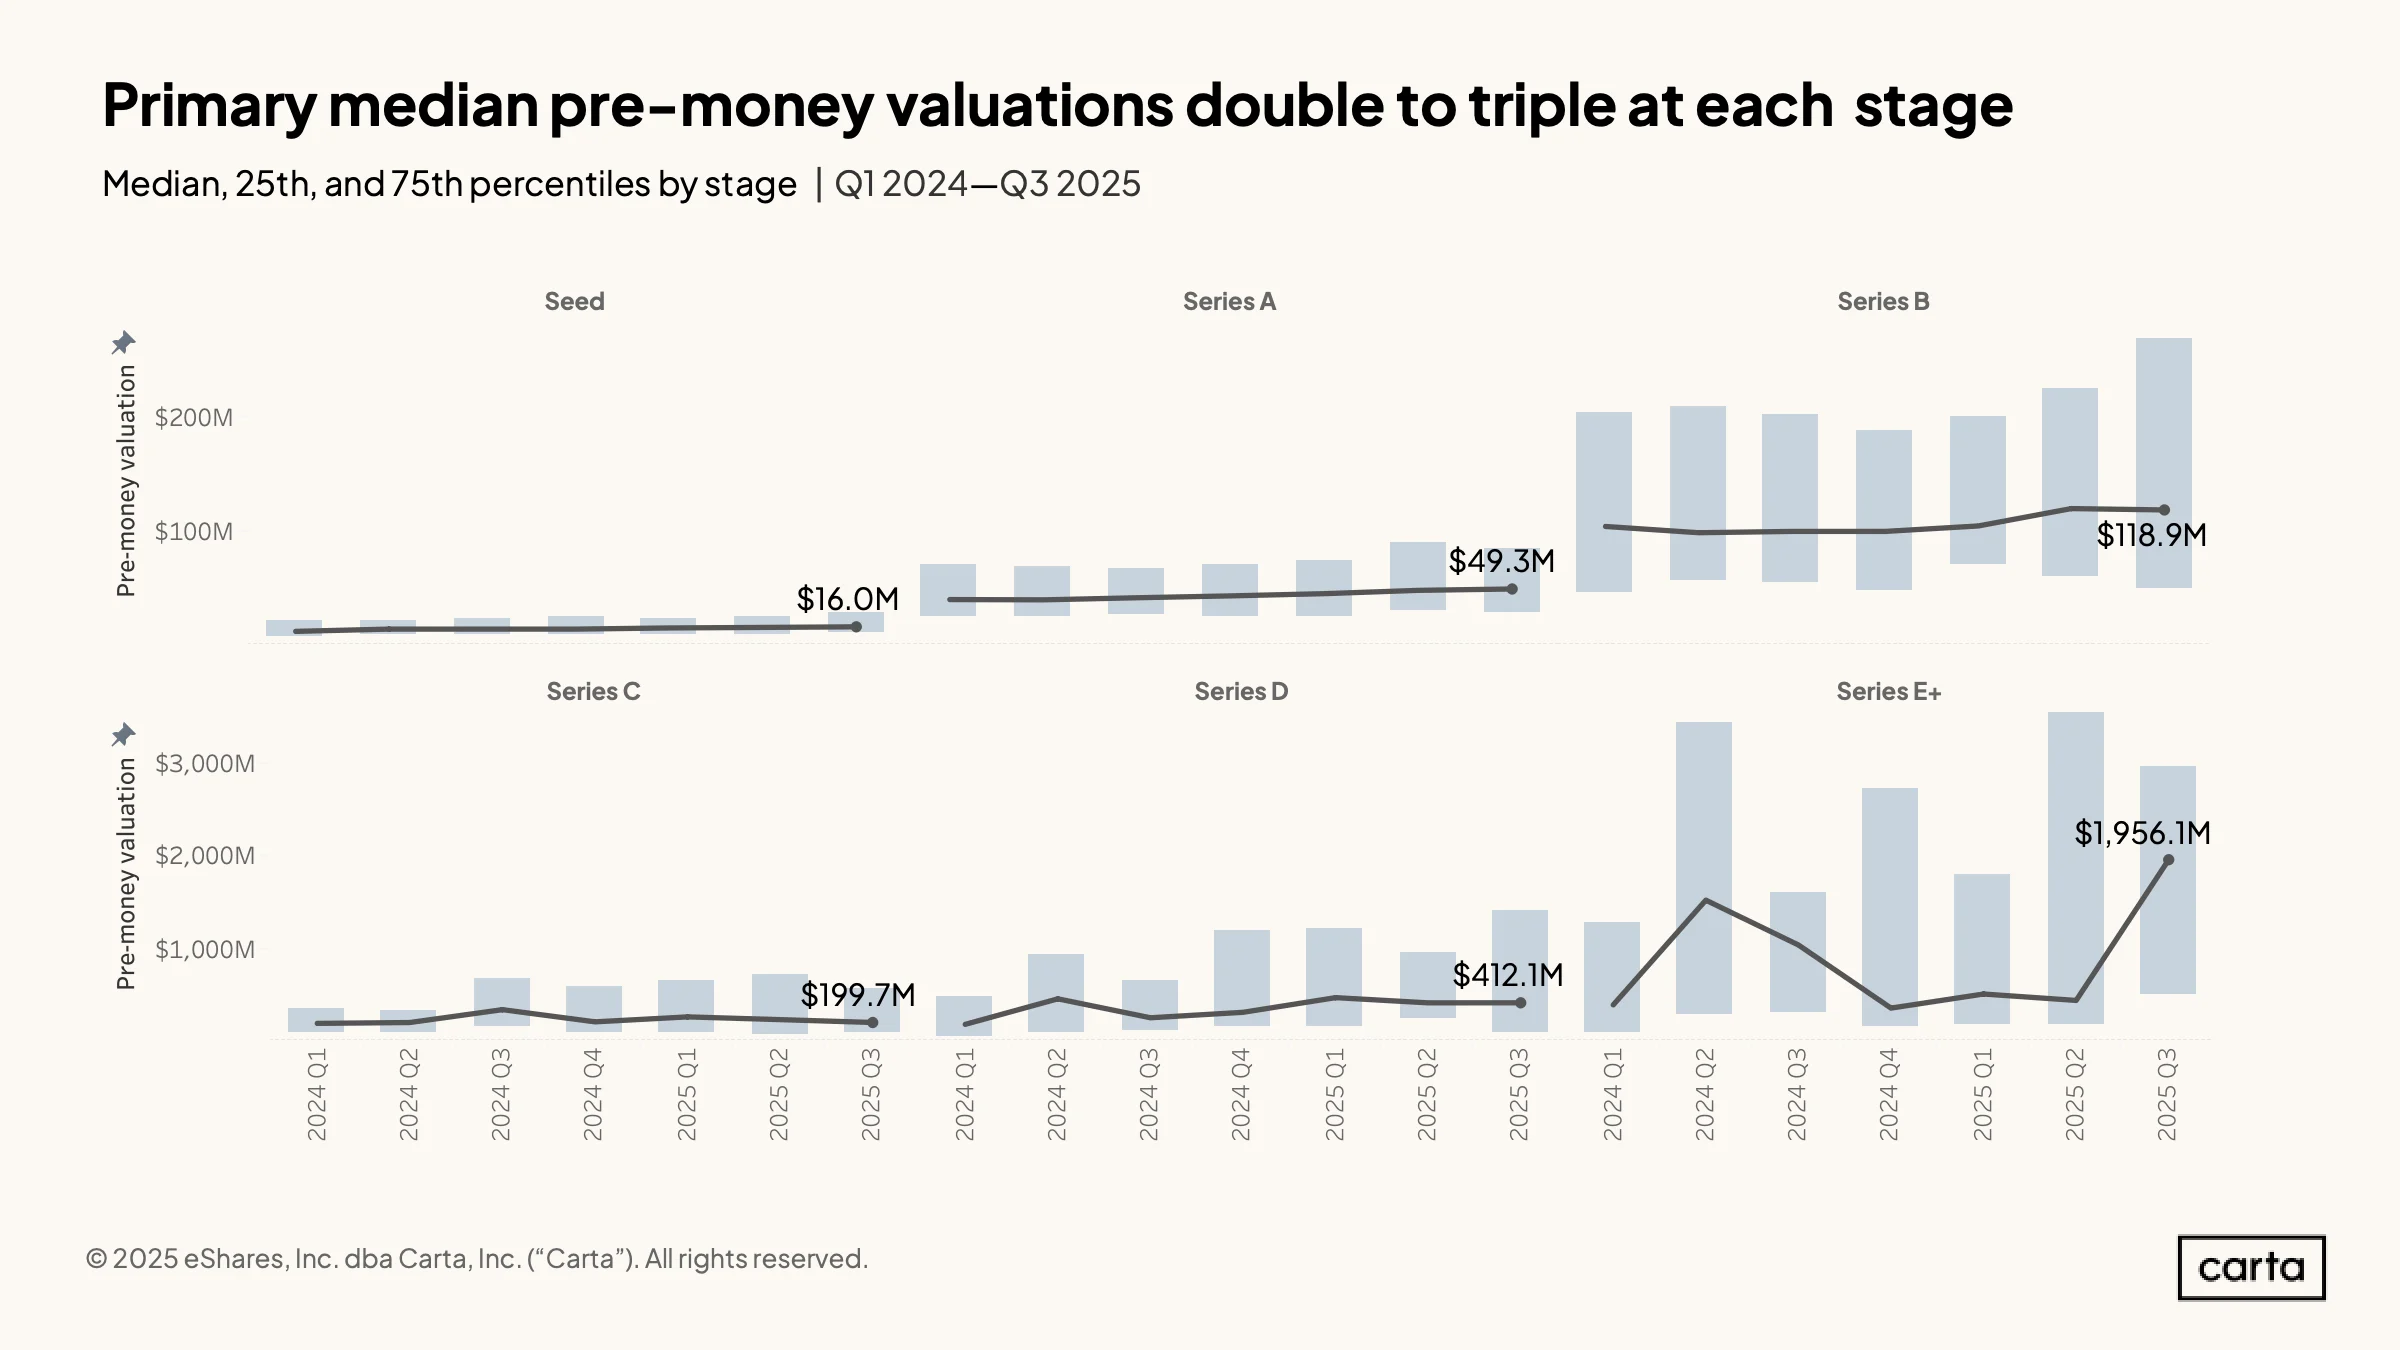
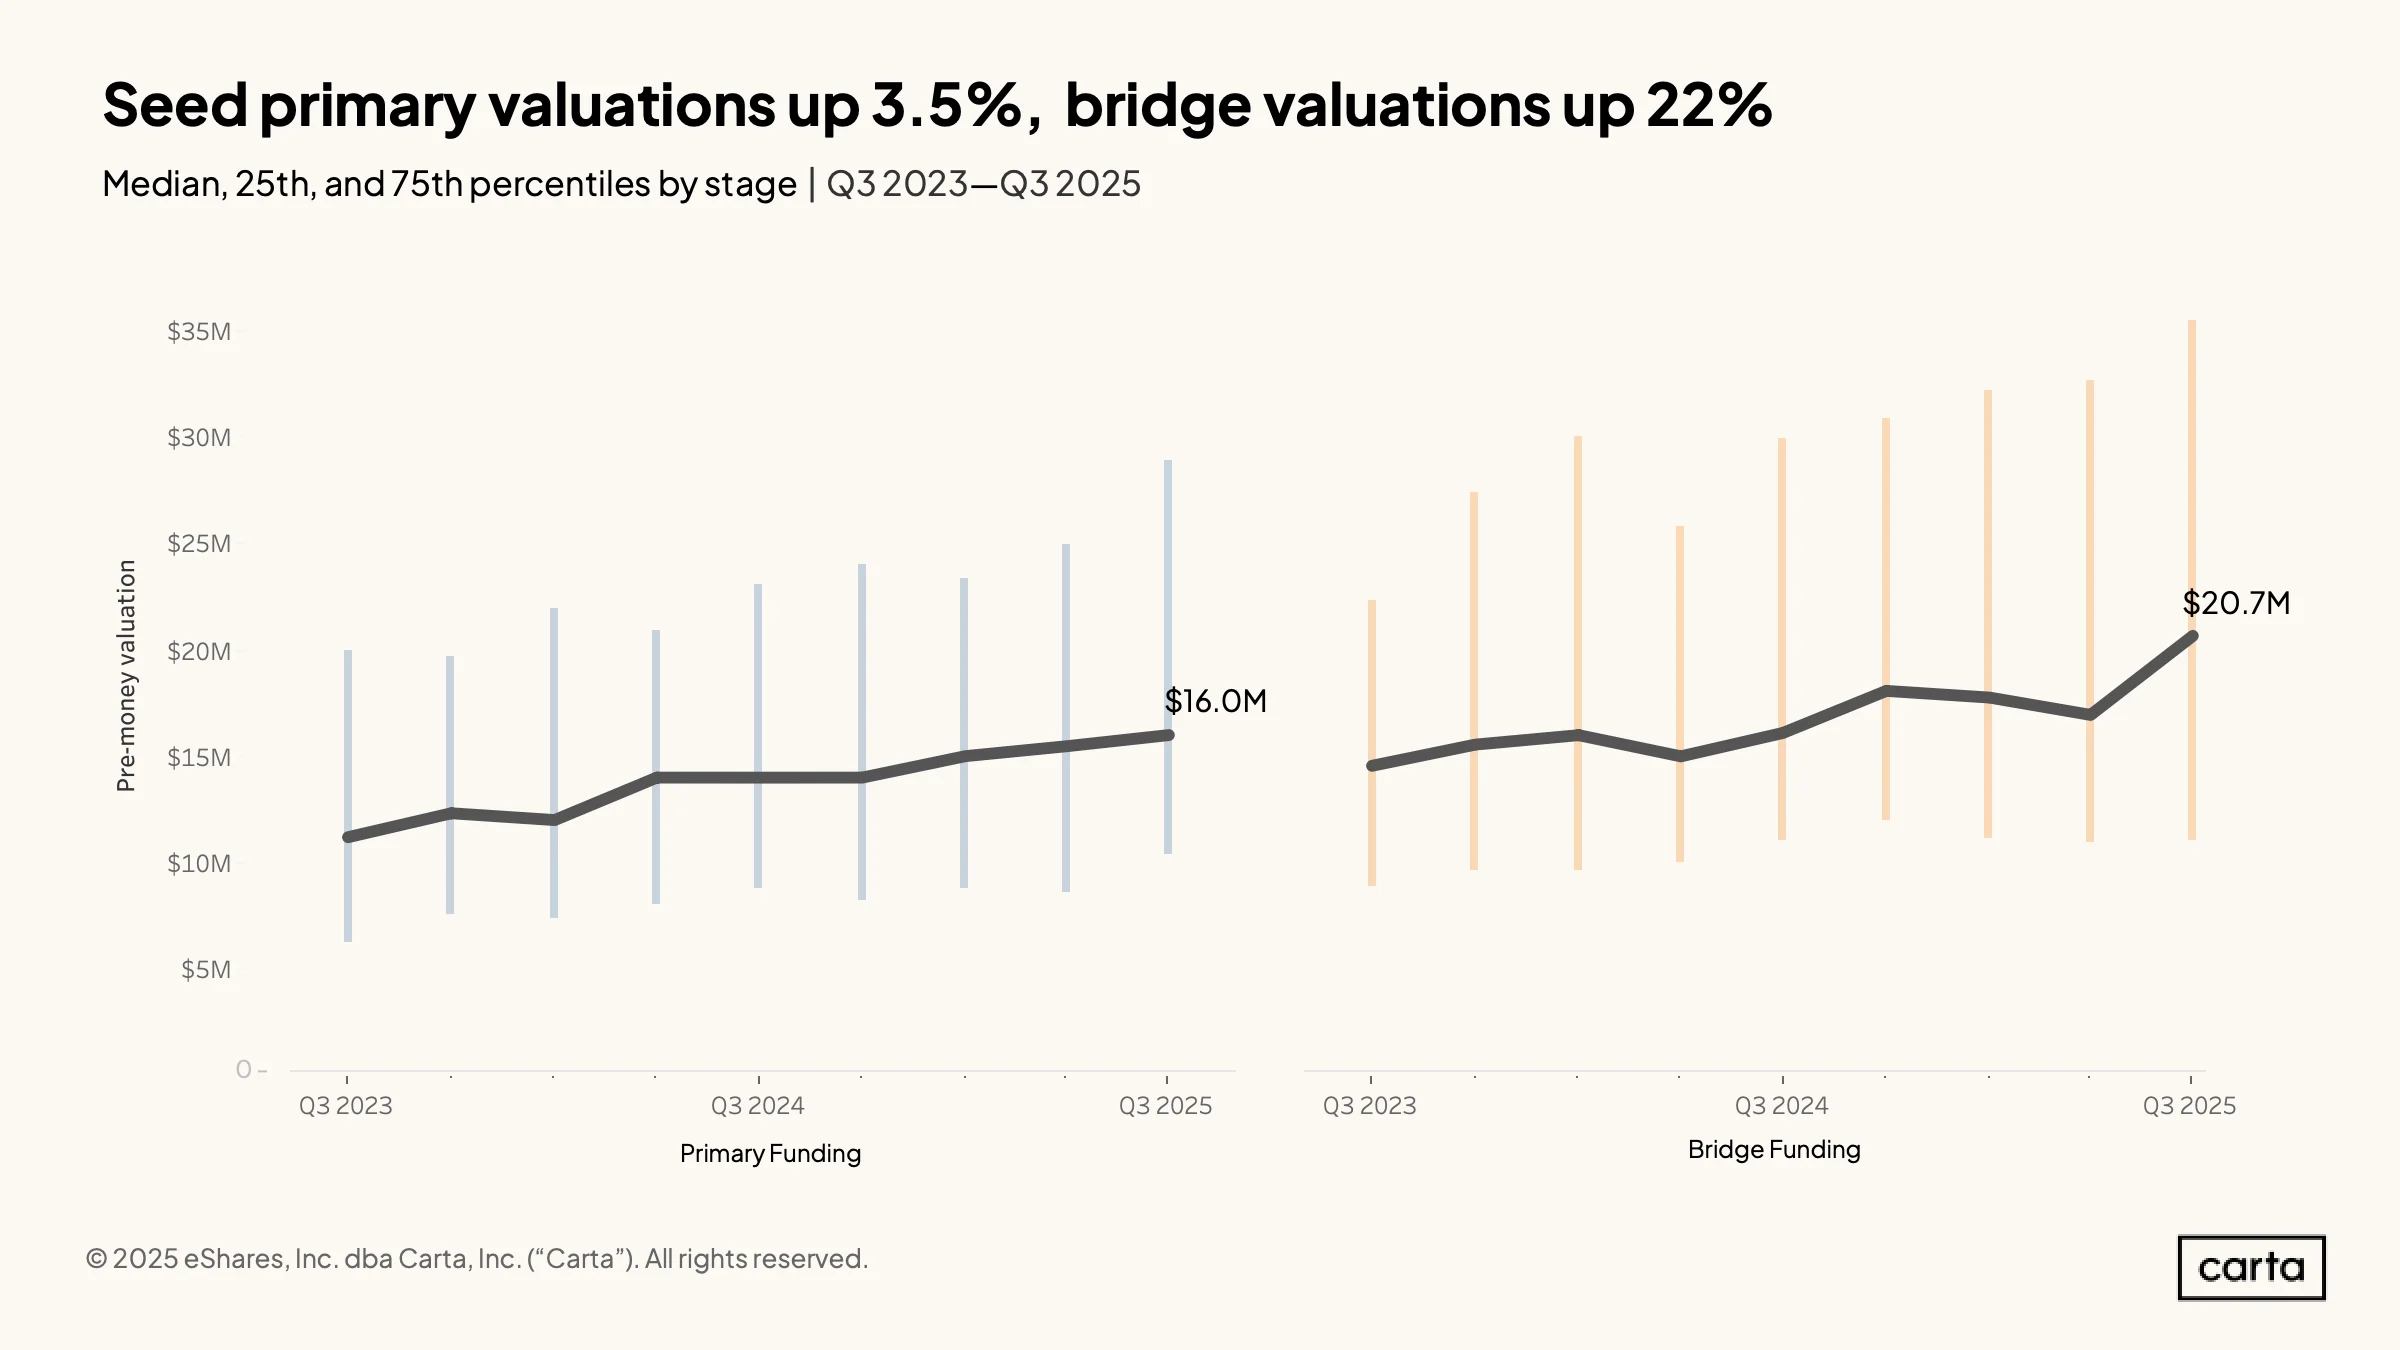
The median pre-money valuation among seed rounds on Carta reached a new high of $16 million in Q3, continuing a steady upward climb over the past two years. That’s good for a 3.5% increase over the previous quarter and a 14% increase year over year. The 25th percentile and 75th percentile for primary seed valuations hit new highs last quarter, too, with the 75th percentile approaching $30 million.
Valuations are also on the rise for seed-stage companies raising bridge rounds, with the median rising to $20.7 million in Q3, up 22% from the previous quarter. Across a broad sample of companies, VCs are proving increasingly willing to pay high prices at the earliest stages of startup life.
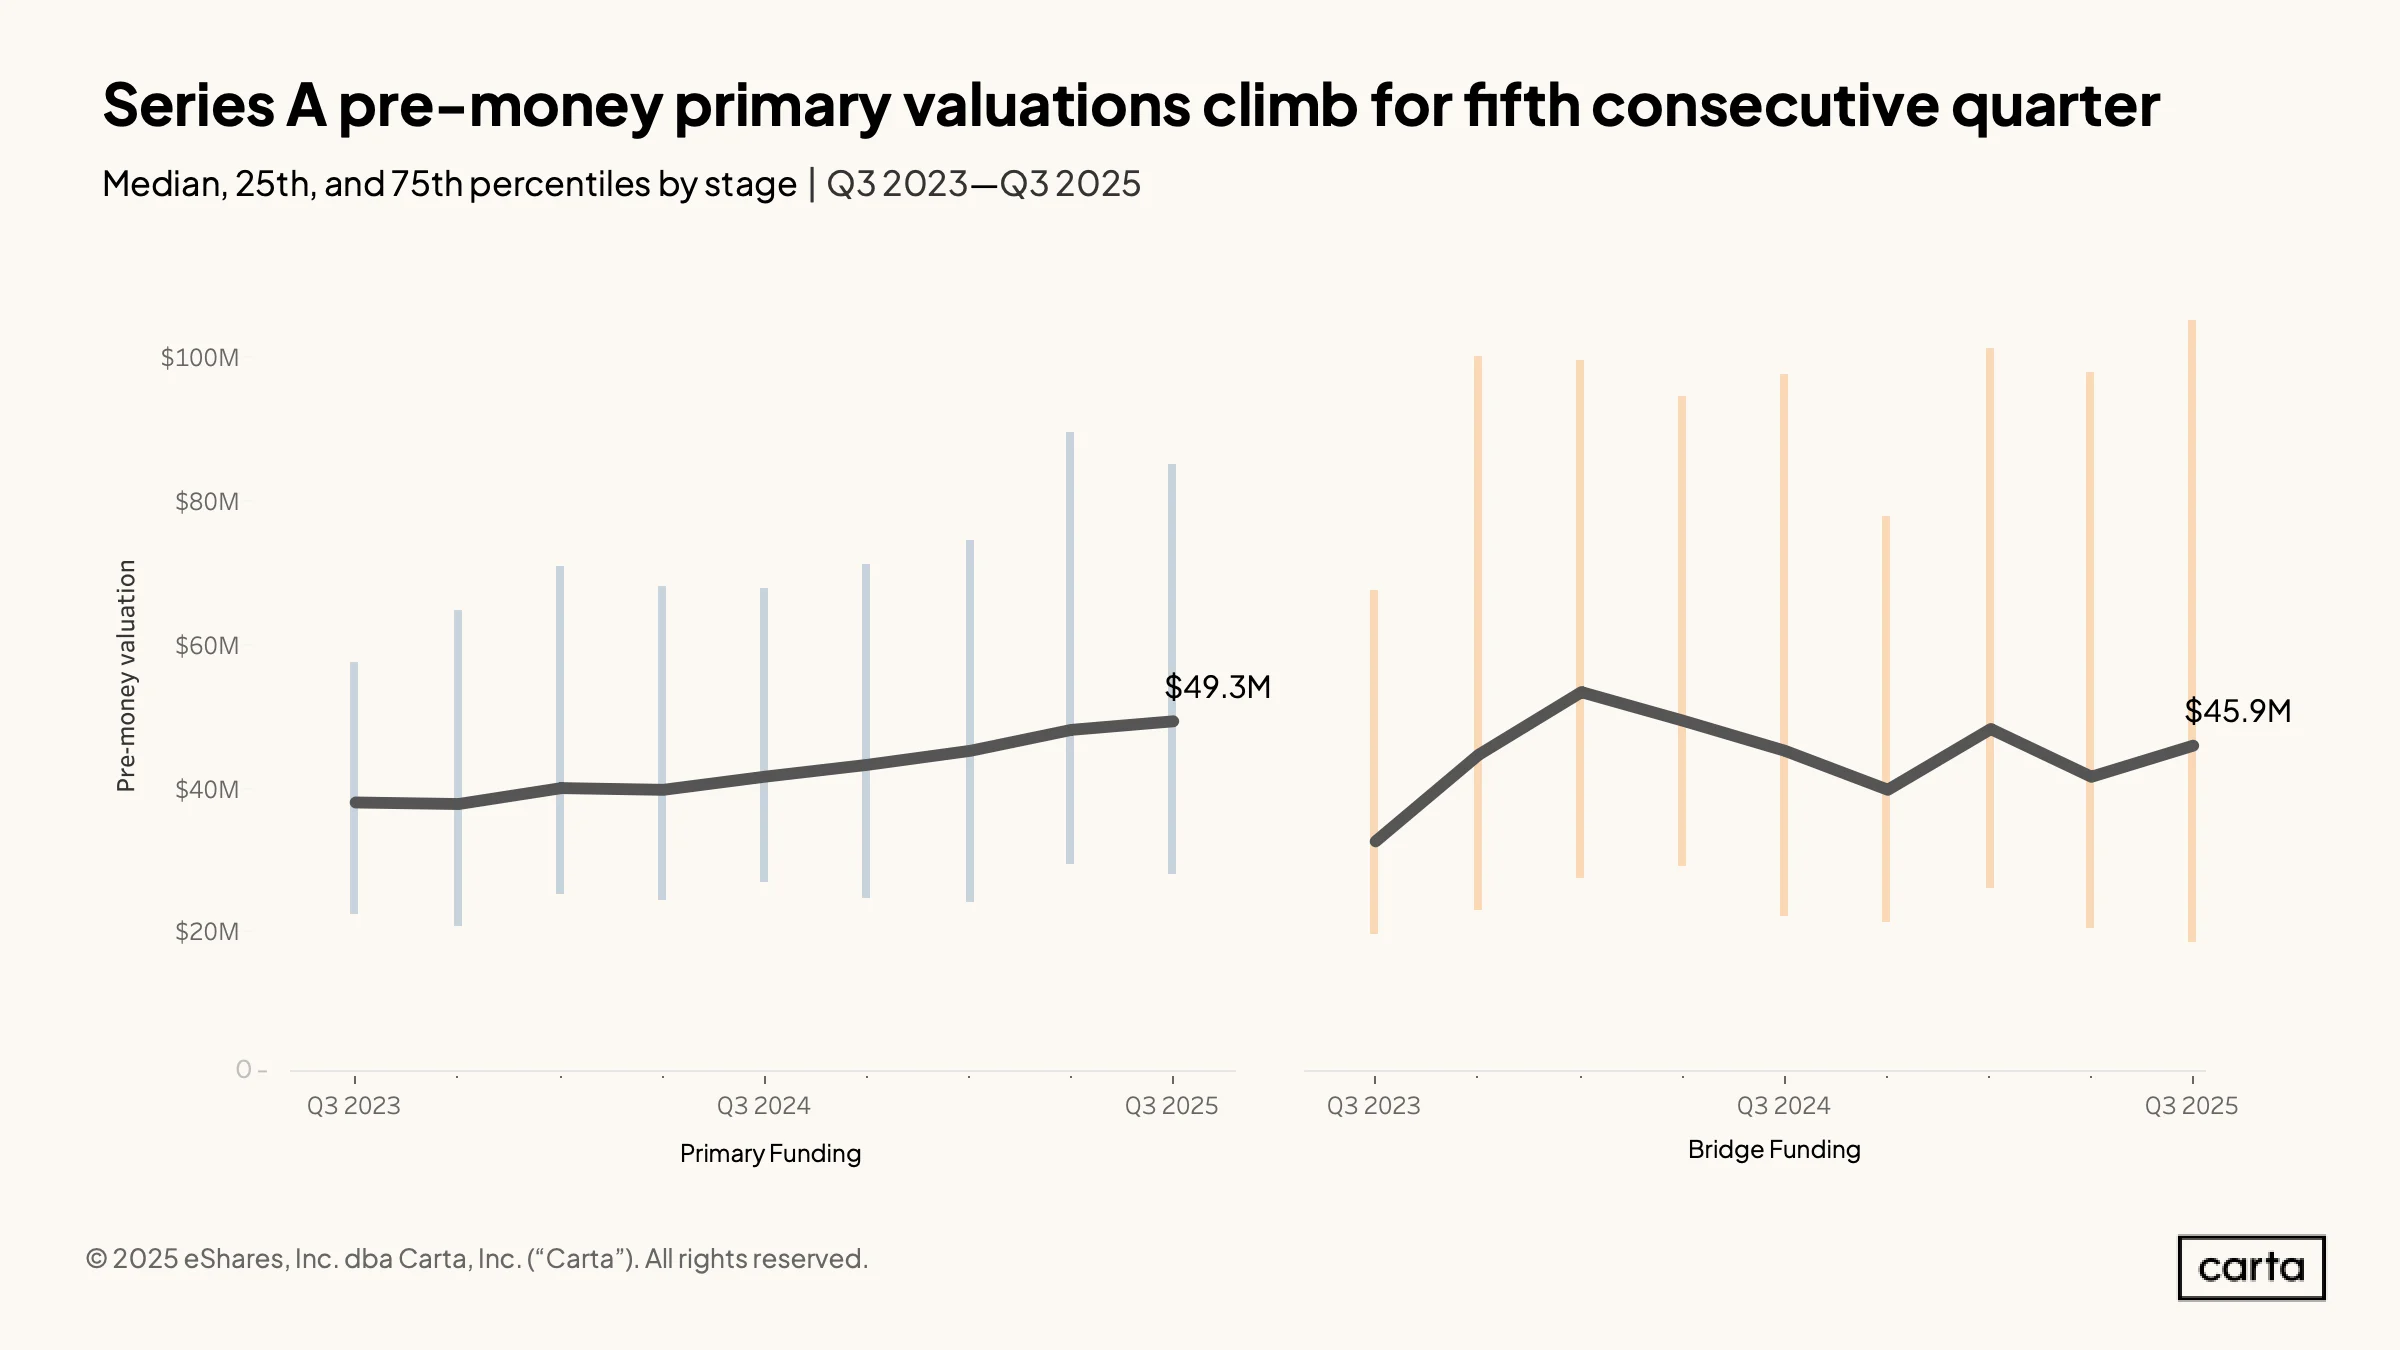
Just like at the seed stage, the pre-money valuations on primary rounds at Series A keeps going up, ascending to $49.3 million in Q3. With this latest bump, the median valuation on primary Series A deals has now increased in each of the past five quarters. Valuations are also trending up at the 75th percentile for Series A valuations, with an uptick of more than 25% from Q3 2024 to Q3 2025.
Valuations on bridge rounds raised by Series A startups have been much more consistent. Over the past year, they’ve been essentially flat, with Q3’s median bridge valuation of $45.9 million representing a year-over-year rise of just 2%. While investors are willing to pay increasingly high prices for Series A startups on a traditional fundraising path, Series A startups raising bridge rounds have found it more difficult to drive valuation growth.
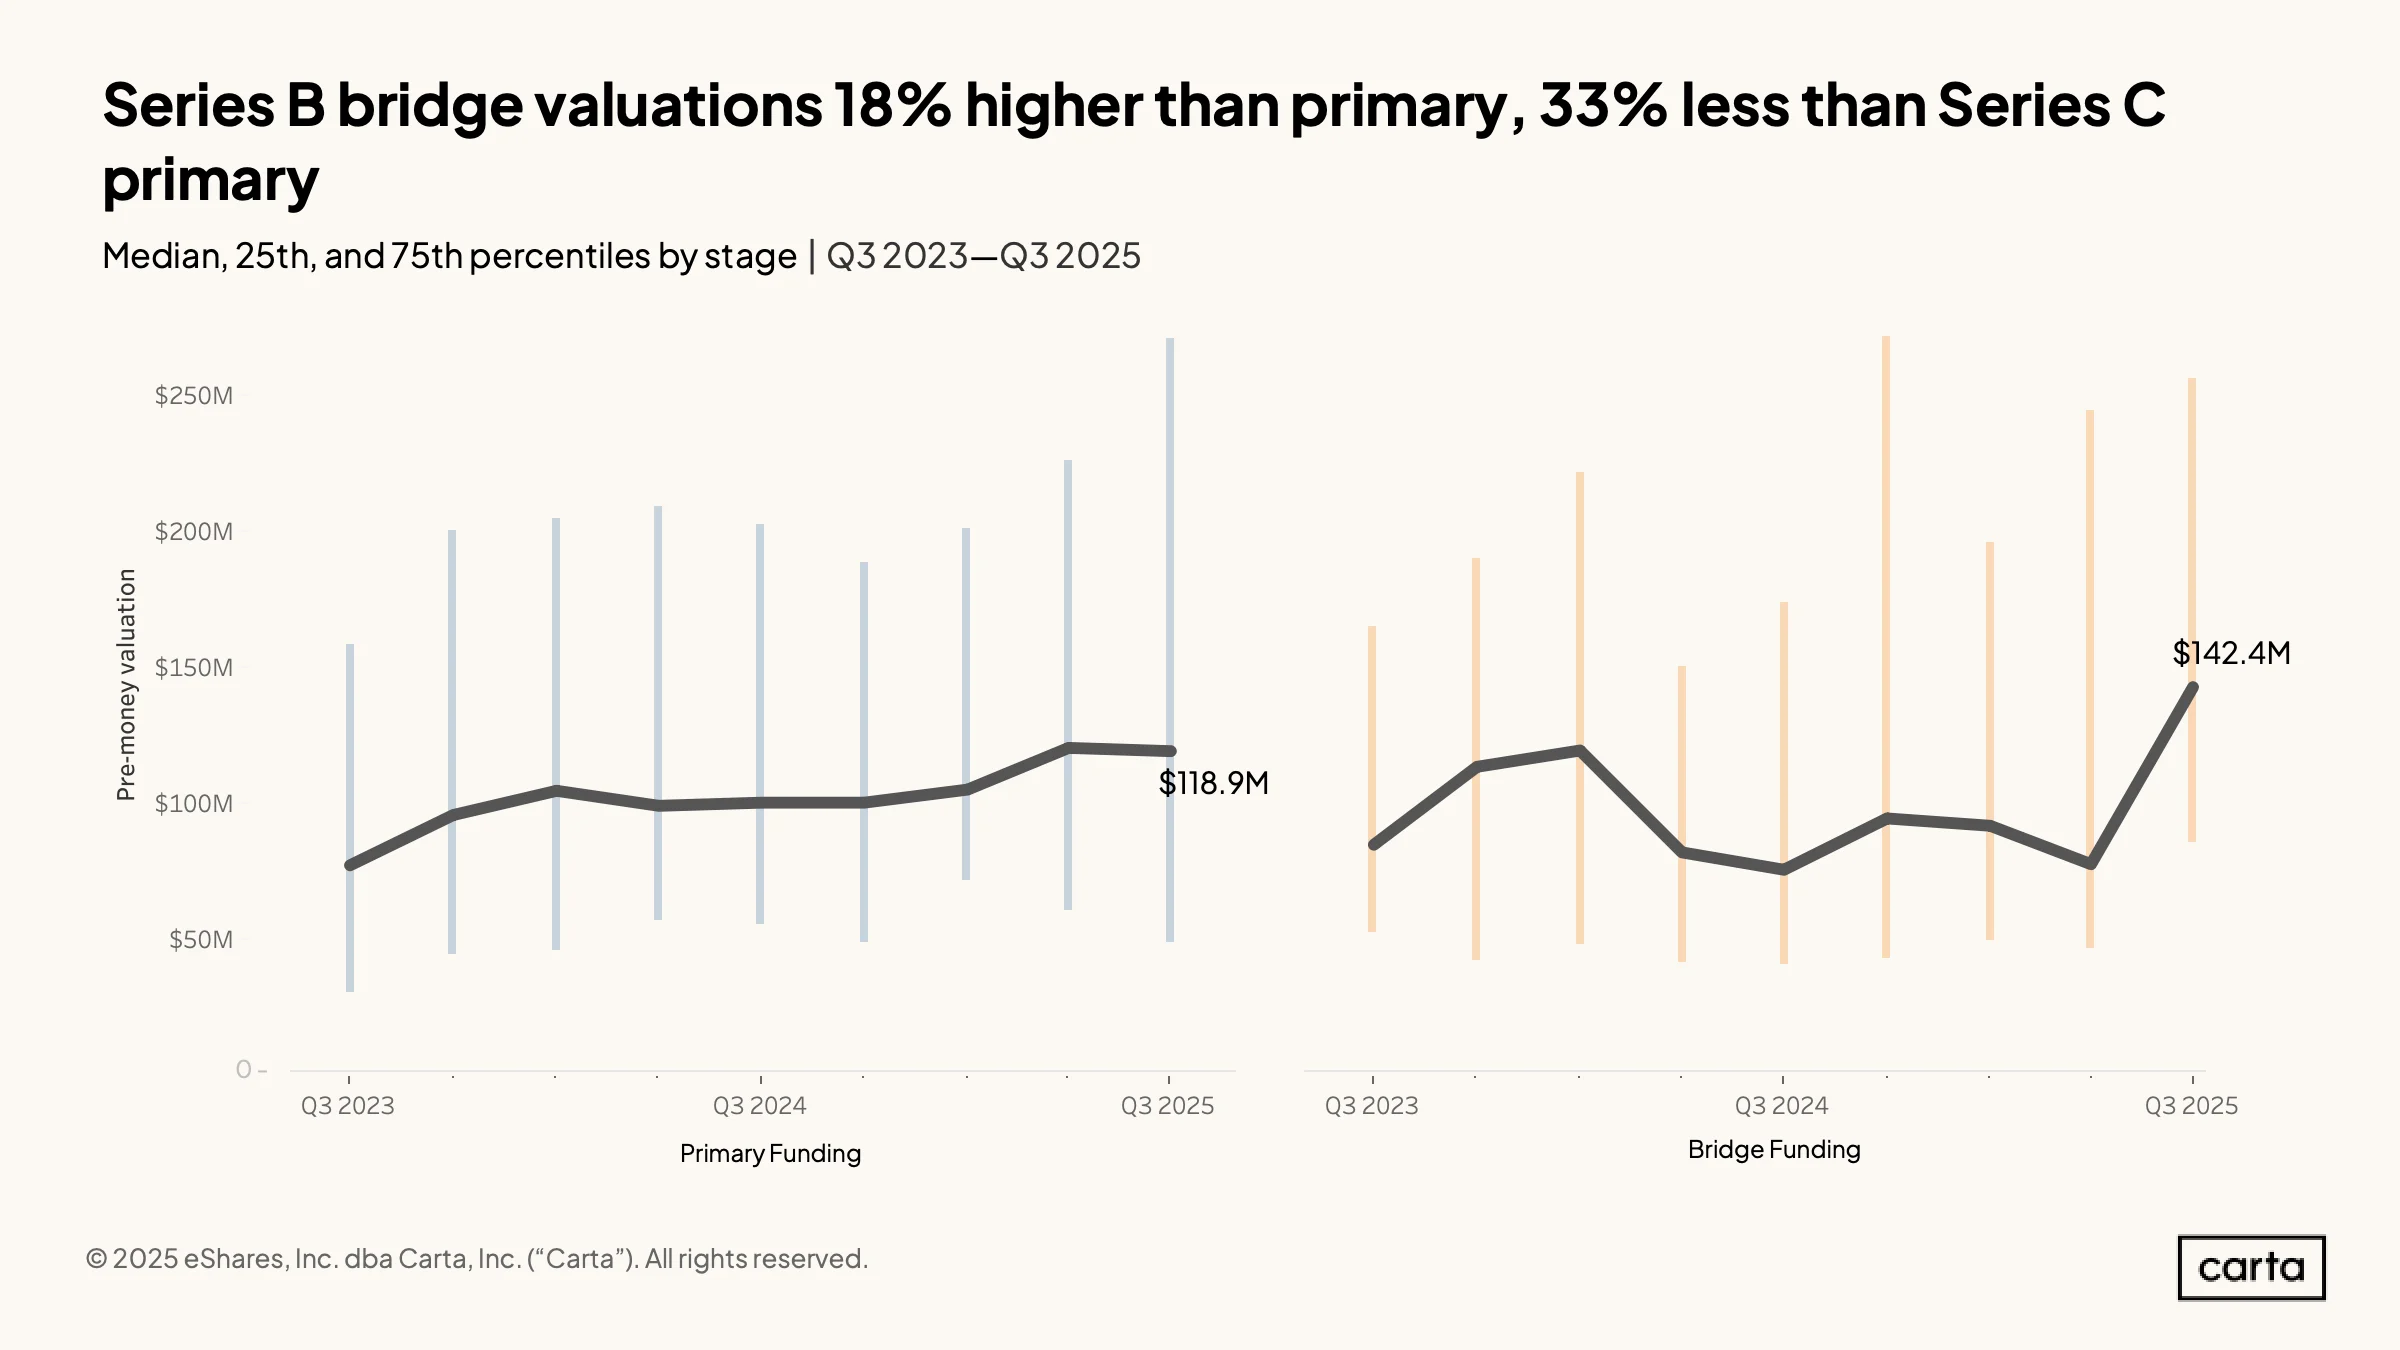
At Series B, the median pre-money valuation on primary rounds saw a slight dip in Q3, dropping to $118.9 million from $120.1 million the previous quarter. Over the past two years, however, primary Series B valuations are following a clear upward trend. This is particularly true at the upward end of the market: The 75th percentile for primary Series B valuations has now increased in each of the past three quarters, climbing to about $270 million in Q3.
For most of the previous two years, median valuations for bridge rounds among Series B startups had been moving in the opposite direction. But that trend reversed course in Q3, as the median bridge valuation rose to $142.4 million, a quarter-over-quarter jump of 84%.
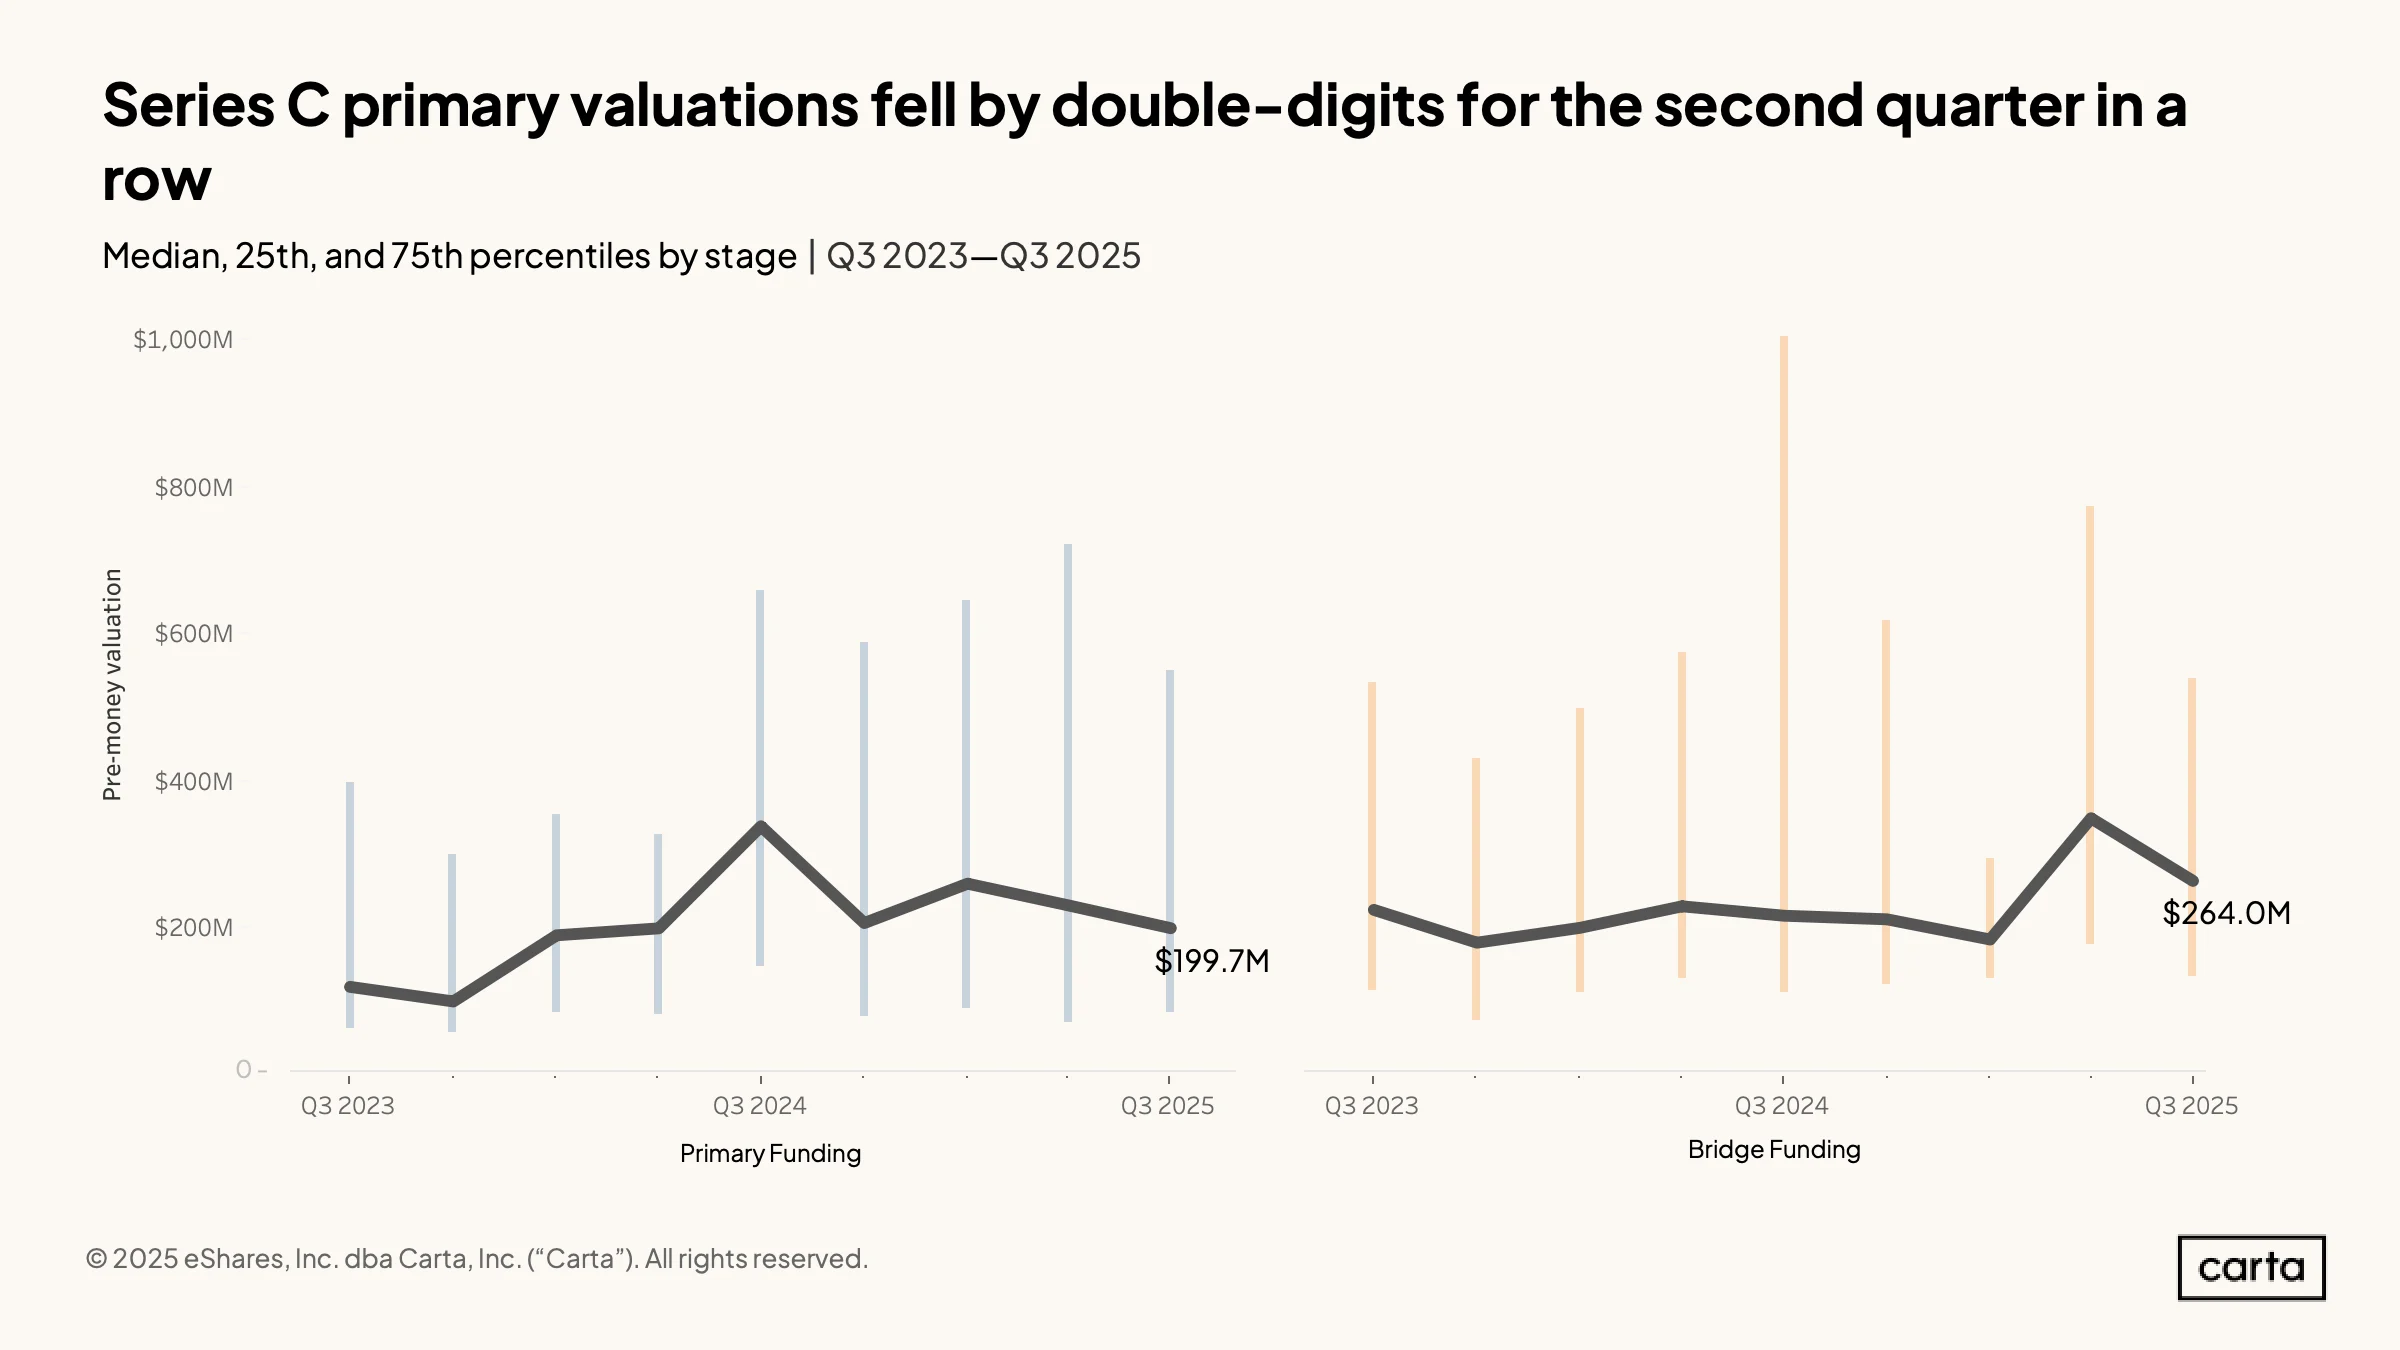
The median pre-money valuation on primary Series C rounds dropped below $200 million in Q3 2025 for the first time since Q2 2024, continuing a yearlong slide. Compared to the previous quarter, the median Series C valuation fell by 13% in Q3. Compared to the same period last year, the median valuation is down 41%.
The median pre-money valuation on bridge rounds raised by Series C companies has now been higher than the median valuation for primary Series C rounds in back-to-back quarters, a departure from the recent trend. Year over year, the median bridge valuation at Series C rose by 21.9%.
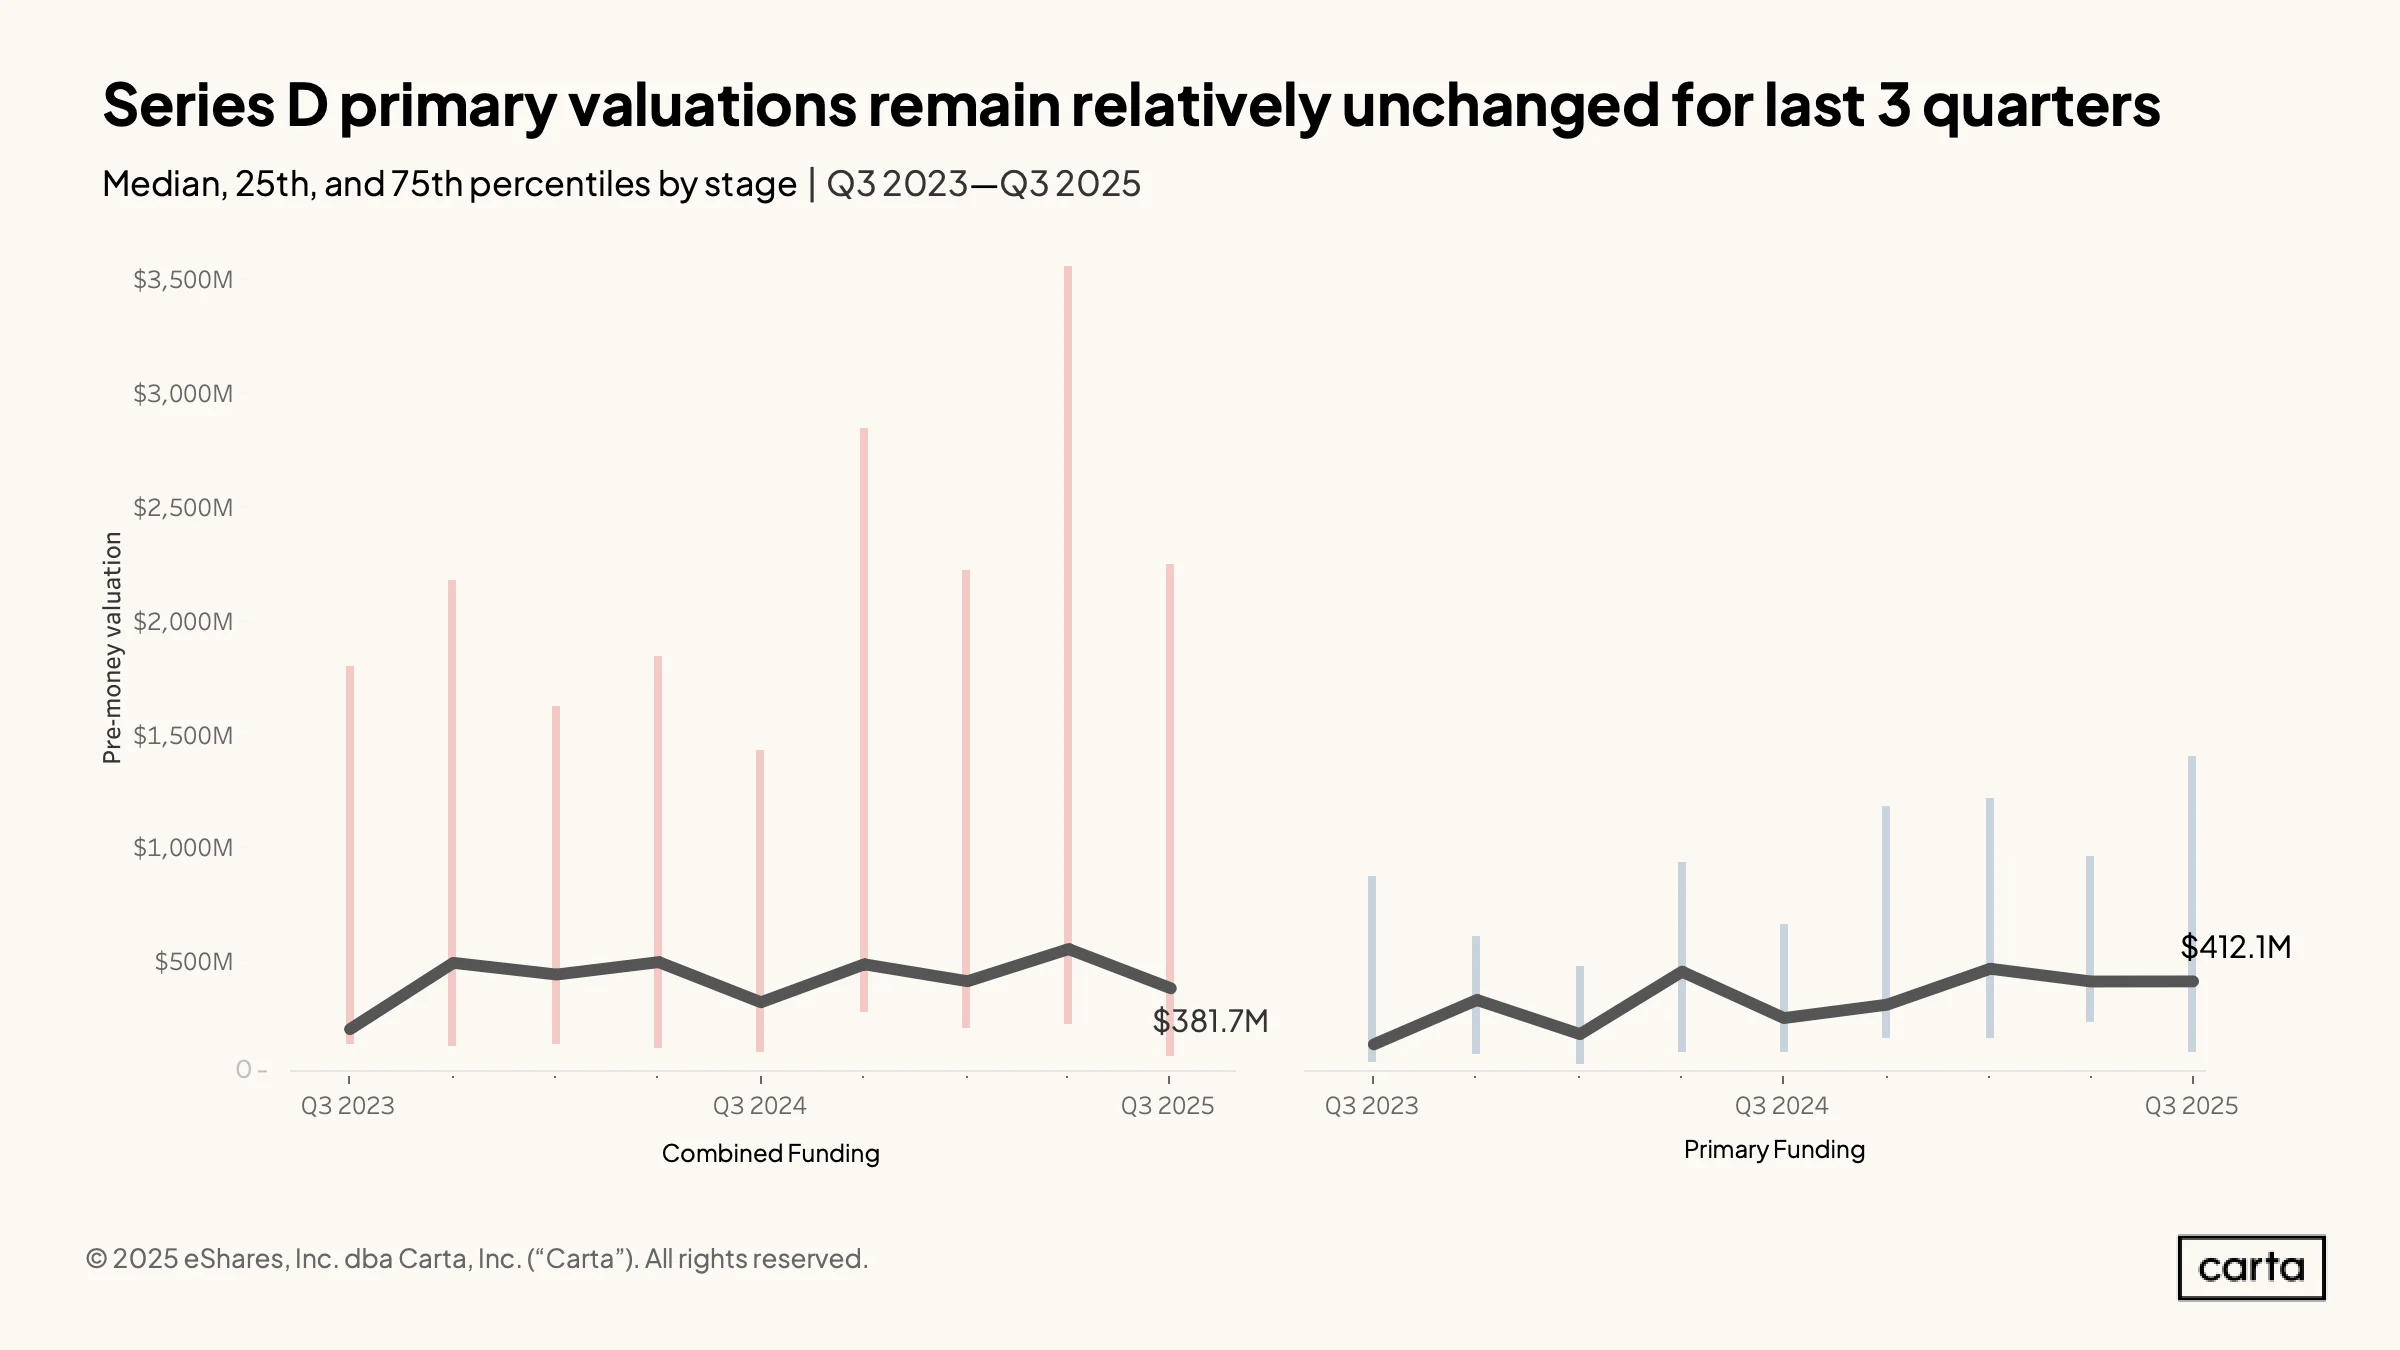
At Series D, the median primary valuation in new venture rounds on Carta has now declined in two consecutive quarters, dropping to $412.1 million from $467.8 million over that span. However, on the two-year timeline shown here, Series D valuations are clearly trending up: Back in Q3 2023, the median valuation on primary Series D rounds was just $134.8 million.
The 75th percentile for primary Series D valuations has also been on the rise, signaling that the upper end of the market is recovering well from the broad valuation reset and dealmaking slowdown that began in late 2022. In Q3 2025, the 75th percentile valuation jumped to about $1.4 billion, compared to about $657 million the same time last year—an annual increase of 113%.
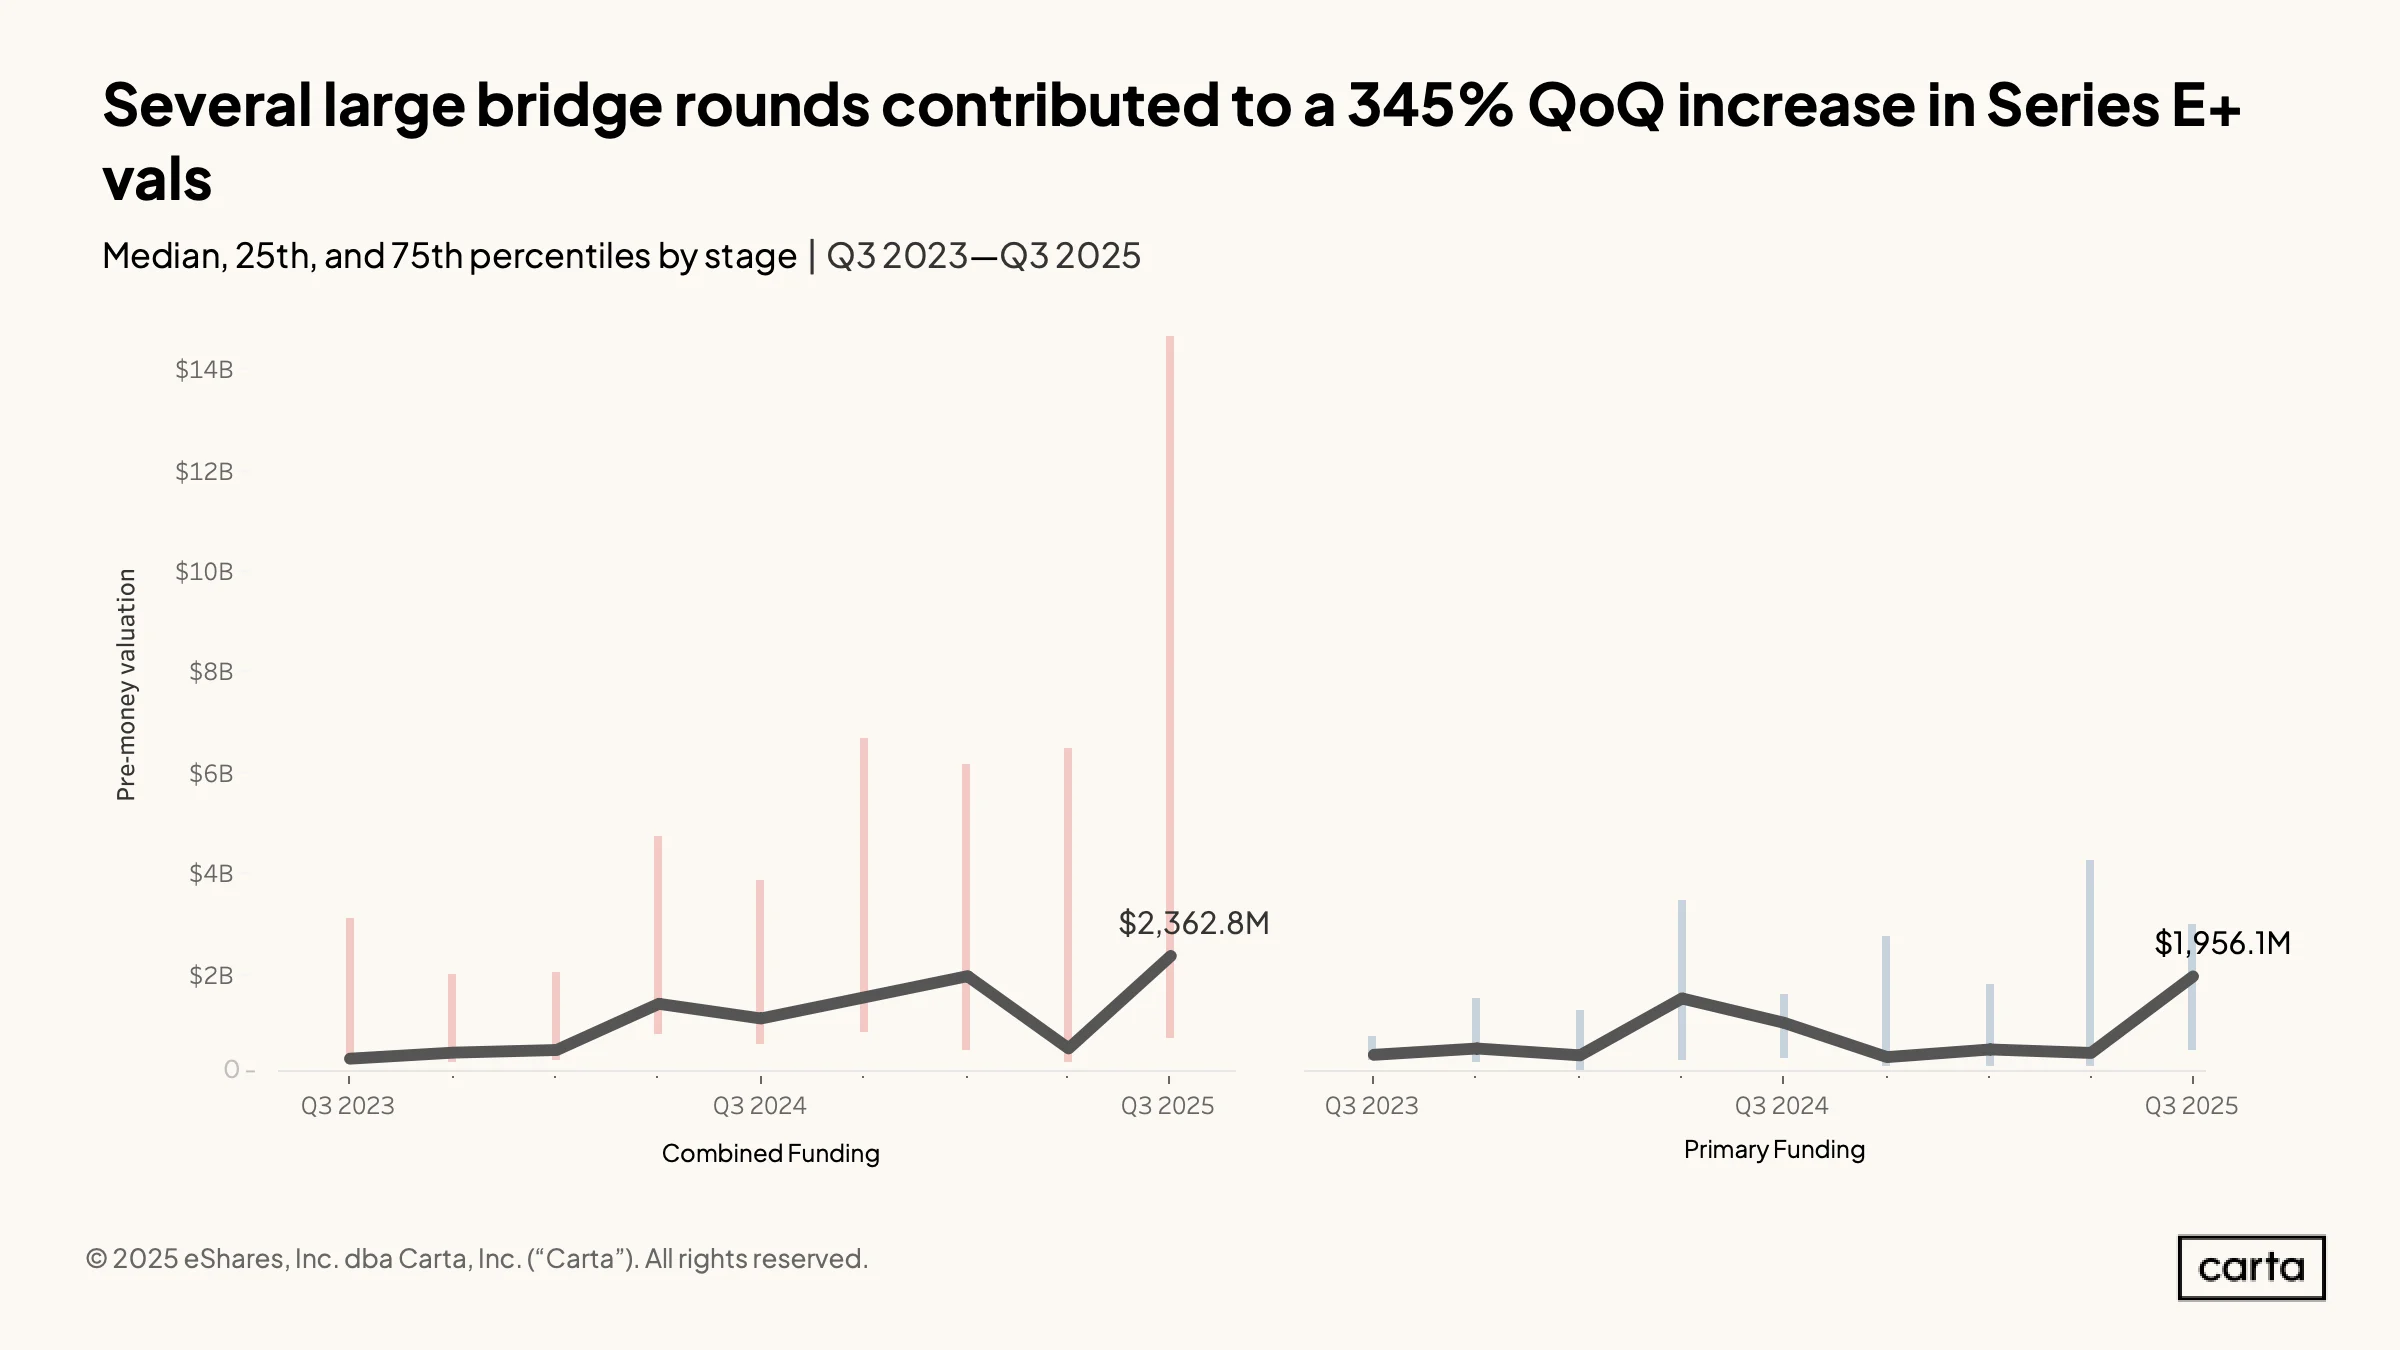
After falling precipitously in Q2, the median pre-money valuation on rounds at Series E and beyond bounced back in a big way in Q3, rising to nearly $2.4 billion—easily the highest it’s been in the past two years. On an annual basis, the median valuation at Series E+ was up 111% in Q3.
With the exception of the aforementioned Q2, valuations at Series E+ have been steadily rising over the past two years. As is the case at Series D, the market for new financings at Series E+continues to recover from the significant slowdown that began in late 2022 and continued into 2023.
Geographical trends
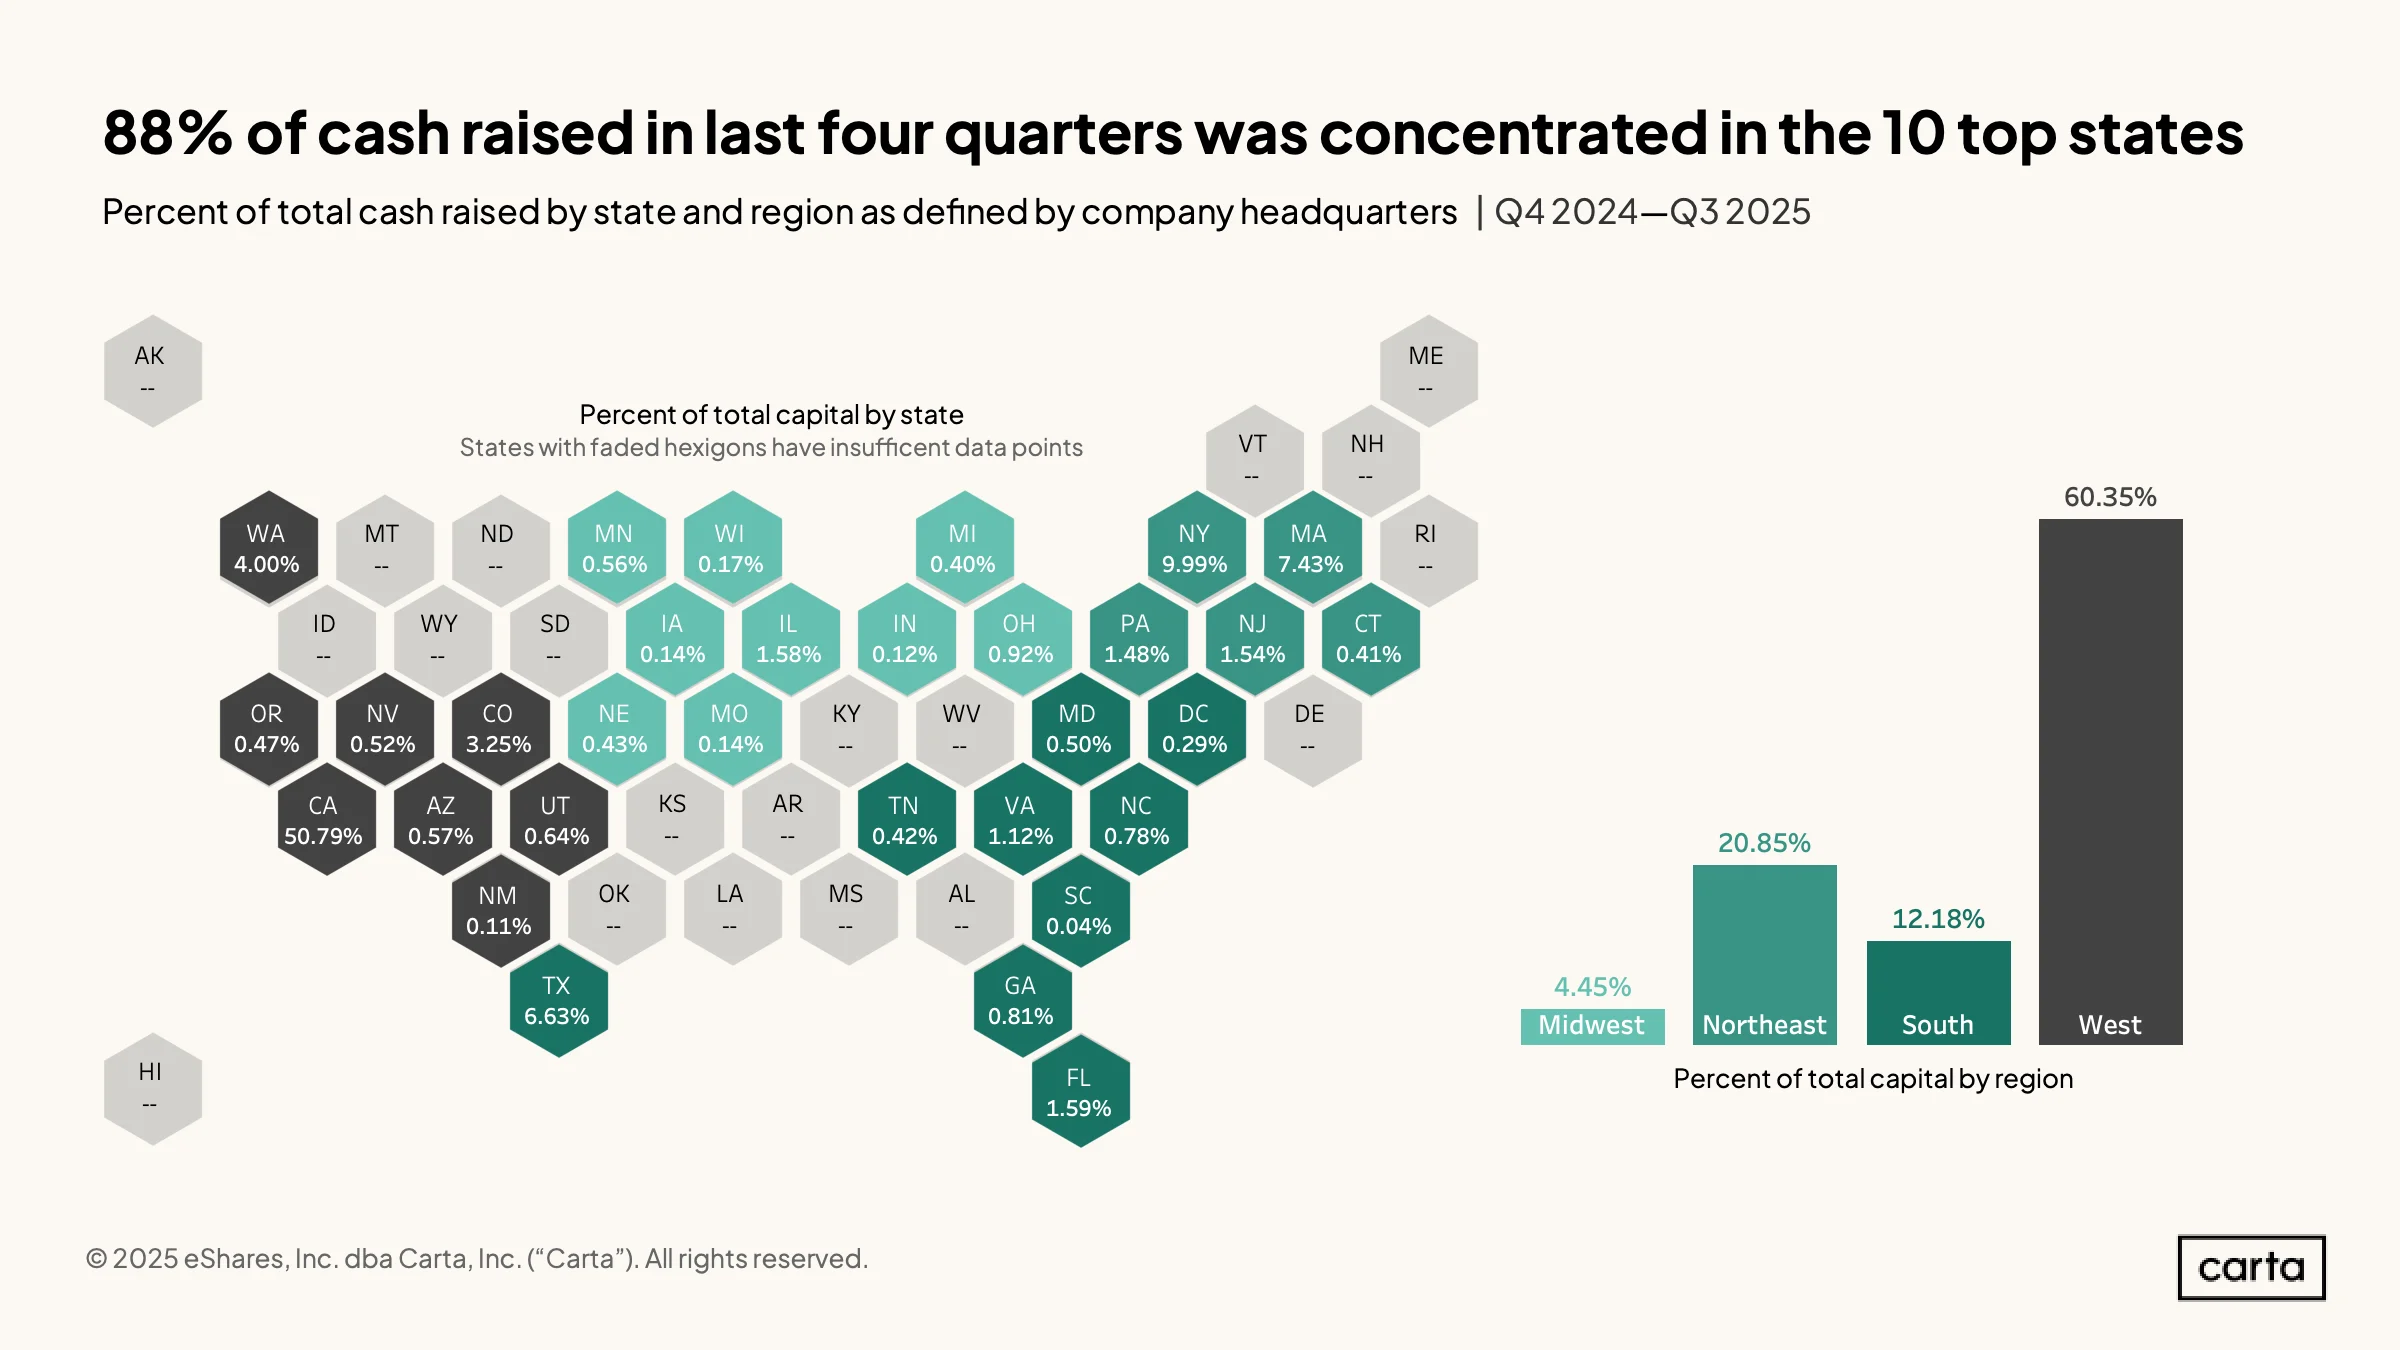
From the start of Q4 2024 through the end of Q3 2025, startups based in California raised more new venture funding than all other states combined, with a 50.8% share of all cash raised. New York claimed the second largest share of funding over this span, at just shy of 10%, followed by Massachusetts (7.4%) and Texas (6.6%).
Overall, some 88% of cash raised in the past 12 months went to companies across just 10 different states, showing the degree to which venture funding tends to be concentrated in the industry’s top hubs. At the other end of the spectrum, there were 20 states in the U.S. that saw fewer than 10 venture funding rounds over the past year.
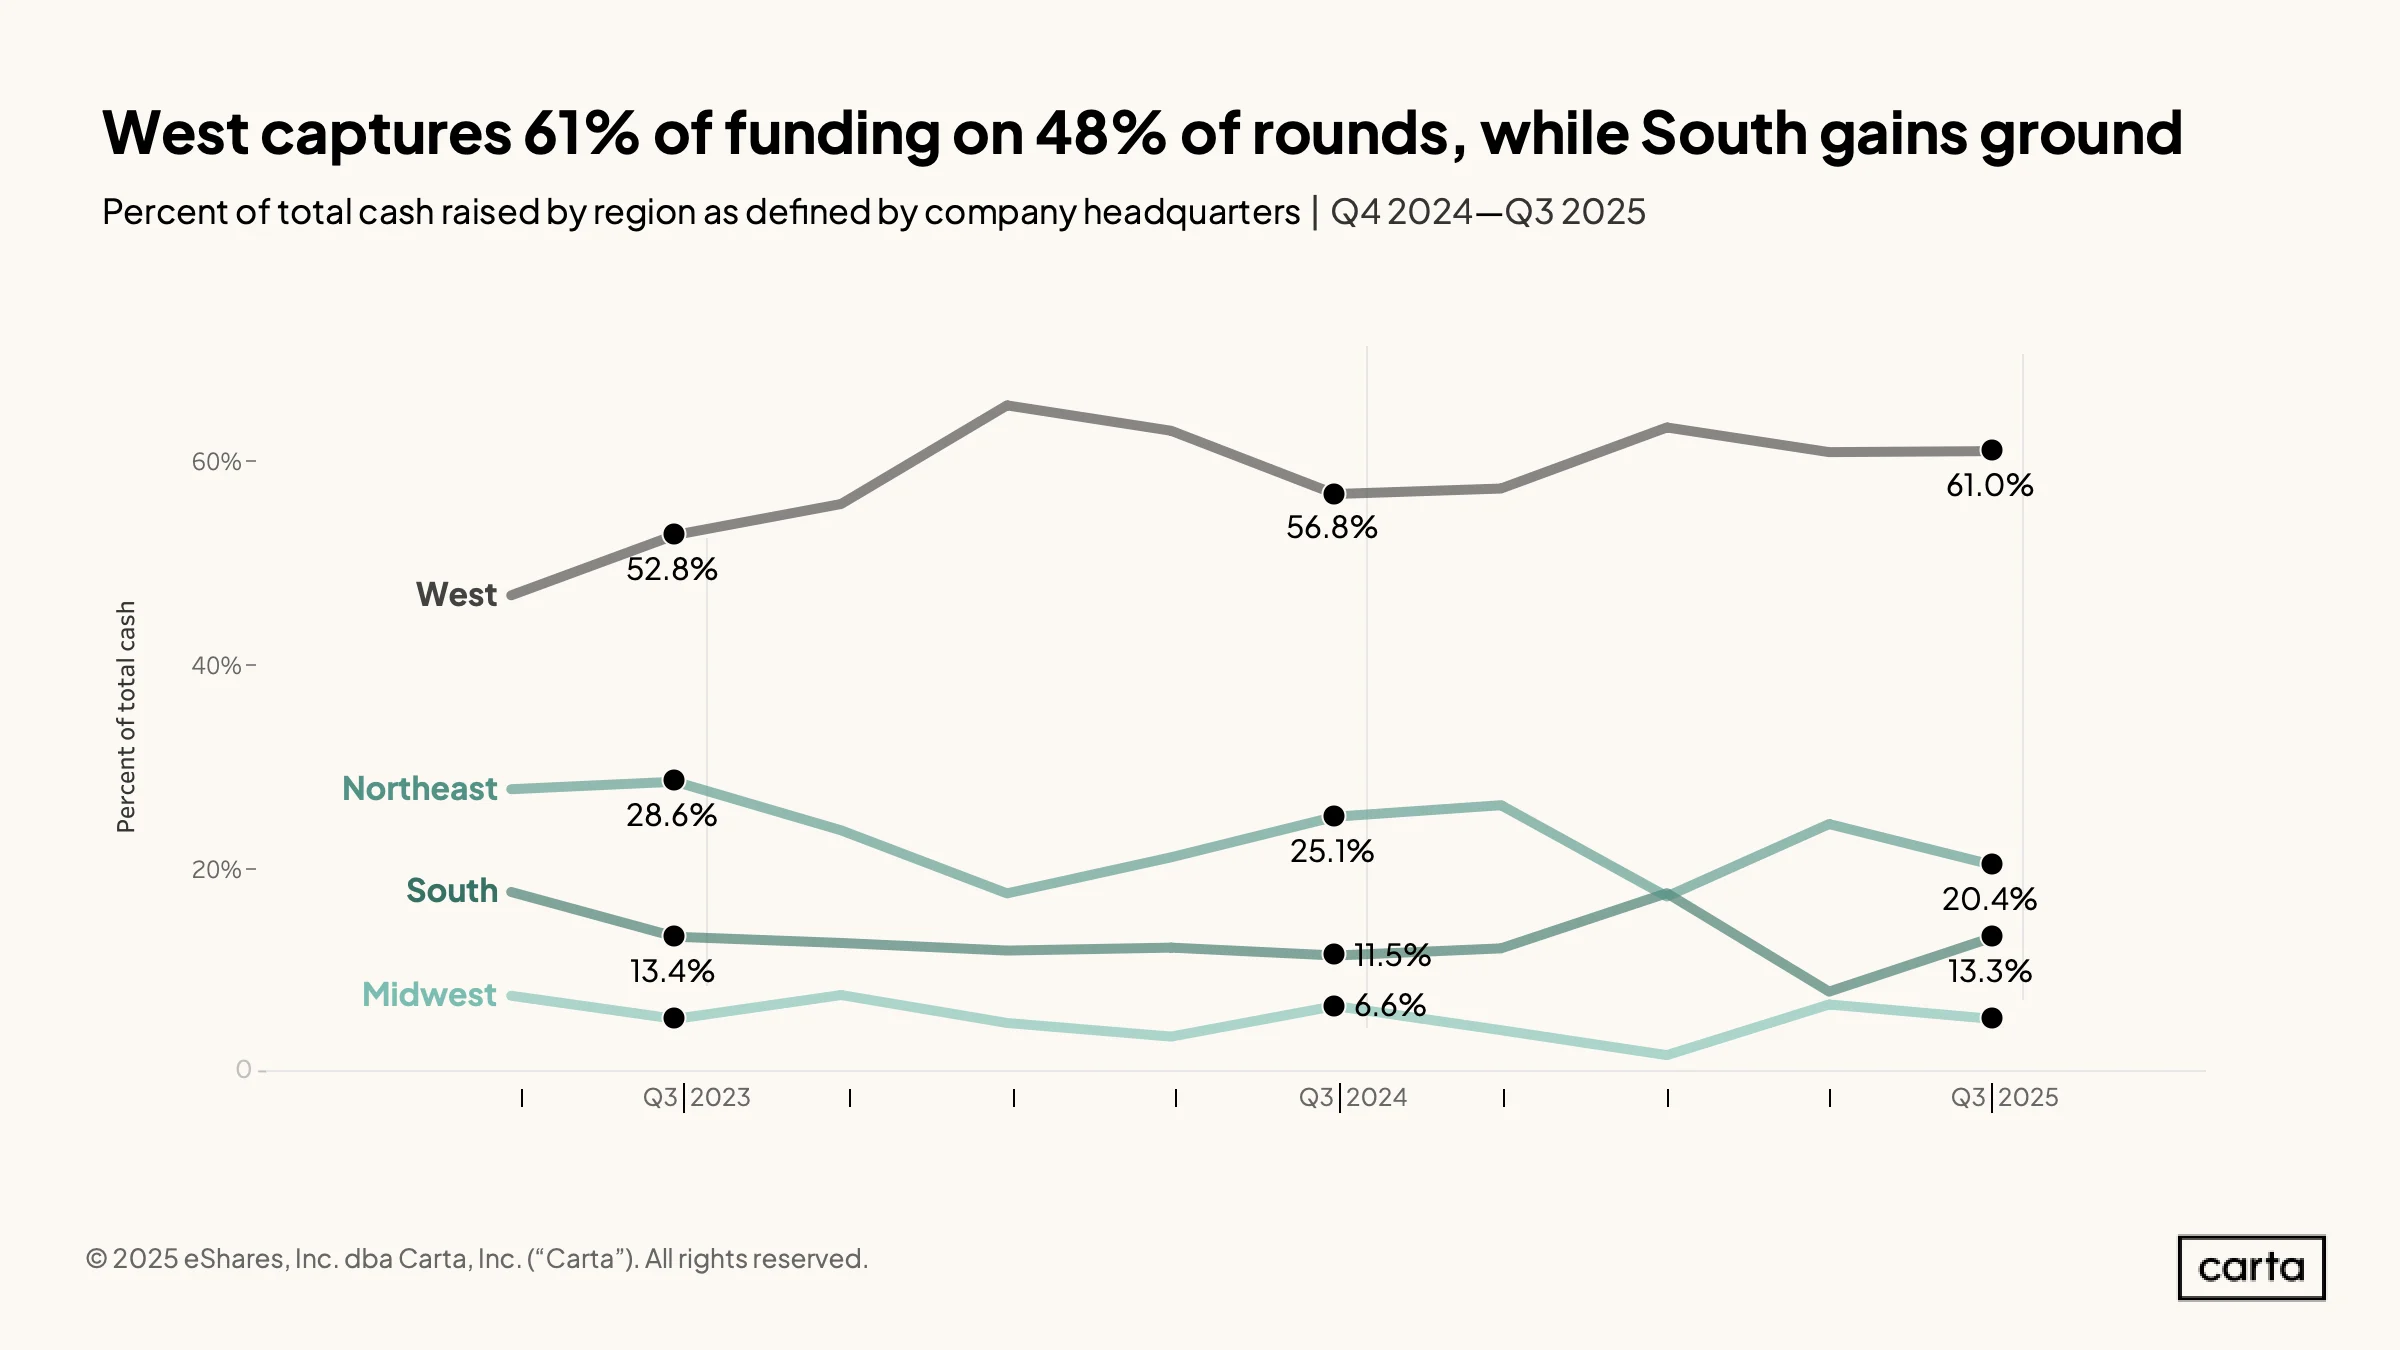
Led by California, startups in the West census region were responsible for 61% of all venture cash raised on Carta in Q3, a rate nearly three times higher than any other region. The West has always been home to the largest percentage of VC funding, but it has consolidated its advantage during the past two years.
As the West gained ground, both the Northeast and Midwest regions saw their share of total venture funding decline in Q3, with the Northeast falling from 24.4% to 20.4%. The South, meanwhile, bounced back in Q3 after its share of funding fell off the prior quarter.
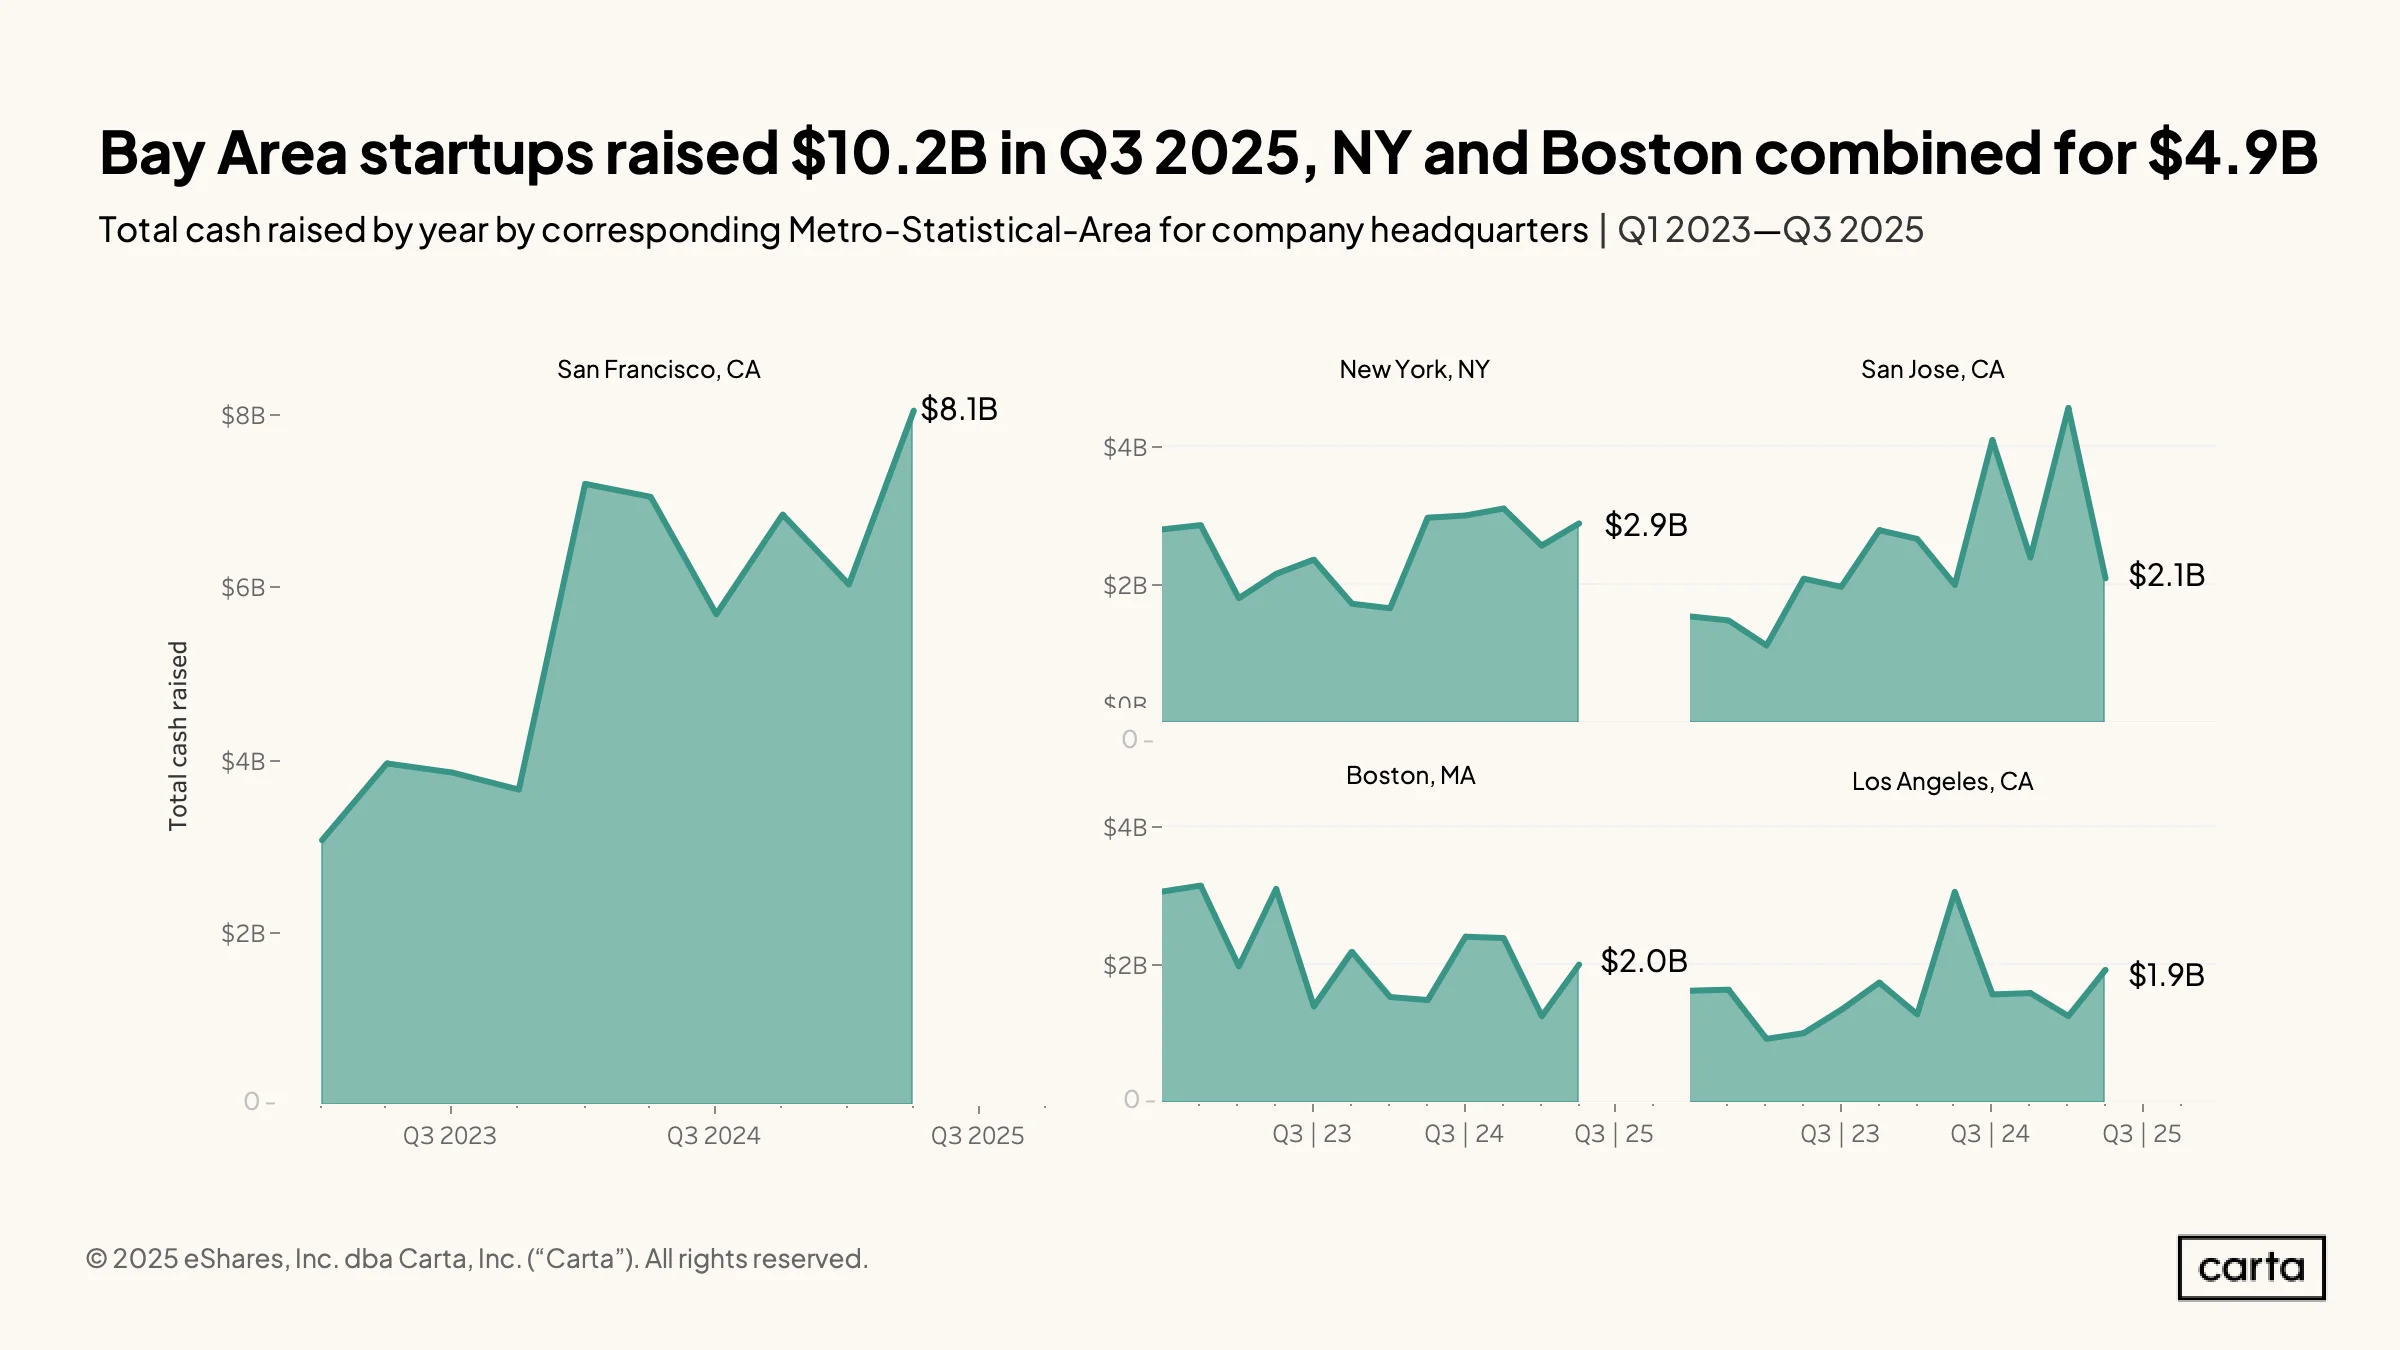
Startups based in the San Francisco metropolitan area collected $8.1 billion in new venture funding during Q3, far more than any other U.S. metro. San Jose ranked third, with $2.1 billion. Both of these Bay Area metros have seen a notable increase in their fundraising totals in the past two years, likely driven by the Bay Area’s role as the center of the ongoing AI revolution.
Other top metro areas for venture activity have not seen the same recent fundraising gains. The New York, Boston, and Los Angeles metros combined to account for about $6.8 billion in new Q3 funding, still more than $1 billion less than San Francisco on its own.
Methodology
Carta helps more than 50,000 primarily venture-backed companies and 1.6 million security holders manage over $4 trillion in equity. We share insights from this unmatched dataset about the private markets and venture ecosystem to help founders, employees, and investors make informed decisions and understand market conditions.
Overview
This study uses an aggregated and anonymized sample of Carta customer data. Companies that have contractually requested that we not use their data in anonymized and aggregated studies are not included in this analysis.
The data presented in this private markets report represents a snapshot as of November 13 , 2025. Historical data may change in future studies because there is typically an administrative lag between the time a transaction took place and when it is recorded in Carta. In addition, new companies signing up for Carta’s services will increase historical data available for the report.
Financings
Financings include equity deals raised in USD by U.S.-based corporations. The financing “series” (e.g. Series A) is taken from the share class name in their applicable certificate or articles of incorporation. Financing rounds that don’t follow this standard are not included in any data shown by series but are included in data not shown by series. Primary rounds are defined as the first equity round within a series. Bridge rounds are defined as any round raised after the first round in a given series.
In some cases, convertible notes are raised and converted at various discounted prices within a series (e.g. Series A-1, Series A-2, Series A-3). In these cases, converted securities are not included in cash raised, and only the post-money valuation of the new money is included.


DISCLOSURE: This communication is on behalf of eShares, Inc. dba Carta, Inc. ("Carta"). This communication is for informational purposes only, and contains general information only. Carta is not, by means of this communication, rendering accounting, business, financial, investment, legal, tax, or other professional advice or services. This publication is not a substitute for such professional advice or services nor should it be used as a basis for any decision or action that may affect your business or interests. Before making any decision or taking any action that may affect your business or interests, you should consult a qualified professional advisor. This communication is not intended as a recommendation, offer or solicitation for the purchase or sale of any security. Carta does not assume any liability for reliance on the information provided herein. ©2026 Carta. All rights reserved. Reproduction prohibited.