Executive summary
When it comes to value creation, the best-performing venture funds of the past decade are running away from the competition.
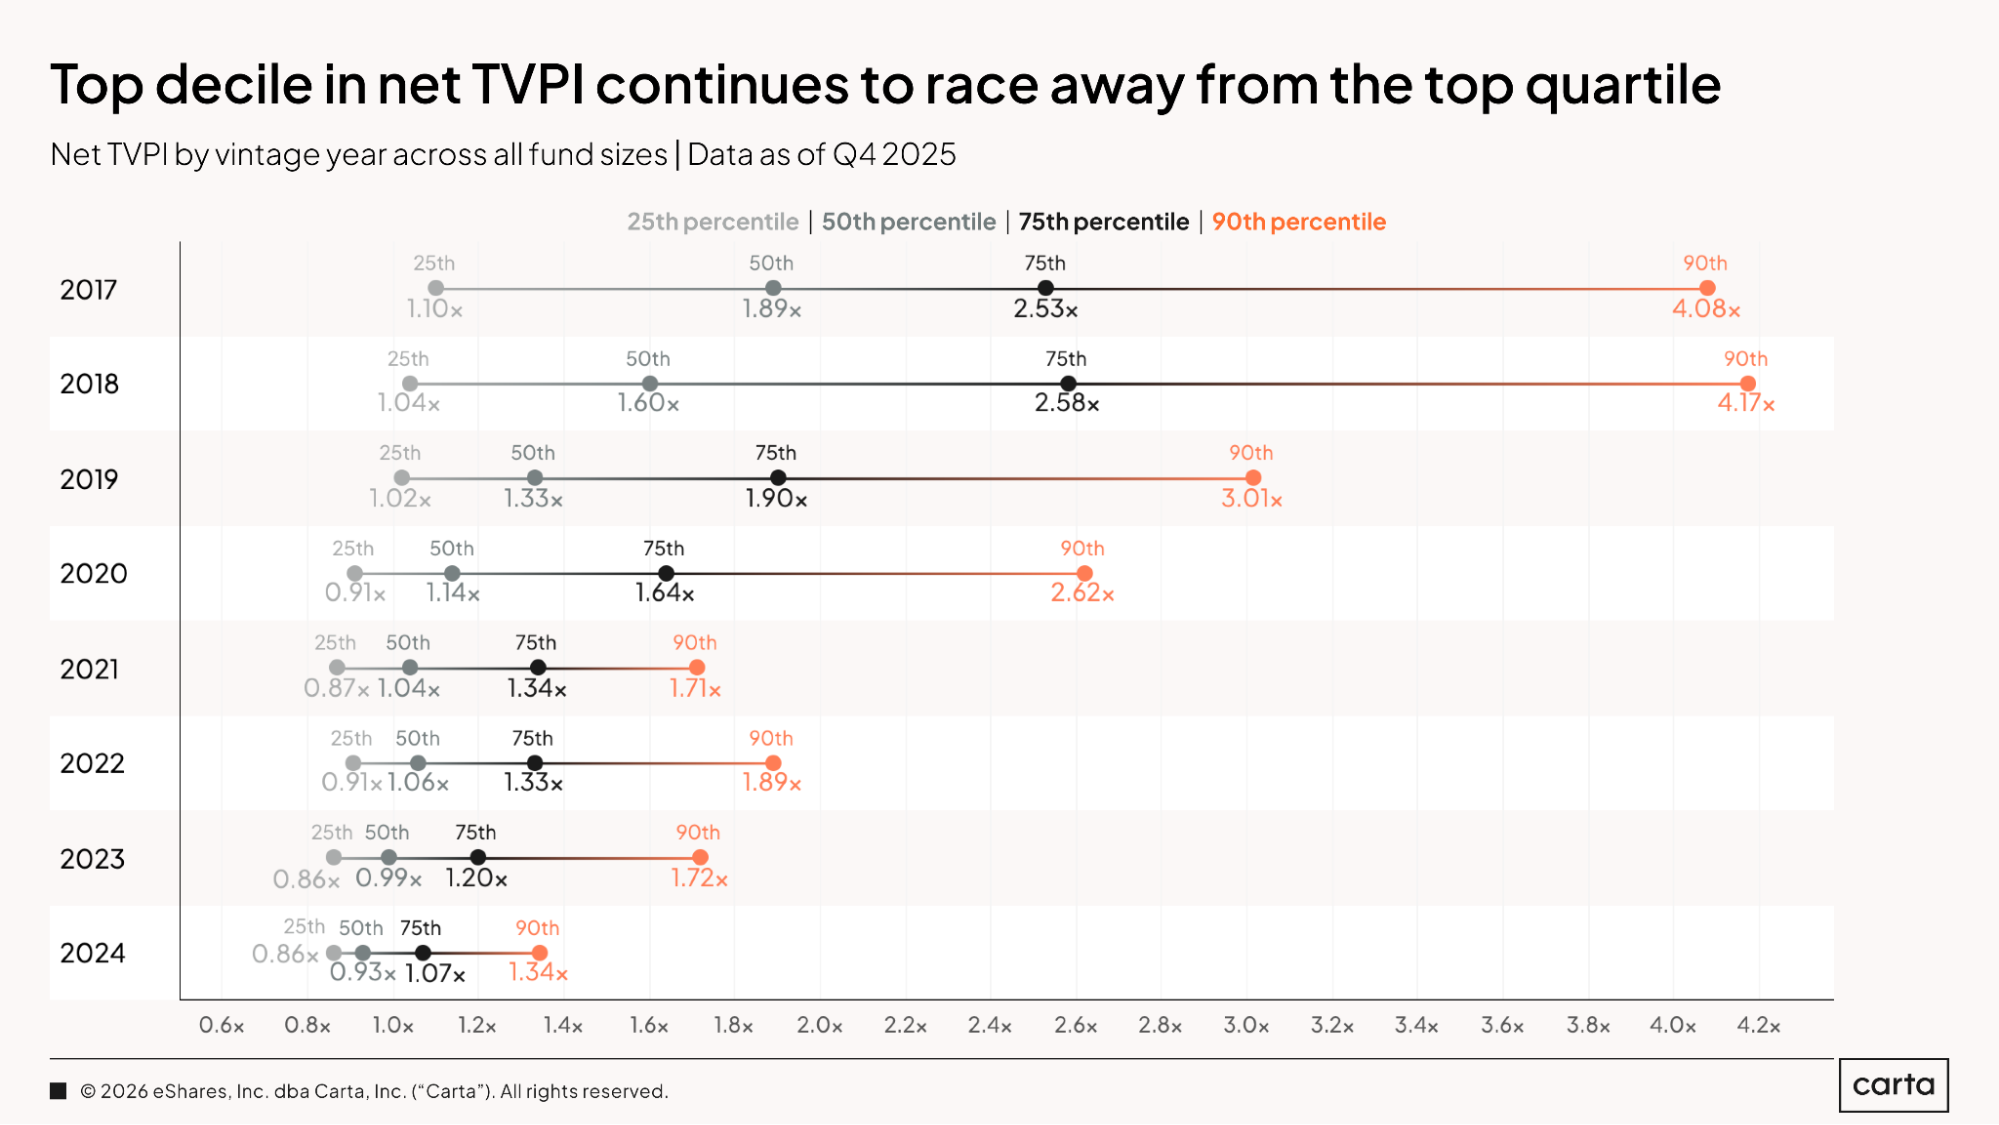
In the 2019 vintage, for instance, the 90th percentile for TVPI sat at 3.01x at the end of last year, compared to a 75th percentile TVPI of 1.9x. This gap between the 75th and 90th percentiles of performance is far larger than the gap between the 75th percentile and the median (1.33x) of 2019 funds, or between the median and the 25th percentile (1.02x).
The same sort of right-tailed distribution can be found at every other vintage of venture funds tracked on Carta from 2017 through 2024. In some cases, the outperformance of the upper tier is even more pronounced. In the 2017 vintage, a top-decile TVPI is 4.08x, while a top-quartile mark is 2.53x, and the median is at 1.89x.
These figures reflect a fundamental fact of the VC ecosystem: It’s a top-heavy asset class. A very small number of startups produce truly outsized returns, generating multiples on the scale of 100x or even 1000x. The vast majority of investments result in much smaller returns; many don’t produce any return at all.
Company-level returns then translate to the fund level. Funds that invest in one or two of the asset class’s true outliers will generate lofty multiples and lucrative returns, the type that keep LPs happy for years to come, with the home-run investments easily outweighing any struggles in the rest of the portfolio. These are the funds that populate the top decile of performance.
For the funds that miss out in their hunt for unicorns, returns will inherently be less attractive. But for the recent fund vintages included in this report’s analysis, the ultimate results are far from baked in. The winners have not yet been decided. In the years to come, funds that currently claim middling return profiles may eventually ascend into the upper echelons.
Regardless of where each individual fund ends up, one truth will remain: Venture capital is a game where the winners tend to win very big indeed.
Highlights
IRR turns positive for 2021 & 2022 VC funds: The median net IRRs for both the 2021 and 2022 vintages of venture funds on Carta have climbed out of negative territory, currently sitting at 1.4% for the 2021 vintage and 0.7% for 2022. Traditionally, IRRs for private funds follow a J-curve, falling below zero during the initial period of management and then steadily rising as fund assets gain in value. Each vintage from 2017 through 2020 currently has a net IRR of at least 4.2%.
Dry powder stacks up in recent vintages: Venture funds on Carta in the 2025 fund vintage still have 72% of their total committed capital remaining on hand as dry powder. About 53% of all capital remains unspent in the 2024 vintage, and 35% for the 2023 vintage. Overall, these three most recent vintages combine to claim more than $19 billion in dry powder.
Returns to LPs grow more common: More than half of all funds from the 2020 vintage have begun to generate at least some amount of DPI, with about 15% of those funds returning capital to LPs for the first time during 2025. In the 2021 vintage, about a third of all funds have begun to record DPI; for both the 2022 and 2023 vintages, the rate sits at just under 25%.
Fund details
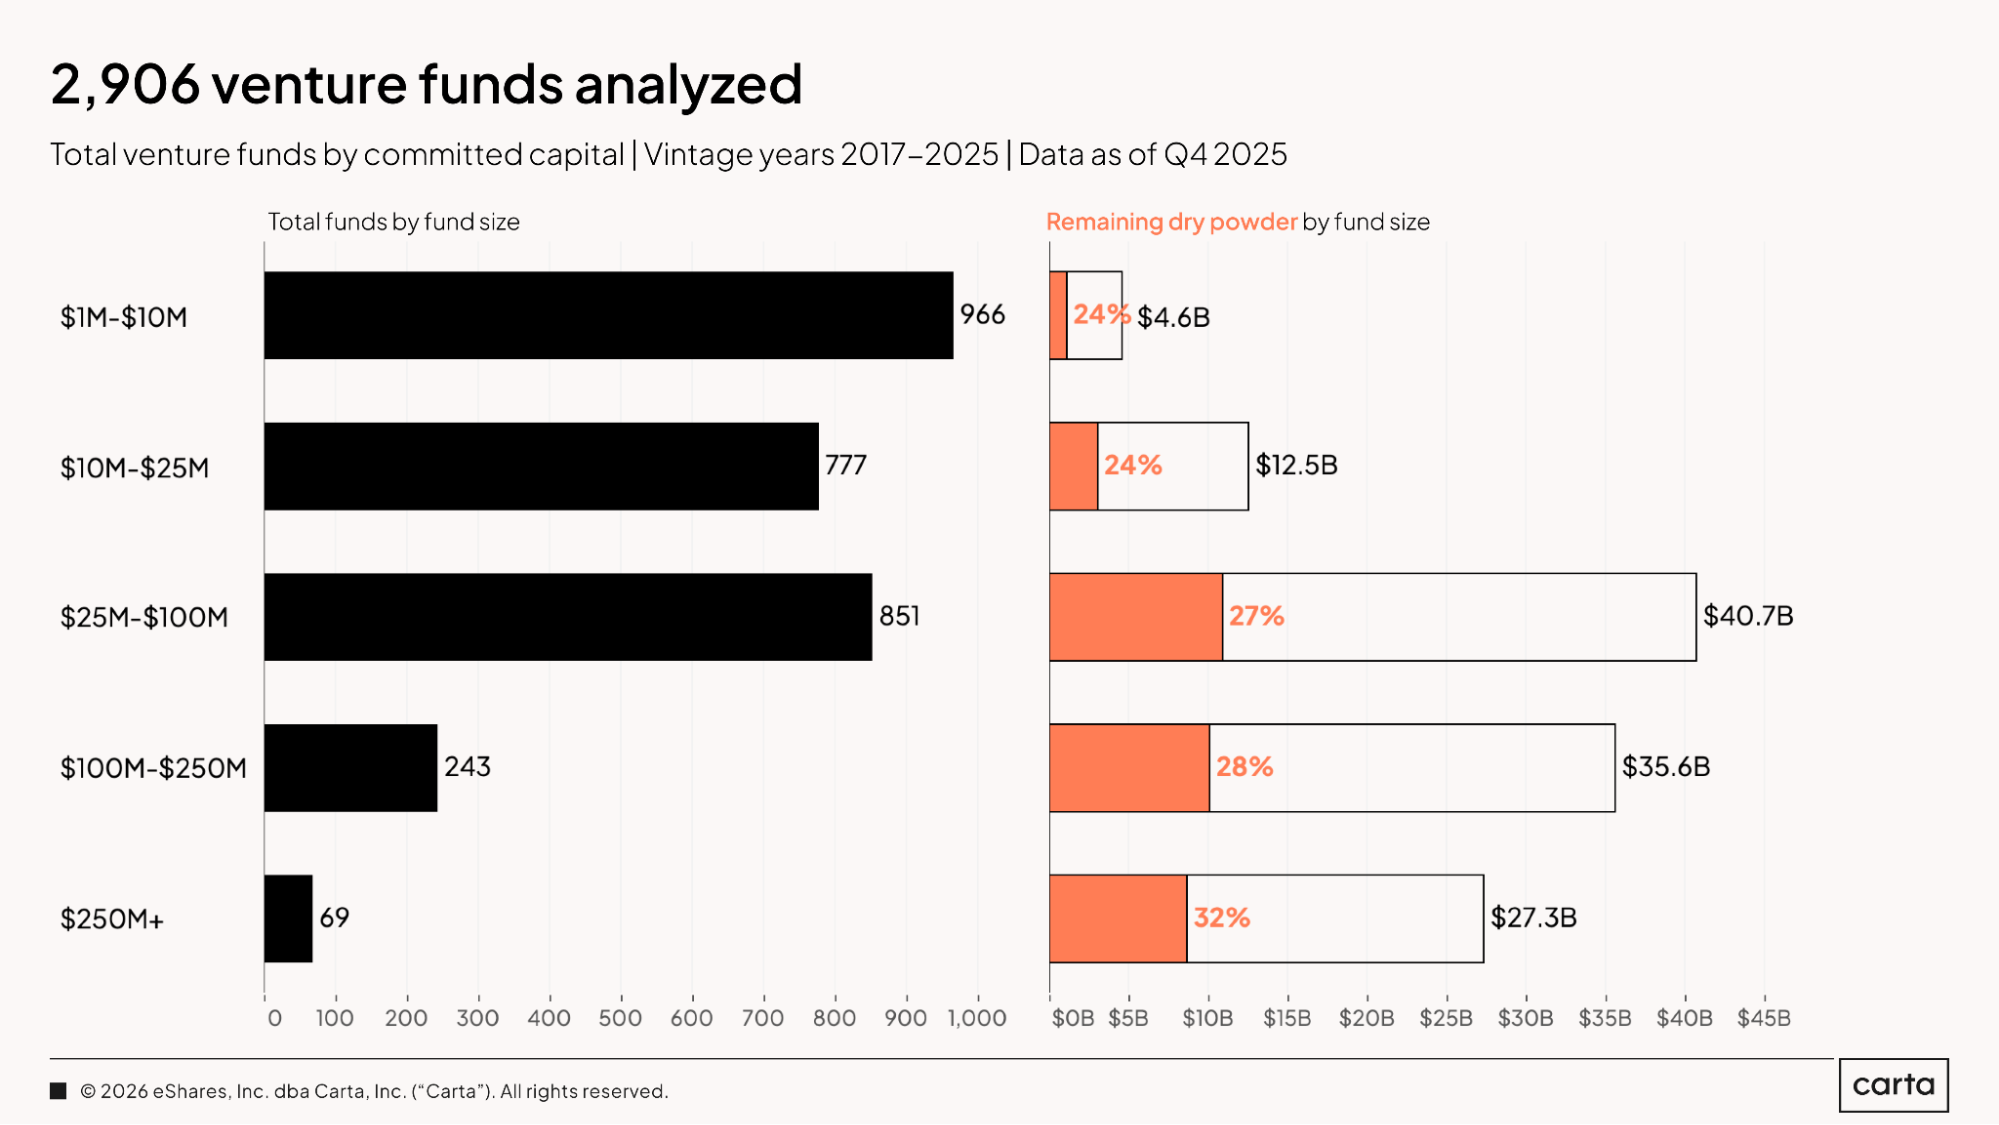
This report relies on data from 2,906 venture funds tracked on Carta from vintage years 2017 through 2025. Most of these funds—about 89%—manage less than $100 million, with a plurality (33%) landing between $1 million and $10 million in size. Across all fund sizes, the funds analyzed in this report boast about $120.7 billion in combined capital under management.
While the $1 million to $10 million cohort claims the largest number of total funds, the group of funds ranging from $25 million to $100 million in size claims the largest share of overall capital, at about $40.7 billion. While just 11% of the total funds in this sample are larger than $100 million, those vehicles combine to account for 52% of all committed capital across this nine-year sample, reflecting the top-heavy nature of the venture fundraising market as a whole.
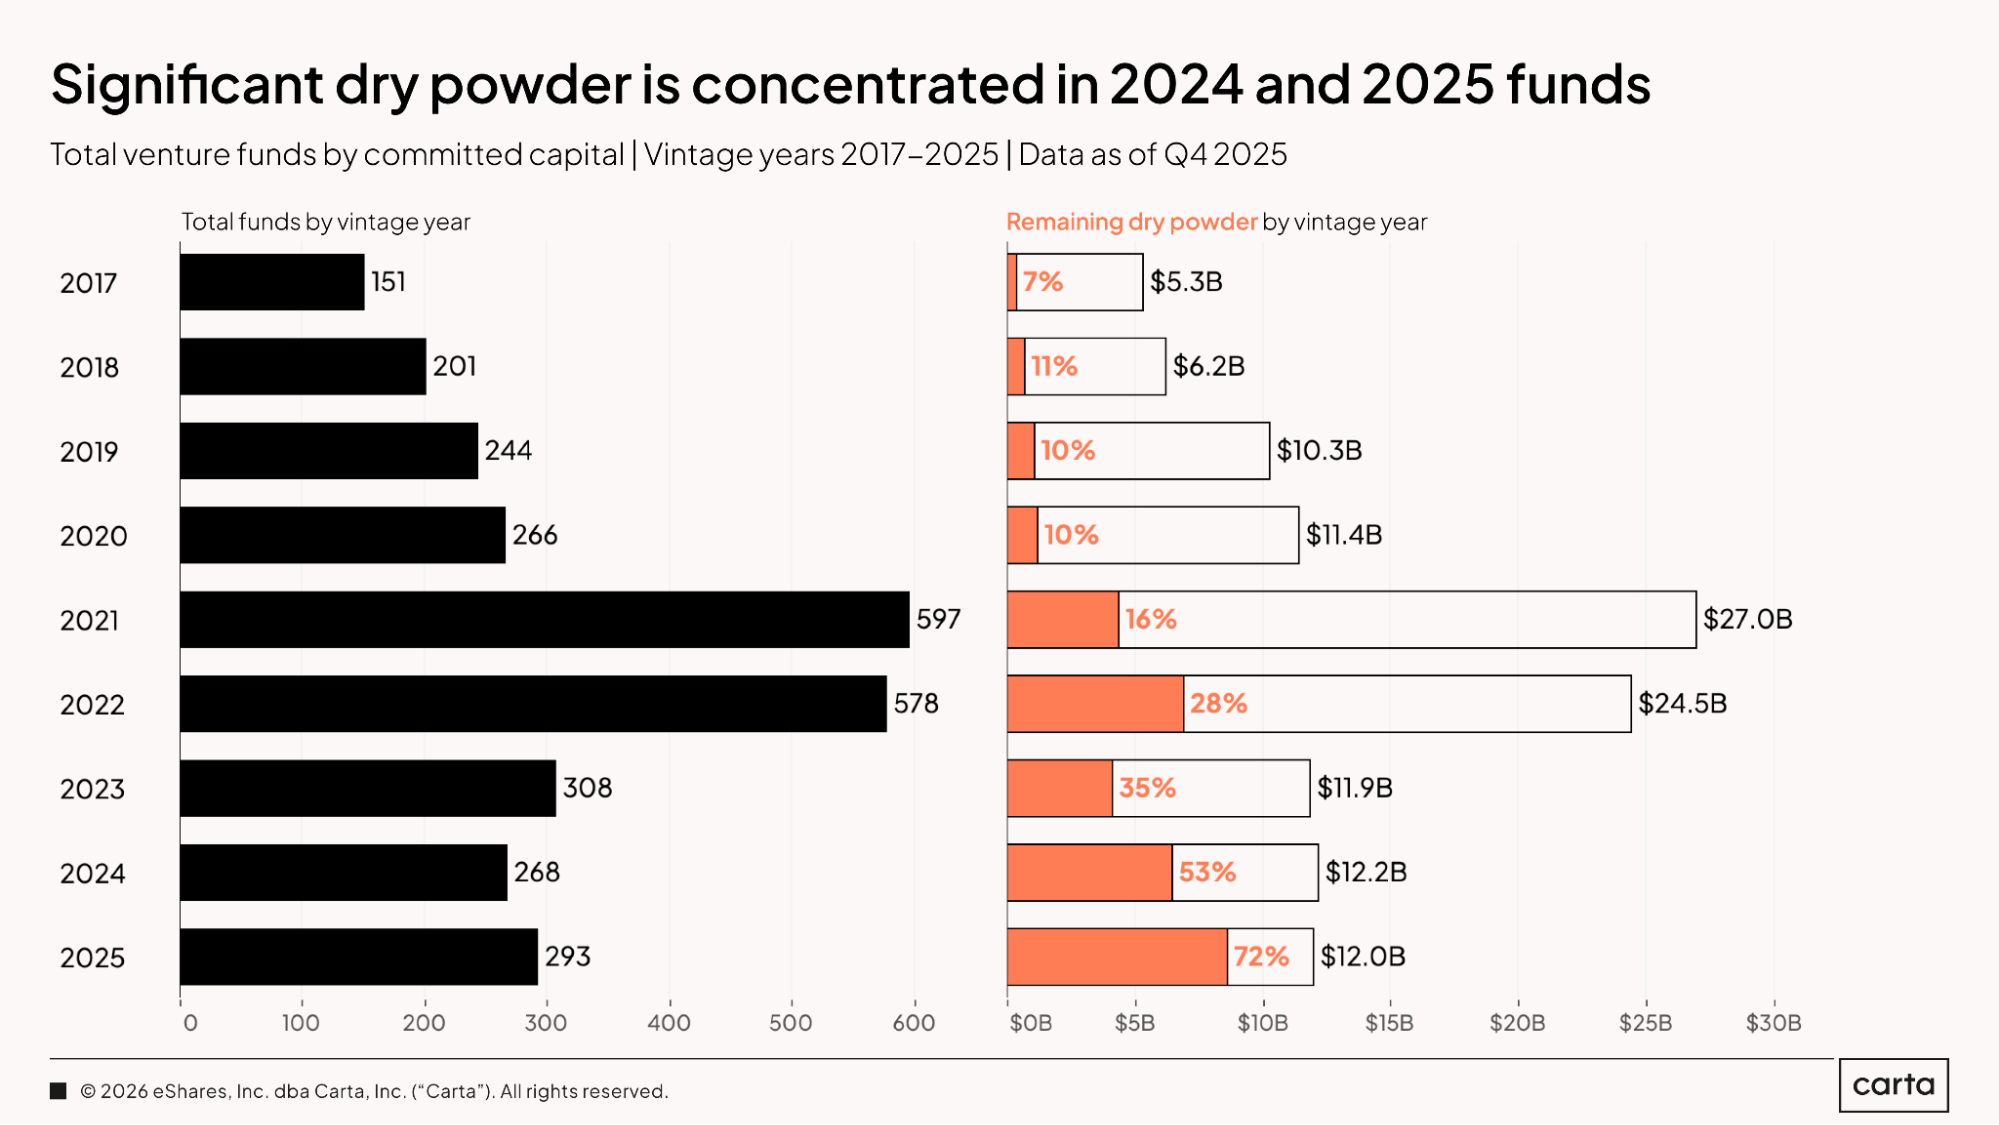
Venture funds on Carta in the 2025 vintage combined to raise $12 billion in total capital. As of the end of last year, about 72% of that cash remained on hand as unspent dry powder. Funds in the 2024 vintage are also still sitting on substantial dry powder reserves, with 53% of total capital commitments still unspent.
As you move further back in time, rates of dry powder rapidly decline. Funds from the 2023 vintage have already deployed about two-thirds of their cash, with 35% remaining as dry powder; in the 2021 vintage, just 16% of the $27 billion in total cash raised remains unspent. Prior to 2021, percentages of dry powder flatten out, with only minor variation in vintages from 2017 through 2020.
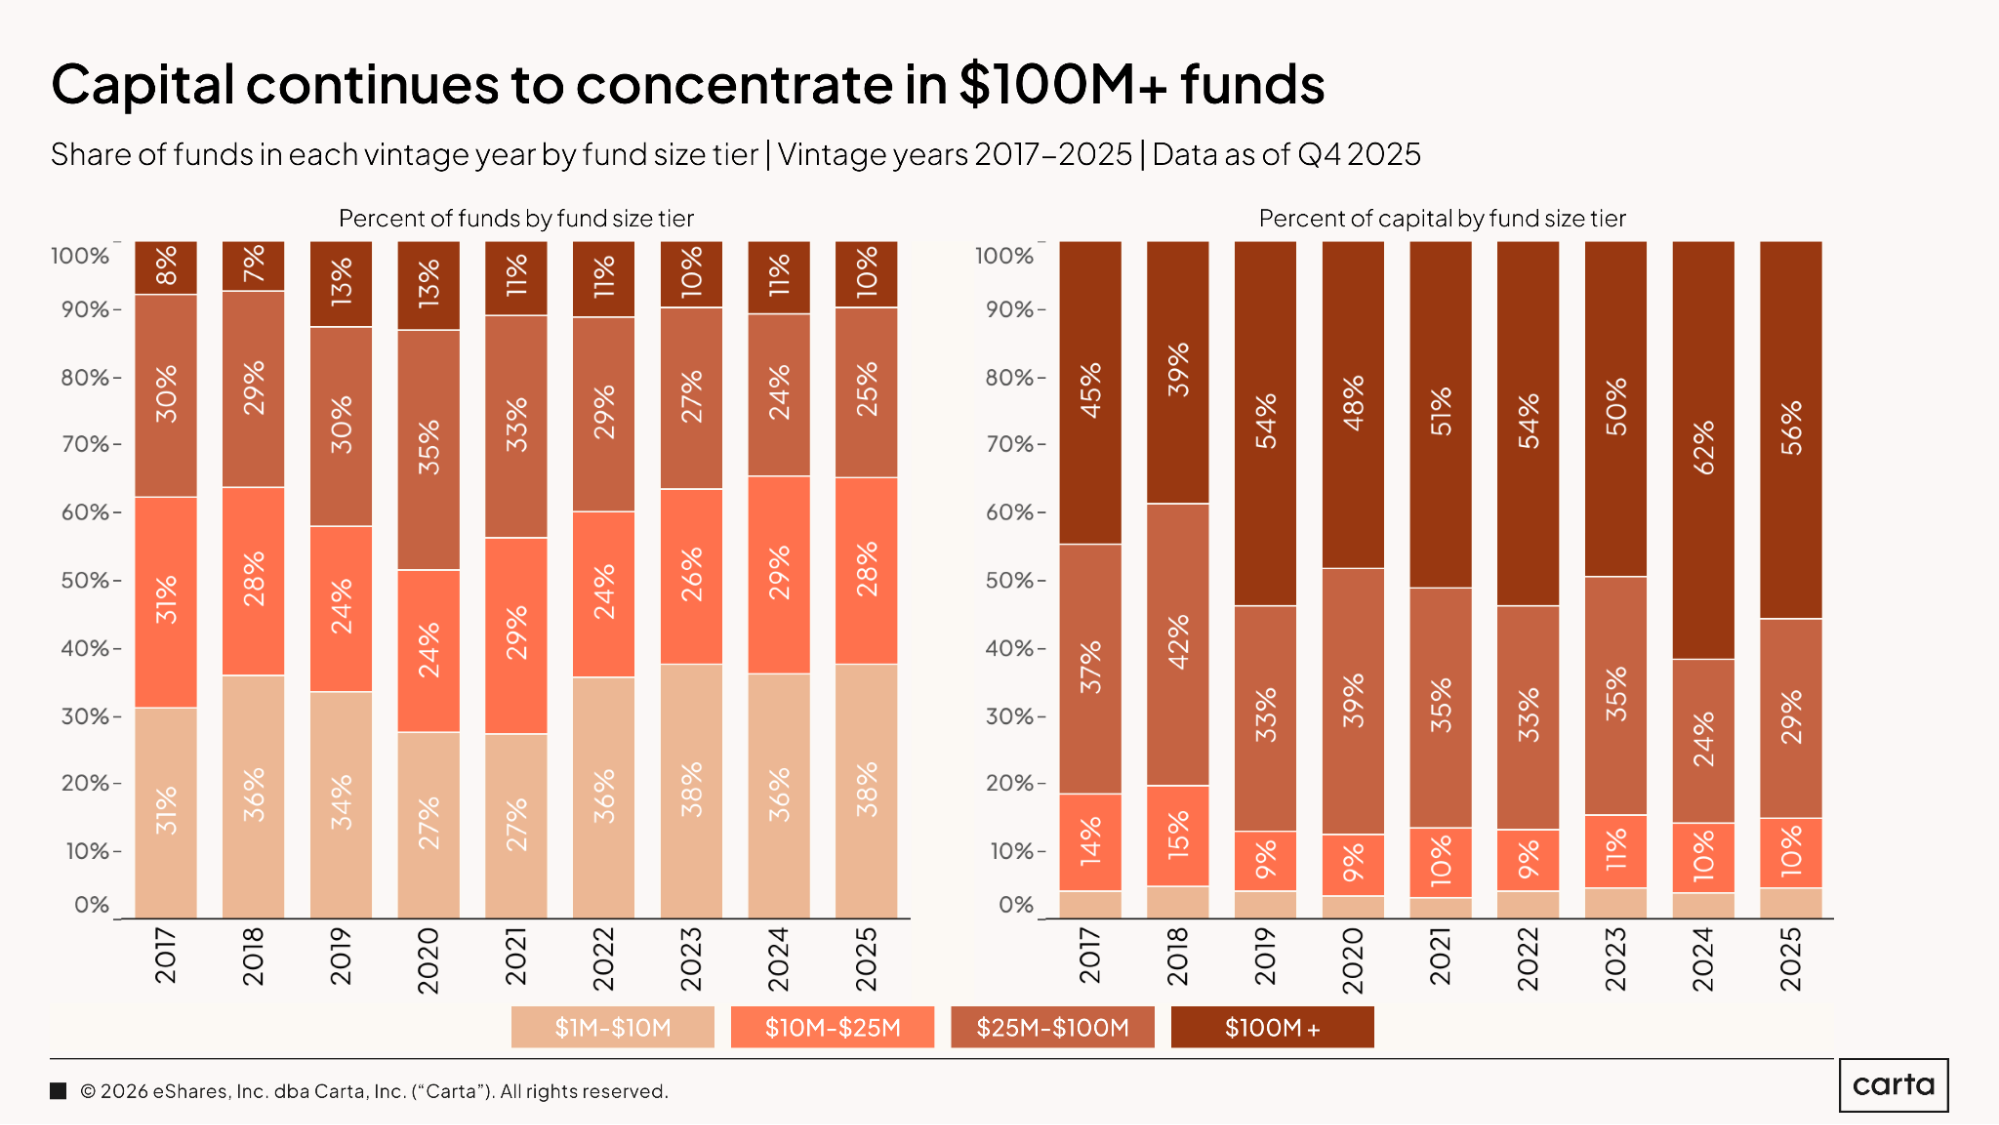
Over the past few years, the division of new venture funds by fund size has remained mostly unchanged. Somewhere between 36% and 38% of new funds raised have been between $1 million and $10 million in size, and either 10% or 11% have been larger than $100 million.
There’s been a little more variation in how total capital is distributed across these cohorts. In 2025, 56% of all cash raised went to funds with more than $100 million in commitments, down from 62% in 2024, which was the highest rate of the past nine years. Funds between $25 million and $100 million, meanwhile, have been playing a reduced role in the venture landscape: This cohort has accounted for less than 30% of capital raised in each of the past two years, after previously landing above 30% for seven years in a row.
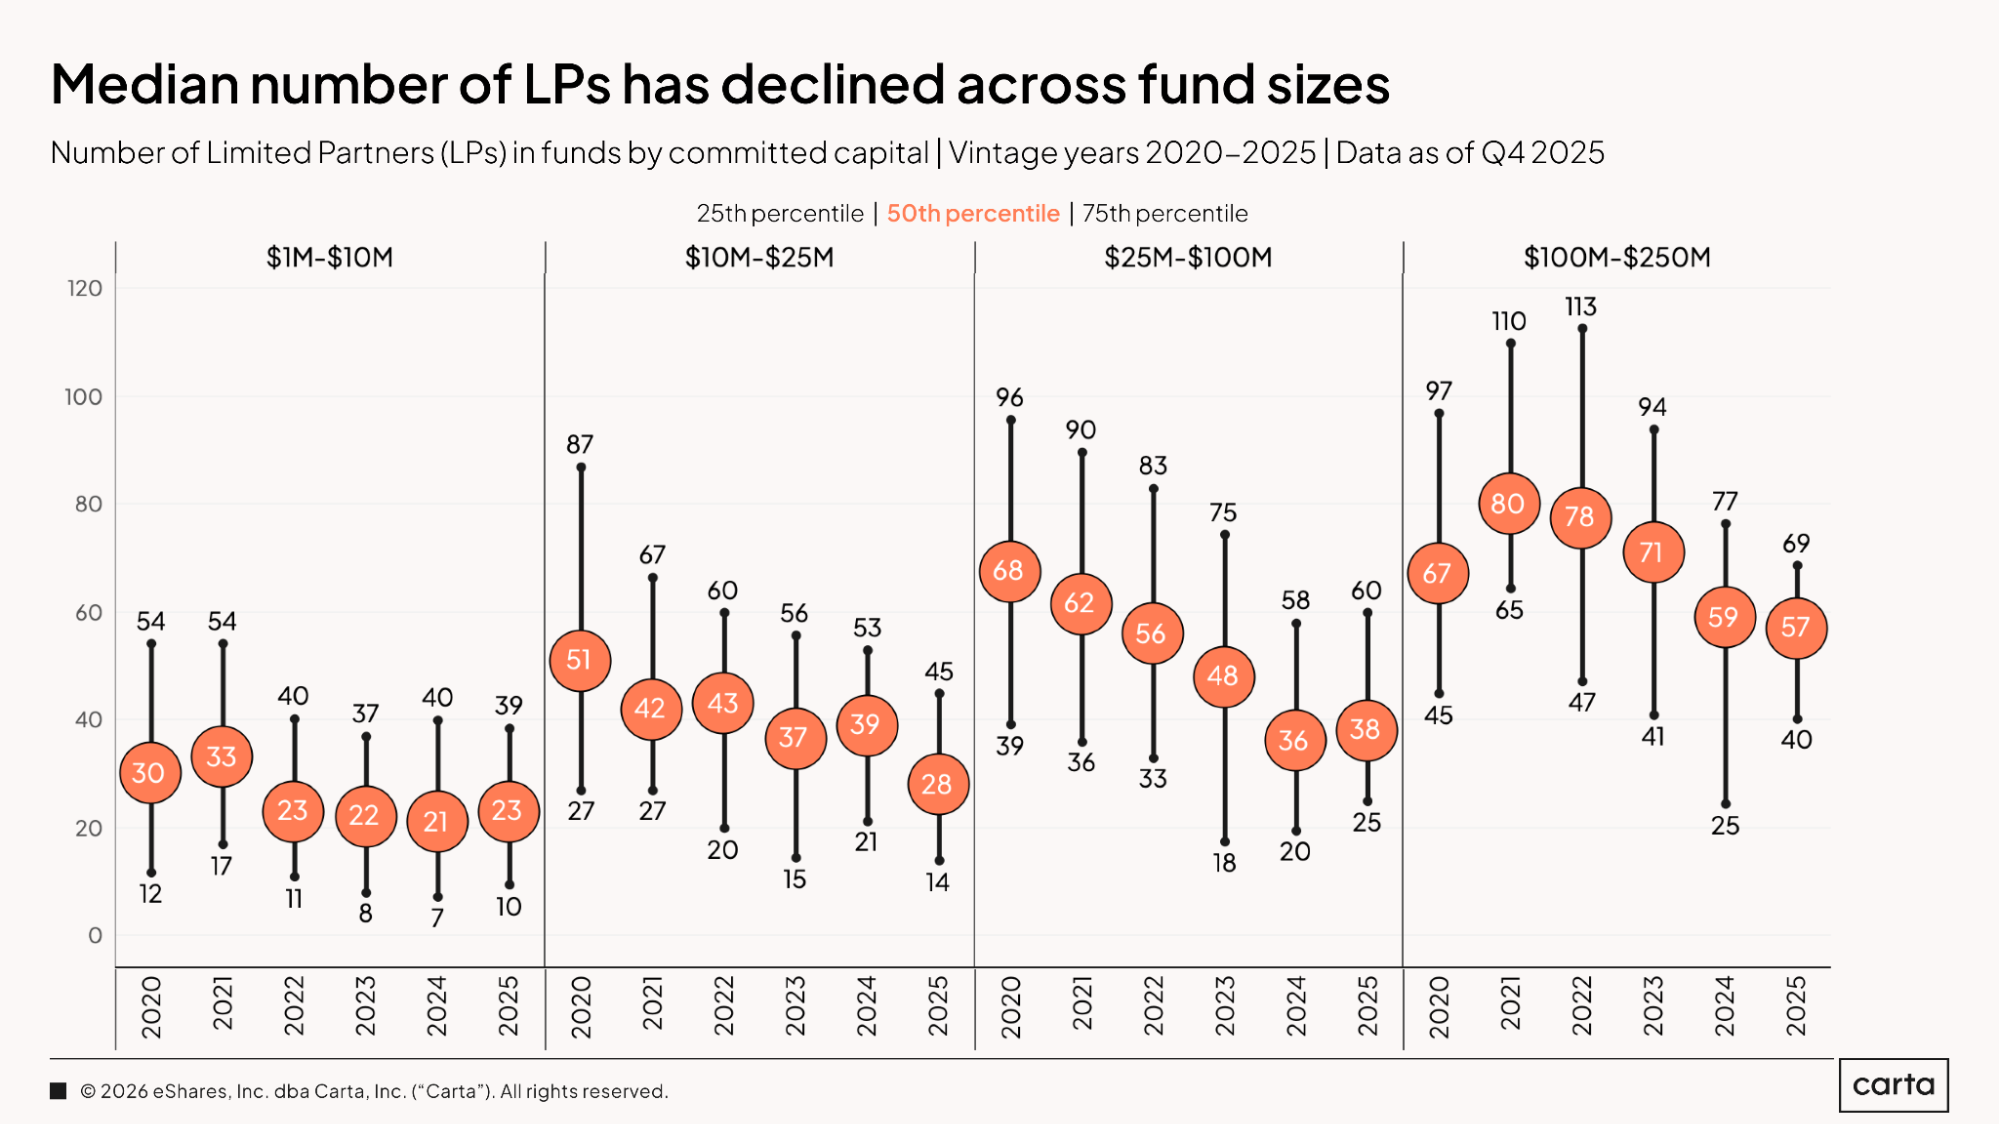
Across most fund sizes, the typical number of LPs per fund has either been holding steady or gradually declining over the past few years.
At the low end of the spectrum, LP counts have been largely consistent, with the median number of LPs per fund landing between 21 and 23 in each year from 2022 through 2025. Larger funds have seen a more pronounced drop-off. Among vehicles between $100 million and $250 million, the median LP count has fallen from 78 to 57 over that same four-year period. The gap between the 25th and 75th percentile for LP counts has also tightened considerably over this span, indicating a narrower band of commitment structures among the largest VC funds.
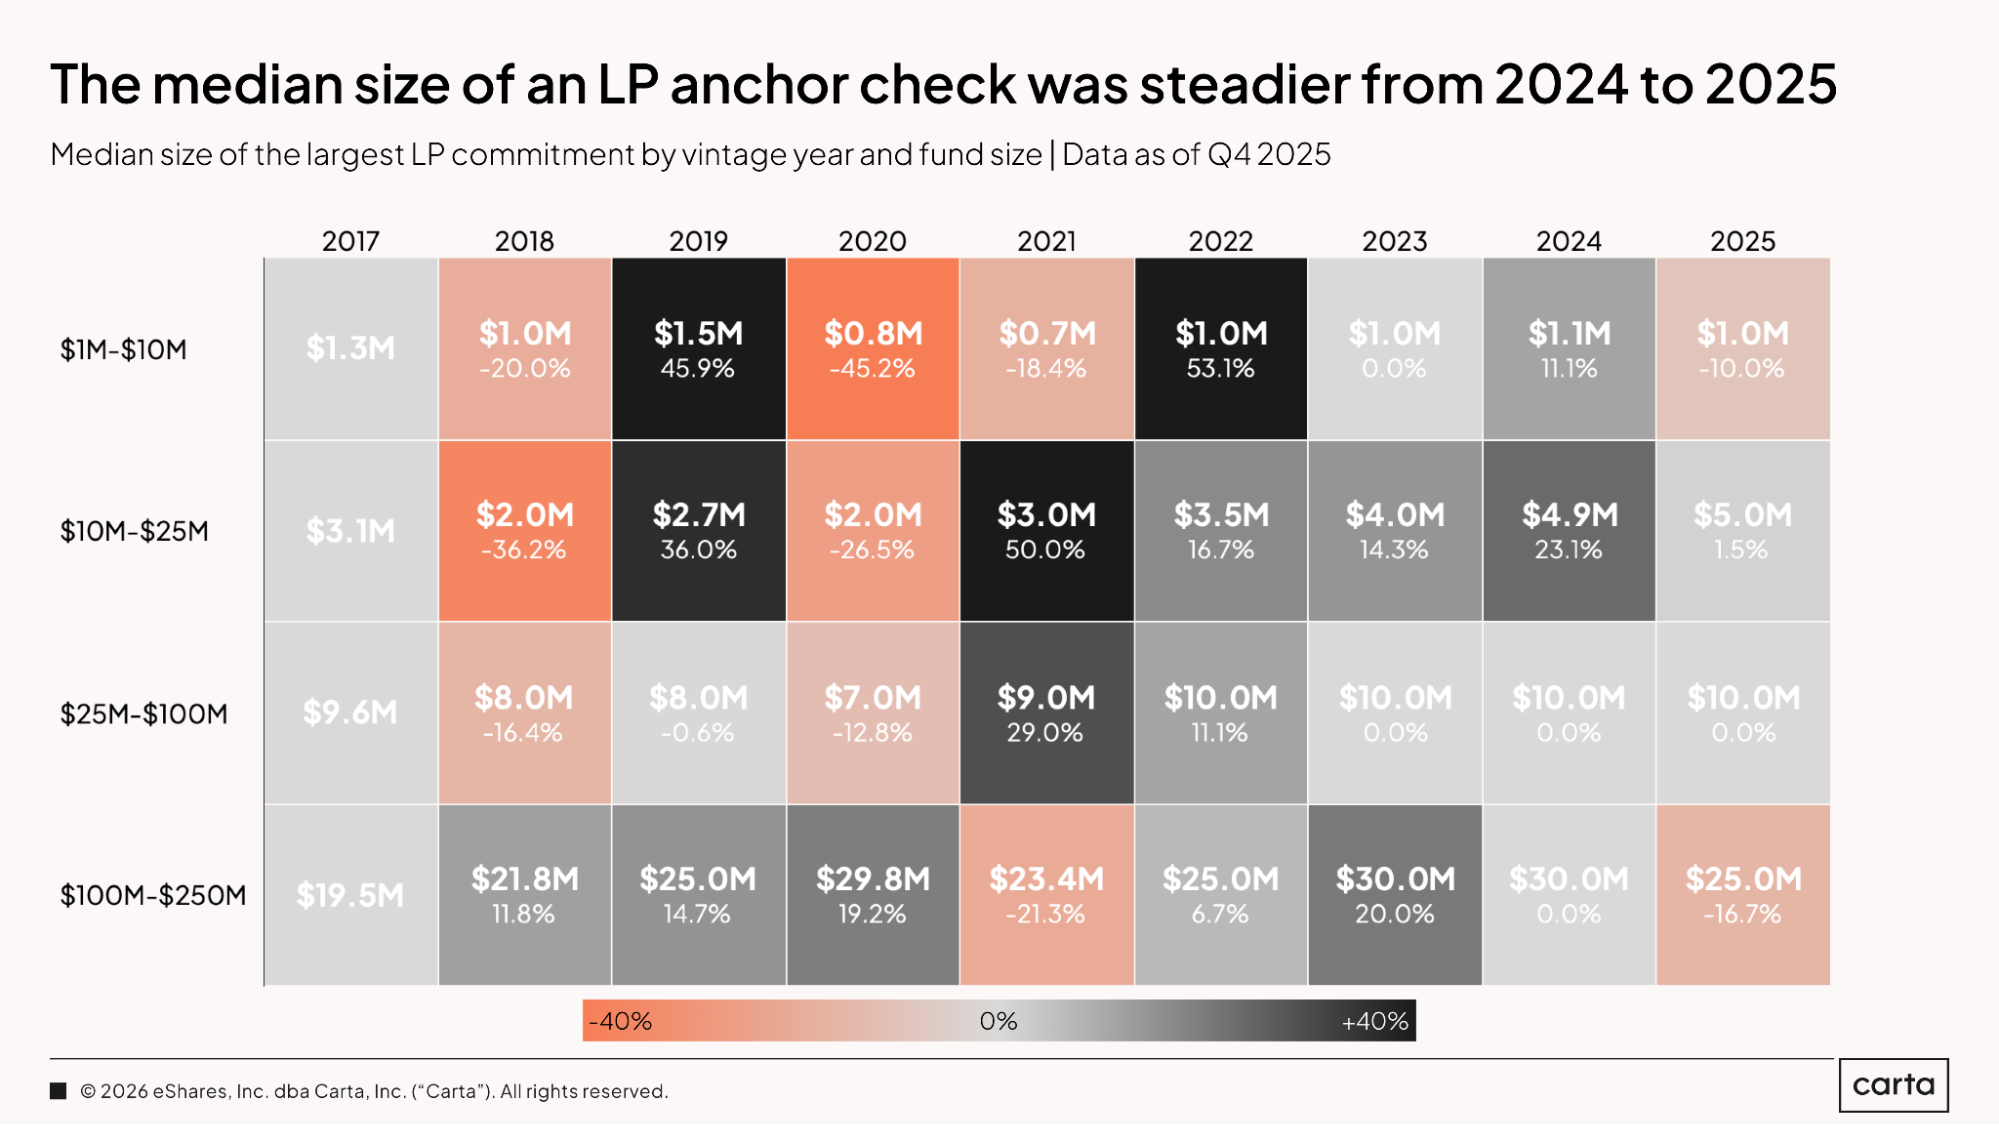
From 2018 through 2022, it was common for the size of the median anchor check—defined as the largest contribution from any single LP—to fluctuate by 20% per year or more across each of these different cohorts of fund size. For the $10 million to $25 million cohort, for instance, the median anchor check decreased by 36.2% in 2018, then increased by 36% in 2019, followed by another substantial decrease in 2020 (26.5%) and another substantial increase in 2021 (50%).
Over the past few years, however, large swings have become less common. This is demonstrated best by the group of funds between $25 million and $100 million in size. Among this grouping, the median anchor check has now landed at $10 million for four consecutive years.
IRR
Where C(t) = net cash flow at a given time t
And C(0) = total initial cost of investments
And NPV = net present value of the fund’s future cash distribution (set to 0 to numerically solve for IRR)
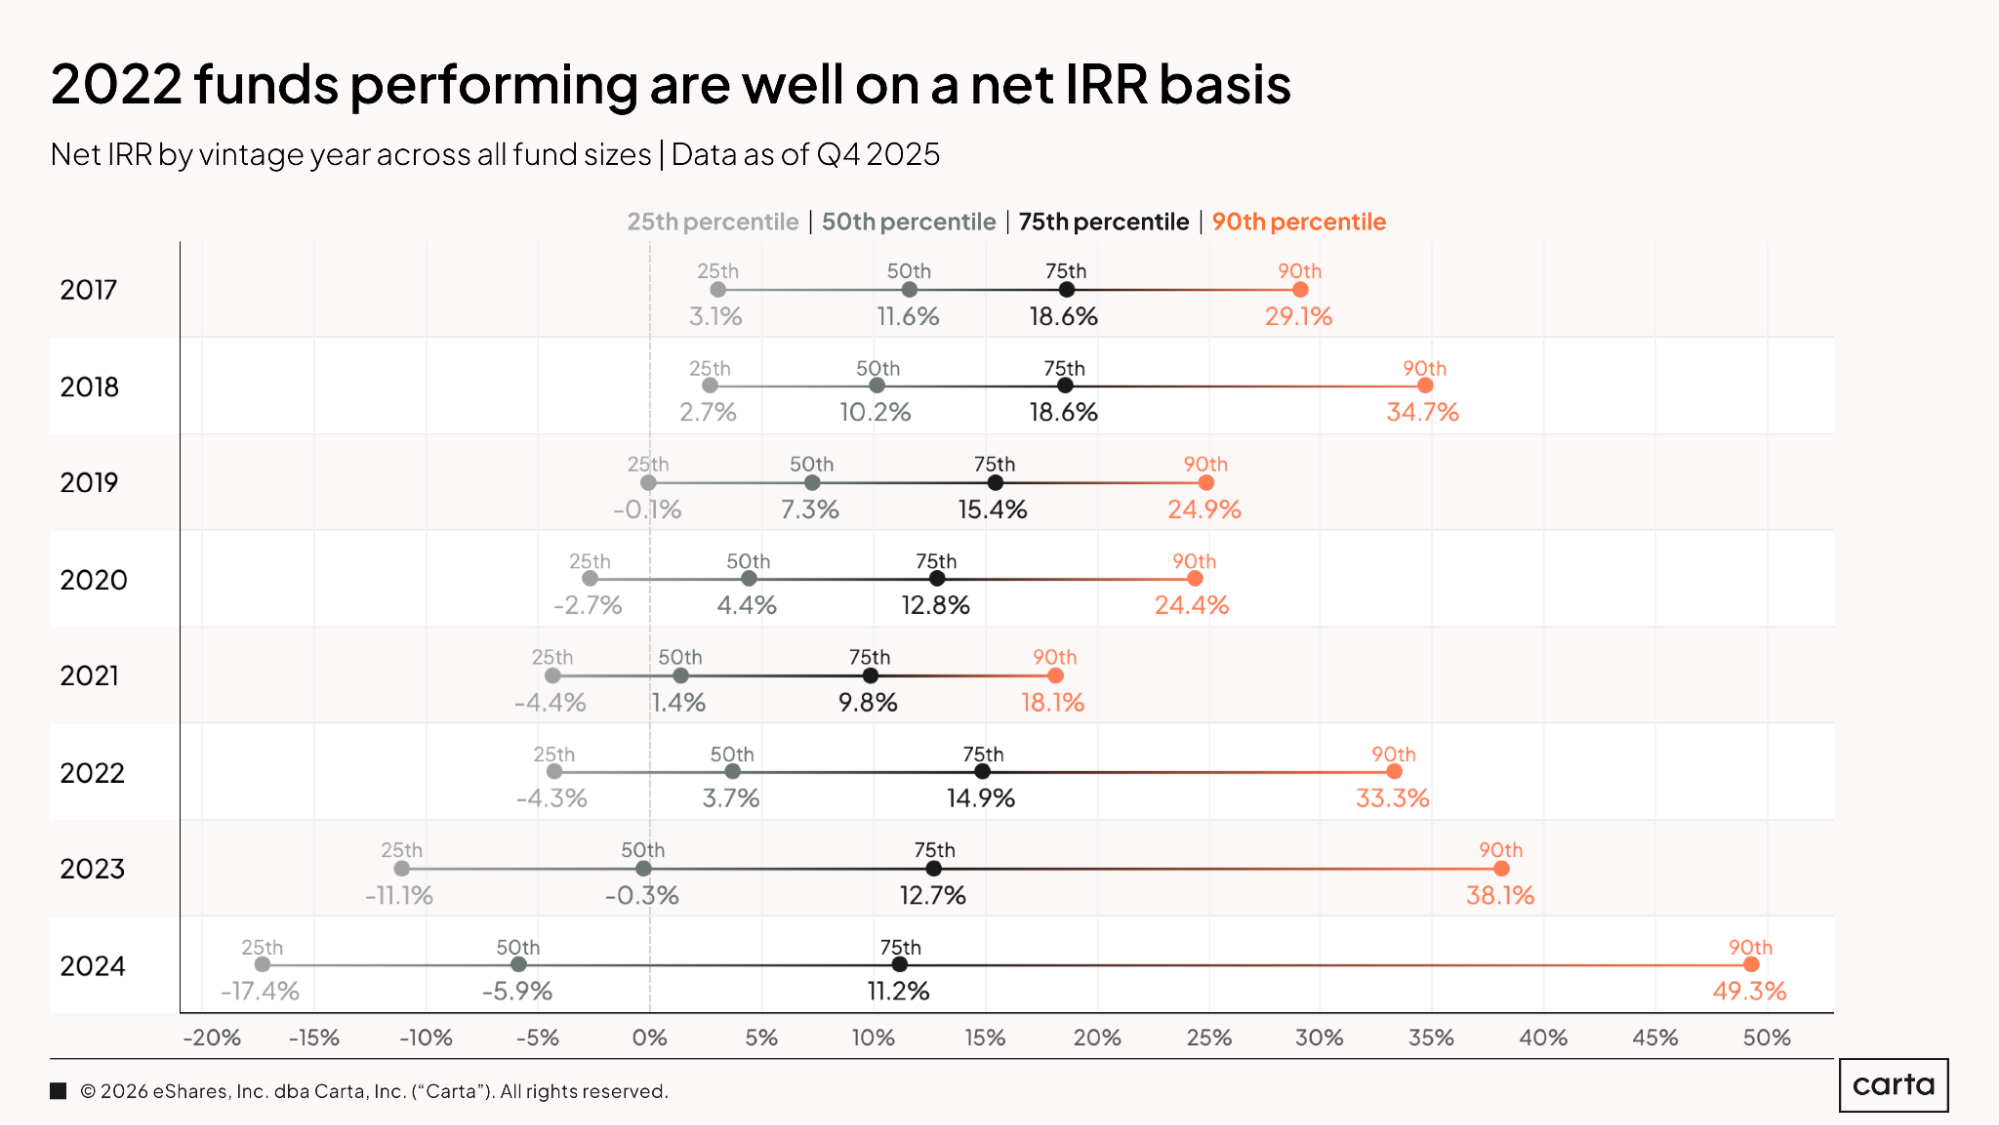
As a general guideline, each new vintage in this sample tends to have lower net IRR numbers than the vintage that precedes it. This is largely due to the fact that older vintages have had more time to increase their value.
But this rule of thumb has some notable exceptions, with the divide between the 2021 and 2022 vintages serving as a particular inflection point. Funds from 2022 are performing better than funds from 2021 at each of the four statistical thresholds shown here, with a 90th percentile for net IRR that’s nearly twice as high. At the 75th and 90th percentiles, the 2023 and 2024 vintages both also claim higher IRRs than 2021. These figures reflect a widespread shift in the landscape for tech valuations that occurred after the 2021 funding boom, a reset in the market that generated considerable downward pressure on the 2021 vintage’s performance.
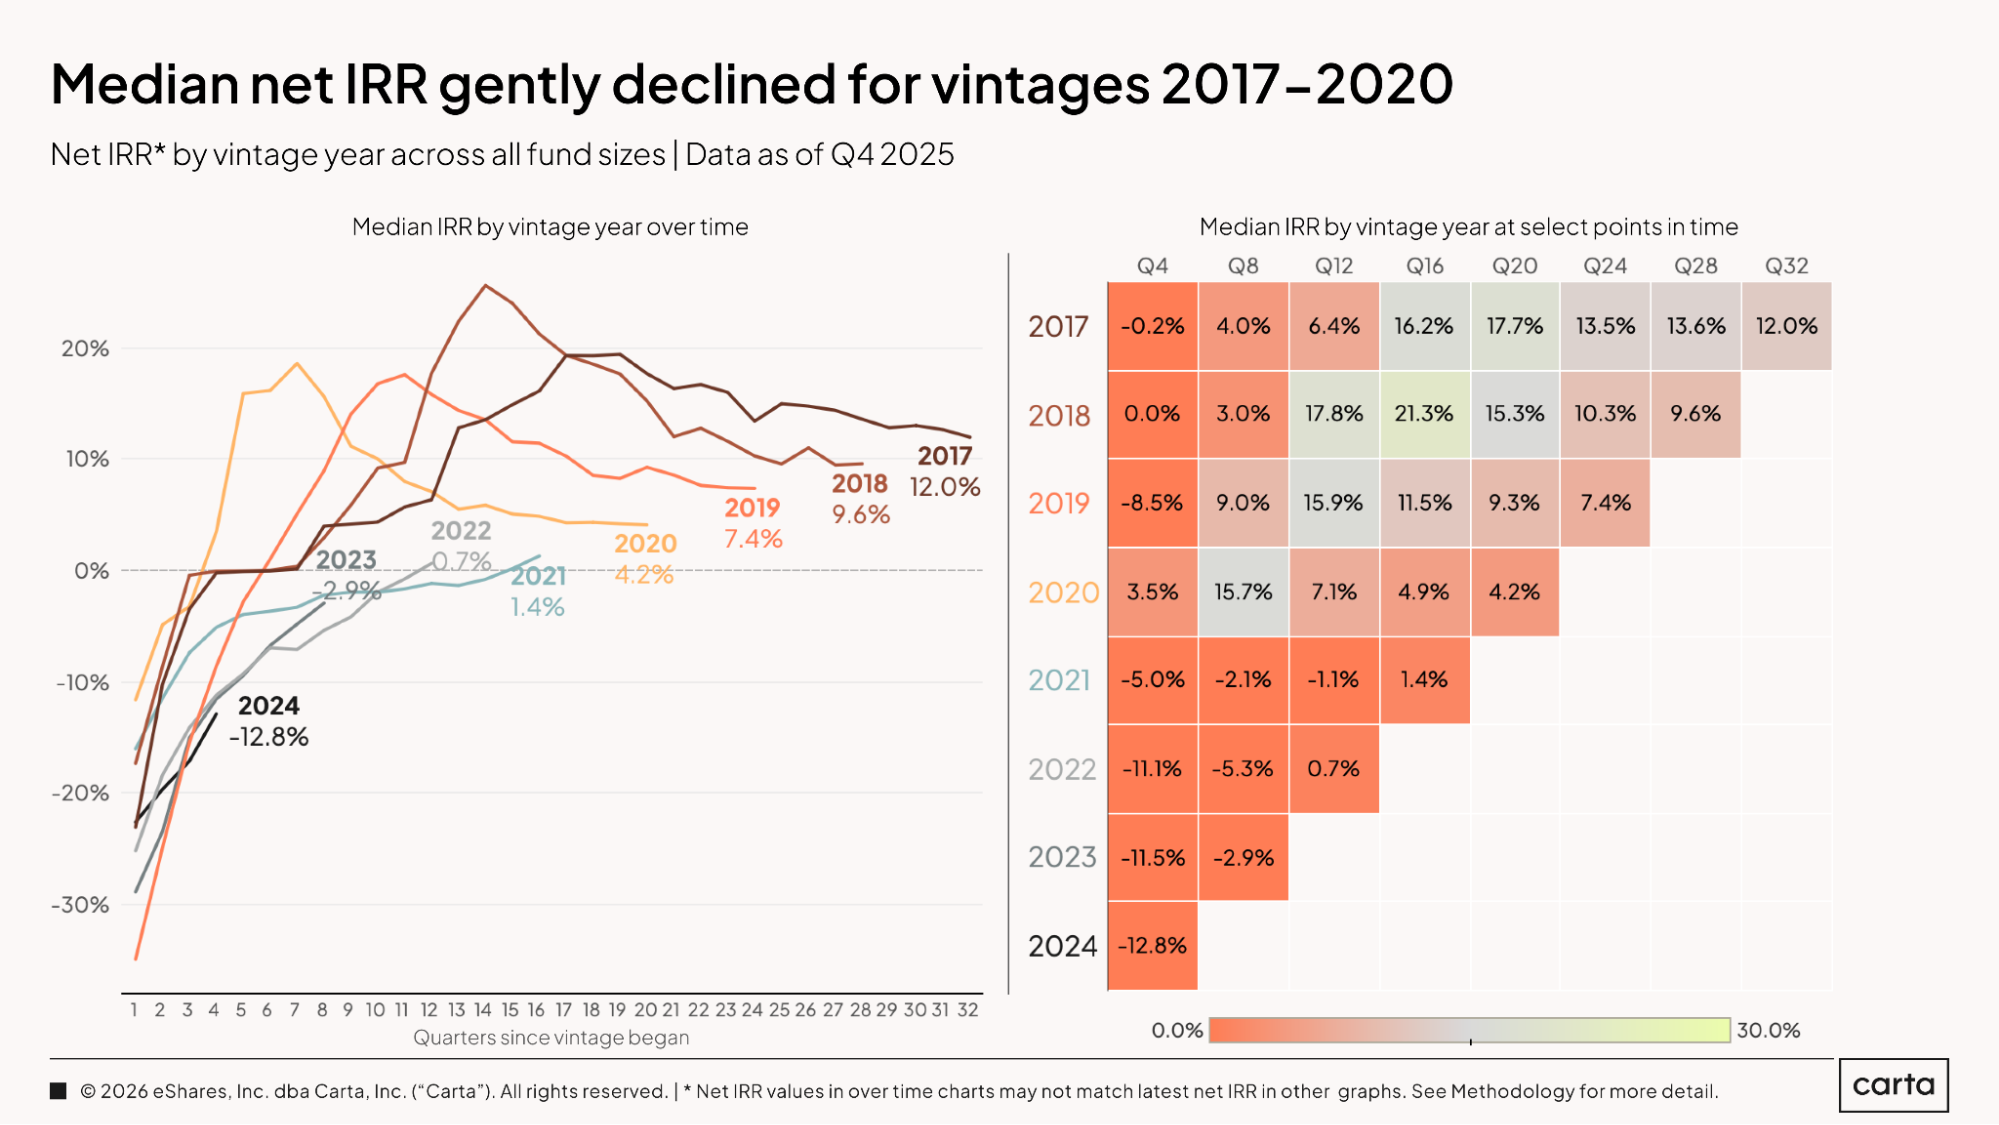
Vintages from 2017 through 2020 continued to see their median net IRR numbers gradually decline over the course of 2025. For the 2017 vintage, for instance, median IRR fell from 13.6% to 12% over the past four quarters. For the 2019 vintage, median IRR declined from 9.3% to 7.4% over that same span.
More recent vintages have seen movement in the other direction. The 2021 vintage saw its median IRR ascend from negative to positive over the past four quarters, settling at 1.4% as of the end of 2025. The 2023 vintage has experienced significant positive momentum, with median IRR climbing from -11.5% after four quarters of active management to -2.9% after eight quarters.
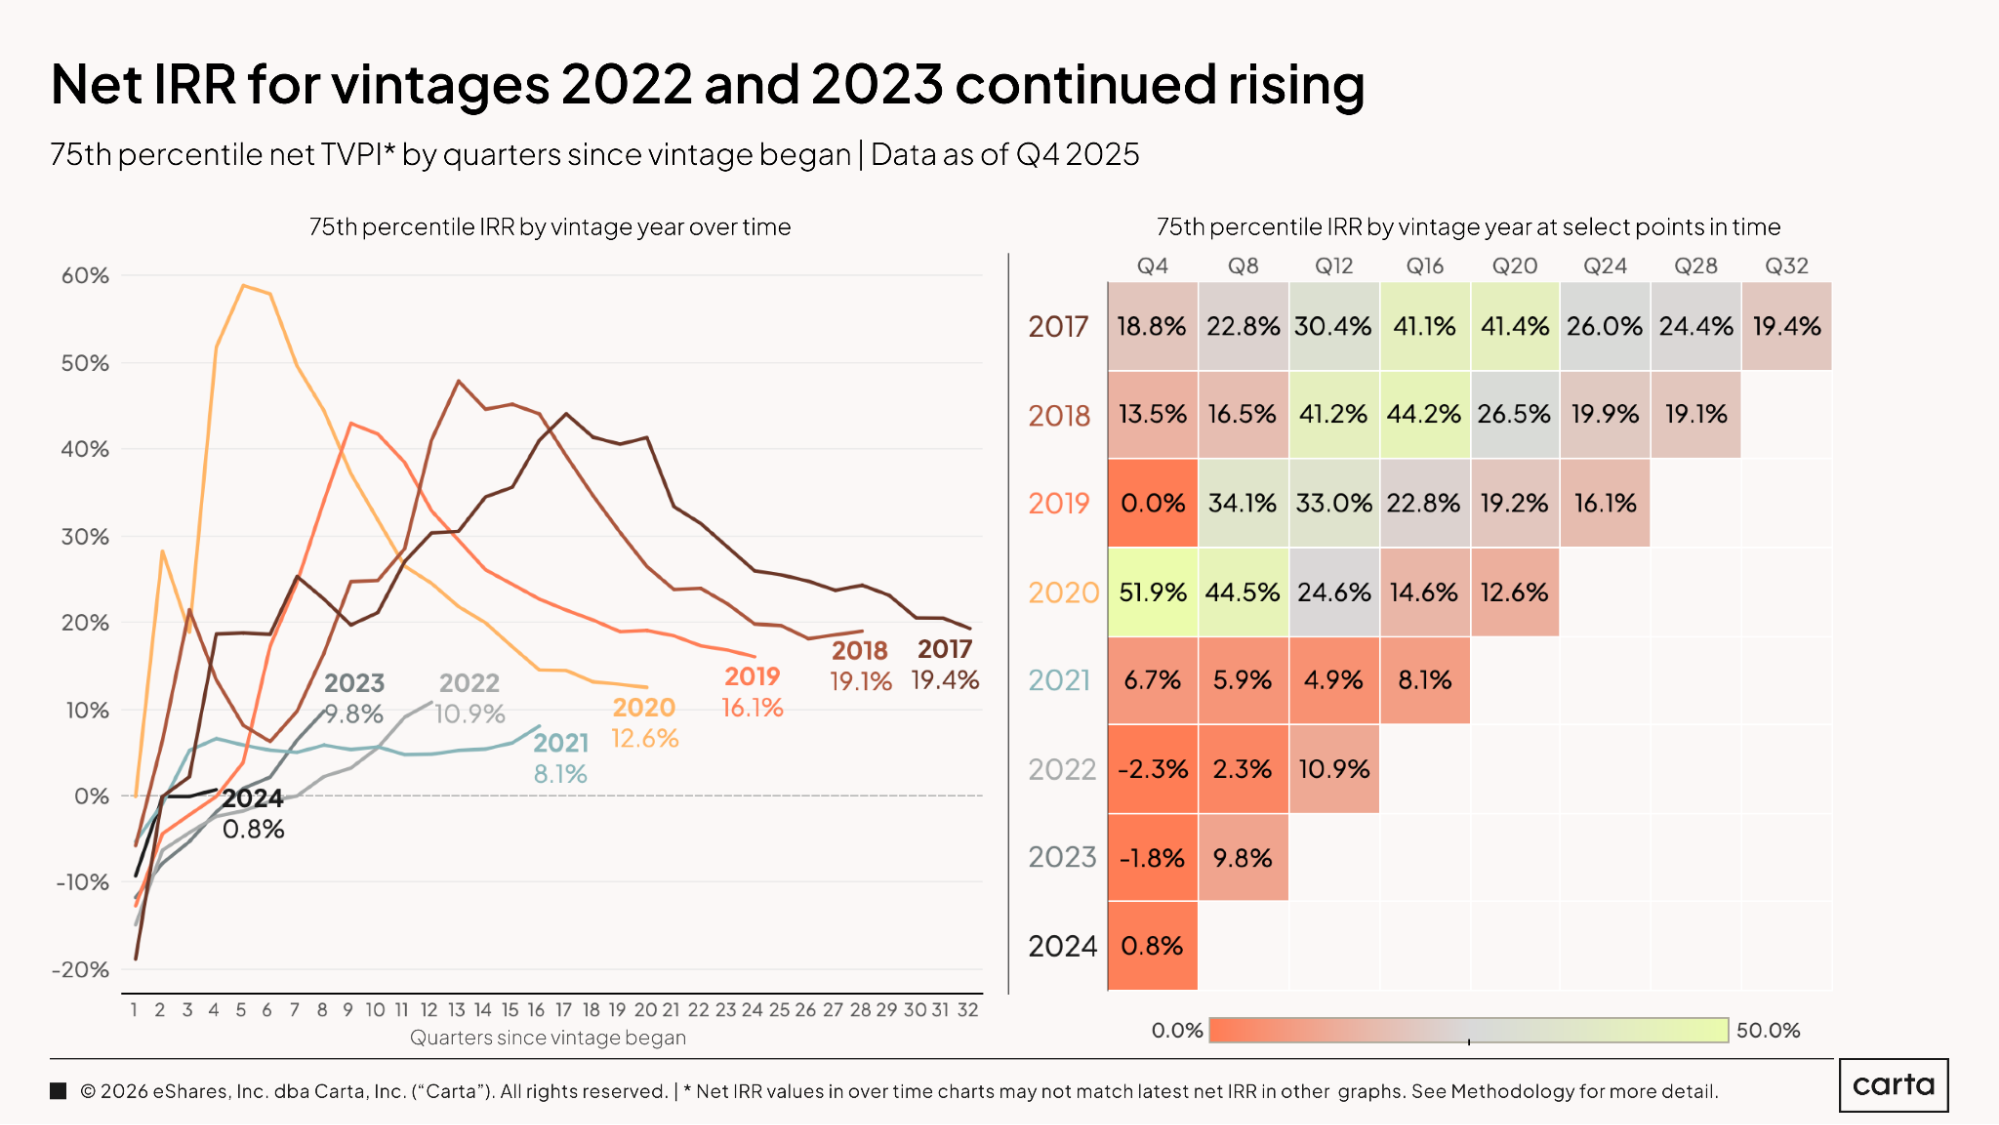
At the top quartile of performance, the 2022 and 2023 vintages are inching closer and closer to vintages from the late 2010s. The 75th percentile for net IRR currently sits at 10.9% for the 2022 vintage and 9.8% for 2023. Over the past four quarters, both of these vintages surpassed the 2021 vintage in terms of top-quartile performance, even as 2021 also experienced gains.
Older vintages, on the other hand, continue to recede from previous highs. For each vintage from 2017 through 2020, the 75th percentile for IRR has now declined by at least 50% over the past three years.
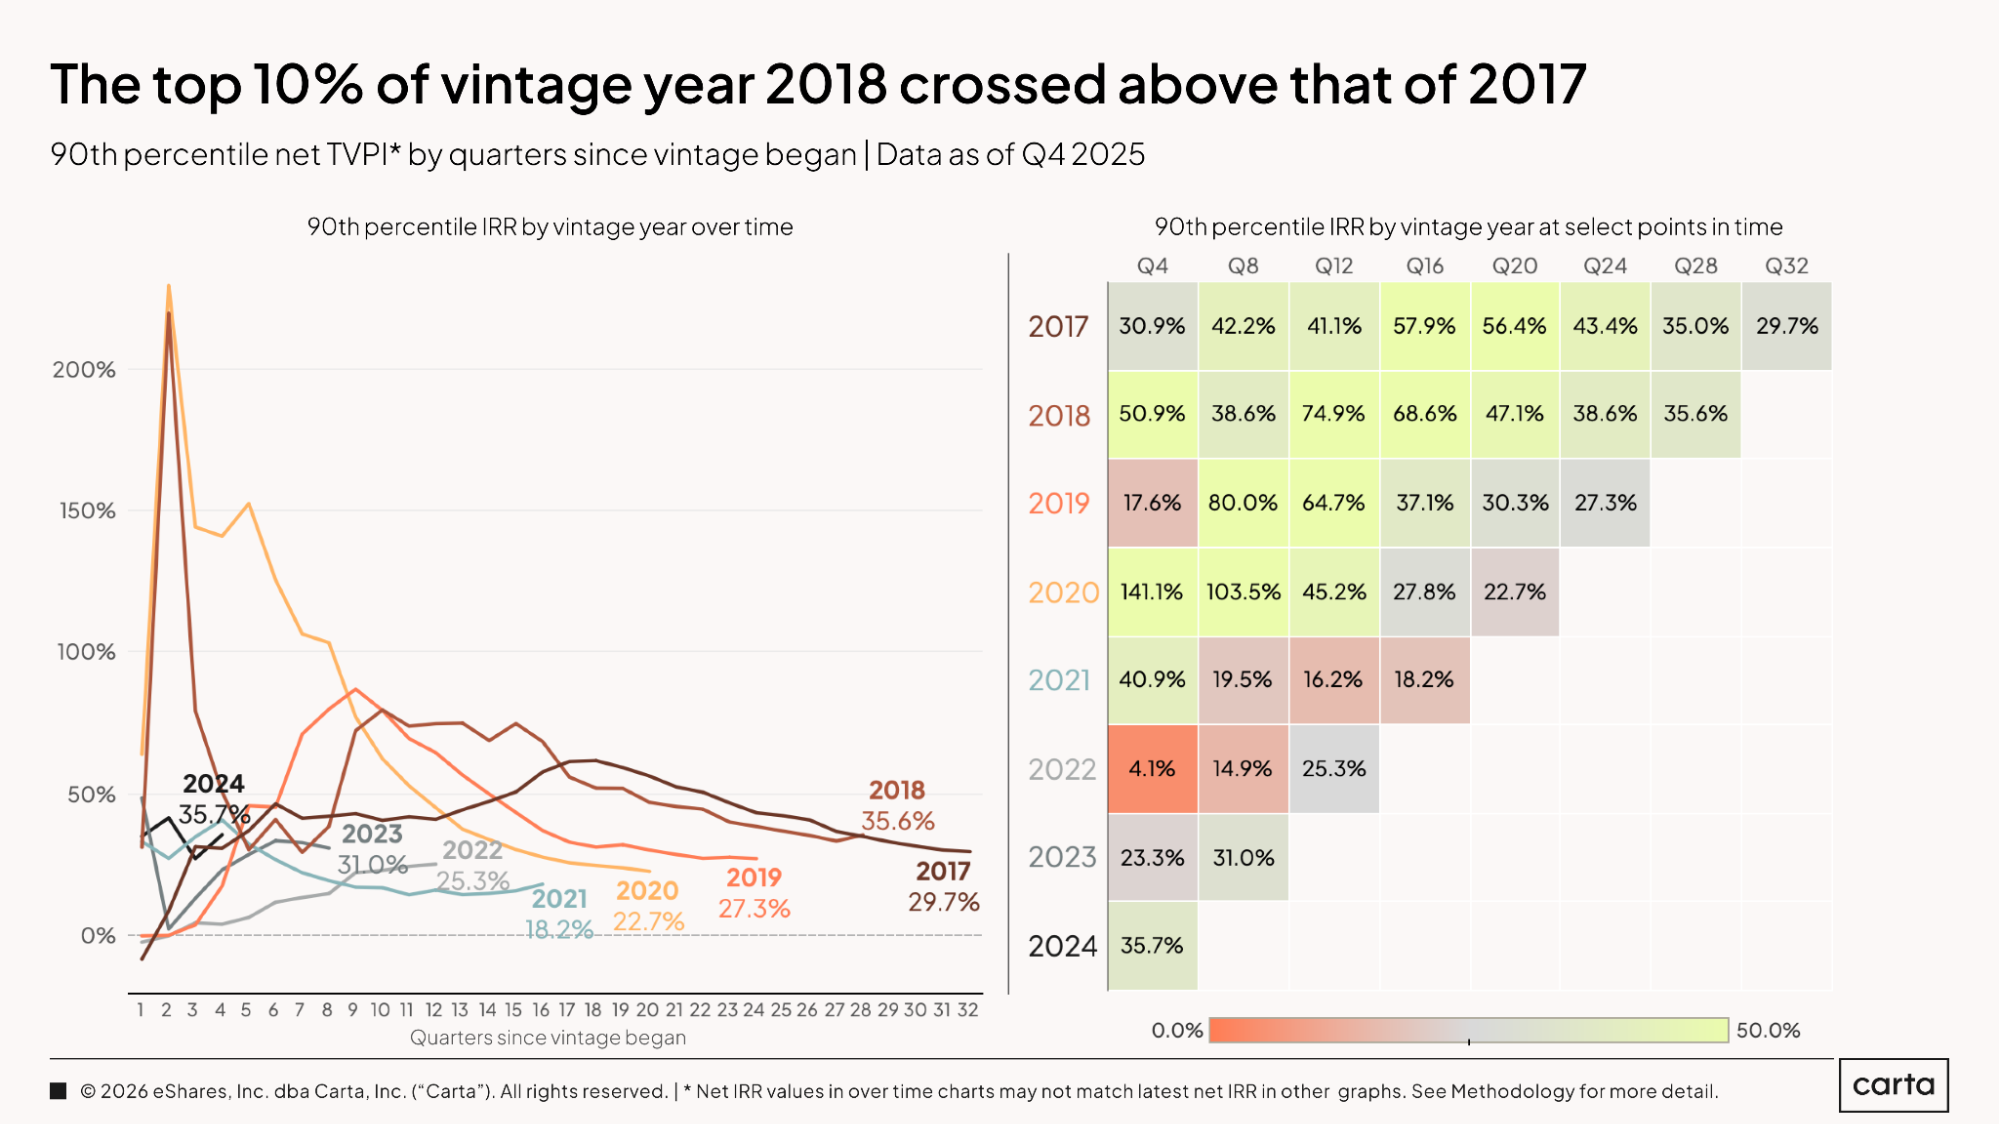
The 90th percentile of net IRR for each of the vintages shown here was at least 18.2% as of the end of 2025, with the 2021 vintage once again bringing up the rear. The 2024 vintage claims the highest top-decile IRR, at 35.7%, followed closely behind by the 2018 vintage, at 35.6%.
The dynamic is similar here to other statistical benchmarks: IRRs are declining for vintages from 2017 through 2020 and rising for vintages from 2022 on. Strong top-decile IRRs for the 2023 and 2024 vintages—both of which were closed after the launch of ChatGPT in November 2022—are a promising sign for funds that have backed some of the most promising AI startups to emerge from the ongoing AI boom.
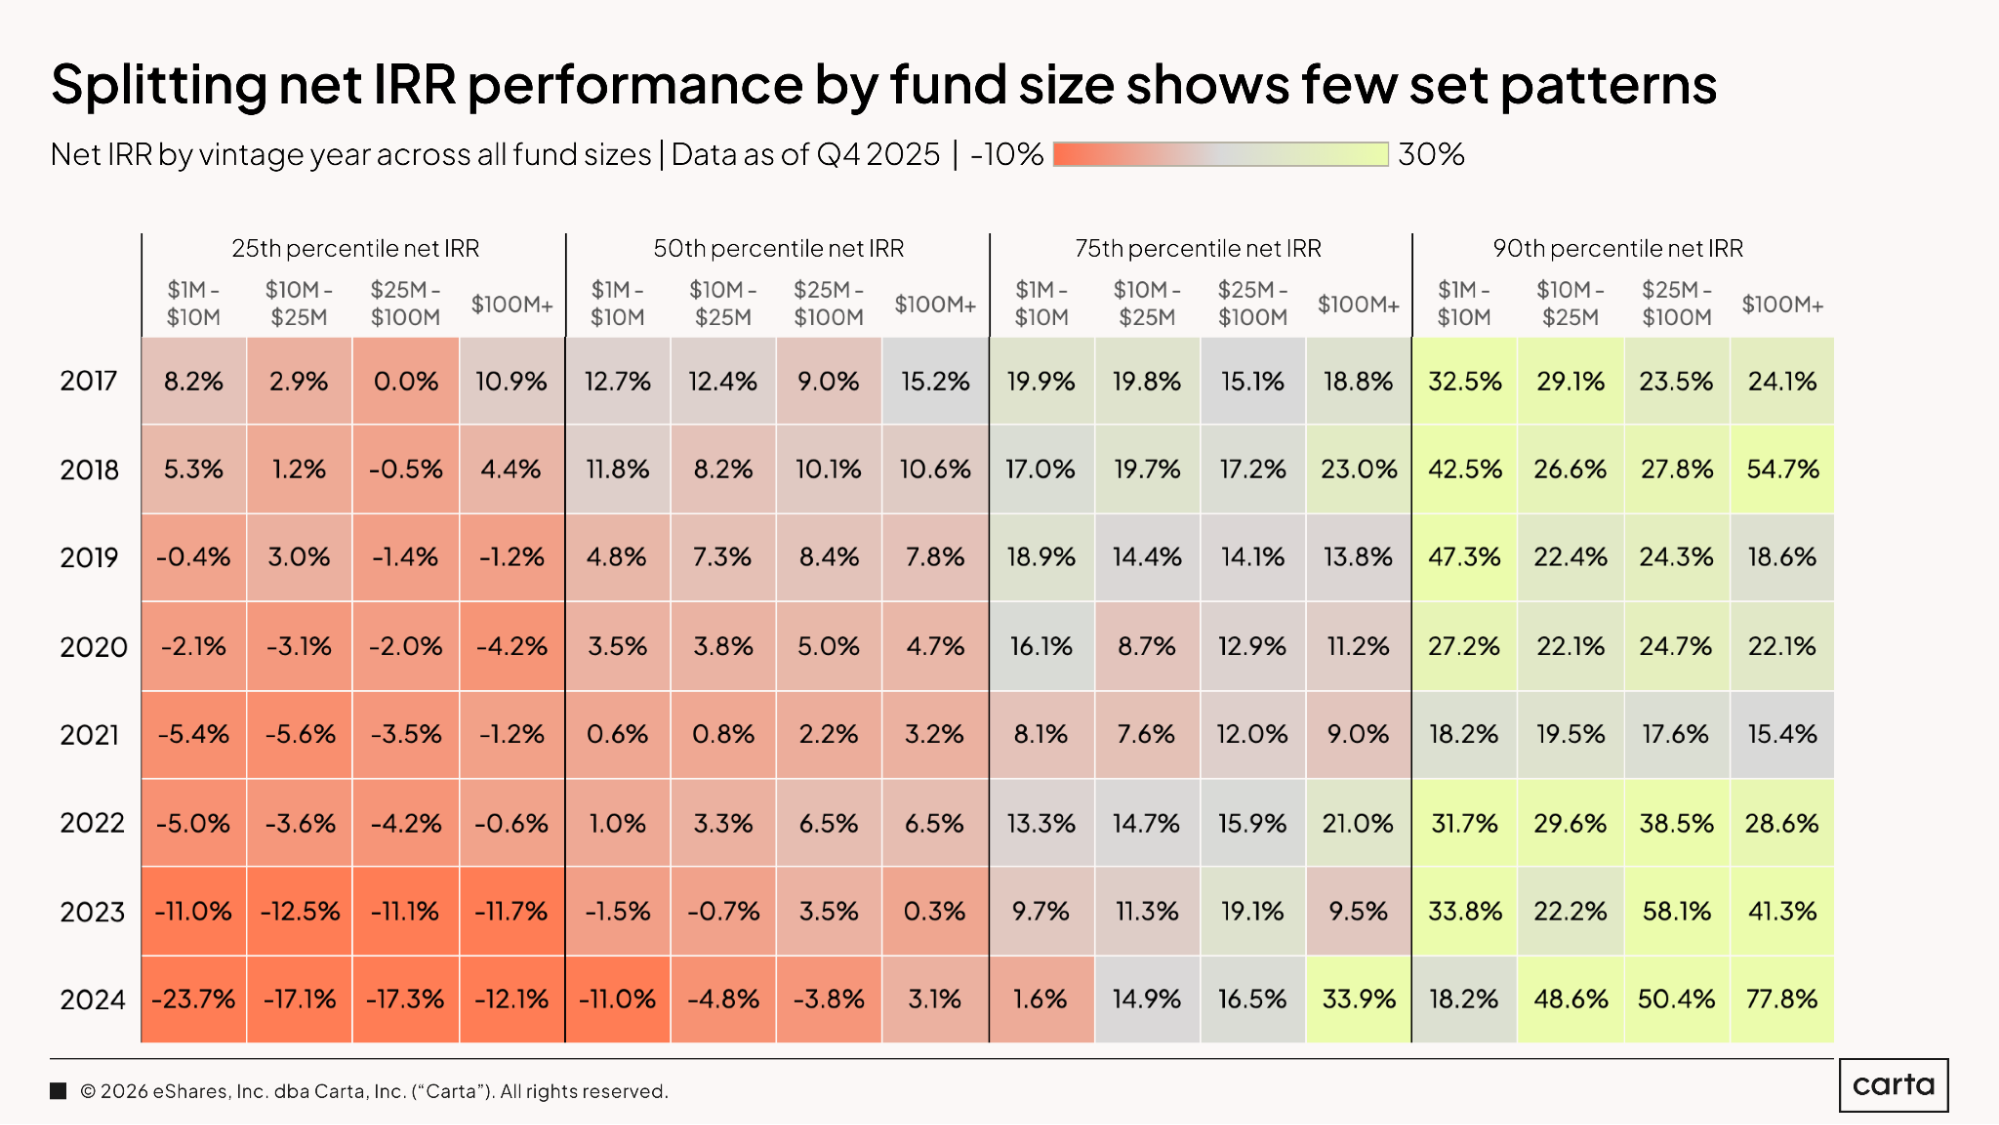
The strong early net IRRs for top-performing funds in the 2024 vintage extend across fund sizes. Among funds between $10 million and $25 million, the 90th percentile IRR for the 2024 vintage is 48.6%, higher than any other recent vintage for funds of the same size. Among funds larger than $100 million, the 2024 vintage boasts a top-decile IRR of 77.8%, again higher than any other year shown here.
Historically, smaller funds tend to have better IRRs than larger ones, simply because it’s mathematically easier for smaller funds to produce a strong return: Generating a 3x return on a $10 million fund requires $30 million in profits, while generating a 2x return on a $100 million vehicle requires a $300 million gain. The most recent vintages, though, are so far bucking this trend: At most performance thresholds, the $100 million-plus funds from 2023 and 2024 are outperforming the $1 million to $10 million funds.
TVPI
TVPI is a multiple that measures the current value of a fund’s holdings against the amount of initial capital that investors paid in. For instance, the 90th percentile for TVPI in the 2019 vintage is 3.01x, meaning the funds at this threshold have tripled the value of their portfolios based on the size of their initial LP contributions.
For each of the eight vintages shown here, the gap between the 75th and 90th percentiles of TVPI is substantially larger than the gap between the 50th and 75th percentiles, reflecting the top-heavy nature of venture investing in general. Rather than a smooth bell curve of performance, the VC asset class tends to produce a small percentage of outlier outcomes that drive outsized returns for the very top of the market.
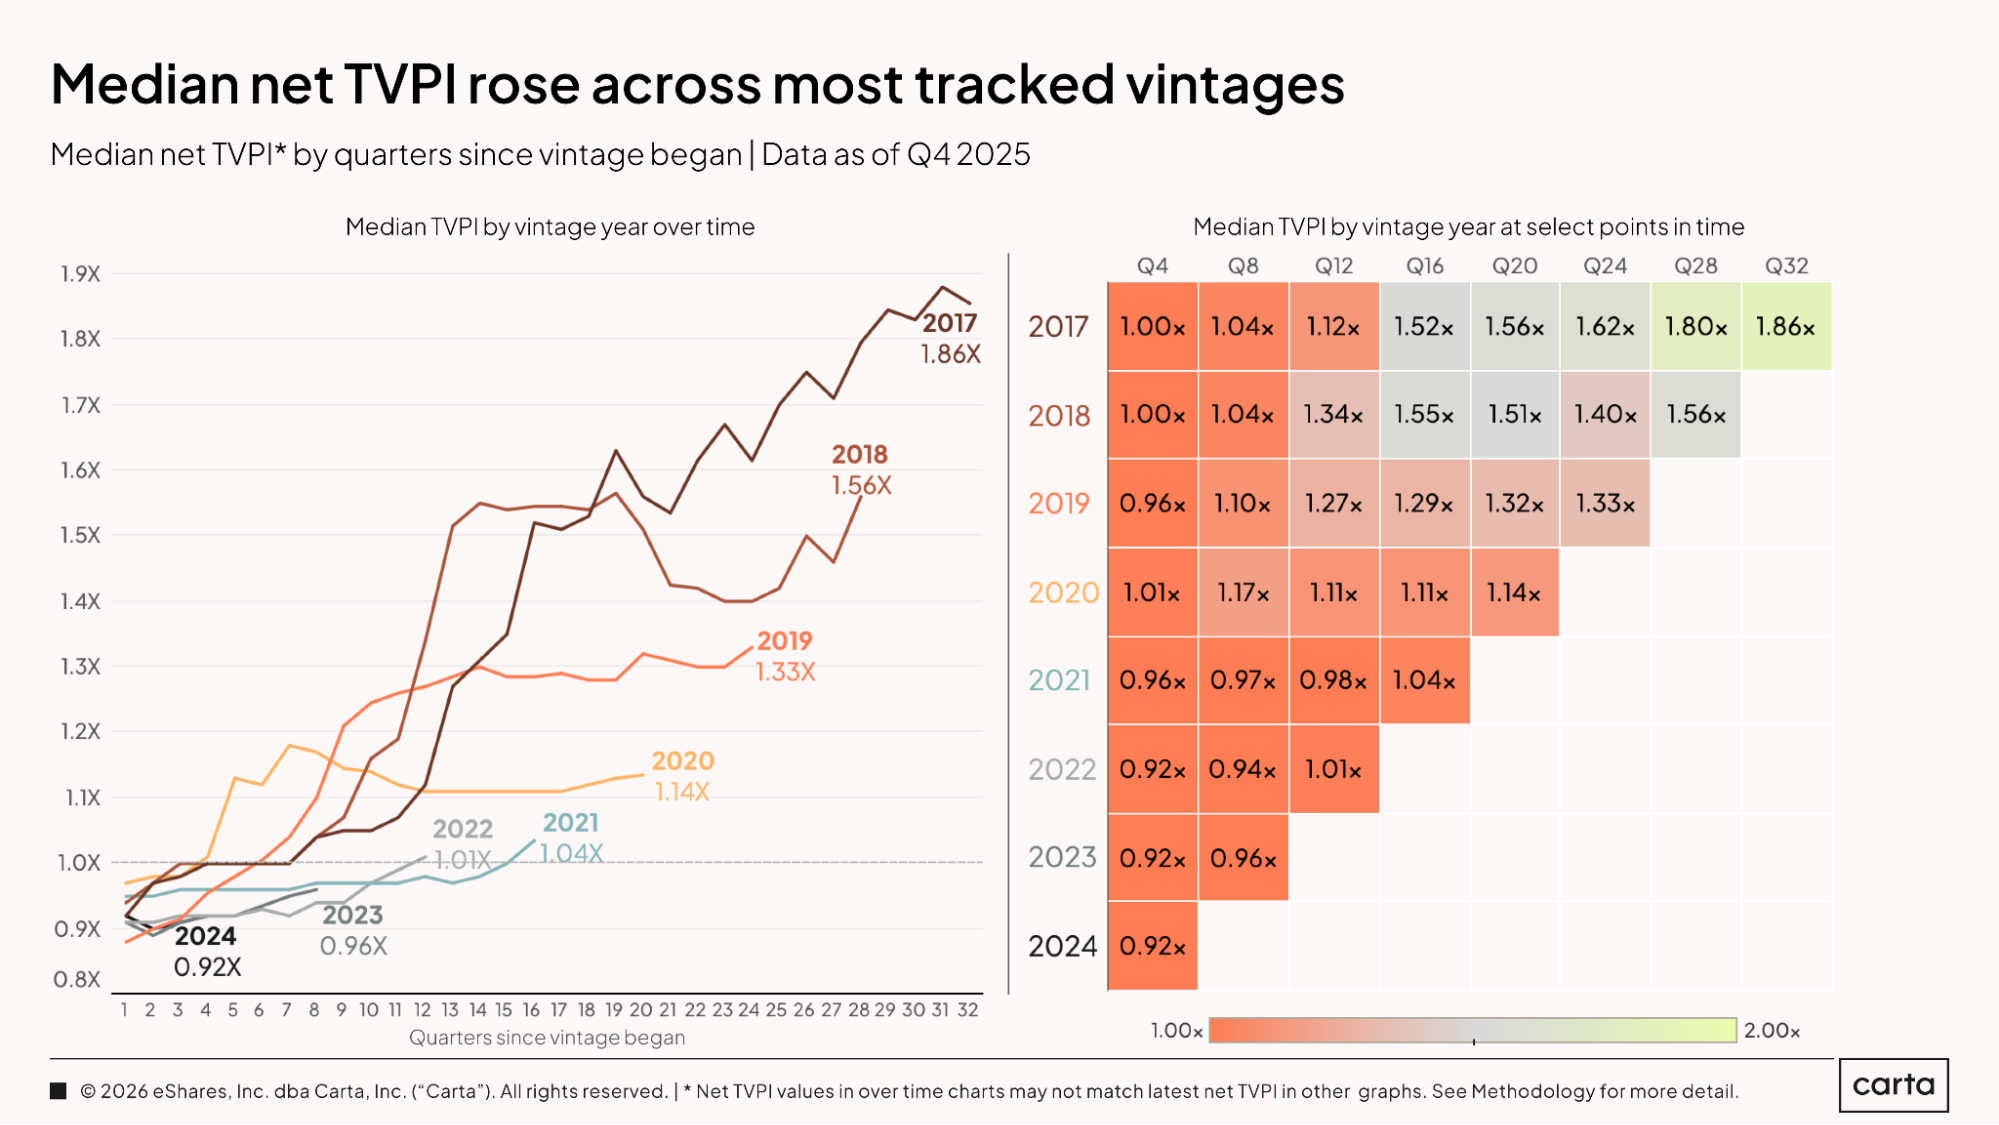
Even more so than IRR, TVPI for vintages that are still actively managing their portfolios tends to depend on timing, with older vintages boasting stronger performance. Again, this is due to these more mature vintages having had more time to help their portfolio companies grow and start to realize some returns.
In this case, each vintage in this sample has a lower TVPI than every other vintage that preceded it. Median TVPIs for the 2021 and 2022 vintages both climbed above 1x over the past four quarters, with trendlines that continue to point up and to the right.
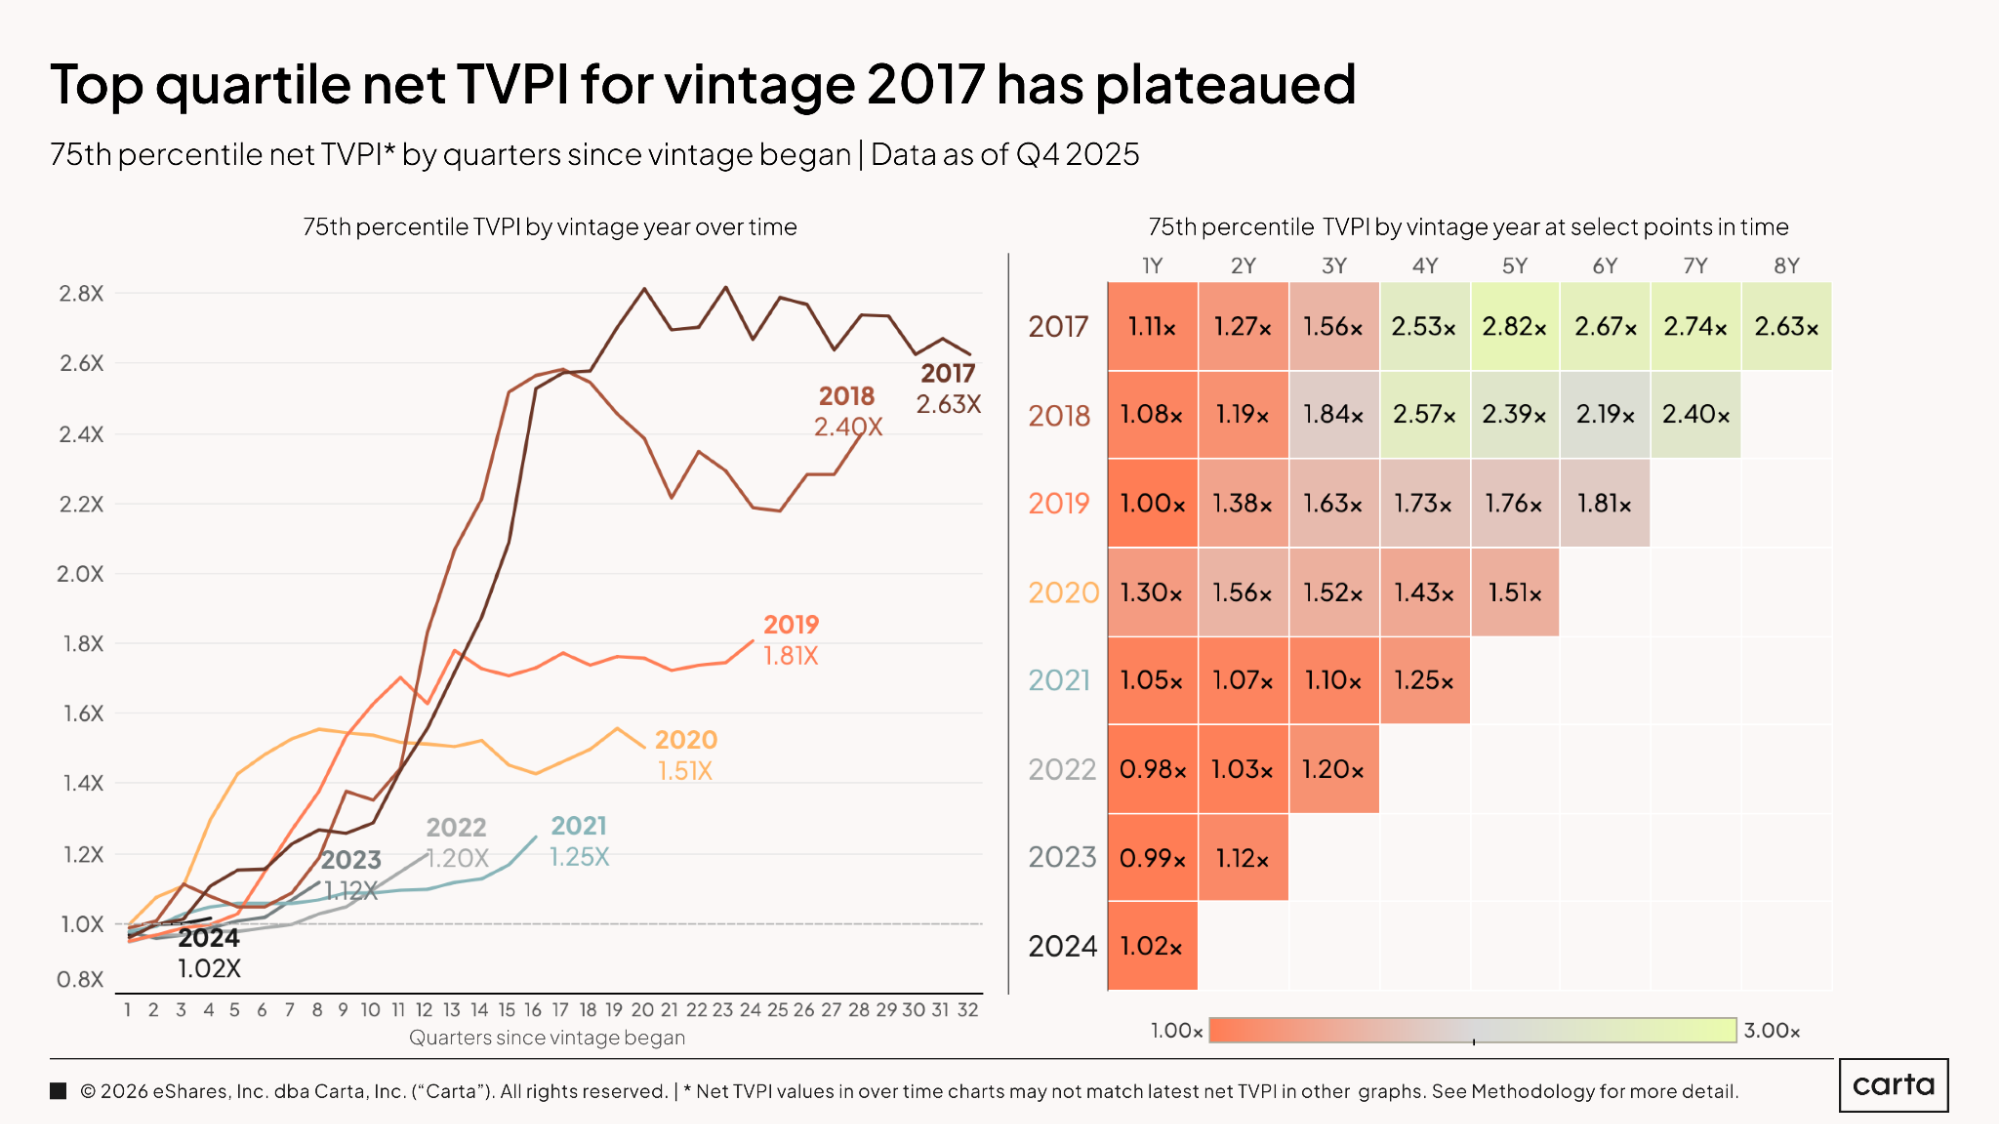
While the median TVPI for 2017 funds continues to rise, the 75th percentile for the 2017 vintage has now been gradually declining for the past few years. As of the end of 2025, this benchmark sat at 2.63x, down from 2.82x at the same point three years ago.
The 2018 vintage experienced a similar period of decline, but it came to an abrupt end over the past few quarters. Today, the 75th percentile TVPI for 2018 funds sits at 2.4x, up from 2.19x a year ago. All of the other fund vintages shown here have also experienced gains in 75th percentile IRR over the past year, including the 2022 vintage, which has seen a rise from 1.03x to 1.2x over this period.
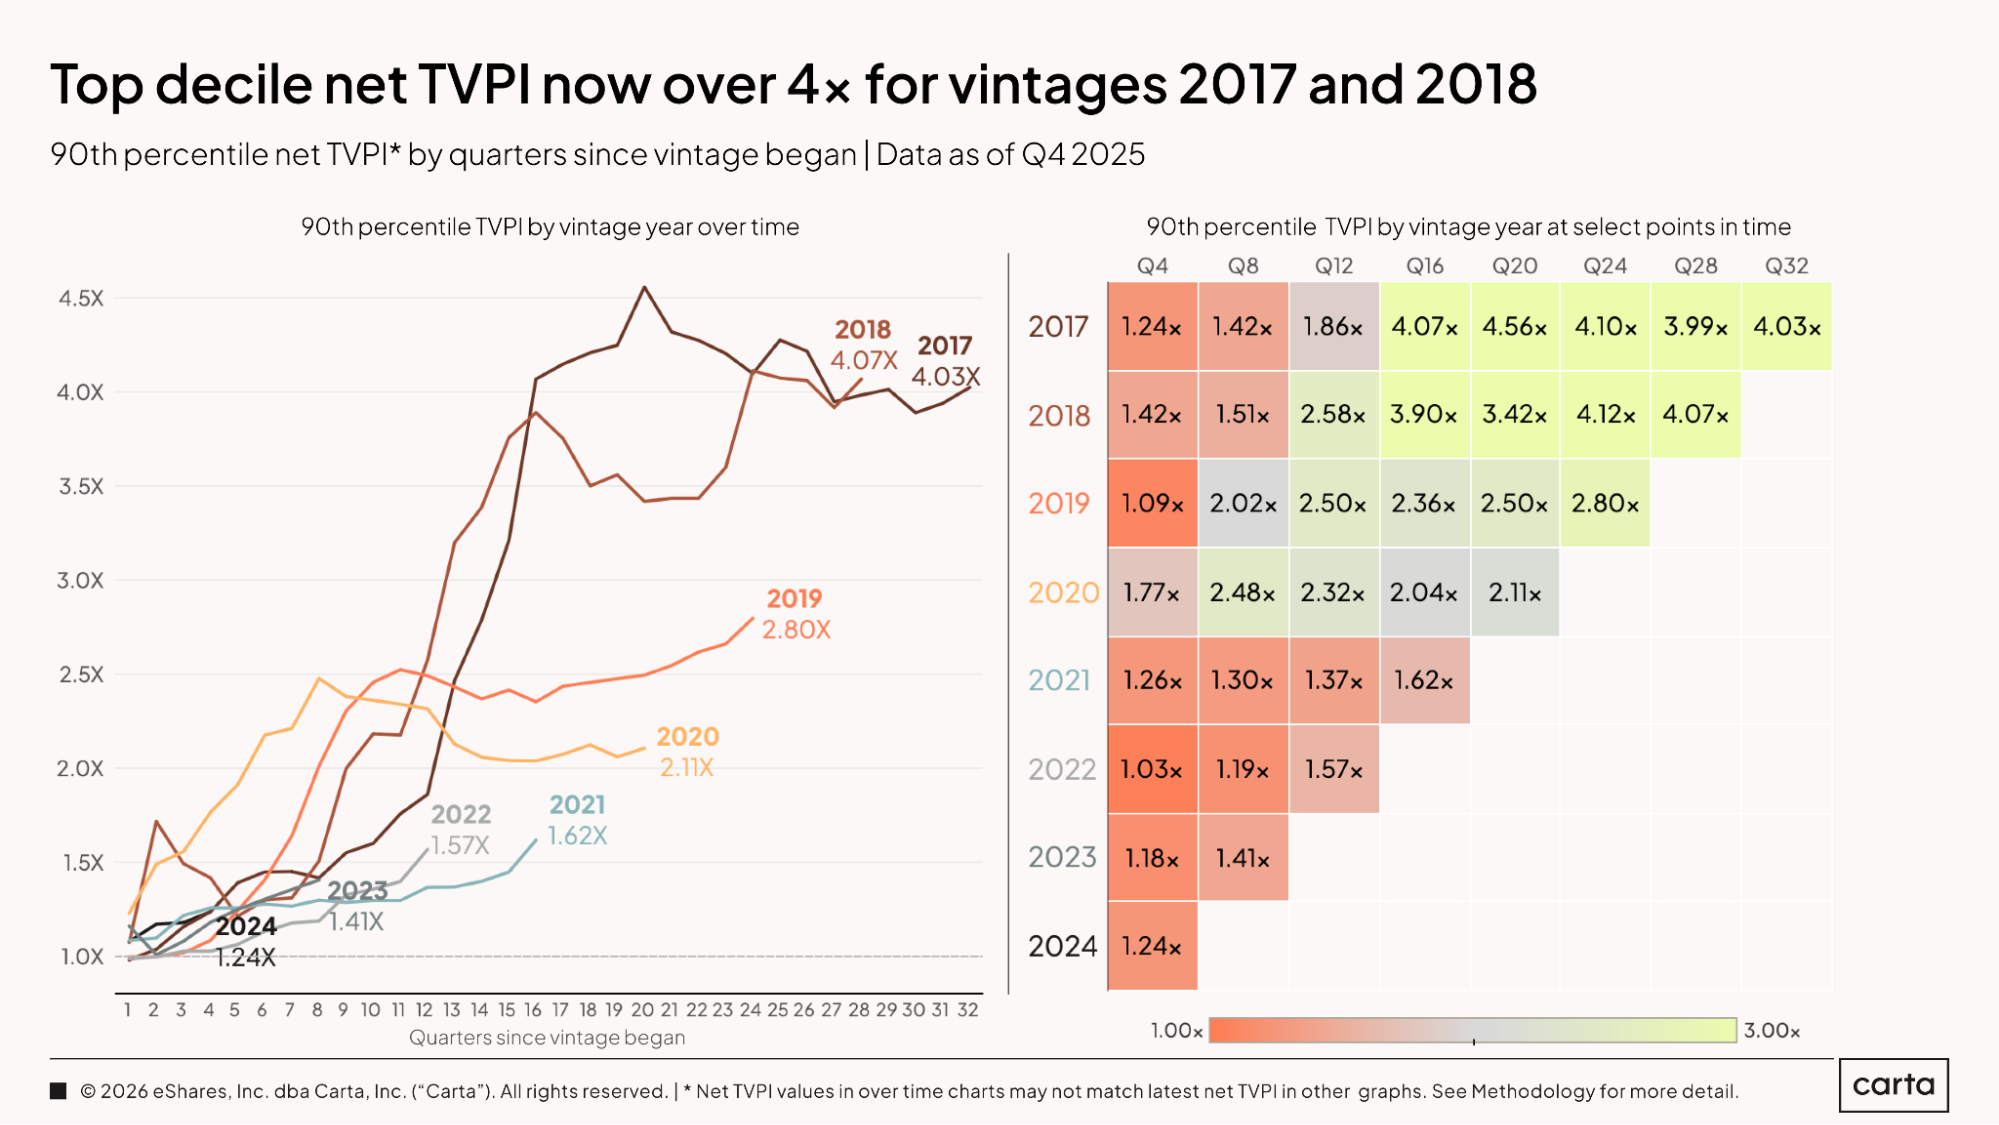
At the very top of the market, the 2018 vintage (90th percentile TVPI of 4.07x) has surpassed the 2017 vintage (4.03x) in terms of performance. The 2017 vintage has now been at or near this level for four full years, dating back to the end of 2021, during a very different era in the recent history of the venture market.
The 2019 vintage is also rapidly gaining ground. It claims a current top-decile TVPI of 2.8x—not far off the 3x mark that is generally considered the threshold for strong performance from a VC fund.
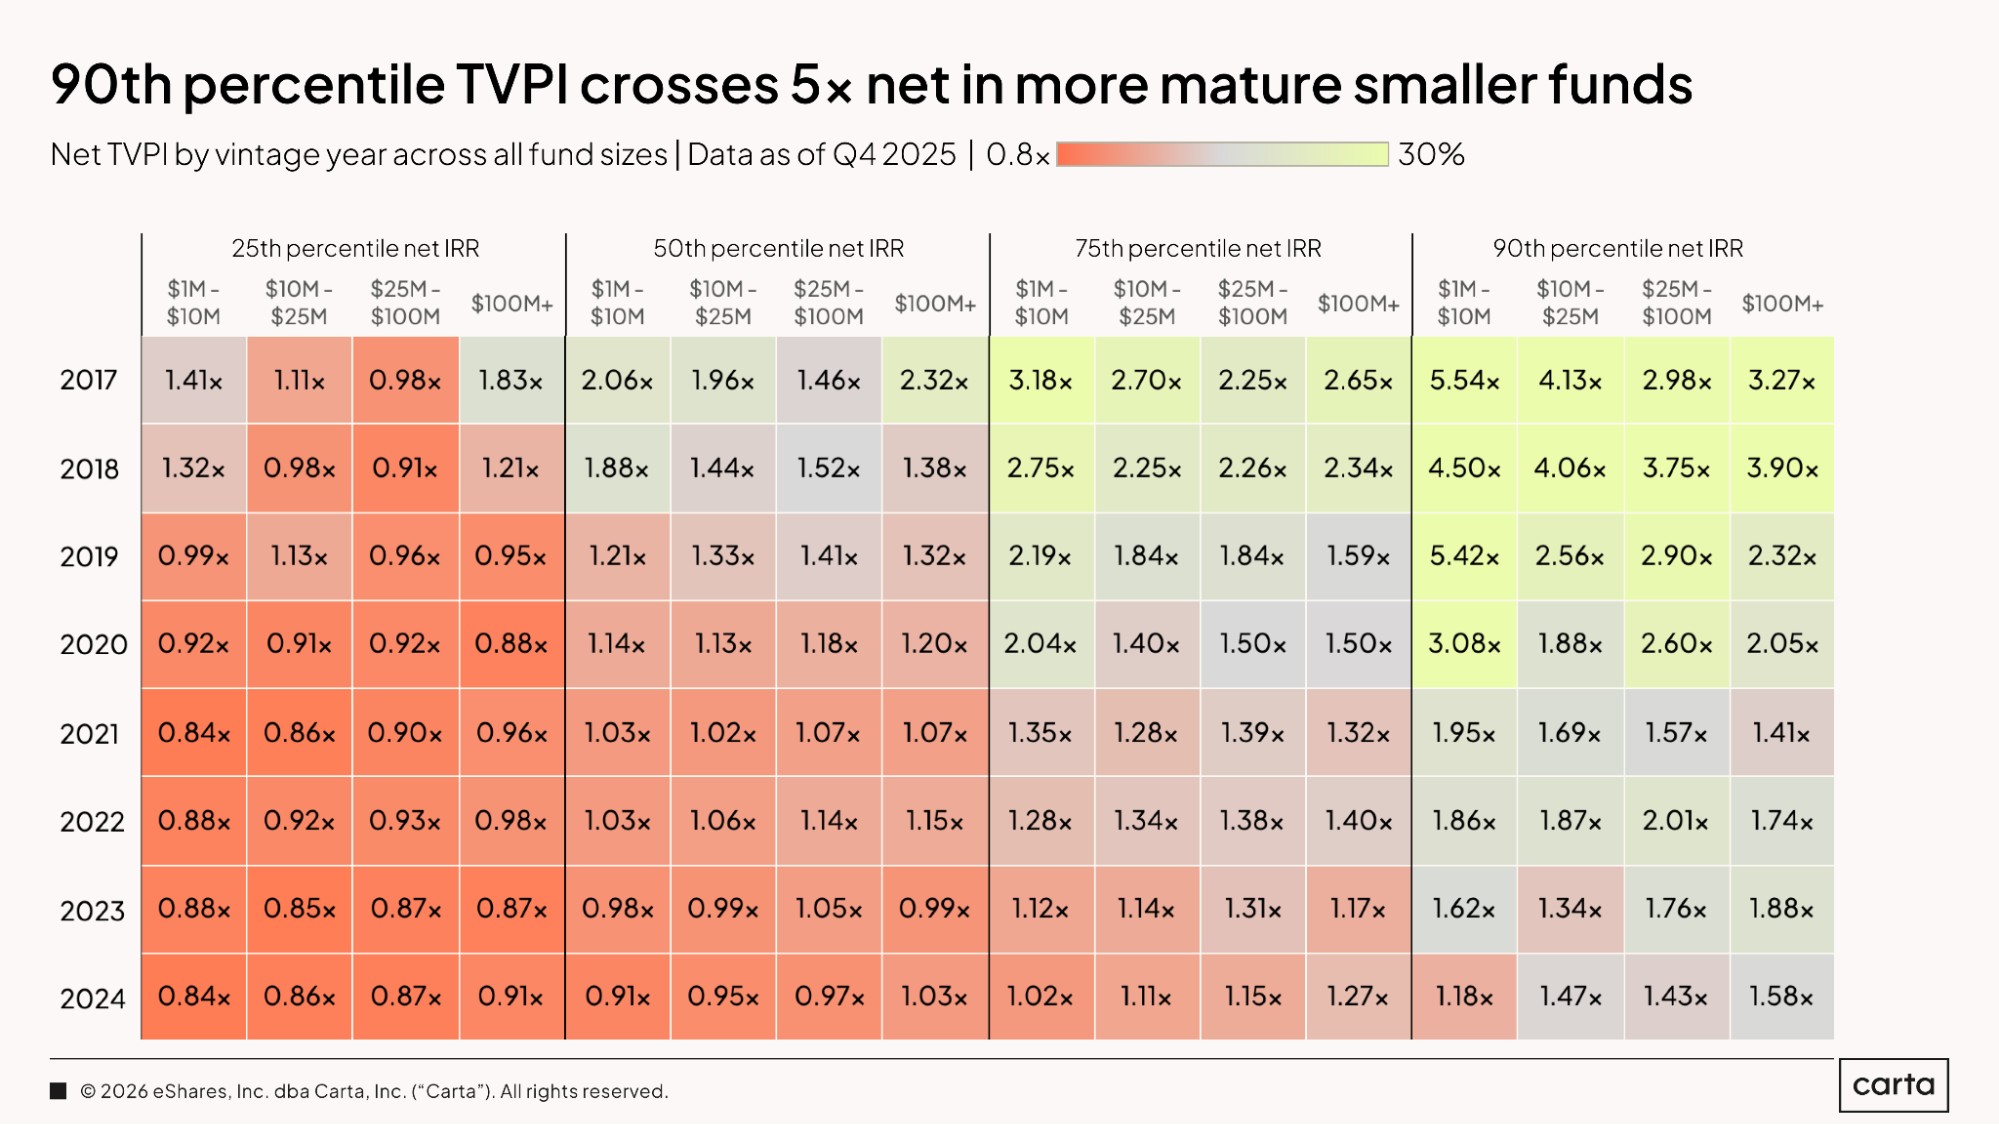
Among all of these recent years and VC fund sizes, smaller funds from the late 2010s are clearly the top performers in terms of TVPI. In the 2017 vintage, funds with between $1 million and $10 million commitments have a 90th percentile TVPI of 5.54x. That same figure sits at 4.5x for the 2018 vintage and 5.42x for the 2019 vintage. In each case, these returns are substantially higher than the 90th percentile results for larger funds.
The difference between bottom-quartile TVPI and top-quartile TVPI tends to increase as vintages mature, reflecting how outcomes tend to diverge over time. For instance, for $100 million-plus funds in the 2024 vintage, the 25th percentile for TVPI is 0.91x, and the 75th percentile is 1.27x, a difference between the two of 40%. For $100 million-plus funds in the 2018 vintage, the 75th percentile is 93% higher than the 25th percentile.
DPI
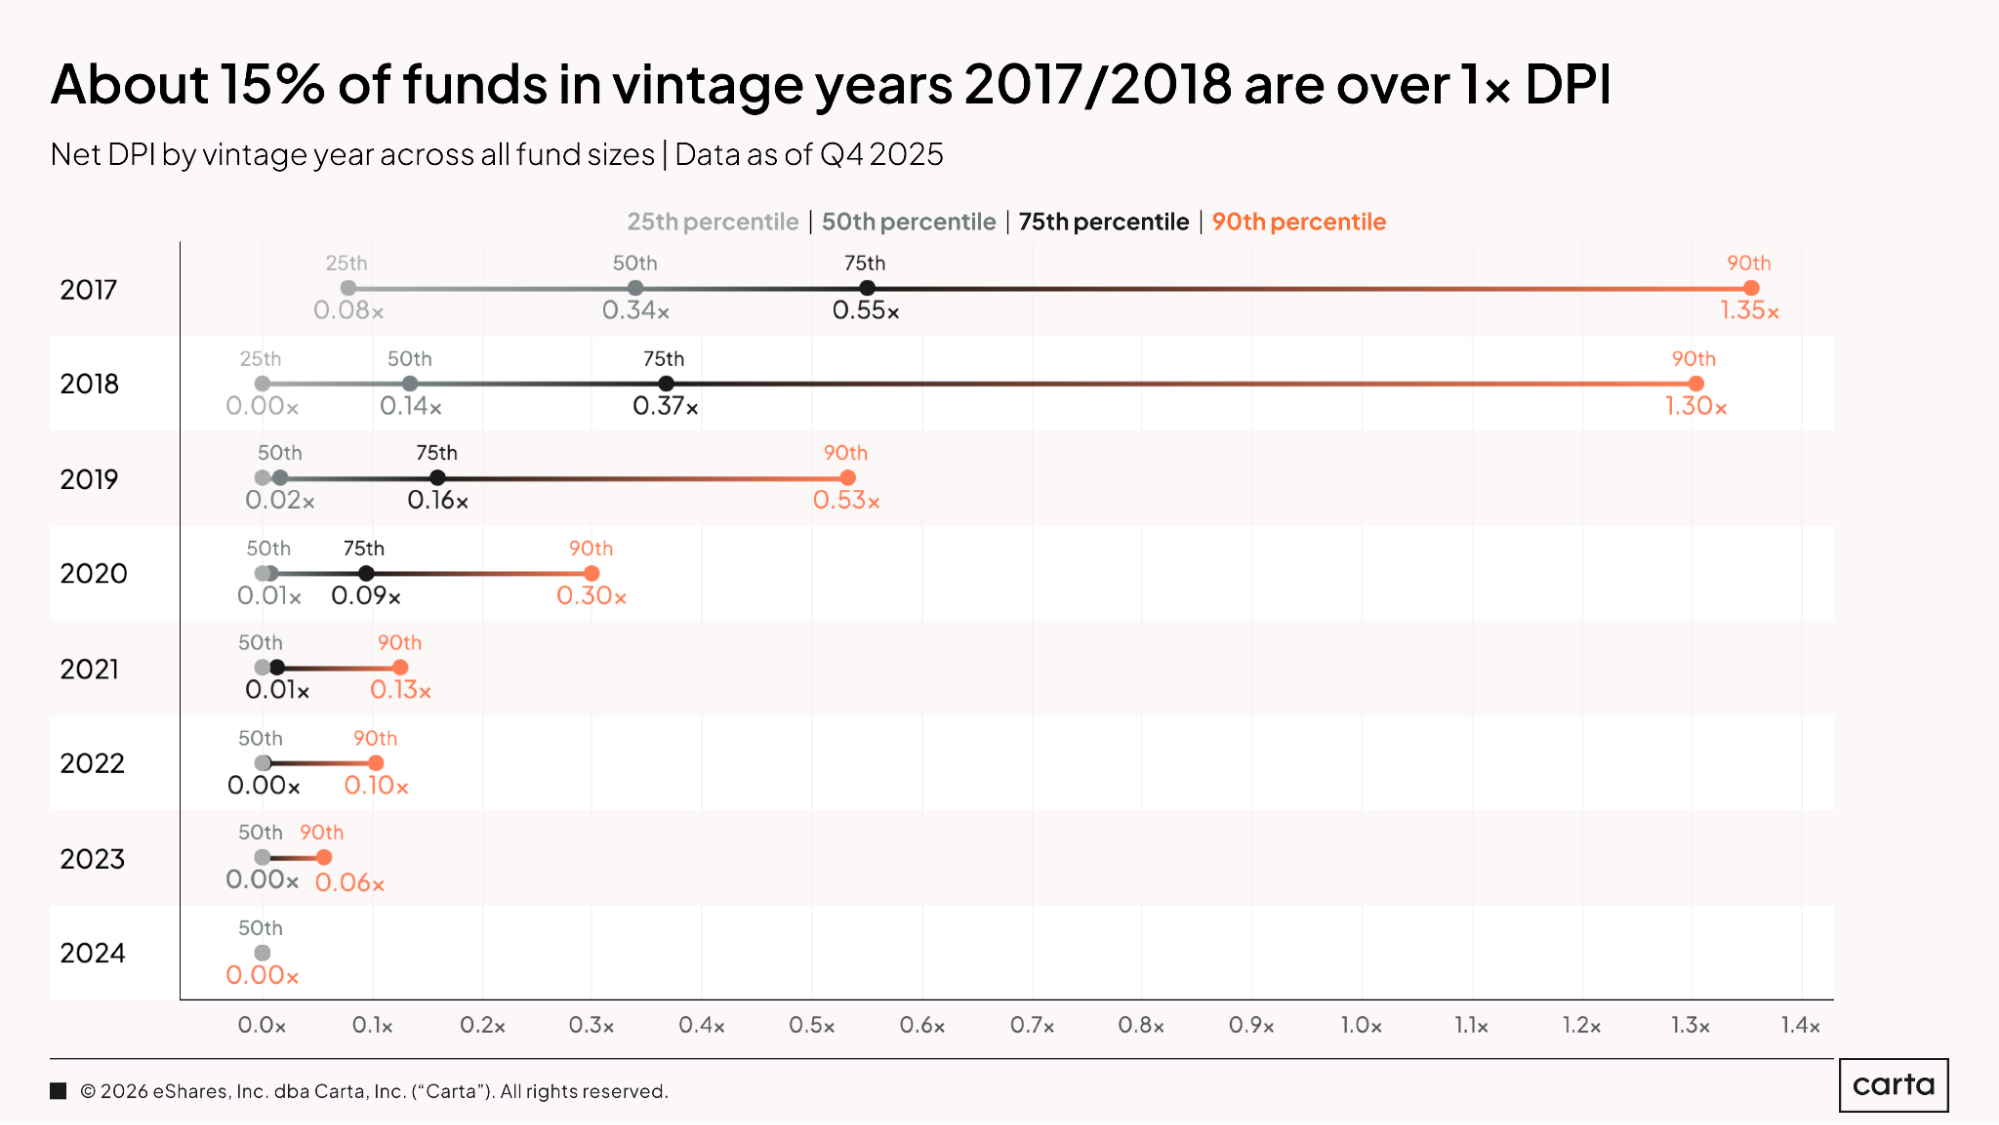
In terms of the DPI they’ve been able to generate, the collection of vintages analyzed here can be divided into a few different categories.
The 2017 and 2018 vintages are the most mature, with most funds in each cohort claiming at least some amount of DPI and the top 15% or so registering DPIs above 1x, meaning those funds have now distributed more capital back to their LPs than the amount of initial capital that was paid in. In the 2019 and 2020 vintages, some funds are beginning to reach a marginal amount of DPI, but substantial returns remain uncommon. Each vintage from 2021 on, meanwhile, has very few returns to speak of, with only a smattering of funds reaching a DPI of even 0.1x.
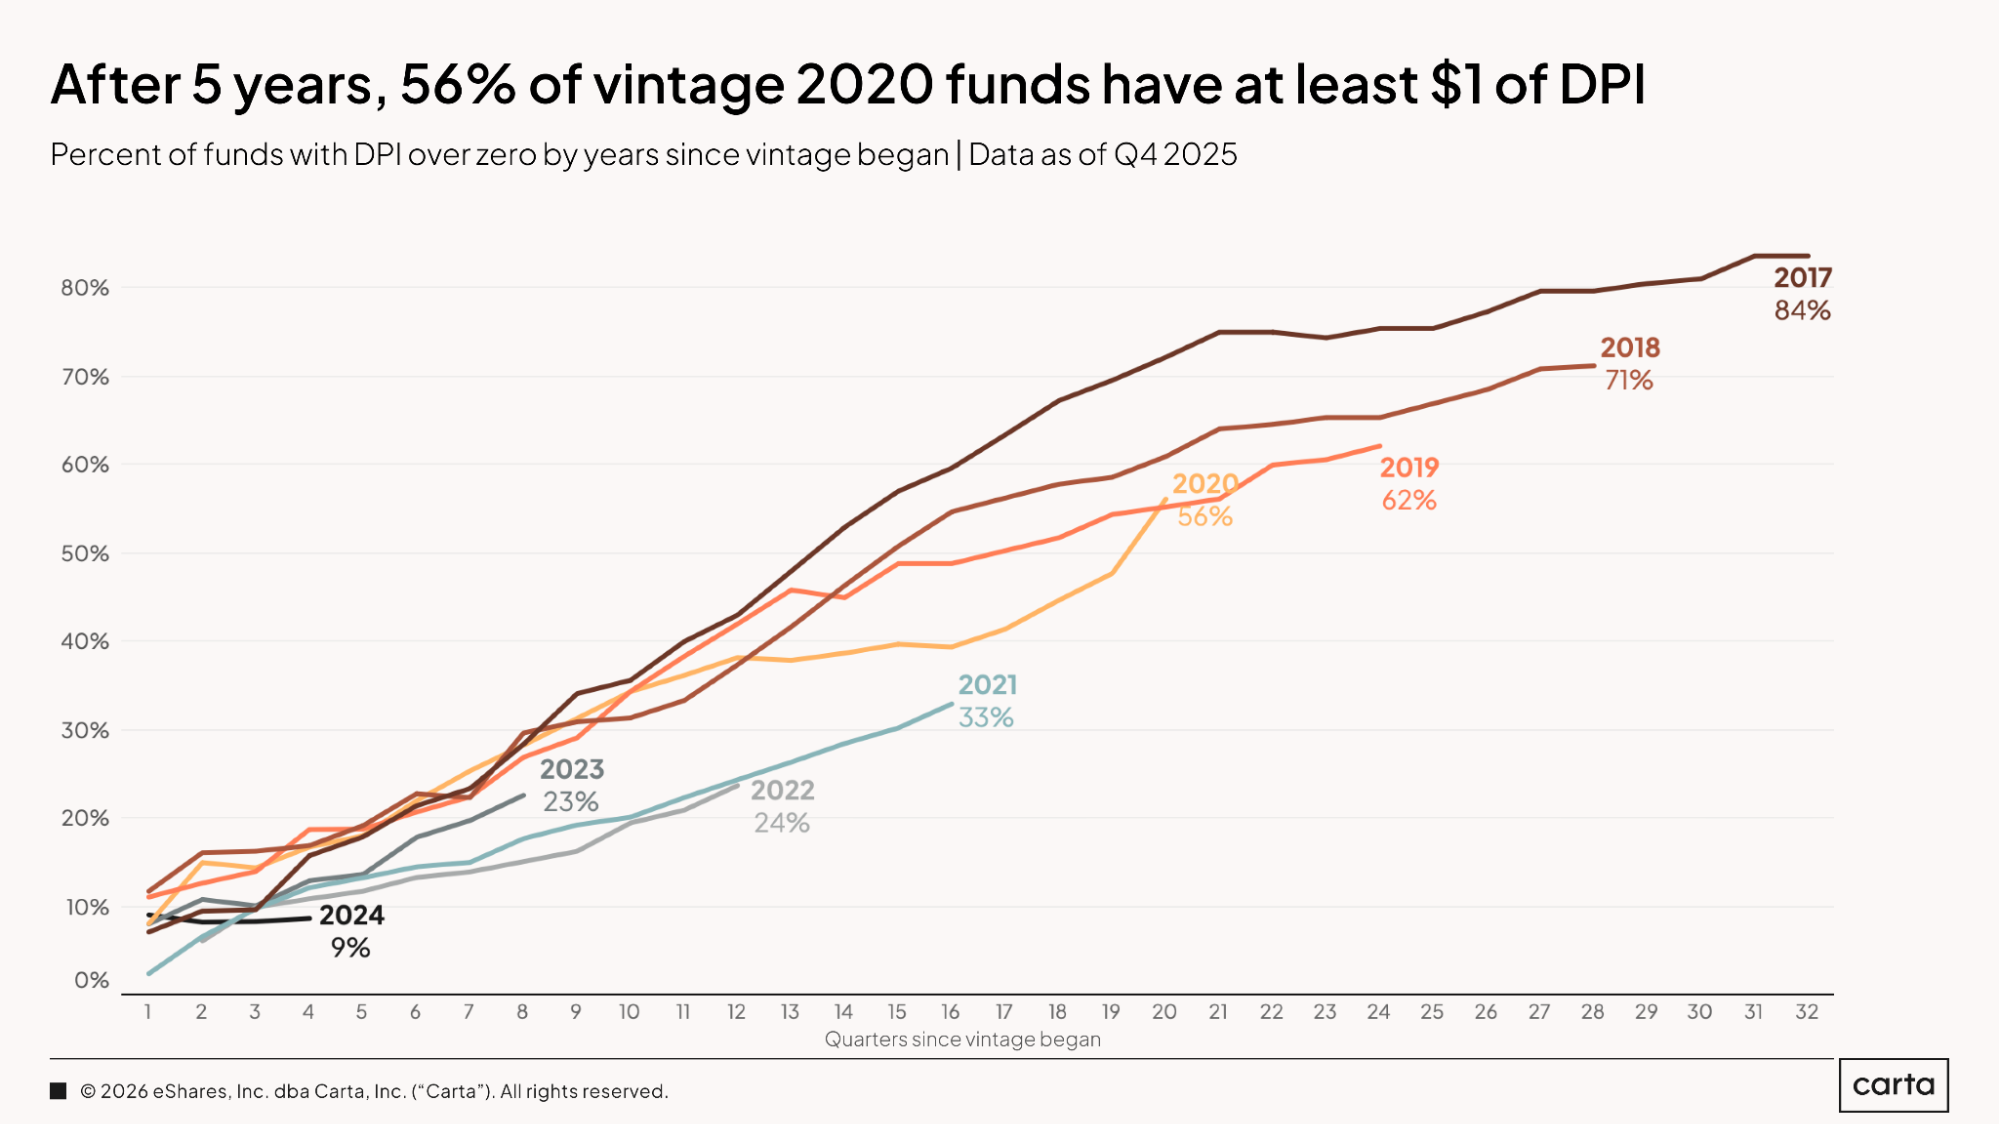
It’s becoming increasingly common for venture funds from the 2021 through 2024 vintages to have recorded at least some amount of DPI. But in terms of the speed with which they’re generating returns, all four of these vintages are lagging behind their recent peers.
After 16 quarters of management, about 33% of funds from the 2021 vintage have started returning capital to their LPs. At that same point in time, about 50% of 2019 funds and about 60% of 2017 funds had begun to record DPI. These longer timelines to liquidity among more-recent vintages are due mainly to the chilly exit environment of the past few years. With fewer attractive opportunities for portfolio companies to go public or pursue M&A deals, LPs are having to wait longer to see concrete returns on their investments in VC funds.
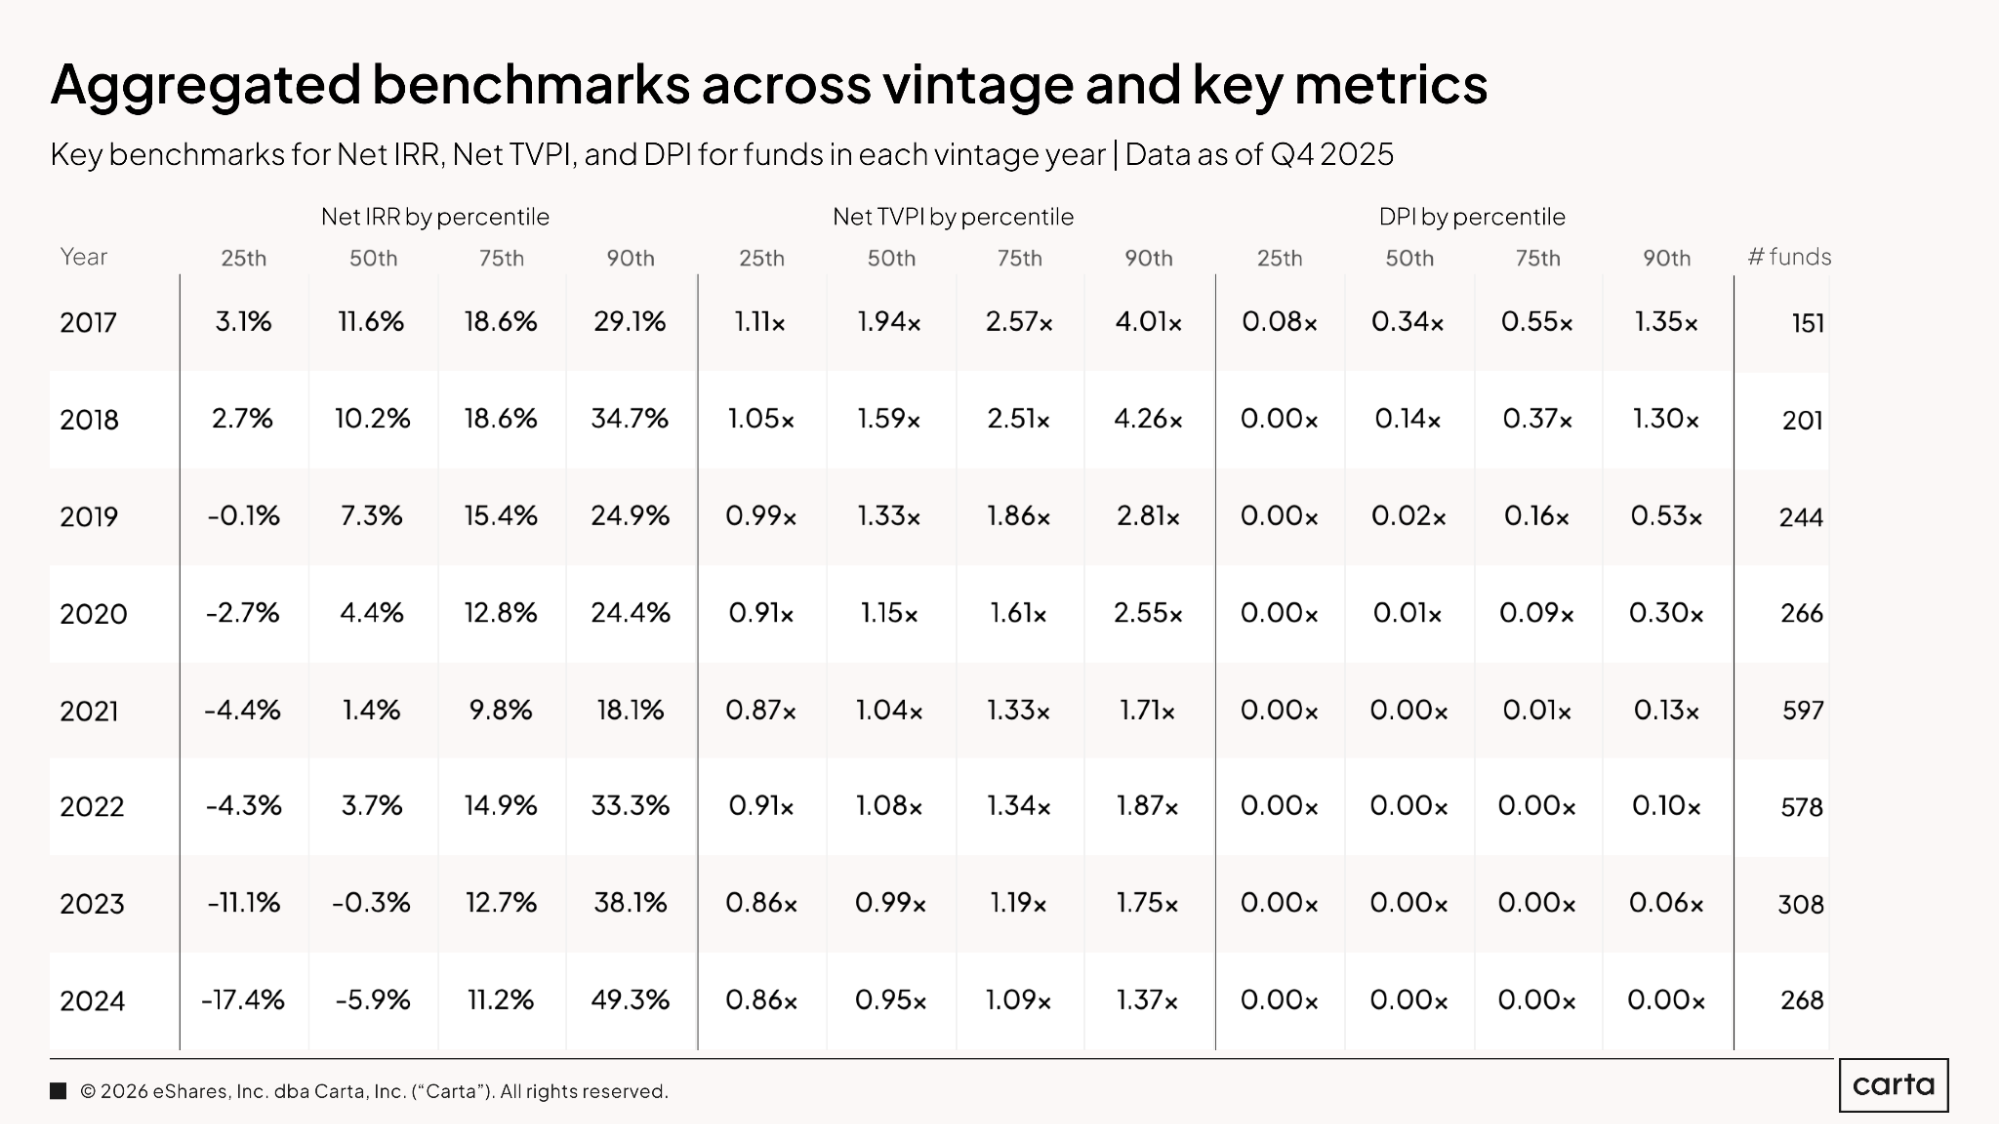
The above table compiles some of the key statistical benchmarks for IRR, TVPI, and DPI for each vintage of venture funds from 2017 through 2024, making it easy to compare your fund against the rest of the market.
For the 2018 vintage, for example, a median fund had an IRR of 10.2%, TVPI of 1.59x, and DPI of 0.14x as of the end of 2025. For a 2018 fund at the 90th percentile, those same numbers climb to 34.7%, 4.26x, and 1.3x. Since that 2018 vintage includes a total of 201 funds, about 20 funds from that cohort are at or above the 90th percentile threshold.
Market context
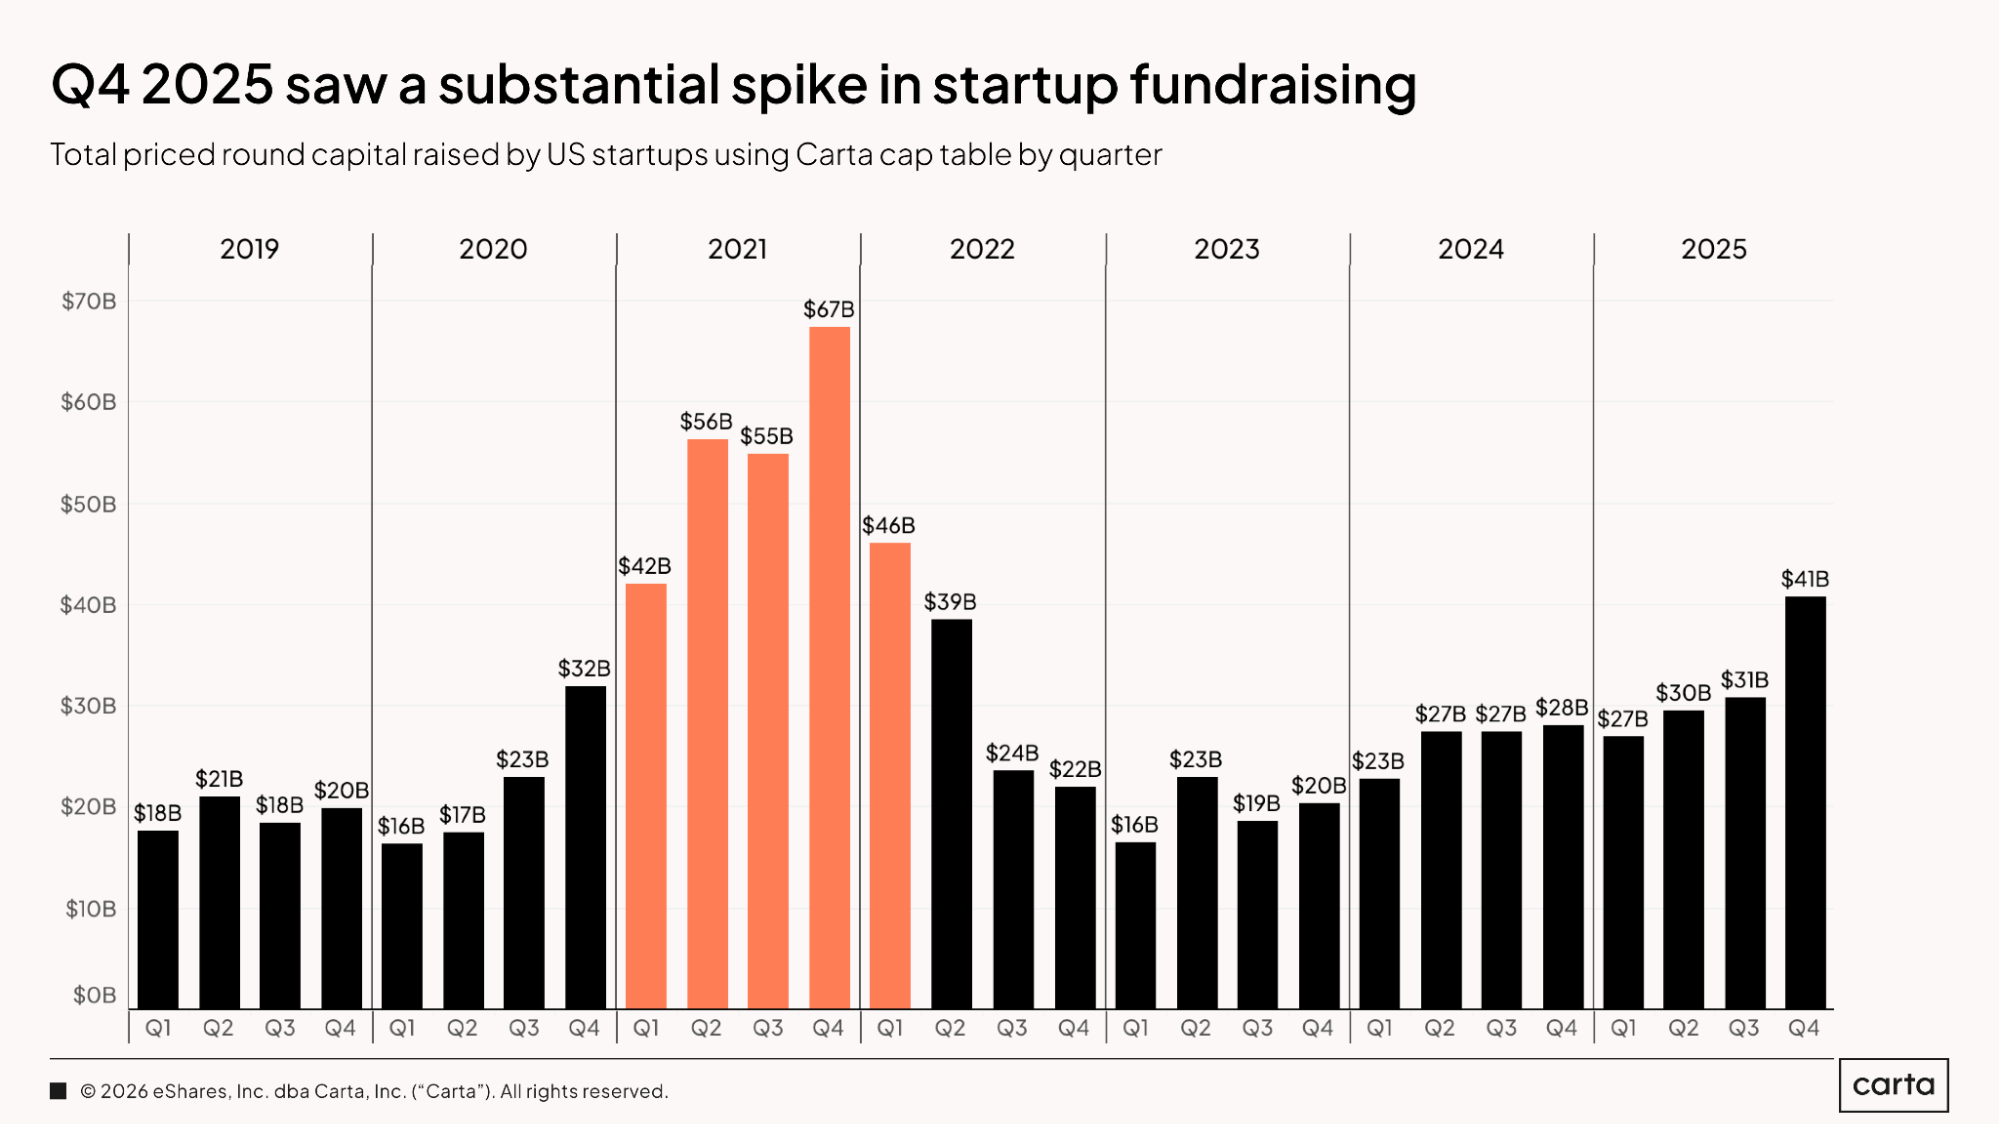
Last year ended with a banner quarter for venture fundraising, as startups on Carta combined to bring in about $41 billion in new capital, the highest quarterly total since Q1 2022. After plummeting in late 2022 and early 2023, quarterly fundraising totals have been gradually trending up for three years now, but Q4 2025 represented the largest leap yet.
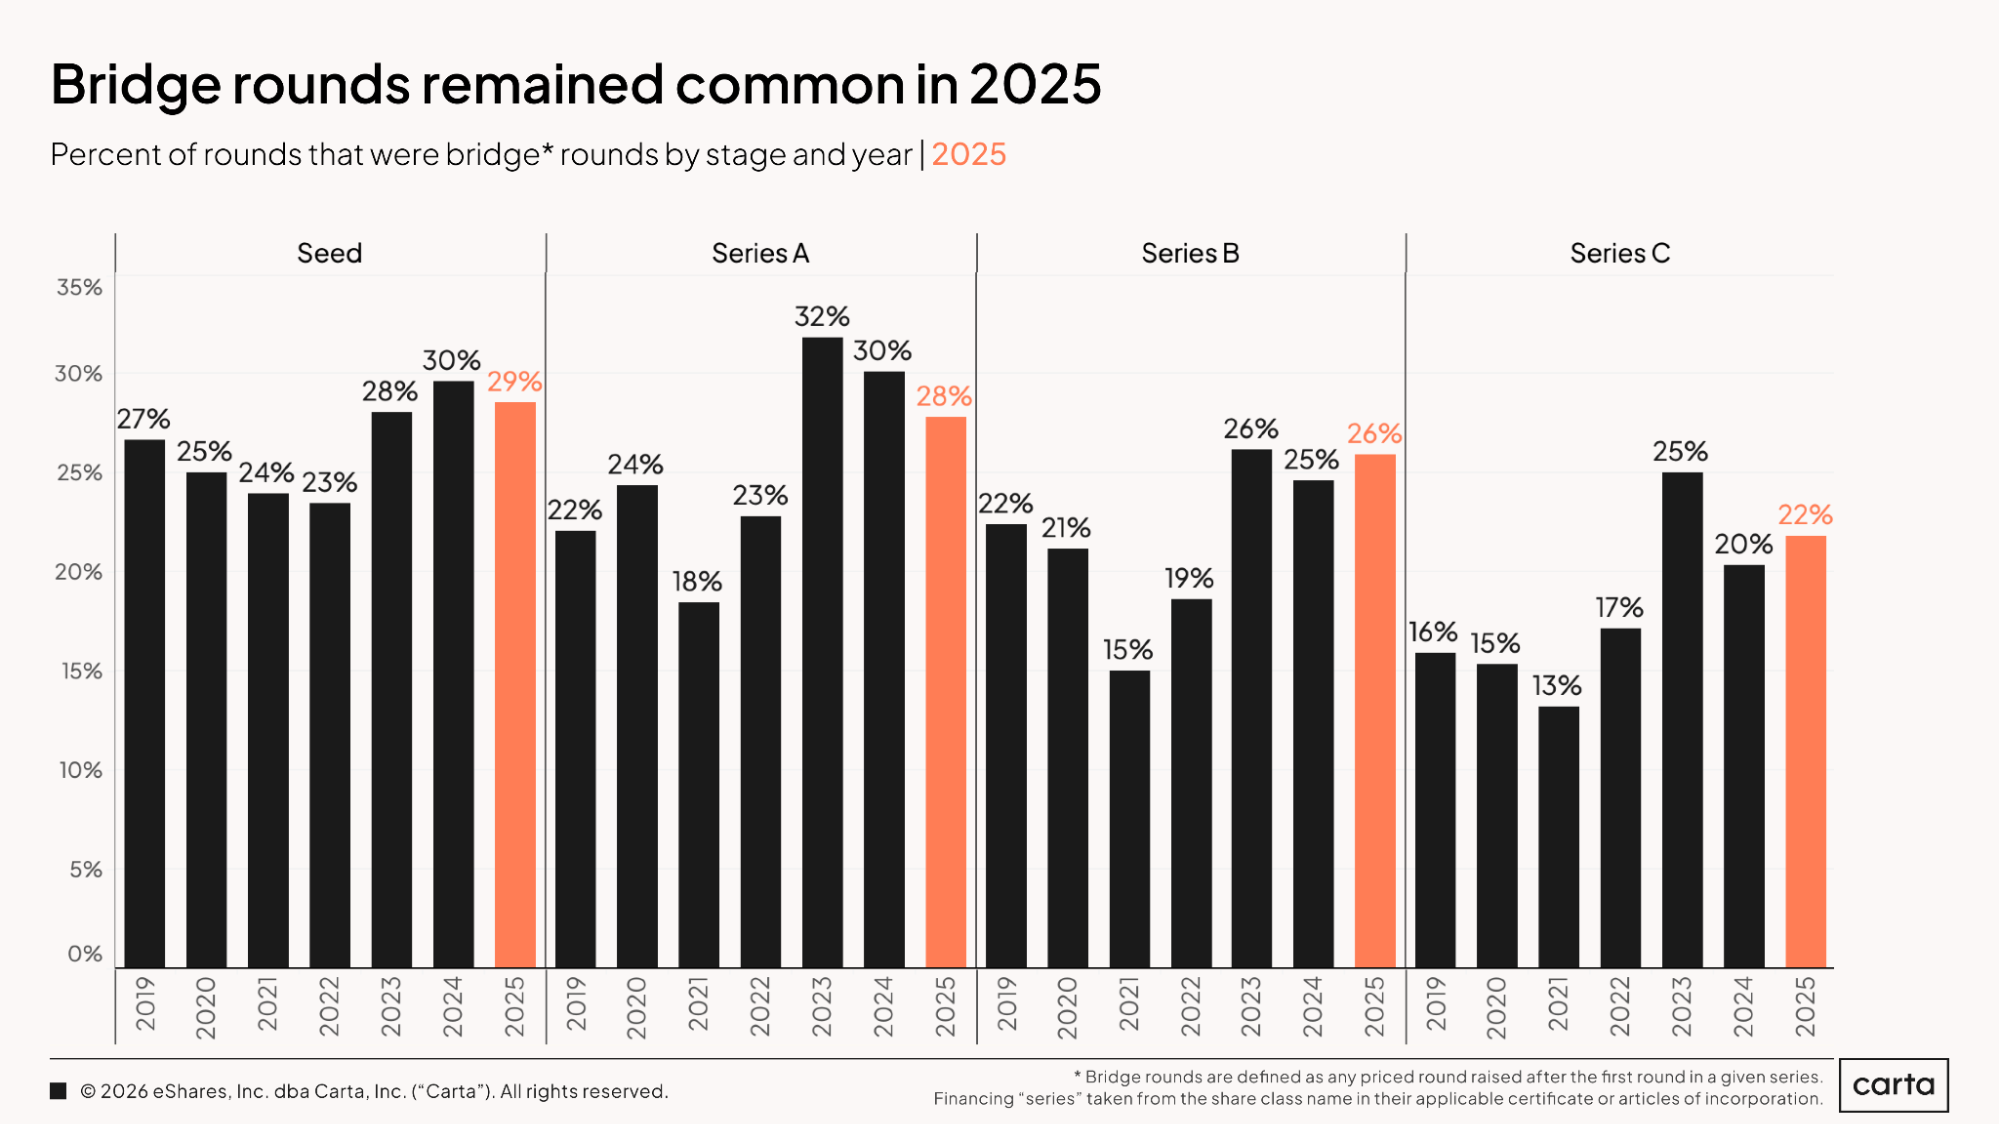
The percentage of all funding events that were bridge rounds declined slightly during 2025 at both seed and Series A, while ticking up at both Series B and Series C. In the big picture, bridge rounds remain more common today than they were prior to the venture boom of 2021, particularly at Series C.
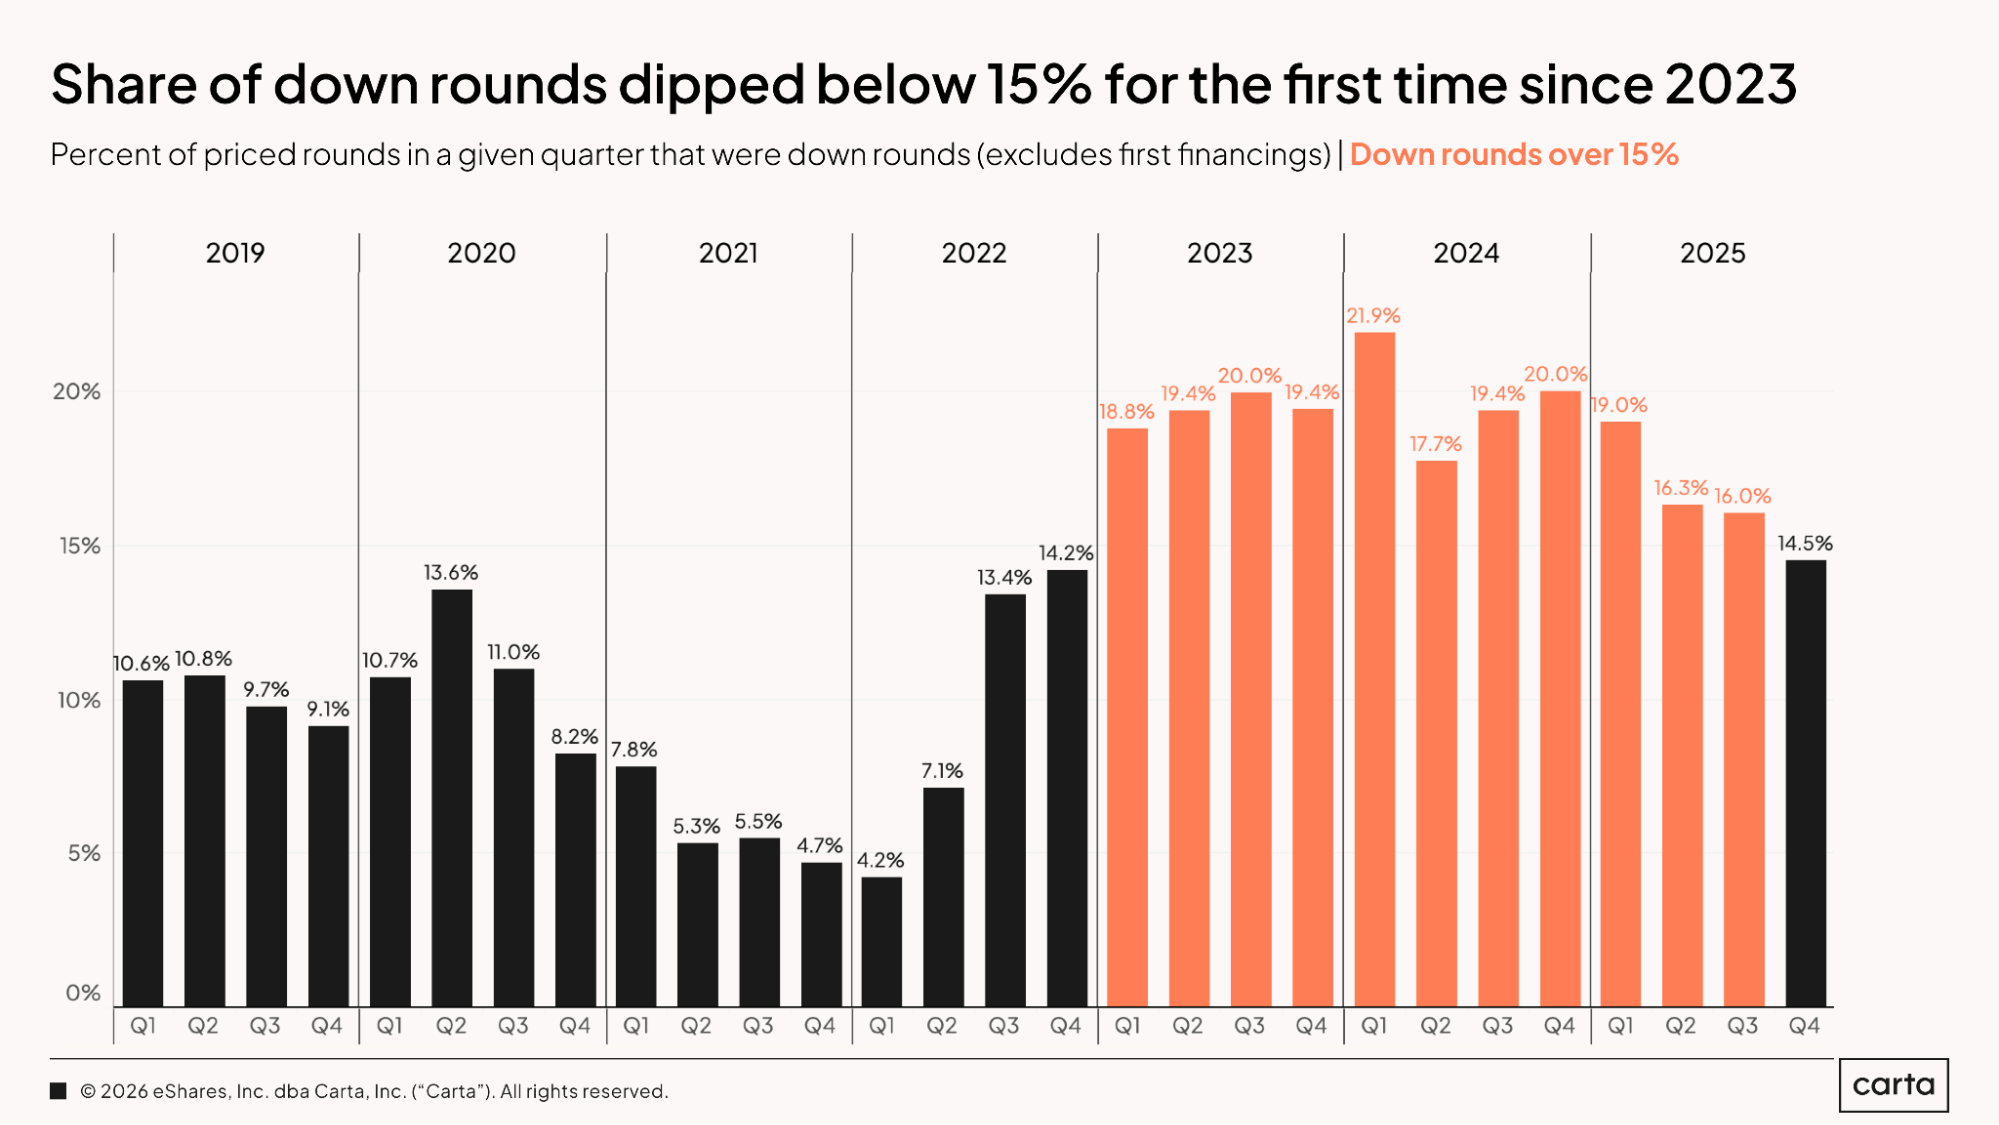
The rate of down rounds continued to fall over the course of 2025, a signal that the venture market is moving past some of the worst effects caused by the widespread reset in tech valuations that began taking place in the back half of 2022. Some 14.5% of all rounds raised in Q4 2025 came at a lower valuation than the startup’s previous funding round, the lowest figure in any of the past 12 quarters. On a historical basis, however, the down-round percentage remains relatively high: That 14.5% figure from Q4 was still higher than every single quarter from 2019 through 2022.
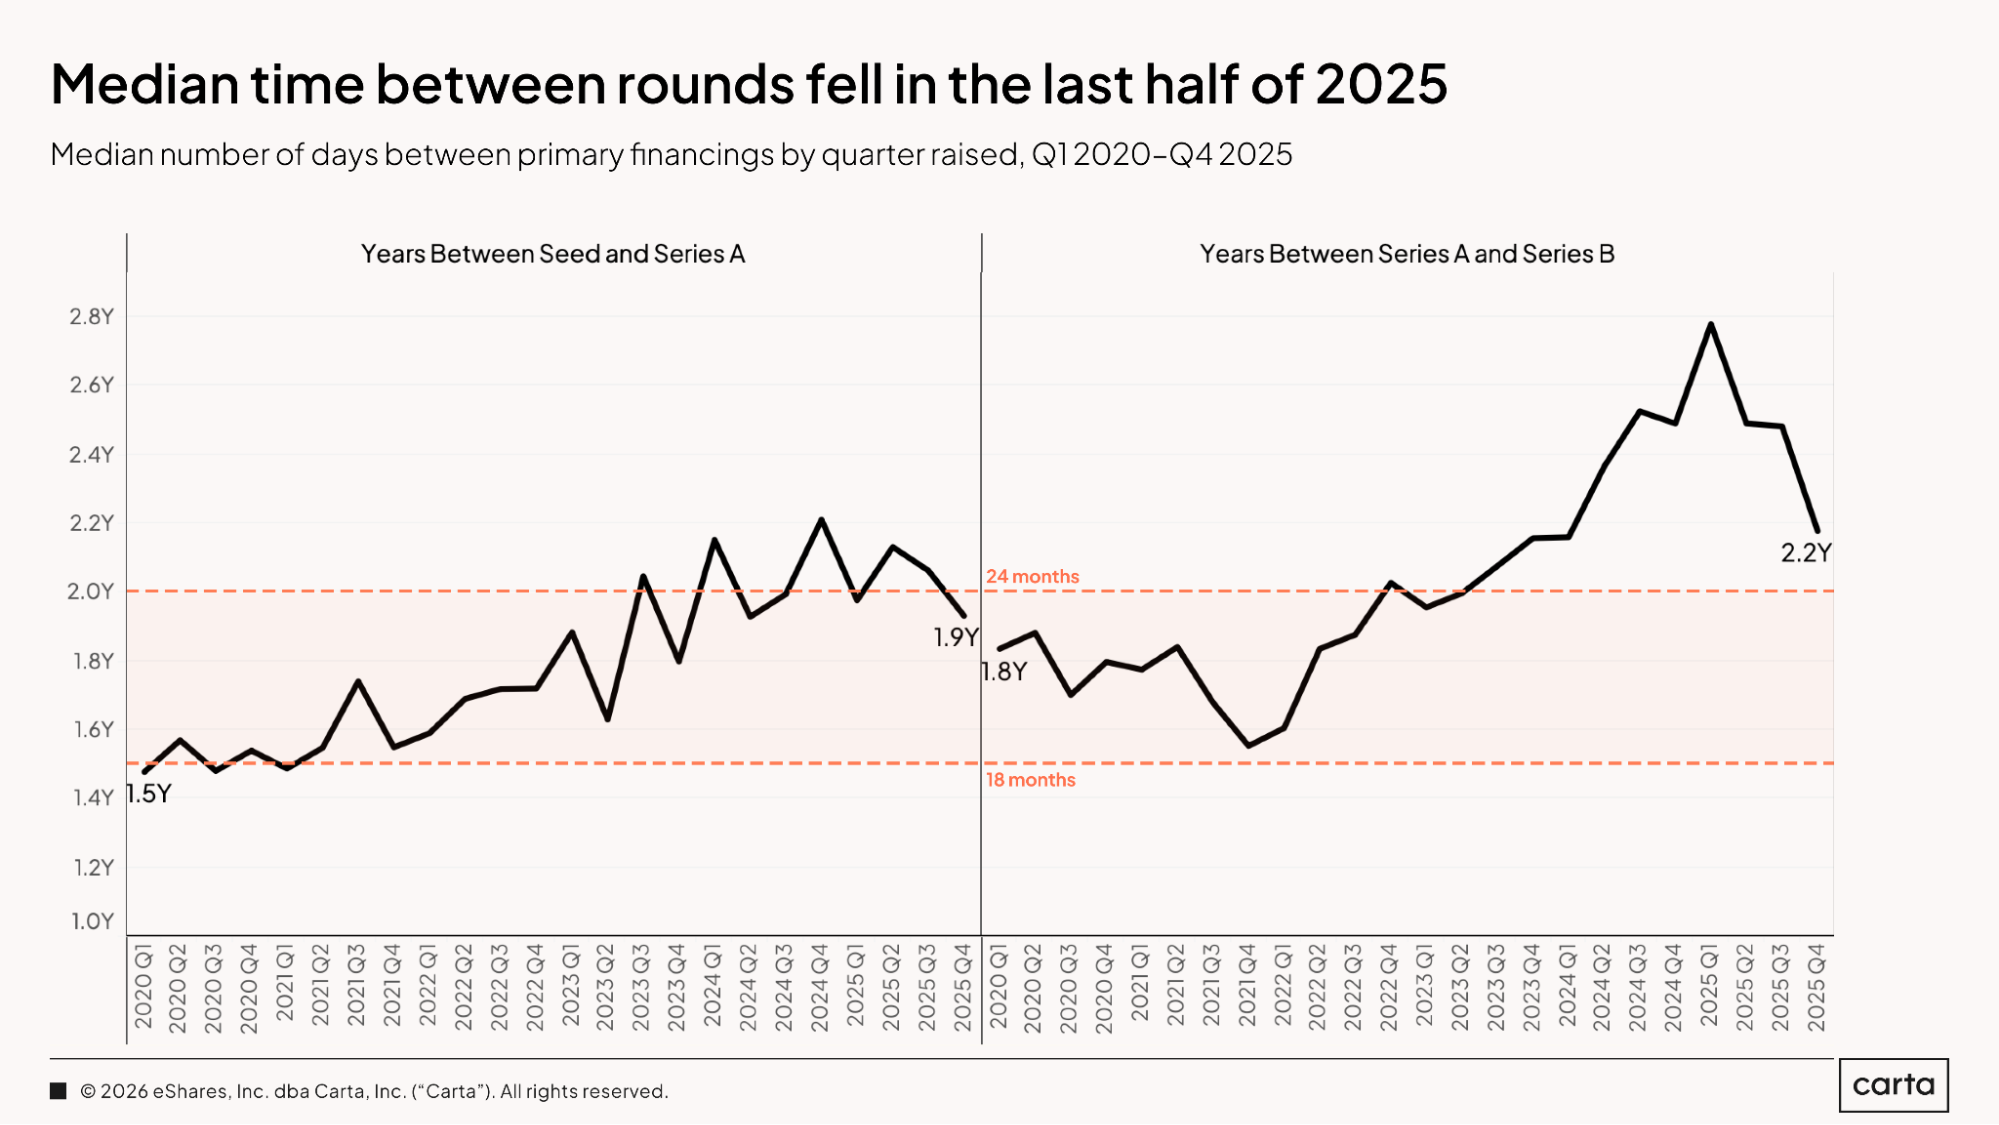
For startups raising both Series A and Series B rounds, the median time between priced funding events began to fall in the second half of 2025. This is a reversal from the past few years, which saw the median time between rounds rise steadily at both these stages. In Q4 2025, the median time between a seed and Series A round reached 1.9 years, compared to 1.5 years back in Q1 2020. The median interval in Q4 between a Series A and Series B, meanwhile, was 2.2 years, compared to 1.8 years in Q1 2020.
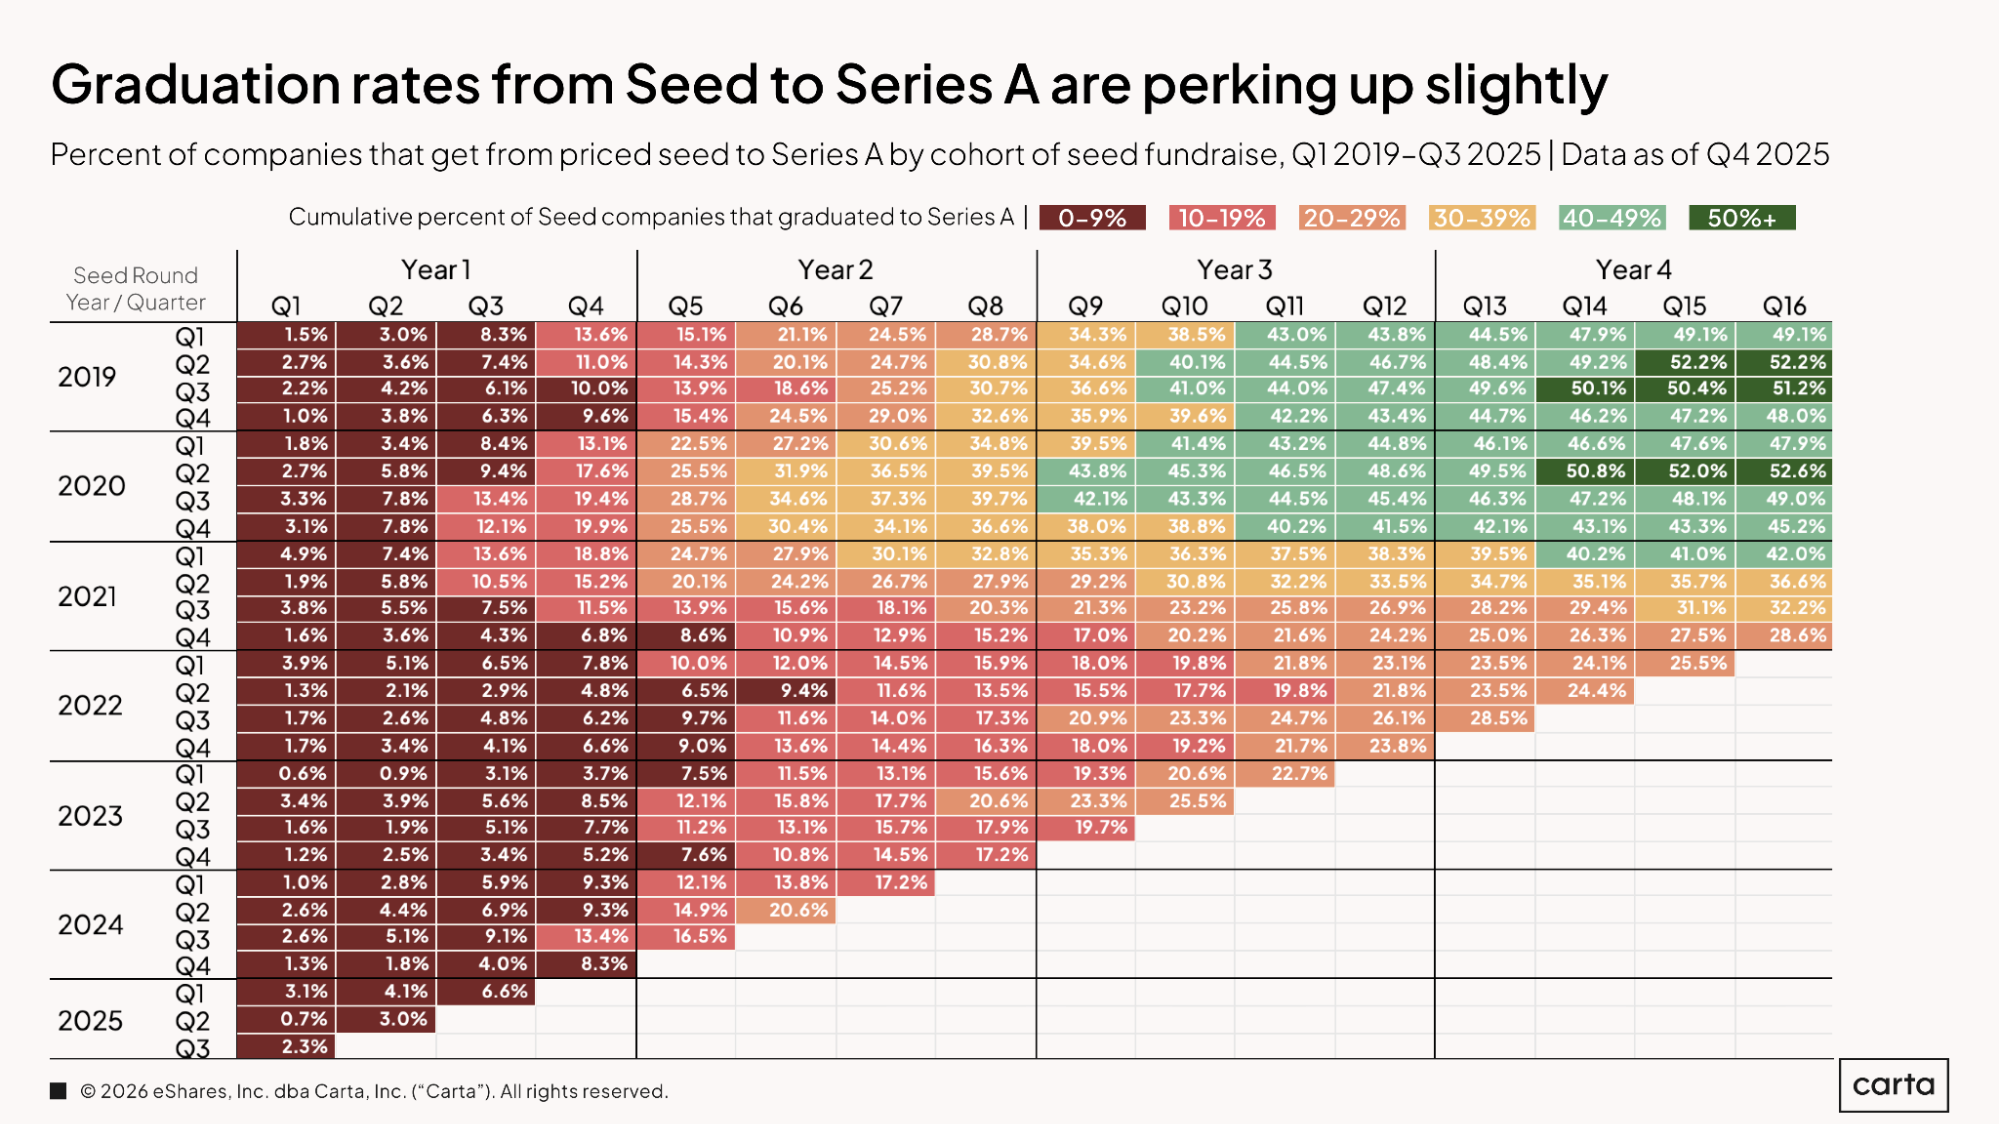
As typical fundraising timelines shorten, the percentage of startups that are proceeding quickly from a seed round to a Series A is on the rise. About 20.6% of startups that raised a seed round in Q2 2024 went on to close a Series A within the next six quarters, the highest rate since Q2 2021, during the heat of the recent venture boom. Among startups that raised a seed round in Q2 2022, for instance, just 9.6% of startups closed a Series A within six quarters. And 16.5% of startups that raised seed funding in Q3 2024 went on to raise a Series A round within the next five quarters, which is again the highest rate since Q2 2021.
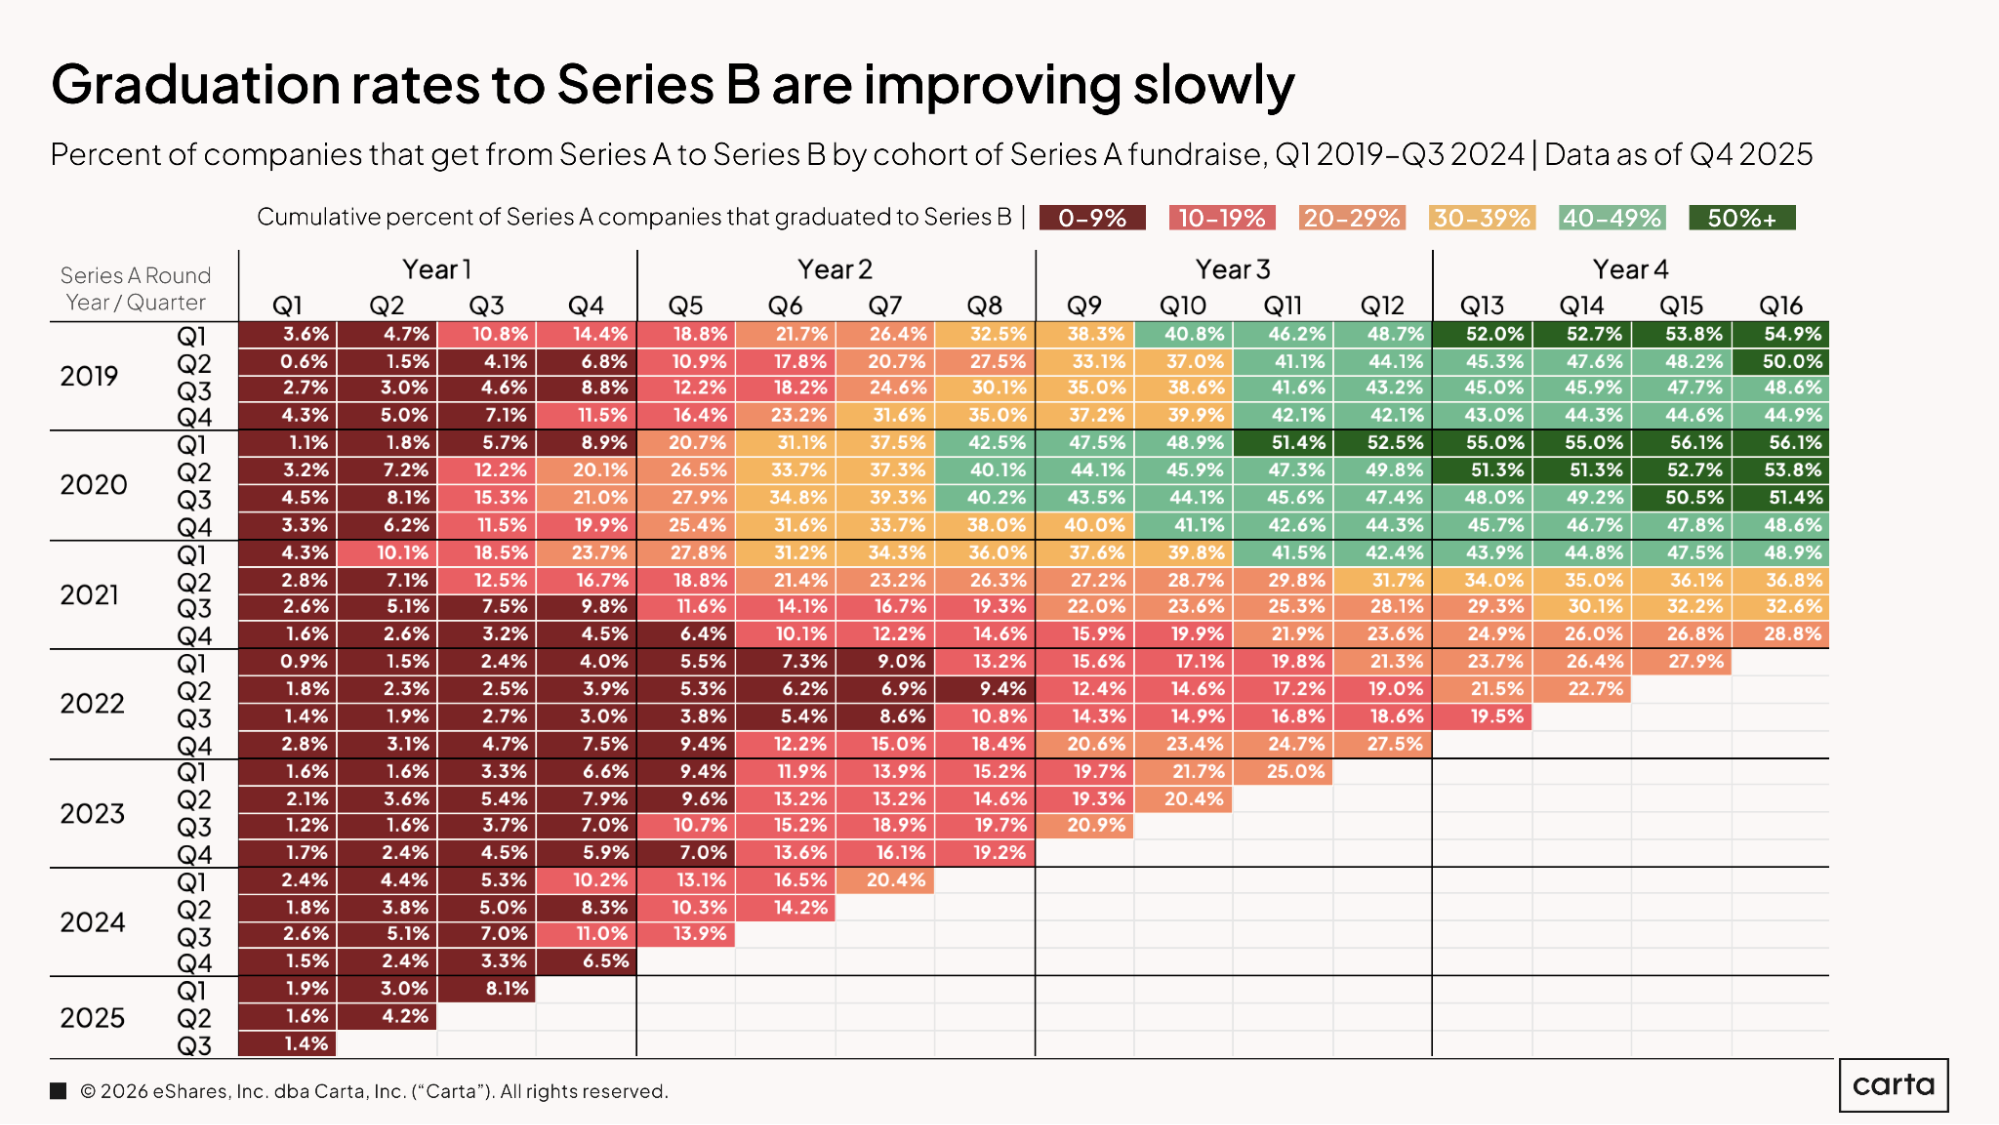
Graduation rates are also beginning to rebound among startups moving from their Series A round to a Series B. For instance, 27.5% of startups that closed a Series A in Q4 2022 had raised a Series B within 12 quarters, a jump from 18.6% of startups that had raised a Series A the previous quarter, in Q3 2022. More recently, 20.4% of startups that raised a Series A in Q1 2024 have already moved on to raise a Series B. Among startups that raised a Series A back in mid-2022, less than 10% had moved on to a Series B so quickly.
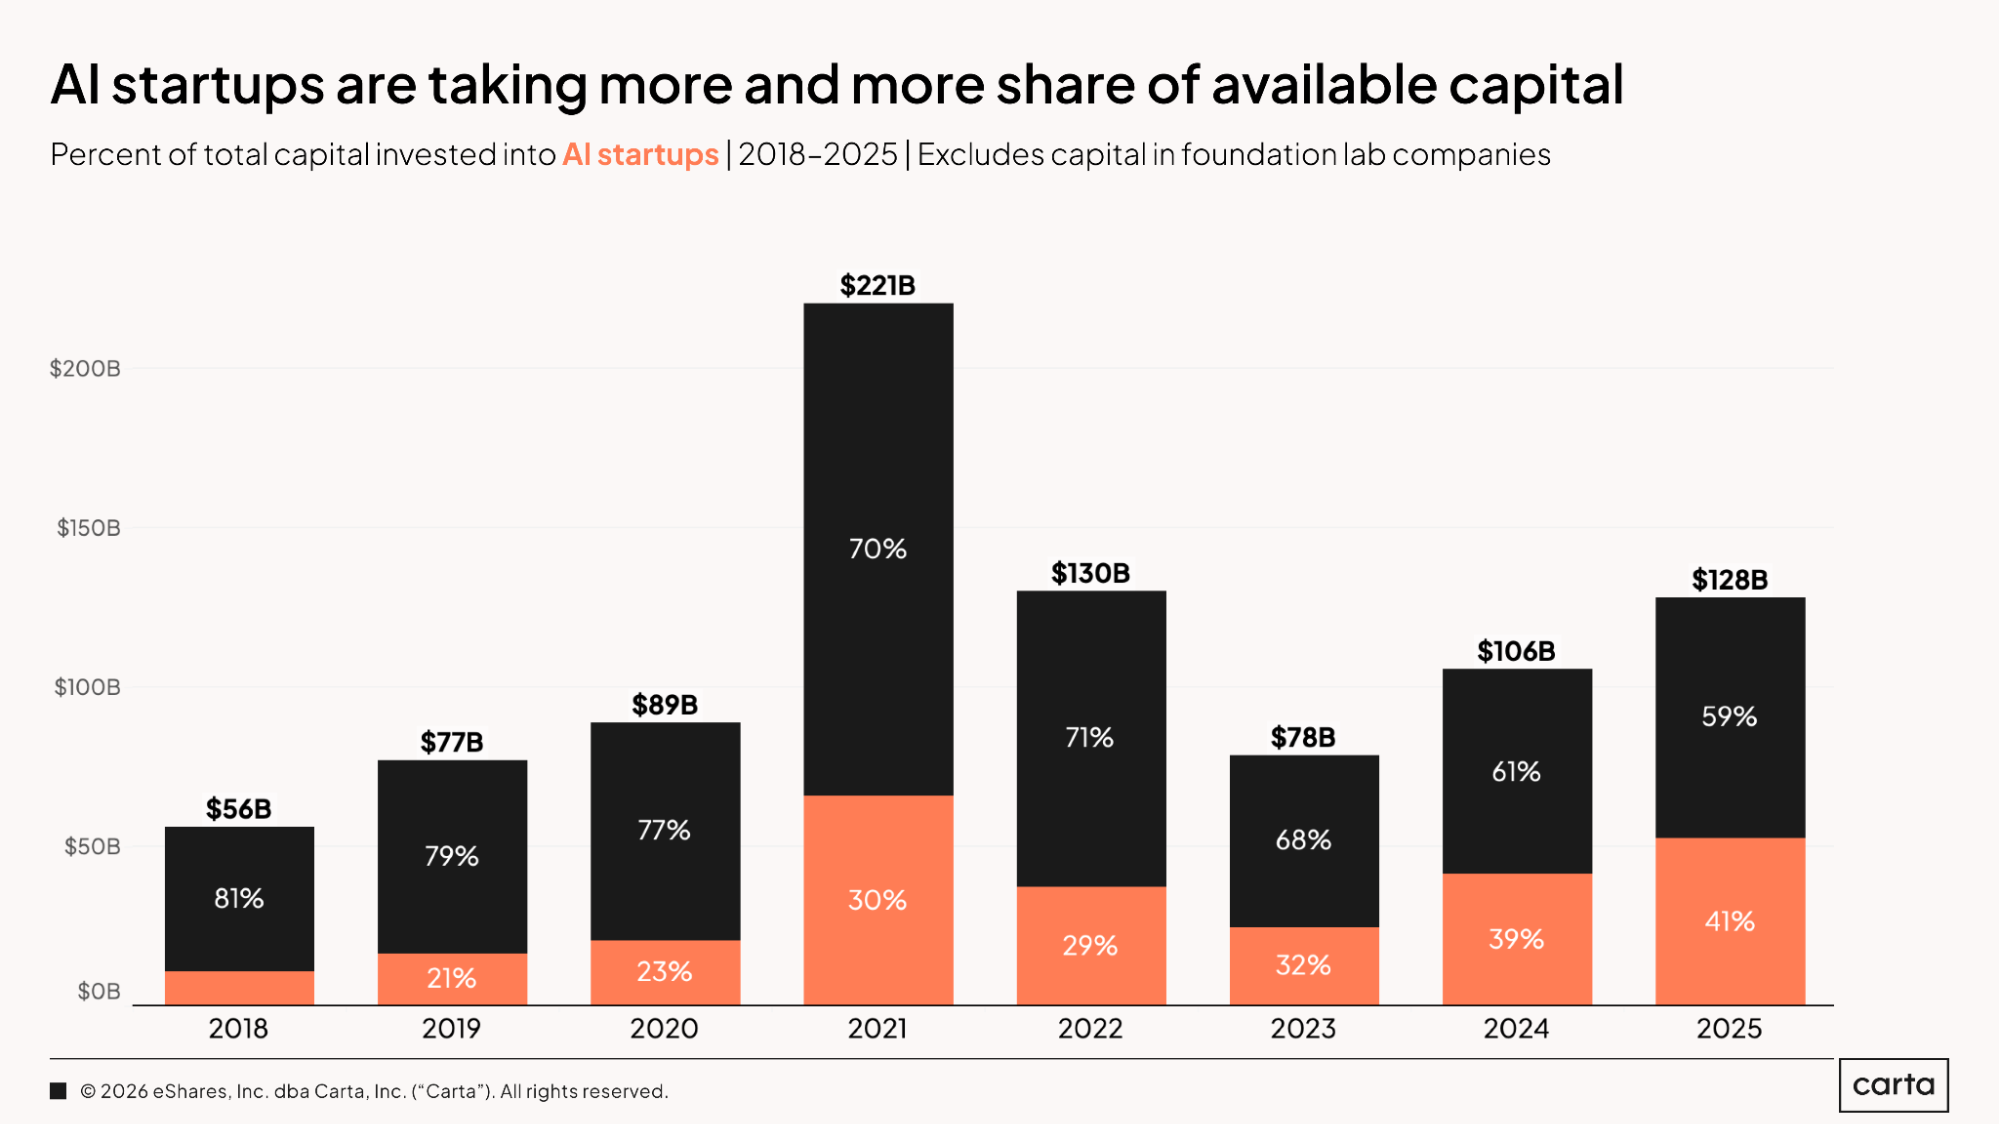
AI startups were responsible for 41% of the $128 billion in total capital raised by companies on Carta during 2025, the highest annual proportion on record. This shift in the fundraising market is being driven by changes on both sides of the negotiating table: Venture capitalists are increasingly eager to back AI startups that they believe could one day deliver exponential returns, and startups are increasingly eager to incorporate new AI tools and systems into their business models.
Methodology
Carta helps over 2,500 venture firms administer more than $150 billion in capital. We're setting a new standard in fund administration by sharing insights from our unmatched dataset about the private markets and venture ecosystem to help investors and limited partners make informed decisions and understand market conditions.
Overview
This study uses an aggregated and anonymized sample of Carta fund customer data. Funds that have contractually requested that we not use their data in anonymized and aggregated studies are not included in this analysis.
We use data through the end of Q4 2025. Historical data may change in future studies because there is typically an administrative lag between the time an event took place and when it is recorded in Carta. In addition, new funds signing up for Carta’s services will increase historical data available for the report.
Fund details
This report only includes funds domiciled in the United States. All funds must have reliable performance data dating back to fund inception and/or when they joined the Carta platform. Included funds are direct investors into startups and do not pursue fund of funds or other strategies. Only funds in vintage years between 2017 and 2025 were included. Funds must have at least $1 million in AUM to be included.
We define vintage year as the year in which the first cost basis (either conversion or new investment) for a fund occurred.
Performance over time
In charts that use the quarters since vintage began framing, we limited the analysis to the most recent quarter in which all funds in a given vintage year had valid performance data. As such, these figures may not exactly match the performance data displayed in charts without a similar time-series framing.
Financings
Financings include equity deals raised in USD by U.S.-based corporations. The financing “series” (e.g., Series A) is taken from the share class name in their applicable certificate or articles of incorporation. Financing rounds that don’t follow this standard are not included in any data shown by series but are included in data not shown by series. Primary rounds are defined as the first equity round within a series. Bridge rounds are defined as any round raised after the first round in a given series.


DISCLOSURE: This communication is on behalf of eShares, Inc. dba Carta, Inc. ("Carta"). This communication is for informational purposes only, and contains general information only. Carta is not, by means of this communication, rendering accounting, business, financial, investment, legal, tax, or other professional advice or services. This publication is not a substitute for such professional advice or services nor should it be used as a basis for any decision or action that may affect your business or interests. Before making any decision or taking any action that may affect your business or interests, you should consult a qualified professional advisor. This communication is not intended as a recommendation, offer or solicitation for the purchase or sale of any security. Carta does not assume any liability for reliance on the information provided herein. ©2026 Carta. All rights reserved. Reproduction prohibited.