- Total value to paid-in capital (TVPI) in private equity and venture capital
- What is total value to paid-in capital?
- Realized vs. unrealized investments
- Paid-in vs. committed capital
- How to calculate TVPI
- TVPI calculation example
- Net TVPI vs. gross TVPI
- How to interpret TVPI
- What is a good TVPI?
- TVPI and the J-curve
- TVPI vs. other fund performance metrics
- TVPI vs. IRR
- TVPI vs. MOIC
- TVPI vs. RVPI
- What TVPI can and can't tell you
- Putting TVPI to work for your LPs
What is total value to paid-in capital?
Total value to paid-in capital (TVPI) is a performance multiple used in private equity and venture capital to measure a fund’s total performance. It equals a fund's realized distributions plus the residual value of its remaining holdings, divided by paid-in capital. Paid-in capital is what limited partners (LP) have actually contributed into the fund, as opposed to committed capital they have pledged but not yet been called for.
Fund managers use TVPI to report performance to their LPs because it combines realized returns with unrealized returns in a single number, giving investors a snapshot of how a fund is doing at any point in time. LPs rely on this number to gauge progress, especially before a fund has made many exits.
When an investor talks about the multiple on a given fund or investment, they're either talking about TVPI, distributions to paid-in capital (DPI), or multiple on invested capital (MOIC). During the fund's life, TVPI is the most relevant of these three investment performance metrics. After a fund's lifecycle is over and it liquidates all remaining investments, TVPI is no longer useful because it will be equal to DPI.
Realized vs. unrealized investments
The "total value" in TVPI is the sum of both realized investments and the residual value of the fund's unrealized investments. In other words, total value is the current value of the fund's existing holdings plus any distributions the fund already made to investors.
Realized investments are capital that has already been returned to the fund's LPs in the form of fund distributions. These distributions could result from interest or dividends on fund investments, but the bulk of private fund distributions usually come from liquidating the fund's position in one or more of its portfolio companies. This can occur through an acquisition or initial public offering (IPO) of the portfolio company, or through a fund's sale of portfolio company equity on the secondary market.
Unrealized investments are investments that the fund still holds. A fund must calculate the unrealized value of these investments, including any unrealized gains or losses, according to its valuation policy.
→ Learn more about portfolio management
Paid-in vs. committed capital
Paid-in capital is the amount investors have actually transferred into the fund in response to capital calls.
Committed capital is the full amount they have promised to contribute over the fund's life.
Using committed capital as the denominator would understate the multiple early on, when only a fraction of commitments have been called. TVPI always uses paid-in capital so the ratio reflects money that has actually been put to work.

How to calculate TVPI
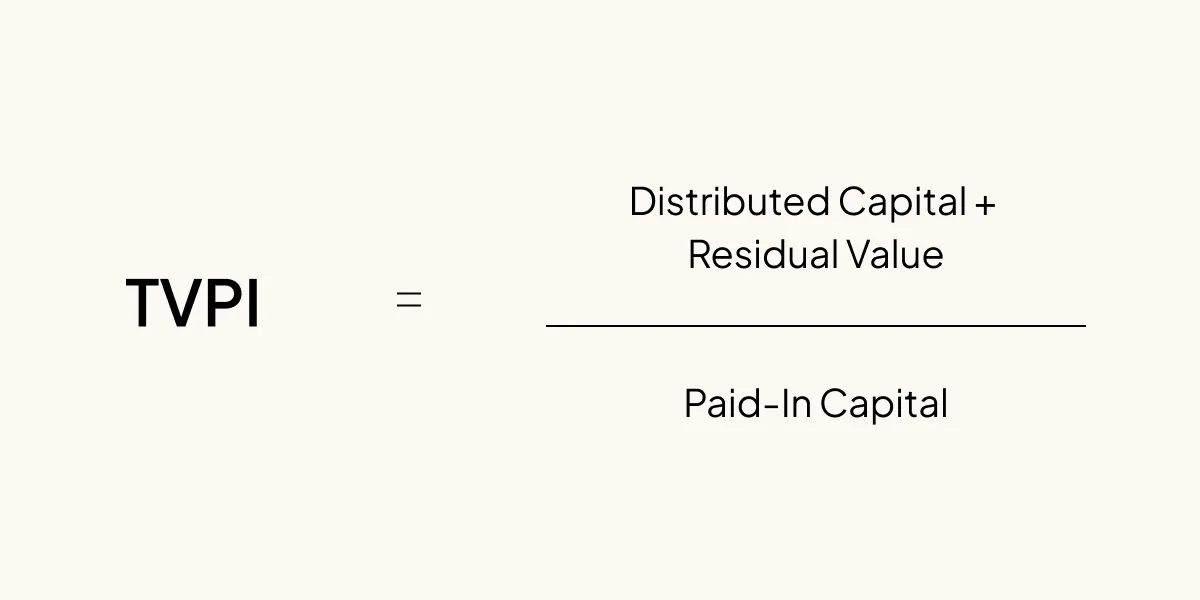
The TVPI formula is relatively simple: Add the total value of all distributions (realized investments) and the fund's residual value (unrealized investments) and divide by the total capital that investors have paid into the fund thus far (including any reinvested capital):
TVPI = (Distributions + Residual Value) ÷ Paid-In Capital
TVPI calculation example
Consider a fund with $100 million in paid-in capital. It has distributed $60 million back to its LPs and still holds investments with a residual value of $90 million.
Its total value is $150 million: the $60 million already distributed plus the $90 million in residual value. Dividing total value by paid-in capital gives a TVPI of 1.5x.
Component | Amount |
Distributions (realized) | $60M |
Residual value (unrealized) | $90M |
Total value | $150M |
Paid-in capital | $100M |
TVPI | 1.5x |
In this case, the fund has generated $1.50 in total value for every dollar paid in, but only $0.60 of that has been distributed as cash so far.
Net TVPI vs. gross TVPI
When calculating TVPI, it's assumed the fund's total value in the numerator is calculated after management fees and carried interest, making net TVPI the default. You can calculate gross TVPI by leaving fees and carry in the numerator. But LPs and prospective investors care more about net TVPI.
Because TVPI is only as reliable as the accounting behind it, many fund chief financial officers (CFOs) rely on their fund administrator to keep the underlying numbers clean:
"Carta frees a lot of my bandwidth. I trust the system to accurately reflect accounting data, and our team can track necessary activity, so I can do more on the strategy side to help the firm grow."
Max Altmark, Chief Financial Officer and Chief Compliance Officer, FVLCRUM Funds
How to interpret TVPI
Any TVPI value above 1.0 means the fund has returned more than investors put in, net of fees and carry. For example, a TVPI of 1.75 means that the fund's investments returned $1.75 for every dollar invested. Below 1.0, the fund has not yet broken even.
What is a good TVPI?
What qualifies as a good TVPI depends on your fund's age, investment strategy, and vintage year, so no single benchmark applies across the board. A multiple above 1.0 signals a positive return on paper, but expectations rise as a fund matures.
Carta's Q2 2026 VC Fund Performance report shows TVPI continues to climb for top-performing funds from the late 2010s, even as IRR figures trend gradually downward—a divergence that reflects longer-than-expected hold timelines.
What counts as good rises with a fund's age. Early funds often sit below 1.0 while they deploy capital, and more mature vintages should show more. As a concrete anchor, among funds between $1M and $10M in the 2017 vintage, median net TVPI reached 2.03x as of Q2 2026.
TVPI is a distribution, not a single number. According to Carta's Q2 2026 report, for the 2017 vintage, the 90th-percentile IRR sits at 25.7% as of Q2 2026—still strong, but down from 28.7% two years prior, as longer hold timelines weigh on time-sensitive returns.
Read TVPI alongside DPI, because a high multiple can mask limited cash returned. Unrealized value still dominates in most funds. For the 2017 vintage, median DPI sits at just 0.37x as of Q2 2026—meaning the typical fund is still returning less than half of paid-in capital. For 2018 funds, it's 0.15x. For 2019 funds, 0.04x.
TVPI and the J-curve
In a fund's early years, TVPI often sits below the amount paid in. This pattern is sometimes called the J-curve.
At the start, management fees reduce the fund's net asset value (NAV), and young investments have not had time to appreciate. So the multiple can look disappointing even when everything is going according to plan.
Over time, portfolio companies mature and the fund begins to exit positions. Distributed capital flows back to LPs, and residual values reflect growth in remaining holdings. TVPI tends to rise as these events happen.
TVPI is a snapshot, not a permanent score. It shifts whenever valuations are updated or distributions go out. Real-time platforms let you watch the metric evolve instead of waiting for quarter-end spreadsheets.
TVPI vs. other fund performance metrics
TVPI is one of several metrics LPs and general partners (GPs) use to evaluate fund performance. Each metric answers a different question. The subsections below compare TVPI to the most common alternatives, and the table summarizes when to use each.
Metric | What it measures | What it ignores | When to use it |
TVPI | Total value (realized + unrealized) vs. paid-in capital | Timing of cash flows | To gauge overall value creation at any point |
DPI | Realized distributions vs. paid-in capital | Unrealized holdings | To see how much cash has actually come back |
RVPI | Unrealized value vs. paid-in capital | Realized distributions | To see what is still held in the portfolio |
MOIC | Total value vs. capital invested into deals | Fund-level fees and timing | To measure deal-level or gross investment returns |
IRR | Time-weighted rate of return | Absolute size of gains | To compare returns on a time-adjusted basis |
TVPI vs. IRR
Unlike internal rate of return (IRR), which uses a discounted cash flow analysis to account for the speed of returns, time is not a variable for TVPI. TVPI gives investors an estimated investment multiple on the total capital paid into the fund, with no adjustment for when those returns arrived.
TVPI vs. MOIC
TVPI is similar to another fund metric: multiple on invested capital (MOIC). But fund managers usually only consider MOIC after the fund's lifecycle has concluded, when TVPI is no longer relevant. Unlike TVPI, MOIC is usually a gross metric rather than its net equivalent, DPI.
TVPI vs. RVPI
Residual value to paid-in capital (RVPI) is an expression of the remaining value of the fund's holdings to the total amount of capital investors have paid in to date. Unlike TVPI, RVPI doesn't account for fund distributions. And because a fund will eventually liquidate all of its investments, RVPI will decline to zero at the end of the fund's life.
What TVPI can and can't tell you
TVPI's chief advantage is simplicity. IRR requires a discounted cash flow model; TVPI is a single ratio built from numbers any fund administrator already tracks. Because it is expressed as a multiple, it is easy to explain to LPs regardless of financial background, including angel investors who find a 2.0x multiple more intuitive than an annualized return. Using paid-in capital as a consistent denominator also allows comparisons across funds of similar age and investment strategy, alongside metrics like public market equivalent (PME).
Its main limitation is that it ignores the time value of money. Two funds can post identical TVPIs while one deployed capital far more efficiently.
TVPI also depends on residual values, which are estimated marks that can be optimistic or outdated. Regular portfolio monitoring helps catch those discrepancies before they reach an LP report.
Finally, comparing TVPI across different vintages or strategies can be misleading because market conditions and hold periods vary. Carta's analysis shows the same three-year TVPI can mean very different things depending on vintage year. Fund size shifts the benchmarks further.

Putting TVPI to work for your LPs
During a fund's active life, unrealized holdings make up most of the return, which is when TVPI is most informative. Pair it with DPI and IRR so LPs can see both paper gains and cash actually returned. As distributions accumulate and the fund matures, TVPI and DPI converge, and DPI takes precedence.
Accurate reporting starts with clean, current data. Carta's fund administration software gives GPs and CFOs real-time net and gross returns, IRR, and performance multiples, so you can answer LP questions without rebuilding spreadsheets each quarter.
Request a demo to see how Carta keeps your TVPI and other performance metrics investor-ready.


DISCLOSURE: This communication is on behalf of eShares, Inc. dba Carta, Inc. ("Carta"). This communication is for informational purposes only, and contains general information only. Carta is not, by means of this communication, rendering accounting, business, financial, investment, legal, tax, or other professional advice or services. This publication is not a substitute for such professional advice or services nor should it be used as a basis for any decision or action that may affect your business or interests. Before making any decision or taking any action that may affect your business or interests, you should consult a qualified professional advisor. This communication is not intended as a recommendation, offer or solicitation for the purchase or sale of any security. Carta does not assume any liability for reliance on the information provided herein. ©2026 Carta. All rights reserved. Reproduction prohibited.