Venture capital is in a slowdown, but not a freefall. For the past two quarters, the number of rounds and the amount of cash raised on the Carta platform both declined, deepening the downturn in venture investment. However, the decline in Q2 wasn’t as steep as it was in Q1. Whereas Q1 saw a 27% drop in the number of rounds and a 36% decline in cash from the previous quarter, the Q2 declines were 13% and 29%, respectively. As companies continue to document their second-quarter deals on Carta, revised data will likely show slightly smaller Q2 declines.
While venture activity in the first half of 2022 was slower than it was last year, it’s on pace to exceed annual totals in 2020 and earlier years.
Q2 highlights
-
Series D saw the steepest drop in total cash.Cash going to Series D rounds dropped by 48% from Q1 to Q2, while Series C saw a drop of just 4%.
-
Bridge rounds became more common at later stages. As companies navigate market conditions that remain unfavorable for IPOs and late-stage valuations, bridge rounds became nearly three times as common at Series E and beyond, comprising 22% of rounds in Q2 2022 versus 8% in Q1.
-
Layoffs increased as voluntary employee departures declined. In both May and June, the number of employees who lost their jobs increased over the previous month, while the number of employees who chose to leave their jobs decreased, driving the percentage of employee terminations that were involuntary up to 37% in June.
These trends come as the U.S. stock market posted its worst first six months since 1970, with the tech-heavy NASDAQ composite dropping some 30%. Meanwhile, the Federal Reserve repeatedly raised interest rates to tame inflation, which reached a high of 9.1% in June. The higher cost of capital and decline in consumer spending power generated economic doubts that continue to register in the private markets.
Another quarter of contractions
Percentage of venture capital cash raised by stage
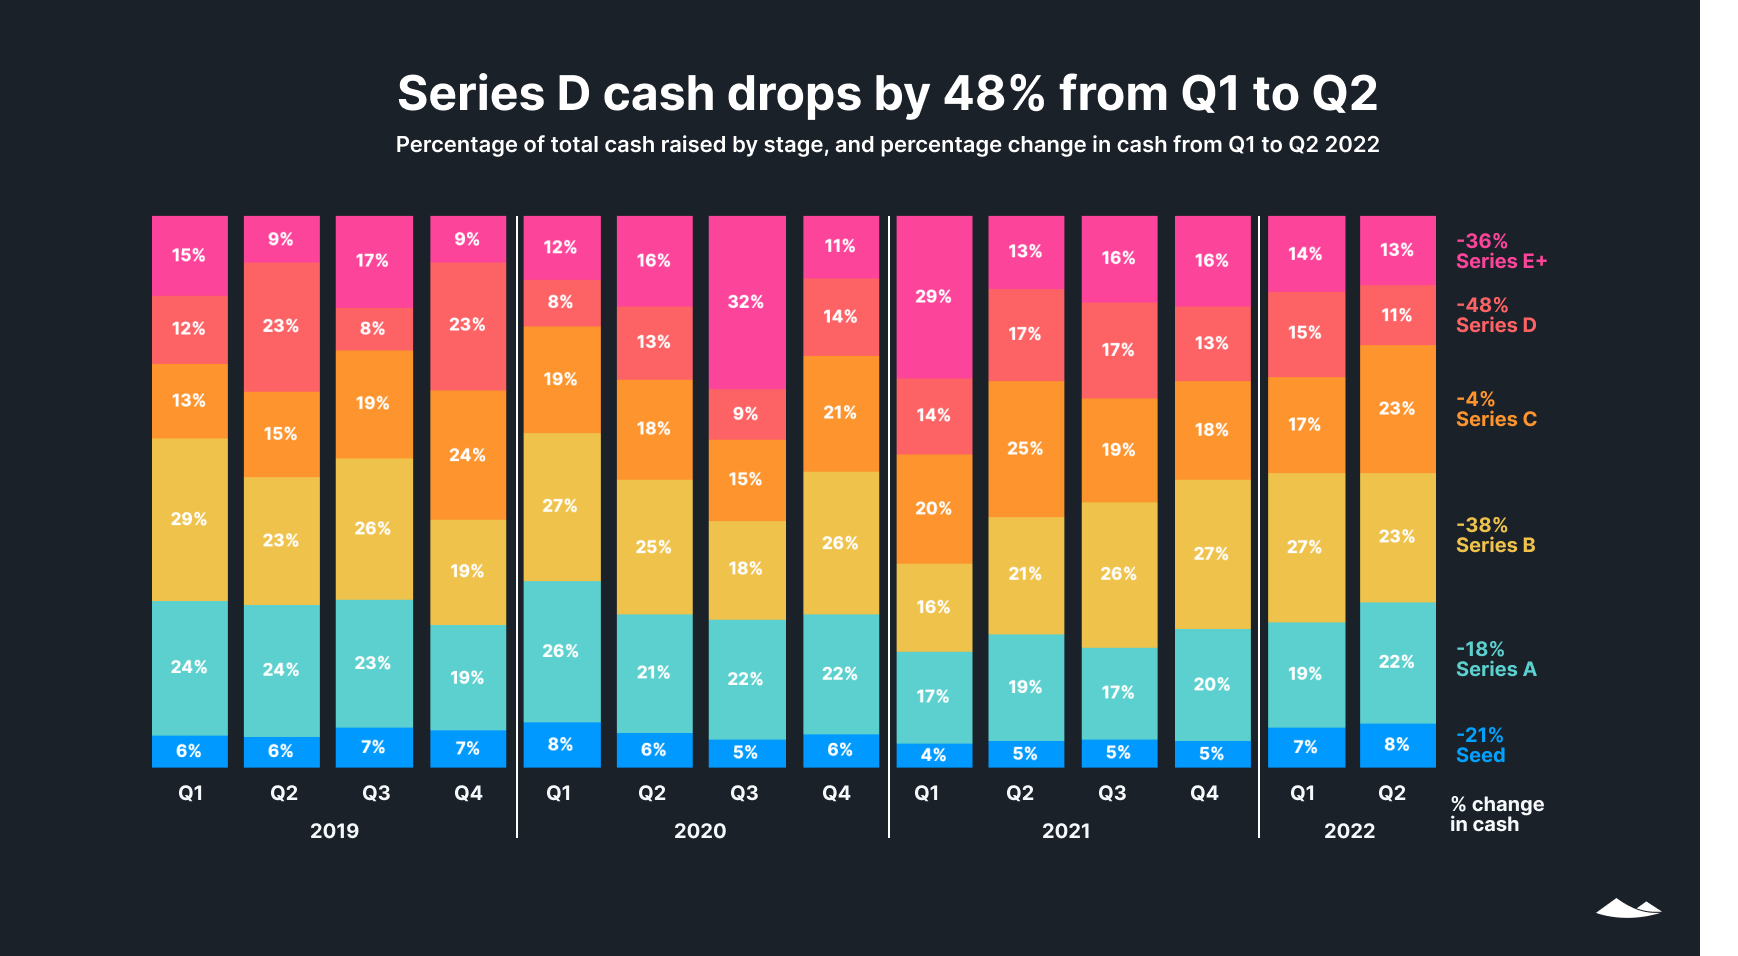
Q1’s relative shift in cash away from later stages continued in Q2, which saw a smaller percentage of cash going to rounds at Series D and above than in any quarter since Q1 2020.
Seed, Series A, and Series C rounds each took larger pieces of a smaller pie in Q2, with the $28B in total cash recorded on Carta for Q2 down by 29% quarter over quarter (QoQ). The number of rounds decreased at every stage except Series C, which posted a QoQ increase of 9% in Q2.
Series C rounds also saw the smallest drop in total cash in Q2, raising just 4% less than in Q1. However, the percentage of cash that went to all late-stage (Series C and beyond) rounds taken together only changed from 46% in Q1 to 47% in Q2.
Venture capital cash raised by industry
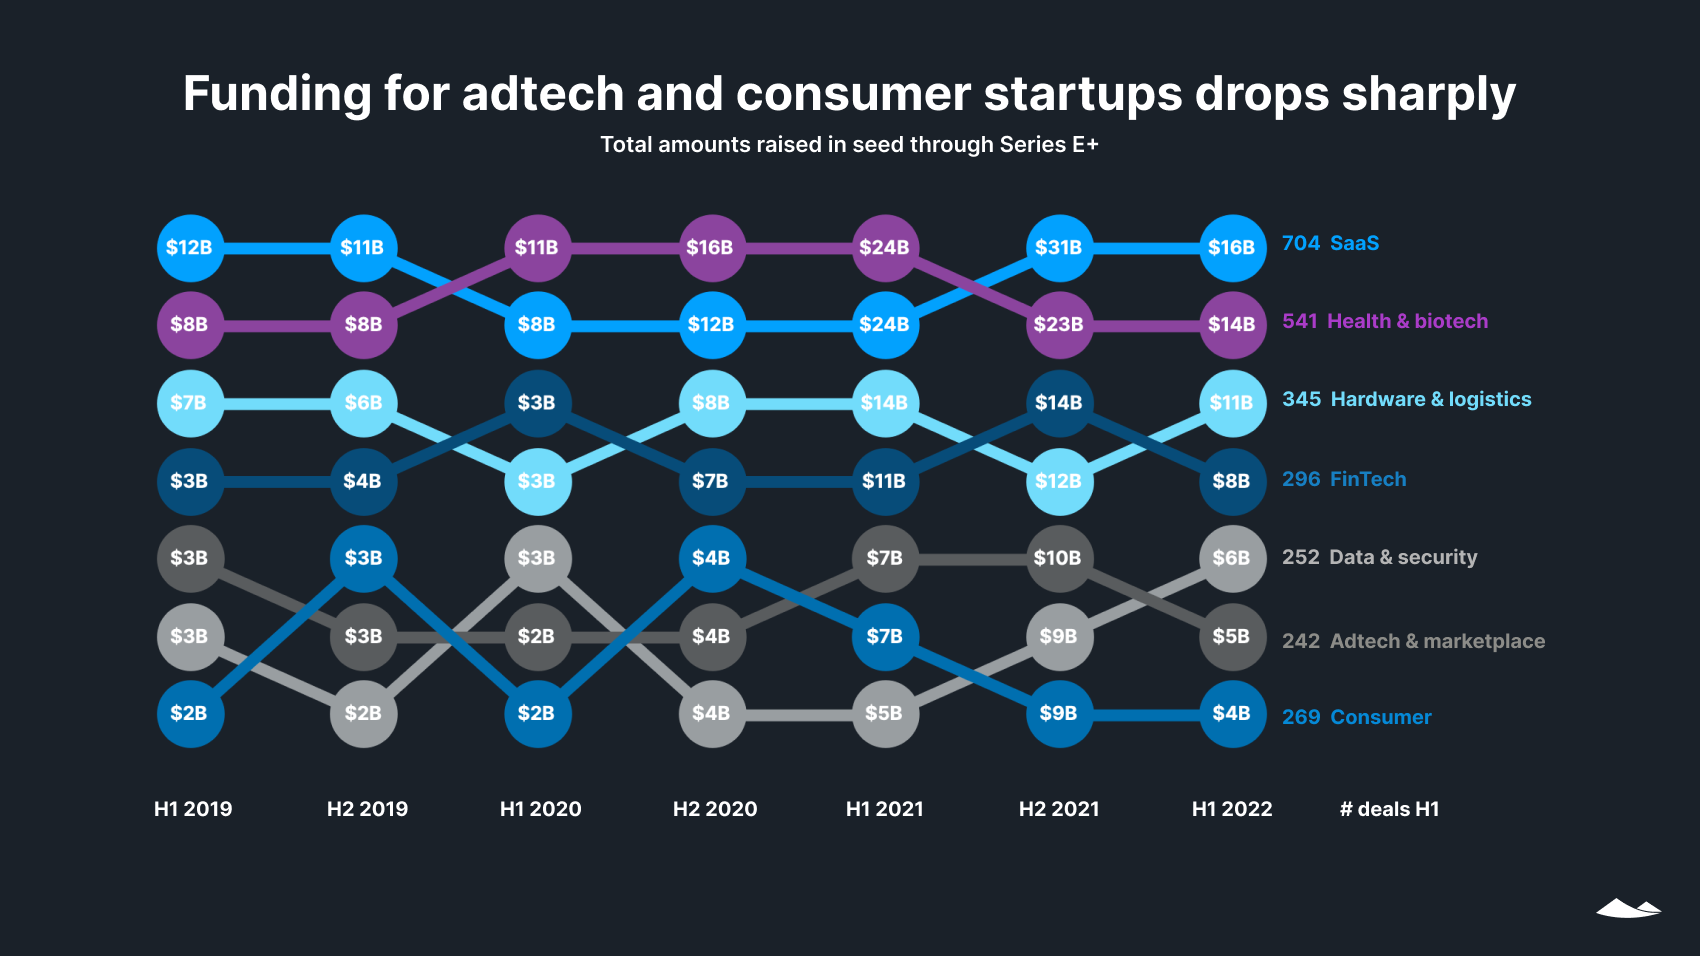
SaaS has outpaced health and biotech in all four quarters since Q3 2021, solidifying its return to pre-pandemic levels of relative funding.
Although every industry saw a drop in total dollars raised in H1 2022 over the previous half, one industry—data and security—was still up slightly on a year-over-year (YoY) basis from $5.49B in H1 2021 to $5.73B in H1 2022. H1’s declines were not large enough to wipe out large H2 2021 increases in cash and rounds for data analytics and cybersecurity, this industry’s two largest segments.
Perhaps due to expectations of dampened household buying power due to inflation or a possible wider economic slowdown, funding for consumer startups has fallen 76% since Q4 2021. Of the $4.3B this sector attracted in the first half of 2022, only $1.2B was in Q2.
Funding for adtech and marketplace startups plummeted in H1 2022 to $4.8B, down from $10.2B in H2 2021, another sign that investors believe last year’s bump in consumer spending might not last.
Hardware and logistics saw the smallest drop in H1, down just 5% from H2 2021 to $11.0B.
Venture capital deals by state
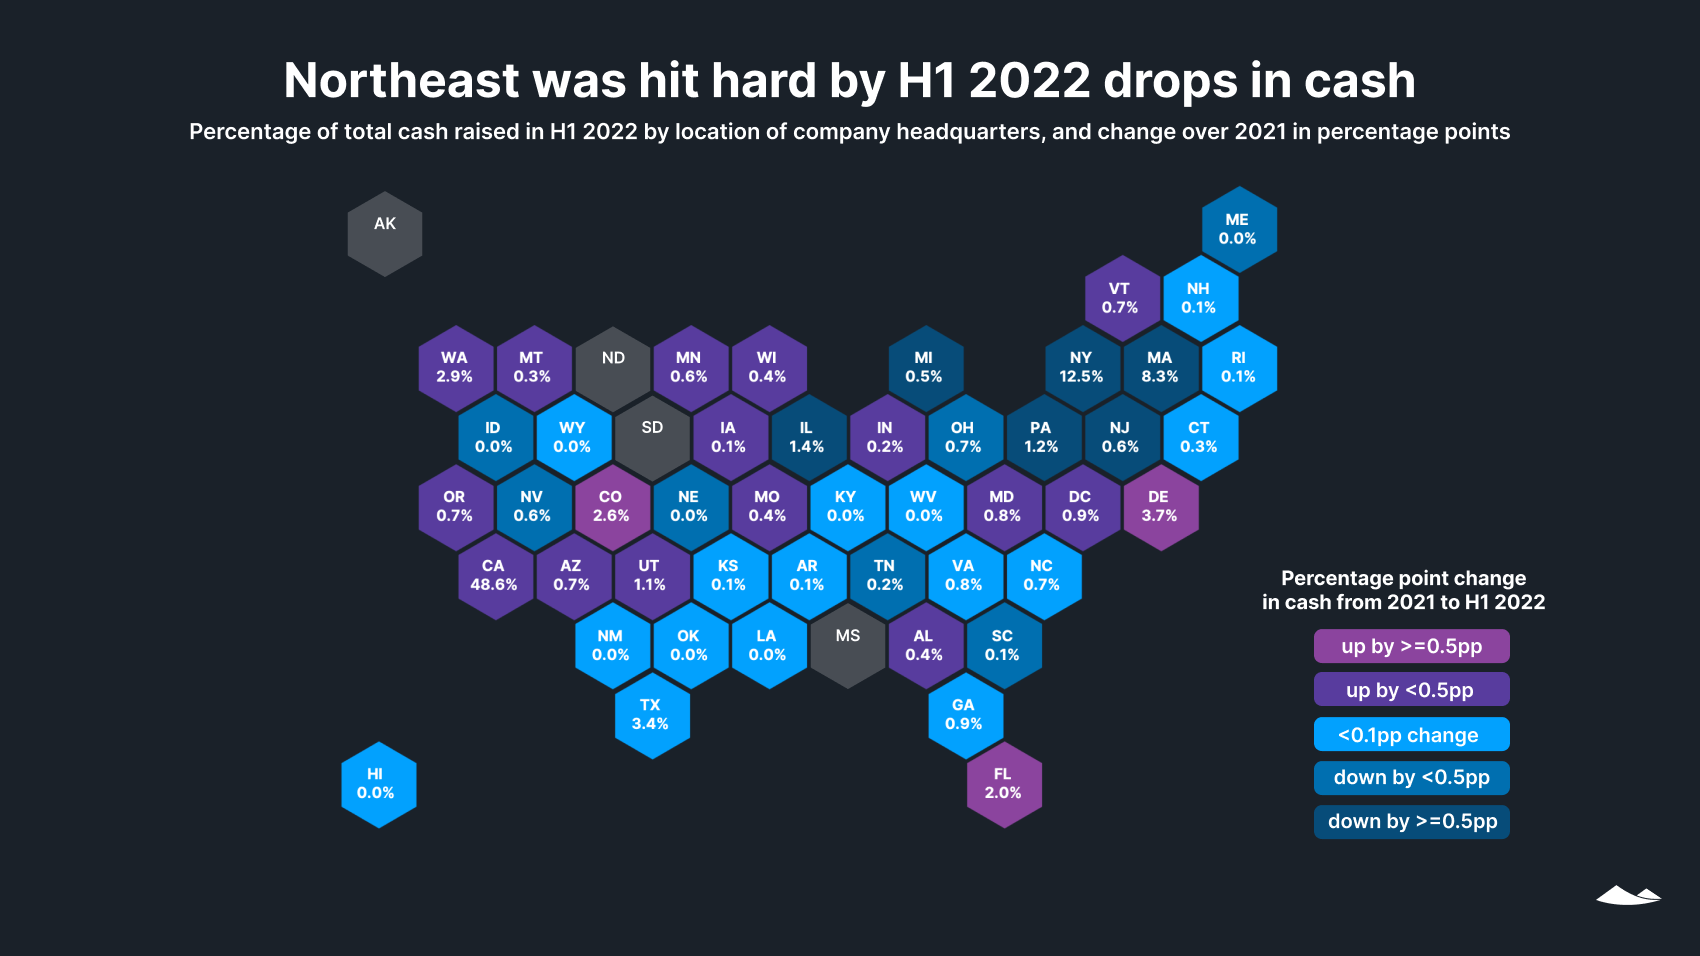
Fundraising levels have declined across the United States from a record-breaking 2021. On an annualized basis (comparing cash raised in 2021 to double the totals for H1 2022) 40 states are down in cash in 2022. Over the first half of 2022, the Northeast and Midwest seem to have fared worse than other regions. New York, Massachusetts, and Michigan each saw a drop of one percentage point in the relative amount of cash that companies in their states received, compared with 2021 totals. Meanwhile, Delaware, Colorado, and Florida—home to burgeoning tech and venture hubs in Boulder and Miami—each saw increases of half a percentage point or more.
No state is on track to be up by $500M or more in all of 2022 compared with 2021, whereas 14 states are down by that amount. Comparing 2022 to 2020, 14 states are on track to be up by $500M or more and only two states are down by that much.
Although markets have shifted, cash is still flowing, buoyed by record amounts of dry powder amassed by VCs.
409A valuations
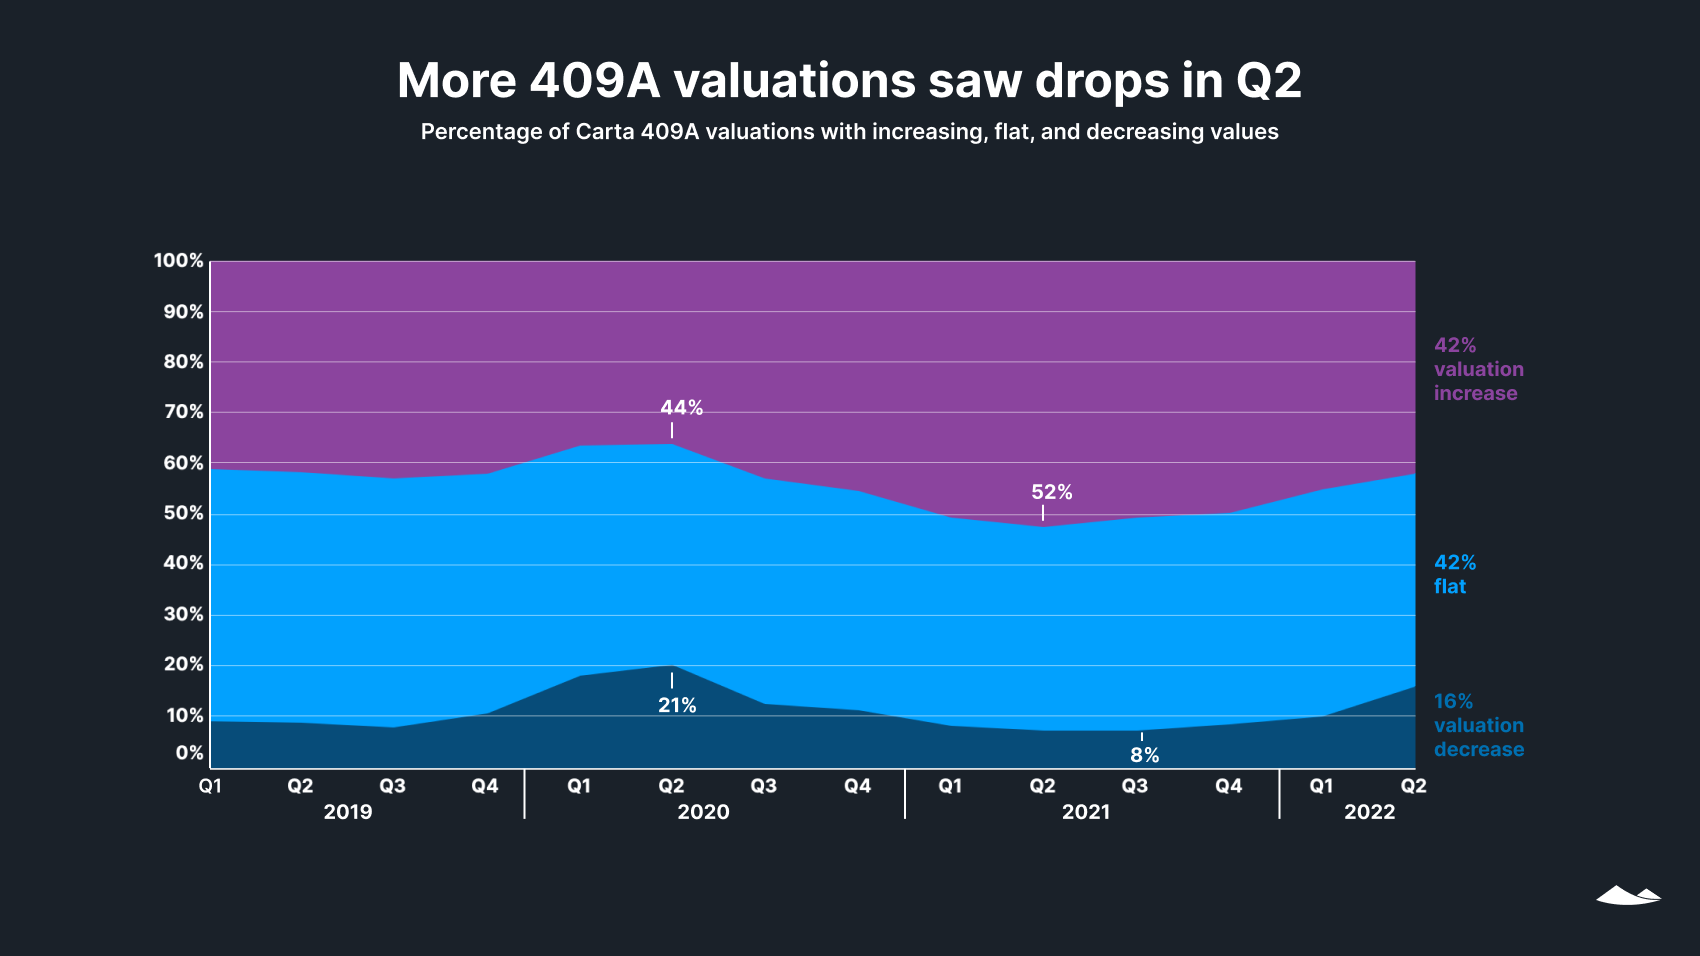
In Q2, 16% of 409A valuations provided by Carta had a valuation decrease, up from 11% in Q1. Among all other quarters in this dataset (which goes back to 2015), only the first two quarters of 2020, at the height of pandemic uncertainty, saw a greater percentage of decreasing valuations than Q2 2022.
Rounds and post-money valuations by stage
Early-stage raises
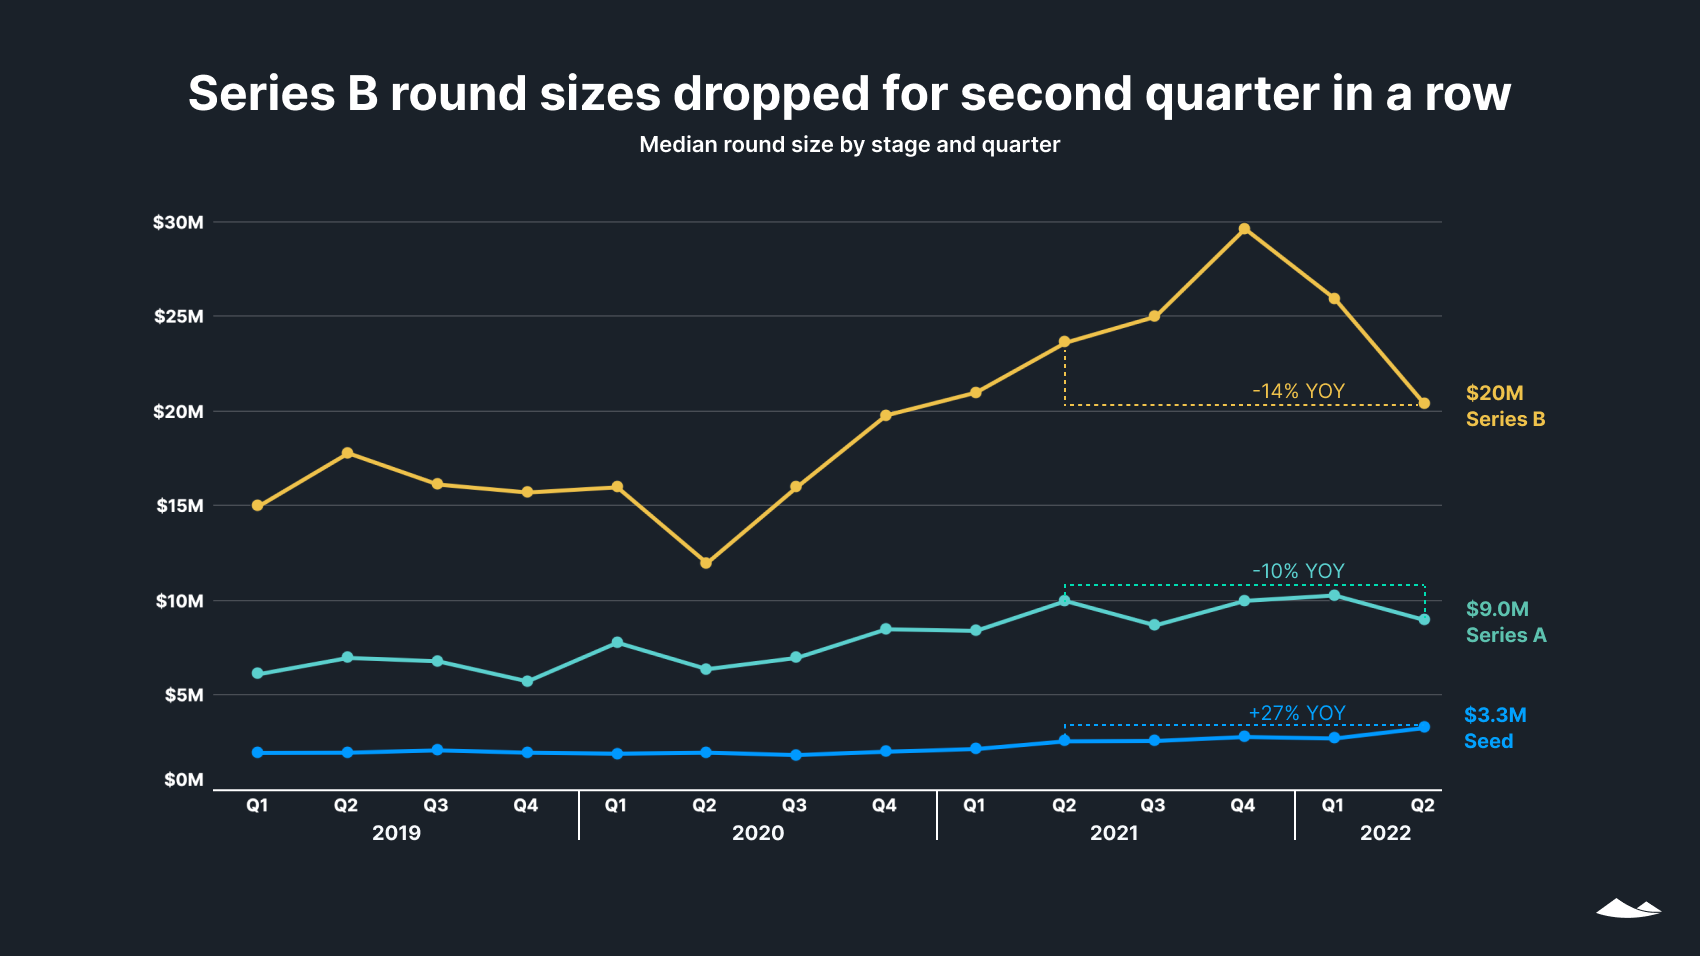
Series B median round sizes declined 21% QoQ in Q2 to $20.4M, after a 12% drop the previous quarter. Still, Series B rounds were slightly larger than in the years prior to 2021.
The median round size for Series A dipped by 13% in Q2, while the median seed round reached $3.3M—up 20% QoQ and 27% YoY. Early-stage rounds have remained more insulated from public market turmoil, a signal that investors remain optimistic about the longer term.
Late-stage raises
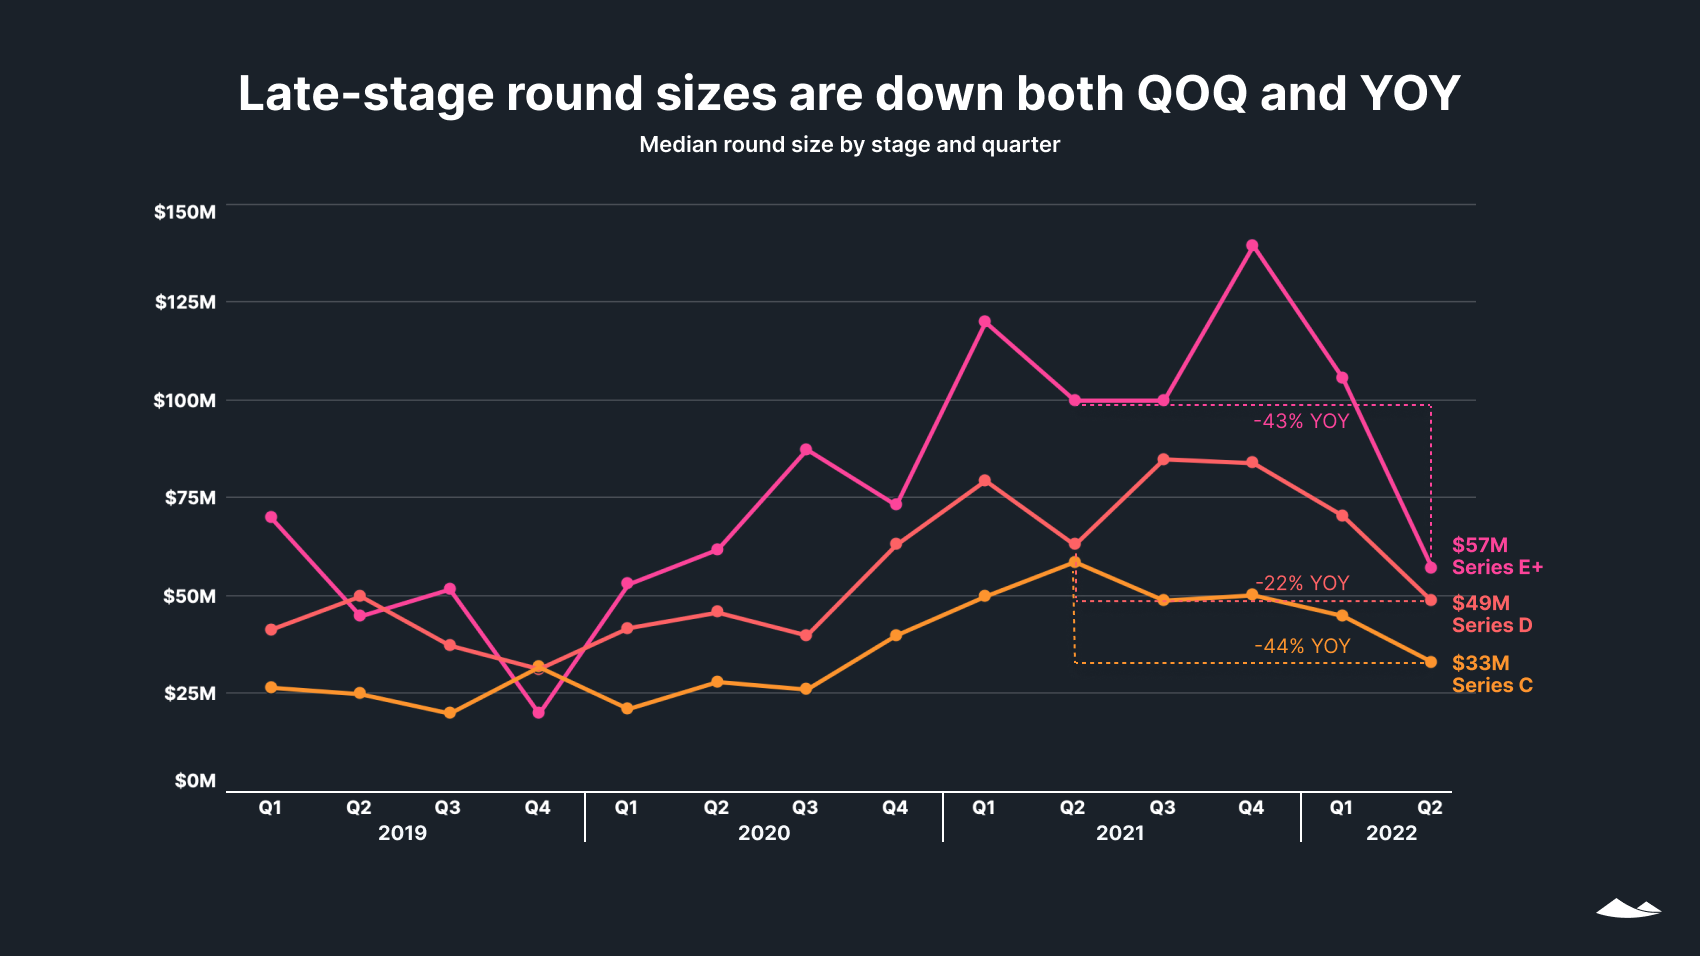
Median round sizes are down at all late stages, both QoQ and YoY.
In the second half of 2021, Series D saw a number of large rounds ($200M+), which have all but disappeared by Q2 2022. In H2 2021, 16% of rounds were $200M or larger, and by Q2 2022 this dropped to 4%. In H2 2021, these larger Series D rounds pushed the mean round size to $127M, nearly 50% higher than the median, as compared with a mean in Q2 2022 of $63M, just under 30% higher than the median.
Round data for later stages is noisier, largely because with fewer companies raising rounds at later stages, the datasets are smaller. Whereas Series C has seen over 100 rounds per quarter since Q4 2020, Series D has seen 40-80 rounds, and Series E+ has seen 30-65. Later-stage rounds also encompass greater diversity in company age, size, and trajectory than earlier-stage rounds.
Early-stage post-money valuations
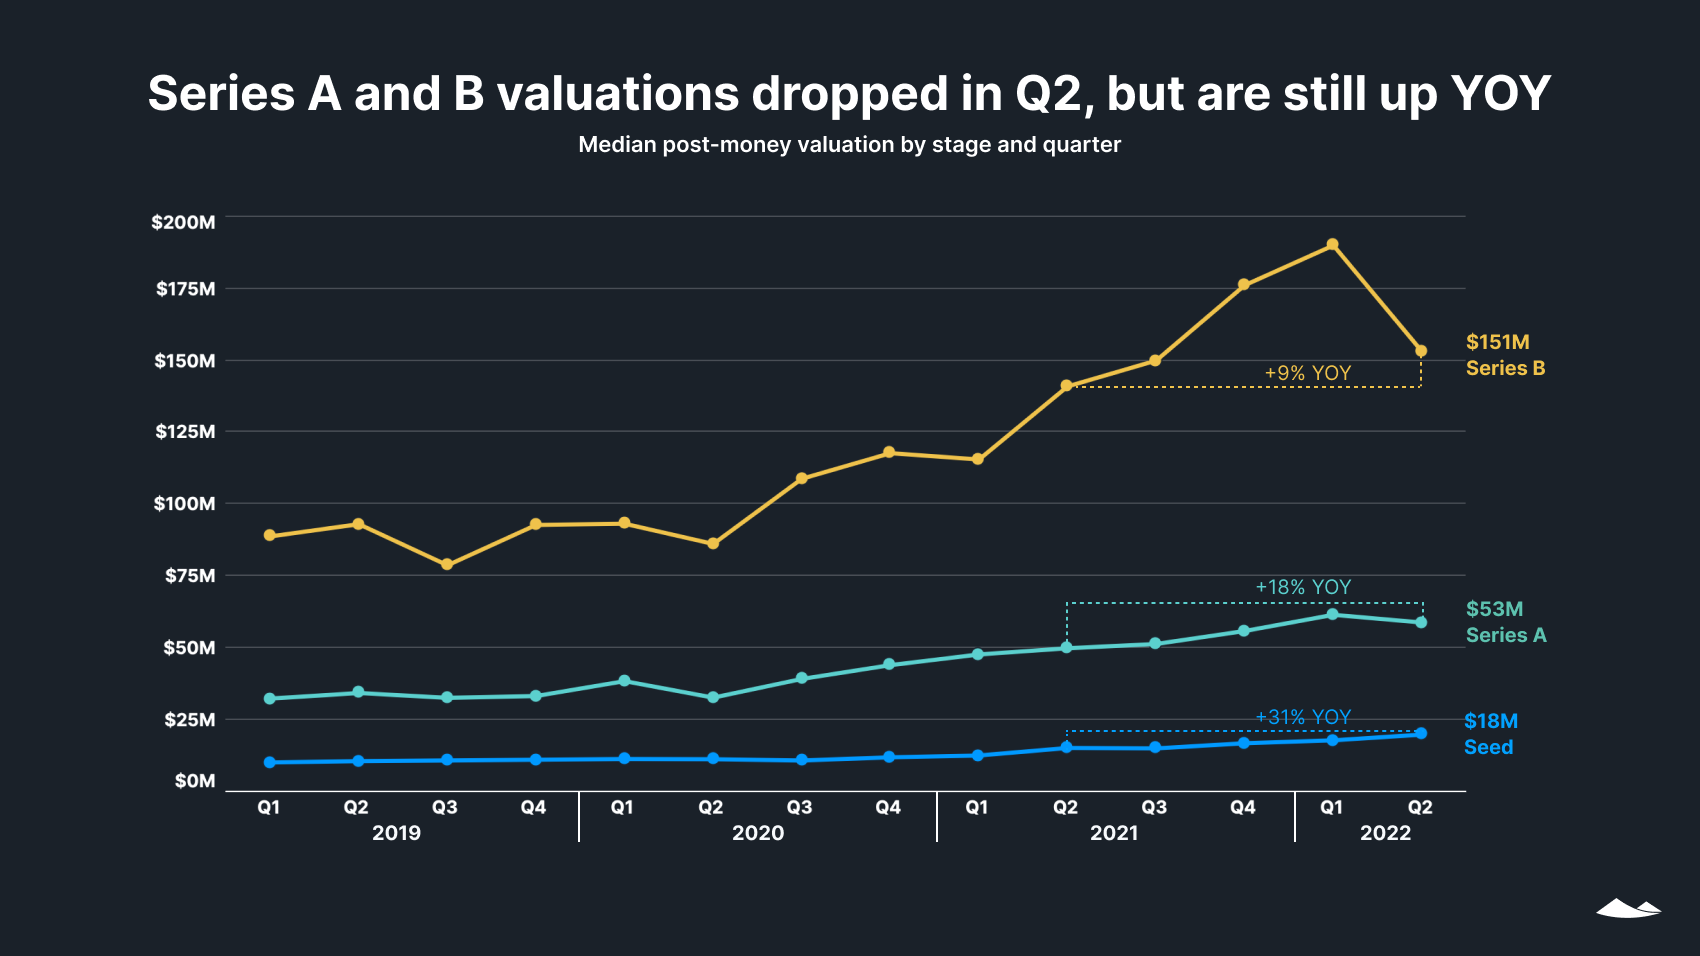
Median valuations are still up YoY at all early stage rounds, even though Series A and B took a dip in Q2 2022. Series B valuations in Q2 were down 19% from a peak of $190M in Q1, but were still higher than in any quarter on record prior to Q4 2021. Series A saw a smaller Q2 dip than Series B, and is up 18% YoY.
Seed round median valuations increased by 11% in Q2, continuing a steady trajectory of growth. Since 2019, seed round median valuations have only dipped in three quarters, and never by more than 4%.
Late-stage post-money valuations
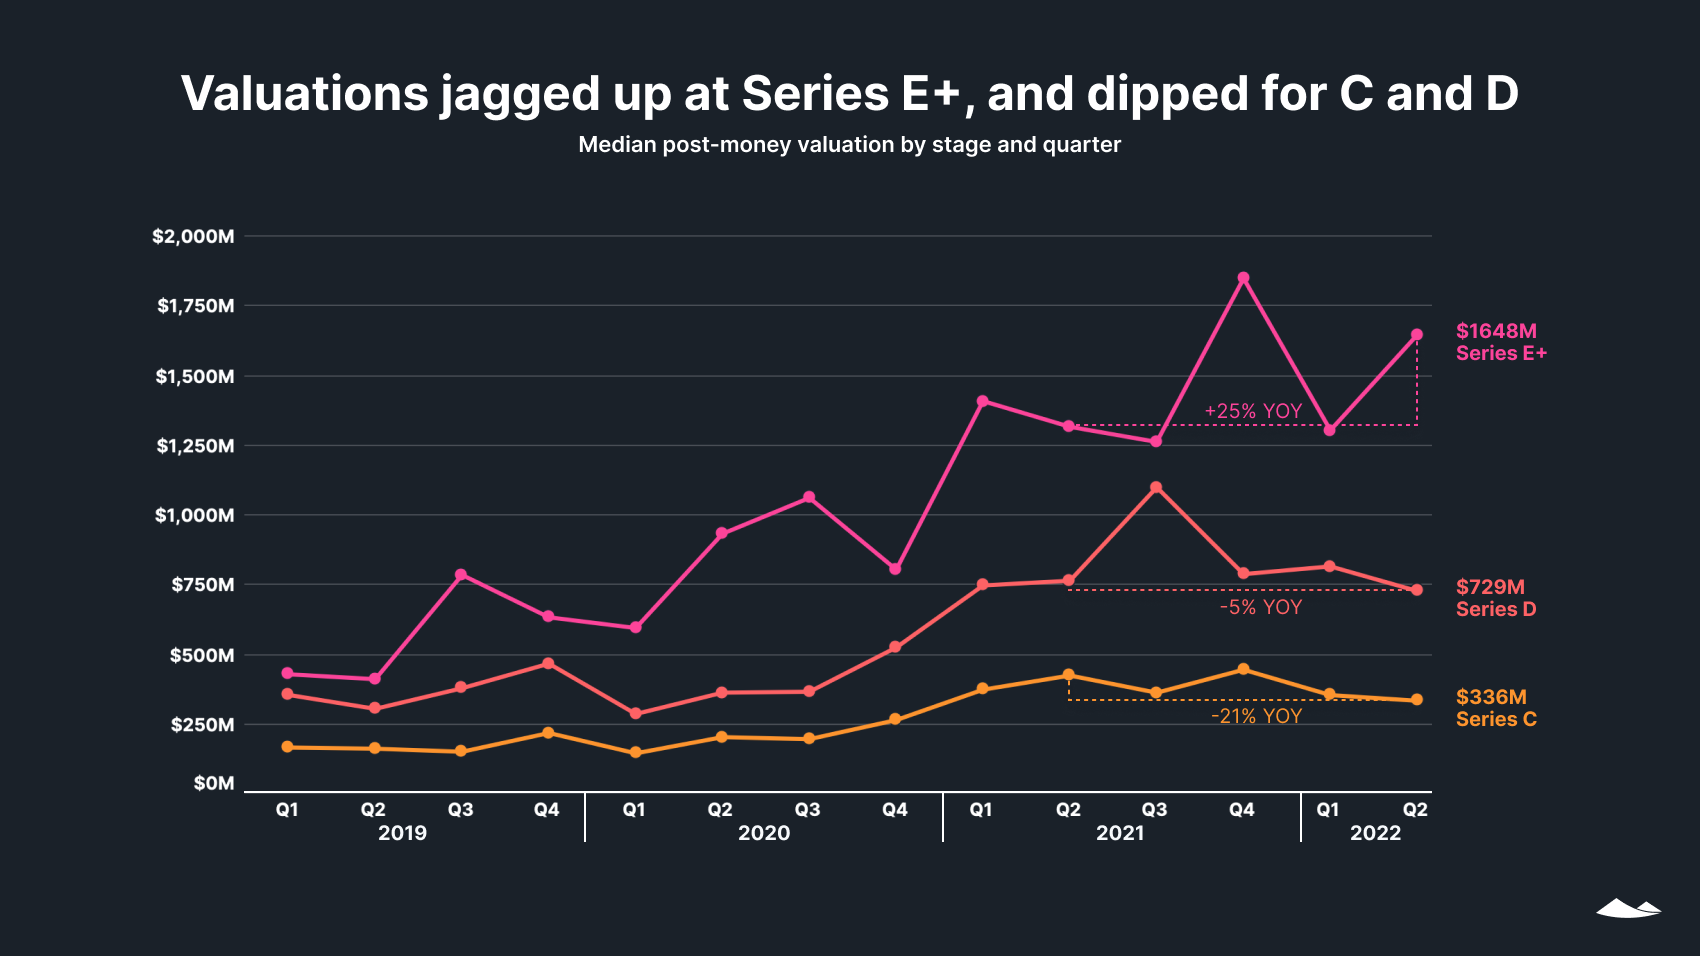
Median valuations for Series C and D rounds were down on a QoQ and YoY basis. They were, however, higher than at any point prior to 2021.
At Series E and beyond, the median valuation jumped by 21% QoQ to $1.65B, a YoY uptick of 25%. This group includes companies with a wide range of ages and sizes, with 50-70% typically being Series E rounds and the rest at Series F, G, and H. Series E+ also makes up just over 2% of all rounds since 2019. This smaller number of rounds from a diverse group contributes to the greater noisiness in Series E median metrics versus other series.
The uptick in Q2 2022 median valuations at Series E and above may be due to a greater number of raises by mature companies that in other markets might have held an IPO.
Early-stage raise sizes versus valuations
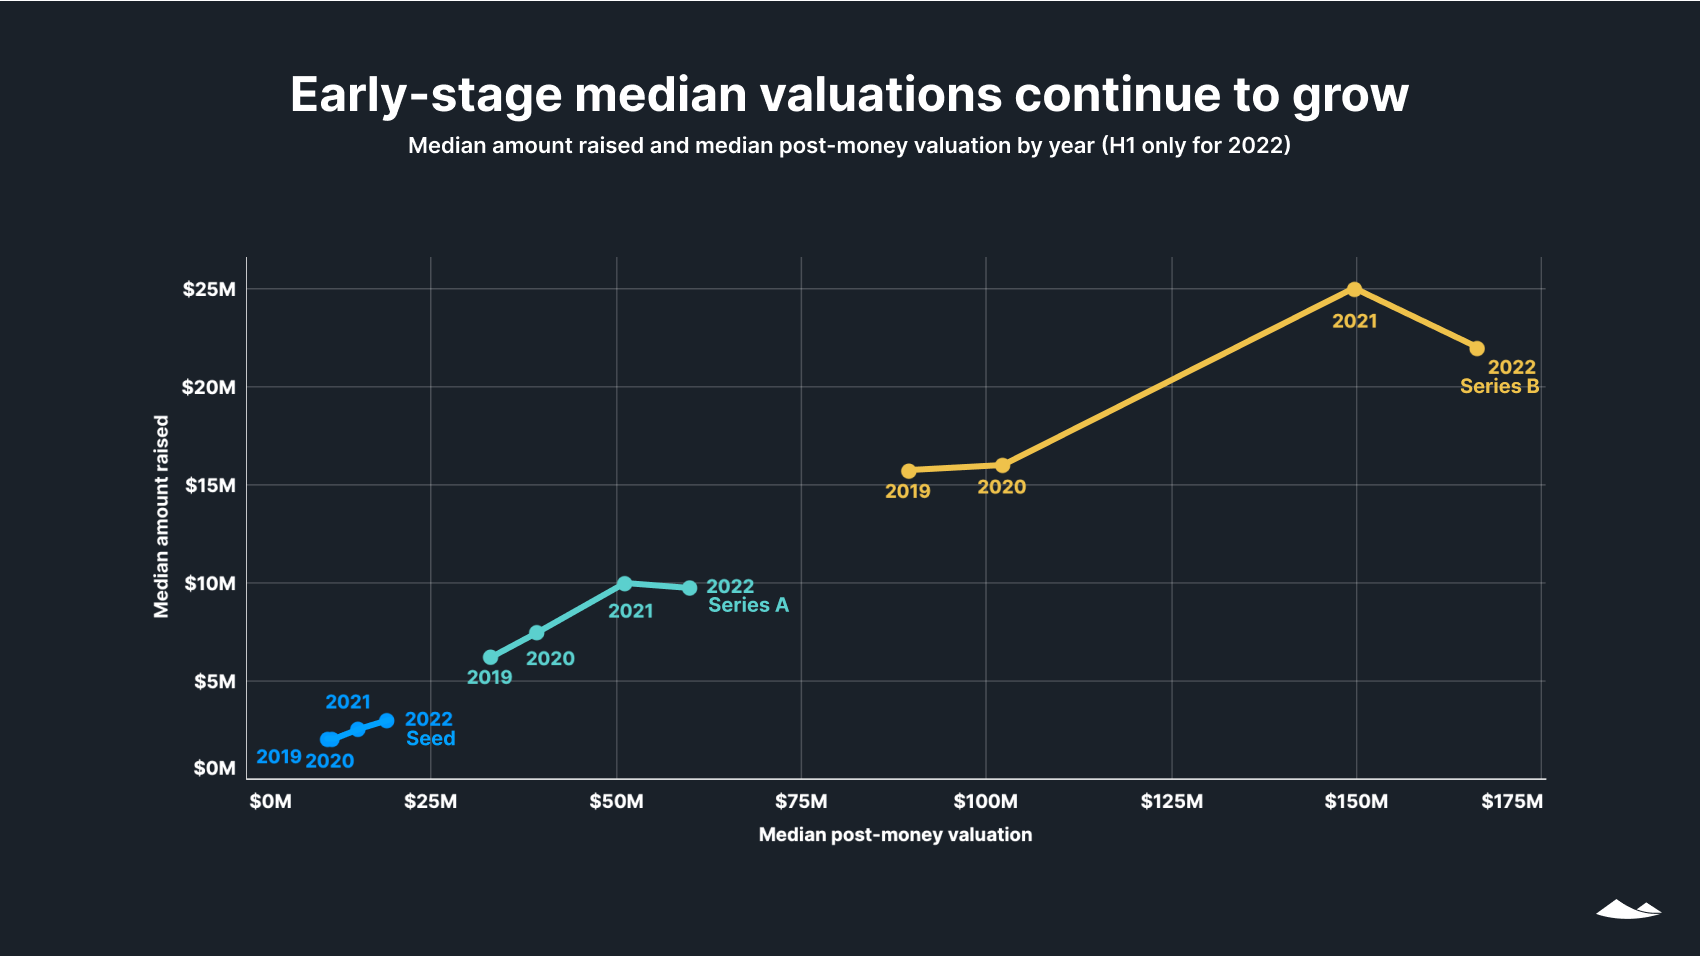
Seed-stage rounds haven’t seen much of a change in trajectory in median raise sizes and valuations, whereas each subsequent stage saw more of a pullback in H1 2022.
Series A and B rounds saw decreasing sizes in H1 2022 compared to 2021, even while post-money valuations continued to increase.
Late-stage raise sizes versus valuations
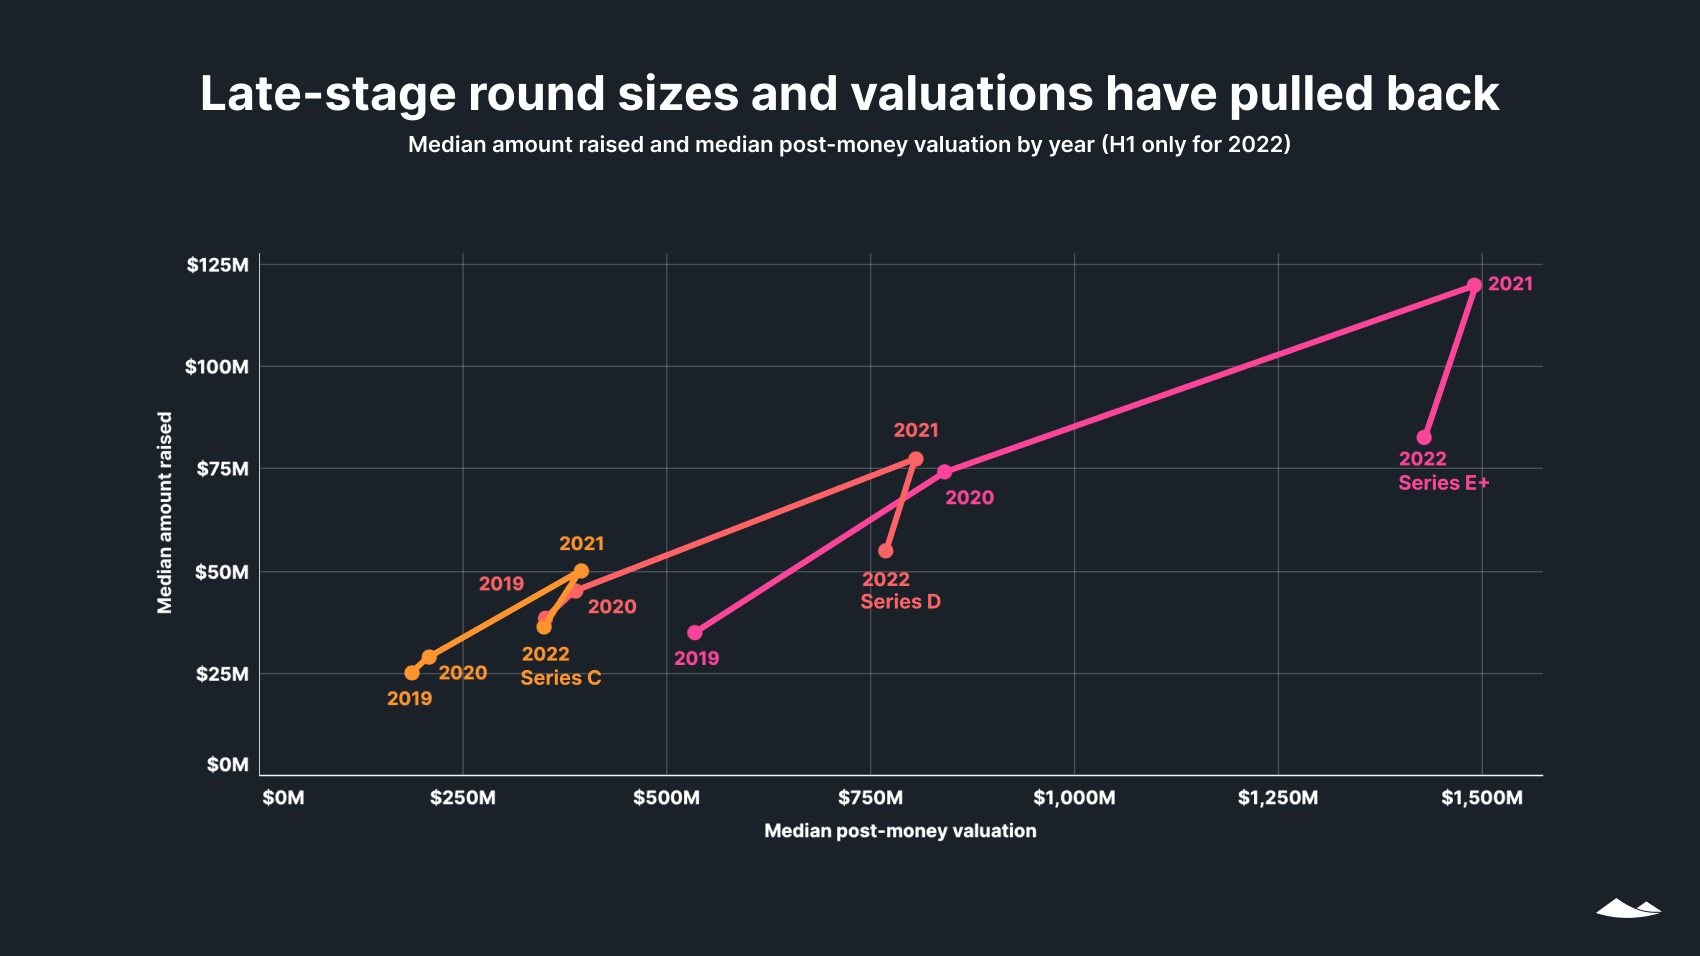
Among late-stage rounds, both raise amounts and post-money valuations were down in H1 2022, relative to 2021, but still above 2020 levels.
Dilution
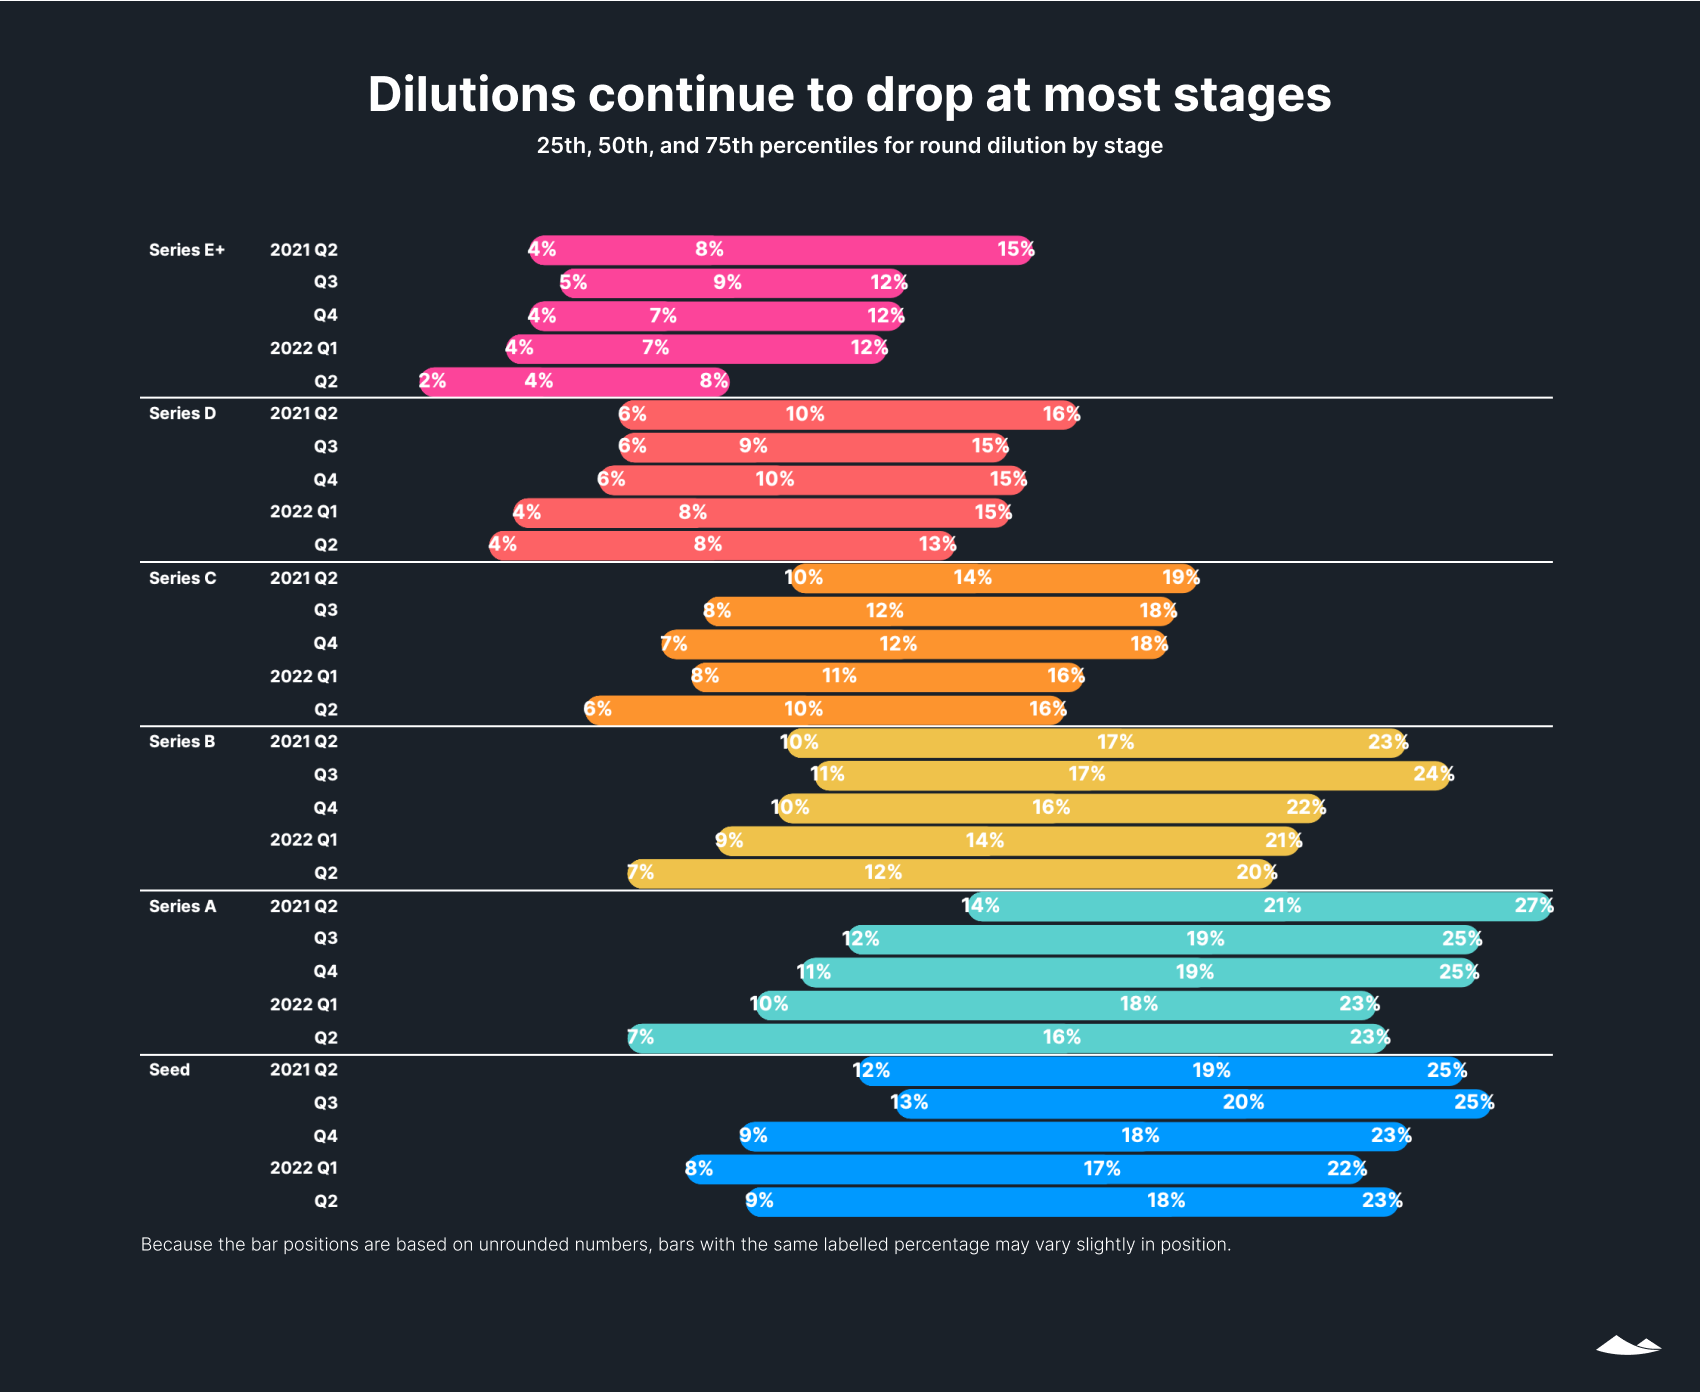
Dilution—or the percentage of a company’s equity that is sold in a round—is calculated by dividing the raised amount by the post-money valuation. The median dilution in a round dropped at most stages in Q2 2022. The exceptions were Series D and seed, which both saw slight increases for median dilutions in Q2.
Bridge rounds
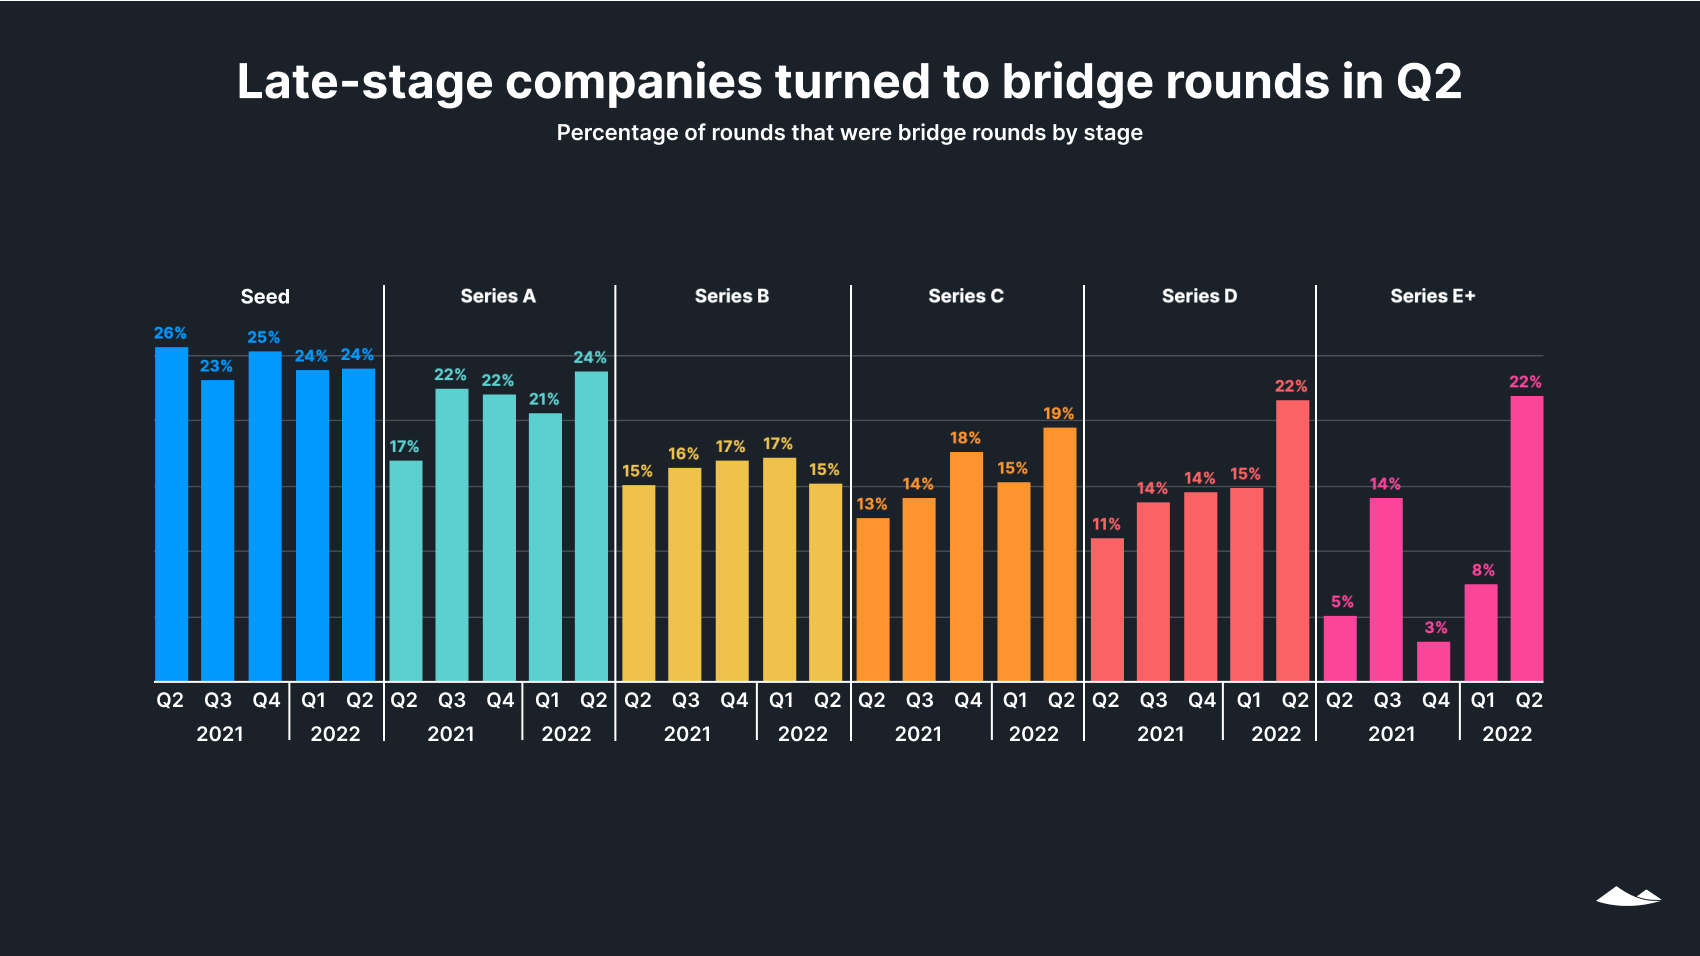
Bridge rounds are an interim, typically smaller, and usually unpriced financing round meant to extend a company’s runway until it is ready for its next priced round or an IPO. The percentage of financing rounds that are bridge rounds jumped for later-stage companies in Q2 2022.
Series E and above saw the sharpest increase, with the percentage of fundings that were bridge rounds nearly tripling from 8% in Q1 to 22% in Q2. Some of these companies might have previously planned to go public, but last year’s sprint to the IPO market among tech startups has slowed to a crawl in 2022, as companies avoid making a debut amid a bearish market that might drive down their stock.
Instead, many companies are buying time with bridge rounds, allowing them to extend their runways without a down round (a primary round at a lower valuation). These companies are waiting until their fundamentals or wider market conditions improve enough to have their valuation expectations met in an IPO or primary financing round.
SAFEs and convertible notes
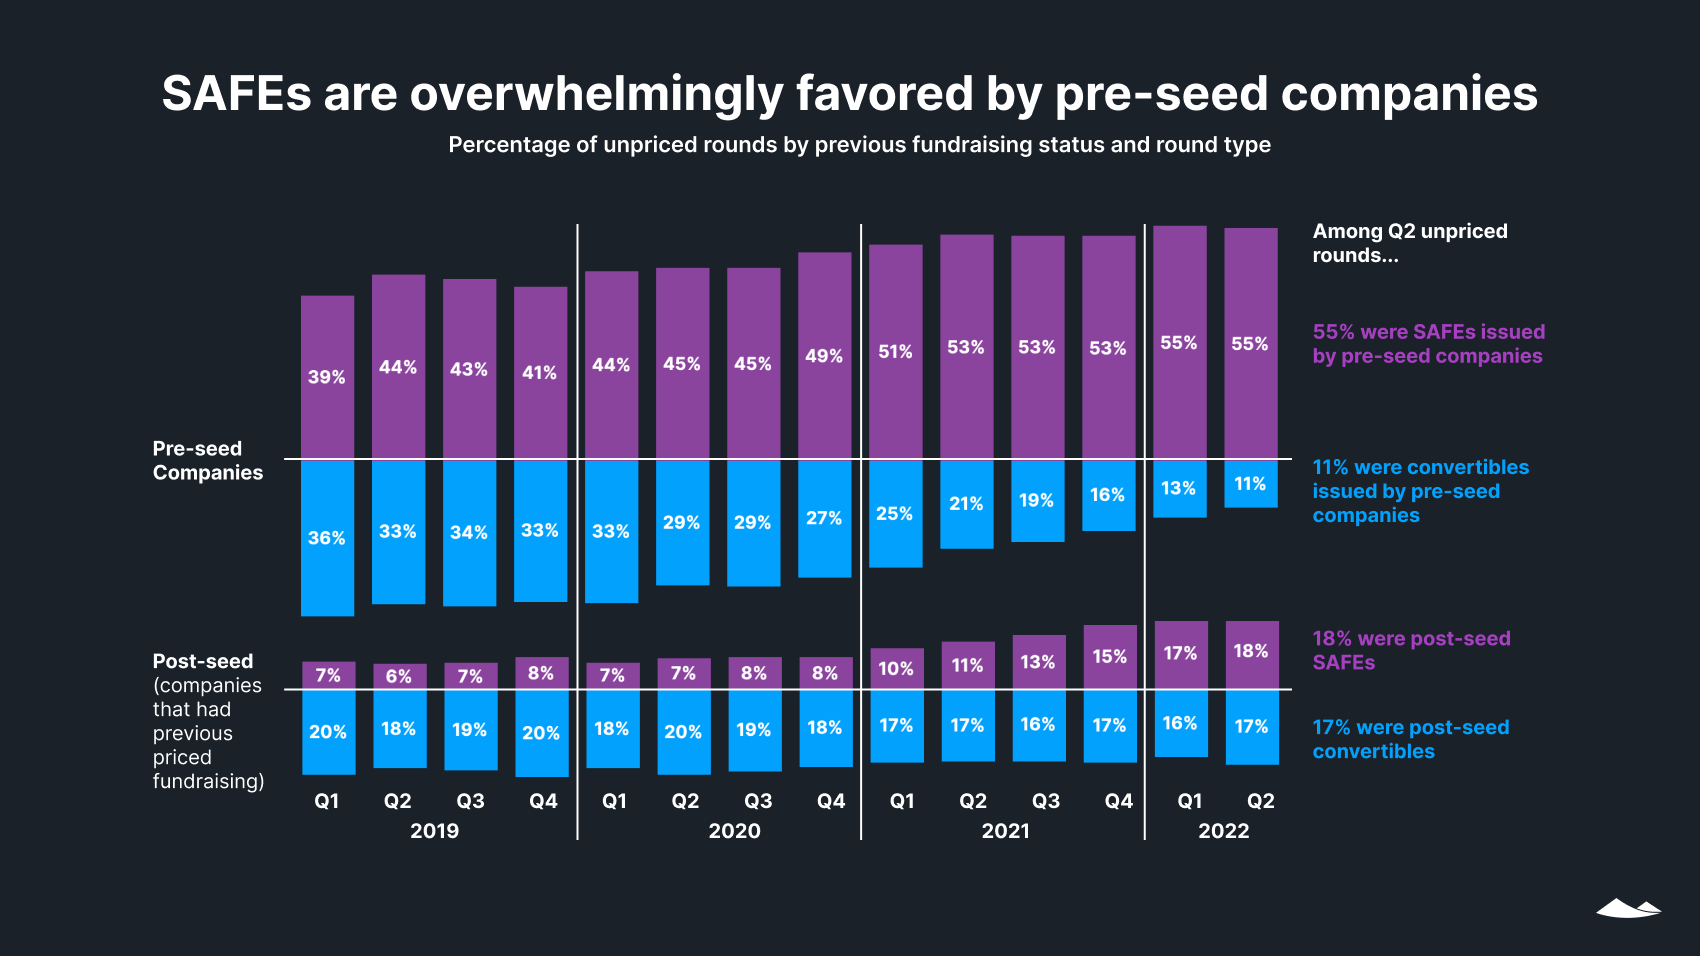
Unpriced rounds, which include both Simple Agreements for Future Equity (SAFEs) and convertible notes, allow a startup to receive an investment without negotiating a valuation. As cheap, easy, and flexible instruments, they are particularly useful for pre-seed companies. For companies at later stages that already have a valuation from a prior round, these same qualities make unpriced rounds helpful for a bridge round, when an influx of cash is needed to help a company reach its next milestone, such as its next primary round of equity financing, or an IPO.
Both pre-seed and post-seed companies have shifted since 2019 toward a preference for SAFEs—which don’t have an interest rate, as they’re not a debt instrument—over convertible notes, which do. The preference is much more marked among pre-seed companies, with 83% of these choosing SAFEs in Q2 2022, as compared with 51% among companies with previous priced fundraising.
The number of unpriced rounds recorded on Carta has remained robust in H1 2022: If the same pace continues in H2, the number of unpriced rounds in 2022 will be just 10% below the 2021 total.
The percentage of unpriced rounds raised by post-seed companies has increased steadily since Q1 2021, when 23% were for companies with previous priced fundraising, versus 39% in Q2 2022. The percentage that were for companies that raised a Series B or later round increased from 6% in Q1 to 9% in Q2 2022, fueled by a spike in bridge rounds by late-stage companies.
Employees and liquidity
Startup employee departures
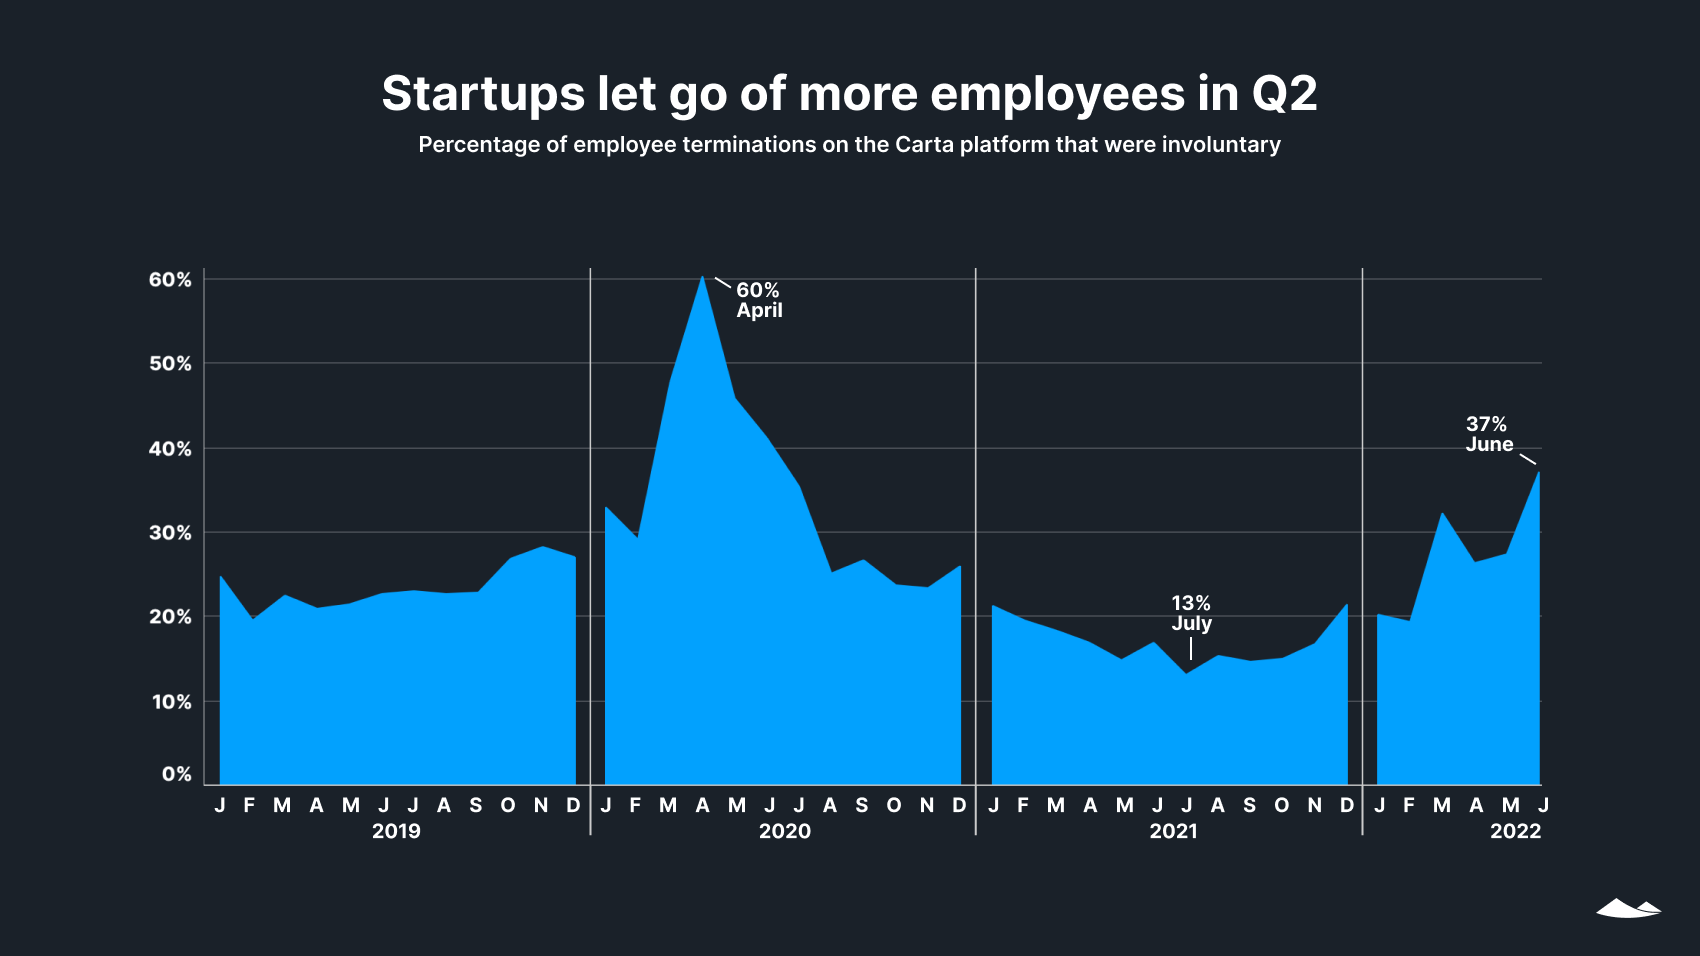
The percentage of employee departures that were involuntary ticked upward in June to 37%, bringing Q2 to an overall percentage of 30%, compared with 25% in Q1.
In both May and June, the total number of employees who lost their jobs at companies in our dataset increased over the previous month while the count of employee-initiated departures decreased—underlining a shift in both employee sentiment and company decision-making.
Employee options exercised
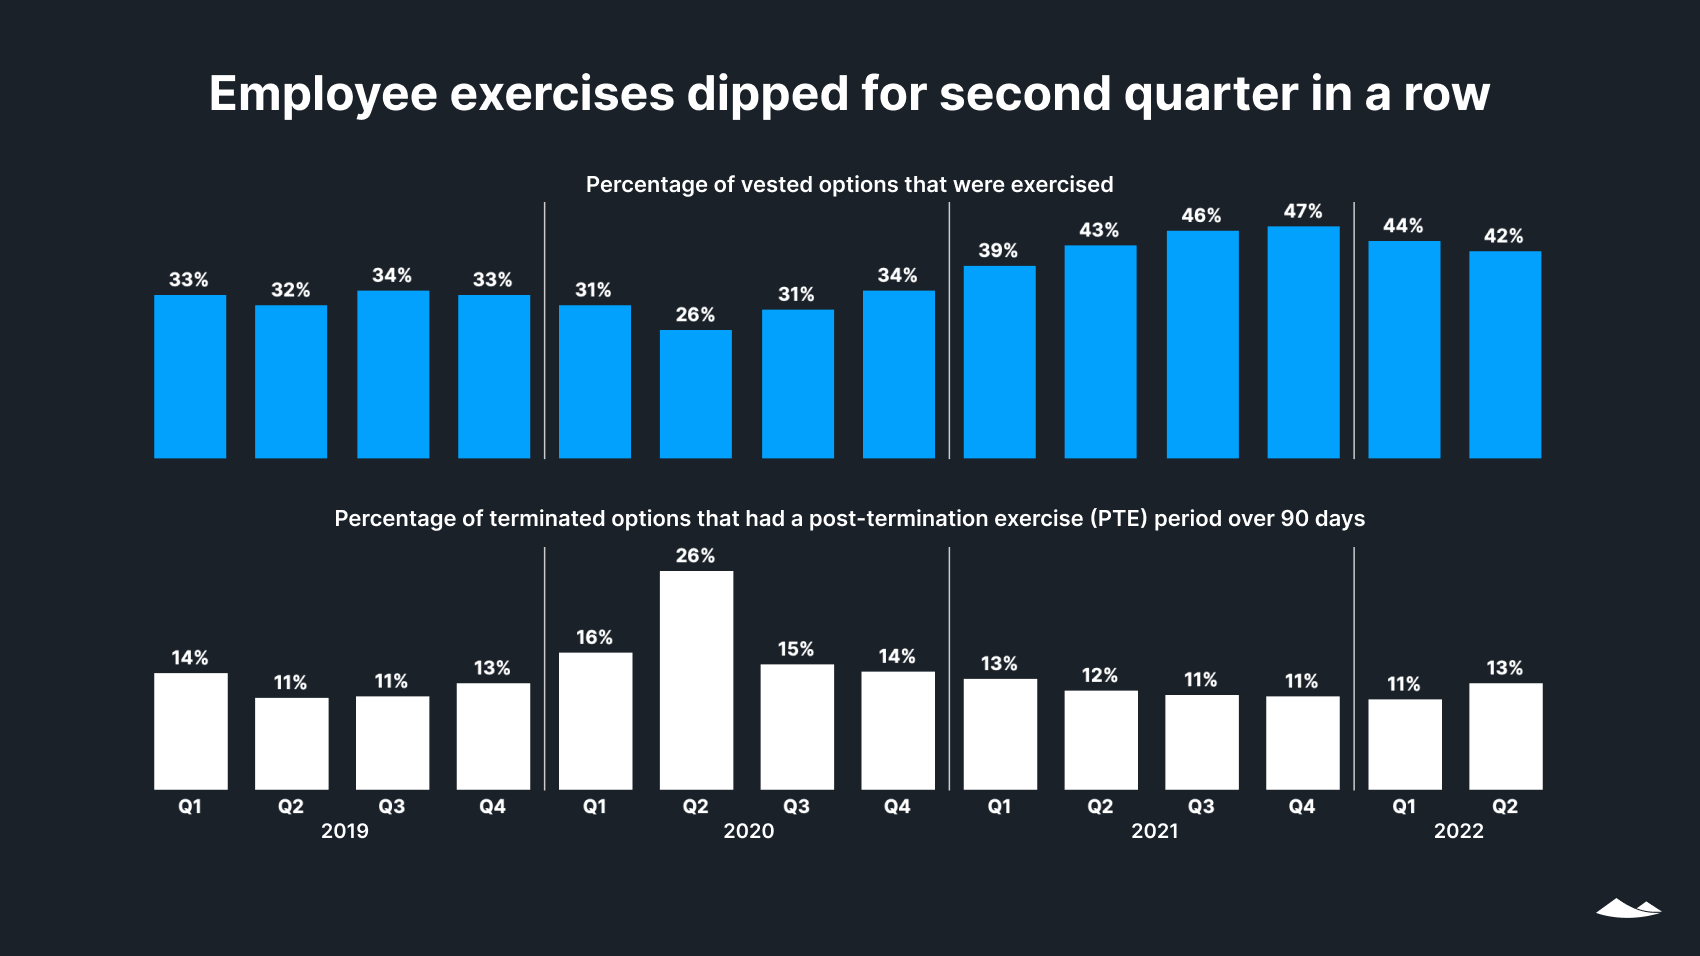
In Q2, the percentage of vested options that employees chose to exercise dropped for the second quarter in a row, but was still higher than any quarter from Q1 2019 to Q1 2021. The decrease could reflect declining employee confidence in the value of their shares, given ongoing news about startup valuations, tech-sector layoffs, and tightening household budgets amid recent inflation.
The trend of fewer options having an extended post-termination exercise (PTE) period reversed in Q2, with a small uptick from 11 to 13%. It’s possible that, as in the pandemic layoffs of Q2 2020, some companies are choosing to give laid-off employees more time to exercise through individual separation agreements or other methods to extend PTE windows.
Mergers and acquisitions
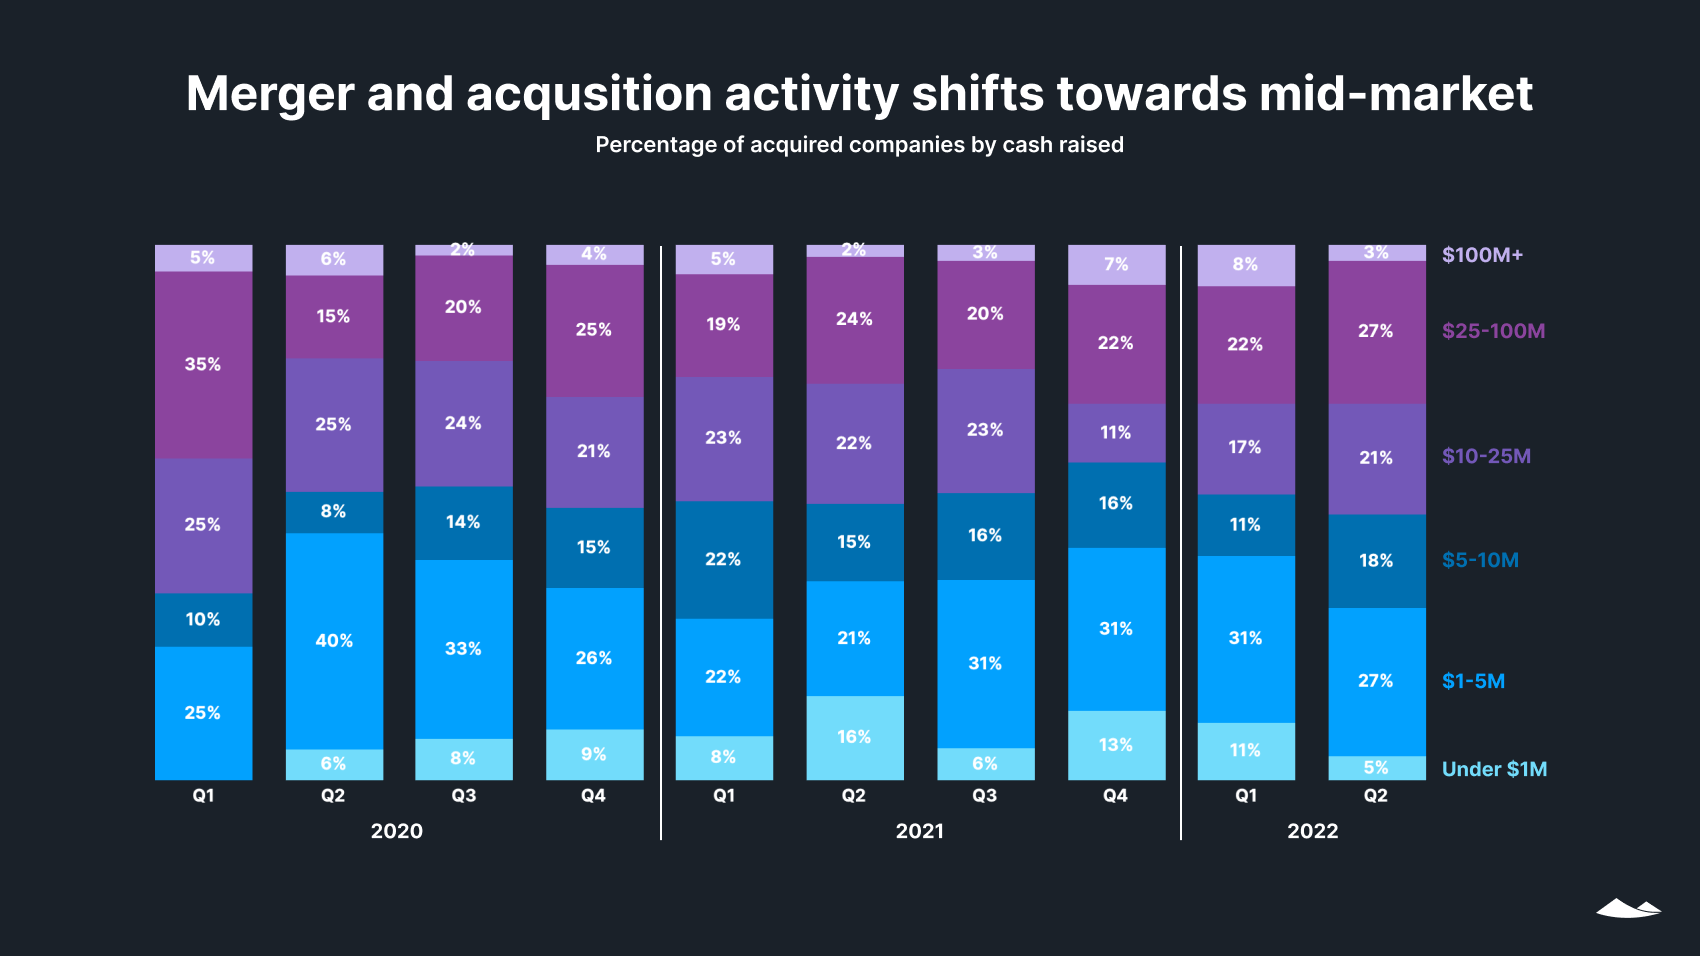
The overall number of companies on Carta to merge with or be acquired by another company per quarter increased slightly from 2021 to 2022.
Among companies using Carta that were acquired or merged with another company in Q2, there were fewer fundraising outliers than in most quarters. Only 5% of those companies had raised less than $1 million and just 3% had raised more than $100 million, leaving a larger proportion of targets than usual in the remaining middle ground.
Tender offers
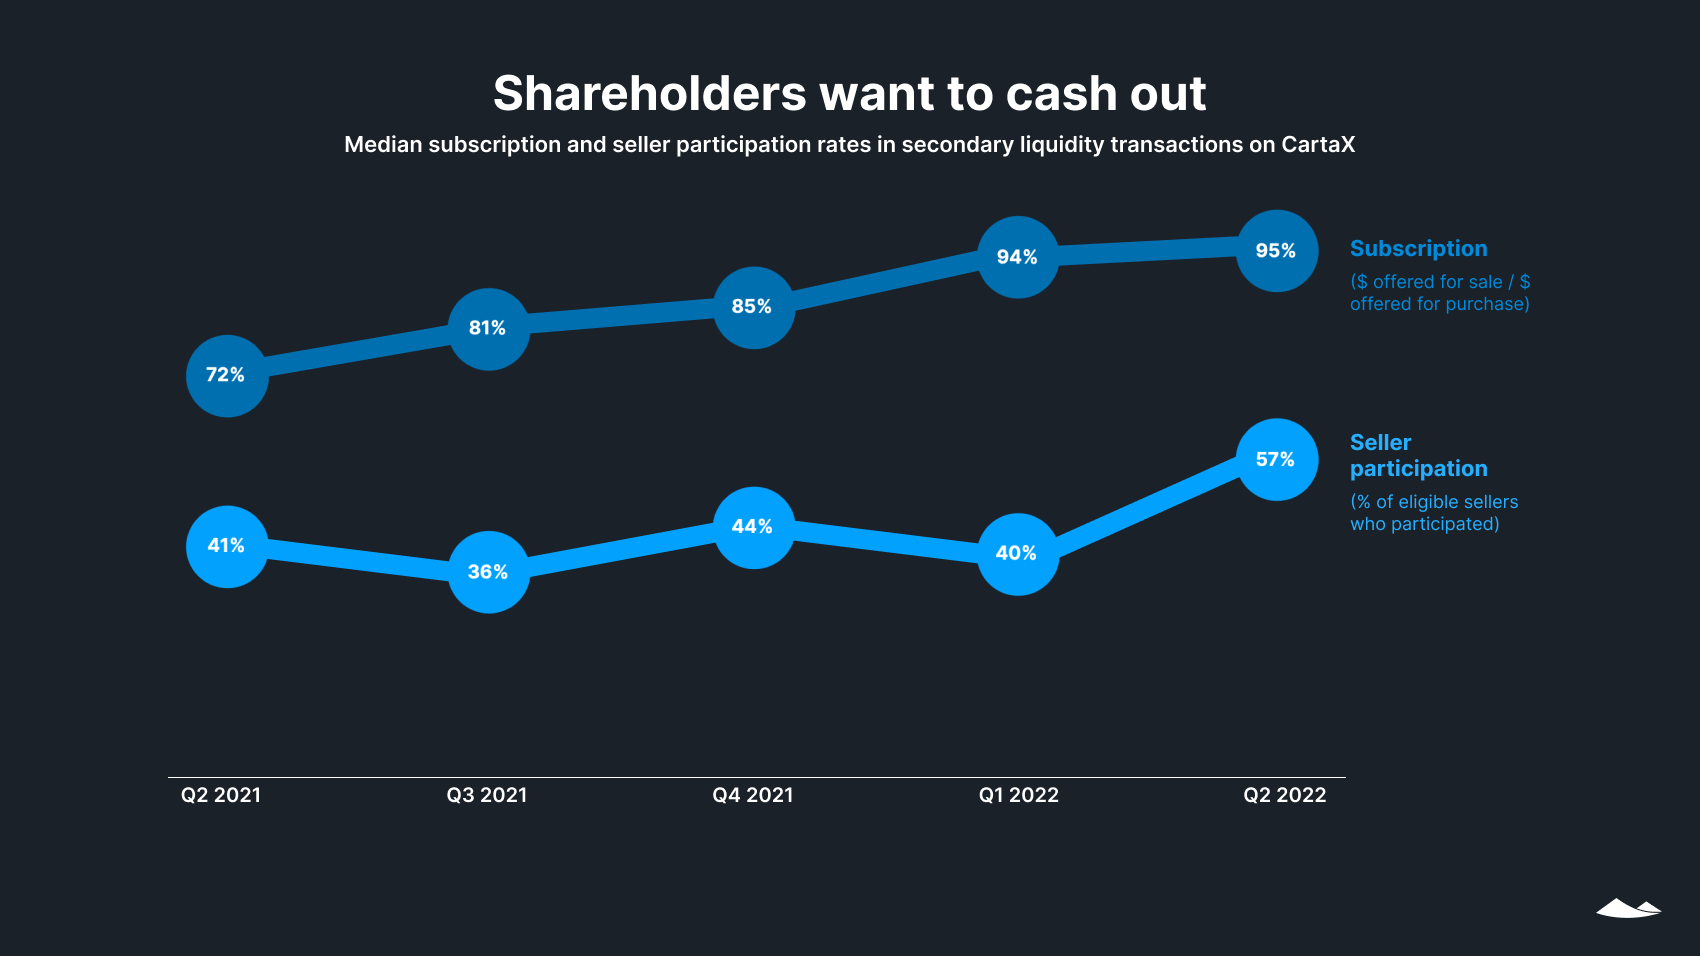
Shareholders are increasingly looking for liquidity. In a secondary liquidity transaction, the subscription rate is the value of shares that sellers elect to sell, divided by the amount investors have offered to buy. The seller participation rate is the percentage of eligible sellers who transacted. In Q2, both numbers reached new highs. In addition to increased awareness of secondary transactions, this likely reflects pressure on companies to meet employee and early-investor thirst for liquidity, and a general shift toward a preference among shareholders for cash, given volatility and contractions in public markets and startup headcounts.
With an increased seller participation rate from 40 to 57% and a 2 percentage point rise in the percentage of secondaries offered at a discount (to 47%), secondaries may be shifting to a buyer’s market. However, we expect to see lower secondary transaction volumes in Q3, as the secondary market delays in registering shifts in primary capital raises and valuations.
Download a PDF of this State of Private Markets: Q2 2022 report.
Methodology
Carta helps more than 30,000 primarily venture-backed companies and 2,000,000 security holders manage over $2.5 trillion in equity. We share insights from this unmatched dataset about the private markets and venture ecosystem to help founders, employees, and investors make informed decisions and understand market conditions.
Overview
This study uses an aggregated and anonymized sample of Carta’s data. Companies that have contractually requested that we not use their data in anonymized and aggregated studies are not included in this analysis.
The data presented in this private markets report represents a snapshot as of August 9-10, 2022. Historical data may change in future studies because there is typically an administrative lag between the time a transaction took place and when it is recorded in Carta. In addition, new companies signing up for Carta’s services will increase historical data available for the report.
Financings
Financings include equity deals raised in USD by U.S.-based corporations. The financing “series” (e.g. Series A) is taken from the legal share class name. Financing rounds that don’t follow this standard are not included in any data shown by series but are included in data not shown by series. Primary rounds are defined as the first equity round within a series. Bridge rounds are defined as any round raised after the first round in a given series. If there is no indication that a round is a Primary or Bridge round, both are included.
In some cases, convertible notes are raised and converted into multiple share classes within a series at various discounted prices (e.g. Series A-1, Series A-2, Series A-3). In these cases, converted securities are not included in cash raised, and only the post-money valuation of the new money is included.
Industry groupings
We grouped industries as follows: “SaaS” includes CRM software, edtech, and HR software in addition to other software as a service companies; “health & biotech” also includes healthcare devices and healthcare tech; “consumer” includes consumer products and services, such as food, cannabis, and video games; “hardware & logistics” includes electronics as well as renewable energy, semiconductors, telecom, and transportation; “fintech” includes financial exchanges; “data & security” includes cloud distribution, analytics, and cybersecurity; and “adtech & marketplace” also includes ecommerce and social media.
Terminations
Terminations entered into Carta must include a reason. Involuntary terminations include both terminations for performance and company layoffs. Voluntary terminations are employees who decided to leave of their own accord. Other termination reasons, including for cause, death, disability, and retirement were not included in the data and make up less than 1% of all terminations combined.
