
The startup fundraising market got off to a cautious start in 2024.
At current count, companies on Carta closed 1,064 new funding rounds during the first quarter of the year, down 29% compared with the prior quarter. The decline was sharpest at the early stages of the venture lifecycle: Deal count fell by 33% at the seed stage in Q1 and 36% at Series A.
Instead of new primary funding events, many companies opted to raise bridge rounds. At both seed and Series A, more than 40% of all financings in Q1 were bridge rounds. Series B wasn’t far behind, at 38%.
VCs were still willing to spend big on certain deals. Despite the decrease in round count, total cash invested increased slightly in Q1, reaching $16.3 billion. But when it came to negotiating their valuations, many startups had to settle: 23% of all new rounds in Q1 were down rounds, the highest rate in more than five years.
After experiencing a pandemic-era surge and subsequent correction,the venture market settled into a quieter place in 2023. So far, that relative tranquility has continued into 2024.
Q1 highlights
-
VCs look to the West: Startups based in the West census region captured 62% of all venture capital raised by companies on Carta in Q1, the highest quarterly figure since Q1 2019. The Northeast, South, and Midwest all saw their market share decline.
-
The Series C market bounces back: Series C startups raised $4.6 billion in new capital in Q1, a 130% increase from the previous quarter. The median primary Series C valuation was $195.7 million, up 48% from the prior quarter.
-
Layoffs still linger: Companies on Carta laid off more than 28,000 employees in Q1. But job cuts have grown less frequent since January, with March seeing the fewest monthly layoffs in nearly two years.
Note: If you’re looking for more industry-specific data, download the addendum to this report for an extended dataset.
Key trends
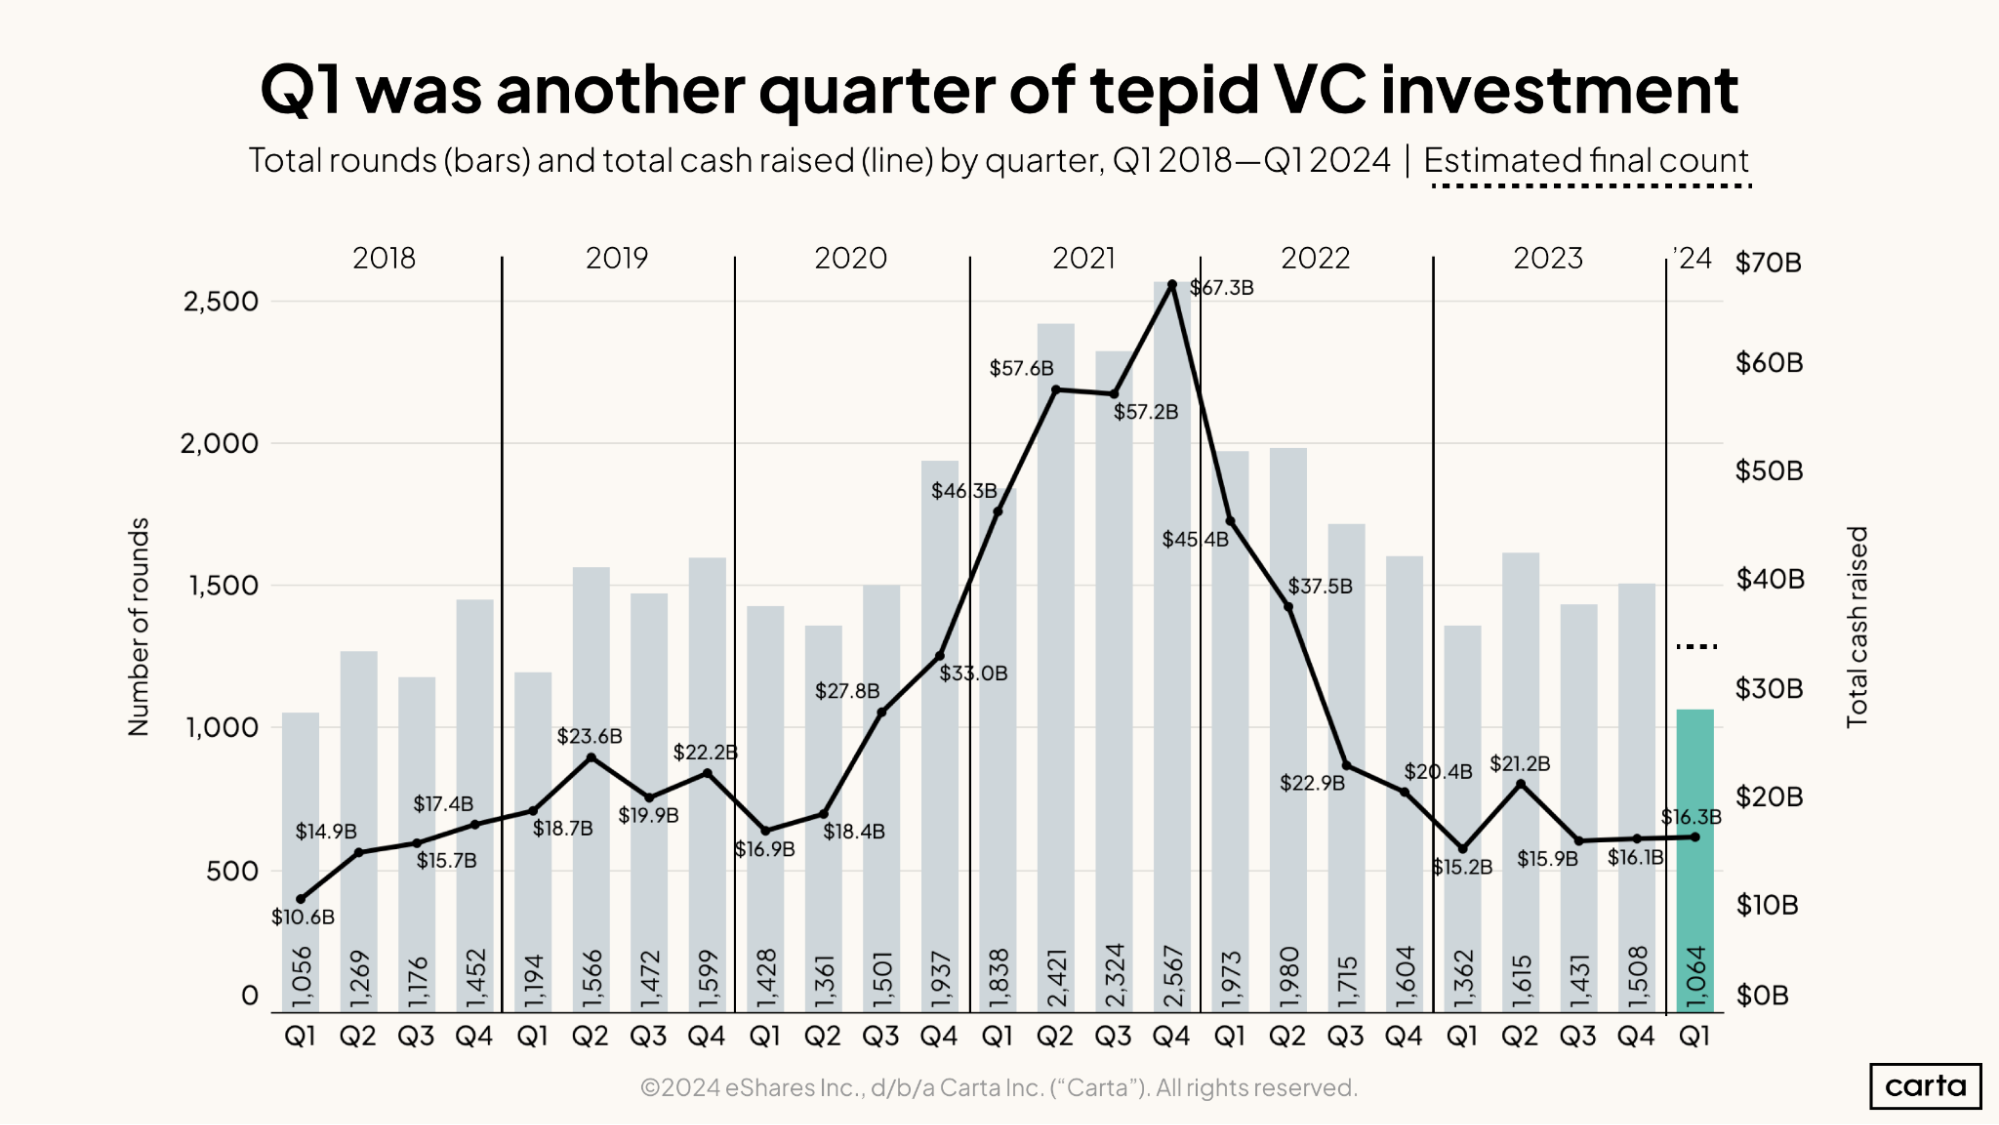
The current Q1 figures of 1,064 total rounds and $16.3 billion in cash raised will both increase in the weeks to come, as companies continue to report transactions from the quarter. With those projected increases, the final data for Q1 will likely look quite similar to fundraising numbers from each of the past few quarters.
Those quarterly fundraising numbers from 2023 ended up looking fairly similar to 2018, 2019, and the first half of 2020. In terms of numbers of deals and cash raised, it’s looking more and more like the pandemic bull market will go down as an anomalous stretch in what has otherwise been a fairly steady market.
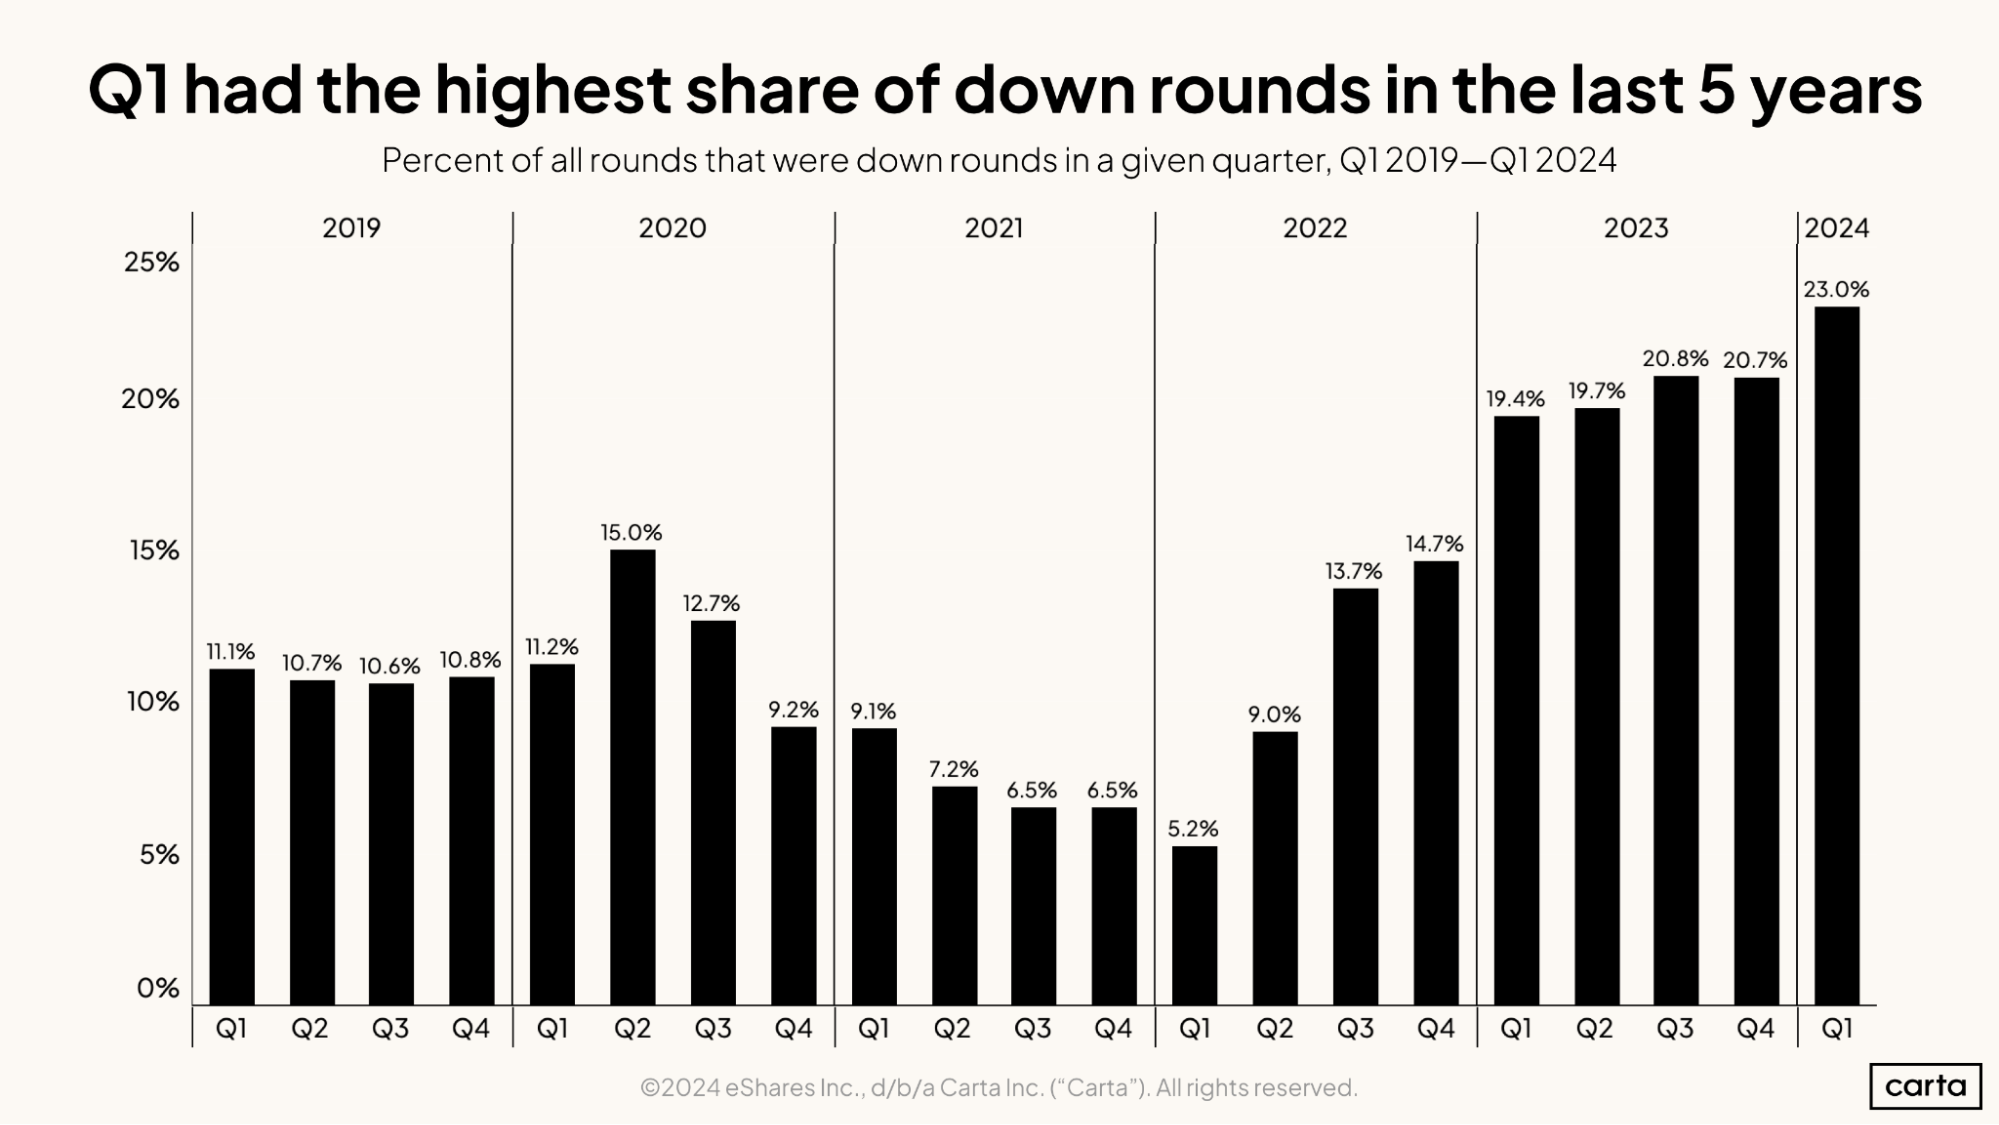
After apparently reaching a plateau during 2023, the rate of down rounds experienced another notable increase during Q1 2024, jumping to 23%. The median time between startup rounds is roughly two to three years, depending on the stage. This timeline means that many companies raising new funding in Q1 would have last raised funding sometime in 2021, when valuations were soaring across the venture landscape. Considering how valuations have declined in the time since, it makes sense that down rounds are still prevalent.
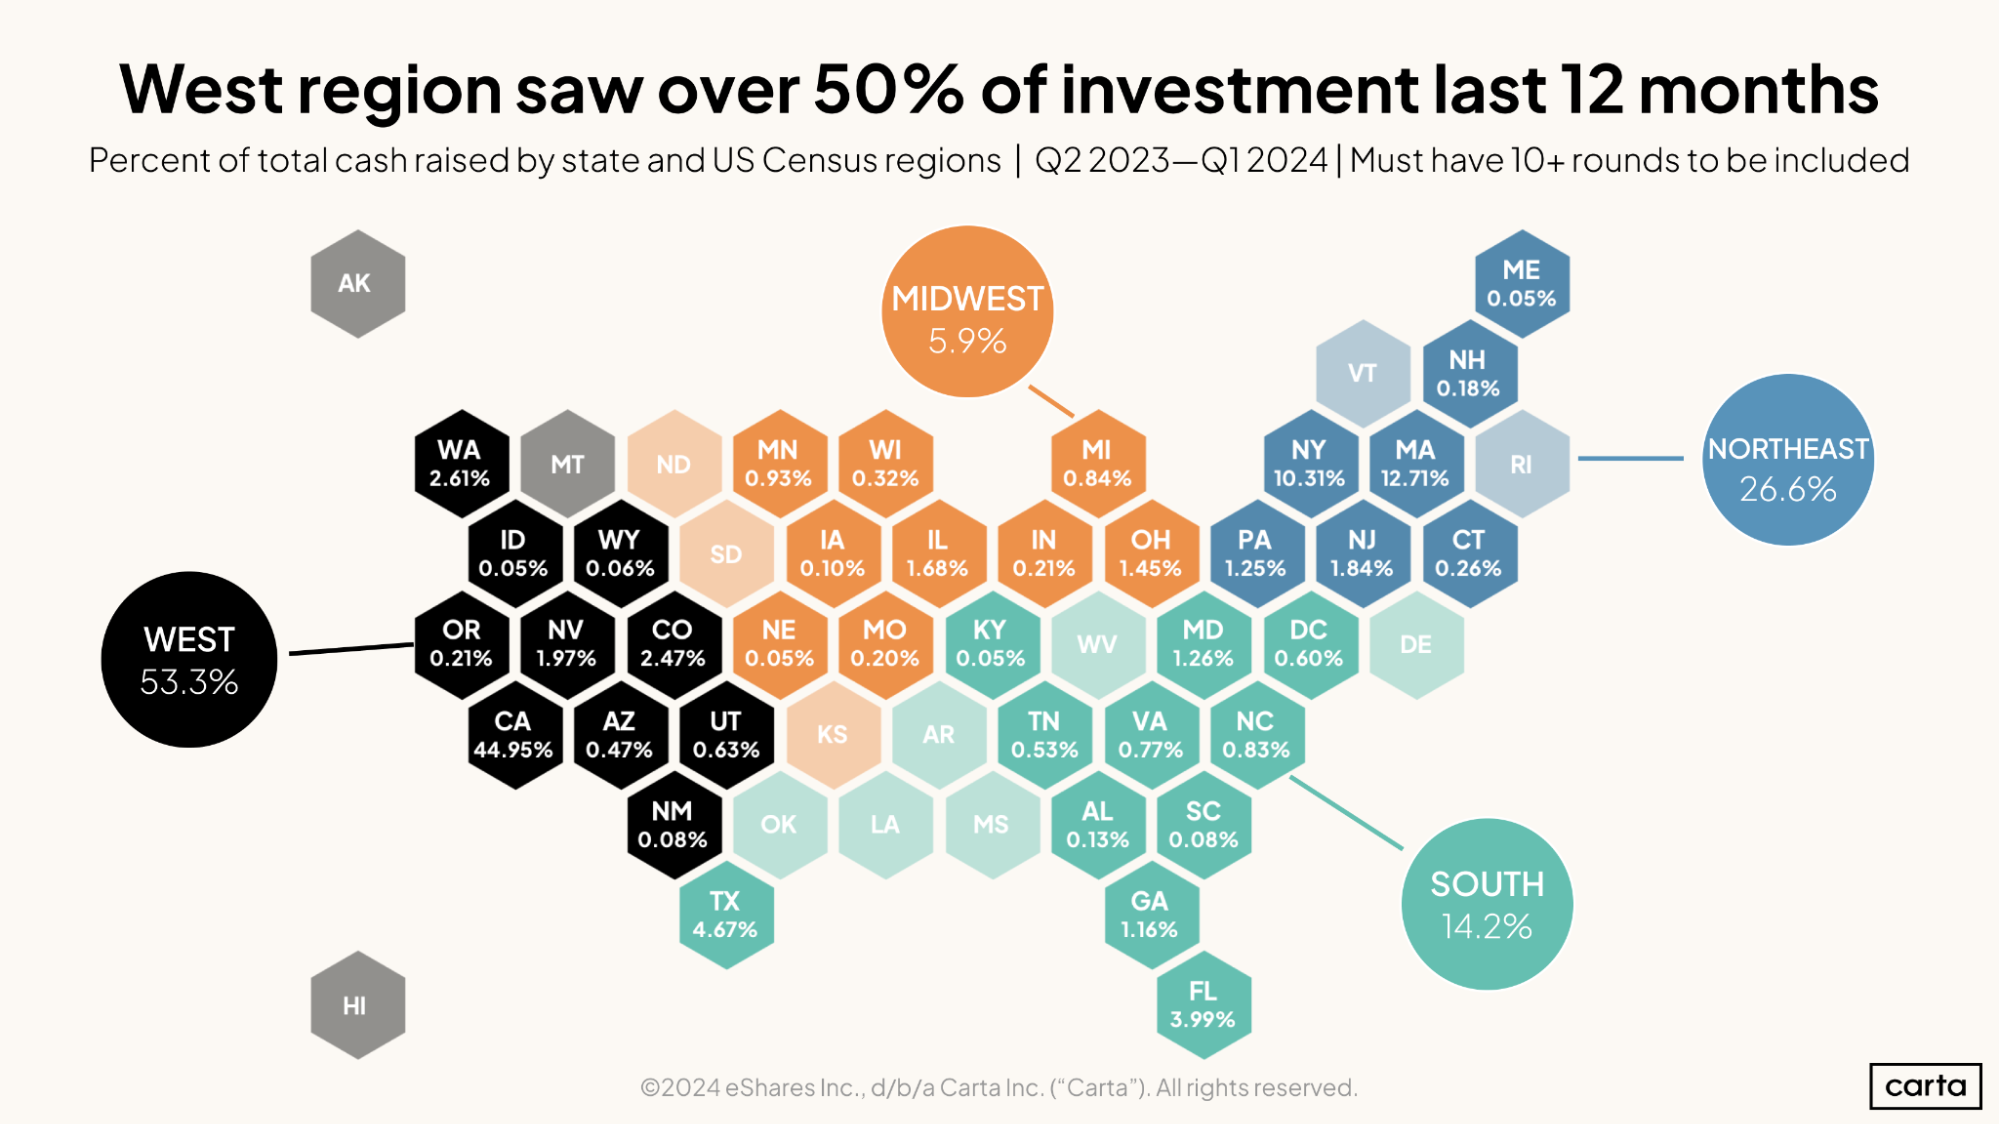
Companies in the West census region combined to bring in 53.3% of all capital raised by startups on Carta from Q2 2023 through Q1 2024, with California accounting for nearly 45% of that cash. Massachusetts ranked second among the states with 12.71% of all capital raised, while New York claimed 10.31%.
In terms of VC activity, the West region is centered around California. The Northeast revolves around Massachusetts and New York. The South has two smaller hubs, in Texas (4.67%) and Florida (3.99%). The Midwest, though, is without a real standard-bearer: Illinois led the way in terms of cash raised over the past 12 months, at just 1.68%.
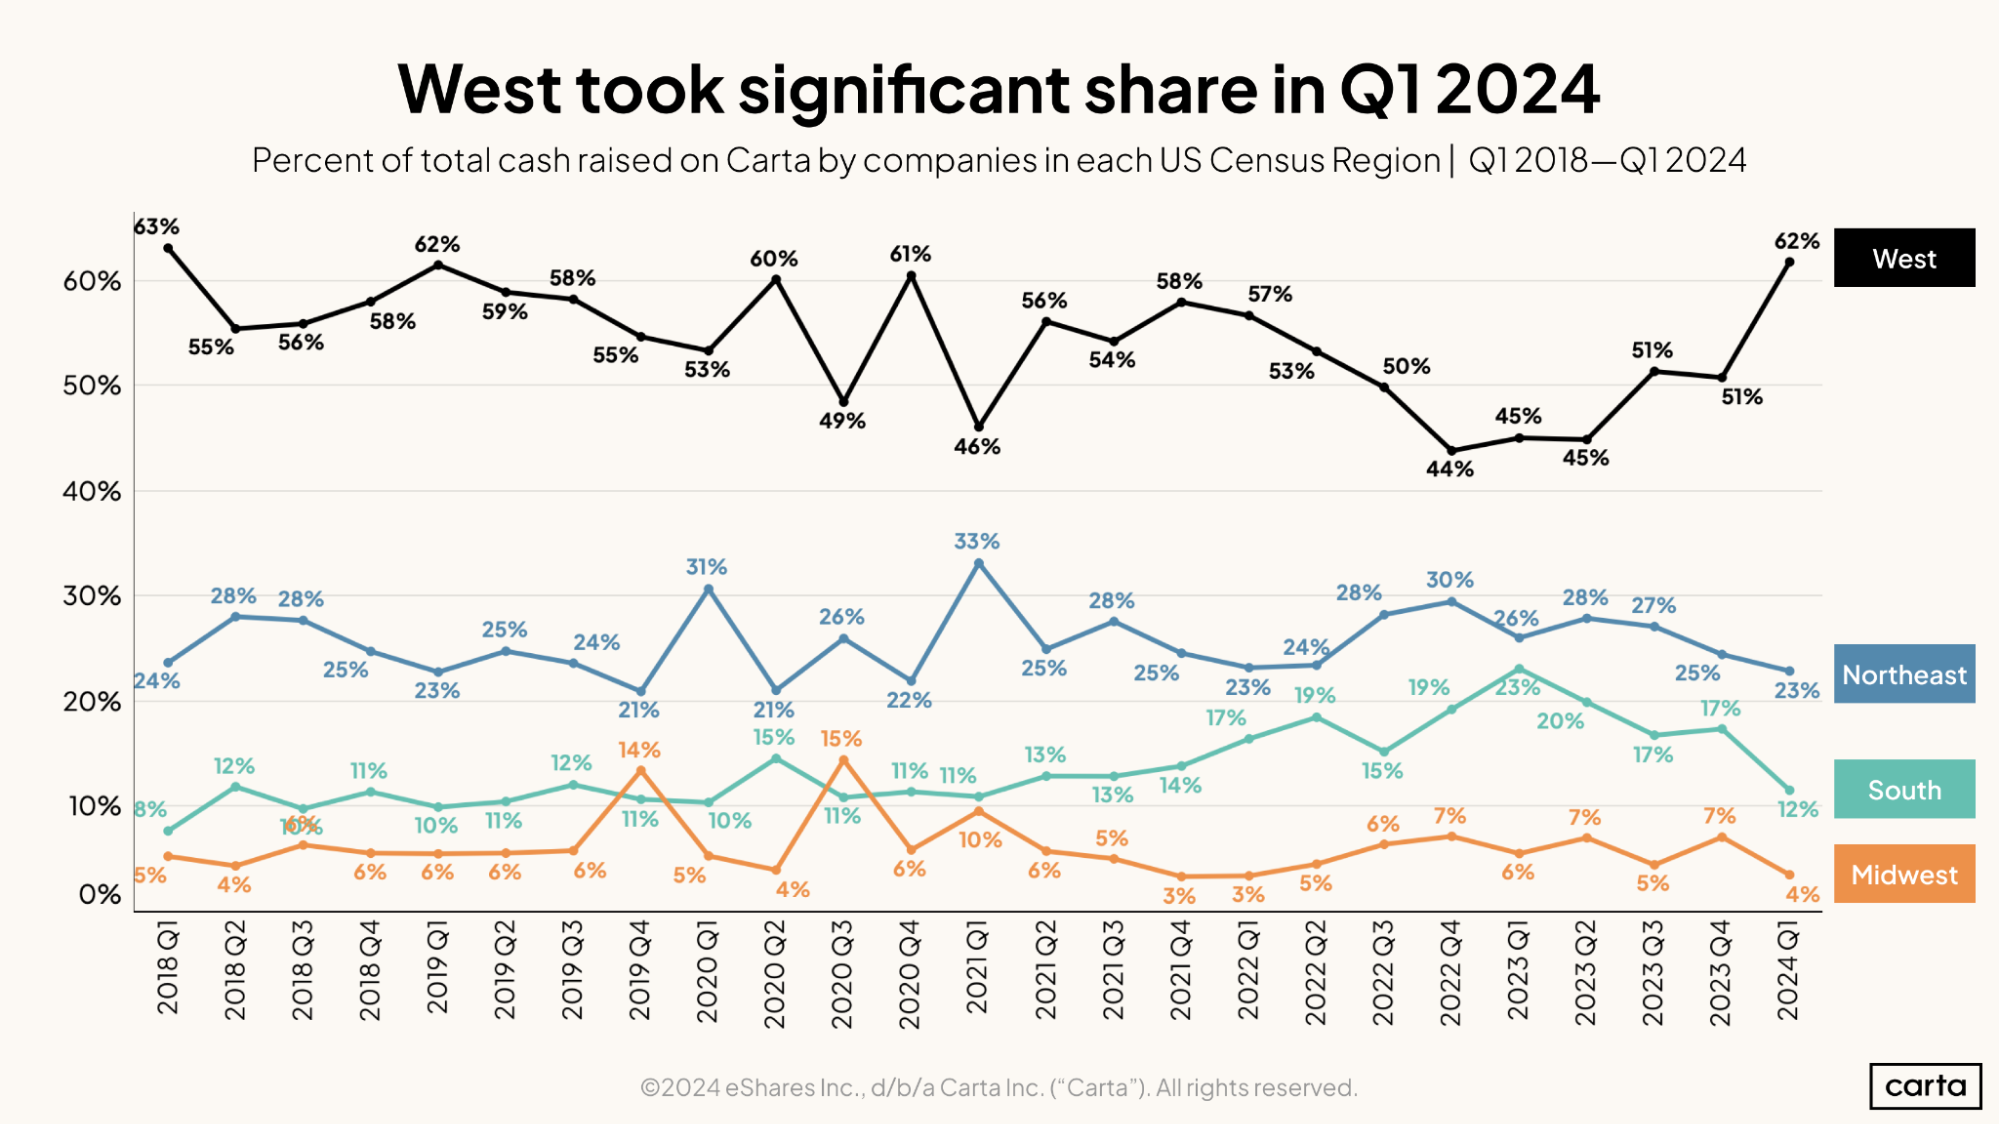
The West (and specifically California) has always been the center of gravity for the U.S. venture capital industry. During Q1, the region’s gravitational force seems to have gotten even stronger. Startups based in the West raised 62% of all total capital invested on Carta in Q1, its highest quarterly figure since Q1 2019.
As a result, the other three census regions saw their market shares decline in Q1—in some cases significantly. The proportion of all VC raised by startups raised in the South fell to 12% in Q1, down from 17% the prior quarter and from 23% a year ago. And the Midwest’s share of cash raised fell from 7% down to 4%.
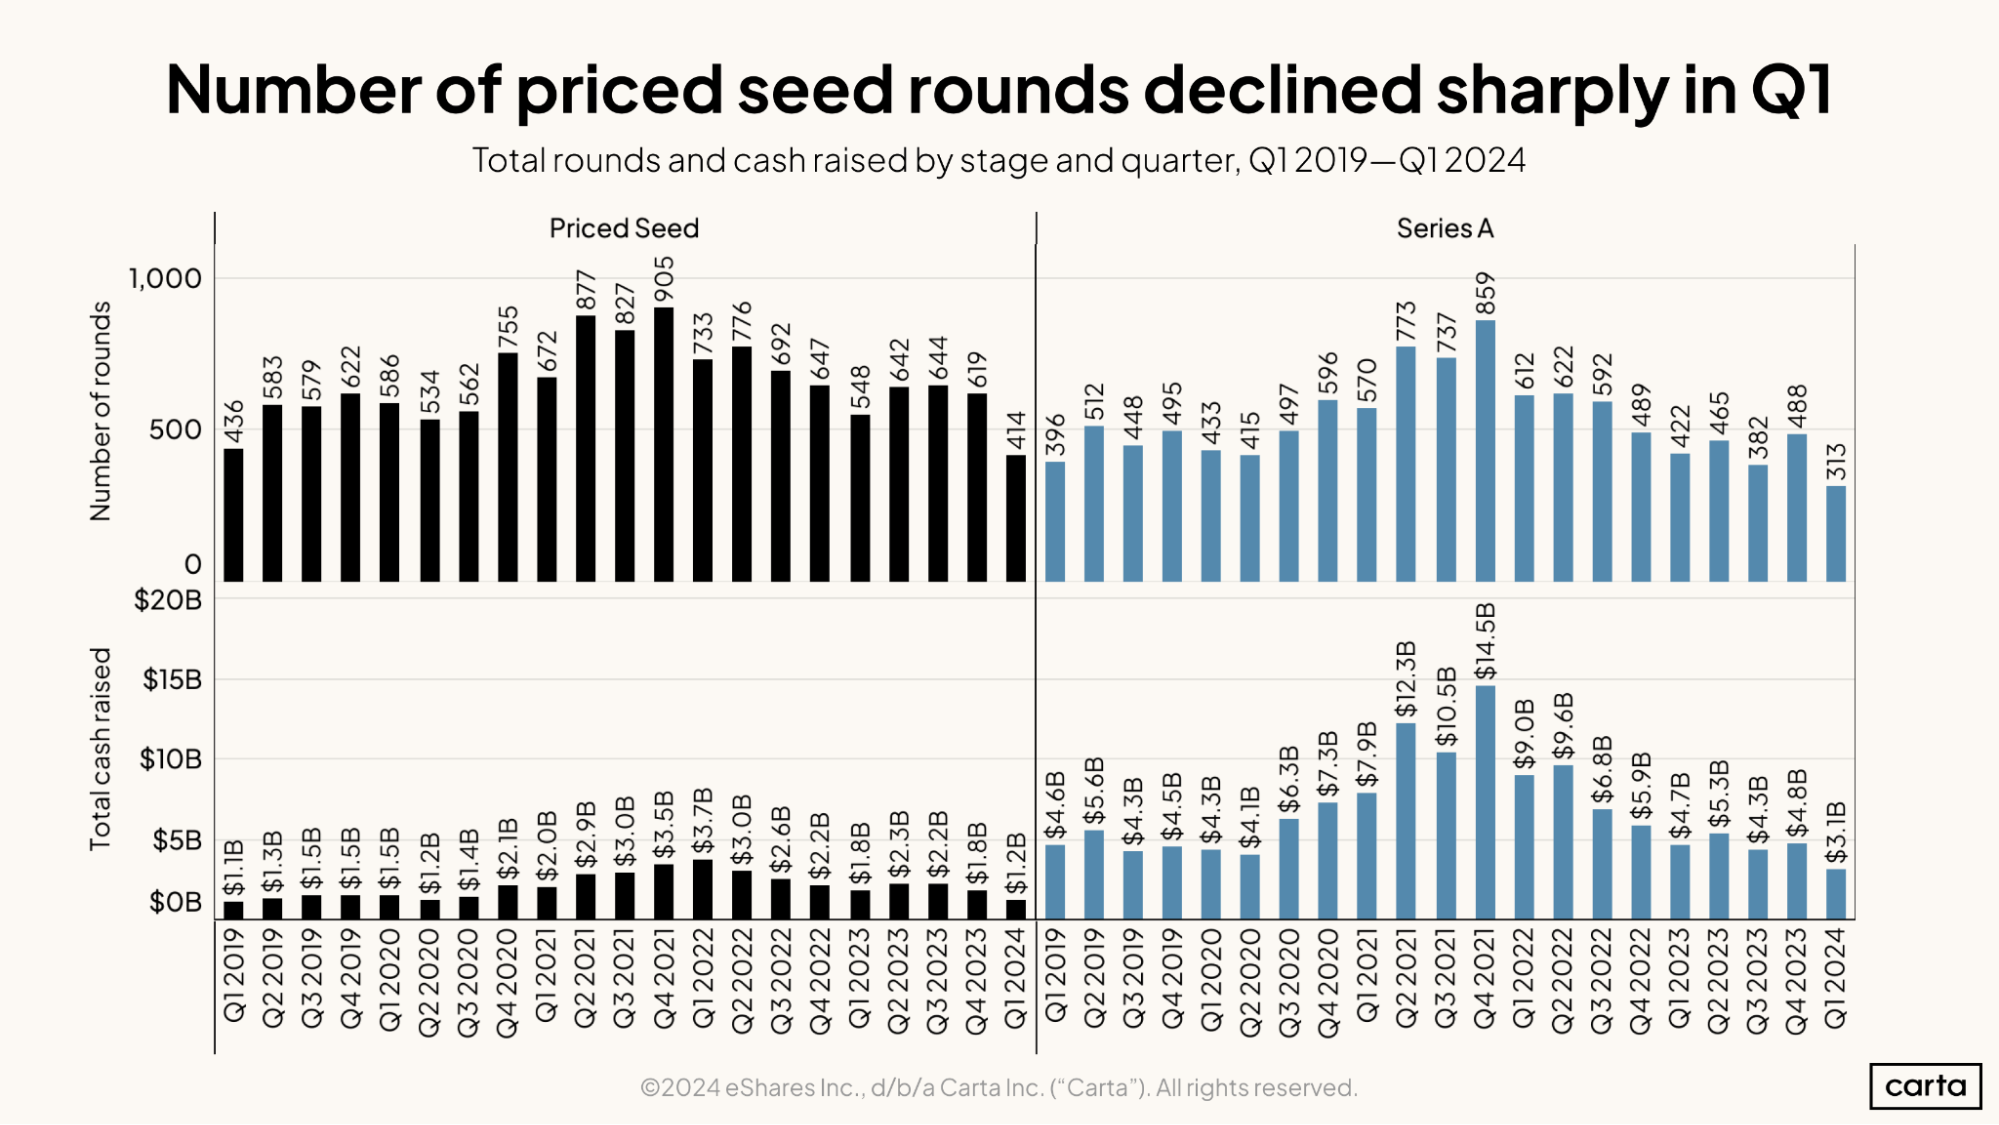
For early-stage investors, Q1 was the slowest quarter in many years. Seed deal count fell to 414, down 33% from Q4 2023, and Series A deal count dropped to 313, a 36% decline. In both cases, those are the lowest quarterly deal counts since at least the start of 2019.
Total cash raised also declined at both stages in Q1. The $3.1 billion in Series A cash raised in Q1 represents a 35% decline quarter-over-quarter and a 34% dip year-over-year. Cash raised at the seed stage declined by 33% both quarter over quarter and year over year.
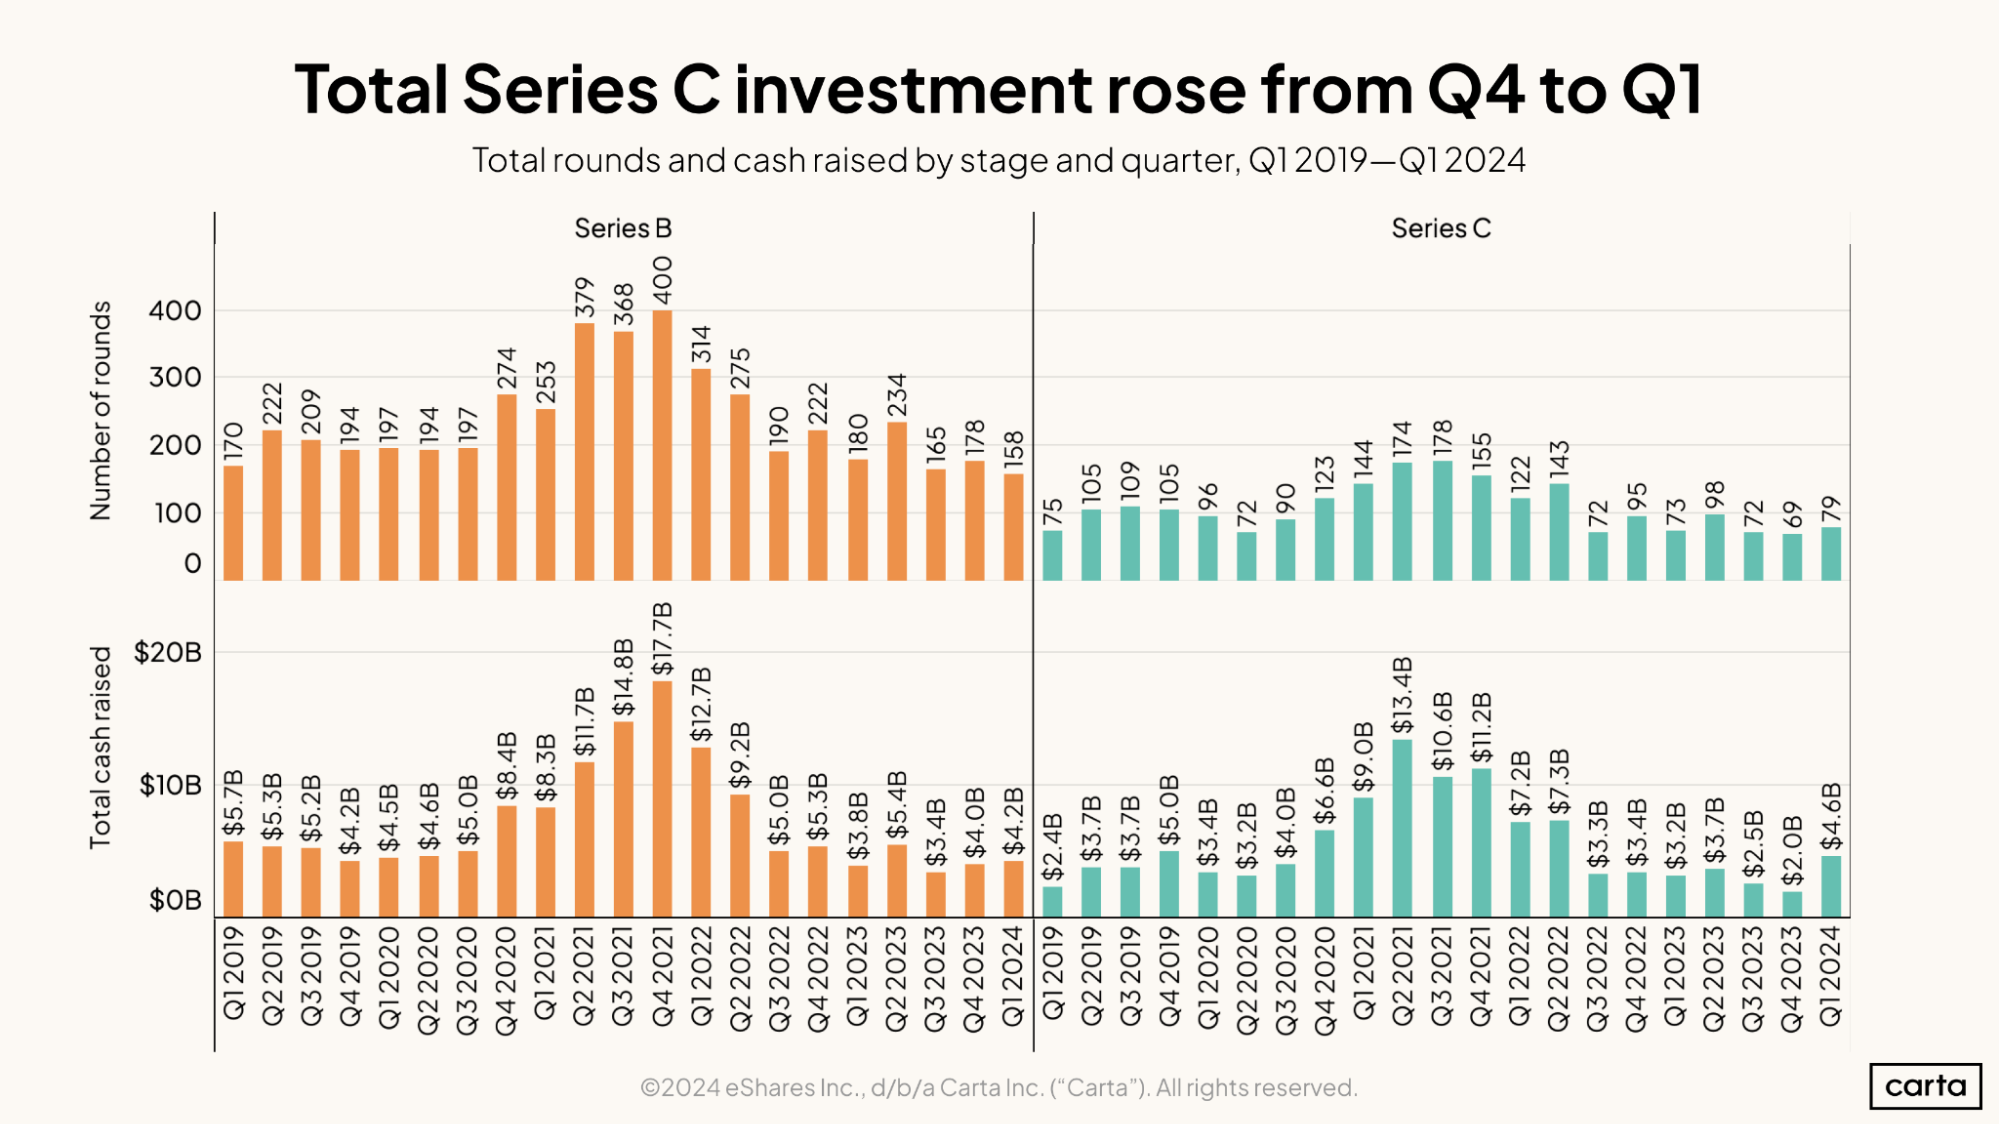
It was a much friendlier fundraising quarter for companies in the middle stages of the startup lifecycle. The number of Series B deals in Q1 declined by a more modest 11% compared to the prior quarter. And Series C deal count increased by 14%, marking the busiest quarter for that stage since Q2 2023.
Total cash raised also rose significantly at Series C in Q1, hitting $4.6 billion. That’s a 130% increase quarter-over-quarter and a 44% bump year-over-year. At Series B, total cash raised has now increased in consecutive quarters.
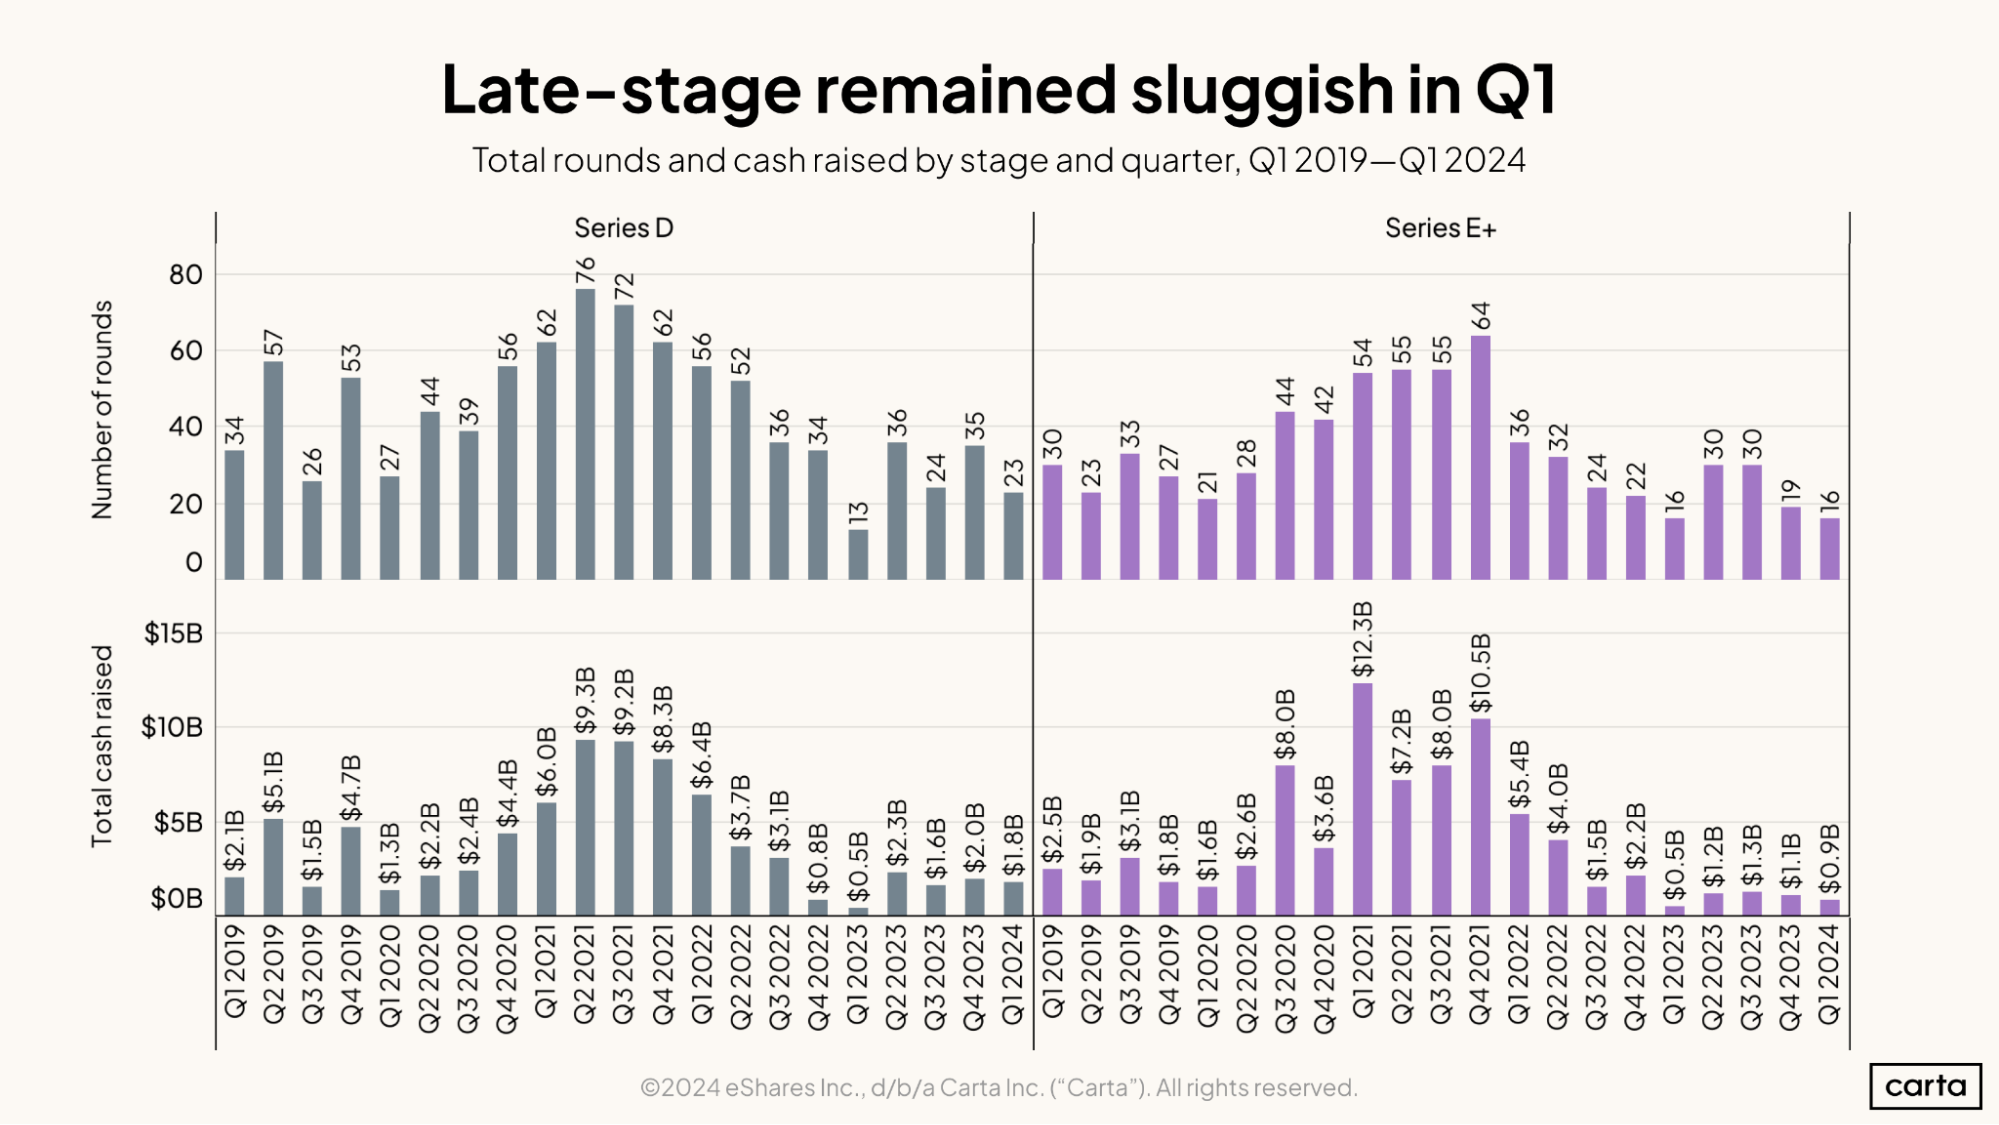
Compared to earlier stages, transactions at the Series D and at Series E+ remain few and far between. There were just 39 venture rounds combined in Q1 among startups at Series D or later, the second-fewest of any quarter in the past five years. The lowest count came one year ago, in Q1 2023, when there were just 29 combined late-stage deals. Total cash raised across these stages has been mostly consistent over the past few quarters. There’s been more variation in average round size. The average Series D round in Q1 was about $77 million, compared to $56 million in Q4 2023.
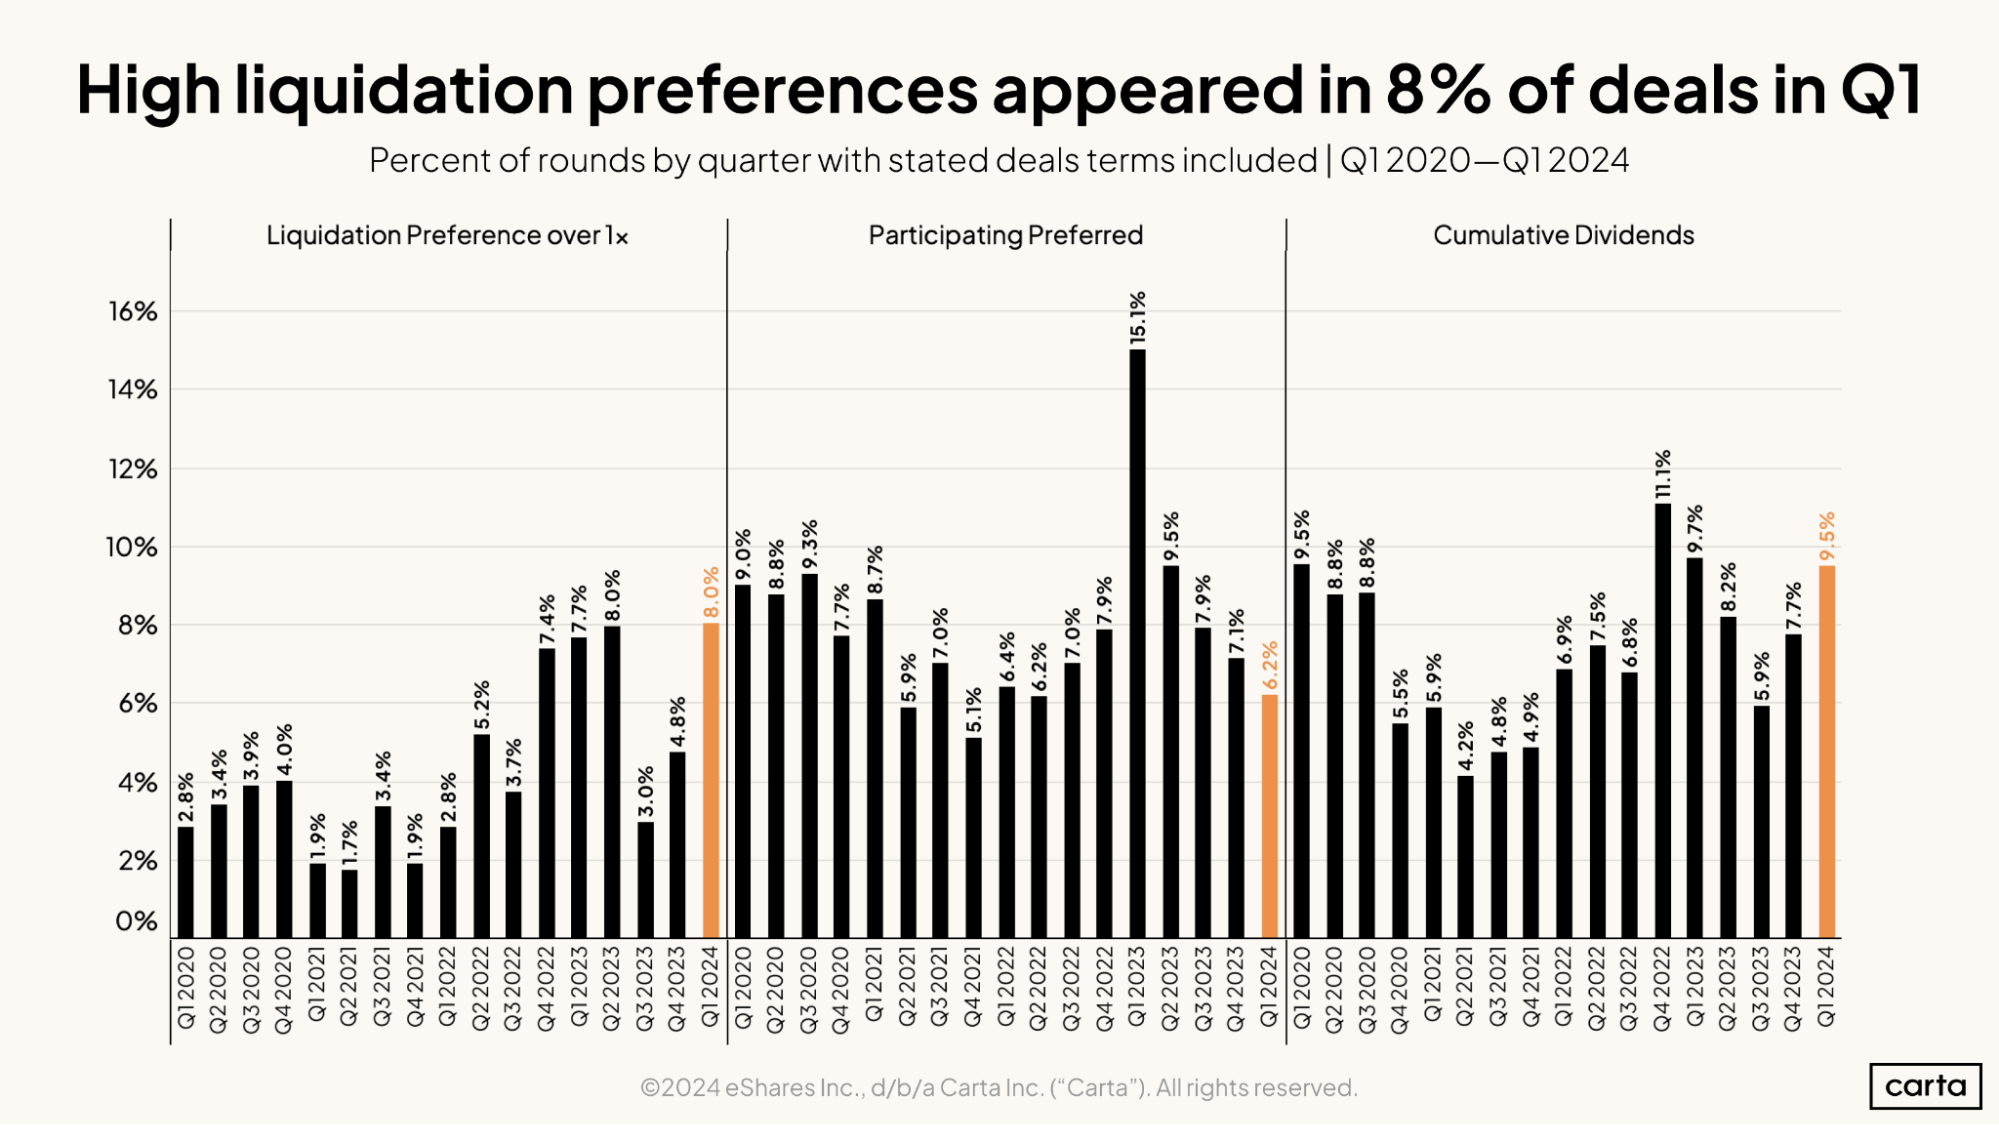
The rate of new venture rounds involving liquidation preference multipliers and cumulative dividends both increased in Q1, with the 8% rate for liquidation preferences over 1x tying a recent high. These sorts of structured deal terms are designed to provide downside protection for investors and increase the likelihood of a positive return. When these terms become more common, it’s typically a sign that investors have more leverage in deal negotiations. These structured terms had all become much more frequent in late 2022 and early 2023, only for them to grow less frequent in the past two quarters. In Q1, the trend shifted again.
Fundraising & valuations
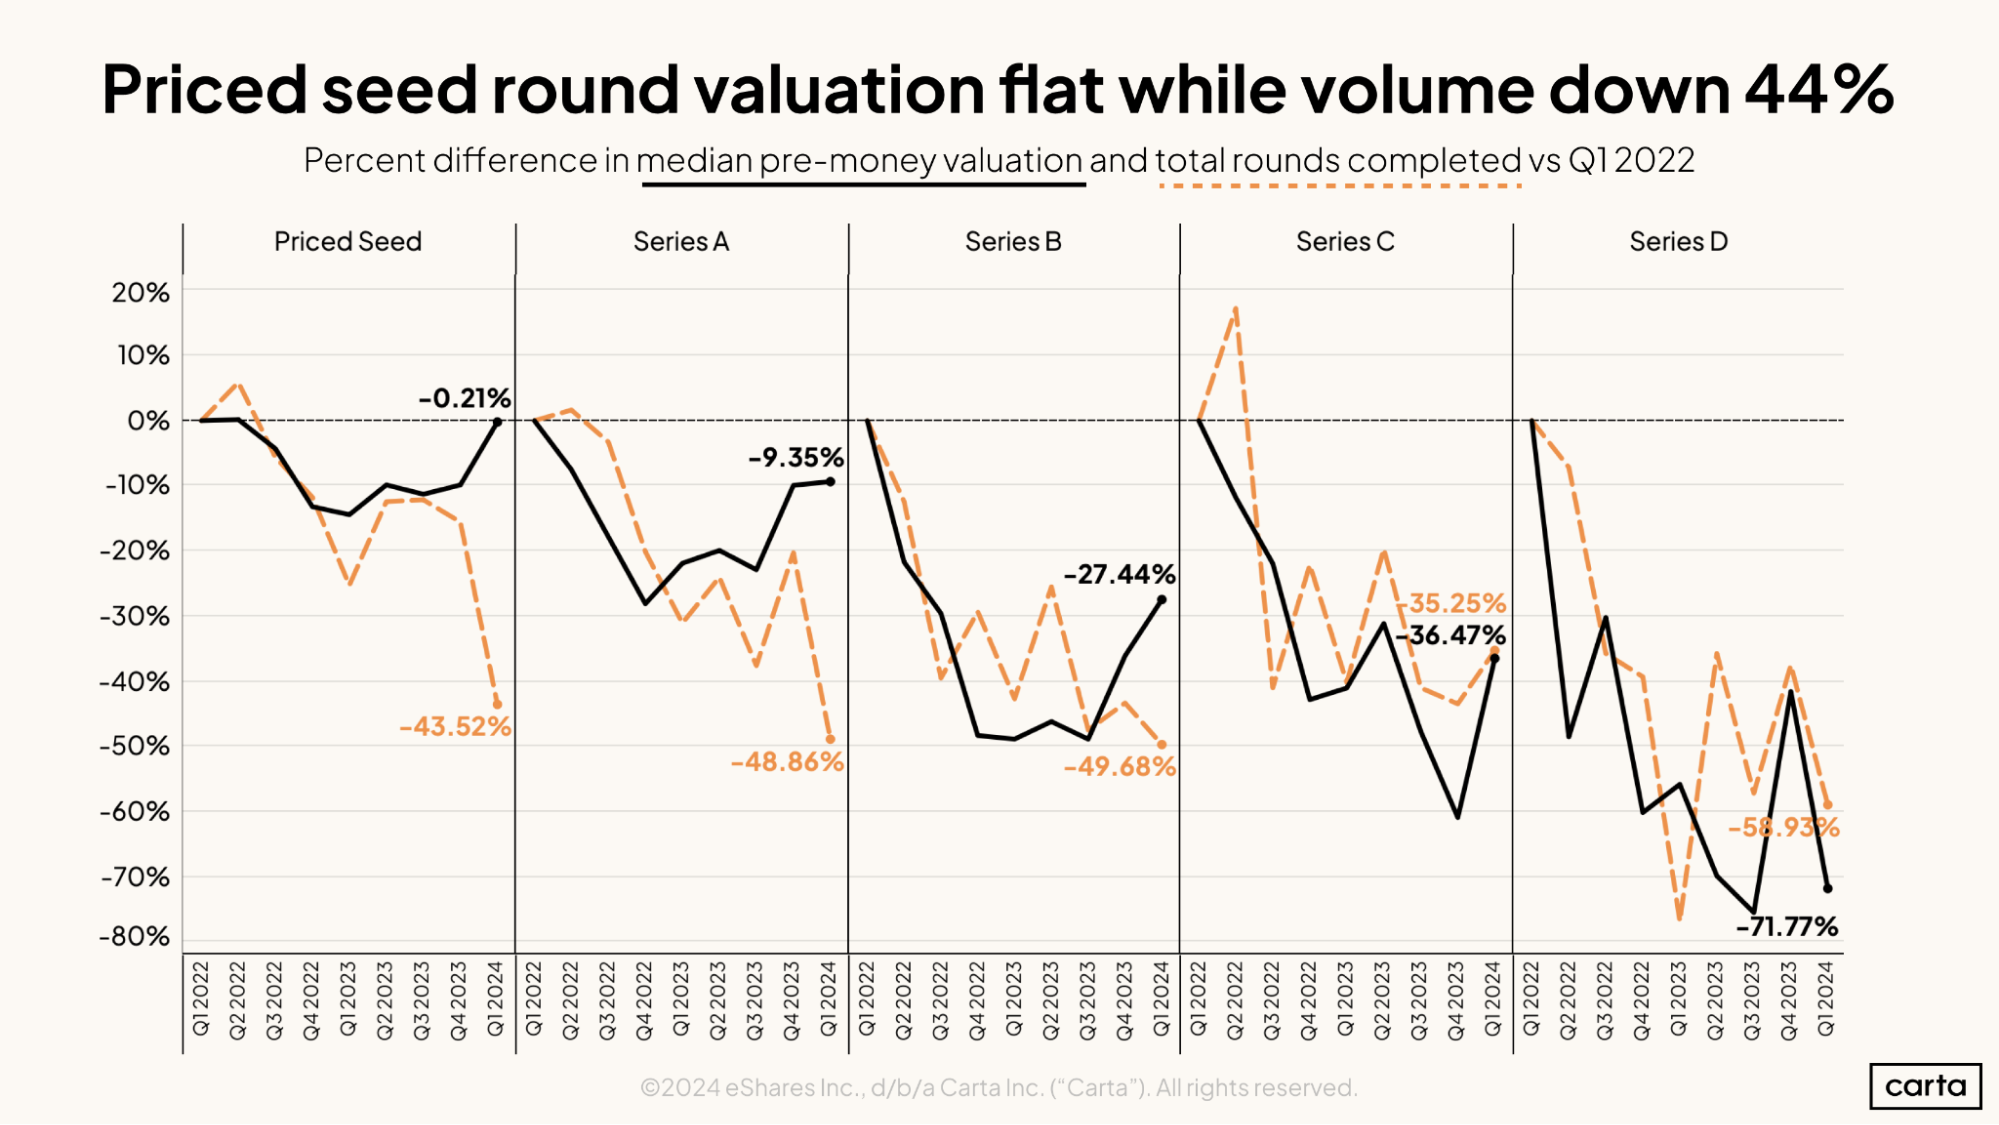
At the seed stage, Series A, and Series B, median valuations have been much more resilient than deal count over the past two-plus years. At seed, for instance, the median pre-money valuation declined just 0.2% between Q1 2022 and Q1 2024, while deal count fell by 43.5% over the same span.
At the later stages, however, the trend is reversed: At Series C and Series D, round counts have been more resilient than valuations. The median Series D valuation dropped by 71.8% from Q1 2022 to Q1 2024, compared to a 58.9% decline for Series D deal count.
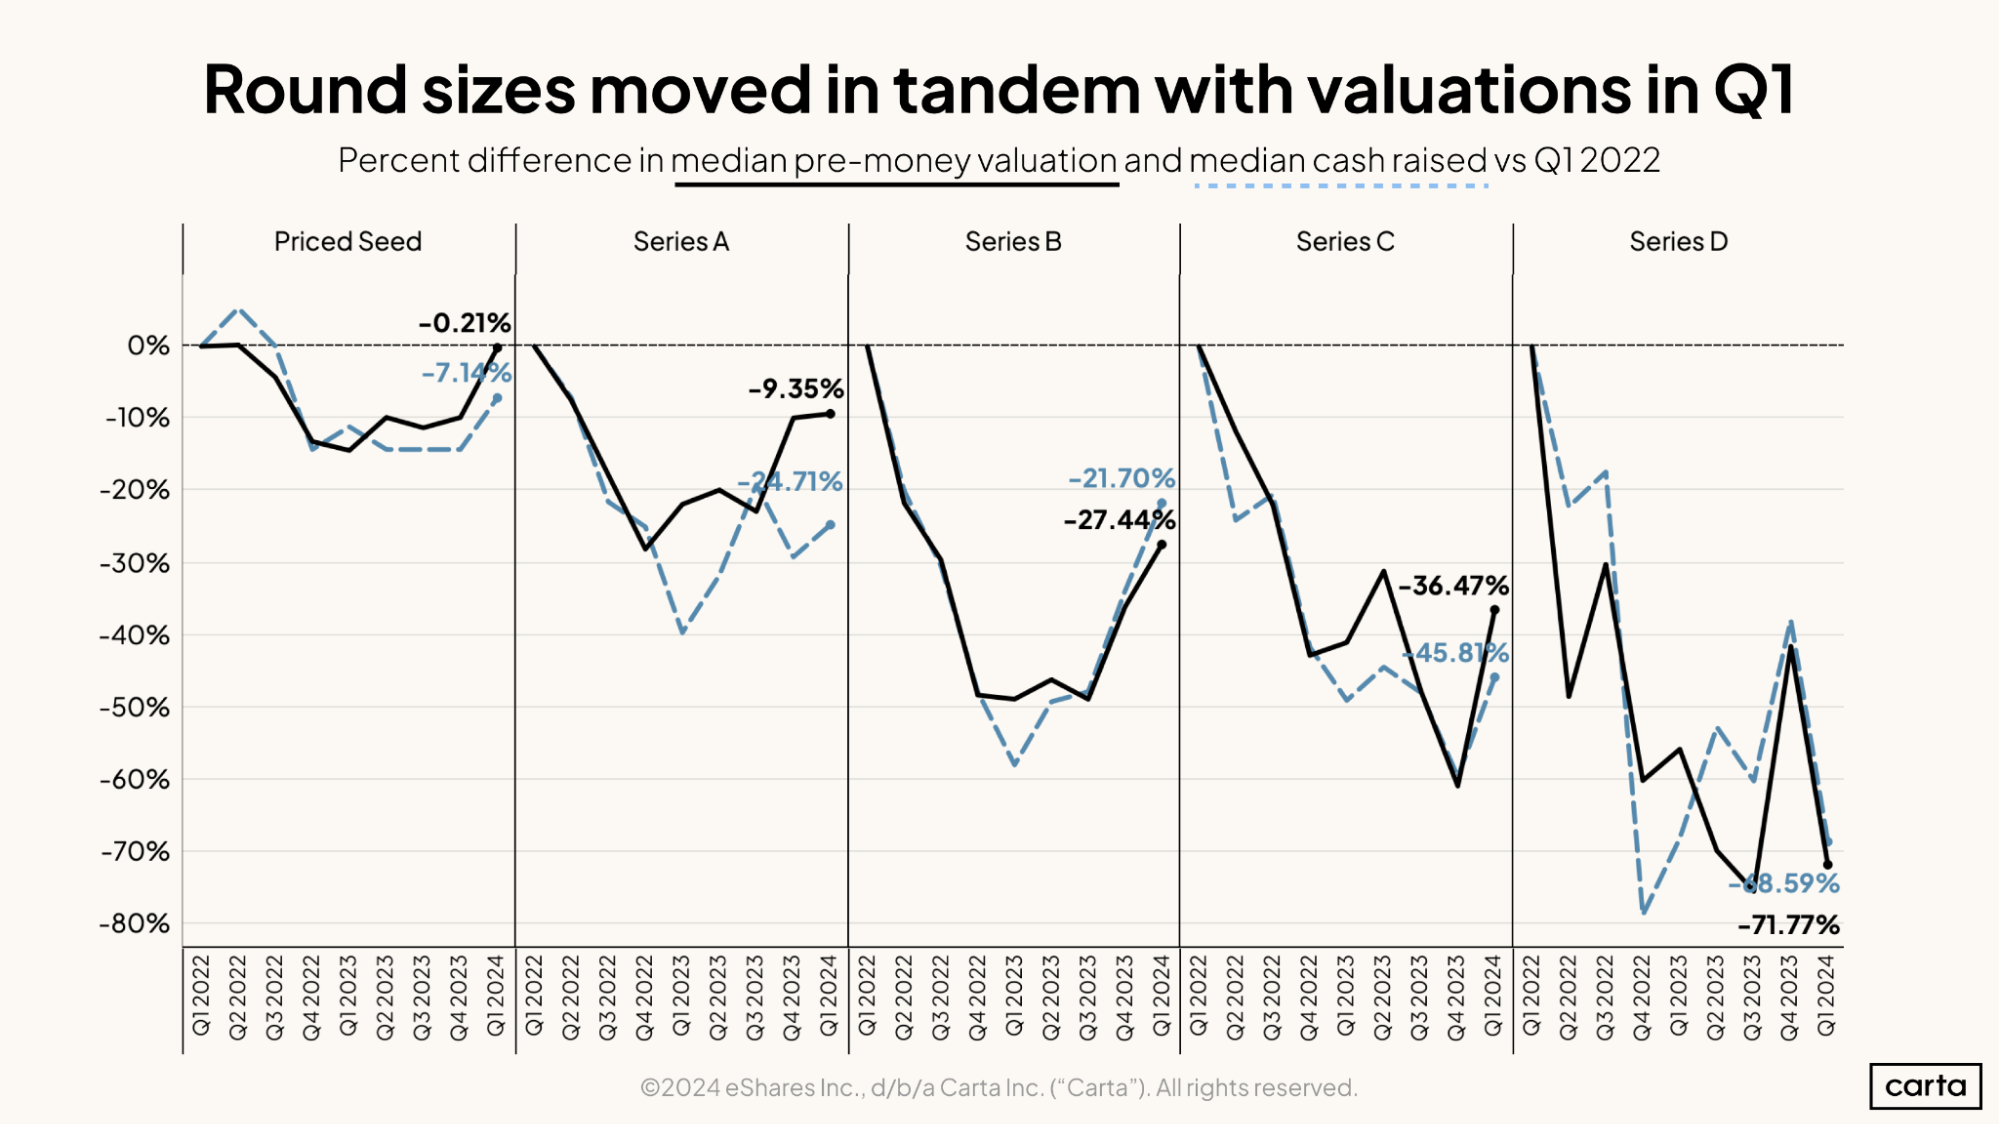
Over the past two-plus years, median valuations have mostly moved in tandem with median cash raised. At the seed stage, the median valuation was down 0.2% from Q1 2022 to Q1 2024, and median cash raised was down 7.1%. The gap was even closer at Series D, where the median valuations fell by 71.8% over that span and median cash raised decreased by 68.6%.
The scale of the decline in median valuation since the start of 2022 also correlates with the venture timeline: The later the stage, the larger the decline. The same is true of cash raised, with one exception: Median round size has declined more at Series A than Series B.
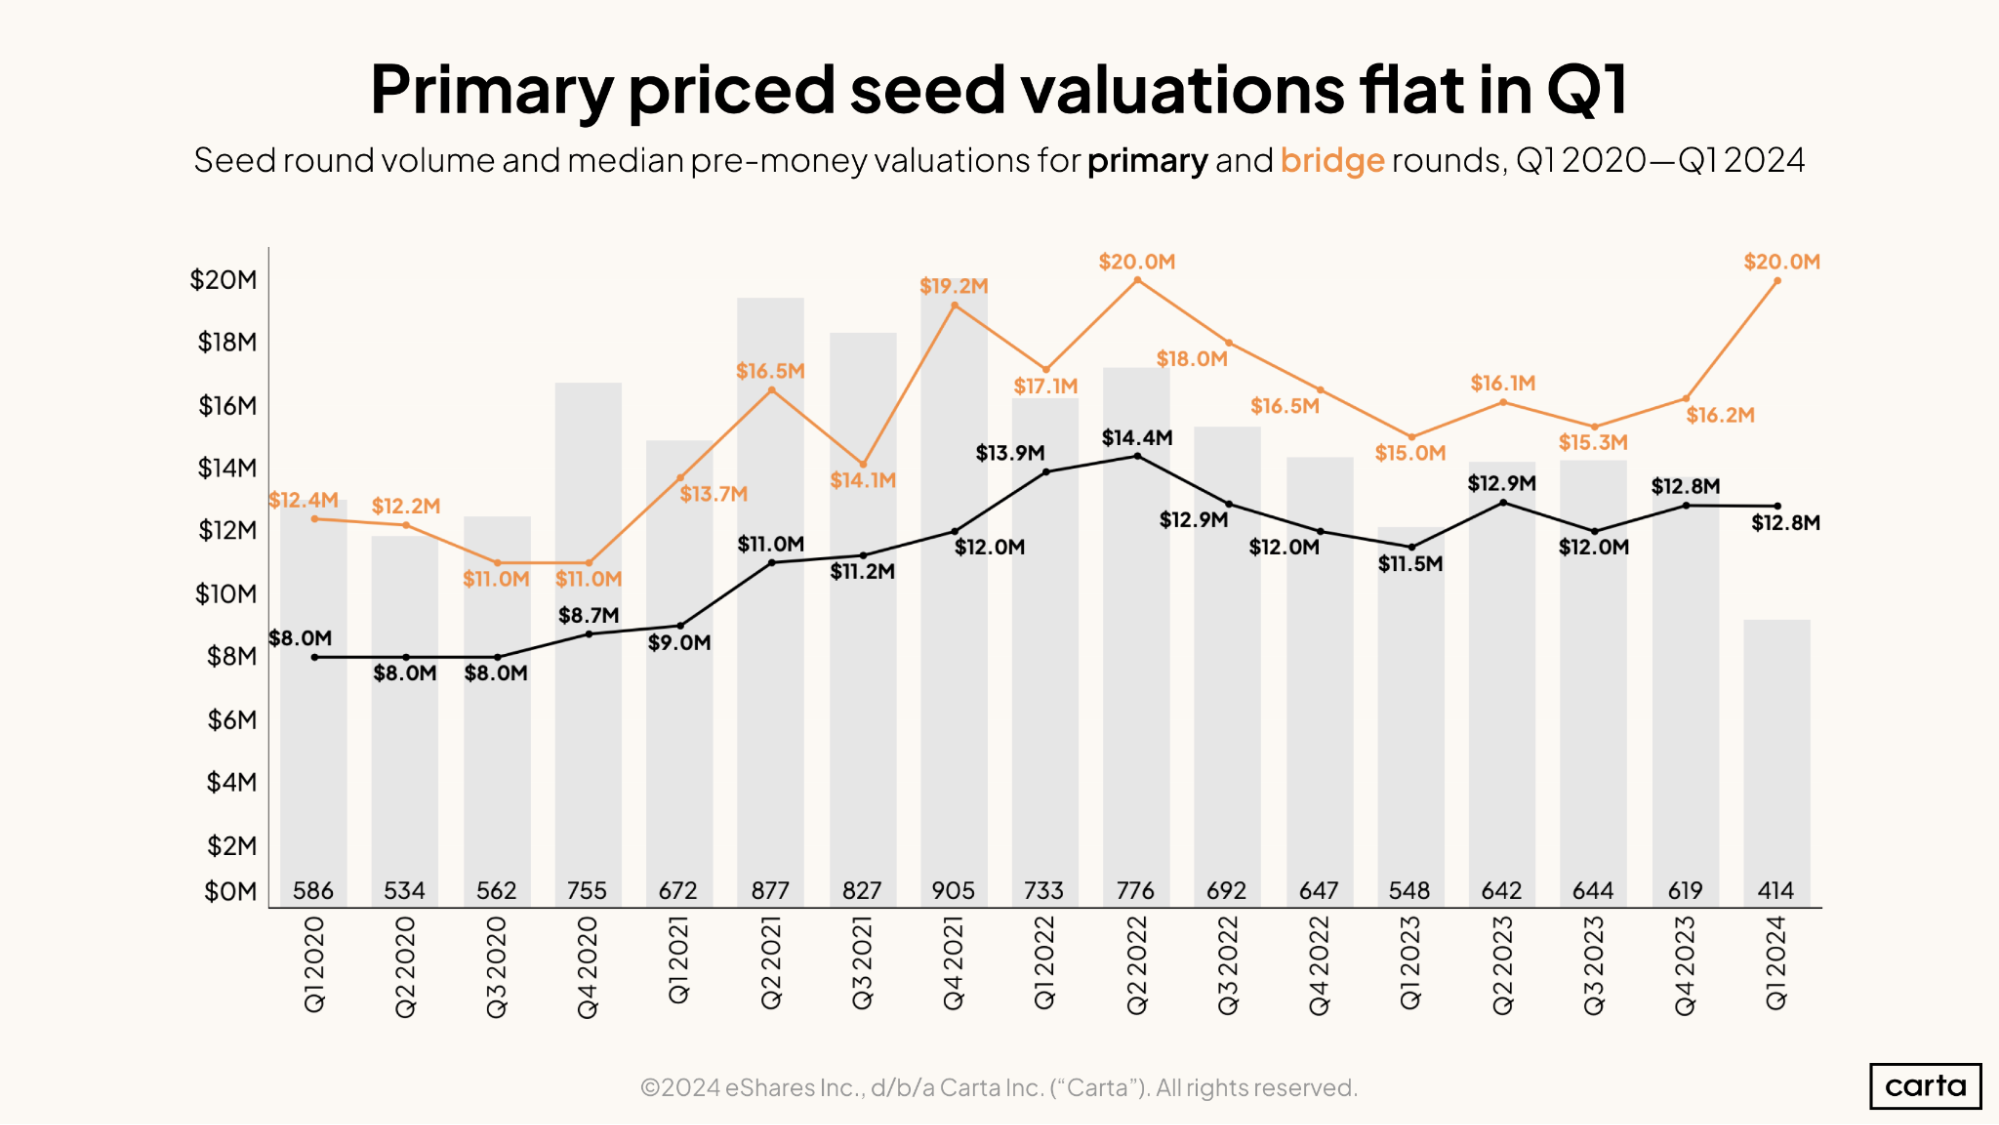
While the median valuation for primary seed valuations stayed flat in Q1, at $12.8 million, the median valuation on bridge rounds raised by seed-stage companies climbed to $20 million, tying its highest point since the start of 2020. This increase in bridge valuations was concurrent with an increase in the frequency of bridge rounds at the seed stage: About 42% of all rounds raised by seed-stage companies in Q1 were bridge deals (see below for more). The combination of more bridge rounds and higher bridge valuations suggests that an increasing number of mature seed-stage companies that are able to garner attractive valuations have been opting for bridge rounds rather than new priced rounds.
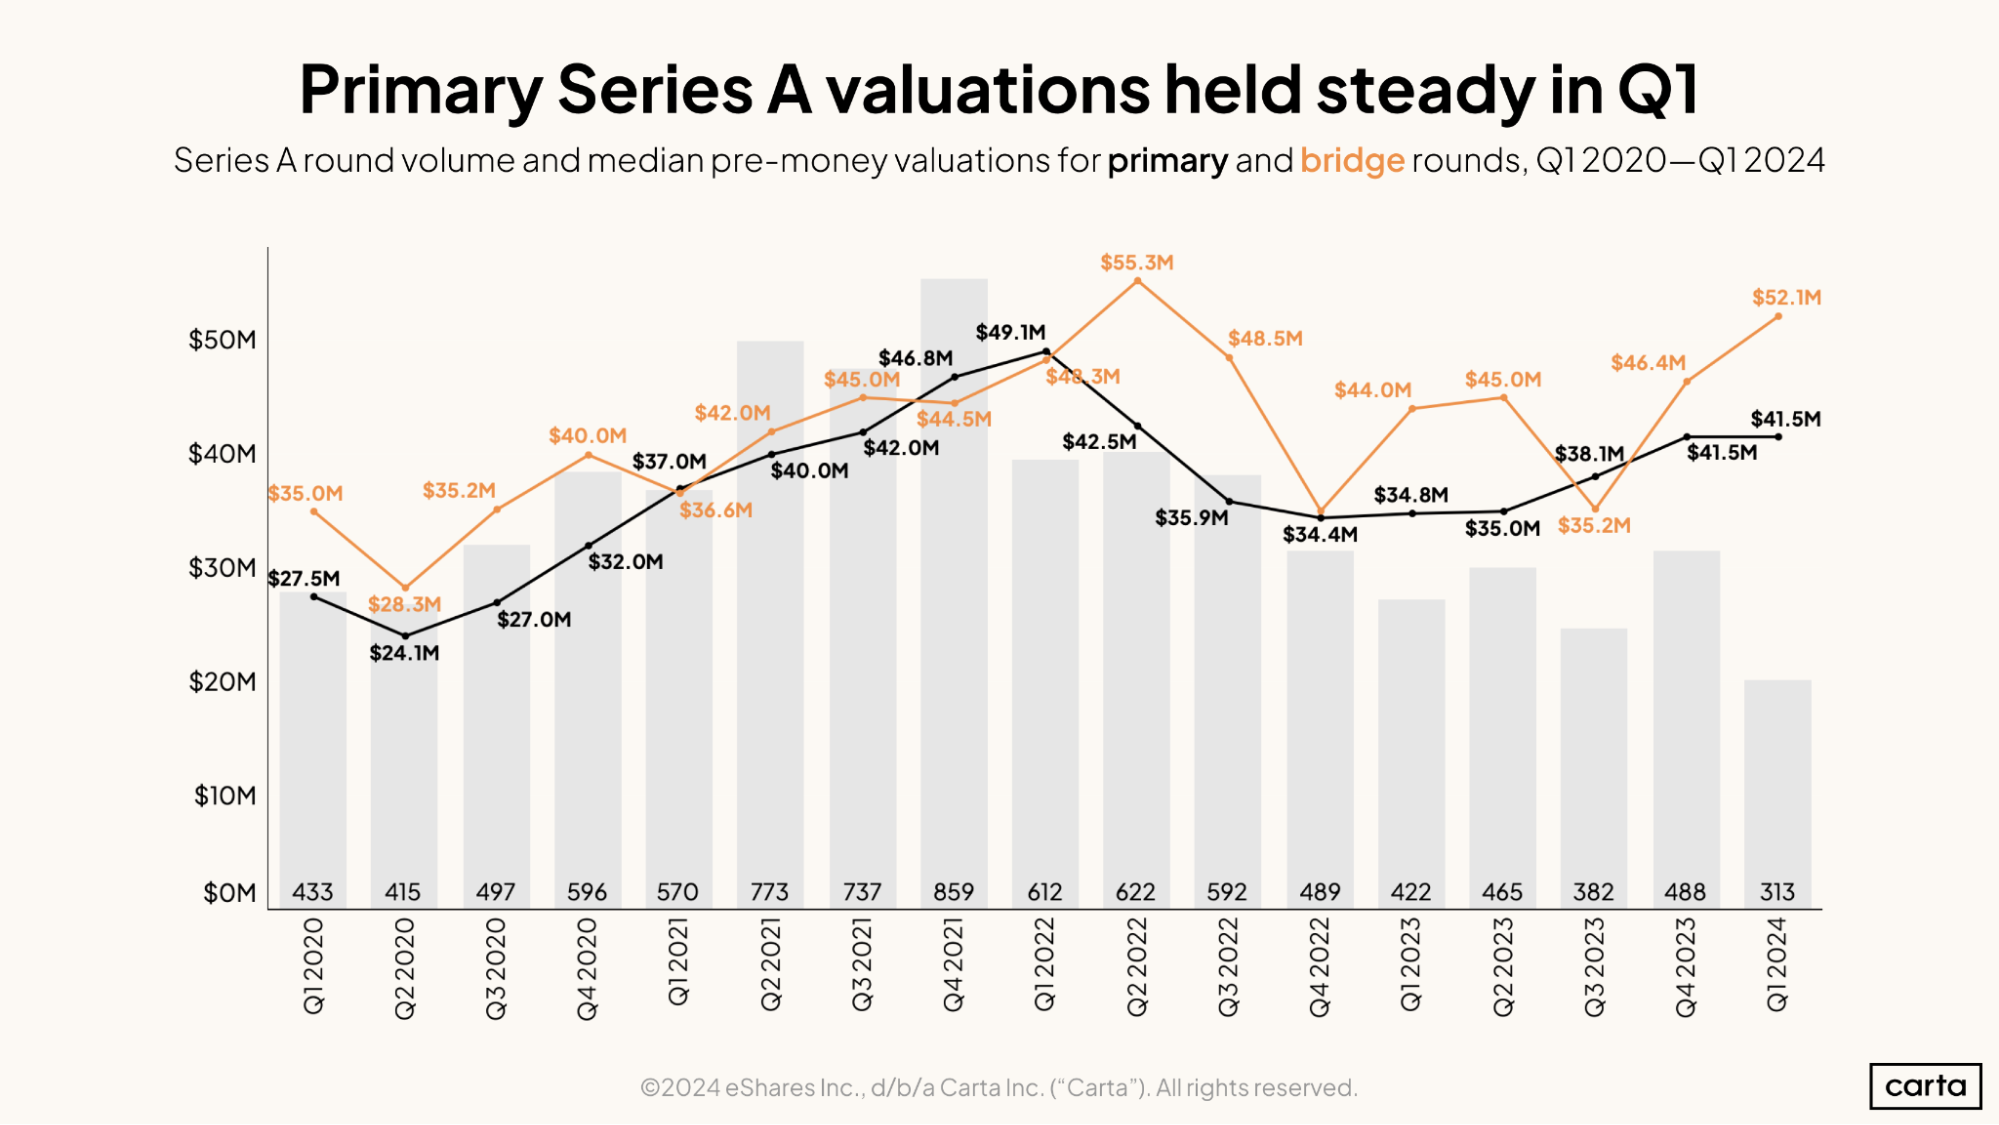
Just like at the seed stage, the median valuation on primary Series A rounds held steady in Q1, while the median Series A bridge valuation took a significant leap. Q1’s median Series A bridge valuation of $52.1 million was the second-highest figure so far this decade.
From Q1 2023 to Q1 2024, the number of Series A investments fell by 26%, while the median primary valuation increased by 19%. Fewer Series A rounds have been taking place, but those companies that are able to successfully raise have seen valuations rise.
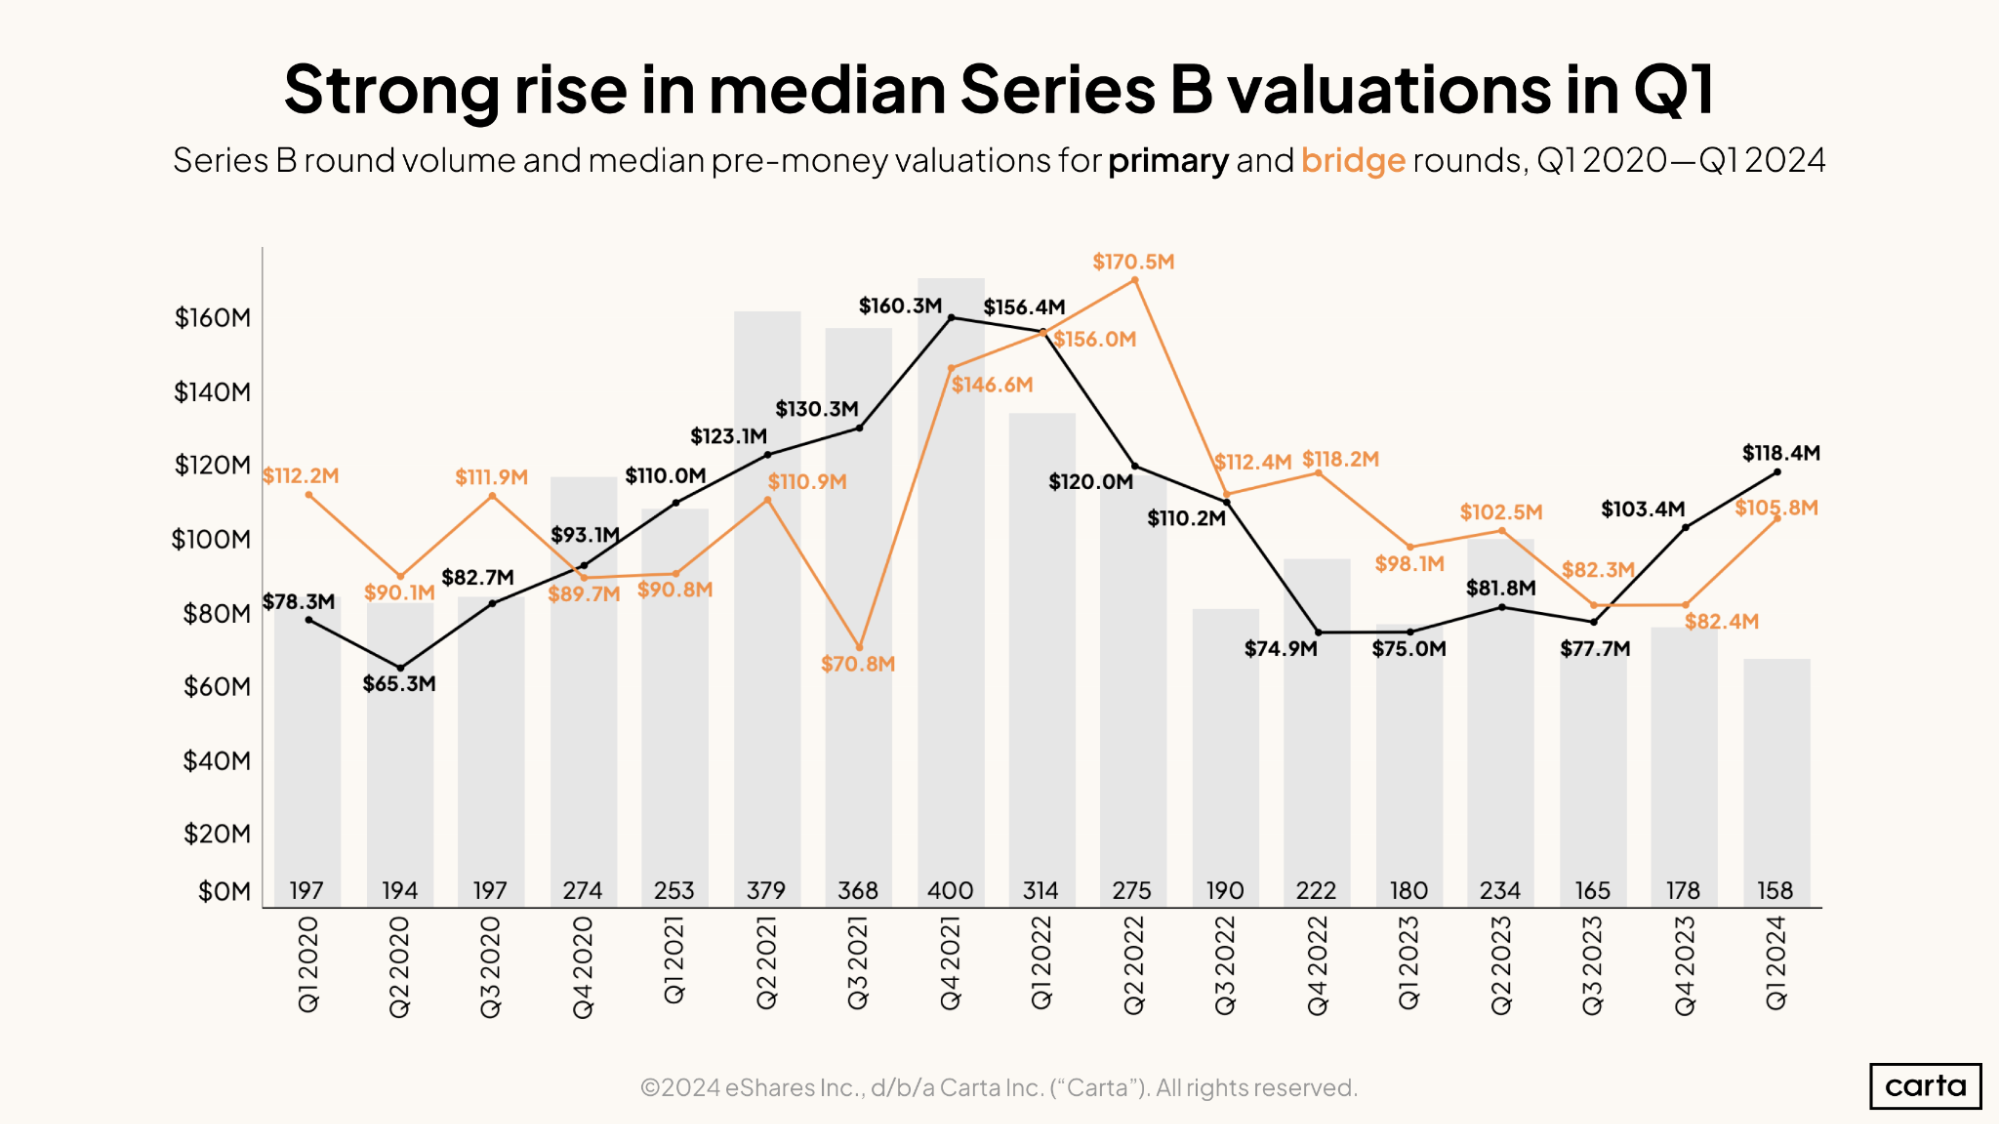
Series B valuations have bounced back in a major way over the past two quarters. The median valuation in primary Series B rounds jumped by 33% between Q3 and Q4, then rose another 15% in Q1. All told, the median primary valuation increased by 52% from Q3 to Q1, rising from $77.7 million to $118.4 million.
The median bridge valuation at Series B was also on the rise in Q1, climbing to $105.8 million, up 28% from the previous quarter. In terms of percentage gain, that’s the largest increase in Series B bridge valuations in more than two years.
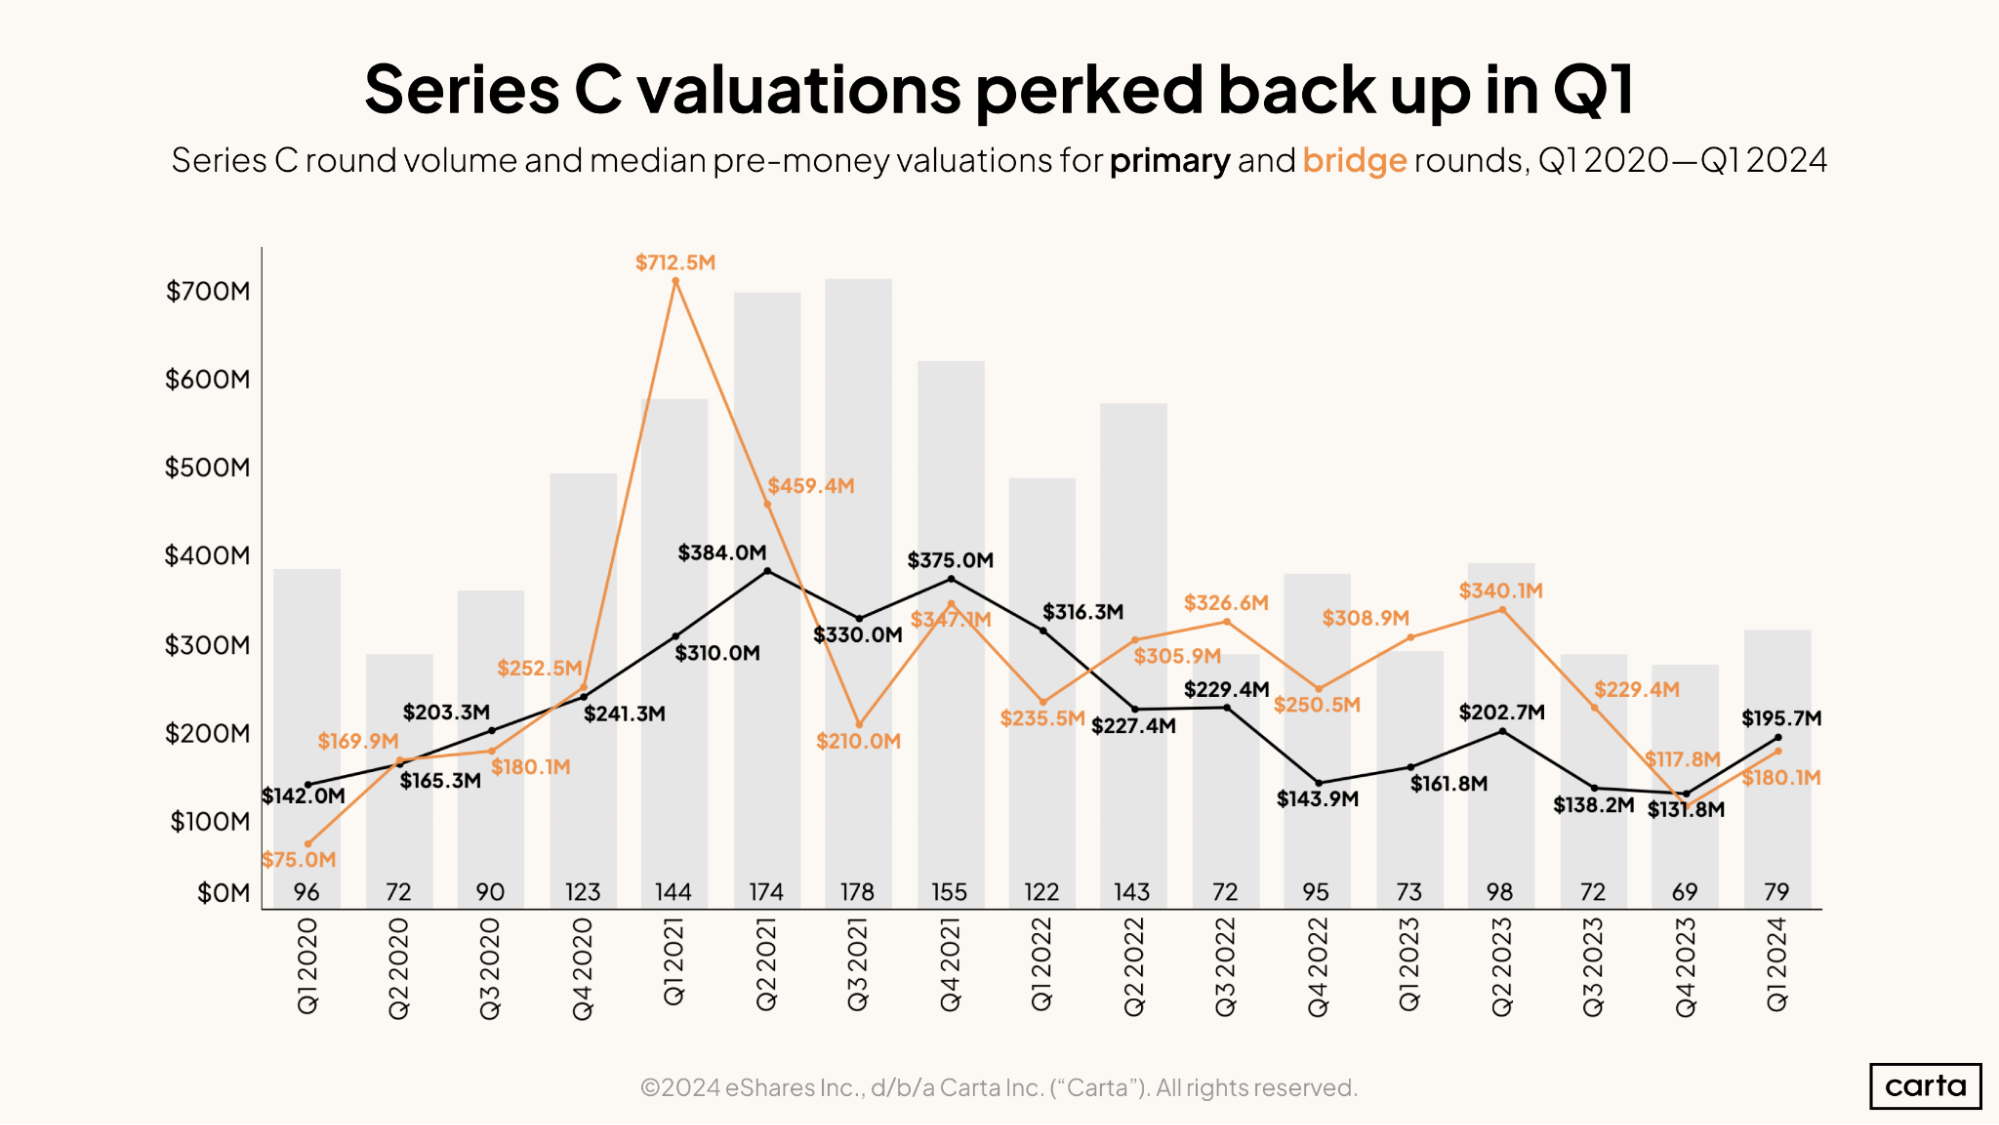
After sinking to a new recent low in Q4 2023, the median valuation for primary Series C rounds bounded back in a relatively big way in Q1, rising to $195.7 million. That’s up 48% from the prior quarter.
On a longer timeline, however, the current Series C market still looks a little chilly. Between Q3 2020 and Q3 2022, the median primary valuation at Series C was above $200 million for nine straight quarters. Now, it’s been below $200 million for five of the past six quarters.
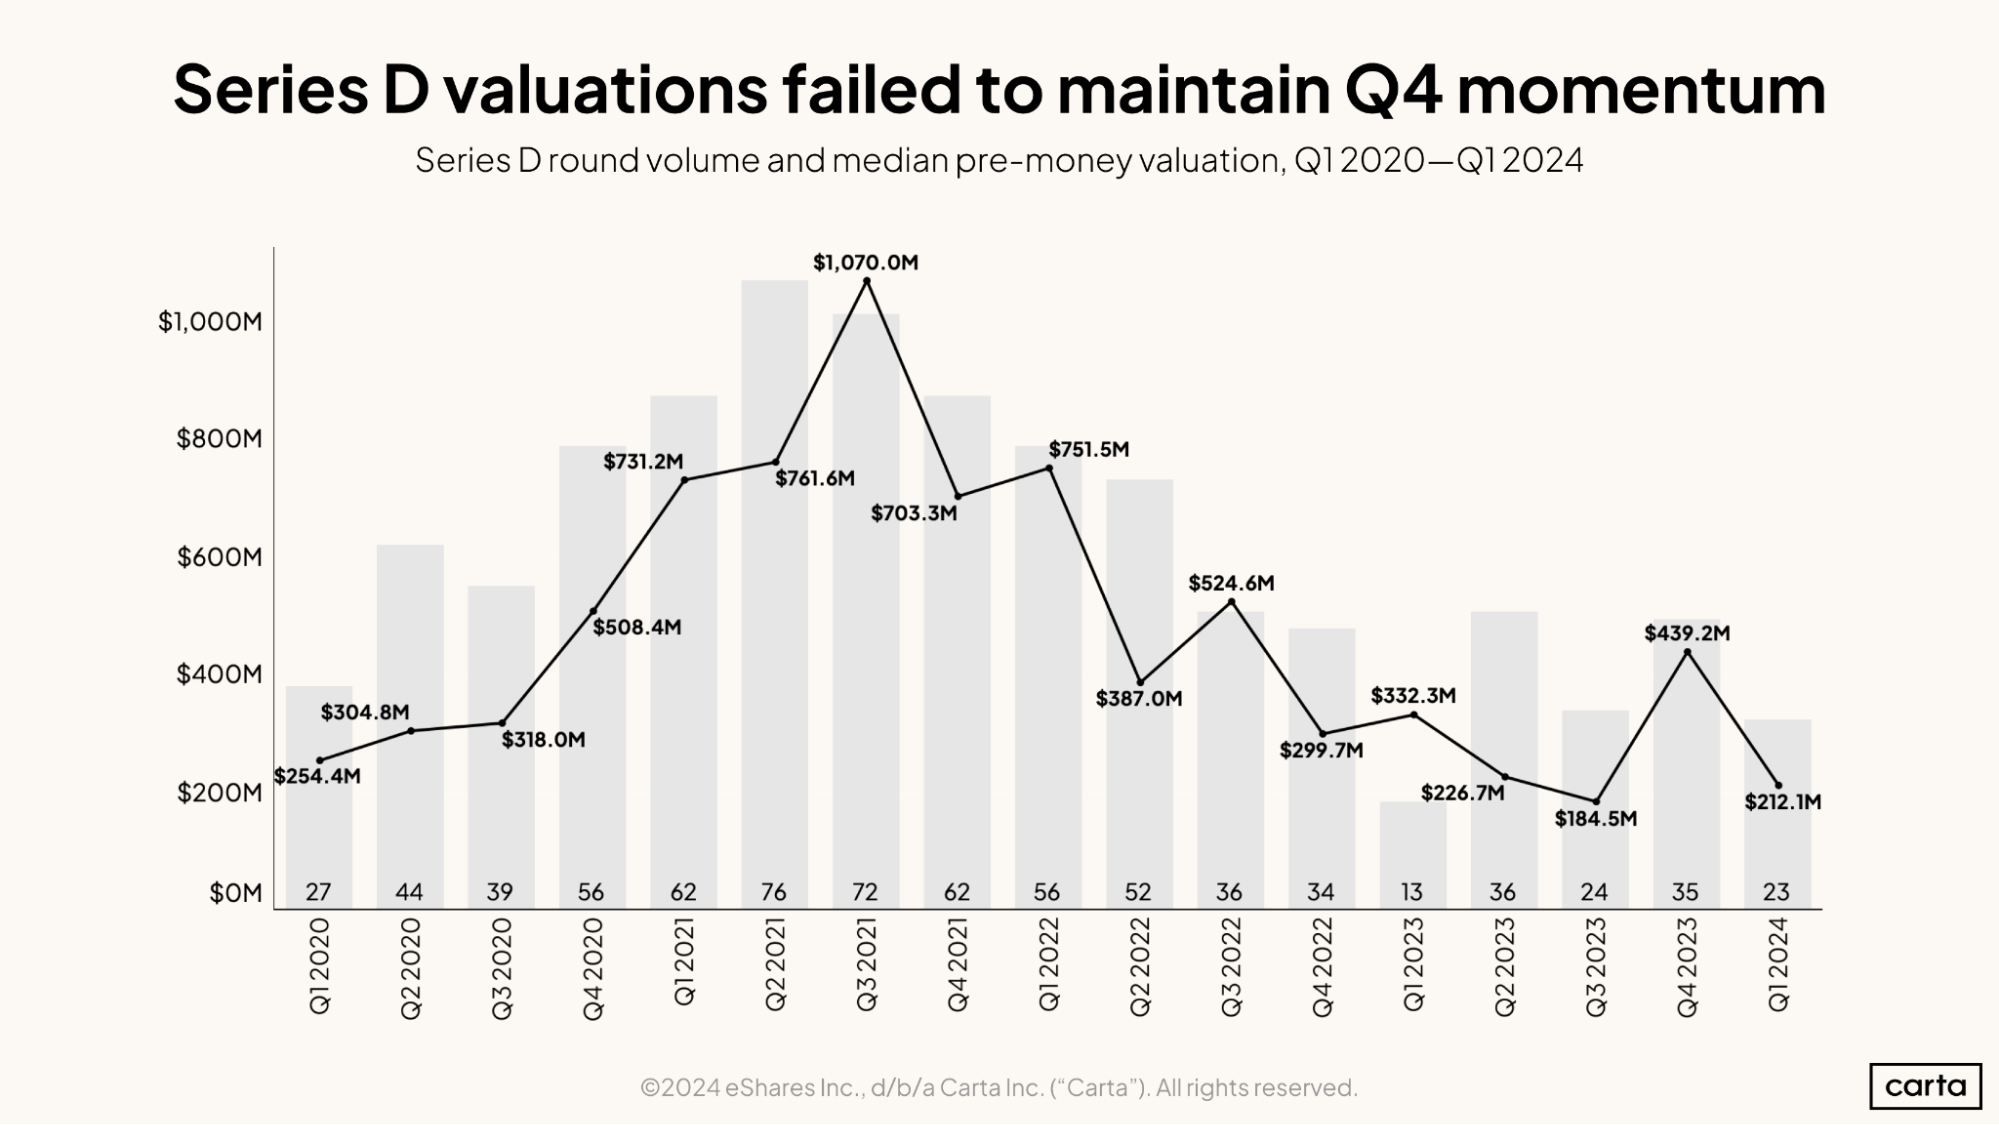
It was a sluggish quarter for Series D deals. The median valuation in Series D transactions fell by 52% in Q1 compared to Q4, while deal count dipped by 34%. The 23 total Series D transactions that took place on Carta in Q1 were the second-fewest in any quarter so far this decade. Still, it was a more active quarter than a year ago: Q1 2023 saw just 13 Series D deals, the lowest count of the 2020s. The median Series D valuation is down 36% year over year.
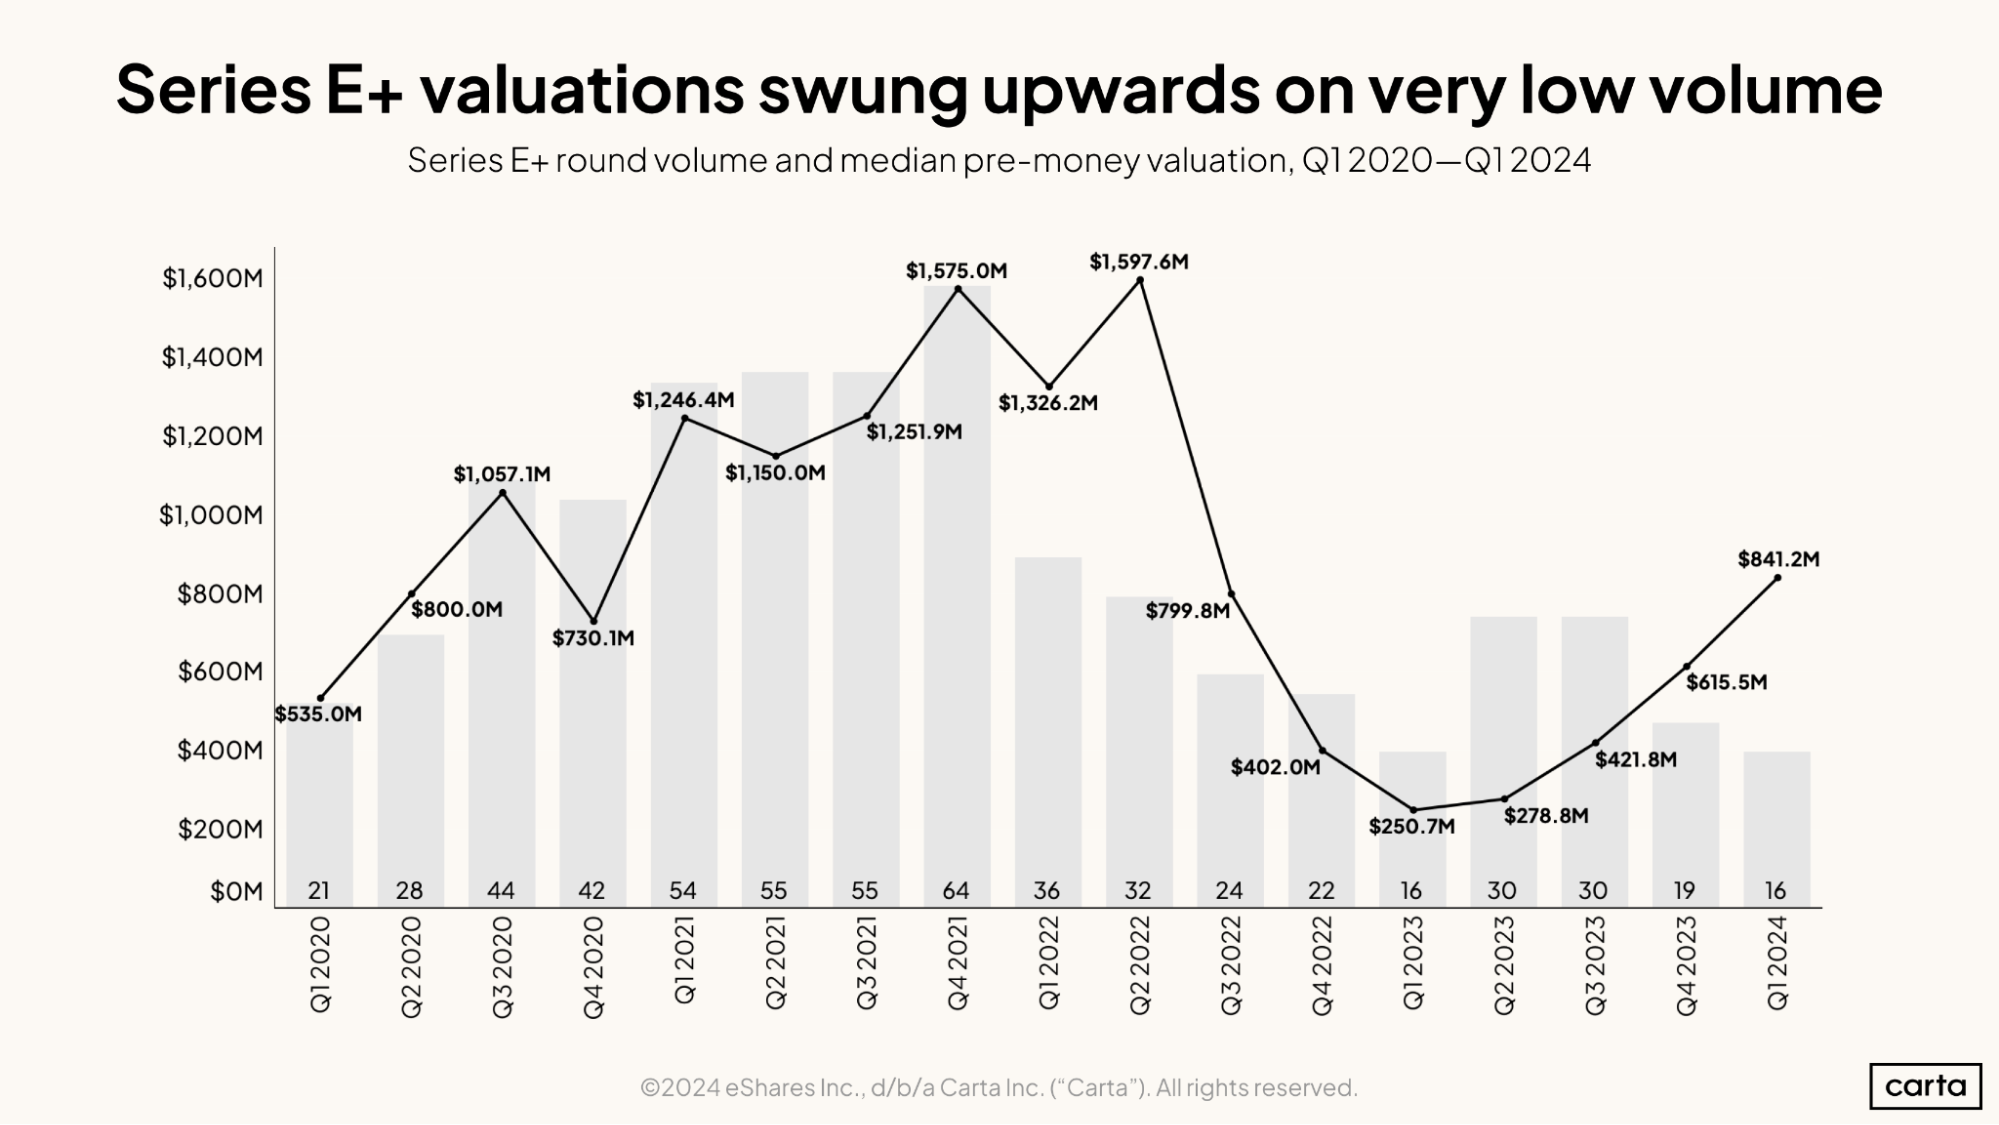
The median valuation in transactions at Series E and beyond has now increased in four consecutive quarters, rising to $841.2 million in Q1. That represents a 37% bump compared to the previous quarter and a whopping 236% increase on a year-over-year basis. The recent journey of valuations at Series E and beyond continues to follow a nearly parabolic curve.
However, Q1’s gains were based on a relatively small sample of deals: There were 16 transactions at Series E+ on Carta in Q1, tied with Q1 2023 for the fewest of any quarter in the past four years.
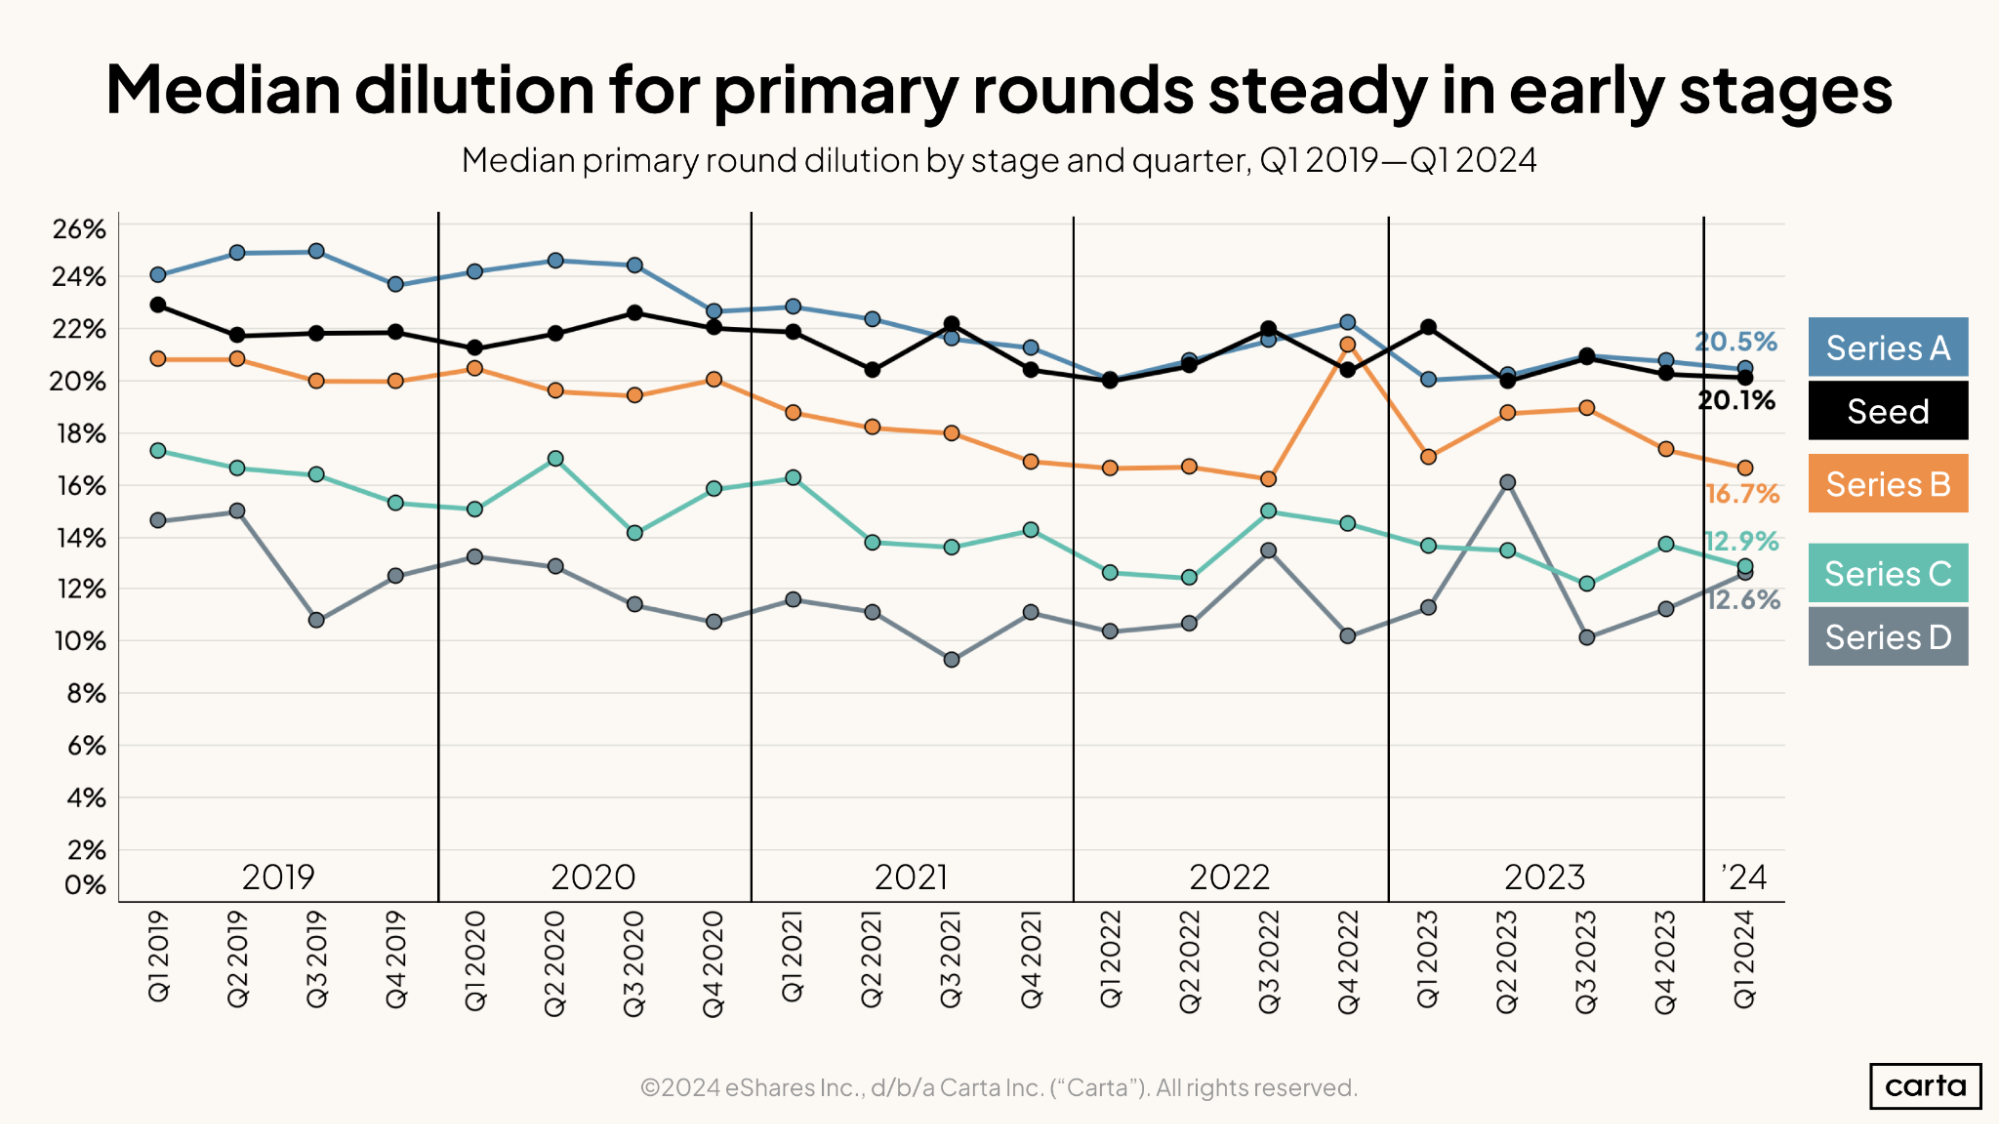
Median dilution in venture rounds declined in Q1 at every stage from seed to Series C. At both seed and Series A, however, the Q1 declines were slight: Median dilution dipped from 20.8% to 20.5% at seed and from 20.3% to 20.1% at Series A. When dilution is lower, it means that founders are selling off a smaller percentage of their company’s equity in new funding rounds.
The trend at Series D, meanwhile, is moving in the opposite direction, with back-to-back quarterly increases in median dilution. The Q1 figure for median dilution was nearly higher at Series D than at Series C, which has only happened once in the past five years.
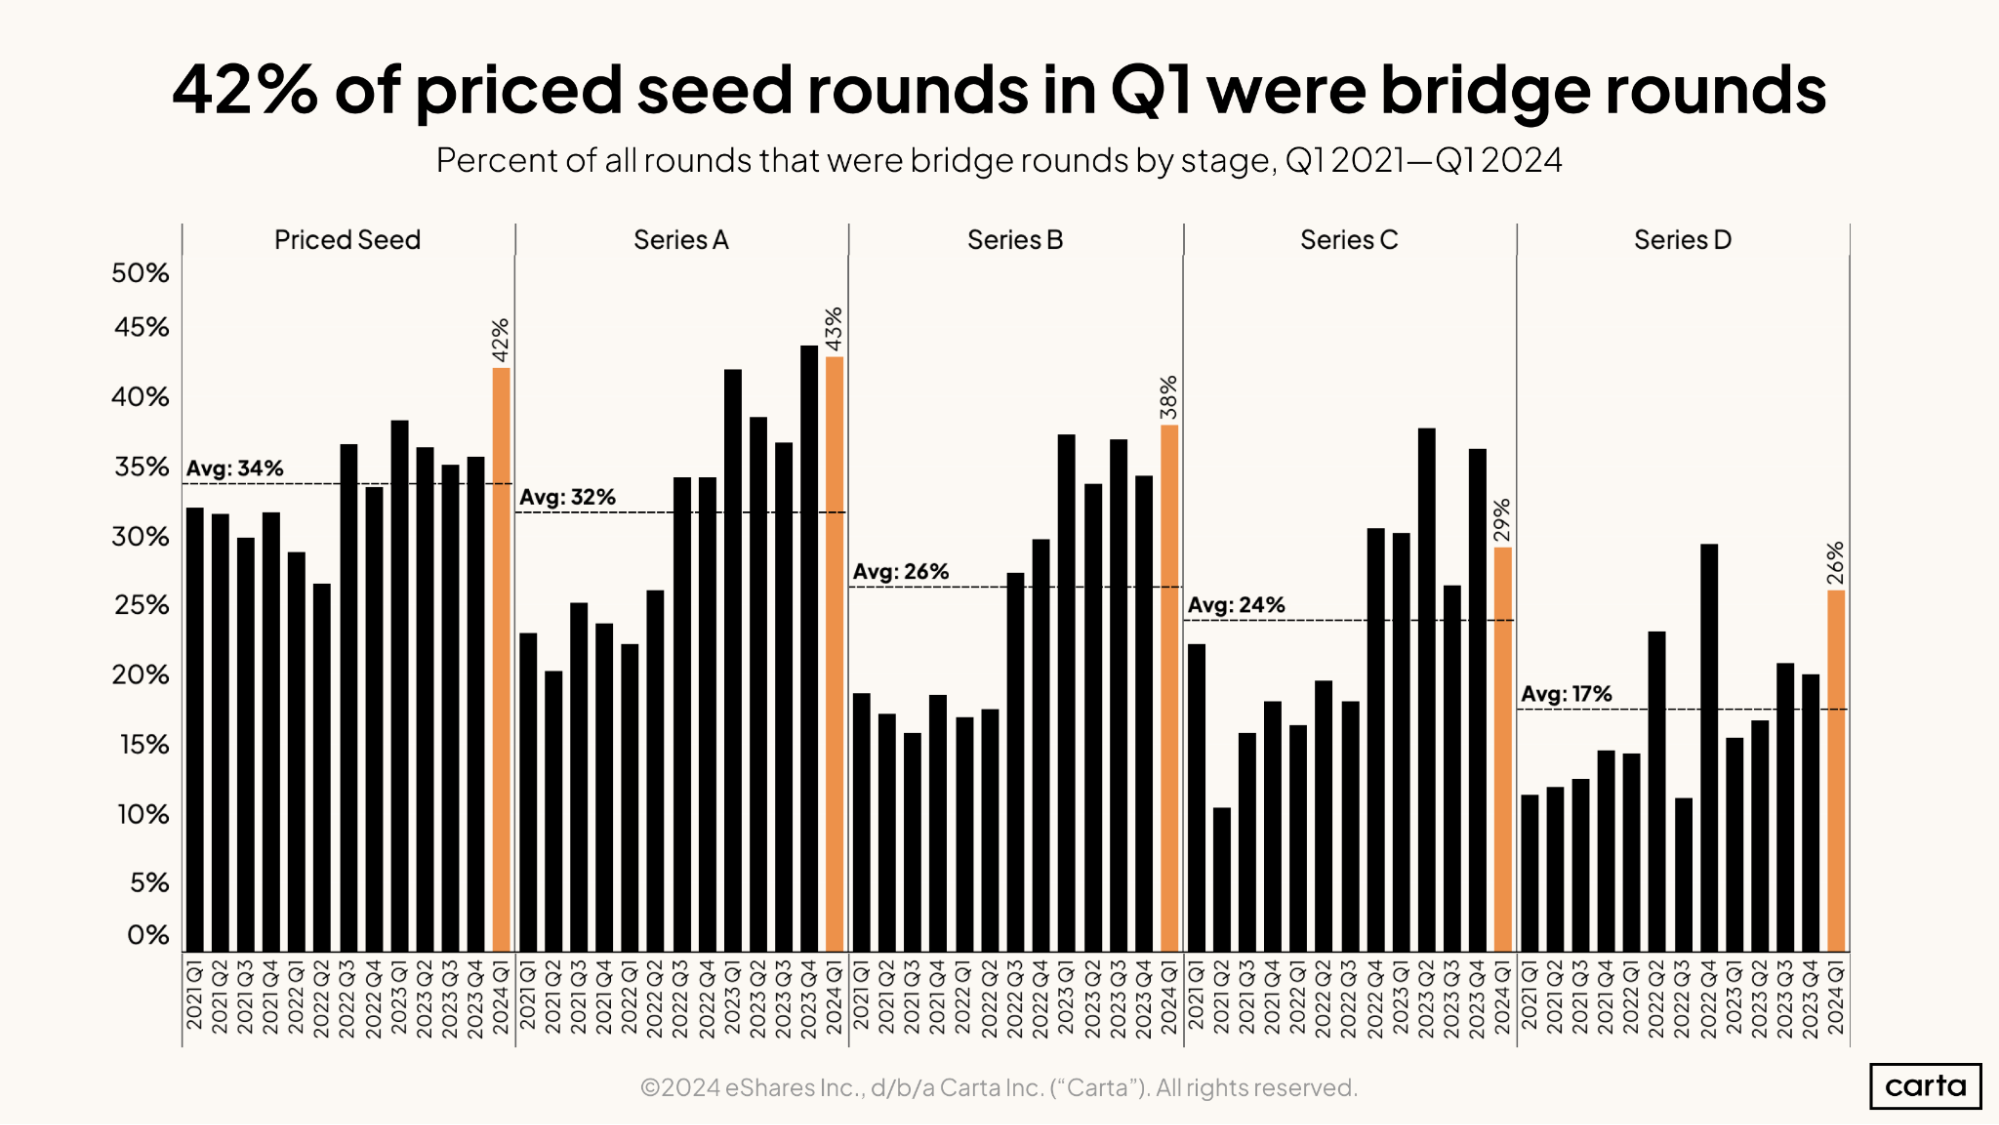
Bridge rounds remain a popular fundraising option for founders at every stage of the startup lifecycle. But they’re particularly popular at the early stages. In Q1, about 42% of all rounds raised by seed-stage companies were bridge rounds, the highest rate of the past few years. And 43% of Series A deals were bridge rounds, the second-highest rate since the start of 2021.
The frequency of bridge rounds also spiked at Series D in Q1, climbing to 26%. This increase in Series D bridge rounds could help explain the decrease in primary Series D rounds that also occurred in Q1.
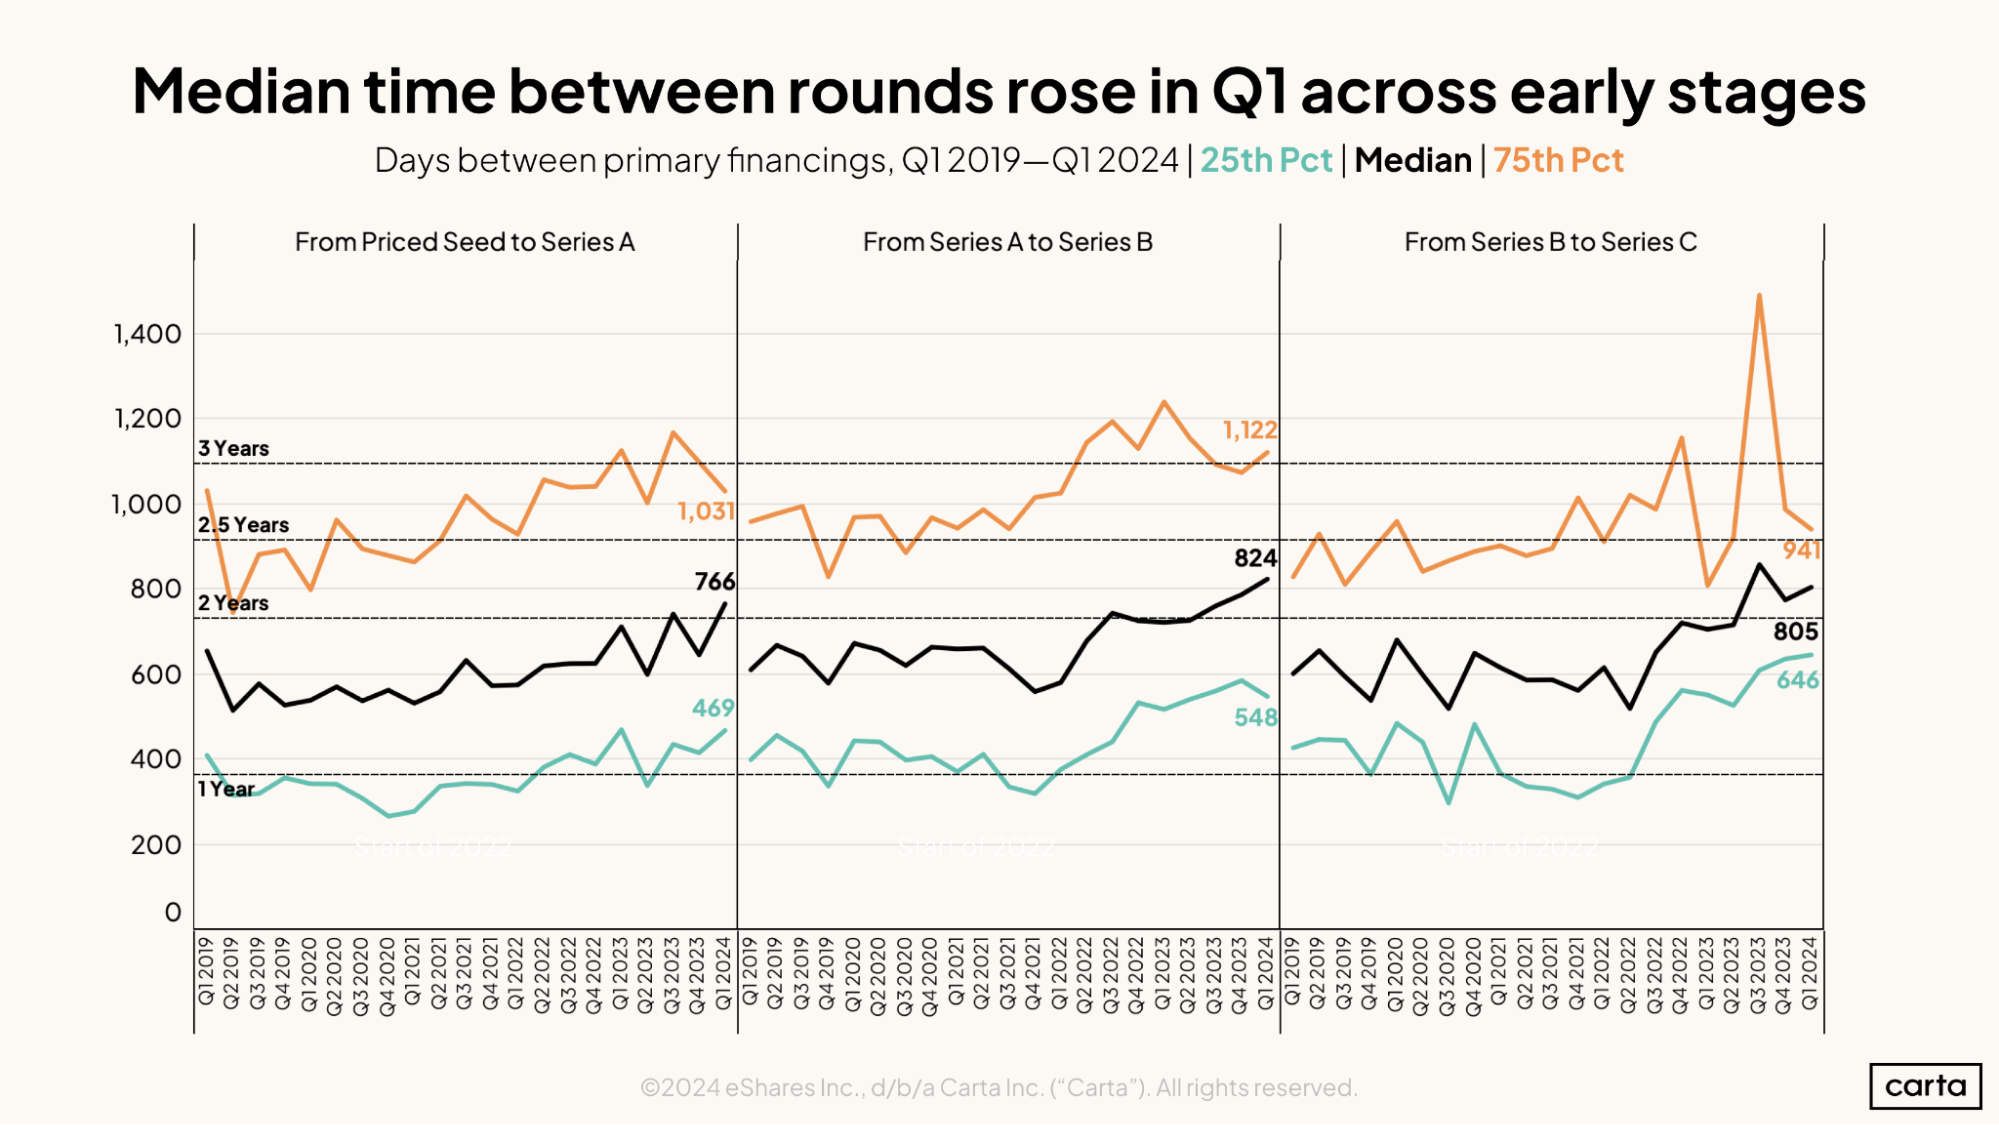
With fewer transactions taking place, founders are having to wait longer between bites at the fundraising apple. Startups that raised a primary Series A round in Q1 had waited a median of 766 days since their seed round, the longest interval of any quarter since the start of 2019. For companies raising a Series B, the median interval between rounds 824 was days, also the longest it’s been in the past five years.
For founders, more time between rounds means more runway is required. That 824-day wait at Series B represents about nine quarters. Nine quarters ago, in Q4 2021, the median time between a Series A and a Series B was just 560 days. That’s a difference of 264 days, or roughly three quarters. This means that a startup that raised a Series B round in Q1 might have needed three more months of runway than the data would have indicated when the startup raised its Series A.
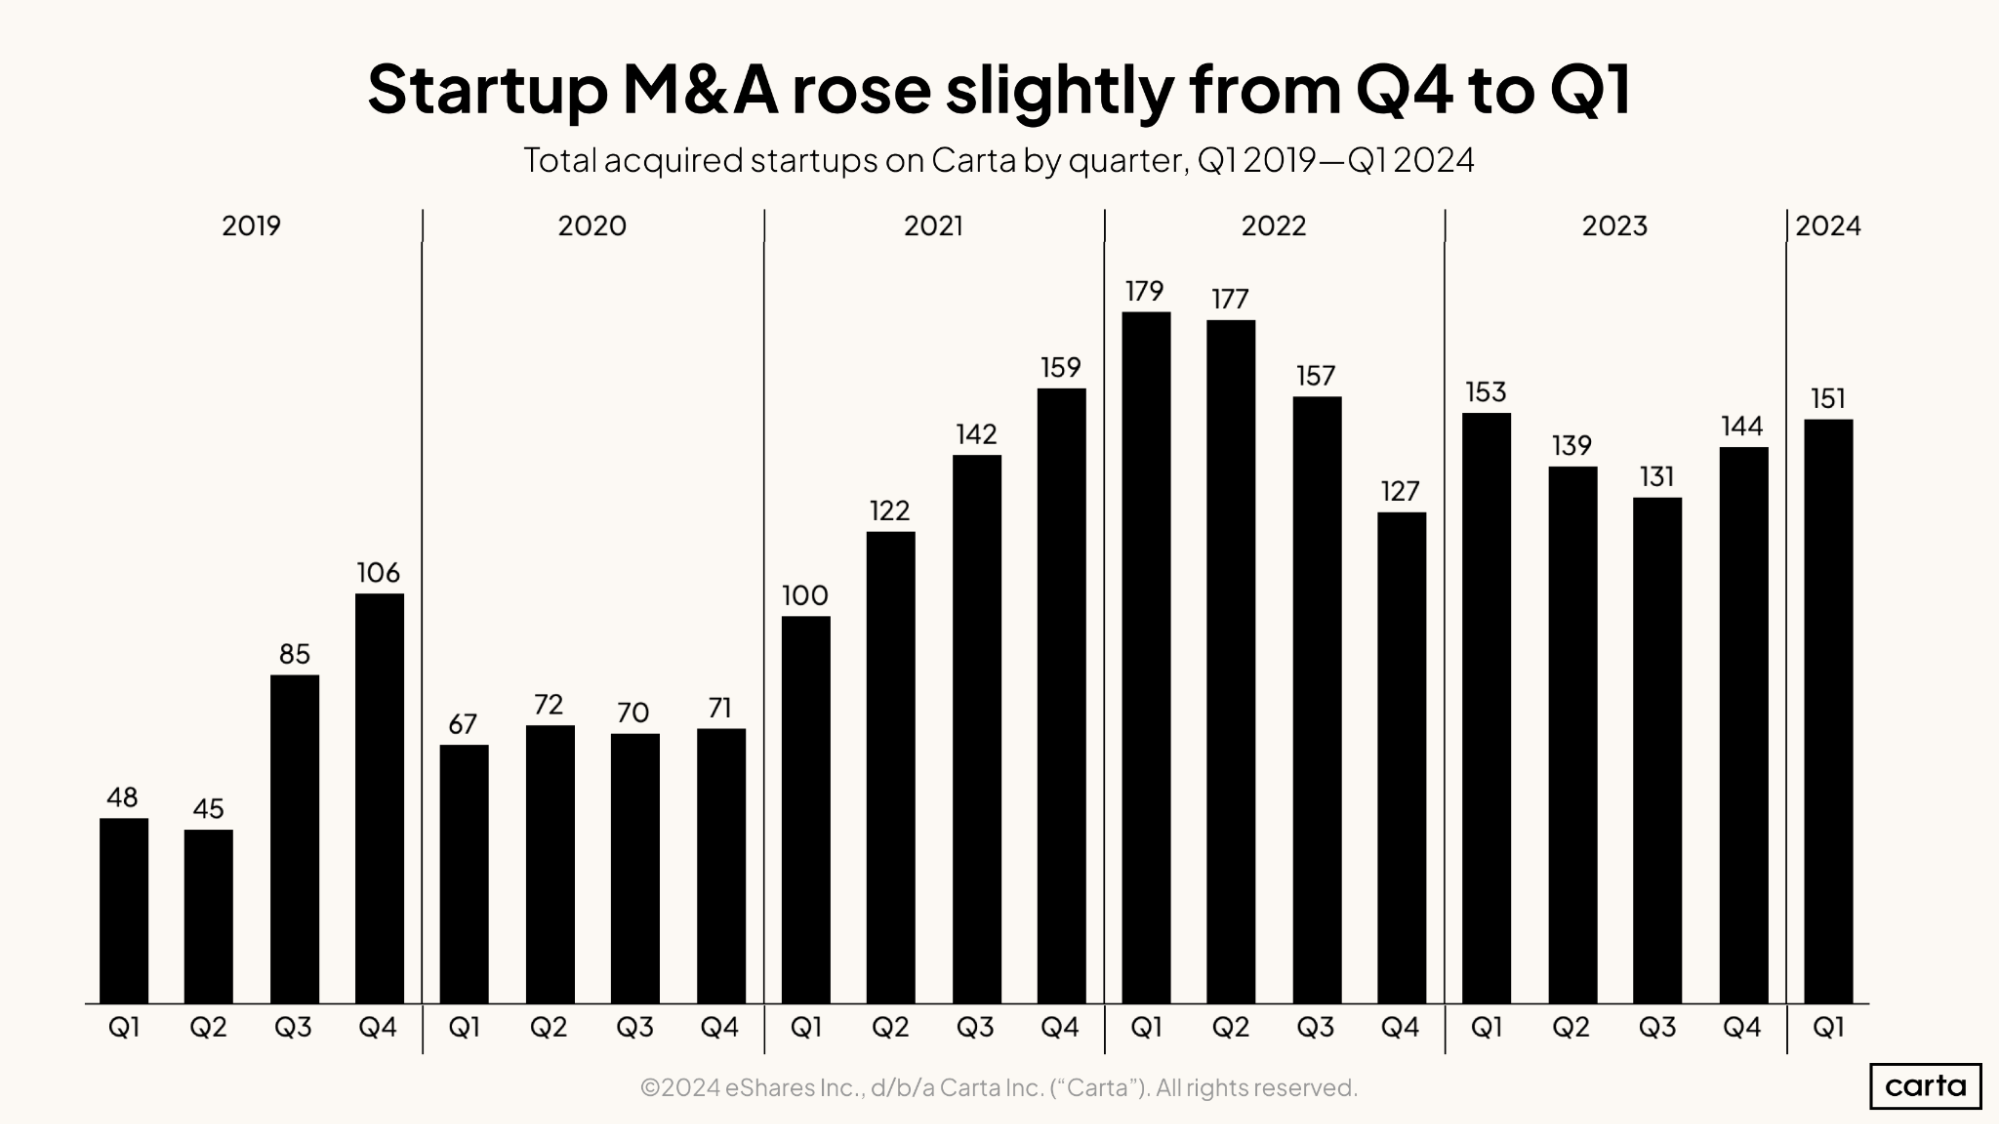
The number of startups exiting through M&A has remained quite steady over the past several quarters. Q1’s count of 151 transactions represents a 5% increase compared to the prior quarter and a decline of just 1% compared to a year ago. In both 2022 and 2023, Q1 was the busiest quarter of the year for startup M&A activity.
Activity in the IPO market has picked up a bit so far in 2024. Through the end of April, U.S. stock markets were on pace for nearly 150 new listings this year, compared to 108 in 2023. So far, that uptick in the most high-profile corner of the exit market hasn’t correlated to an increase in M&A.
Employee equity & movement
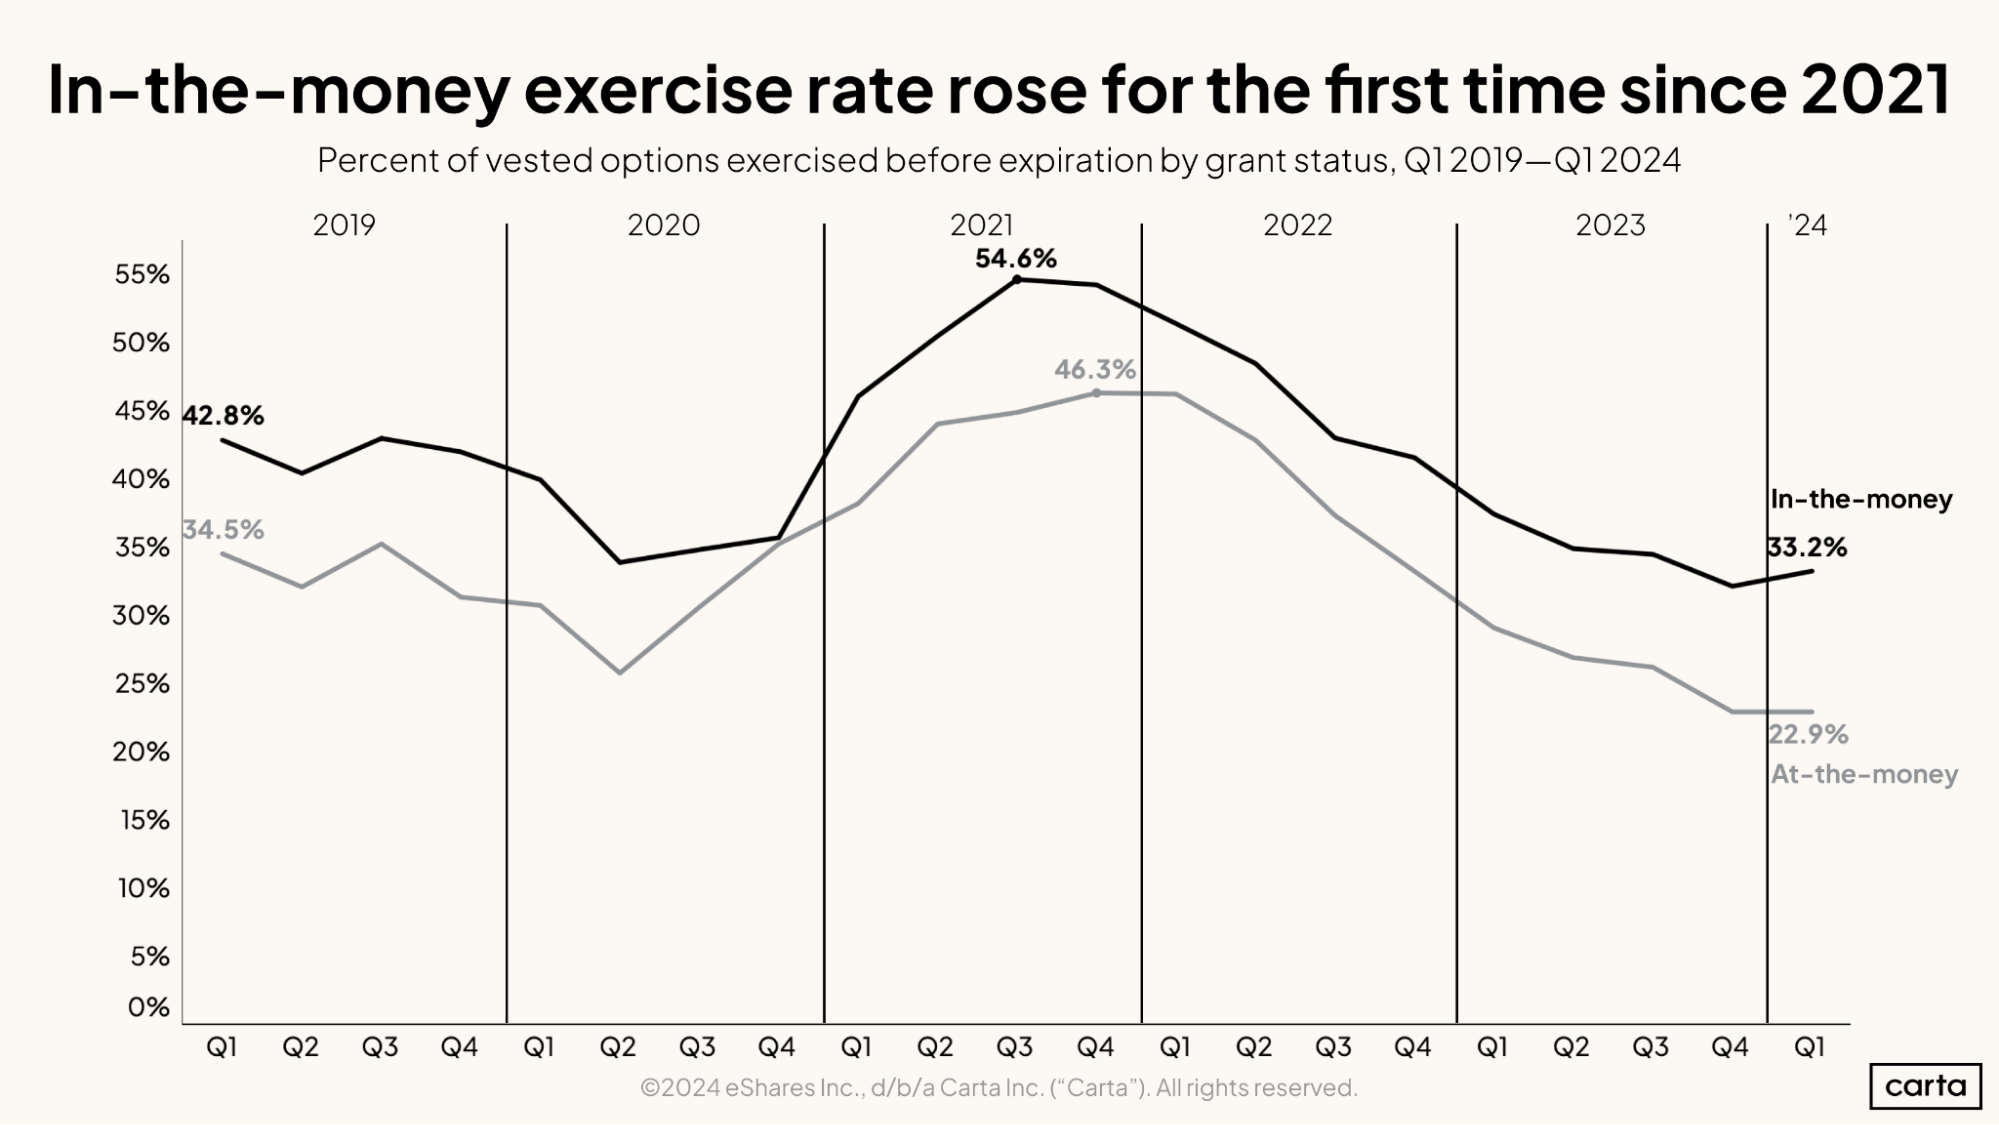
Employees chose to exercise about one third of their vested, in-the-money stock options before those options expired in Q1, a slightly higher percentage than in Q4 2023. This ends a streak of nine straight quarters in which the employee exercise rate had declined, dating back to a recent peak of 54.6% in Q3 2021.
The exercise rate in Q1 was 22.9% for at-the-money stock options—that is, stock options for which the strike price and the current value of the stock are equal. That’s the lowest exercise rate for at-the-money options since at least the start of 2019. This could signal that employees holding at-the-money options are growing less optimistic about their companies’ future prospects.
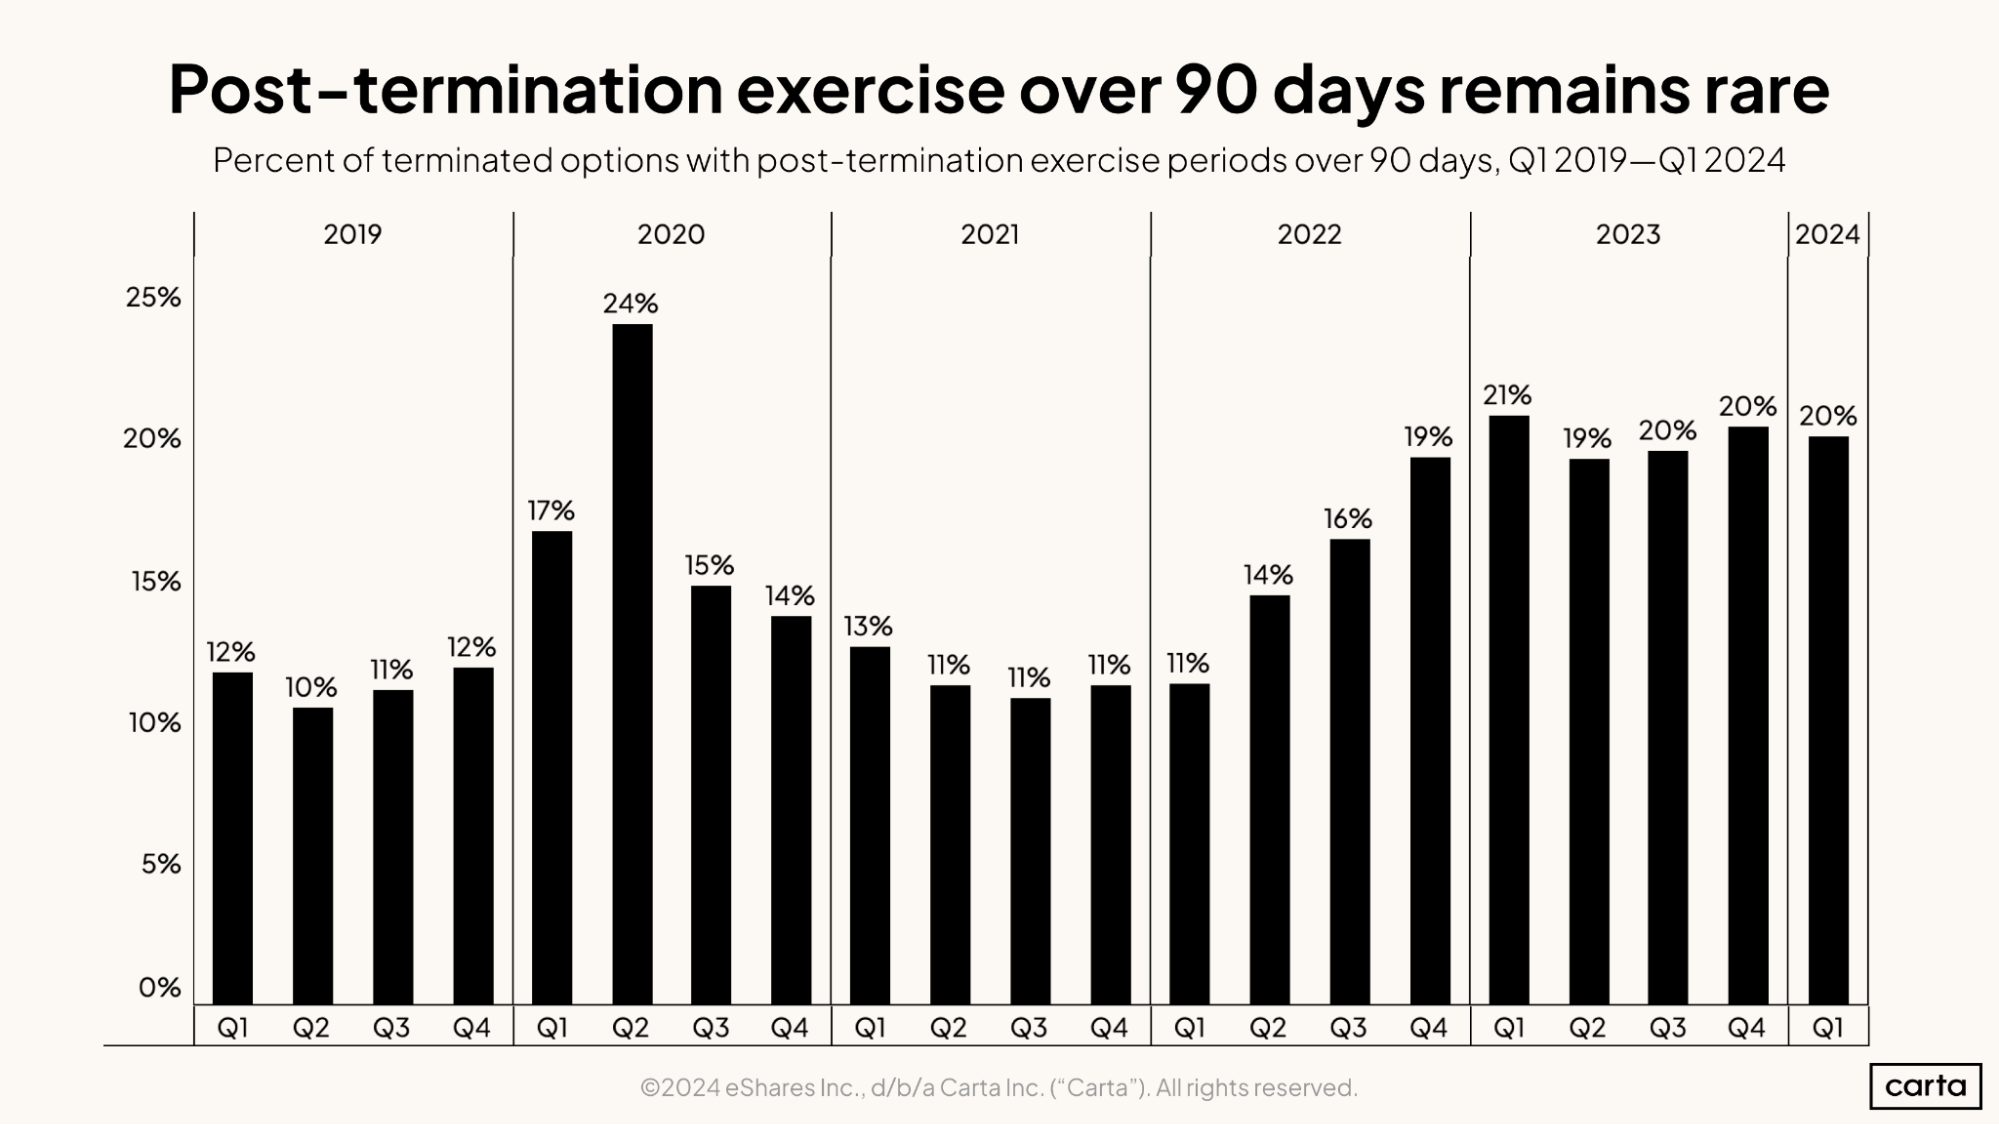
When startups part ways with an employee, the employee typically has 90 days to decide whether to exercise any of their vested stock options. Over the past two years, it’s grown more common for startups to extend this post-termination exercise period (PTEP) past the 90-day norm. The market for extended PTEP remained steady in Q1, with employees offering longer than 90 days for about 20% of all terminated options. The rate of extended PTEP has now been somewhere in the range of 19% to 21% for six straight quarters.
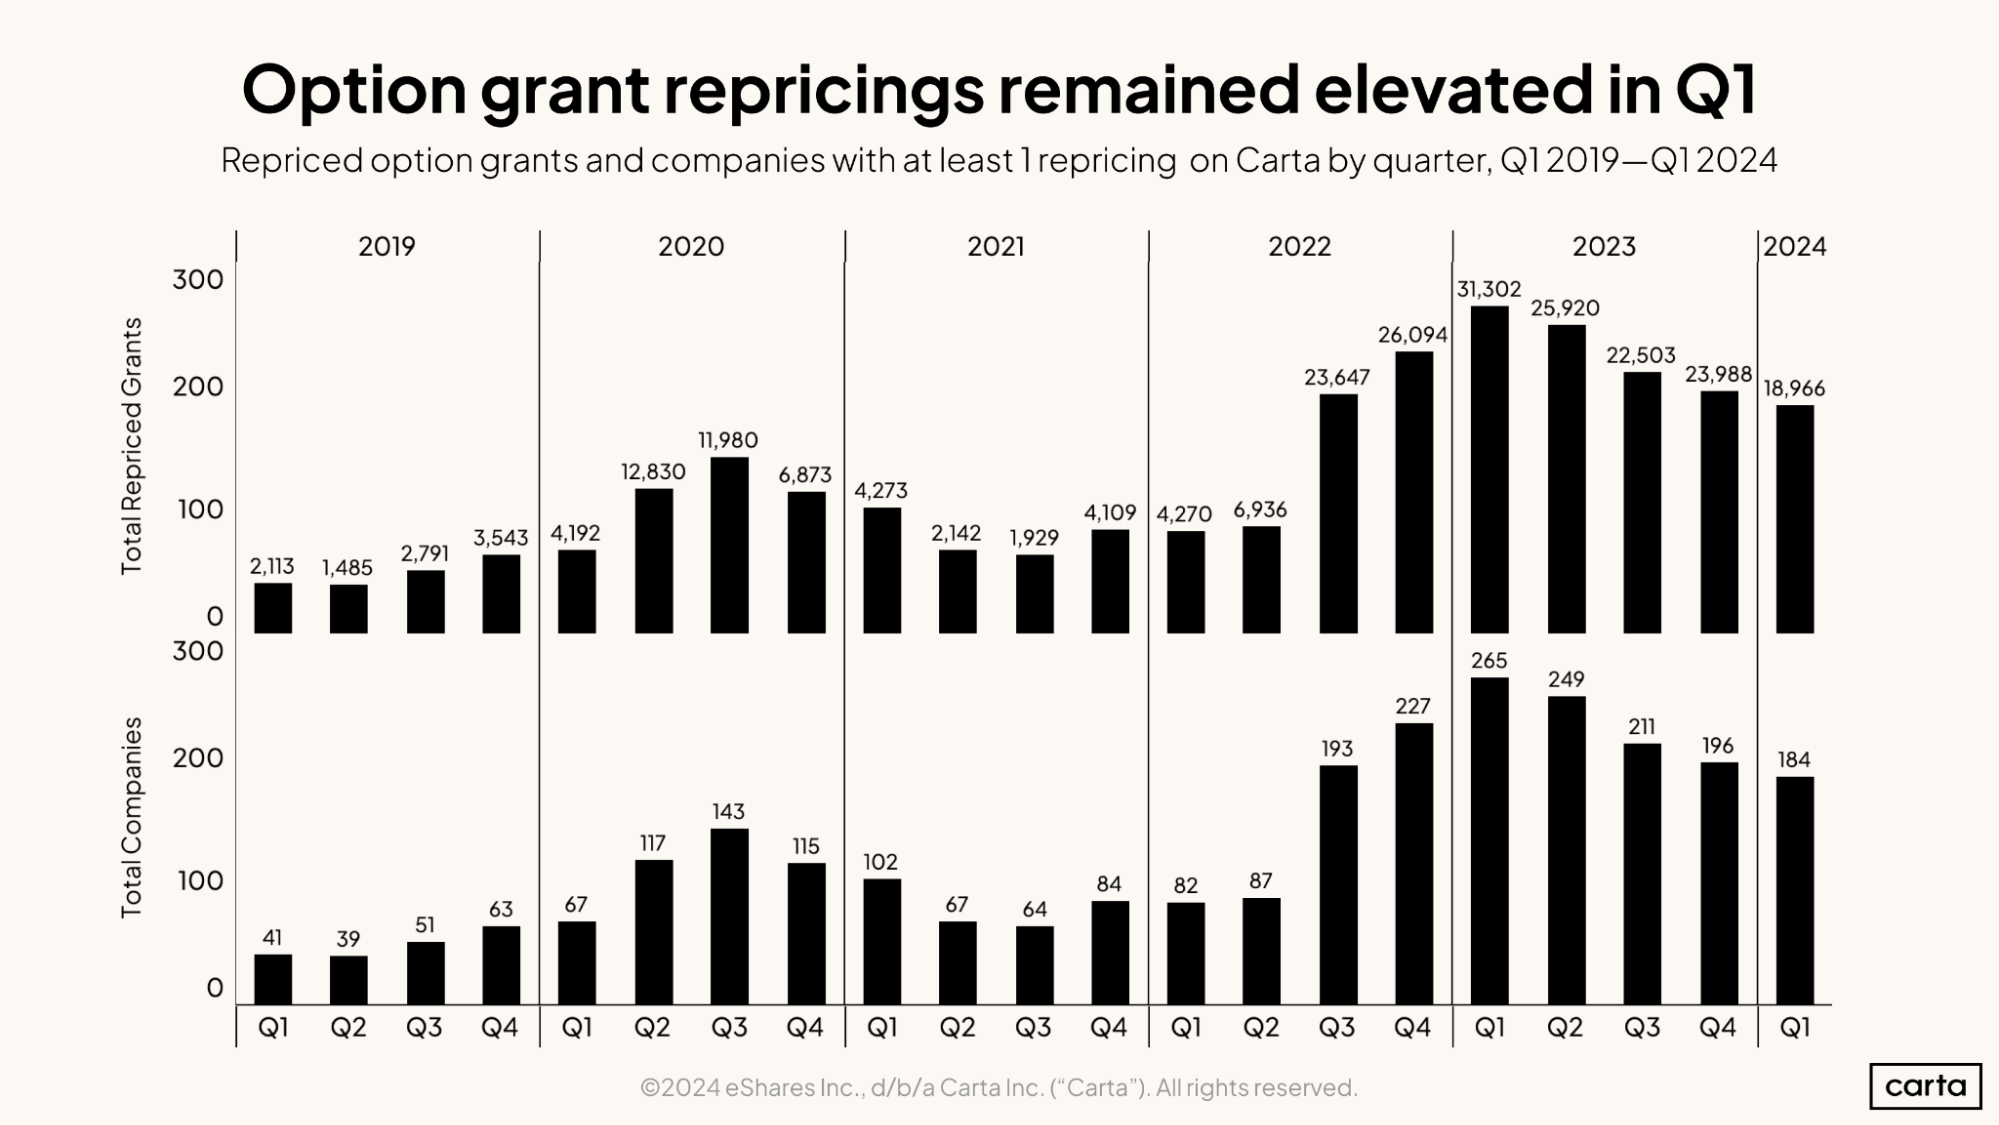
In Q1, 184 companies on Carta combined to reprice nearly 19,000 previously issued option grants. Both of those figures are the lowest they’ve been in the past seven quarters. But both figures are also still higher than any individual quarter from 2019, 2020, or 2021. This increase in repriced option grants is likely due in part to the increase in down rounds and a broader decline in venture-backed valuations that’s occurred since the middle of 2022. If a company’s valuation declines—or doesn’t experience the growth that might have previously been expected—then stock options become less appealing to current employees. Repricing those already-issued options is a way to make them more attractive.
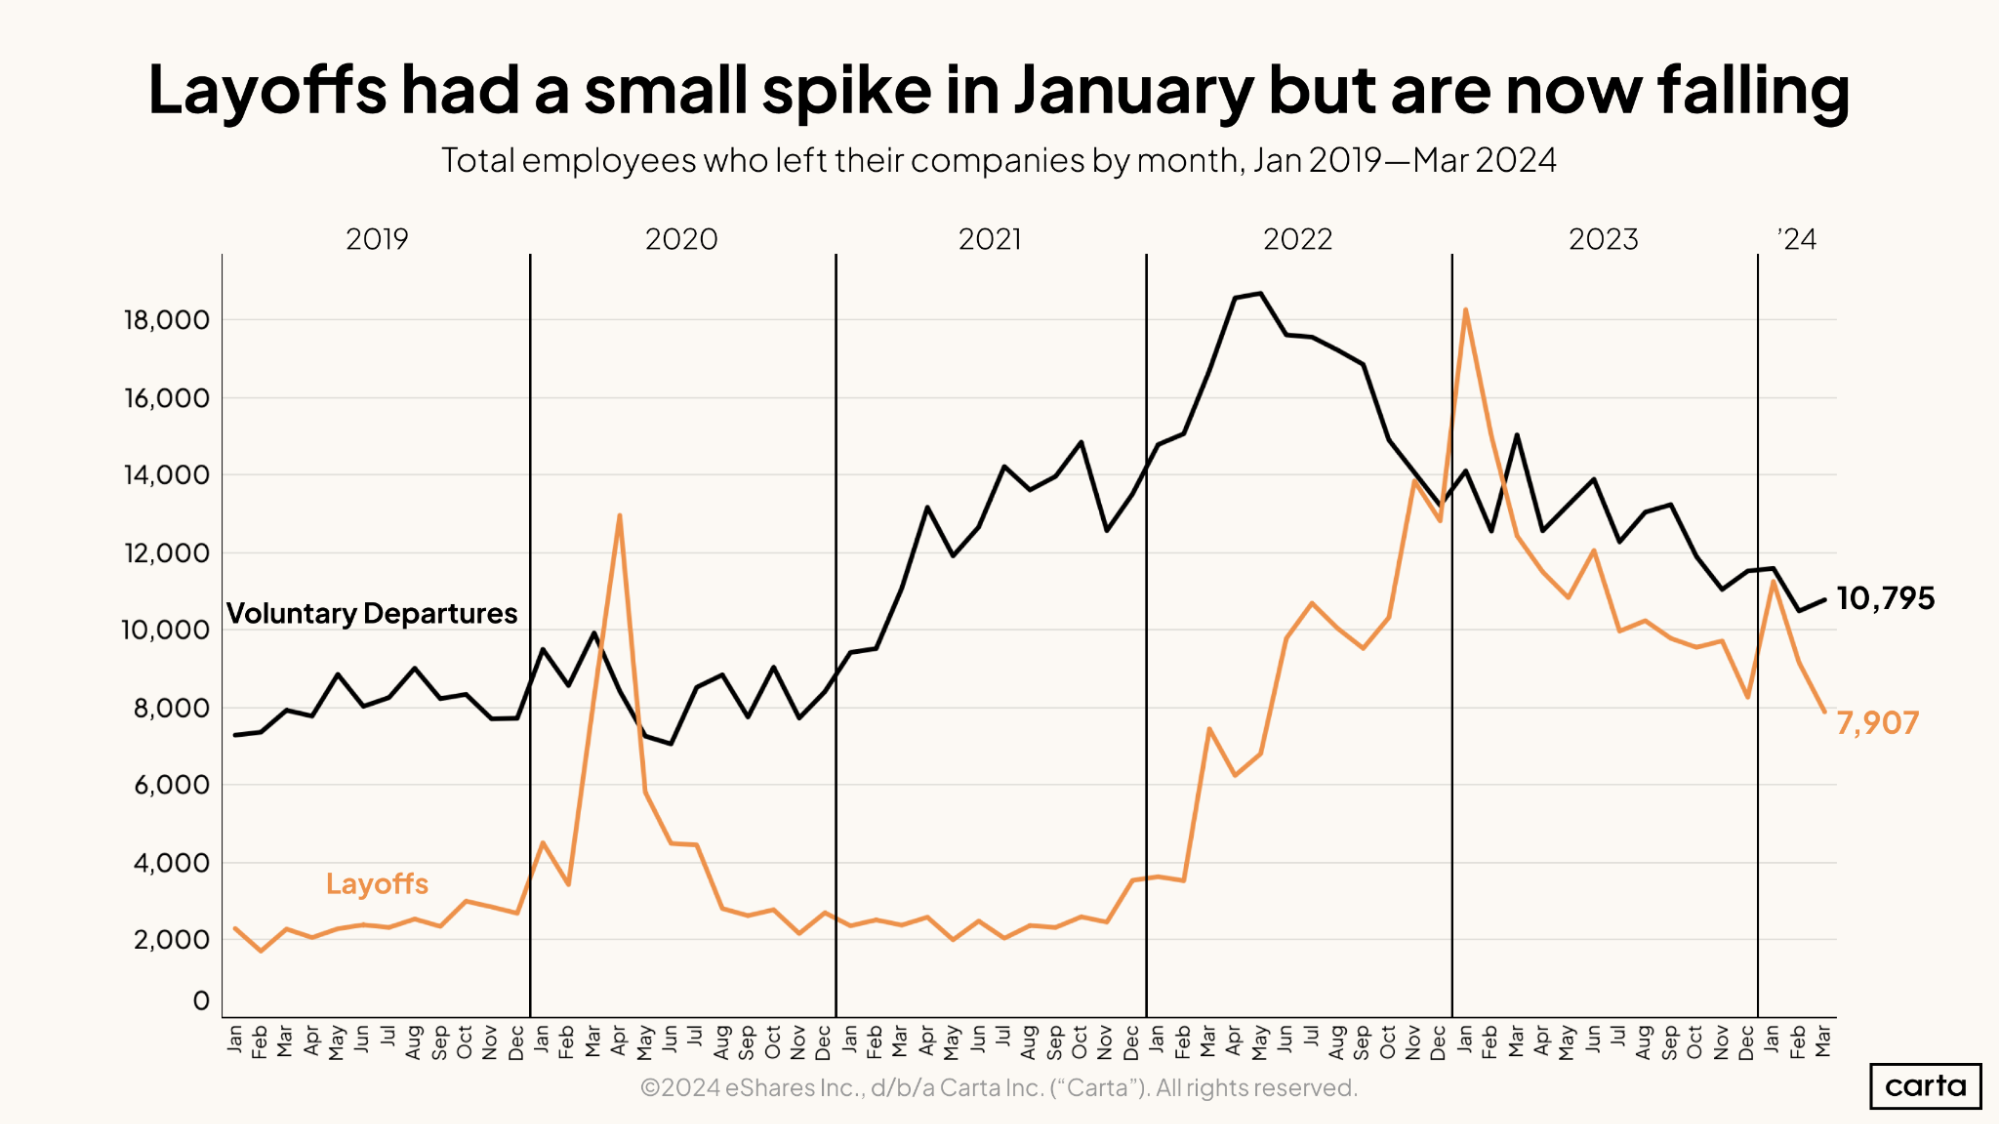
In March 2024, the total number of layoffs on Carta fell below 8,000 for the first time in any month since May 2022, a span of nearly two years. And in February 2024, the total number of voluntary job departures fell below 11,000 for the first time since February 2021. In the big picture, the general decline in both voluntary and involuntary job changes that began in early 2023 continued during the first quarter of 2024.
There were some exceptions, however. The layoff count jumped up to 11,270 in January 2024, the second straight January with a sharp uptick in layoffs. The voluntary job departures increased slightly in March.
Industry-specific data
Download the addendum to this quarter's report to get industry-specific data on fundraising and valuations:
Methodology
Carta helps more than 45,000 primarily venture-backed companies and 2,400,000 security holders manage over $3.0 trillion in equity. We share insights from this unmatched dataset about the private markets and venture ecosystem to help founders, employees, and investors make informed decisions and understand market conditions.
Overview
This study uses an aggregated and anonymized sample of Carta customer data. Companies that have contractually requested that we not use their data in anonymized and aggregated studies are not included in this analysis.
The data presented in this private markets report represents a snapshot as of May 1, 2024. Historical data may change in future studies because there is typically an administrative lag between the time a transaction took place and when it is recorded in Carta. In addition, new companies signing up for Carta’s services will increase historical data available for the report.
Financings
Financings include equity deals raised in USD by U.S.-based corporations. The financing “series” (e.g. Series A) is taken from the legal share class name. Financing rounds that don’t follow this standard are not included in any data shown by series but are included in data not shown by series. Primary rounds are defined as the first equity round within a series. Bridge rounds are defined as any round raised after the first round in a given series.
In some cases, convertible notes are raised and converted at various discounted prices within a series (e.g. Series A-1, Series A-2, Series A-3). In these cases, converted securities are not included in cash raised, and only the post-money valuation of the new money is included.
Terminations
Terminations entered into Carta must include a reason. Involuntary terminations include both terminations for performance and company layoffs. Voluntary terminations are employees who decided to leave of their own accord. Other termination reasons, including for cause, death, disability, and retirement were not included in the data and make up less than 1% of all terminations combined.

