Figuring out employee compensation can be tricky. Often, making an offer is a shot in the dark based on conversations with friends and investors and the few data points you can find online. You can consult with a law firm and pay expensive hourly rates. Or you can use survey data from compensation consulting firms, but that data is only updated once or twice a year, a cadence that’s not fast enough for the quickly changing job market. And usually, it lacks information on startup equity compensation, so it’s not showing the whole picture.
Limitations like these make it especially difficult to figure out competitive compensation packages for specialized roles. Let’s say you need to hire a certain type of engineering or operations role. Understanding what roles like these are worth can be tricky because there’s not nearly as much data as there is for, say, software engineers.
Raw compensation data can also contain outlier data points, like unrealistic salary increases between two levels or lower levels getting paid more than higher levels.In these sorts of cases, it takes a lot of manual effort to smooth out the data. It’s often the job of a full-time compensation analyst or HR professional to make sense of messy compensation data and ultimately make it usable.
Why compensation bands matter
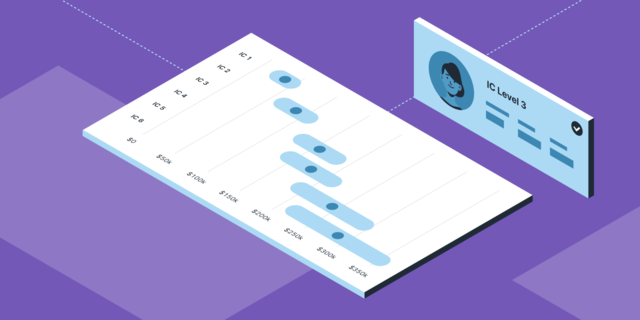
A compensation band is an upper and lower range of compensation that you would be willing to pay someone in a specific role.
Bands are important because they help you make fair and competitive compensation offers. Each employee in the role will be paid within the same band.
At the same time, the range within the band lets you factor in education, experience, and performance. You might start someone at the lower end of the band and show your employees a path to the higher end through promotions, incentivizing them to stay.
In that way, bands go hand in hand with levels. If an employee is performing well, there should be a clear path for them to take on added responsibility and level up to a new role (and a new band).
But bands only work if they’re competitive—you’ll need to create compensation bands that reflect what’s going on in the market. And to make sure you’re staying competitive in the job market, you’ll need to create pay bands that reflect real market data.
Using data to make fair, competitive compensation bands
Carta Total Comp has real-time compensation data from over 120,000 employees linked to the Carta network. That data is helpful in itself, but Total Comp uses it as a starting point: The platform is constantly learning, using statistical modeling to create compensation bands for each role at your company.
When you input a job area, level, company valuation, and location, Total Comp will generate the 25th, 50th, and 75th percentile for salary and equity and create a fair and competitive pay band for the job.
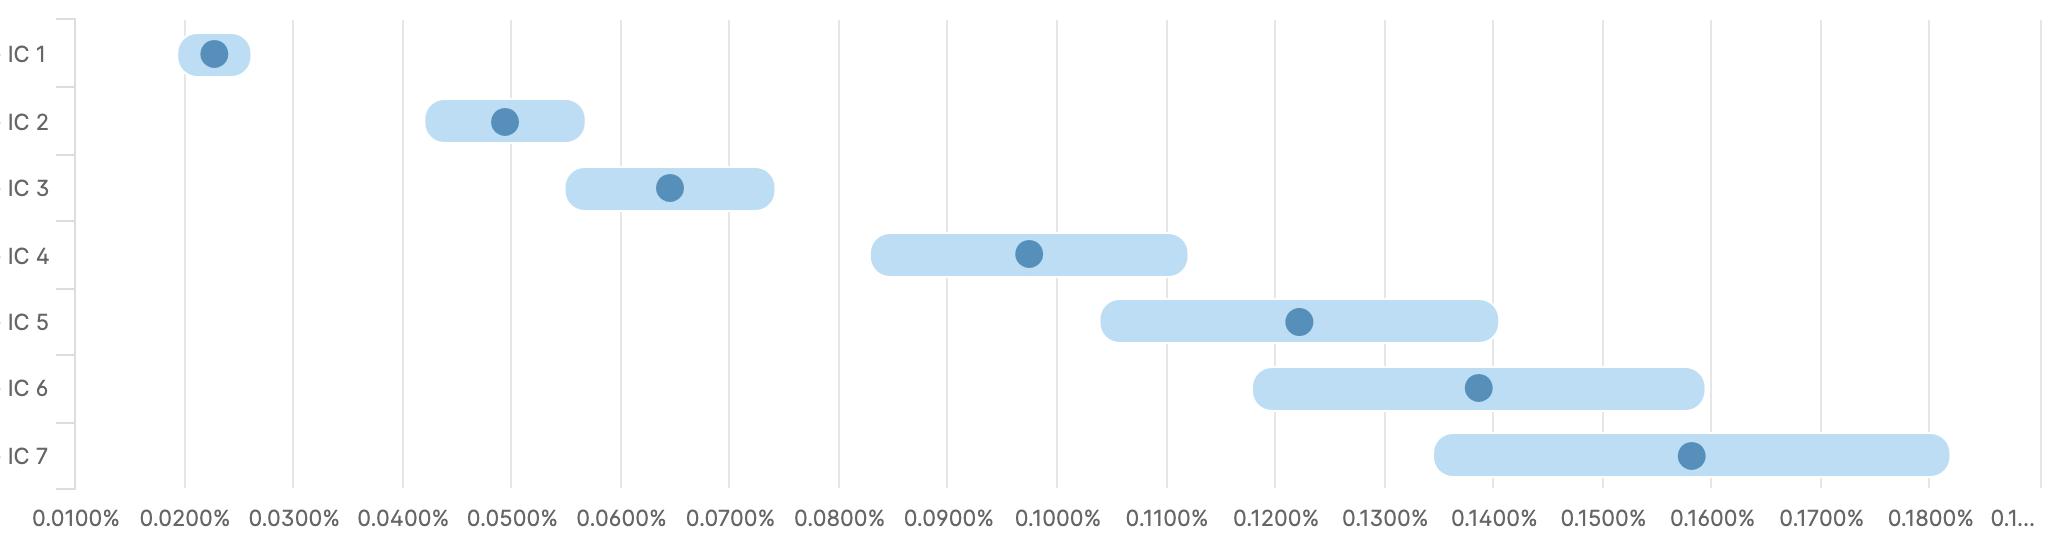
Even for specialized roles where there’s not as much data, the model can fill in the gaps and create an accurate compensation band.
How the machine learning works
Using tens of thousands of real-time compensation data points, Carta’s machine learning model estimates median salaries and uses logical rules from the real world to create rational bands. A rule like “never pay a Level 4 employee more than a Level 5” lets the model know that compensation bands should be higher at each job level. A rule like “earlier-stage companies grant a higher ownership percentage than later-stage companies” makes sure the model understands that one percent of equity at a $1 billion company is very different than one percent at a $1 million company.
Carta’s team also regularly checks the market data and logic that go into the model. If they see an unlikely scenario, such as a drastic salary increase between certain job levels, they’ll dive into the mechanics of the model and the slice of market data to make sure it makes more realistic band recommendations.
Carta Total Comp’s machine learning model even works when there’s limited market data. It accurately predicts compensation trends by analyzing all of the real-time data points from employees on the Total Comp platform. Carta regularly updates the model so that there’s as little difference as possible between the predictions it makes and the underlying market data.
Let’s say you’re a hiring manager at a $100 million Series A company, and you’re trying to figure out how much to pay a engineering director. Even if there isn’t a big market for that role, Carta Total Comp will predict a realistic compensation package. The model makes a director-level salary prediction by looking at real benchmarks for the same role at companies with smaller and larger post-money valuations, then adding gradual salary increases between them. That’s because the model assumes that compensation increases as companies get more money.
Building a compensation plan for your company
You can use Carta Total Comp to build and adjust your entire company’s compensation plan. In addition to helping you figure out what to pay individual employees, Carta Total Comp lets you make changes to all your employees’ bands in just a few clicks.
Automating your bands can help you save your team not only time, but also money. You’ll be able to easily see any roles where you’re paying well over market rate, for example. You can also see where you’re at risk for attrition—bumping up pay within the band could keep you from losing a top performer.
Carta Total Comp’s default setting is to create 50th percentile compensation bands for all your employees, but you can change the market position at any time. For example, if you want your company to consistently pay in the 75th percentile relative to the market, you can decide that in your Carta Total Comp settings, and all your employees’ bands will automatically reflect that target. You can also customize your settings by role and type of compensation—if you want to pay in the 75th percentile for salary but something else for equity, you’re in control.
Interested in learning more? Find some time with our team of compensation experts.
DISCLOSURE: This communication is on behalf of eShares Inc., d/b/a Carta Inc. (“Carta”). This communication is for informational purposes only, and contains general information only. Carta is not, by means of this communication, rendering accounting, business, financial, investment, legal, tax, or other professional advice or services. This publication is not a substitute for such professional advice or services nor should it be used as a basis for any decision or action that may affect your business or interests. Before making any decision or taking any action that may affect your business or interests, you should consult a qualified professional advisor. This communication is not intended as a recommendation, offer or solicitation for the purchase or sale of any security. Carta does not assume any liability for reliance on the information provided herein. ©2022 eShares Inc., d/b/a Carta Inc. (“Carta”). All rights reserved. Reproduction prohibited.