Startups in 2023 are facing compensation markets unlike any in recent memory. Layoffs have afflicted large, public tech companies as well as companies across the VC ecosystem. In the private markets, declining valuations and increasing intervals between funding rounds are motivating founders to conserve cash and extend runway—and payroll is the primary driver of cash burn.
In this report, we’ll cover the most significant changes to the compensation market since publishing our debut State of Compensation report and attempt to shed light on a few key questions:
How have these protracted layoffs affected tech compensation?
How have startups adjusted hiring plans to fit the new normal?
And how can founders inclined to hire international talent ensure they’re paying competitively?
At Carta, we see it as our responsibility to share the insights that come from an unmatched amount of data about the private market. This compensation report is drawn from more than 216,000 employee records from startups that use Carta Total Comp. We also layer in metrics on employee movement from the aggregate pool of more than 1 million employees currently working for the 33,000 startups that use Carta to manage their cap tables.
While the majority of the data presented below deals with changes in base salaries (with a dash of variable compensation), we’ve also charted key updates in equity compensation in our equity addendum. Be sure to download the addendum to get the latest figures for option pool sizes, early employee and advisory shares, and suggested equity geo-adjustments for 20 key countries.
>>Download the equity compensation addendum.
H2 2022 highlights
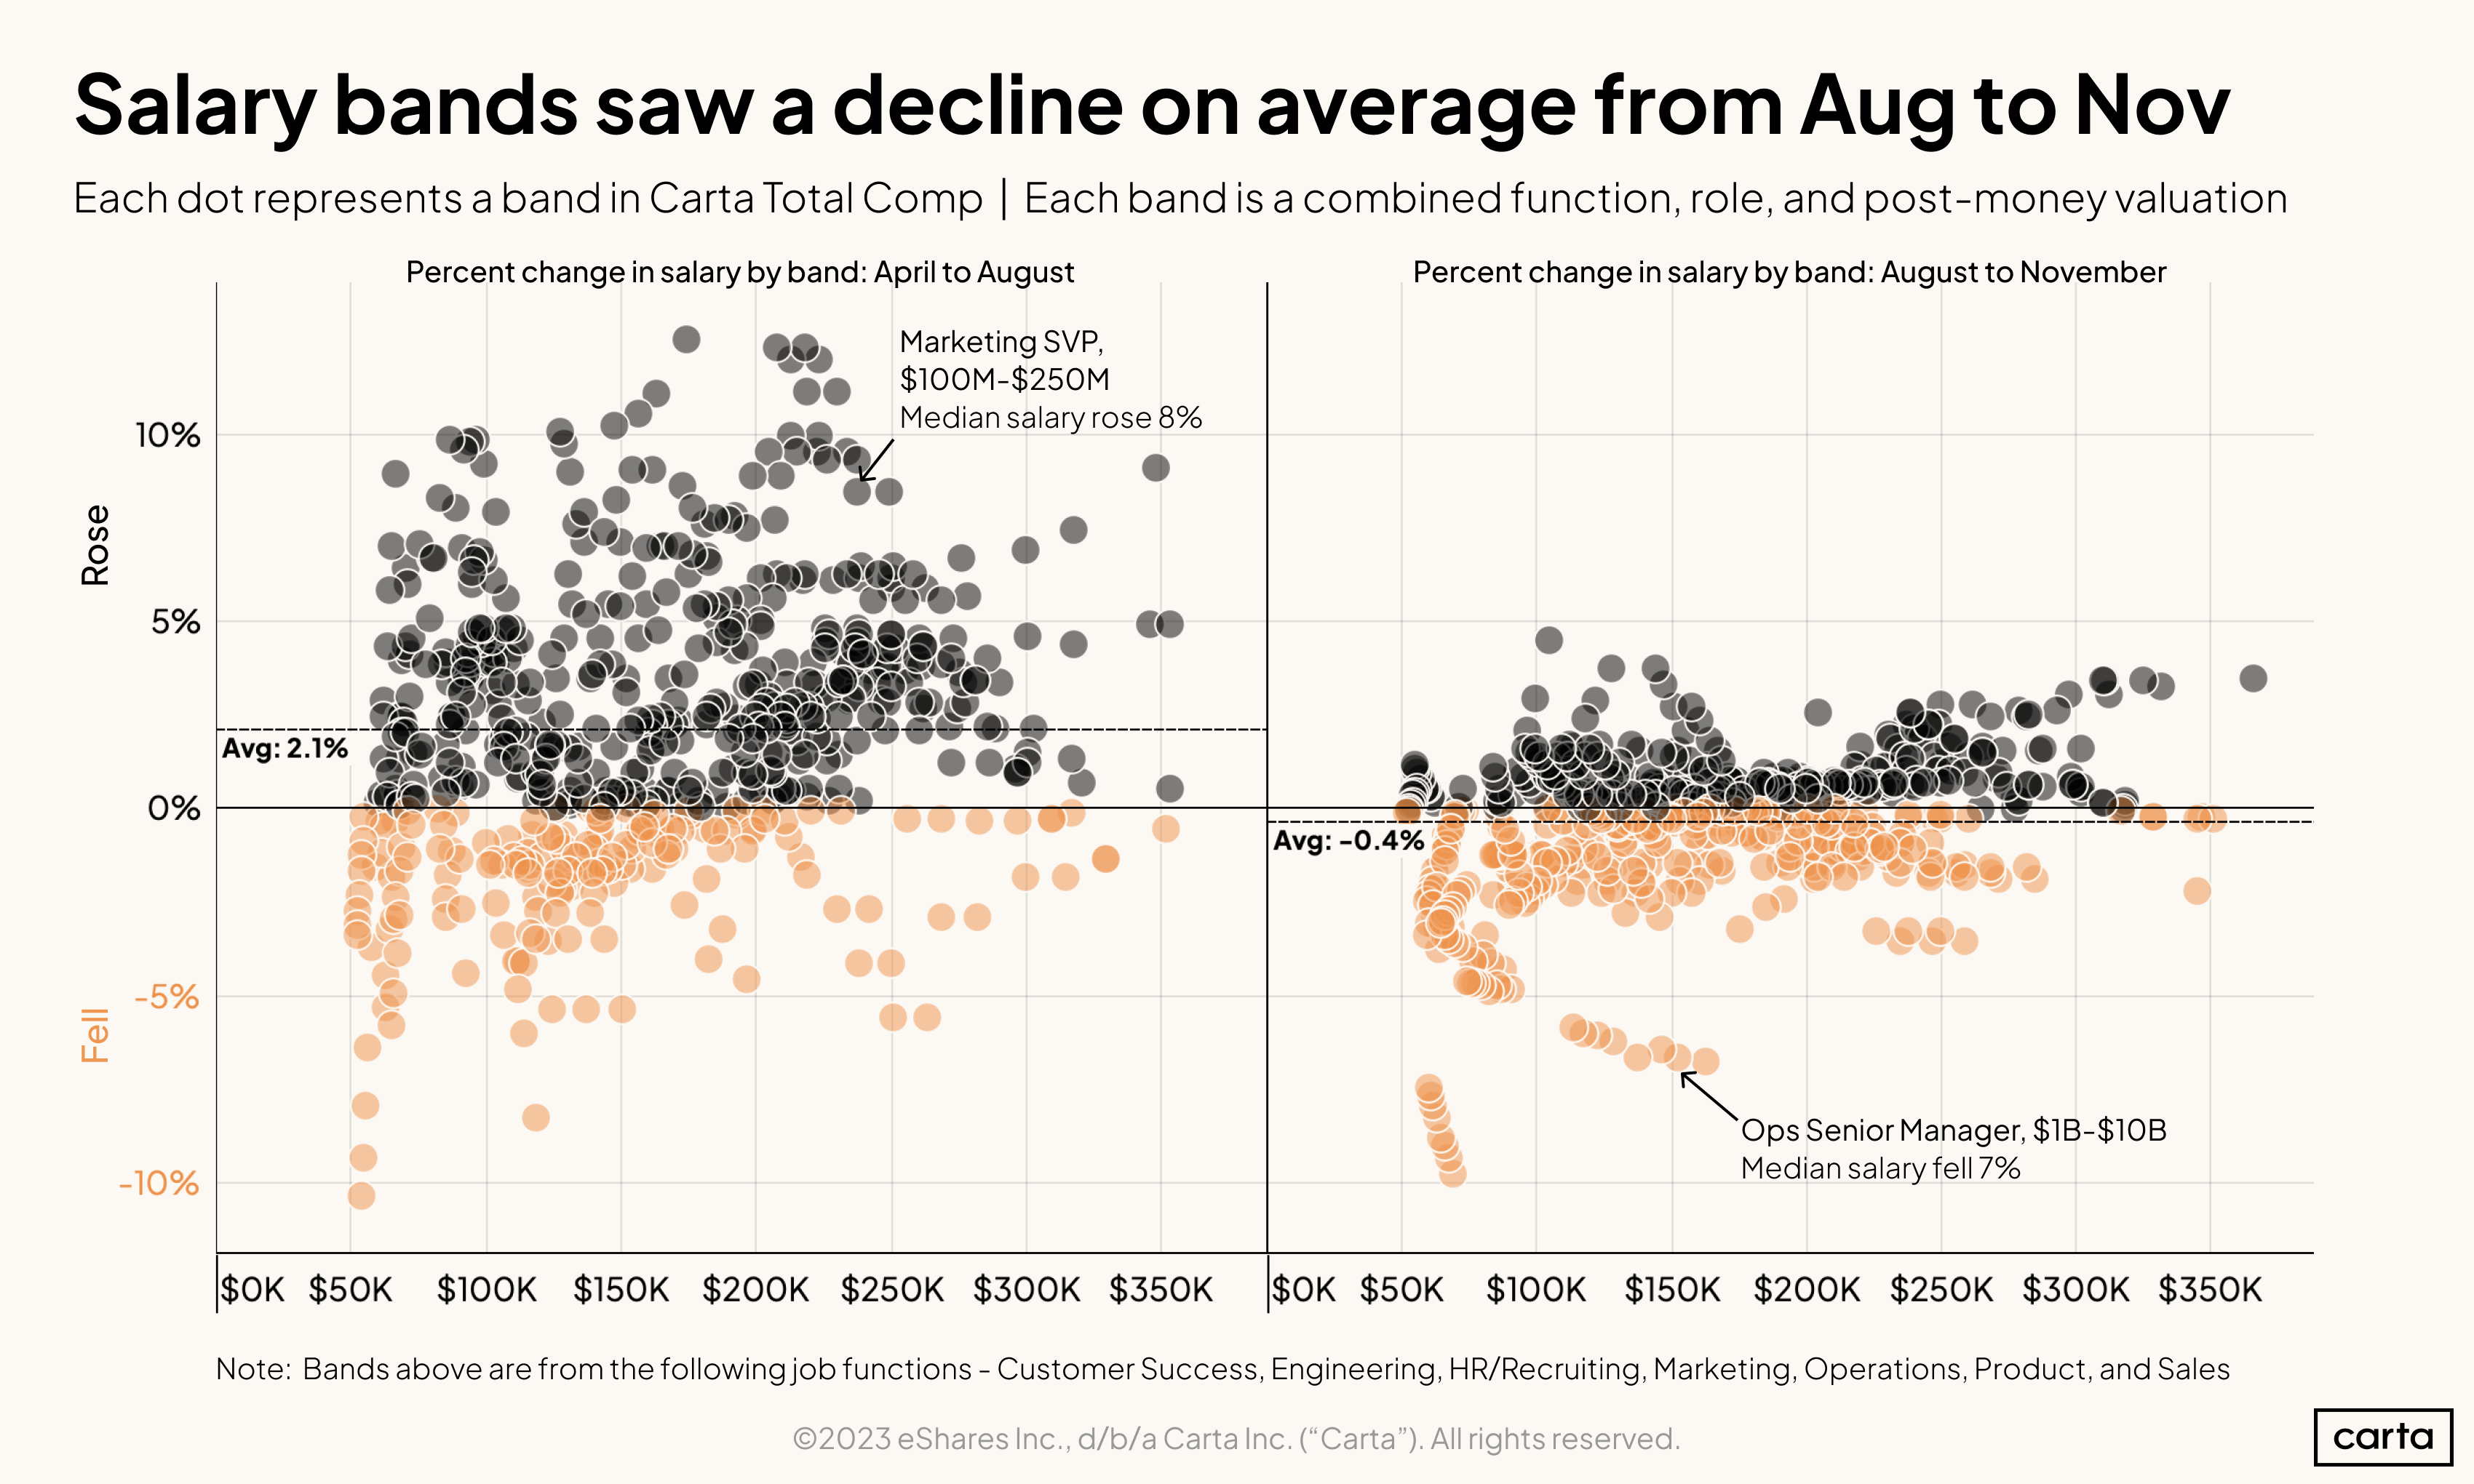
Salaries have stopped rising: The average salary band in Carta Total Comp rose 2.1% from April to August last year. From August to November, the average fell 0.4%
Layoffs are impacting all sectors: Laid off employees accounted for 52% of all employee departures in December 2022 after representing just 13% of departures in July 2021.
Hiring is not keeping pace with departures: Net headcount growth across Carta cap table companies turned negative in September 2022 and has yet to rebound.
Employee movement
Carta data on employee movement—who leaves their company, who joins another, and whether those departures were voluntary or involuntary—is drawn from across our more than 33,000 startups on platform. This provides Carta nearly unmatched visibility into hiring trends across the private markets.
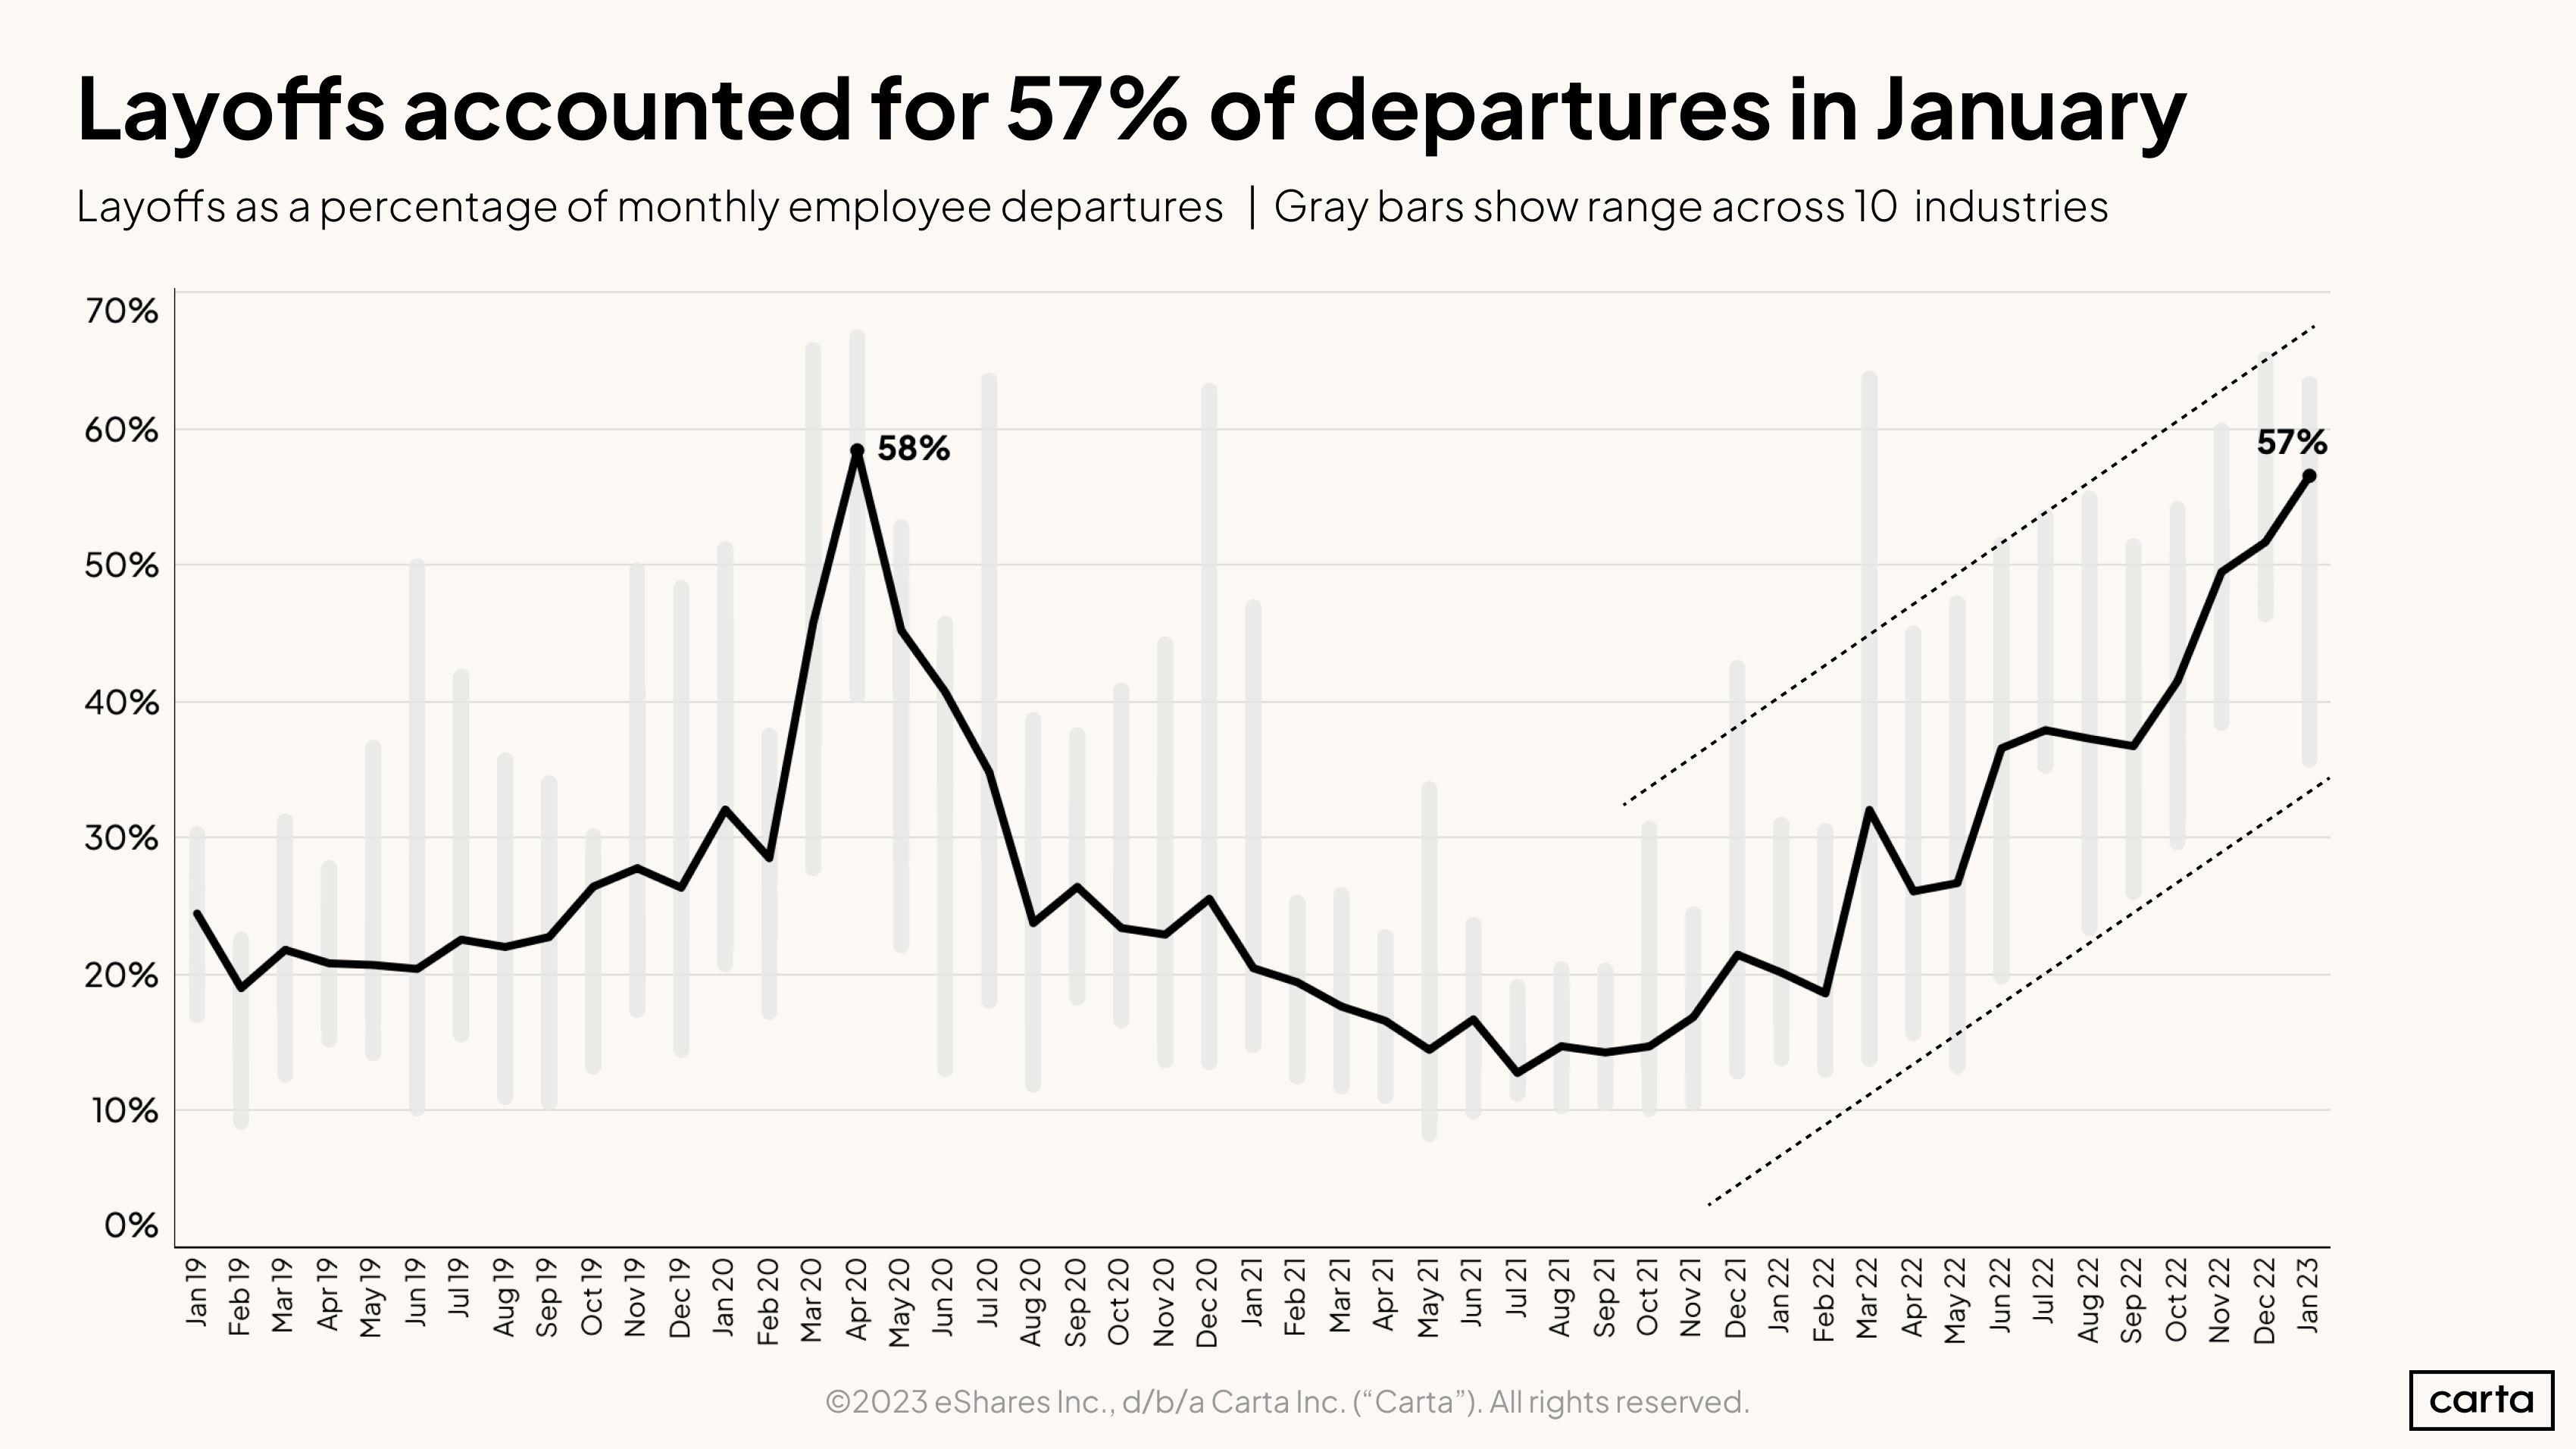
The headlines have it right: Startup employees are getting laid off at higher rates than at any point since 2020. Economic uncertainties provoked by the global pandemic sparked a sharp layoff spike that quickly subsided. The current mix of difficult fundraising and declining startup valuations has caused a prolonged layoff season.
Layoffs have been rising across virtually every major startup industry. Fintech has had an especially rough few months, but no sector has escaped unscathed.
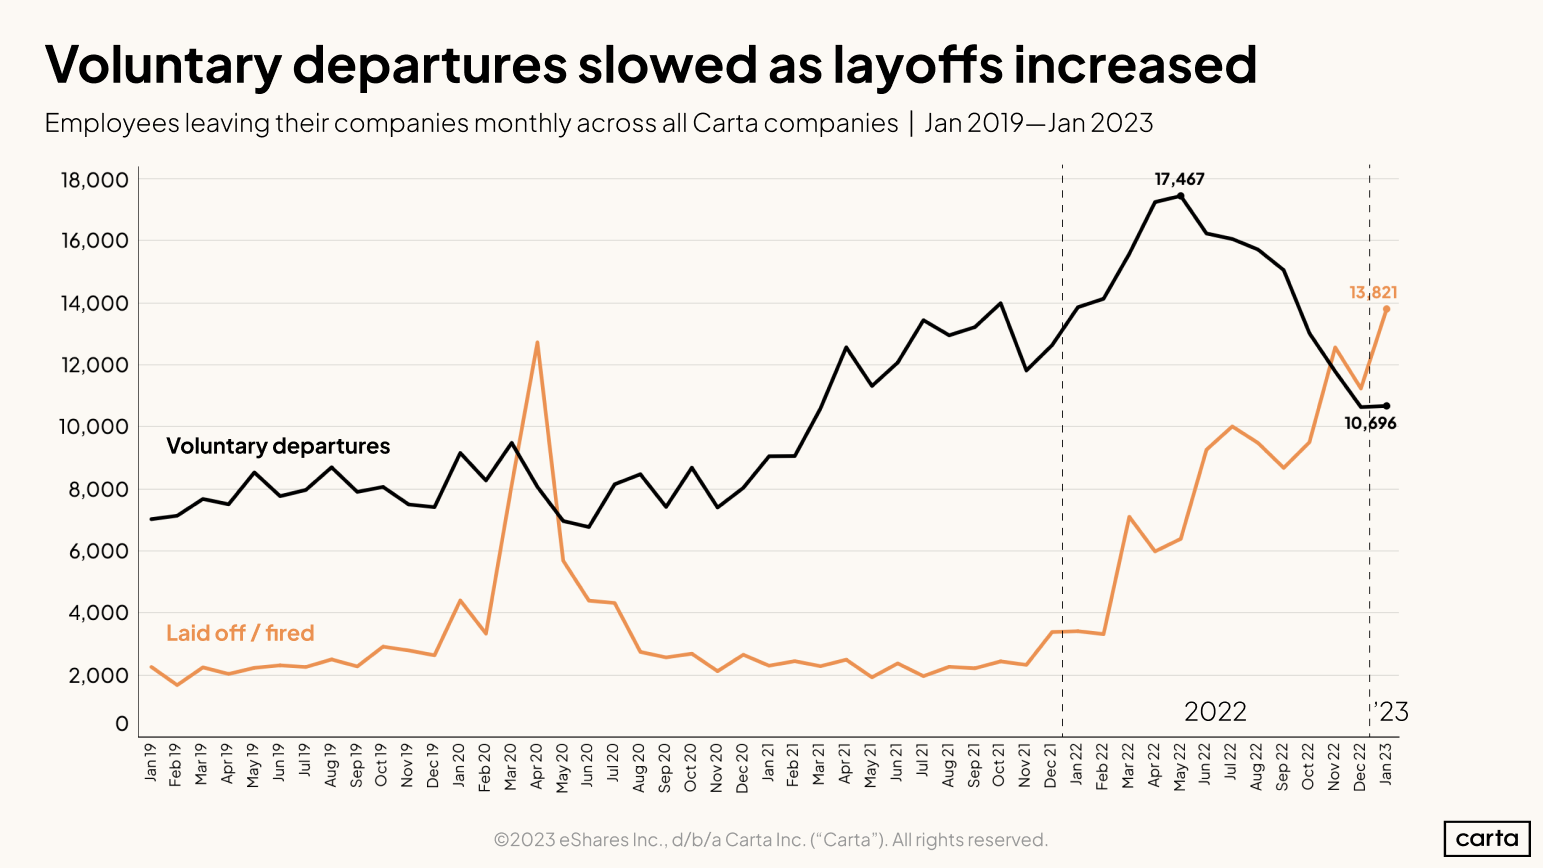
One underrated consequence of rising layoffs at startups is that employees are choosing to remain in their current roles for longer. Uncertainty about the present job market and widespread layoffs make the Great Resignation of late 2021—early 2022 feel like the distant past.
As companies see less voluntary turnover, they may reduce hiring plans further from their already diminished projections.
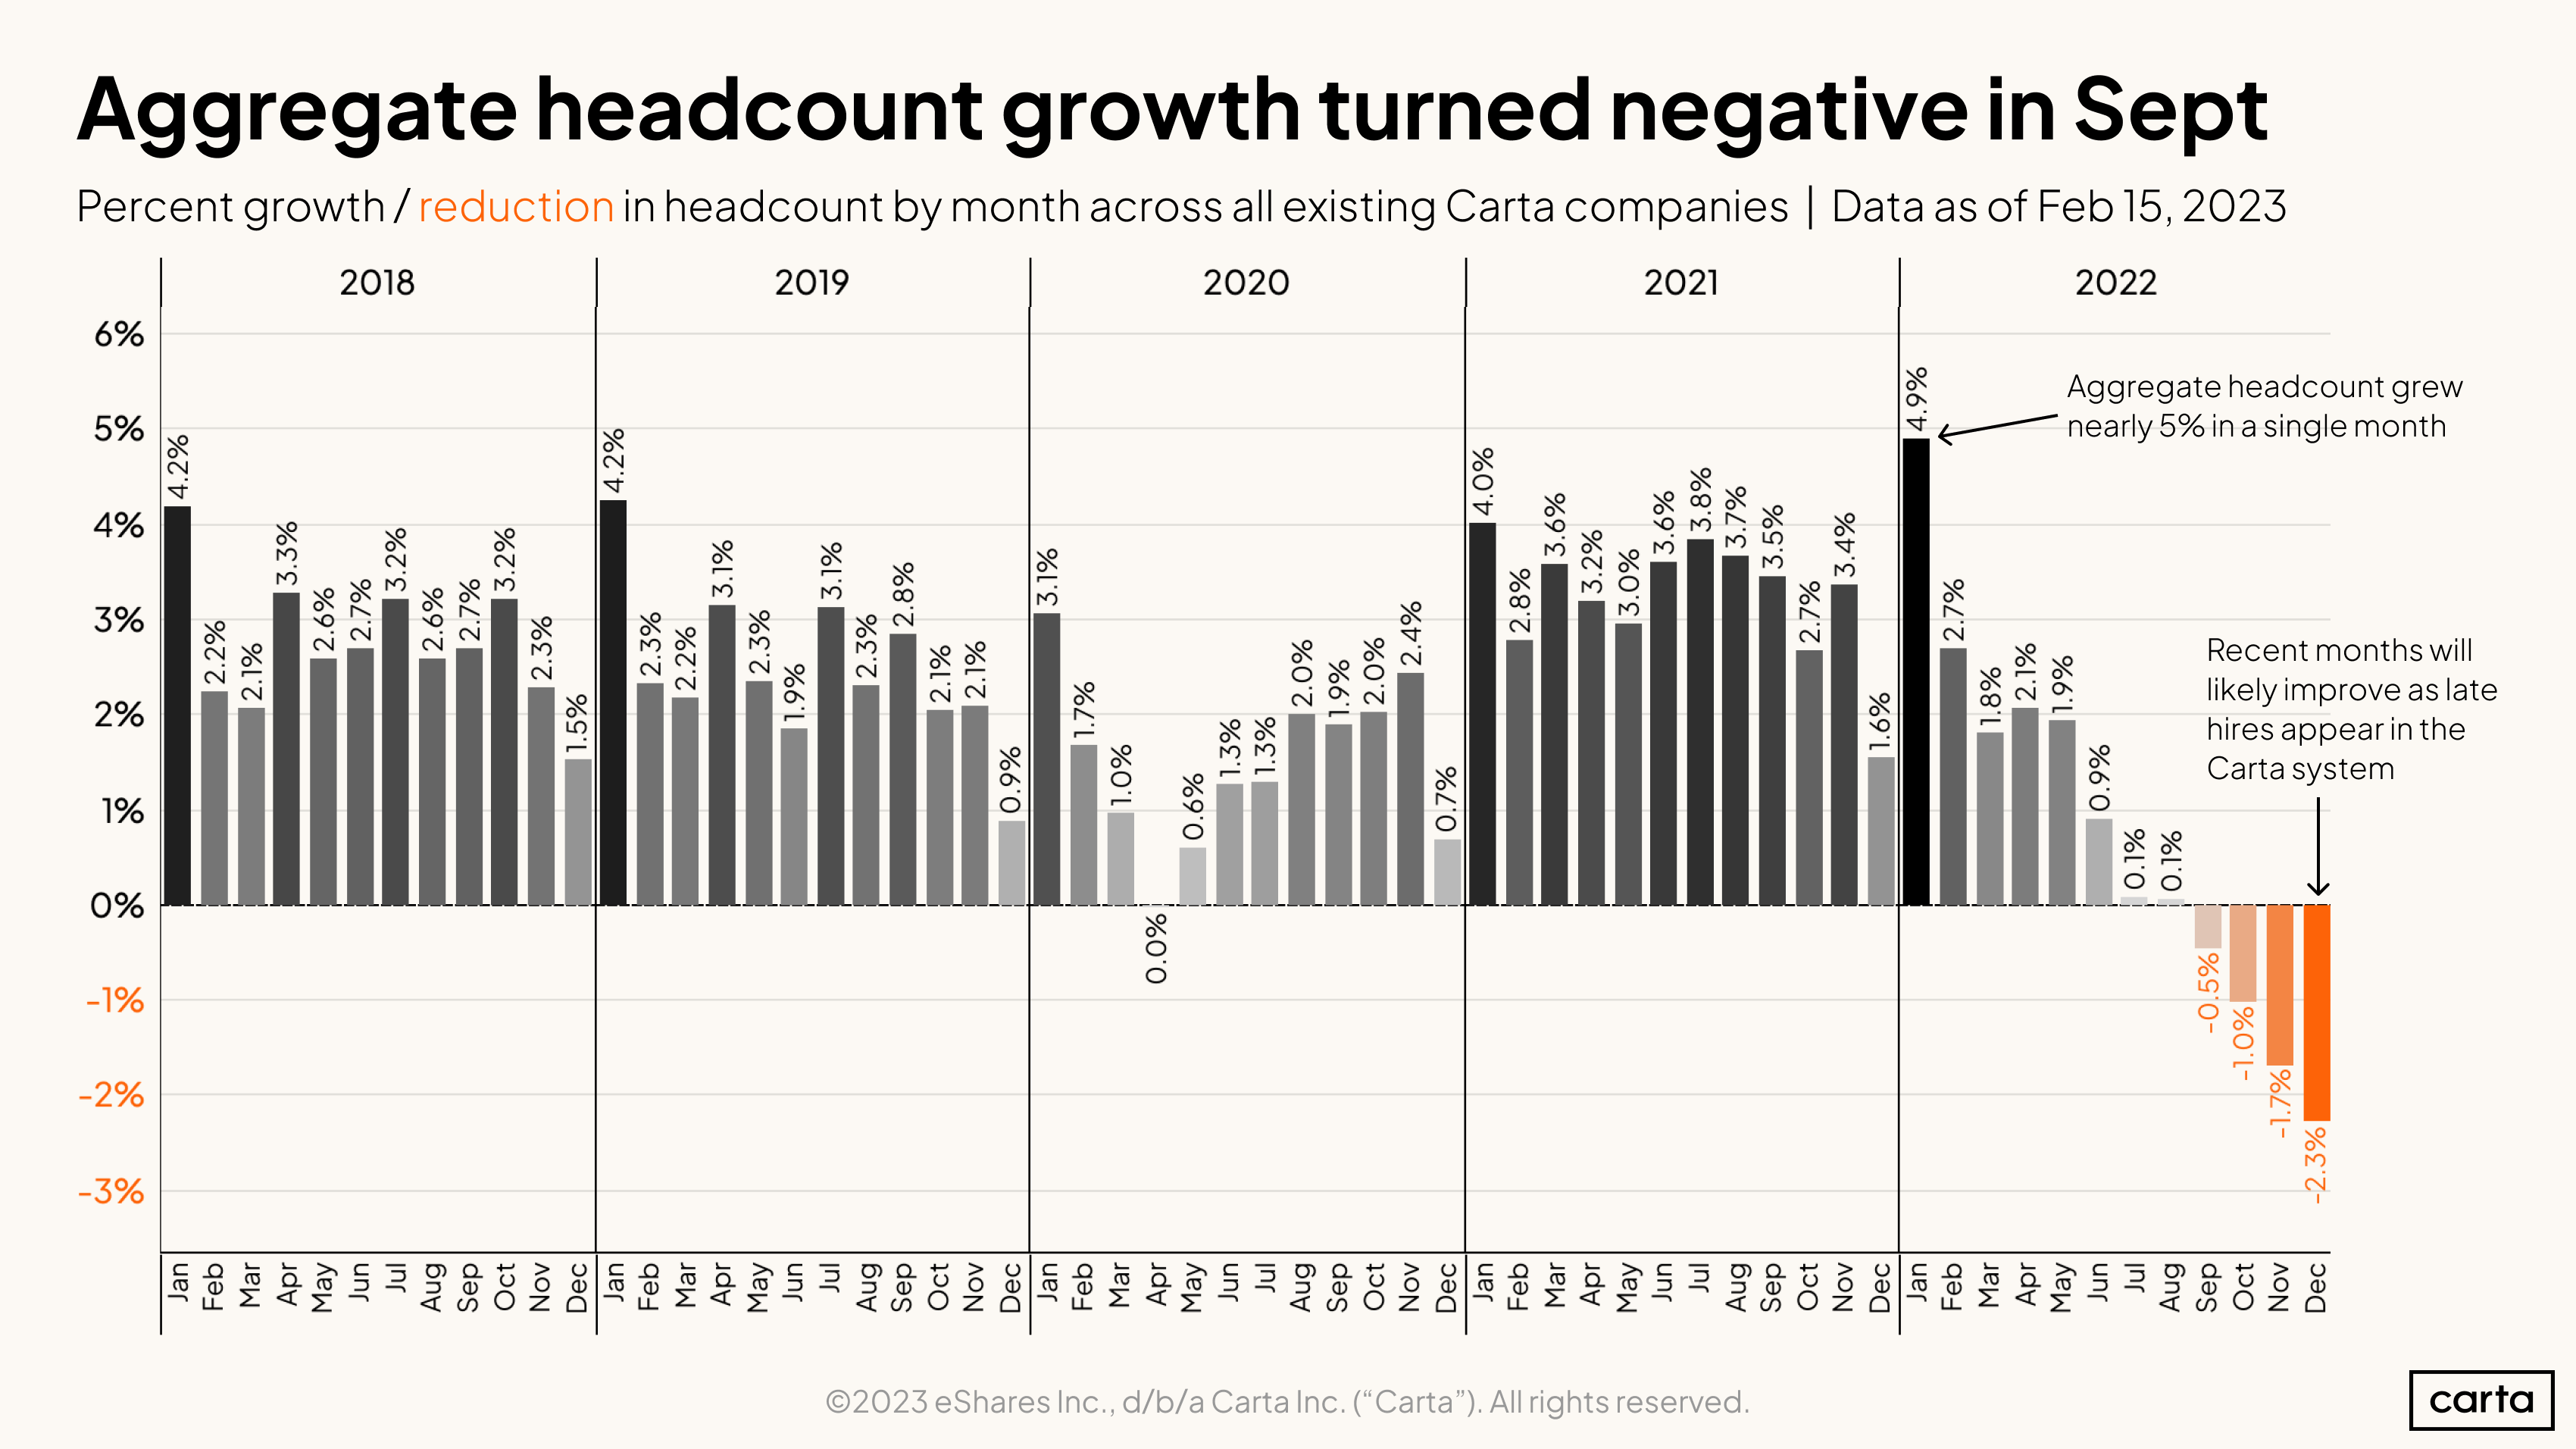
Compared to years past, hiring as a whole is down across the startup ecosystem. We expect those orange bars representing negative headcount growth over the past several months to rise slightly as Carta becomes aware of hires who have already joined—but the trend is unmistakable.
From March 2022 onward, each month saw companies on Carta grow, in aggregate, less rapidly than they had the year before. Over the summer, growth slowed to a crawl before turning negative last September. It will be illuminating to see what the final growth figure is for January 2023 (as January has been the best new-hire month each year since 2018).
Headcount & payroll
So where do layoffs and slowed hiring leave startup headcounts today? Many companies are making do with less. Payroll is still the primary driver of cash burn for most companies, causing many to rethink their headcount projections in light of new fundraising dynamics.
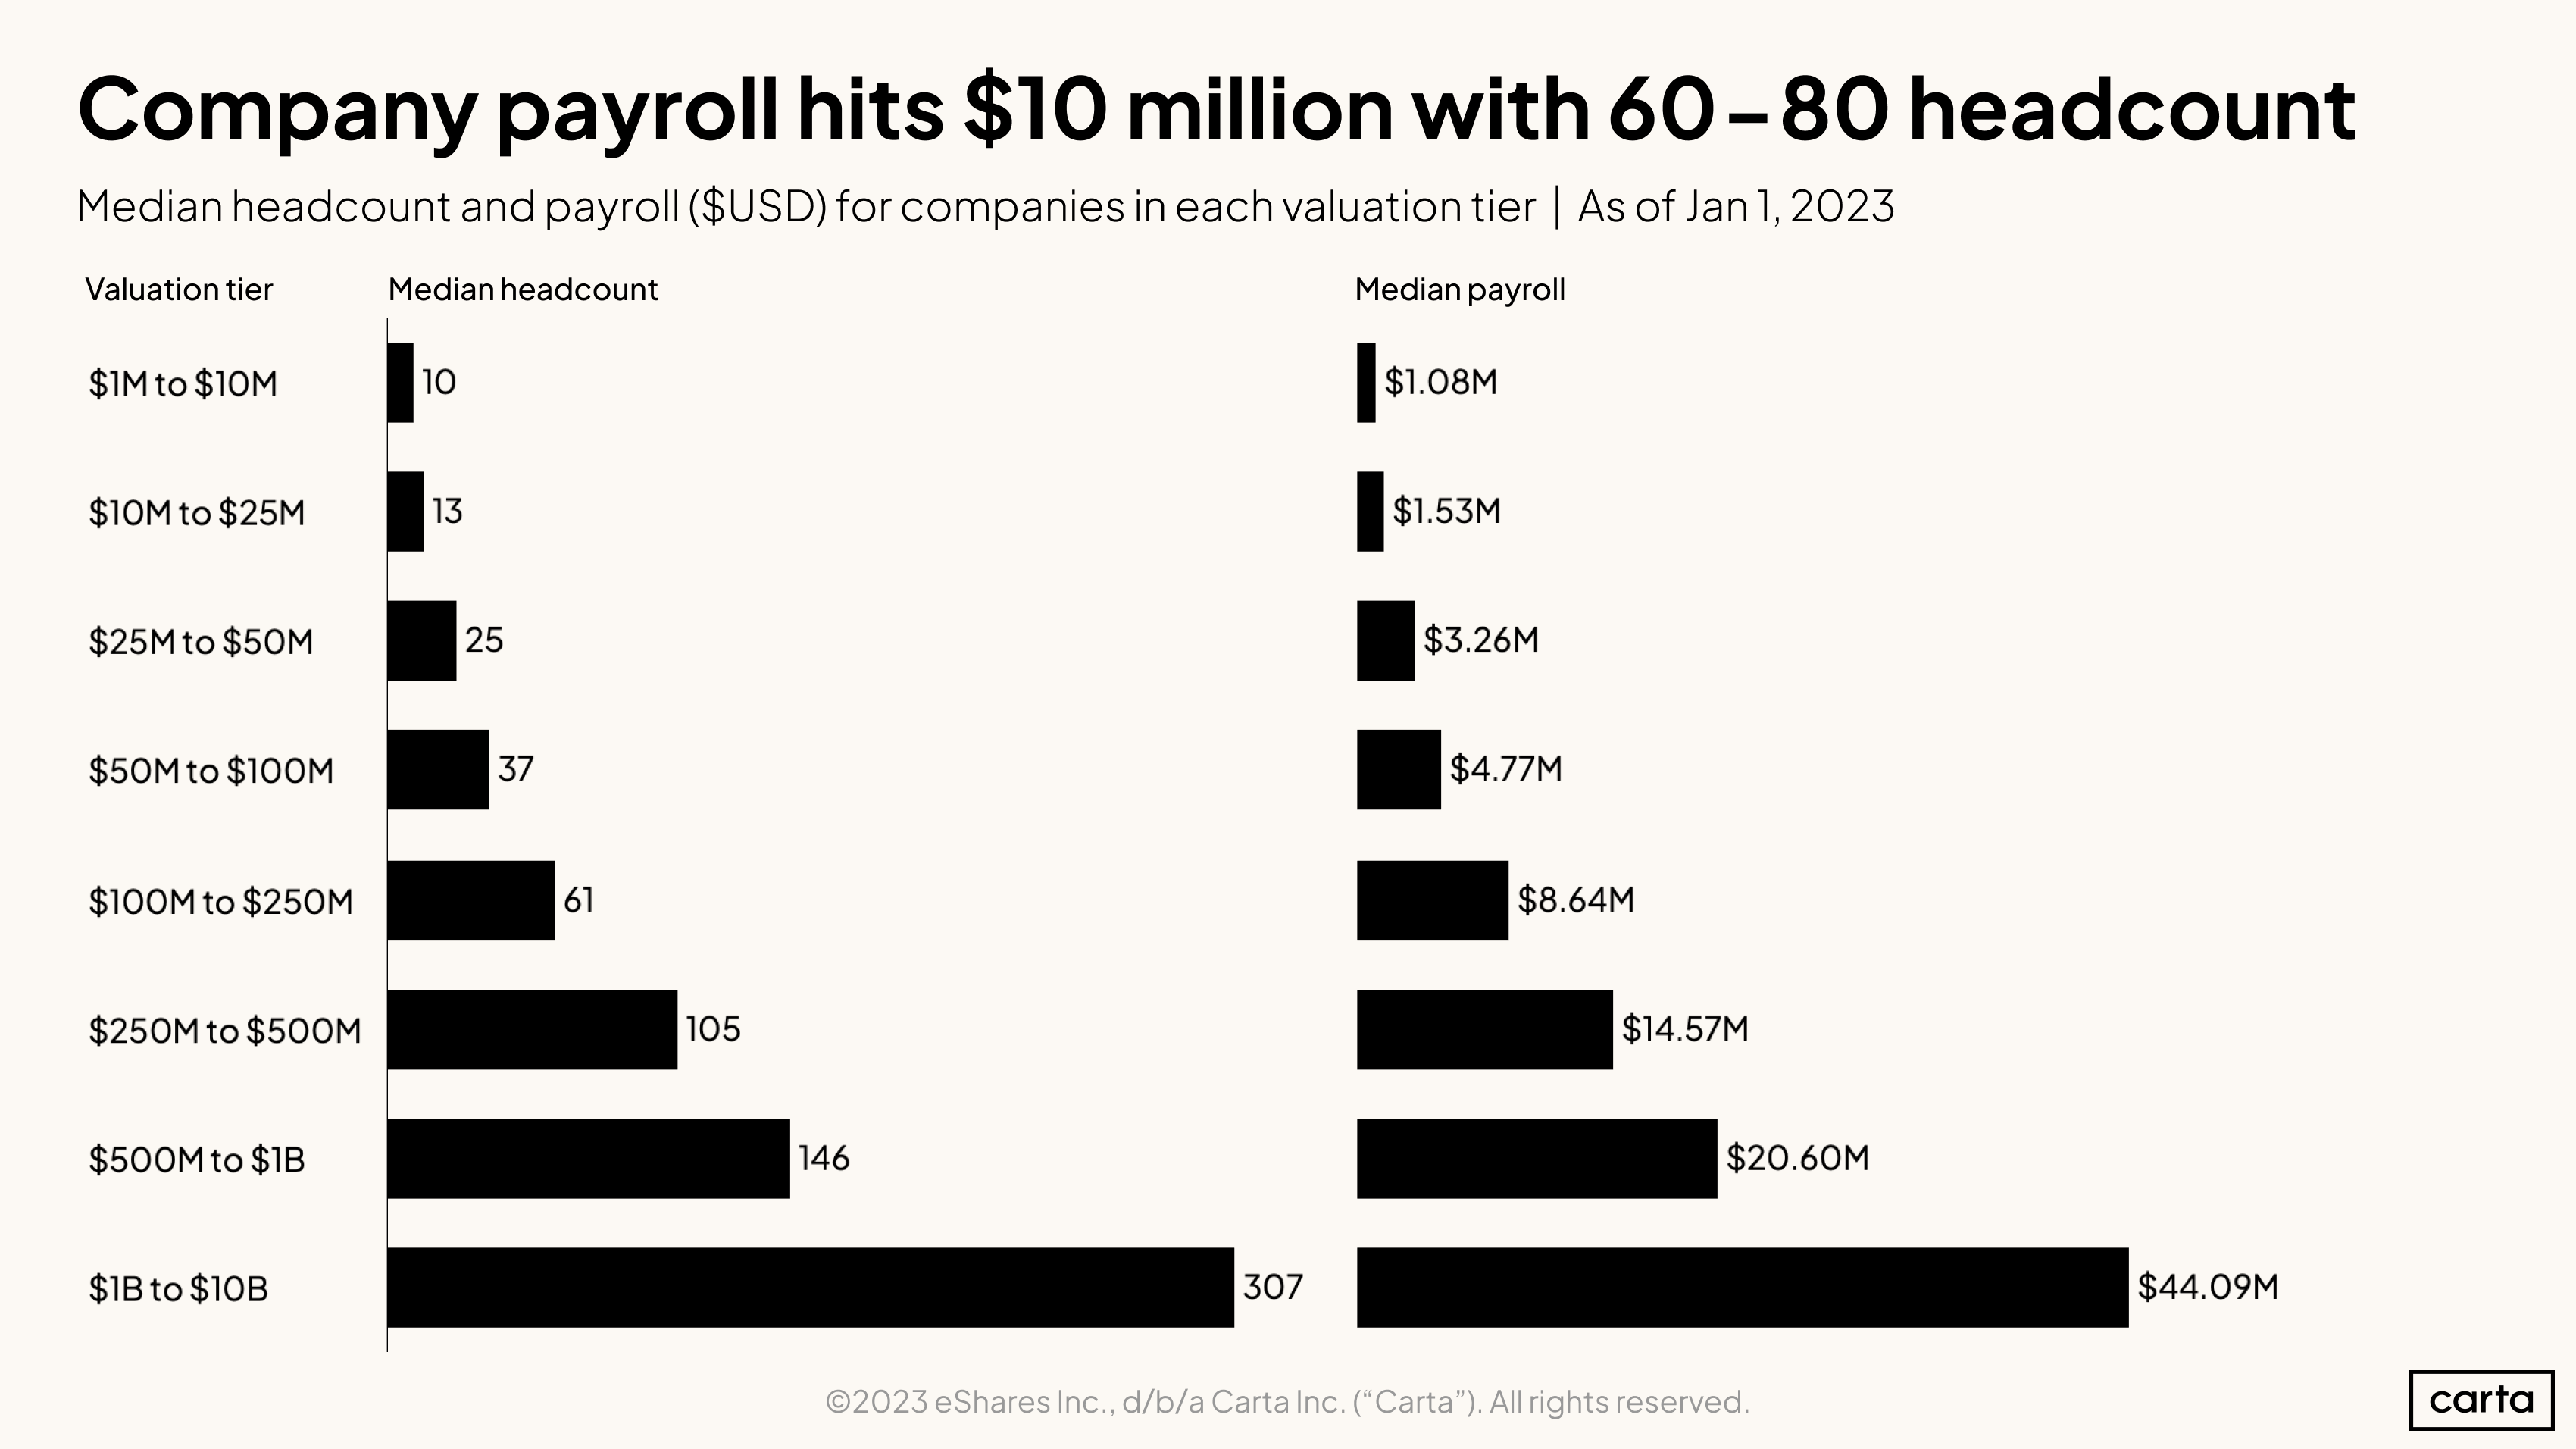
Company payroll typically crosses the $1 million threshold around the time the company reaches a $10 million valuation. A company typically breaks through the $10 million payroll threshold when it has 60-80 employees.
Payroll, headcount, and company valuation don’t scale at the same pace. Because payroll is a function of headcount, the two metrics scale alongside each other. Company valuation, however, scales faster.
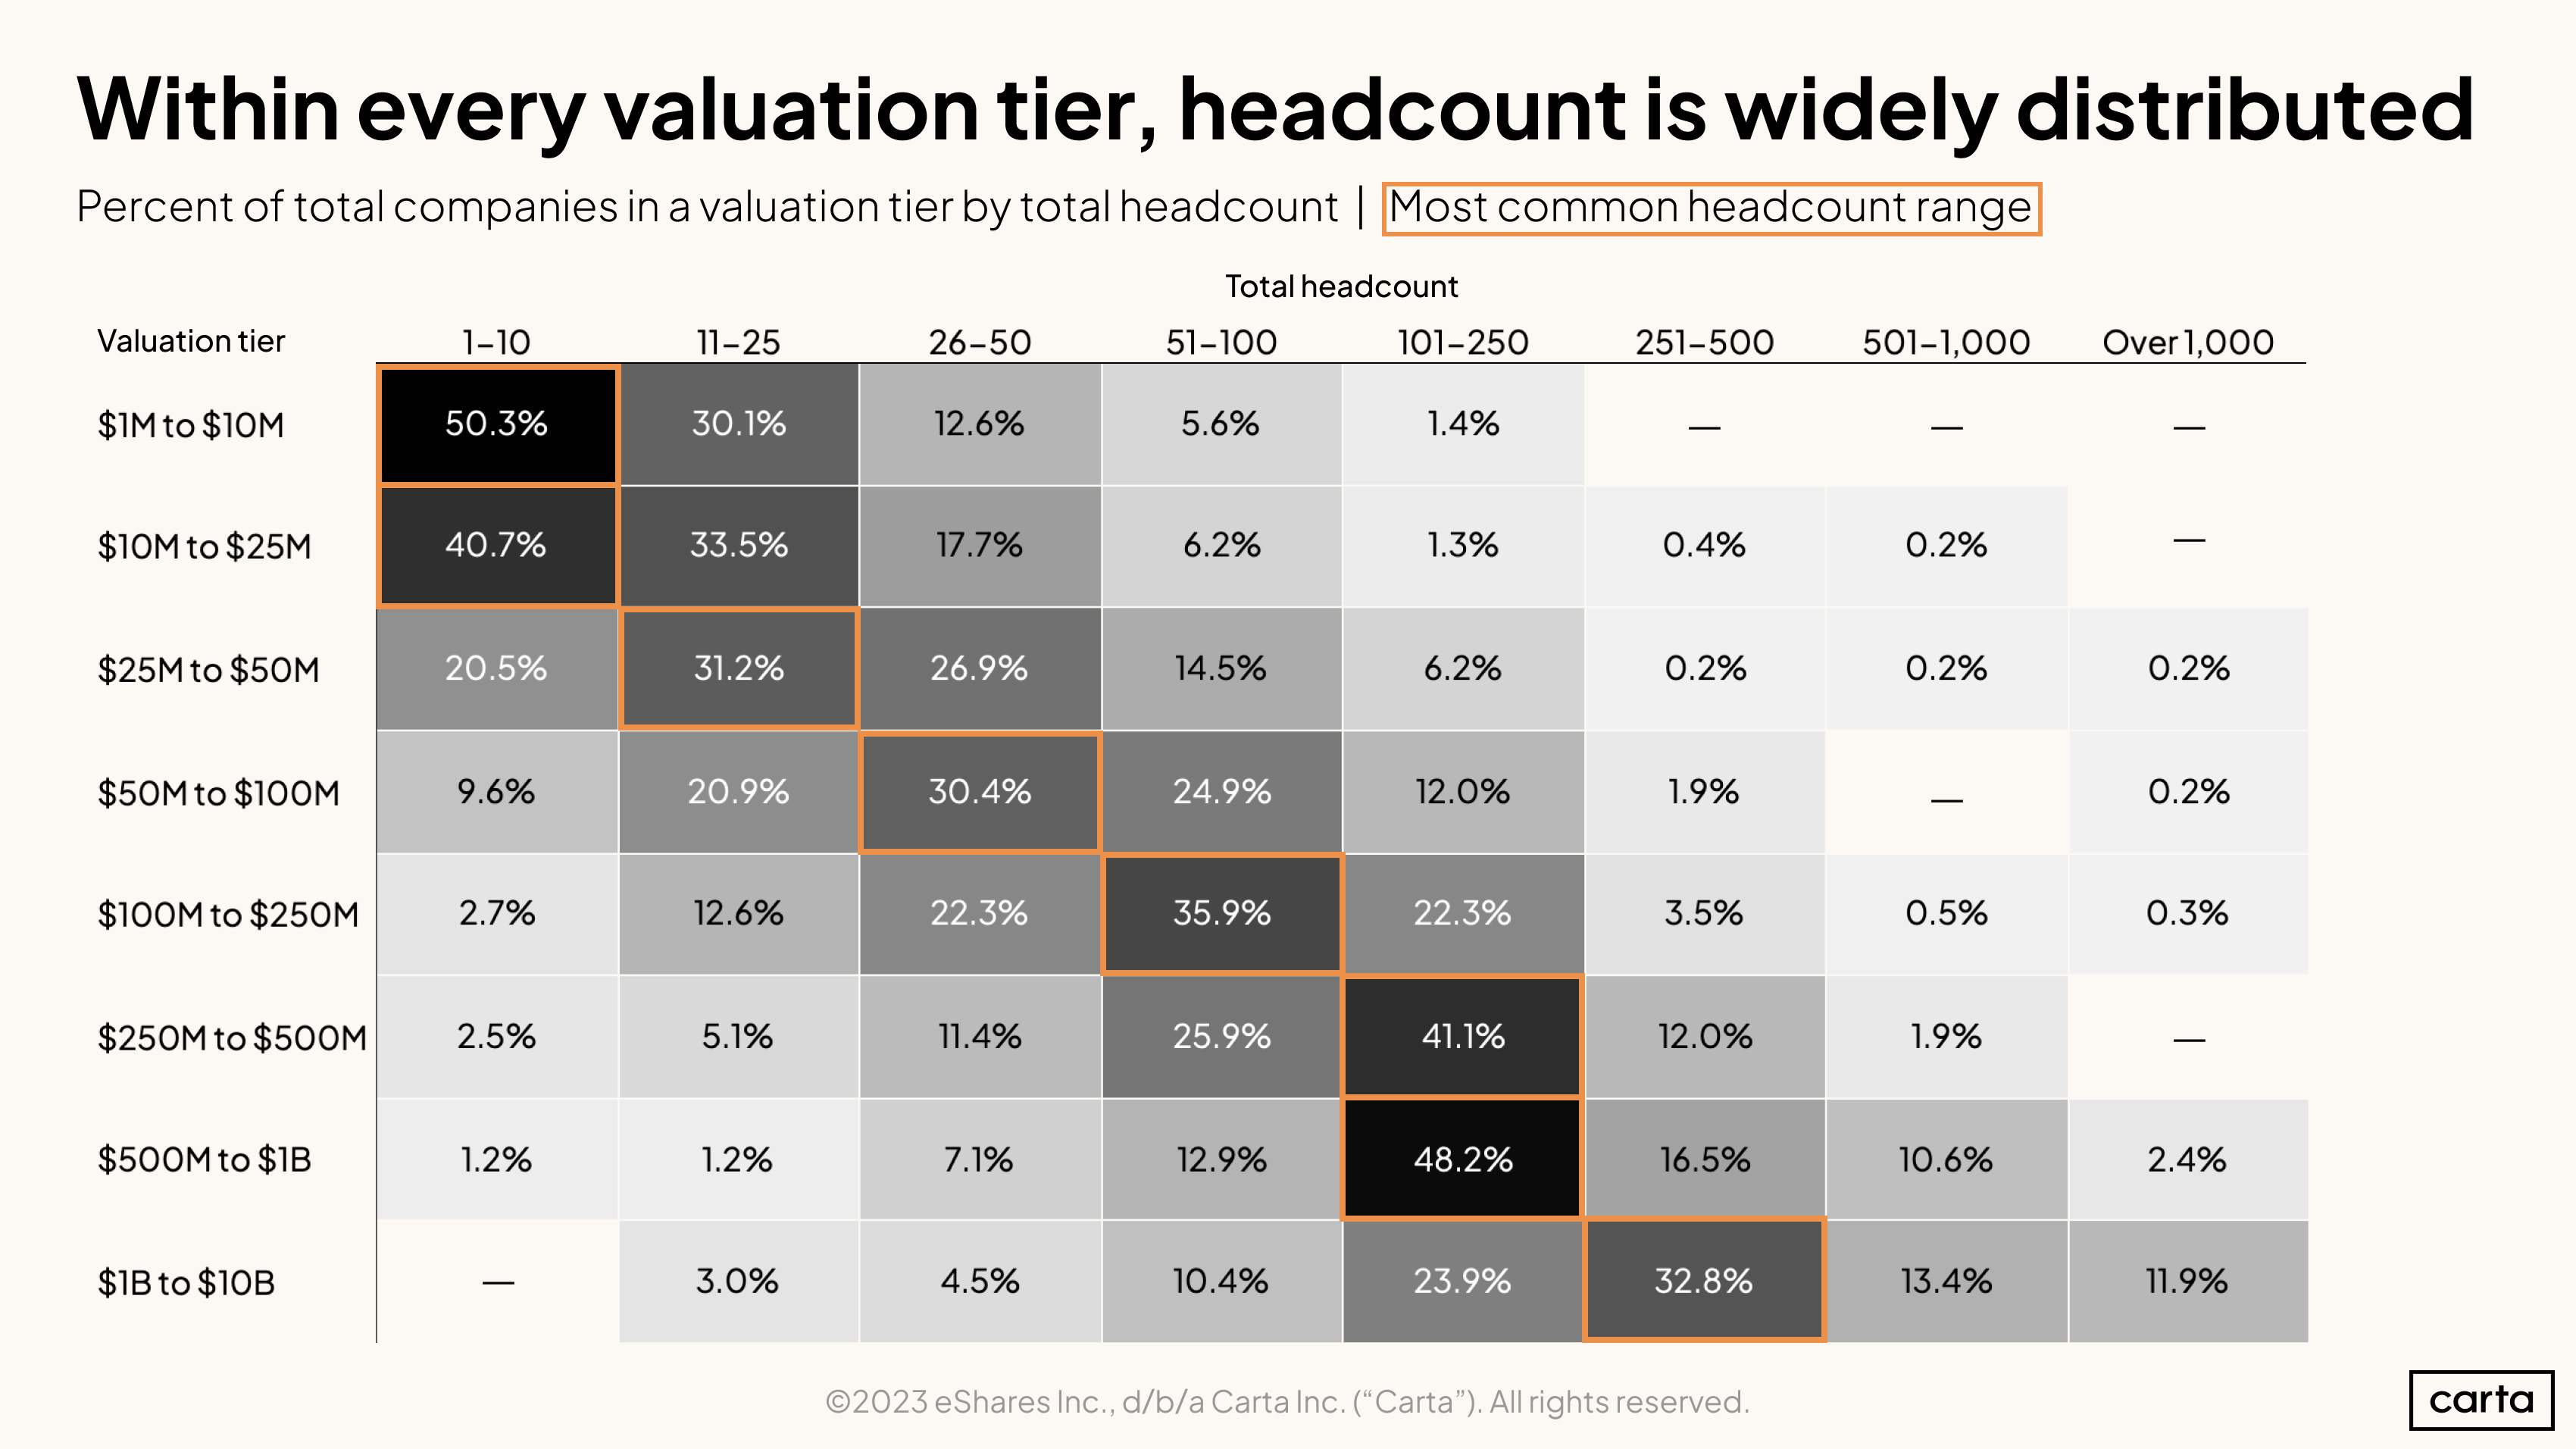
Companies in each valuation tier tend to cluster around specific headcount ranges. For instance, about three quarters of companies worth less than $25 million have fewer than 25 employees.
Headcount growth slowed significantly for smaller startups and turned negative for larger companies in the second half of 2022. As valuation resets for public tech companies took their toll on private valuations, many startups were forced to conserve cash by curtailing hiring plans and, in some cases, conducting layoffs.
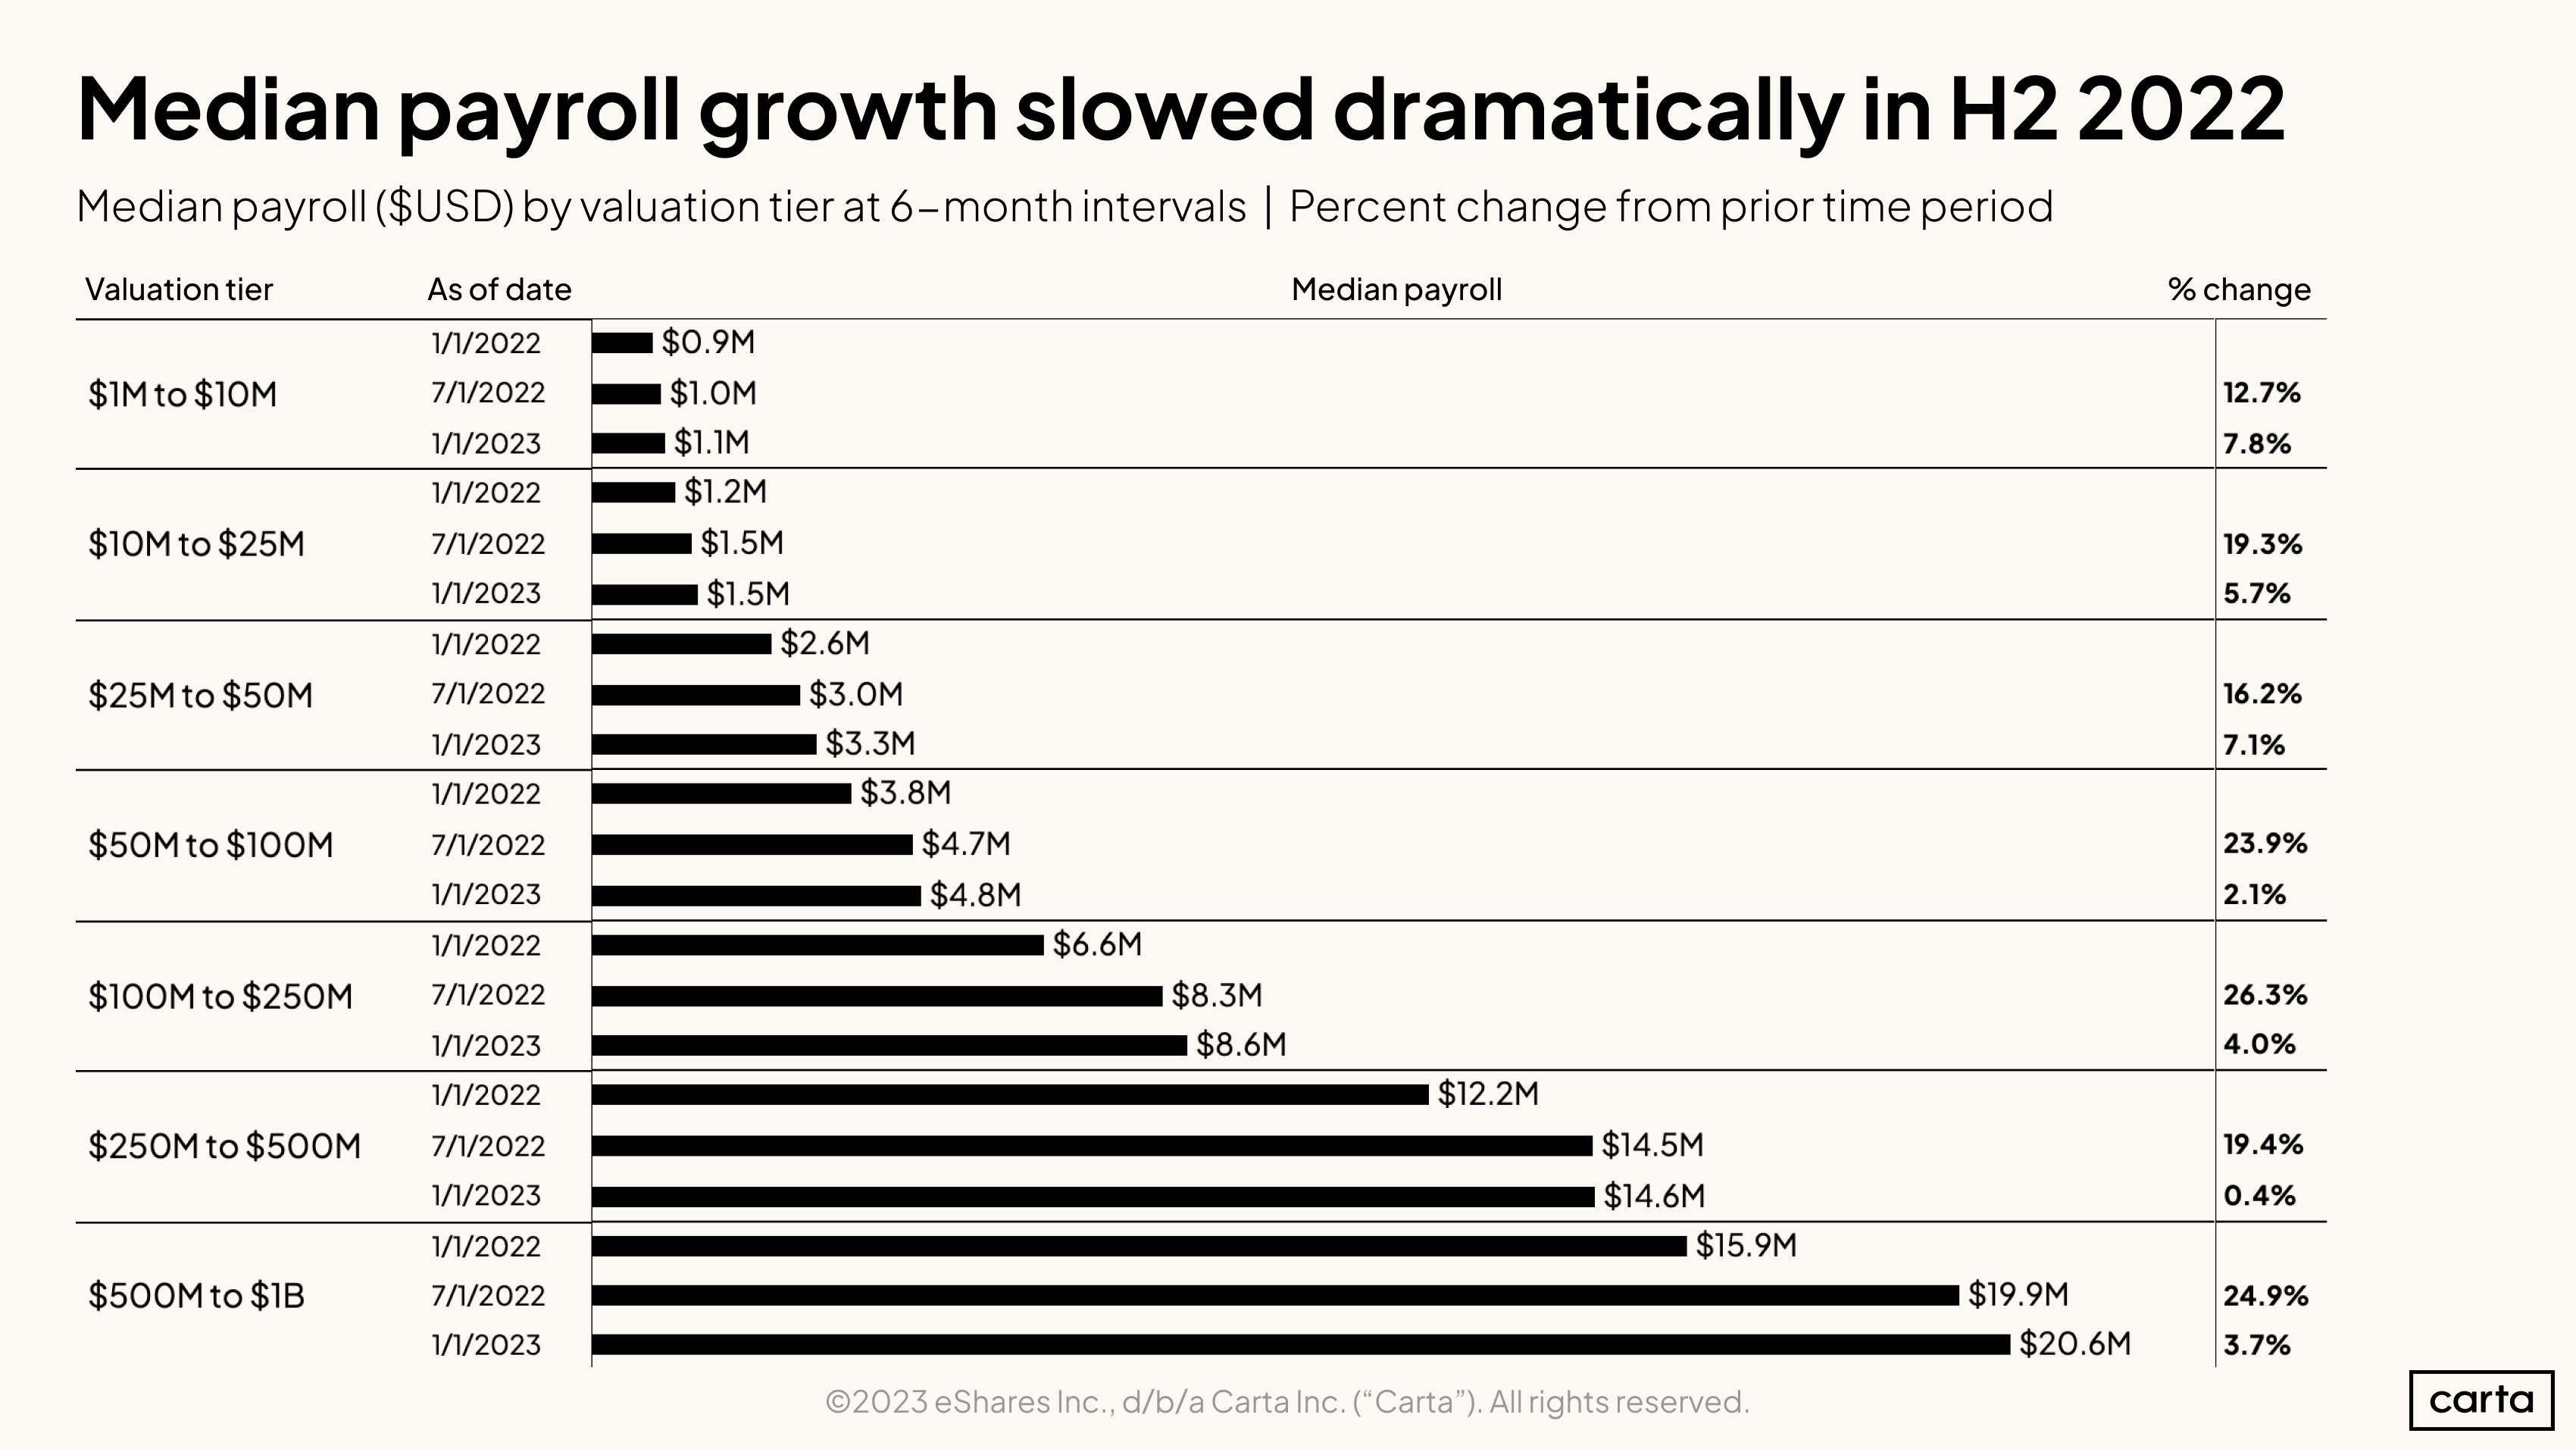
Payroll shows a similar dynamic to overall headcount: impressive growth over the first half of 2022, followed by a much reduced rise from July through December.
Across the startup ecosystem, January 2022 was a month of unprecedented hiring. Companies on Carta added 3.9 employees for every one who left that month. That ratio fell with every passing month last year.
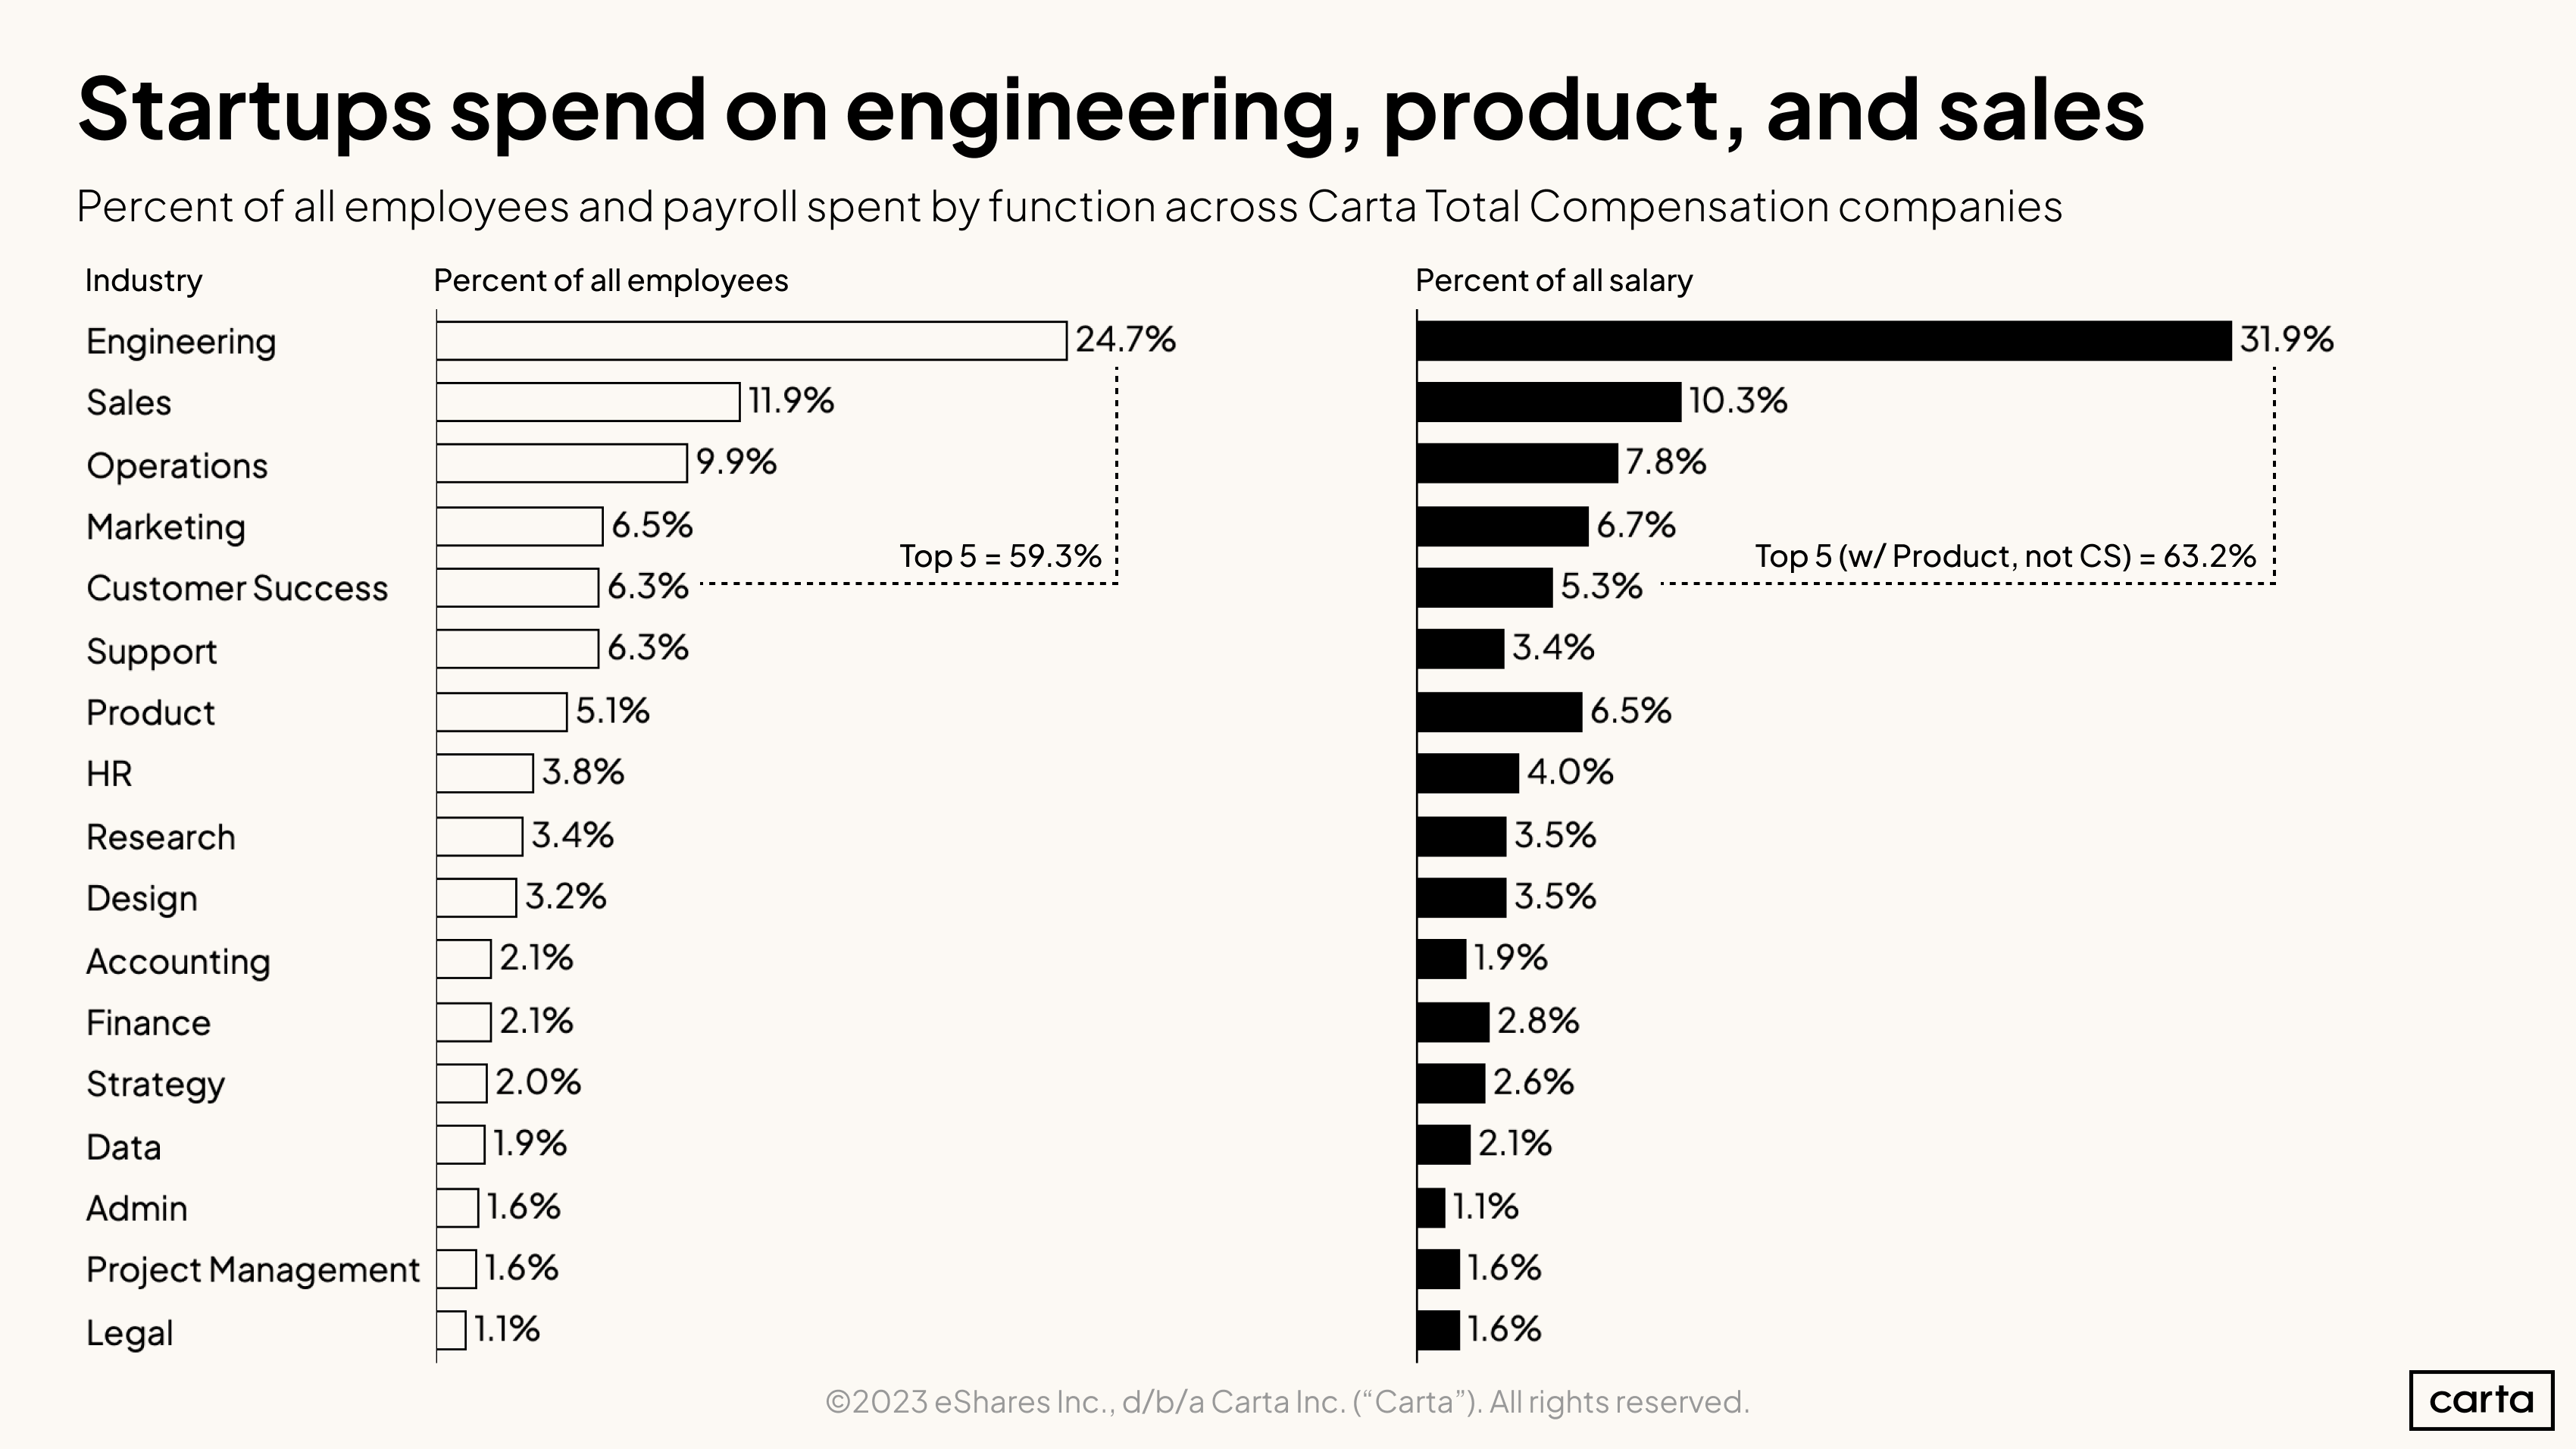
As expected, the largest job function across Carta Total Comp startups is engineering. Just under a quarter of employees are classified as engineers. Engineering accounts for an even more impressive share of headcount in smaller companies.
Nearly 60% of headcount—and over 60% of payroll—is spent on the top five functions (engineering, sales, operations, marketing, and customer success). For other job functions categorized above, startups are unlikely to have many employees until their growth requires it. The first HR hire, for example, is on average the 22nd employee.
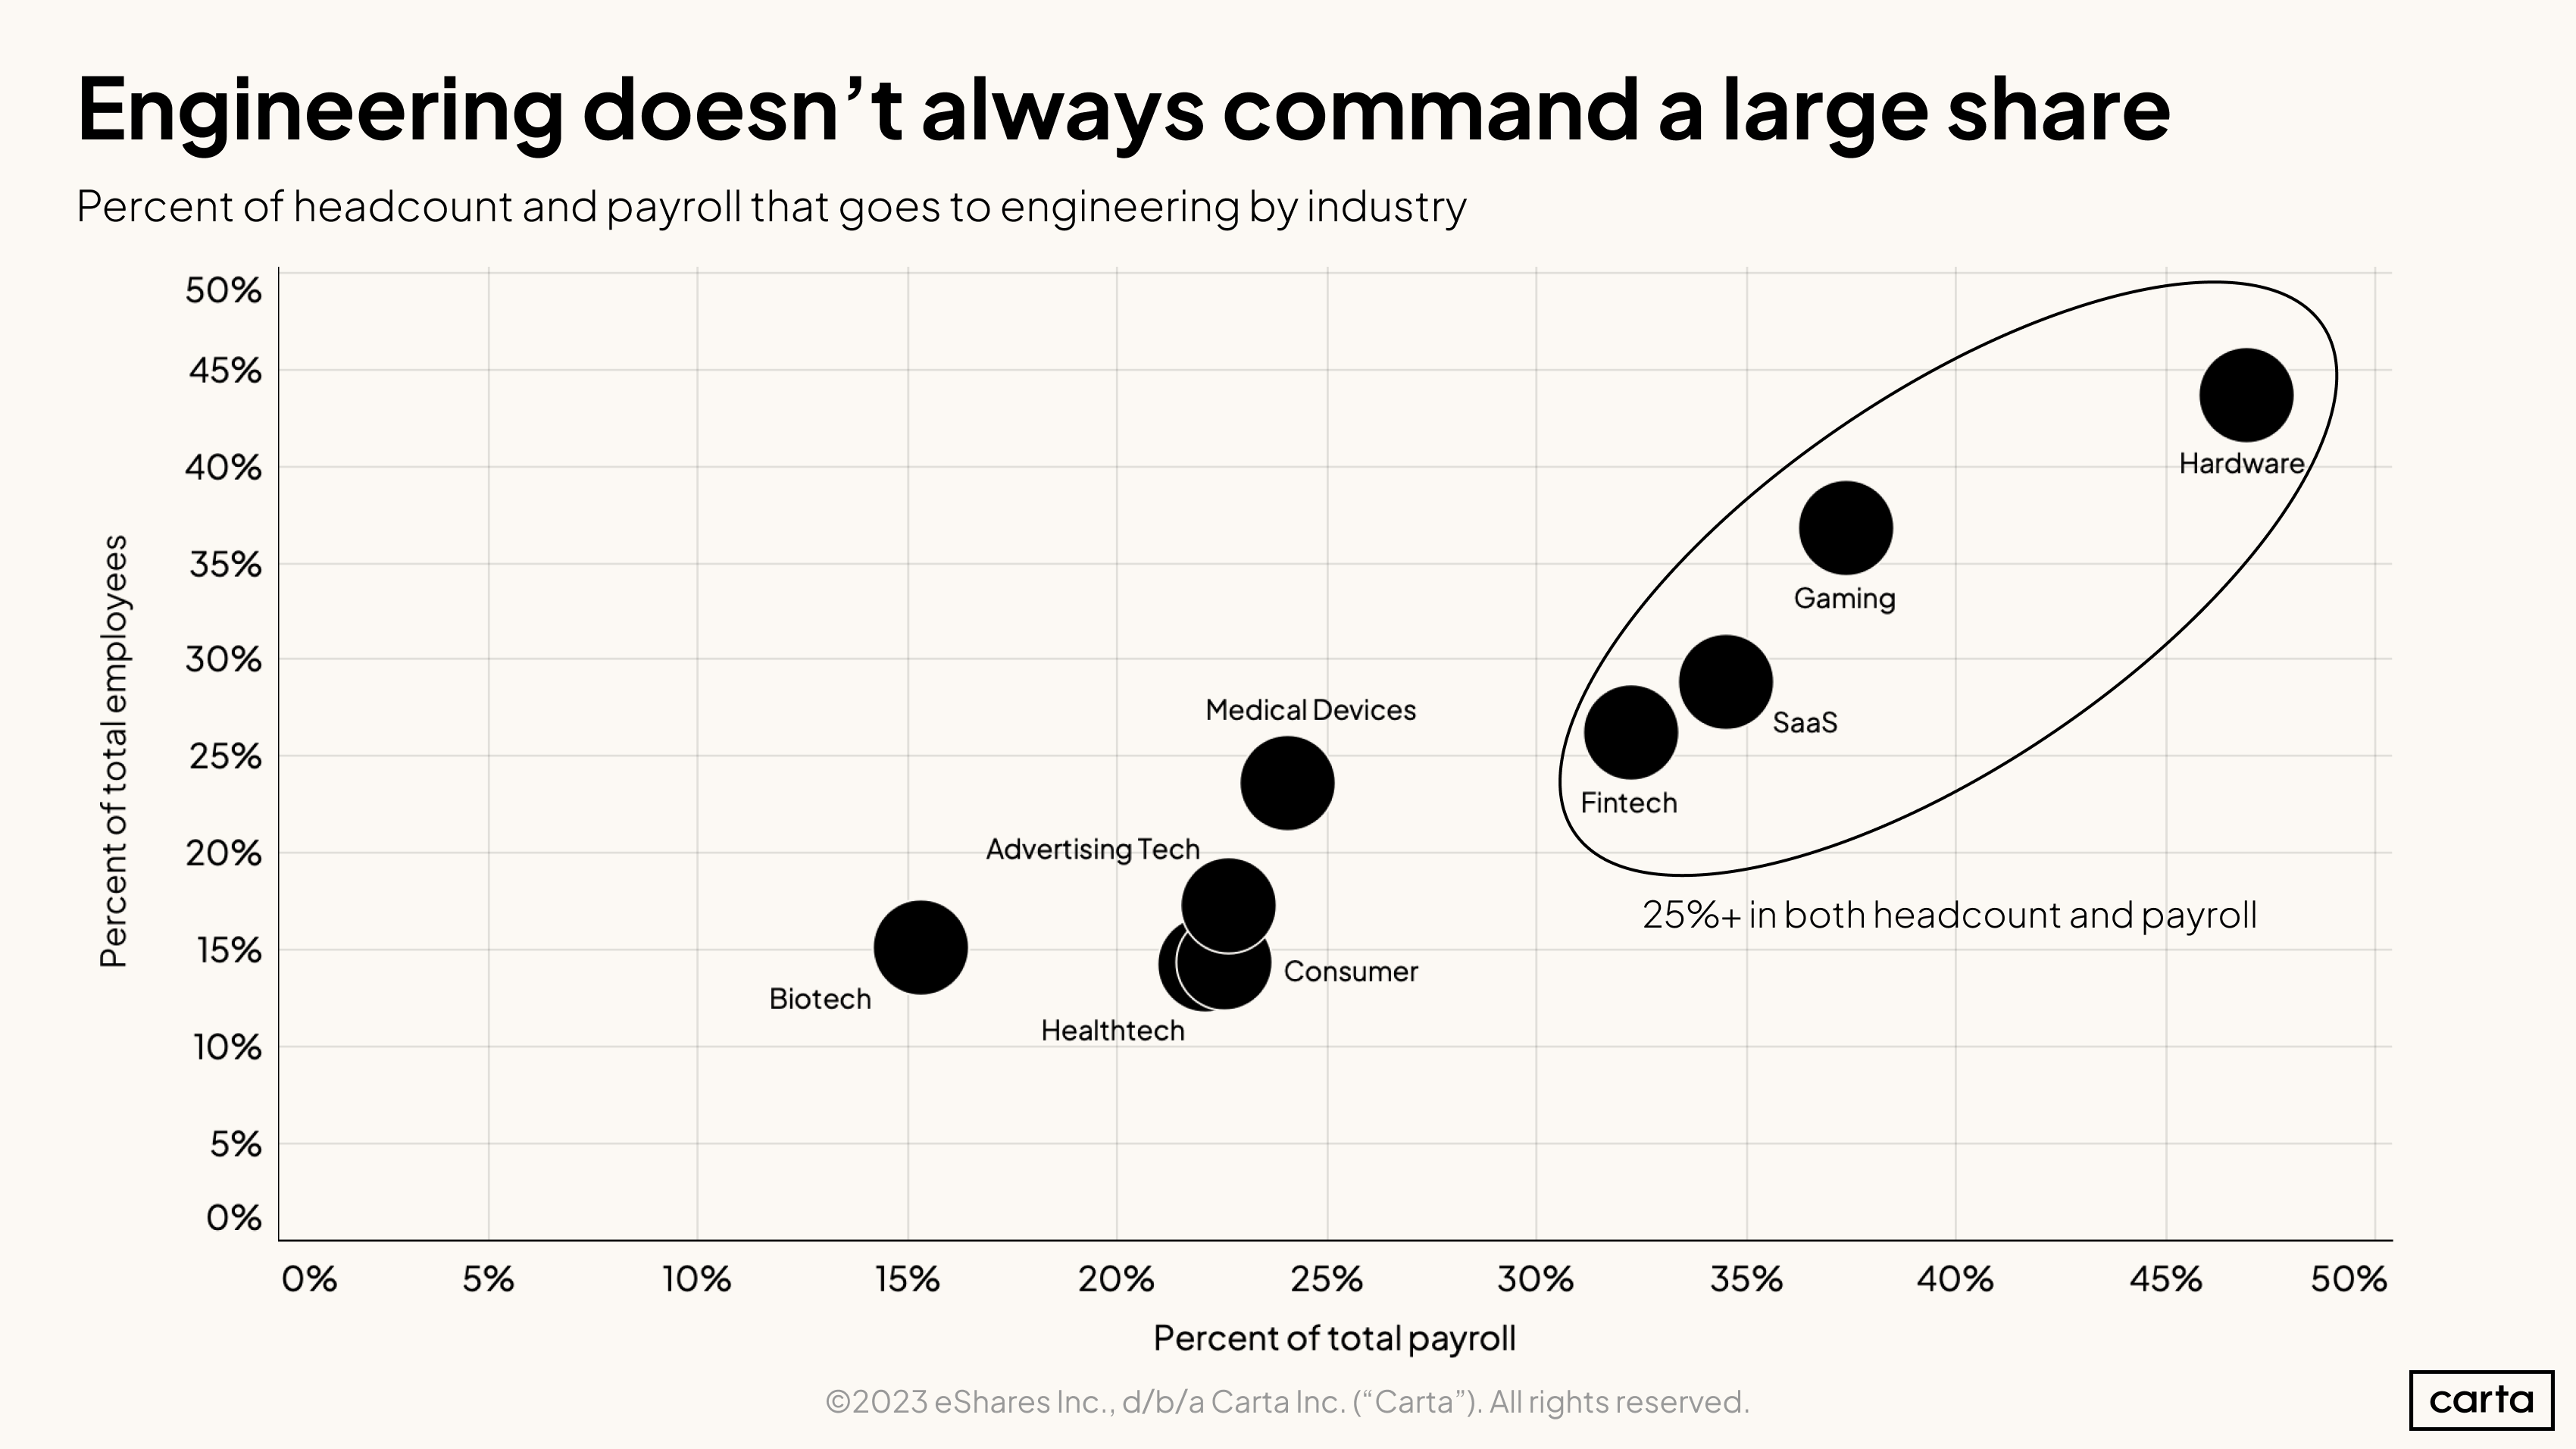
Although engineers represent 25% of all startup employees, that percentage varies across industries. Hardware companies are spending even more resources on engineers than other sectors, while industries like biotech devote more cash to specialized talent like scientific researchers.
Salary changes over time
Are tech layoffs the harbinger of decreasing employee compensation?
It depends greatly on the role in question. Carta Total Comp tracks hundreds of salary bands. A salary band is defined as the combination of a job function, role, and valuation—for example, an engineering manager at a company worth $50M-$100M. On average, those bands increased by 2.1% from April to August and declined 0.4% from August to November.
Not every band saw a decrease in average salary in the second half of the year. But as the constricted cluster of black data points shows, bands that eked out some salary gains from August to November had more modest increases than in prior months.
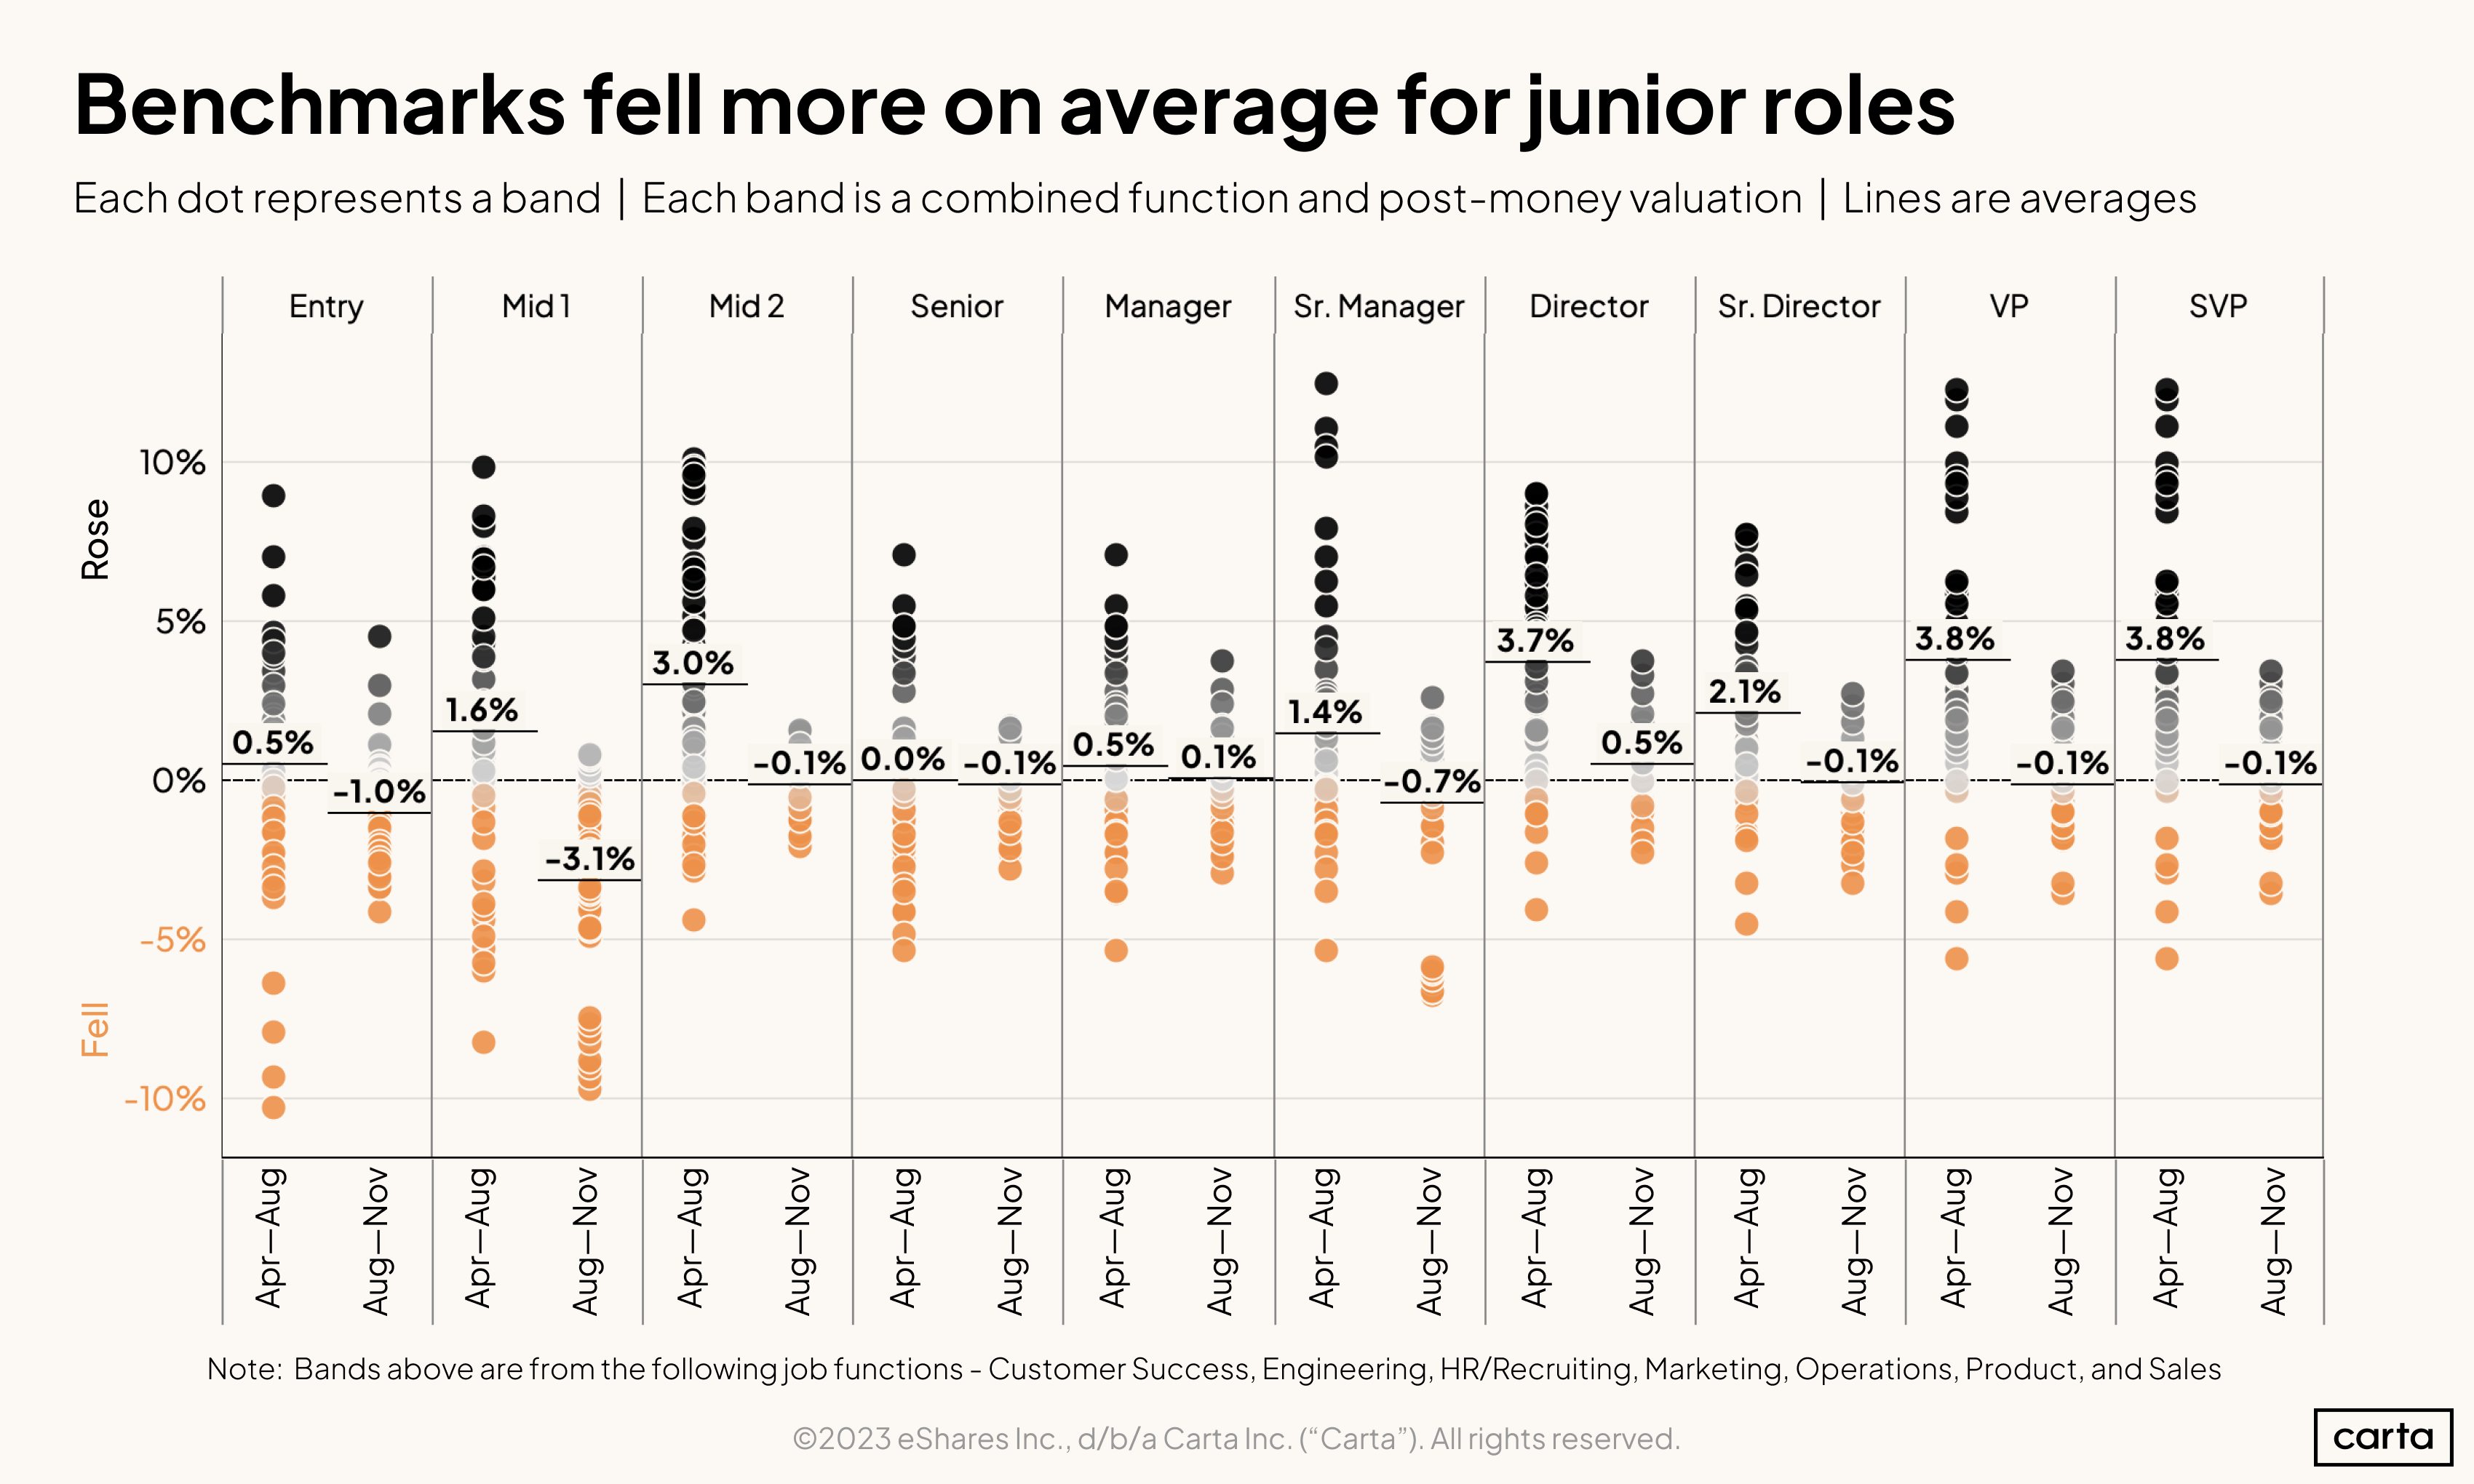
Adding seniority to this analysis highlights which employees saw the biggest impacts on their market benchmarks.
Workers in entry-level roles saw their benchmarks drop by an average of 1% from August to November. Those just above entry-level fared even worse, seeing their market benchmarks decline over 3%.
Salary benchmarks for executives at the director level and above, which had been growing robustly earlier in 2022, plateaued from August to November.
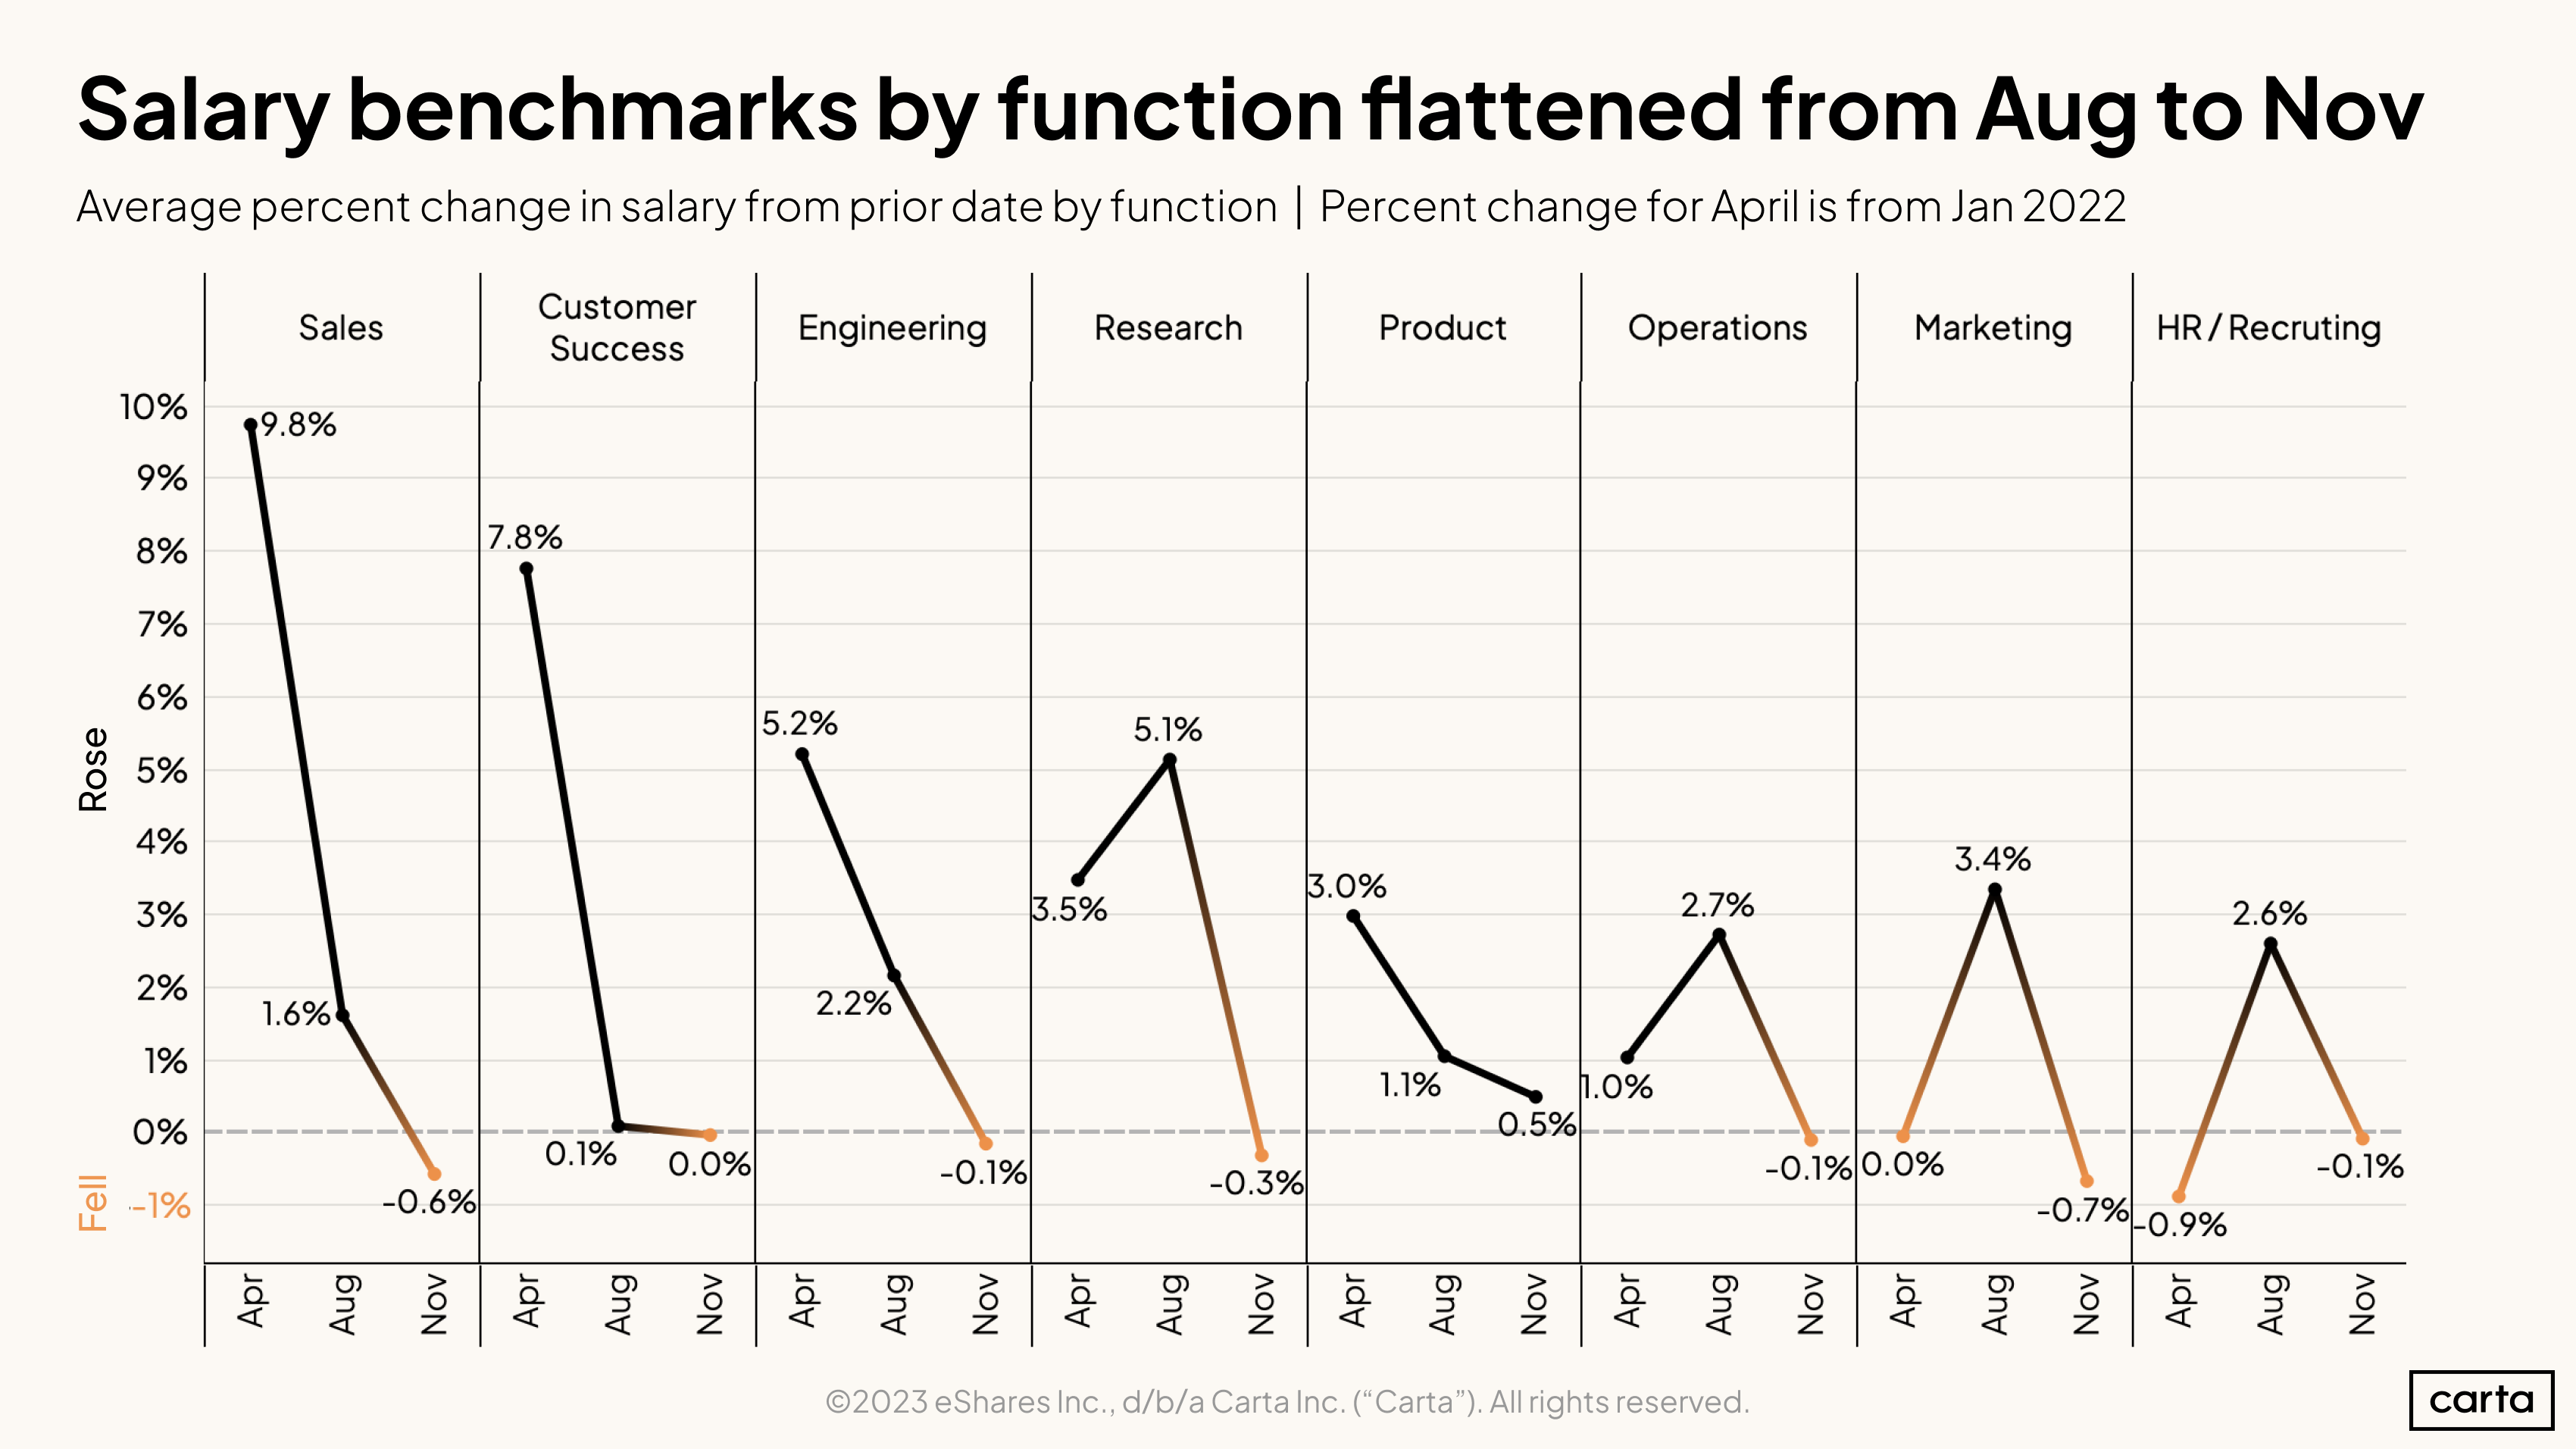
When we examine the data by job function instead of seniority, the results are more equal. Every function saw average salary plateau or dip slightly between August and November.
Engineering, the most populous function, offers a convenient proxy for startup salaries as a whole. After leaping forward by more than 5% from January to April, salary growth slowed to 2.2% between April and August before basically flatlining for the rest of the year.
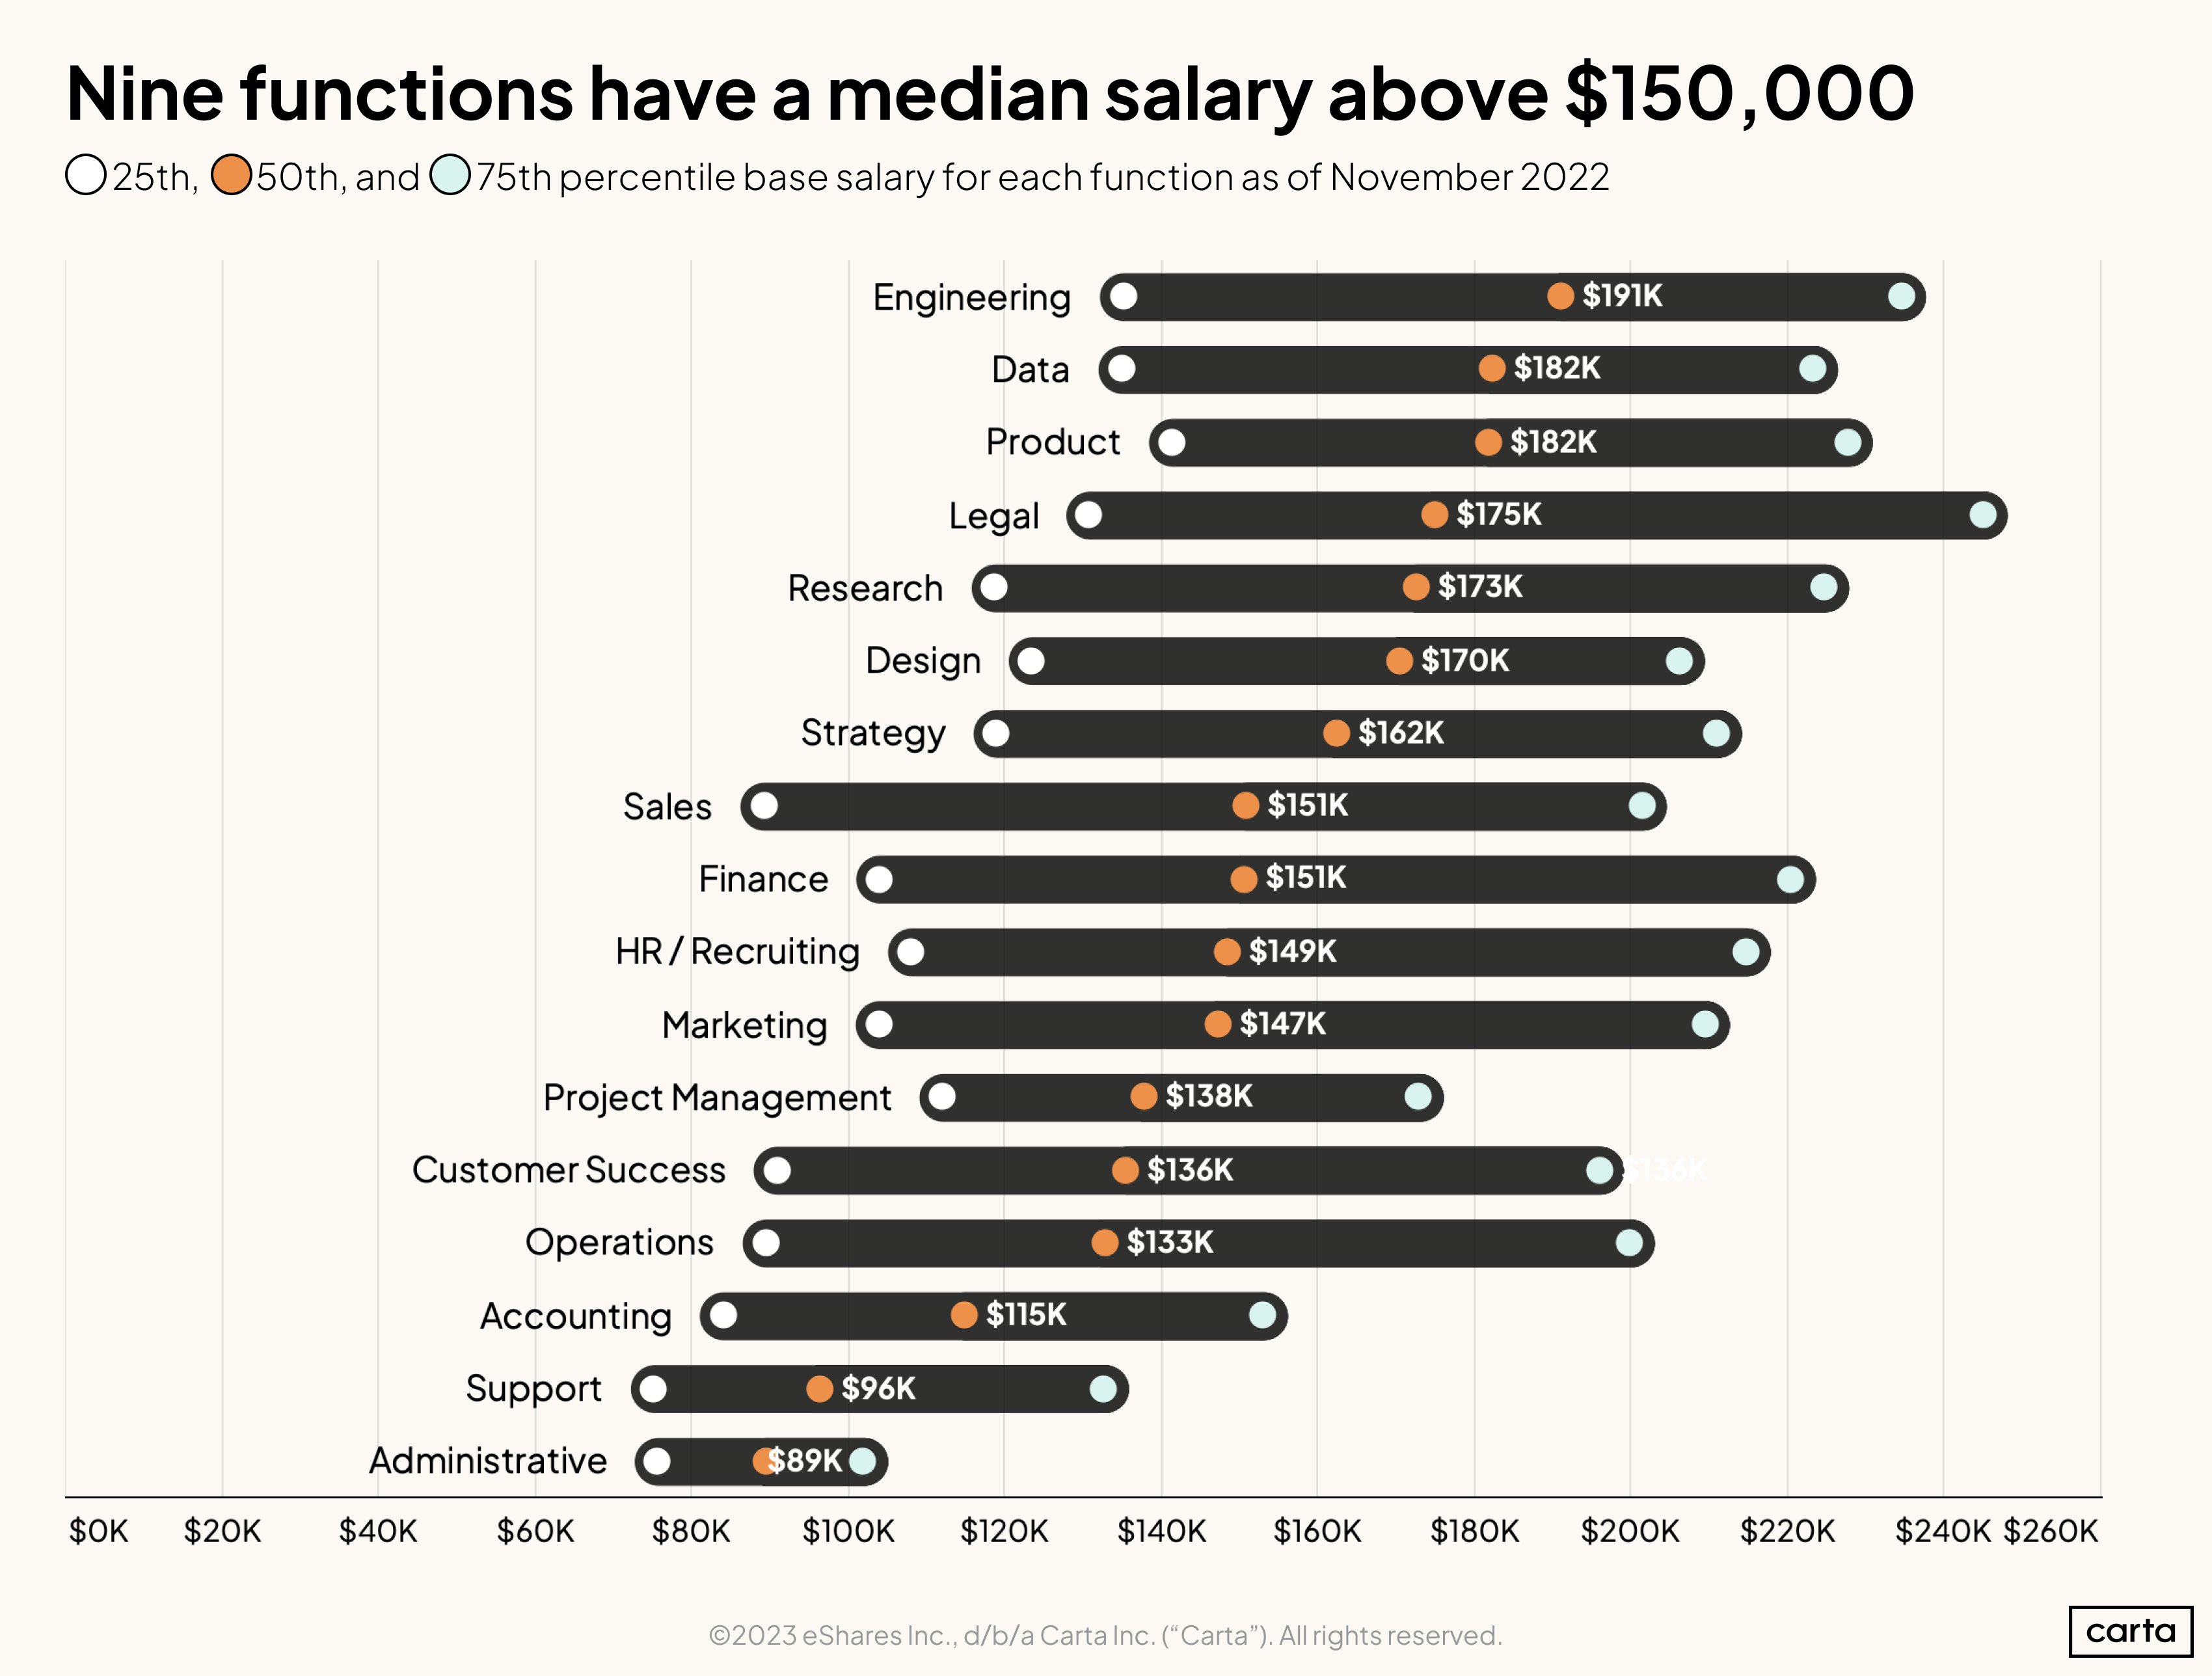
Engineers commanded the highest median salary across all startup functions as of November 2022, at $191,000. Nine functions received median salaries over $150,000, while 15 of 17 had six-figure medians.
The black bars above show how wide the gap is between the 25th and 75th percentiles of median salaries for each function. The wide variation is largely a function of company maturity; the dataset includes startups with post-money valuations ranging from $1 million to $5 billion.
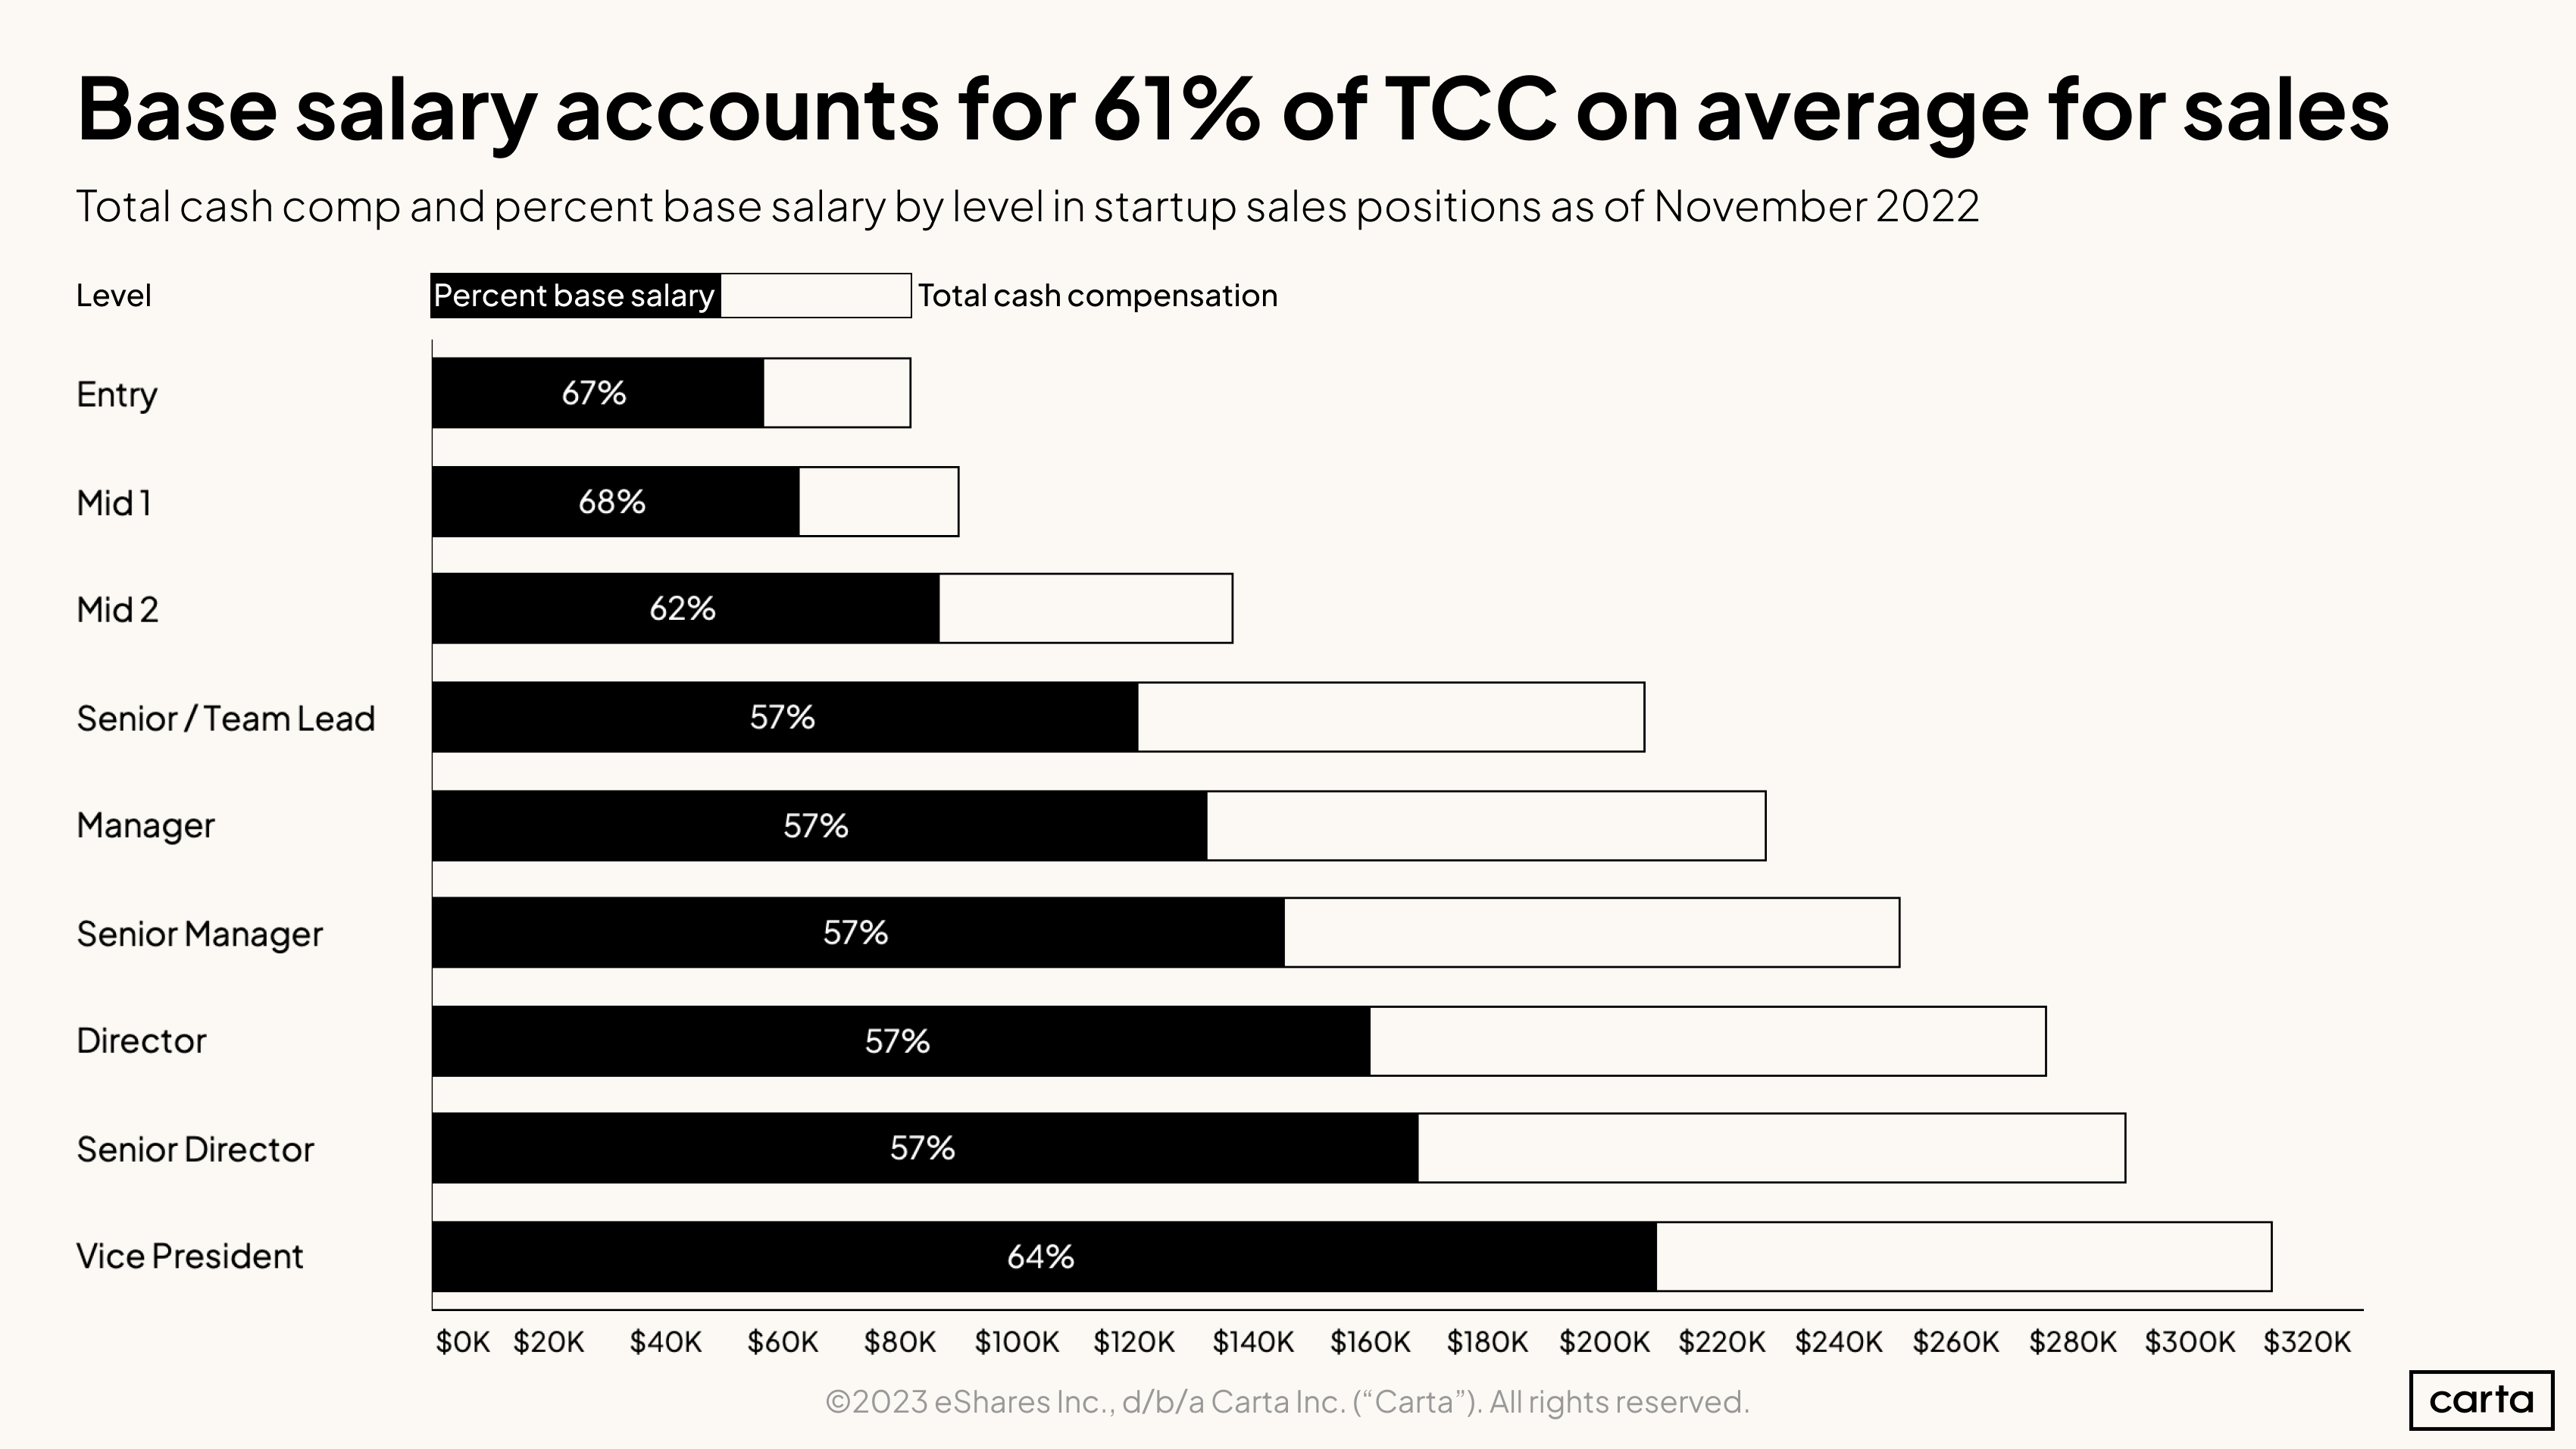
Sales has only the 8th-highest median base salary across functions, but a significant portion of sales compensation comes from commission or variable comp. Looking across the seniority levels of sales employees, base salary makes up 61% of a salesperson’s total cash compensation.
Remote work
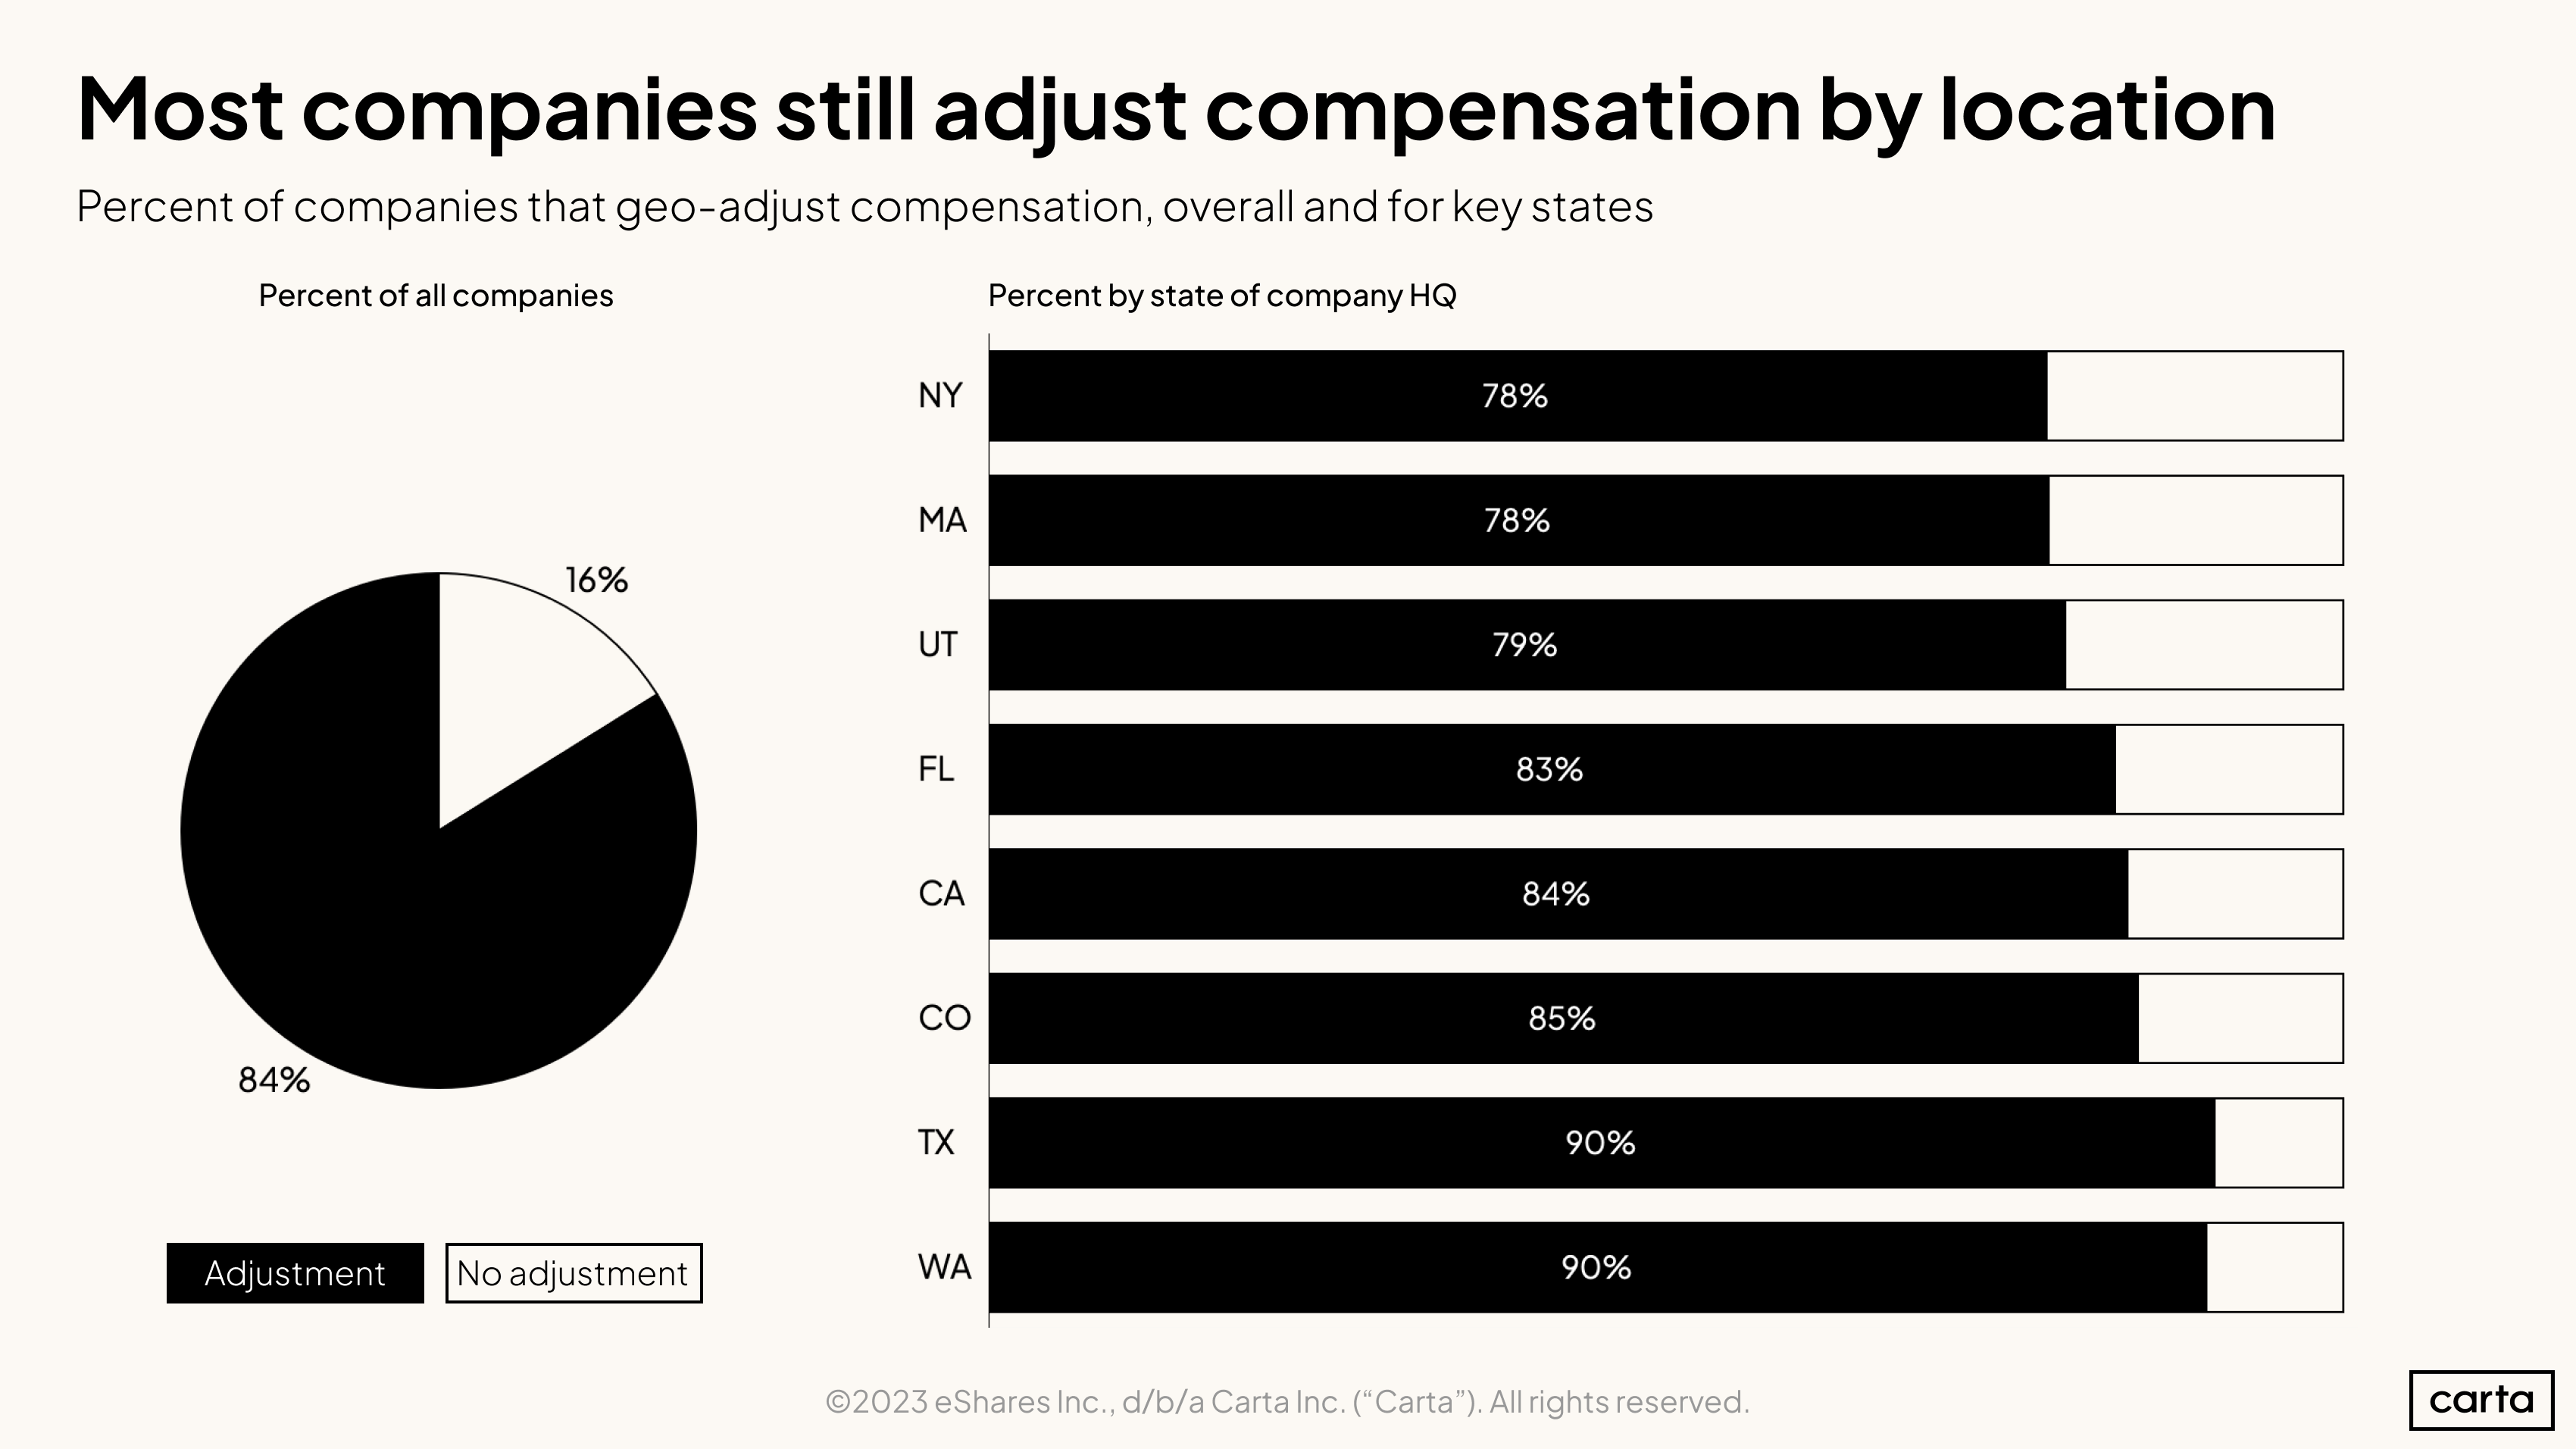
The narrative that companies would soon be compensating all employees equally, regardless of where that employee resided, has proven false. The vast majority of startups on Carta Total Comp use some form of geo-adjustment in their compensation strategies.
In New York, 22% of startups are paying the same regardless of location, while only 10% of startups in Texas and Washington do the same.
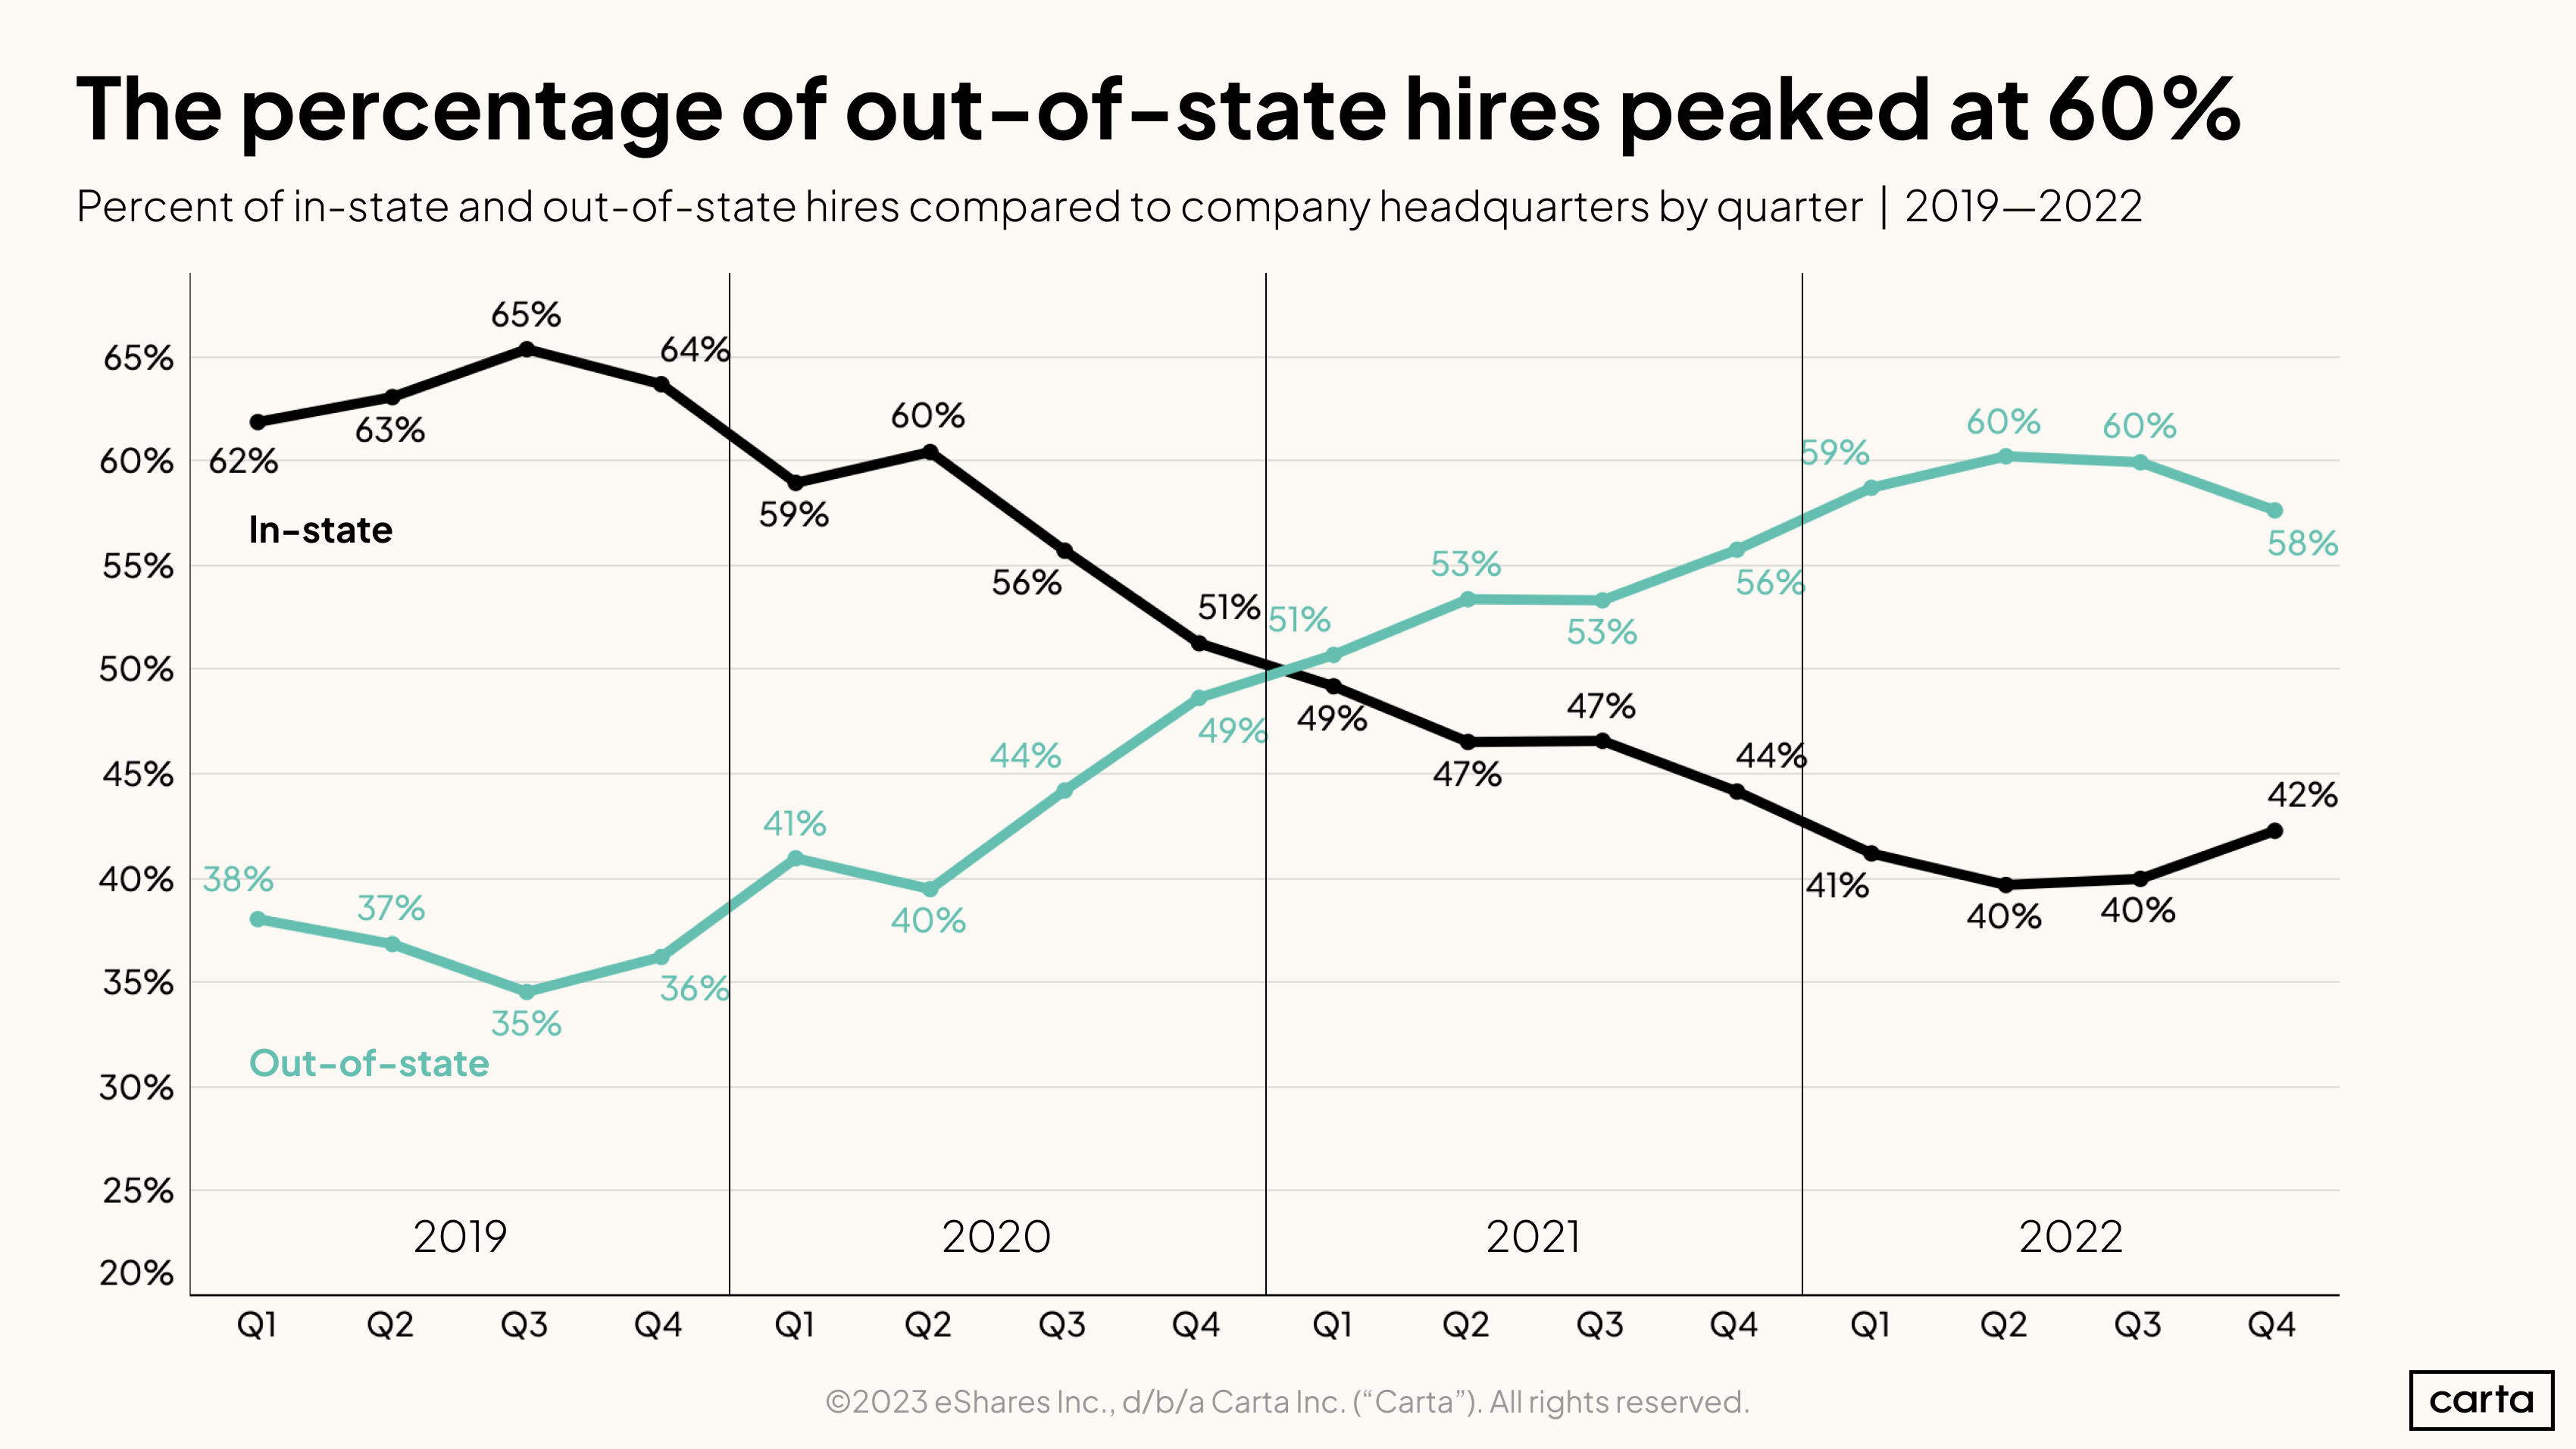
From Q2 2020 to Q2 2022, the percentage of hires that were in state vs. out of state essentially flipped. In Q4 2022, however, the out of state hiring percentage dipped slightly. It’s too soon to say whether out-of-state hiring will retreat further or if it has simply found a new standard level.
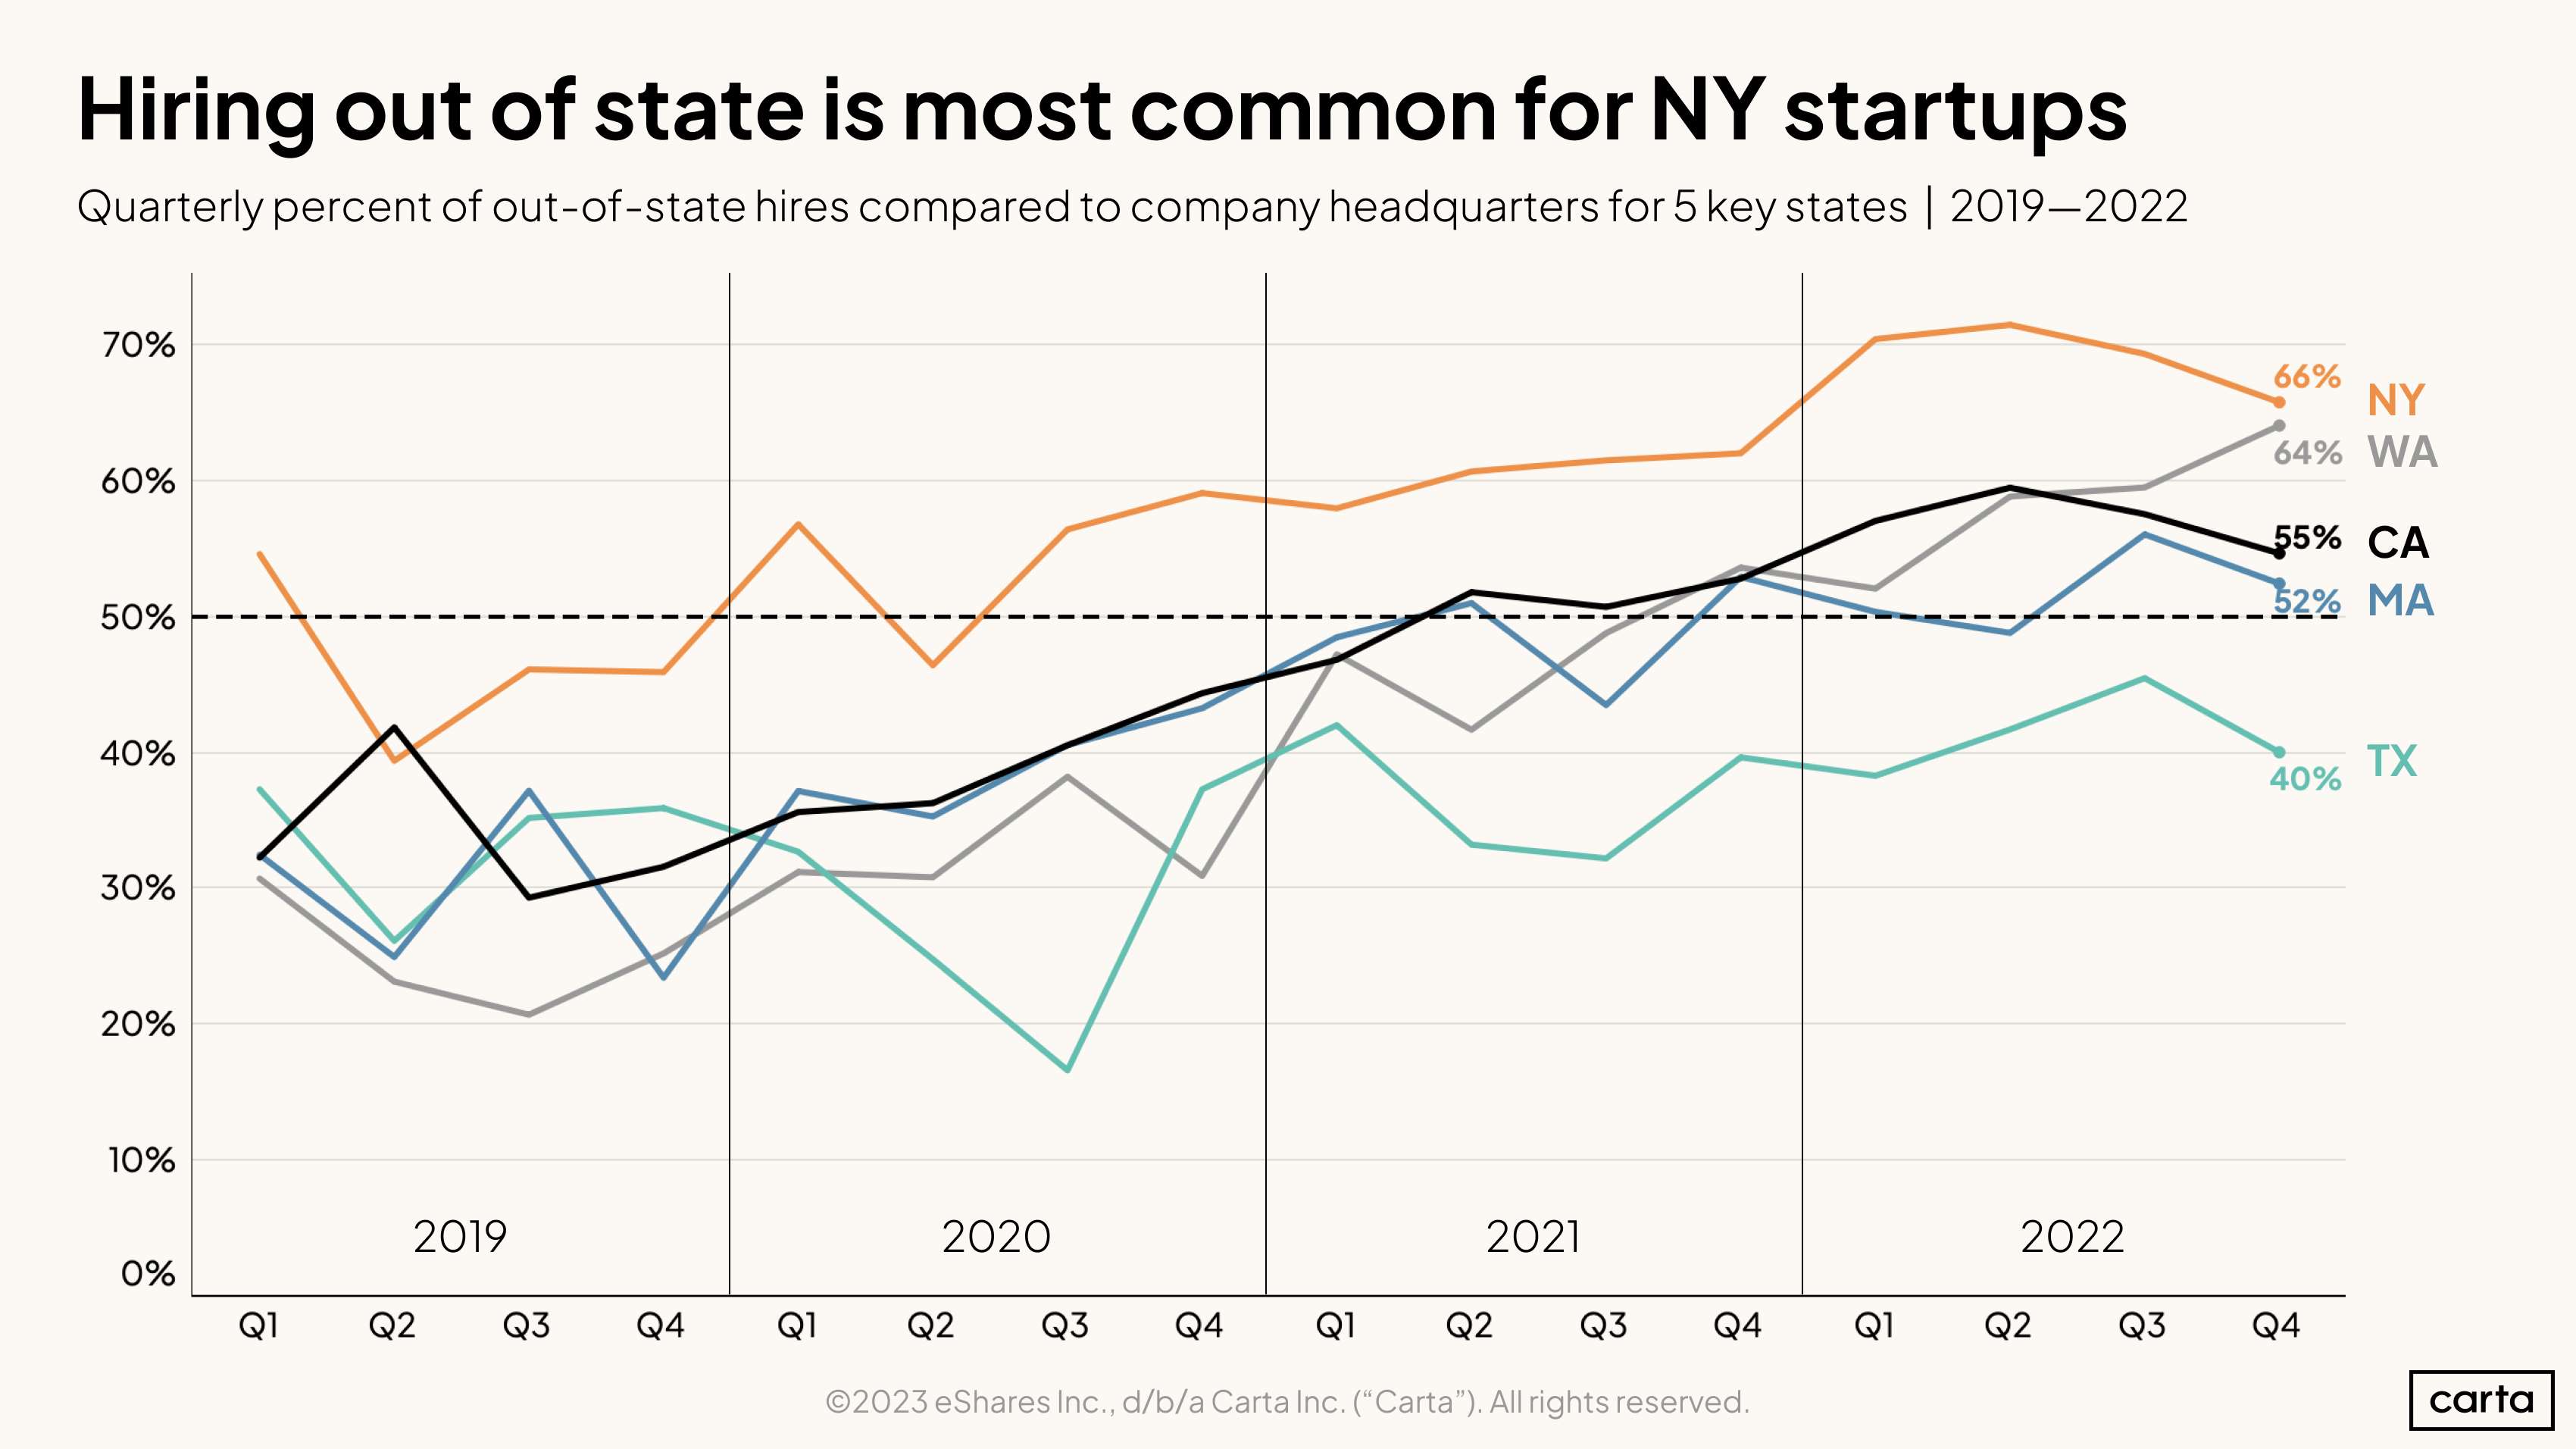
Given that New York has the highest percentage of companies that do not geo-adjust their salary bands, it’s unsurprising that New York leads all key venture markets for out-of-state hires. The higher out-of-state hire rate may also be the result of New York-based startups opening comparatively more satellite offices.
While hiring more out-of-state employees was a pattern across all VC ecosystems, the change was certainly weaker in markets like Texas (and Florida, not included above).
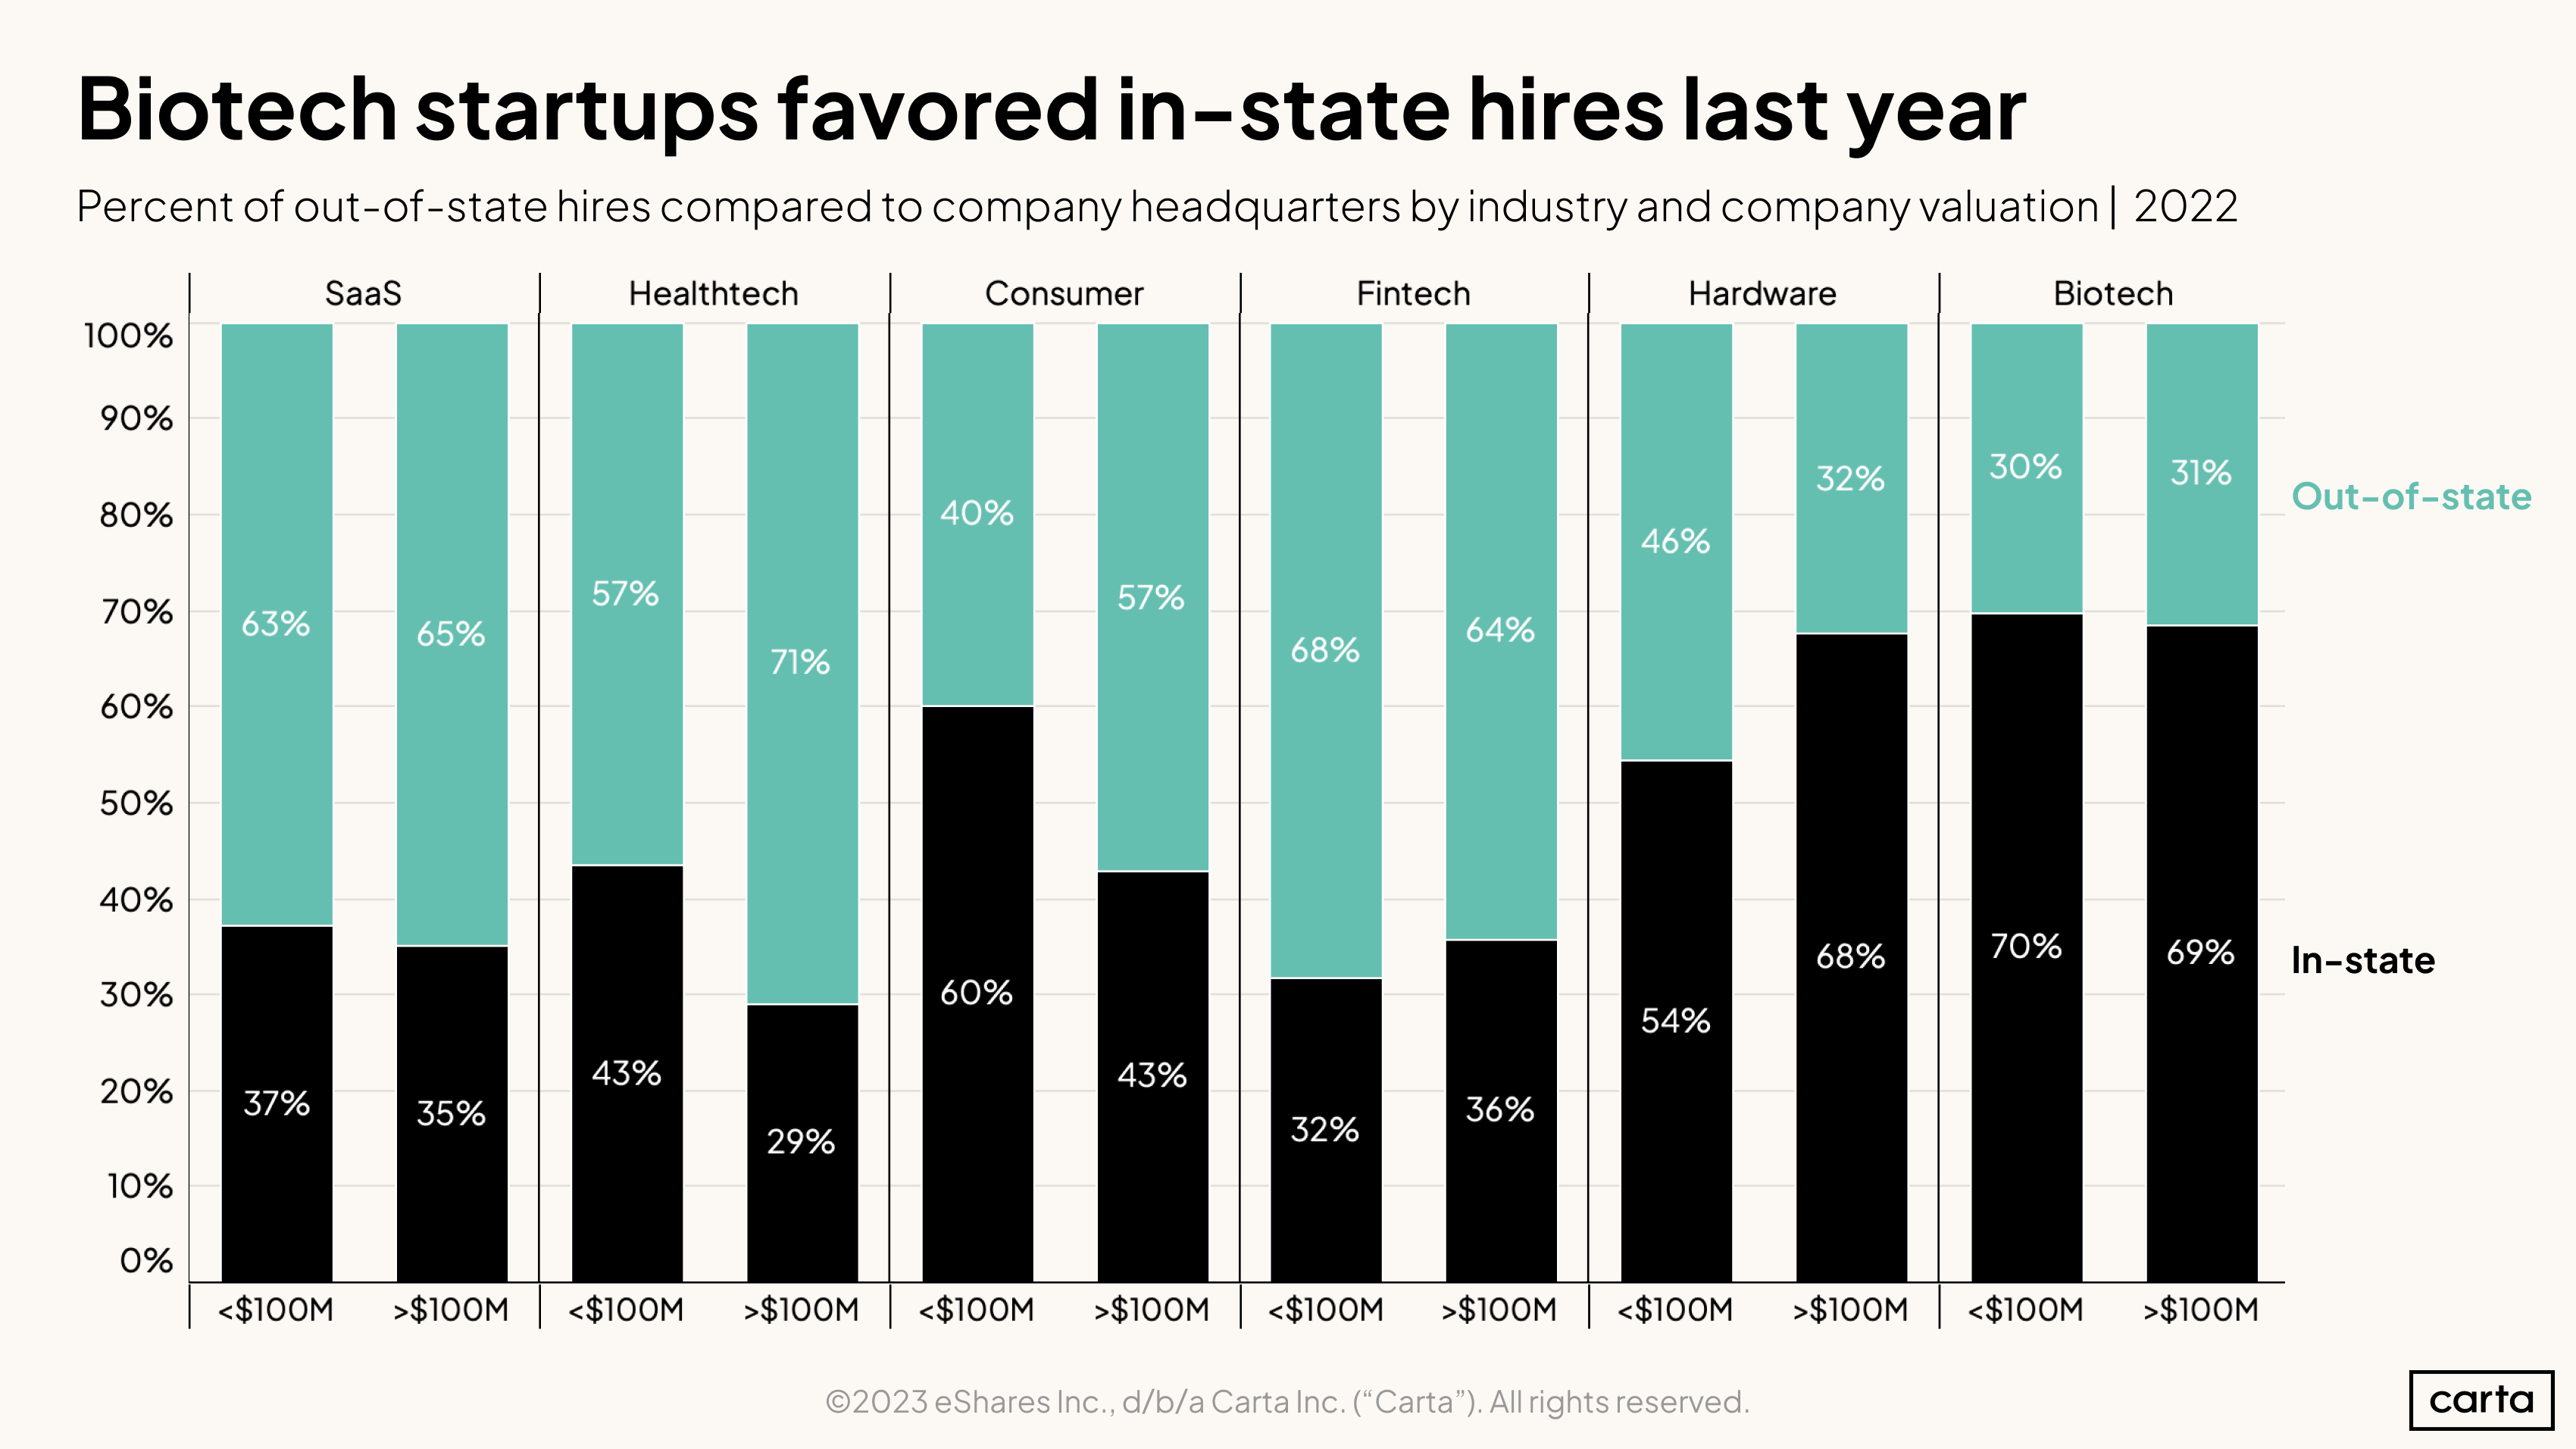
Certain industries appear more resistant to out-of-state hires. While verticals like SaaS and fintech have adopted new hiring practices (across both early and late-stage startups), biotech largely remains an in-person sector.
Some industry segments (like consumer startups) tend toward local hiring until they achieve a certain scale, then pursue out-of-state candidates more regularly. Hardware startups exhibit the opposite tendency, with the share of out-of-state hires falling as the company grows.
Geographic compensation
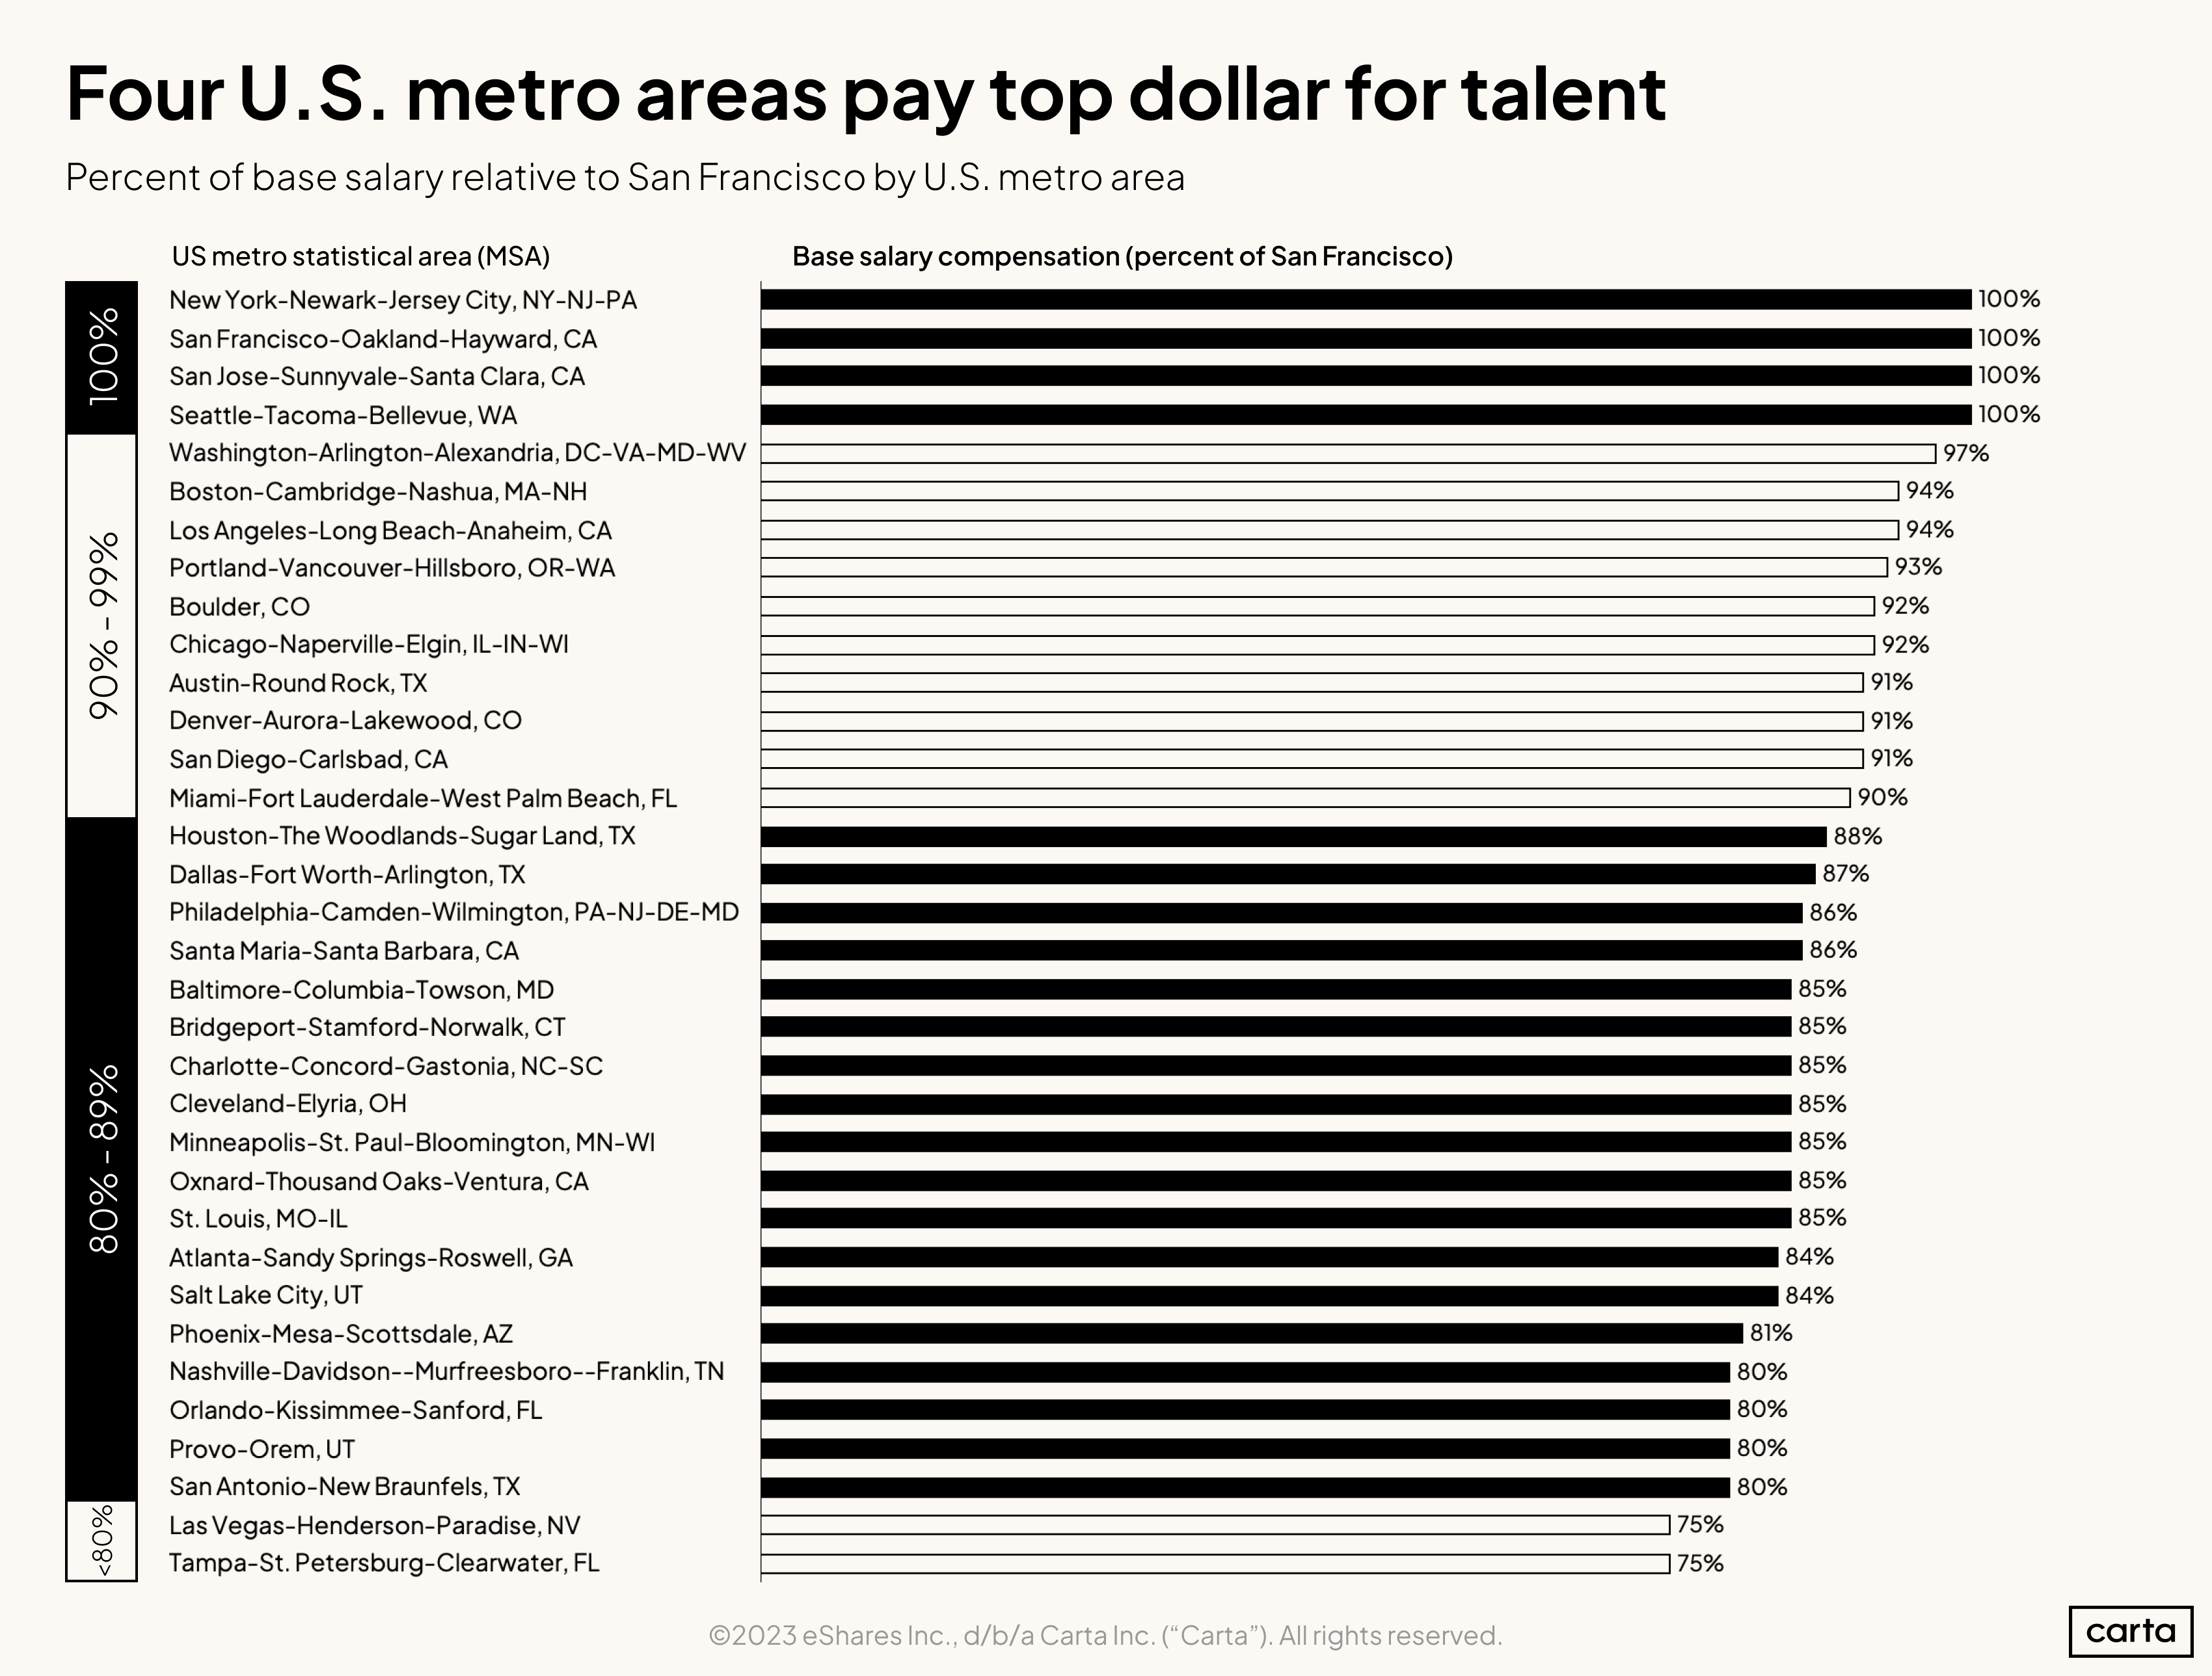
Four metro areas in the U.S. pay the highest rates for tech talent: San Francisco, New York, San Jose, and Seattle are all nearly identical in terms of base salary for tech workers.
The relative adjustment by metro area tended to shrink over the first half of 2022. More cities across the U.S. moved towards San Francisco salaries, if only marginally. Today, 10 markets pay 90% or above of San Francisco rates.
For the first time, Carta Total Comp data now breaks out countries using the same geo-adjustment logic as it does for U.S. cities. We’ve plotted 20 examples in this interactive graphic, but startups using Carta Total Comp get access to 45 distinct country adjustments.
While the salary adjustments are significant, equity ranges are even more variable in countries without strong venture capital ecosystems.
You can see the suggested equity adjustment for the 20 countries above by downloading our equity addendum here.
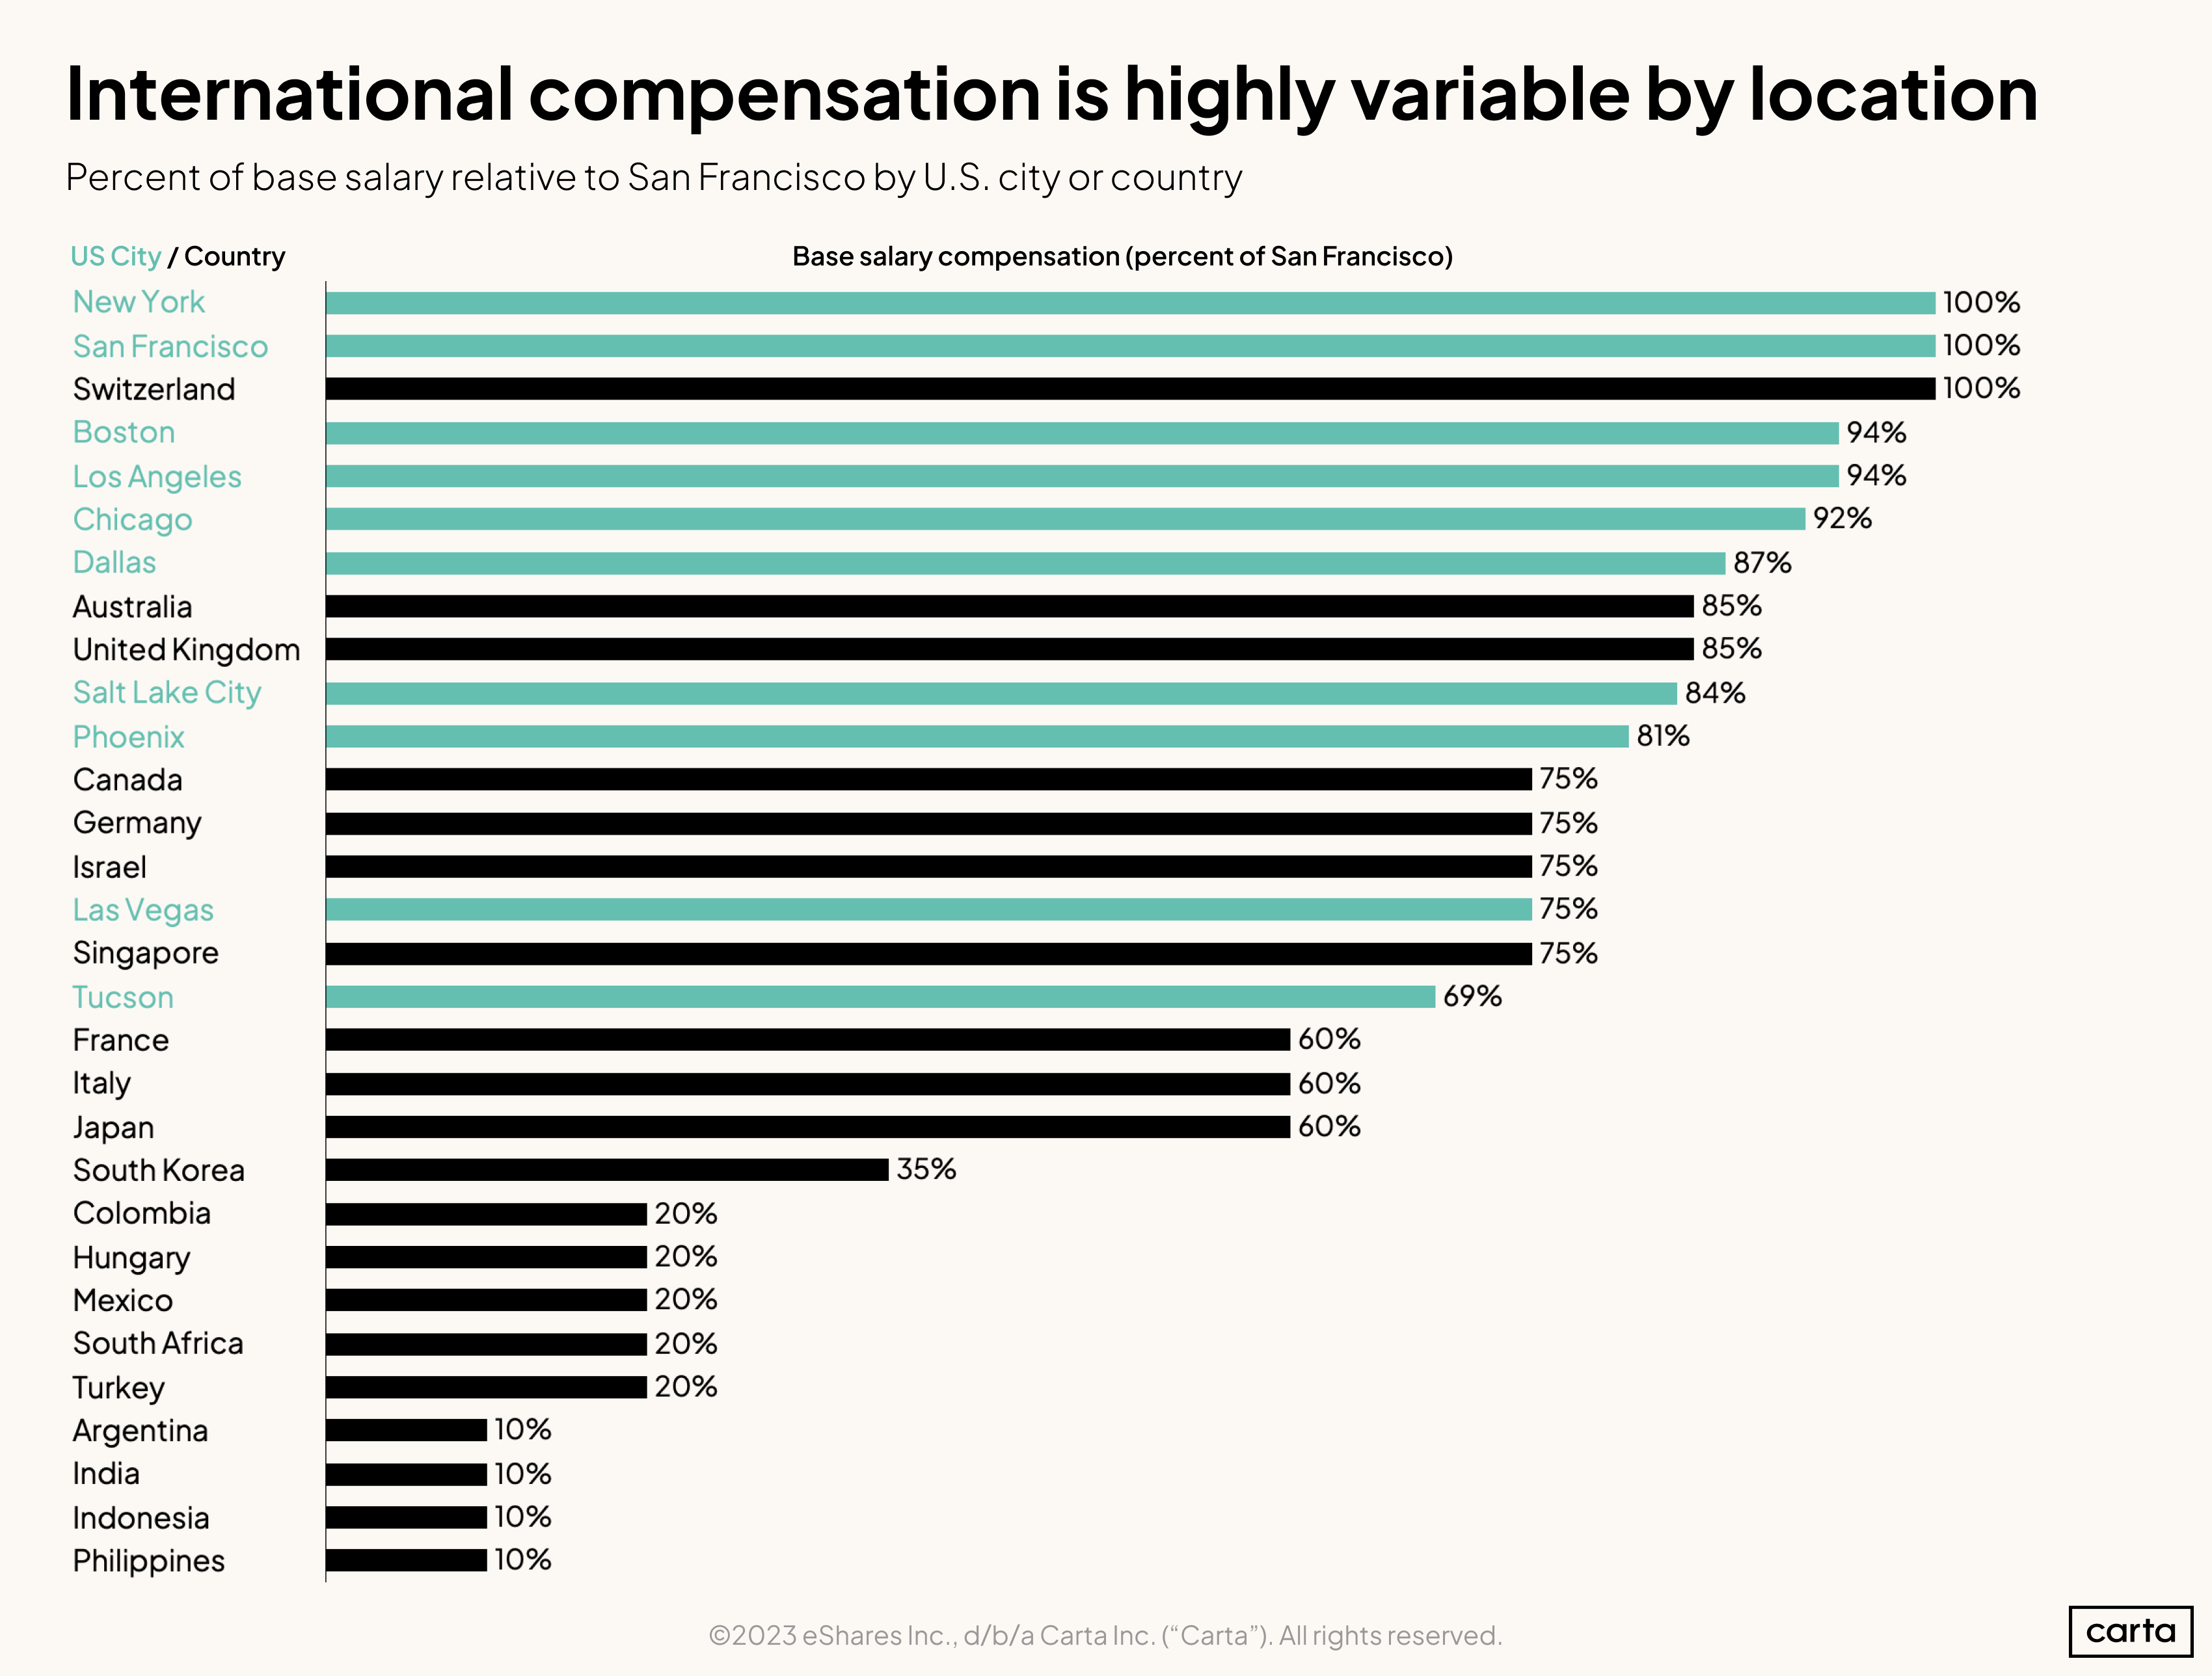
Plotting city and country adjustments in the same view makes it clear that startups can take advantage of sizable salary arbitrage if they expand their candidate pools to include overseas talent. There are very few major U.S. metro areas where base compensation for tech talent falls under 50% of San Francisco rates.
Equity compensation data
Download the equity addendum below to see:
Employee option pool sizes by valuation
Median advisor equity for pre-seed, seed, and Series A companies
Median equity grants for a startup’s first 10 employees
Suggested equity adjustments for the 20 countries explored above
Methodology
Overall dataset
Carta helps more than 3,000 venture-backed companies compensate their employees through Carta Total Comp. The data presented above represents an aggregated, anonymized view into the pay strategies of these startups. Collectively, Carta Total Comp companies employ more than 216,000 employees. Companies that have contractually requested that we not use their data in anonymized and aggregated studies are not included in this analysis.
The data presented in this report represents a snapshot as of Feb 15th, 2023. Historical data may change in future studies. New companies signing up for Carta’s services will increase the amount of data available for the report.
Location analysis
All metro analysis in this report uses metropolitan statistical areas, or MSAs, as the geographic unit. We included metro areas for which Carta Total Comp has sufficient density of employees to make reasonable determinations as to the relative level of compensation. The same process was applied to the 20 country-level adjustments.
Salary & equity
All salaries presented in this report are expressed in U.S. dollars. Except where indicated, total payroll numbers do not include any variable compensation, such as bonuses or commissions, that may be given to employees.
All equity values presented in this report are expressed as a percentage of fully diluted company shares.
In the section “Salary changes over time,” salary changes reflect updates to Carta Total Comp bands. These benchmarks are updated once per quarter to incorporate newly hired employee data as well as any adjustments to current employee compensation.

DISCLOSURE: This communication is on behalf of eShares Inc., d/b/a Carta Inc. (“Carta”). This communication is for informational purposes only, and contains general information only. Carta is not, by means of this communication, rendering accounting, business, financial, investment, legal, tax, or other professional advice or services. This publication is not a substitute for such professional advice or services nor should it be used as a basis for any decision or action that may affect your business or interests. Before making any decision or taking any action that may affect your business or interests, you should consult a qualified professional advisor. This communication is not intended as a recommendation, offer or solicitation for the purchase or sale of any security. Carta does not assume any liability for reliance on the information provided herein. ©2023 eShares Inc., d/b/a Carta Inc. (“Carta”). All rights reserved. Reproduction prohibited.