As VC-backed startups continue to contend with bear-market headwinds, startup hiring and compensation have undergone a reset.
Last year marked a startup employment contraction: There were more total job departures from companies on Carta in 2023 than there were new hires, the first annual net contraction in at least five years. A wave of layoffs that peaked in January 2023 also contributed to the workforce contraction. That month, startups laid off more than 18,000 employees.
Startups were still hiring last year, but their priorities shifted. Employees in engineering, sales, and operations made up a larger portion of all new hires, while job functions in customer success, support, and product accounted for a smaller portion of new hires than they did in the past. Compensation strategies shifted, too: Newly hired entry-level workers and C-suite leaders both saw their average salary levels increase during 2023, while new managers and VPs saw their average salaries decline.
At Carta, we believe it’s our responsibility to share the insights that come from an unmatched amount of data about the private market. The data below comes from thousands of CTC customers with over 500,000 data points used by Carta Total Compensation. Other metrics in the report, such as those that describe employee movement, derive from the aggregate pool of more than 1 million employees currently working for the 43,000 startups that use Carta to manage their cap tables.
>> If you'd like a detailed look at equity for advisors, board members, and early employees, download our equity addendum here for an extended dataset
H2 2023 key takeaways
-
Hiring halved last year: Companies on Carta made 267,818 new hires in all of 2023, a far cry from the 523,487 hires made in 2022 and 525,827 hires from 2021.
-
32% of new hires from 2022 departed their companies: Even among very recent hires, employee turnover has been considerable. About 32% of employees hired in 2022 are no longer with the company, and about 23% of new hires from 2023 have already moved on.
-
Equity packages have stabilized: The average amount of equity issued to new hires increased by 0.2% in January 2024 compared to September 2023. That’s a small change, but it’s an abrupt shift from recent history: Previously, equity benchmarks had declined by 37% between November 2022 and September 2023.
Hiring & headcount
For the first time in at least five years, headcount at VC-backed startups on Carta experienced a net decline. Back in 2021 and early 2022, net headcount across Carta was regularly increasing by tens of thousands of employees each month, peaking at more than 50,000 in January 2022. Across all 12 months of 2021, net headcount increased by 346,222 people.
In 2023, it declined by 18,377.
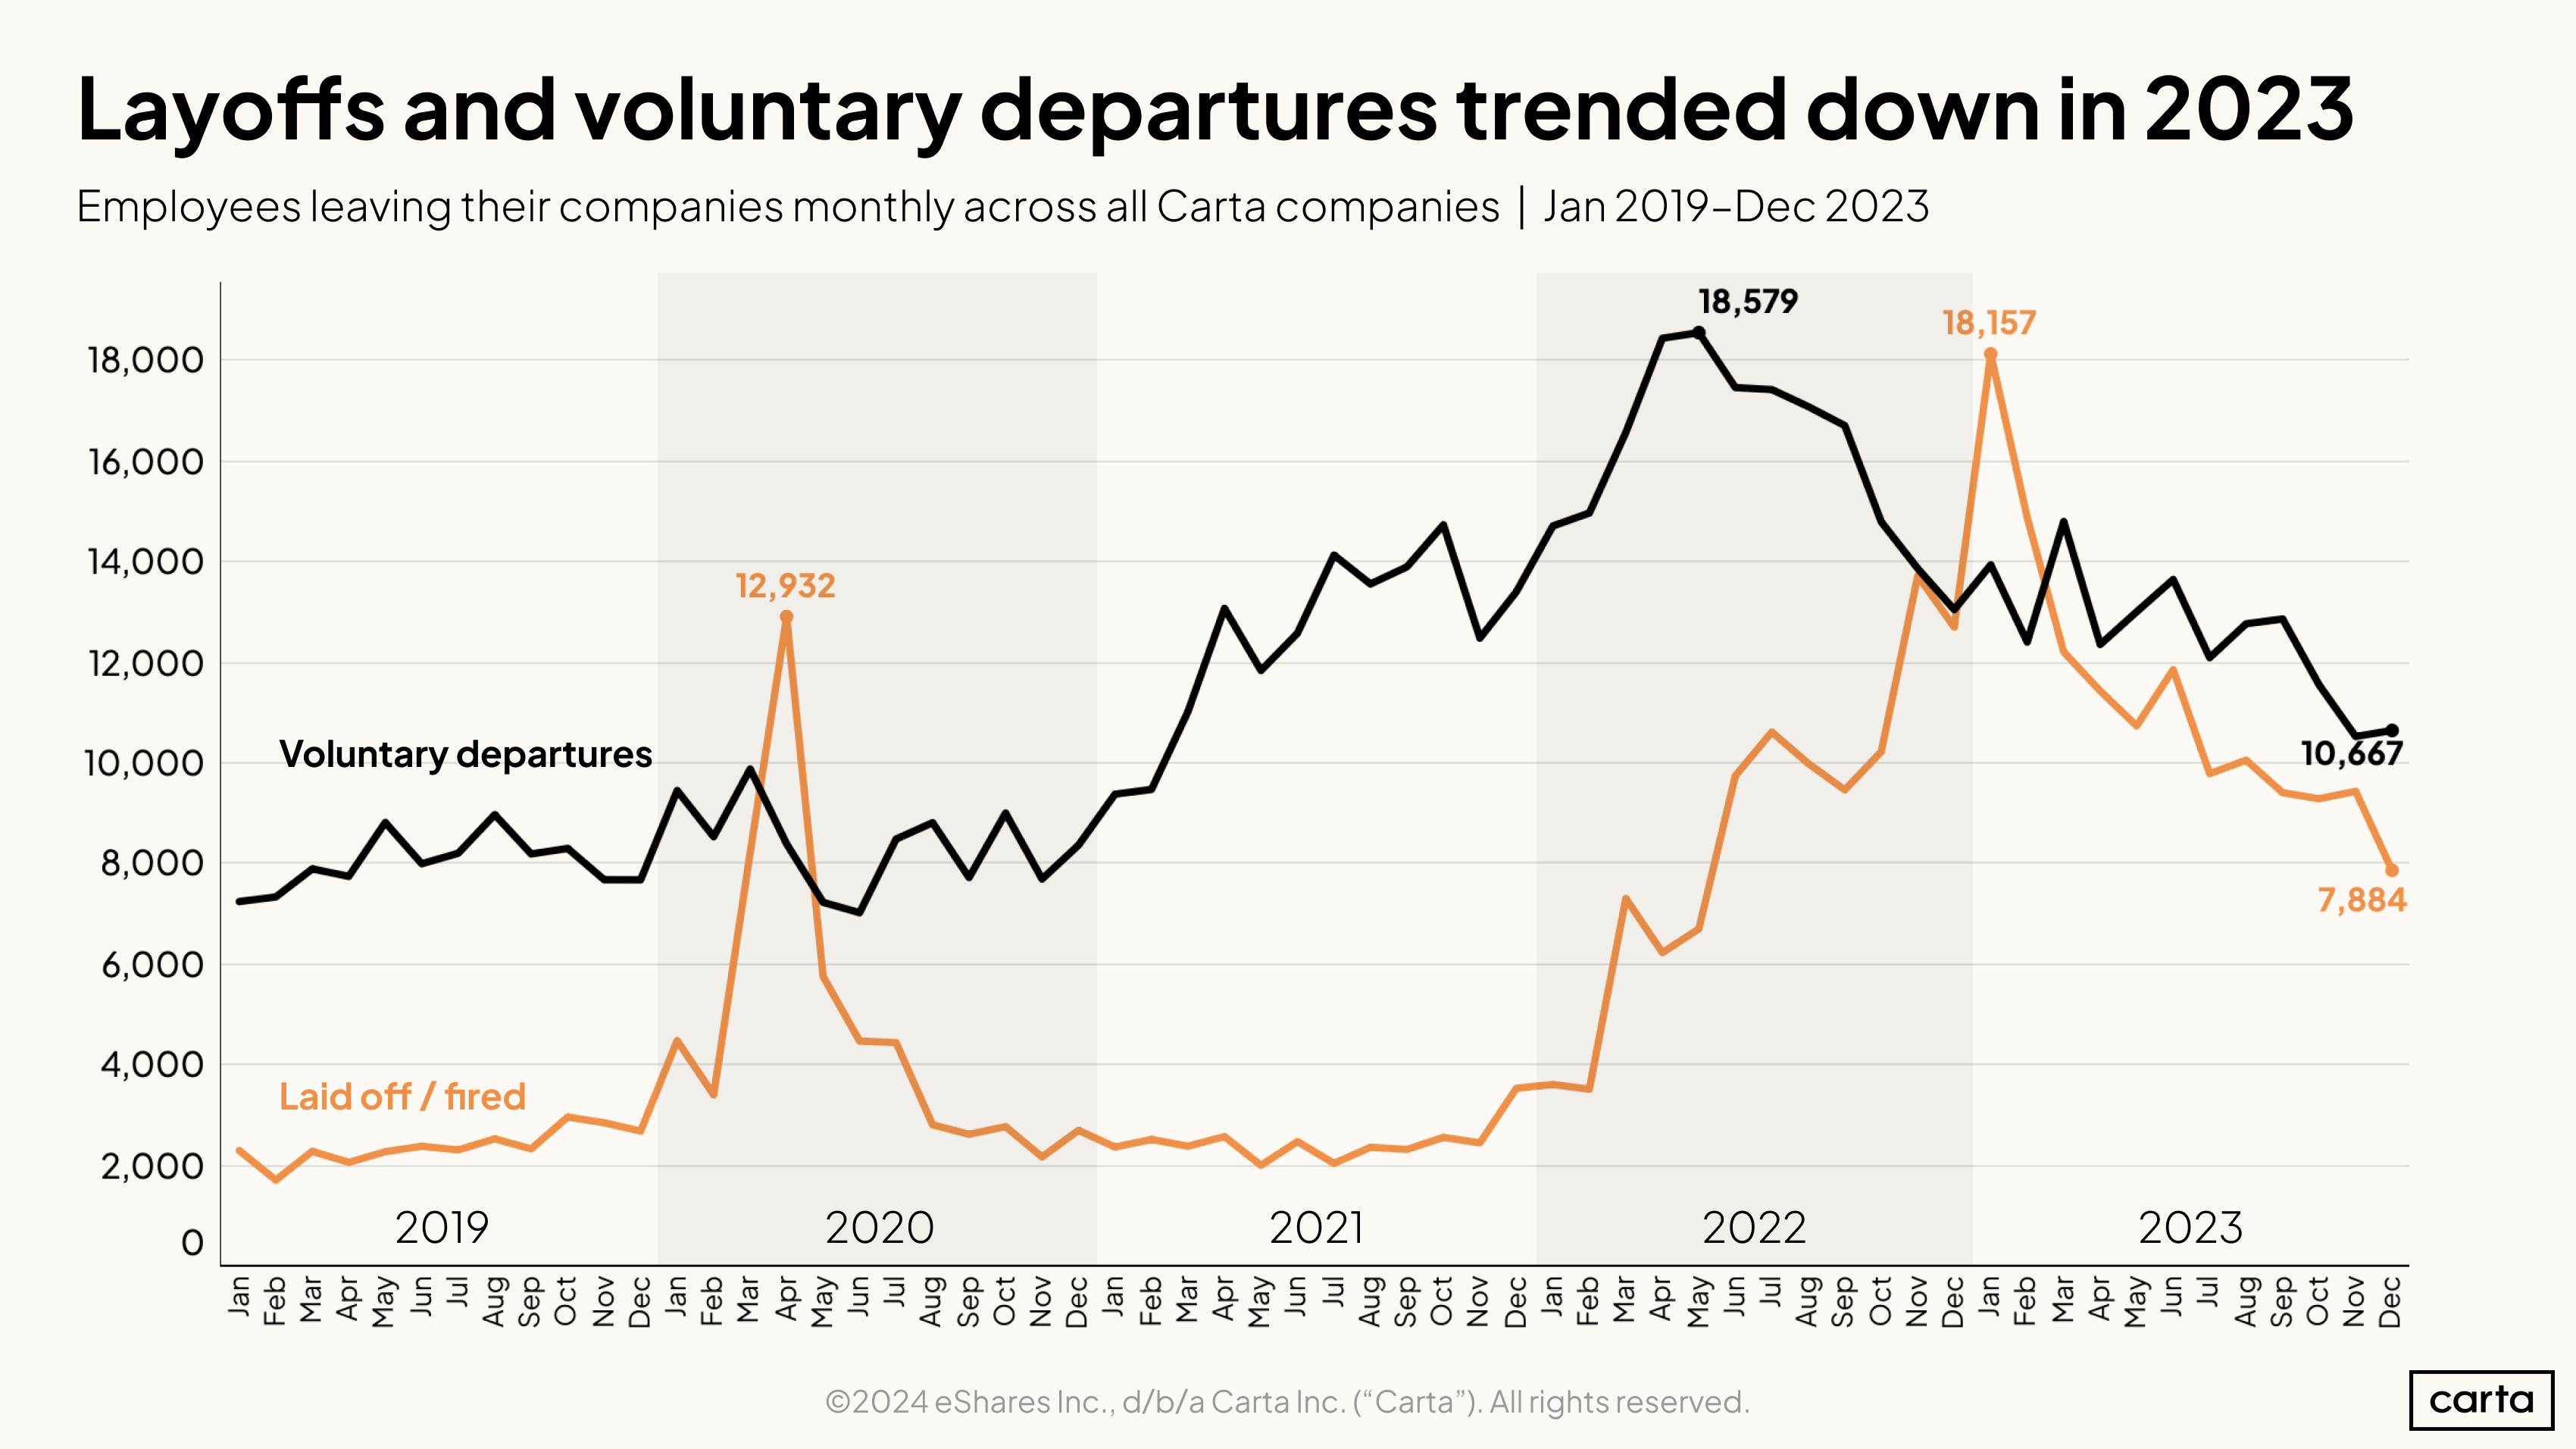
Layoffs grew much less frequent as 2023 progressed, with the monthly layoff count declining by 57% from January to December. Still, relative to the last few years, layoffs remain frequent: More workers were laid off in December 2023 than in any month from 2019 or 2021 (in 2020, Covid-related layoffs spiked in Q2). Voluntary job departures also grew less frequent over the course of 2023. But the decline wasn’t as steep as it was for layoffs. From January to December, the number of voluntary job departures dipped by 24%.
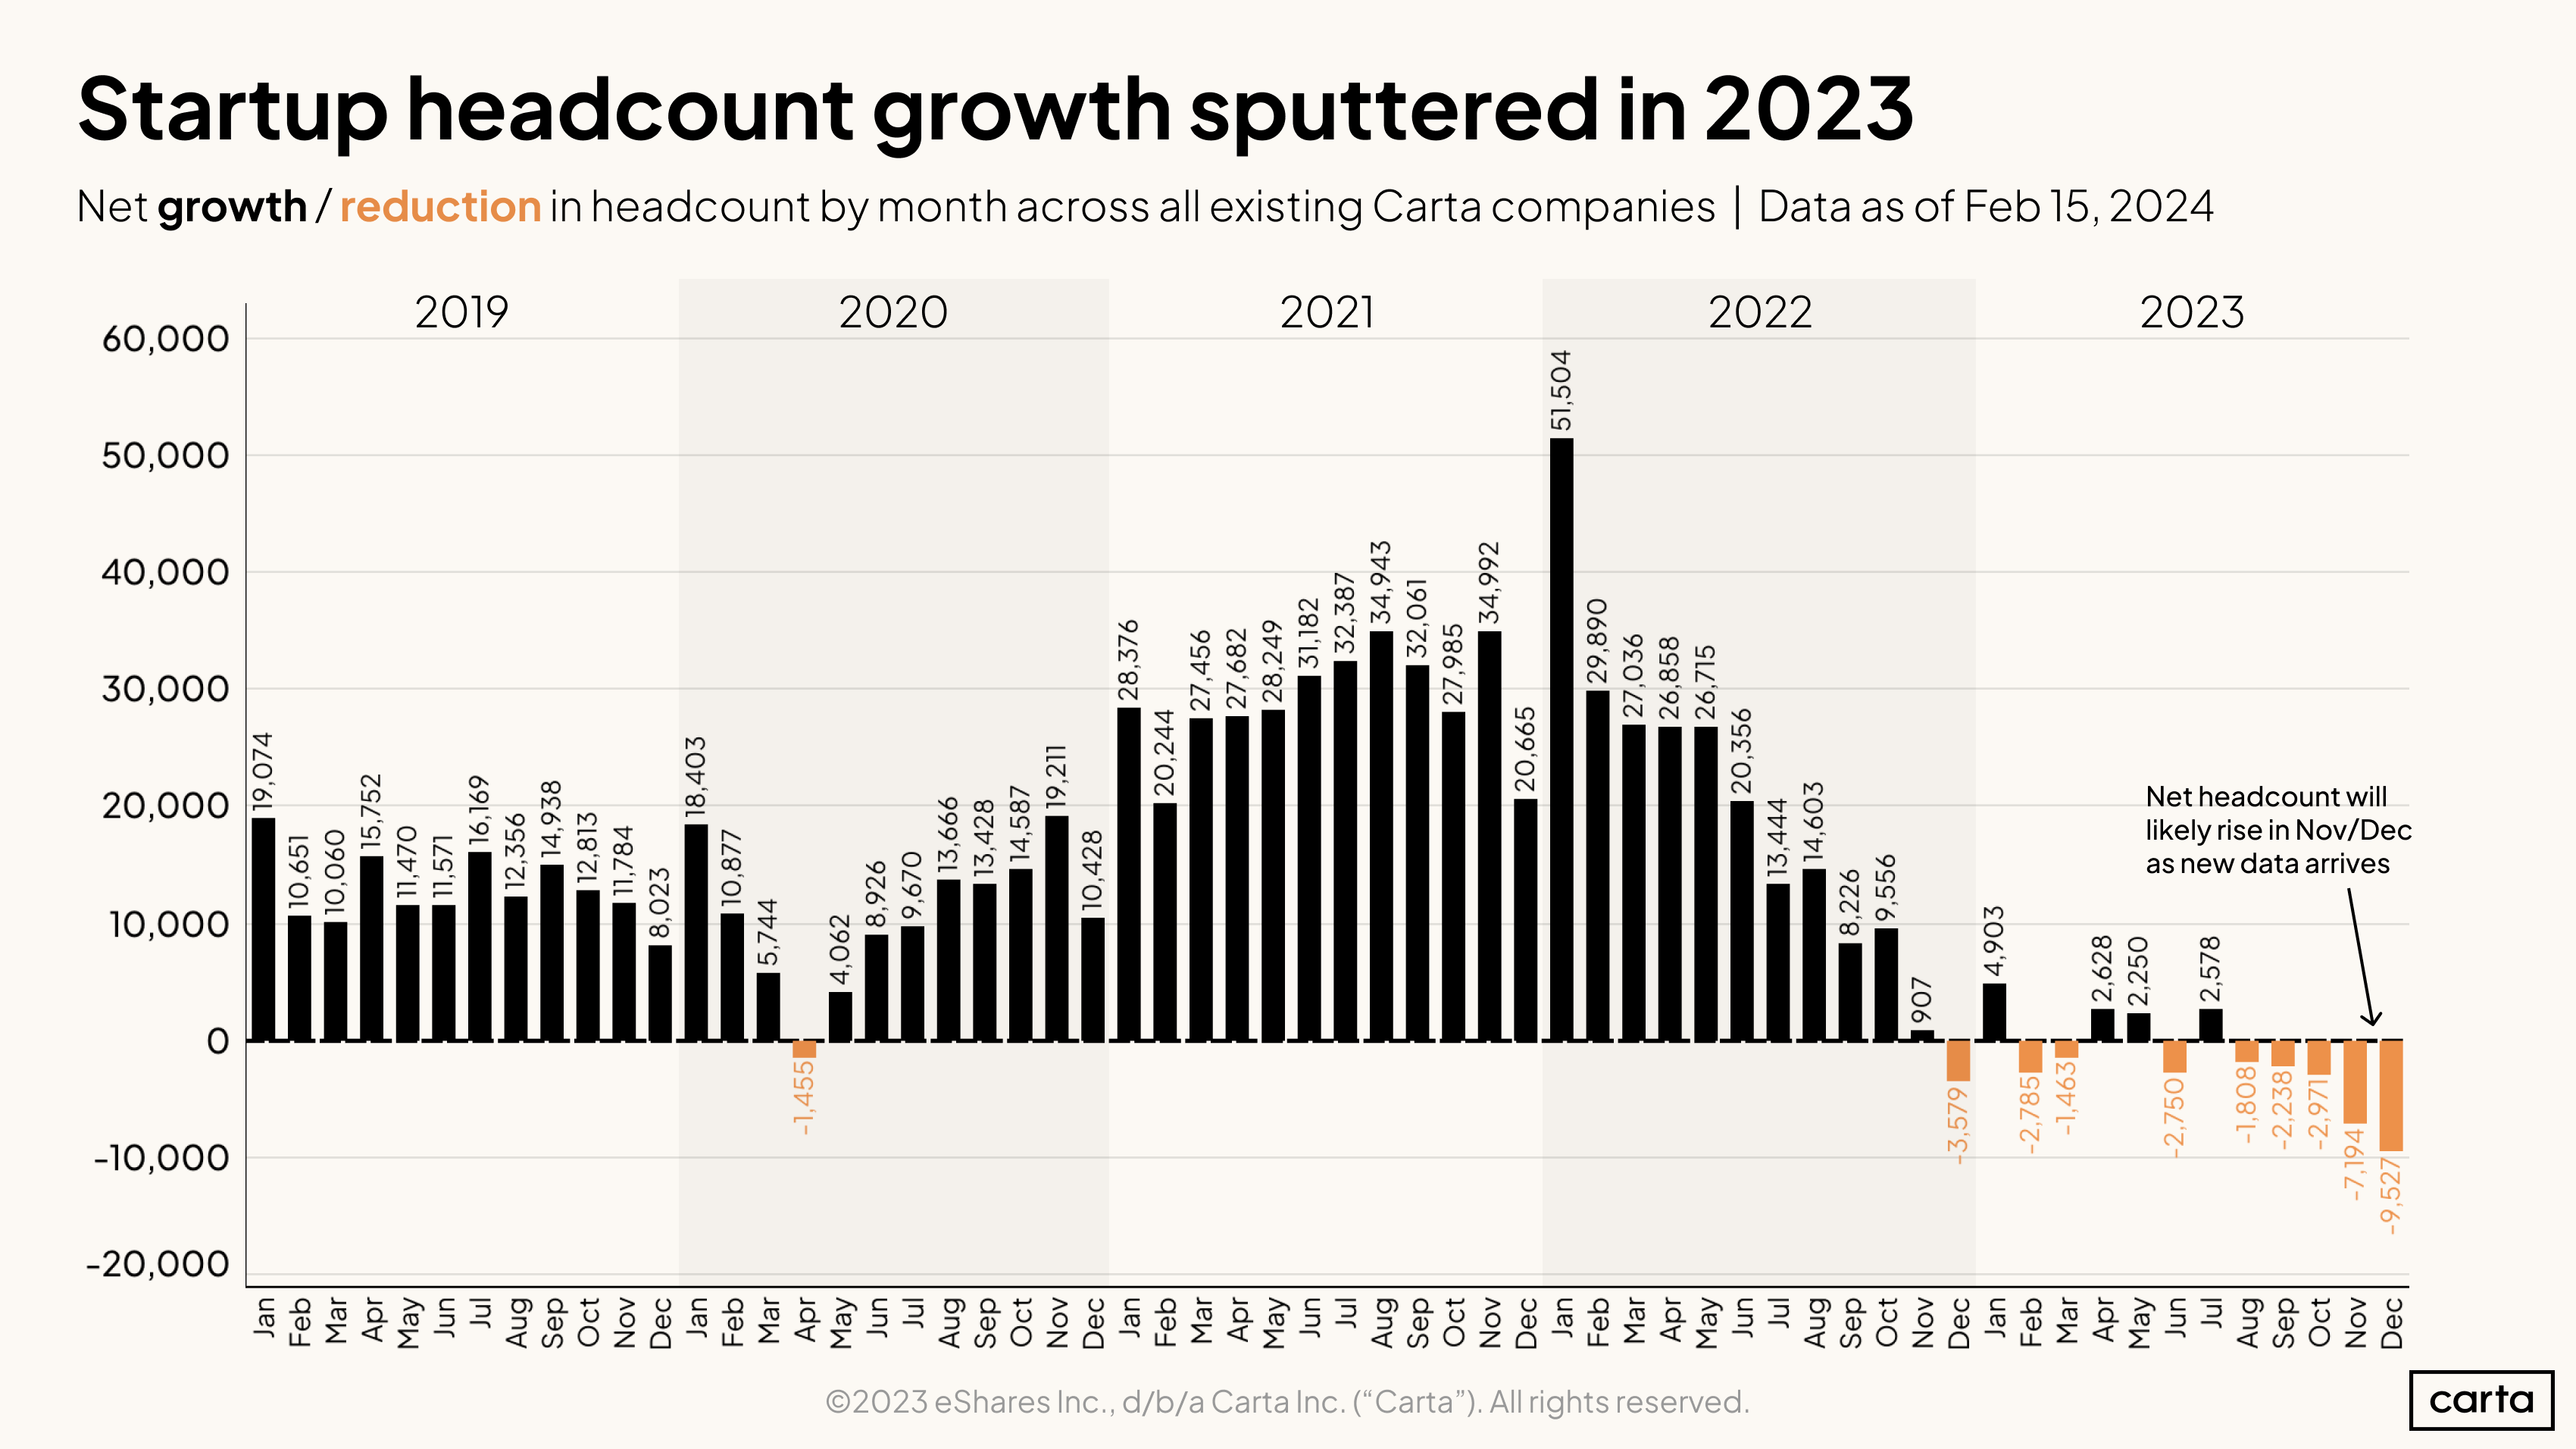
Net headcount across all companies on Carta increased in 46 out of 47 months between January 2019 and November 2022—only April 2020, the month following the WHO’s declaration of a global pandemic, saw a net contraction. After that, net headcount declined in nine of the next 13 months, signaling a sharp transition in the way many startups are thinking about the size of their workforce.
The data for November and December 2023 may still change as companies report new hires and departures on Carta. But that likely won’t change the overarching trend.
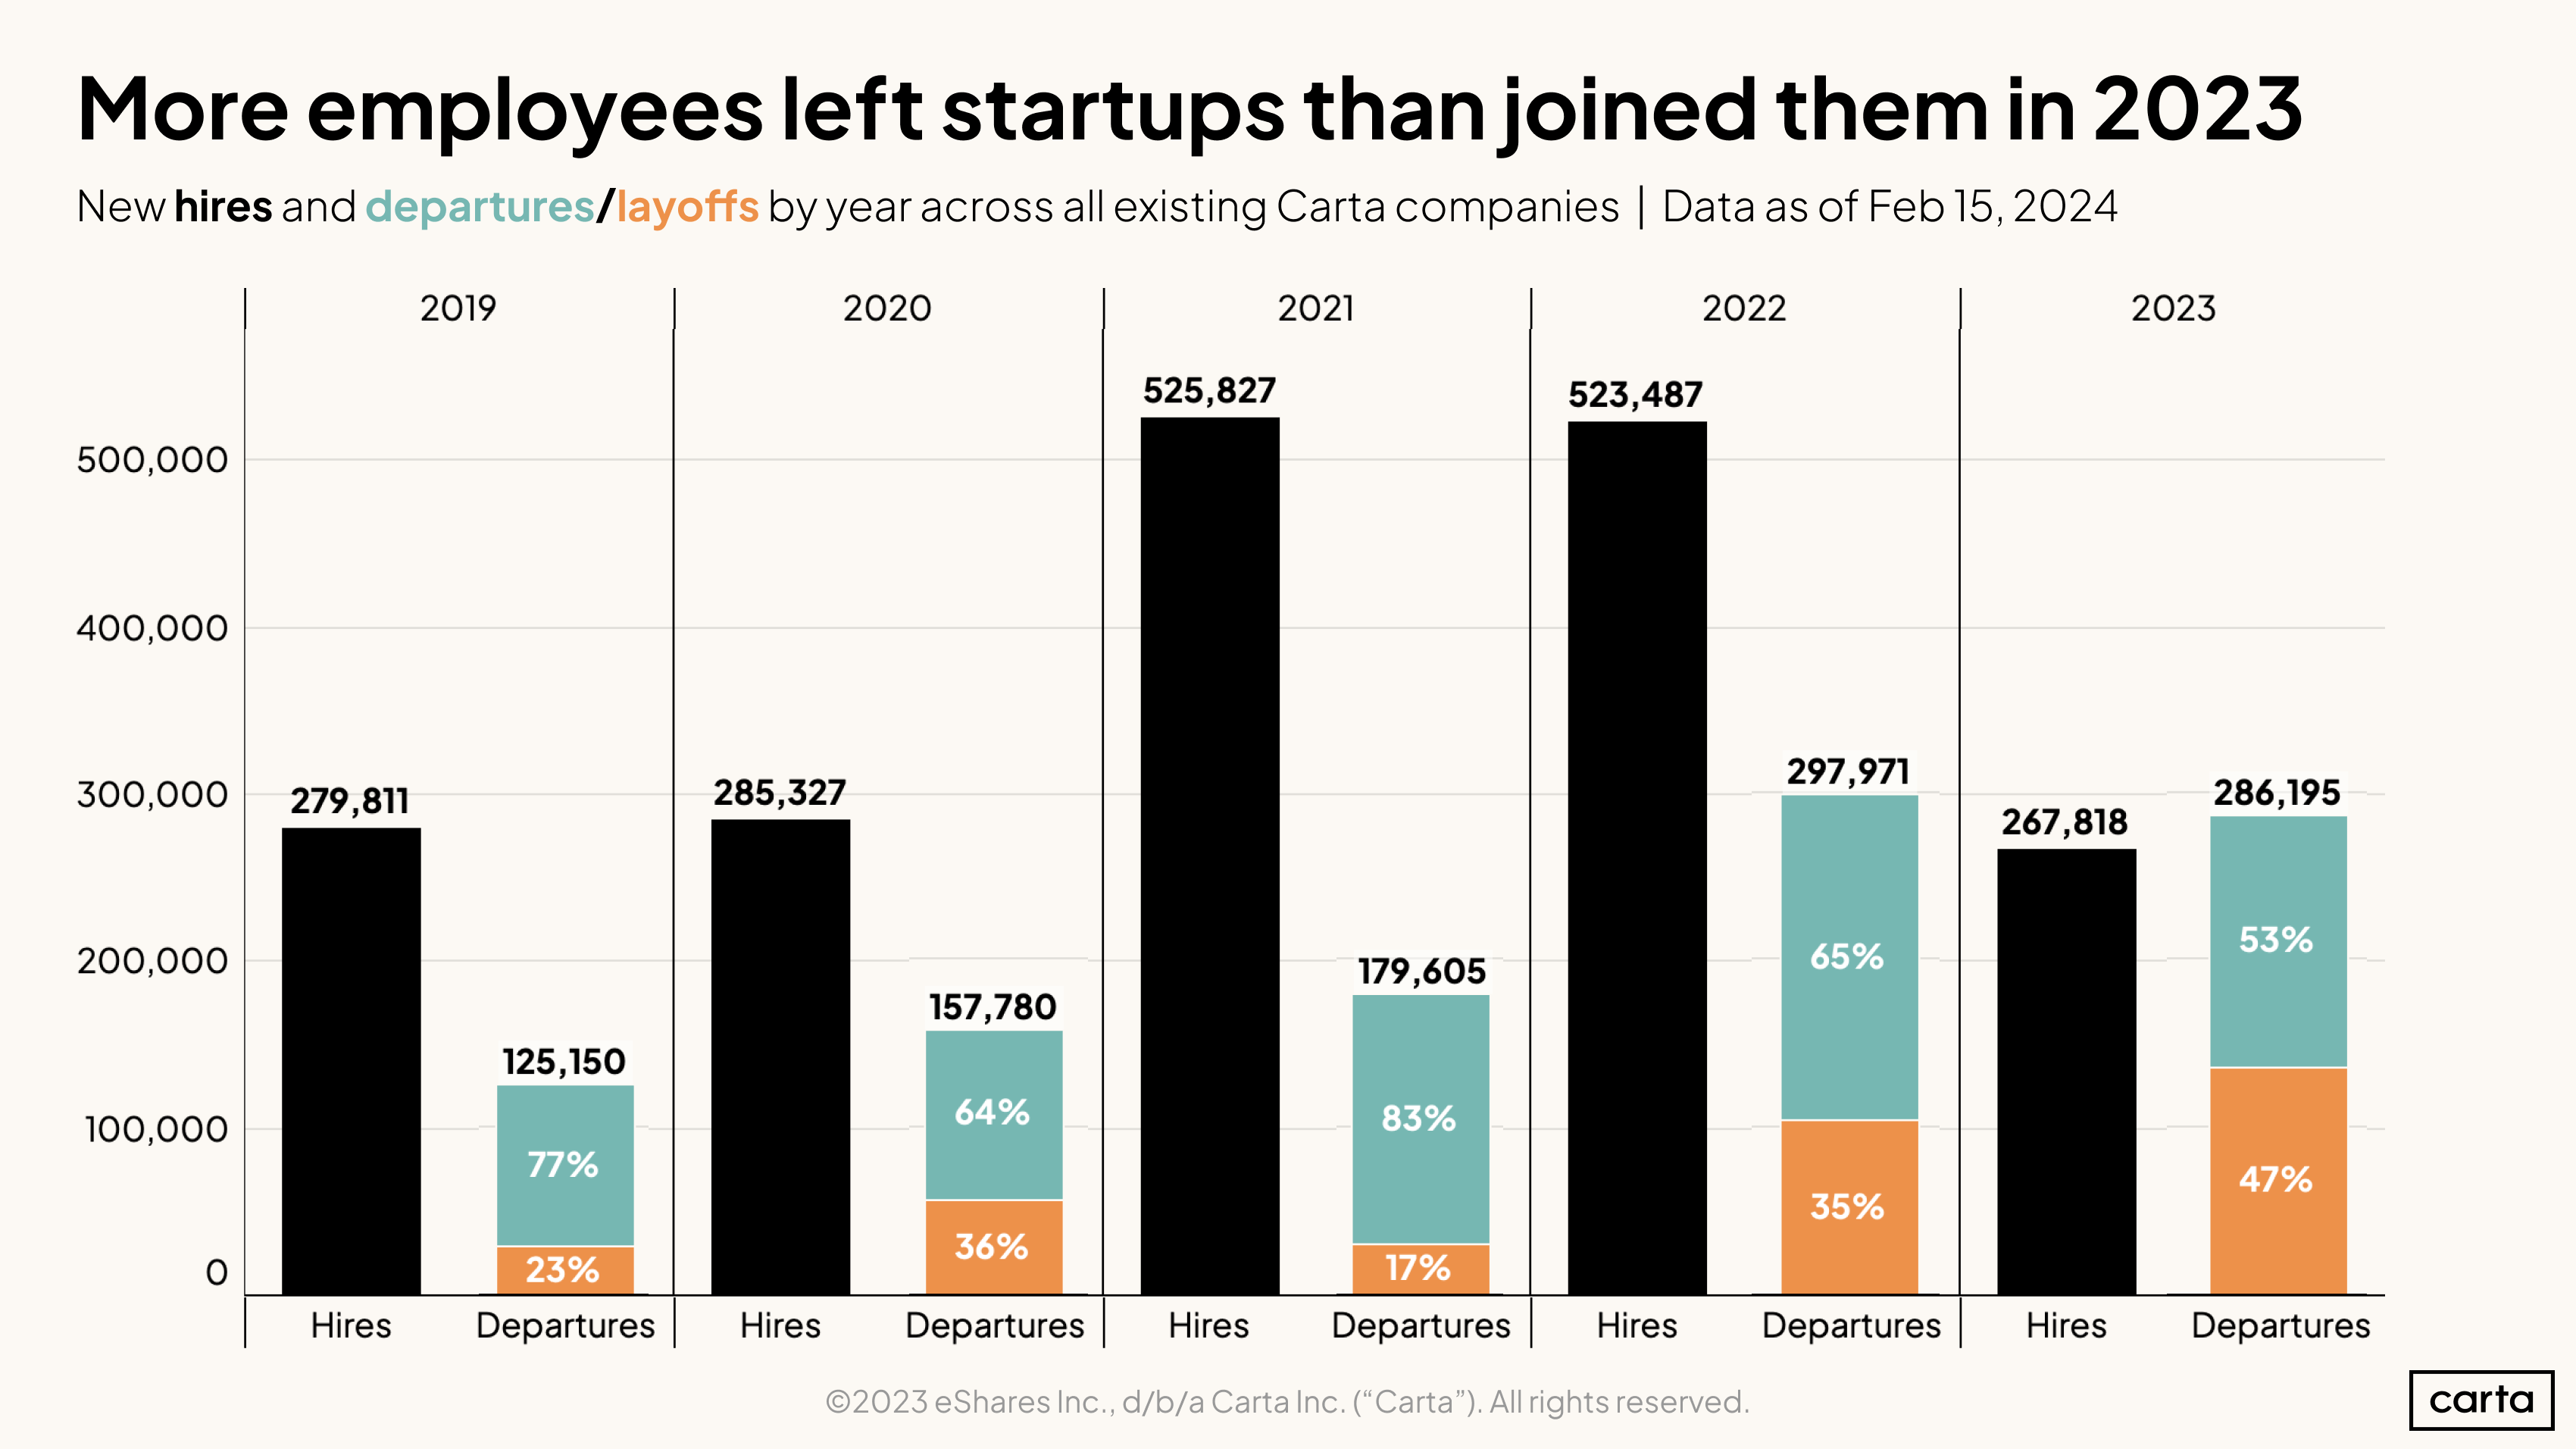
While the number of total startup departures declined by just 4% year over year, the number of new hires fell by 49%, falling to its lowest point of the past five years.
The distribution of combined job departures also changed significantly in 2023. Layoffs made up 47% of all departures on Carta over the course of the year, by far the highest rate of the past five years. The surge in layoffs that occurred in early 2023 had a lasting effect on the year’s metrics.
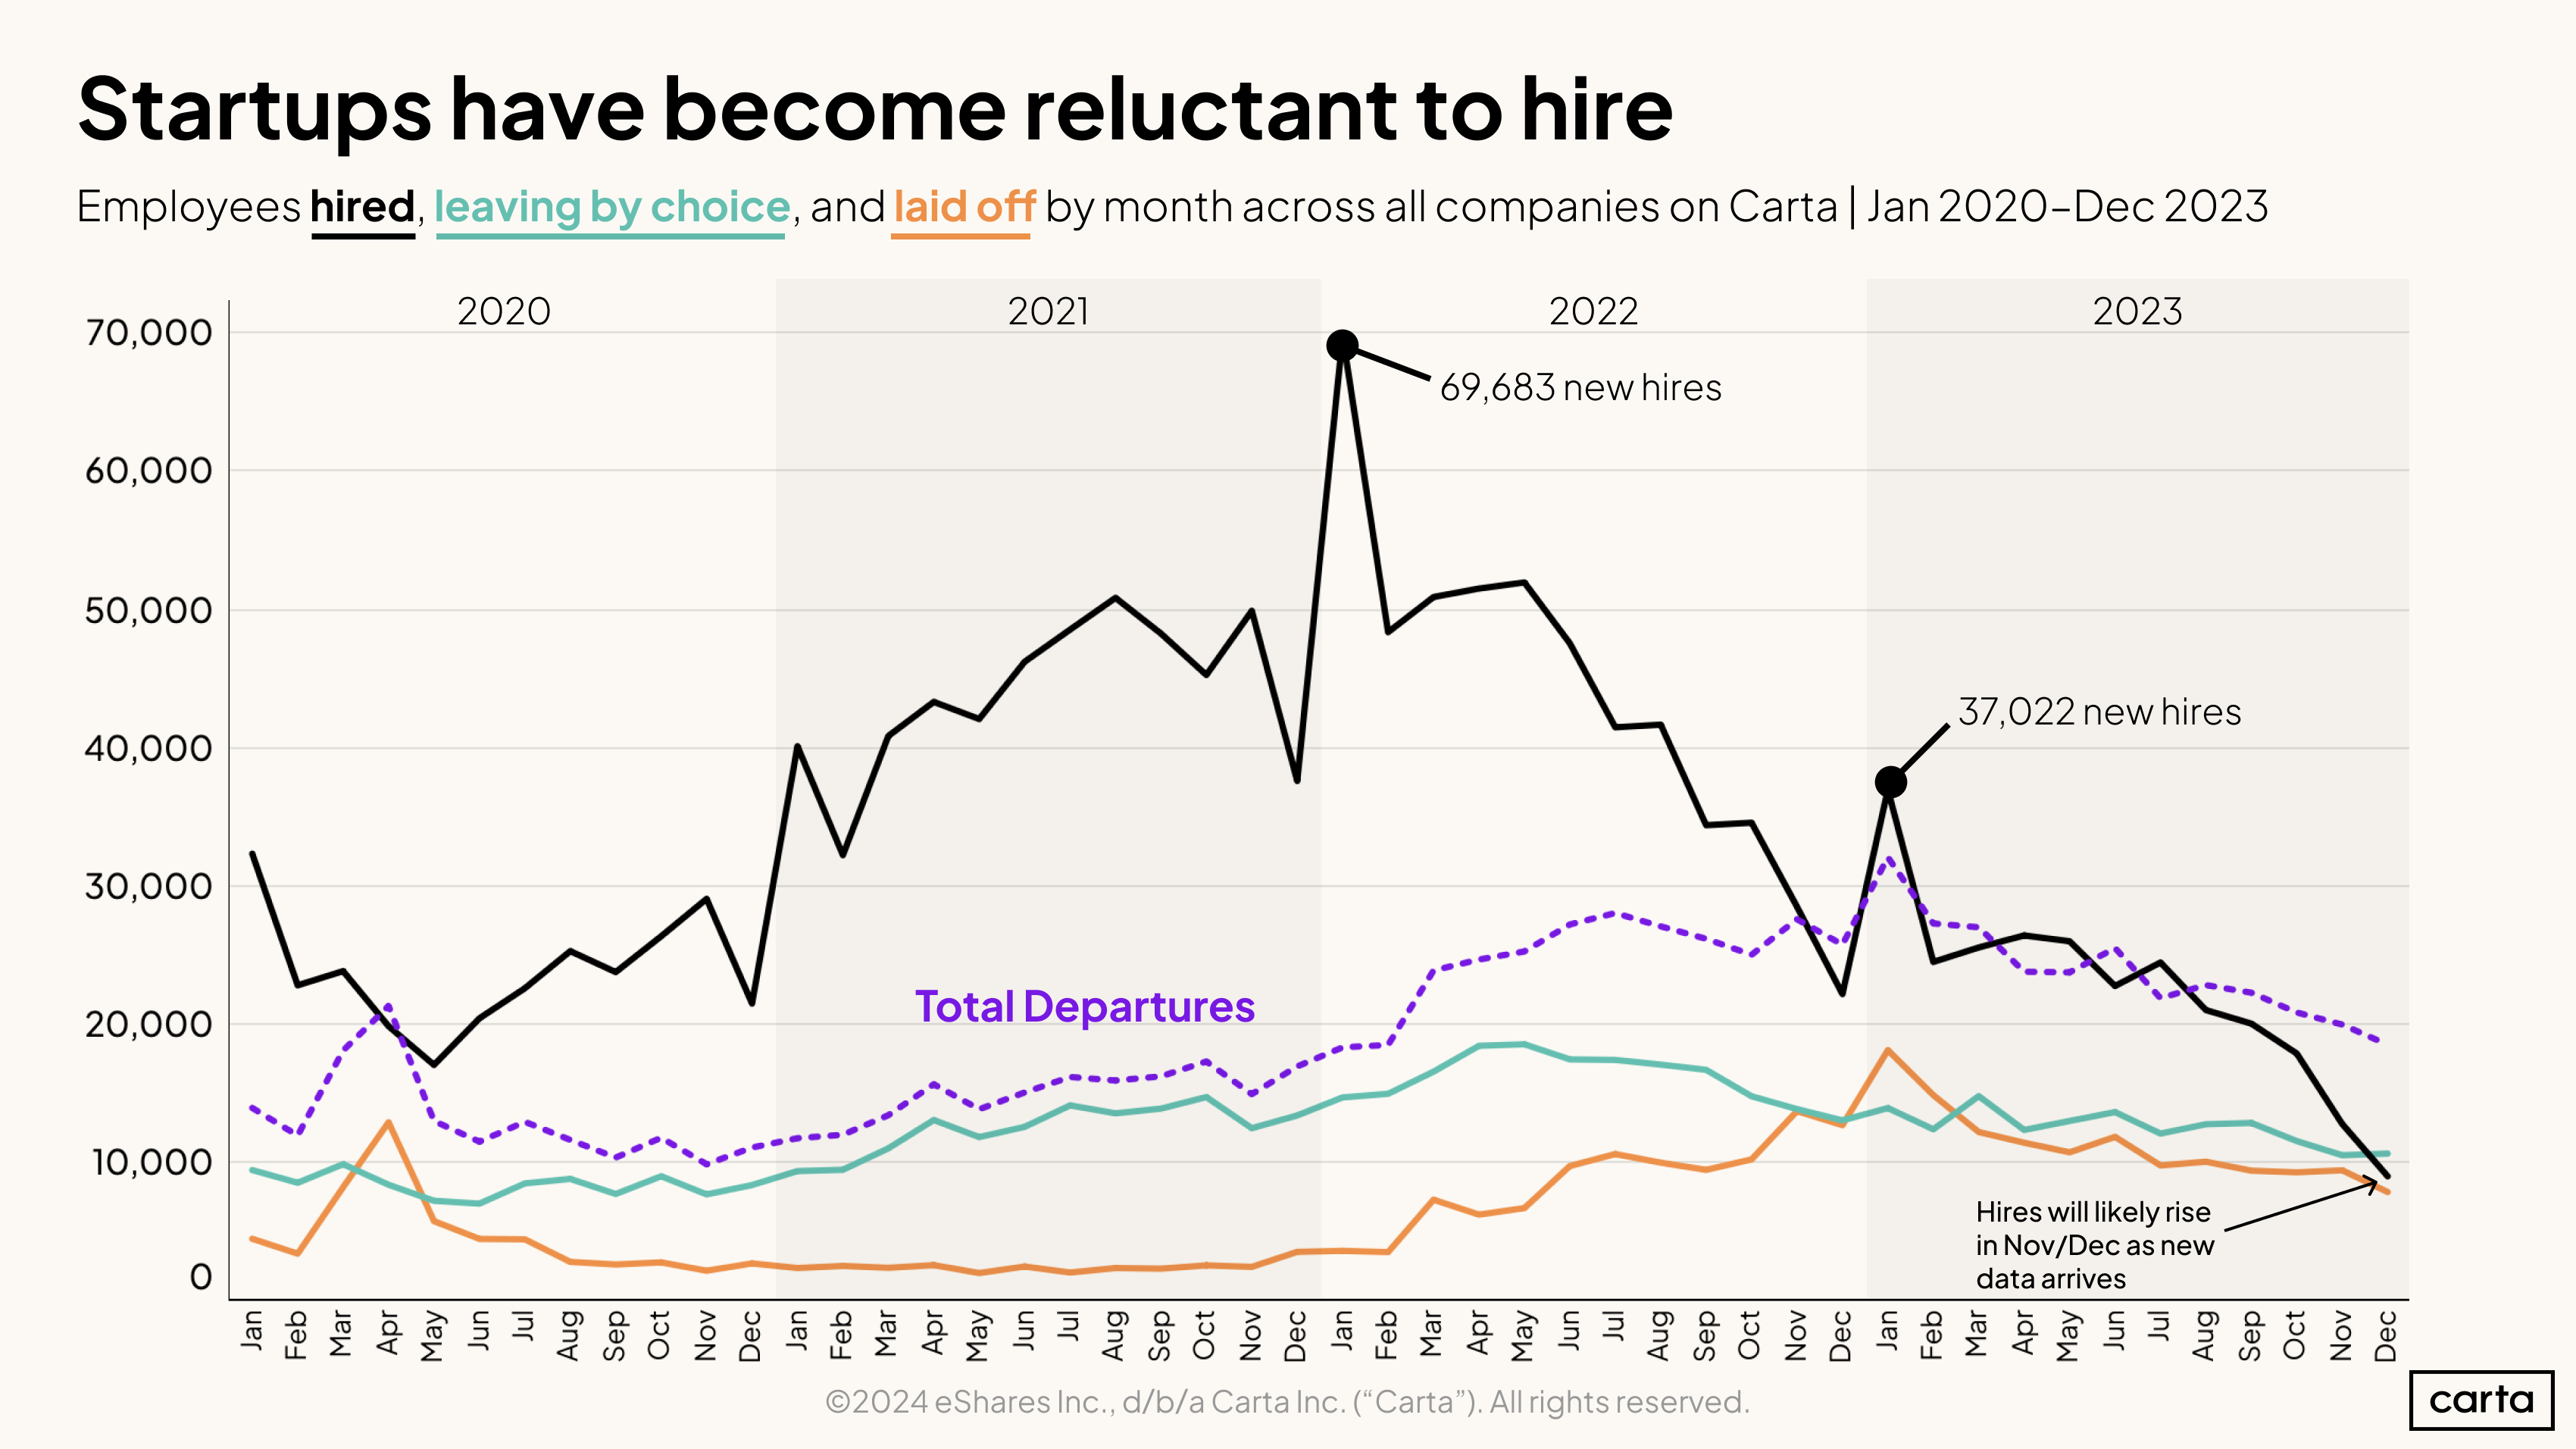
In most months throughout the past four years, new hires have outpaced total job departures on Carta—in some cases by very wide margins. But that trend came to an end in the second half of 2022, thanks to an ongoing plunge in the number of new hires. As hiring continued to decline in the second half of 2023, departures began to easily surpass new hires.
At the peak of the hiring market, in January 2022, startups on Carta brought on 69,683 new employees. Jump to January 2023 and that number fell to 37,022. Hiring continued to decline almost every month.
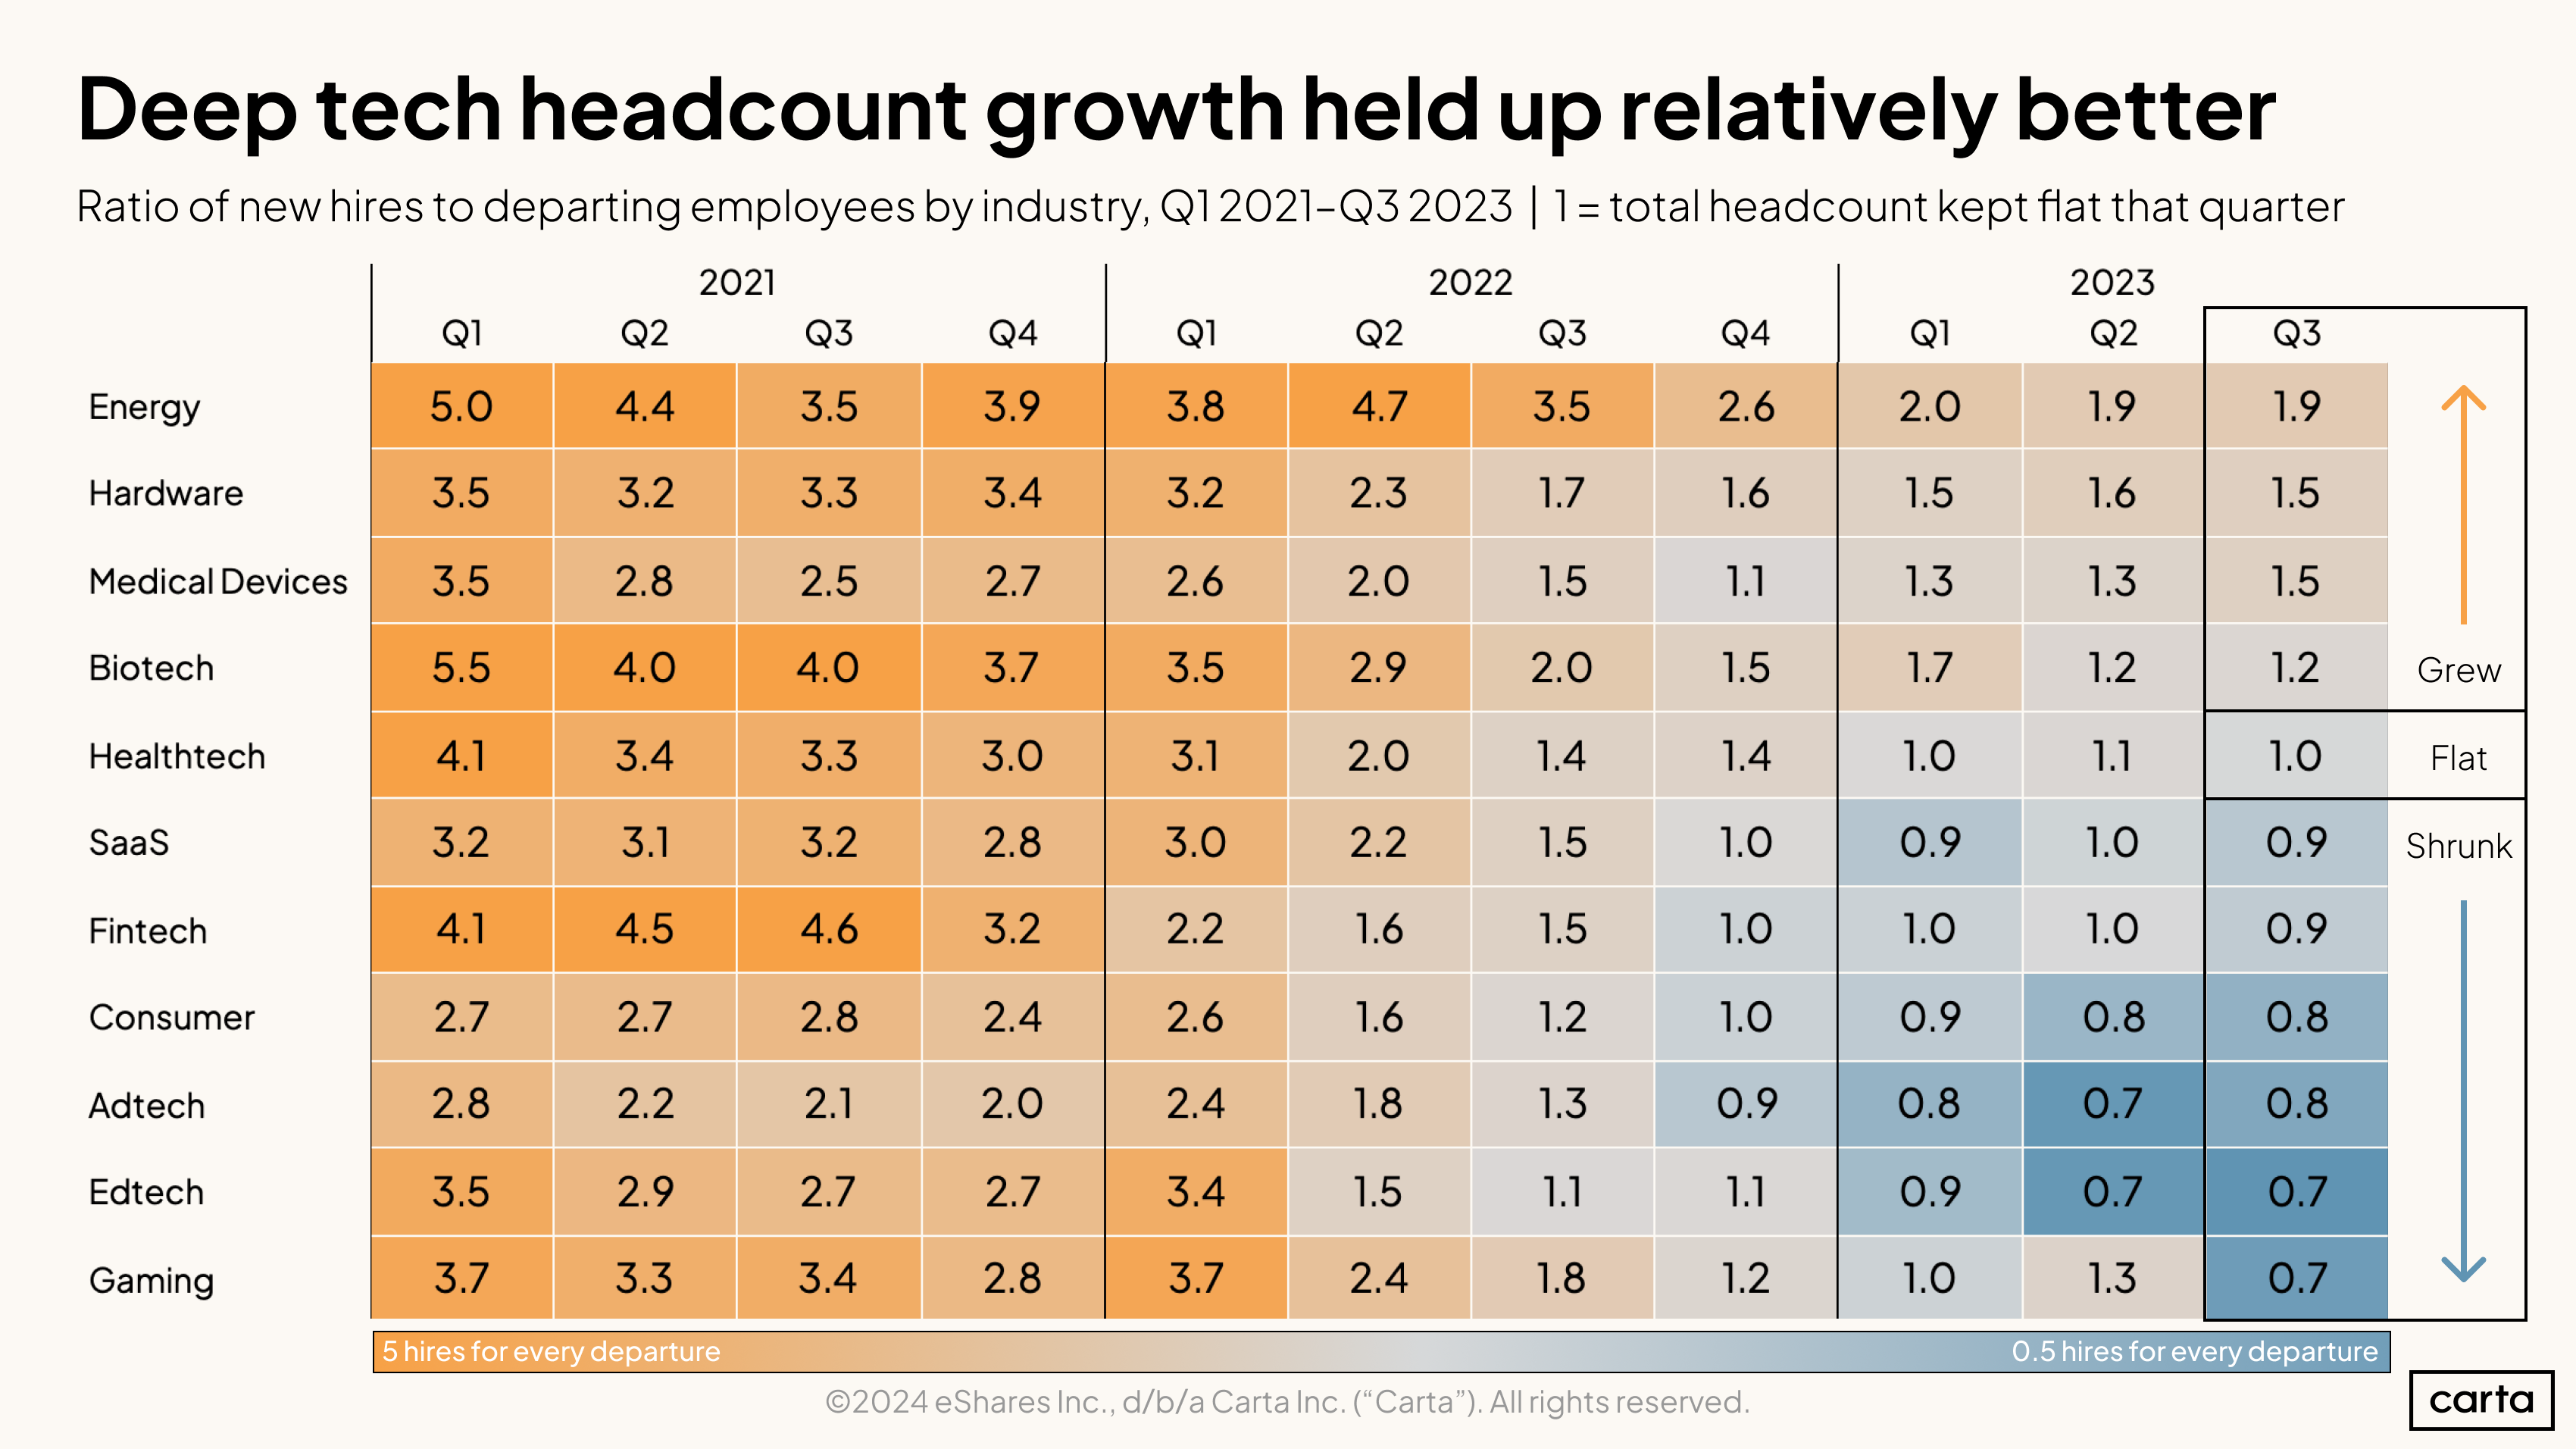
The ratio of new hires to departing employees has declined steadily over the past three years in each of these 11 major startup industries. But the scale of that decline has varied significantly across sectors. New hires are still more frequent than departures in areas like energy, hardware, and medical devices. In sectors like edtech and gaming, meanwhile, job departures have become more common than hires.
In general, hiring has remained more resilient in sectors that are based in hard research, engineering, and technological breakthroughs—what might be described as deep tech. Hiring has taken more of a hit in segments that rely more heavily on software.
The gaming industry has seen some of the biggest changes over the past two years. As recently as Q1 2022, it had the second highest hires-to-departures ratio of any sector in this sample at 3.7. By Q3 2023, it was tied for the lowest, at 0.7.
Company composition
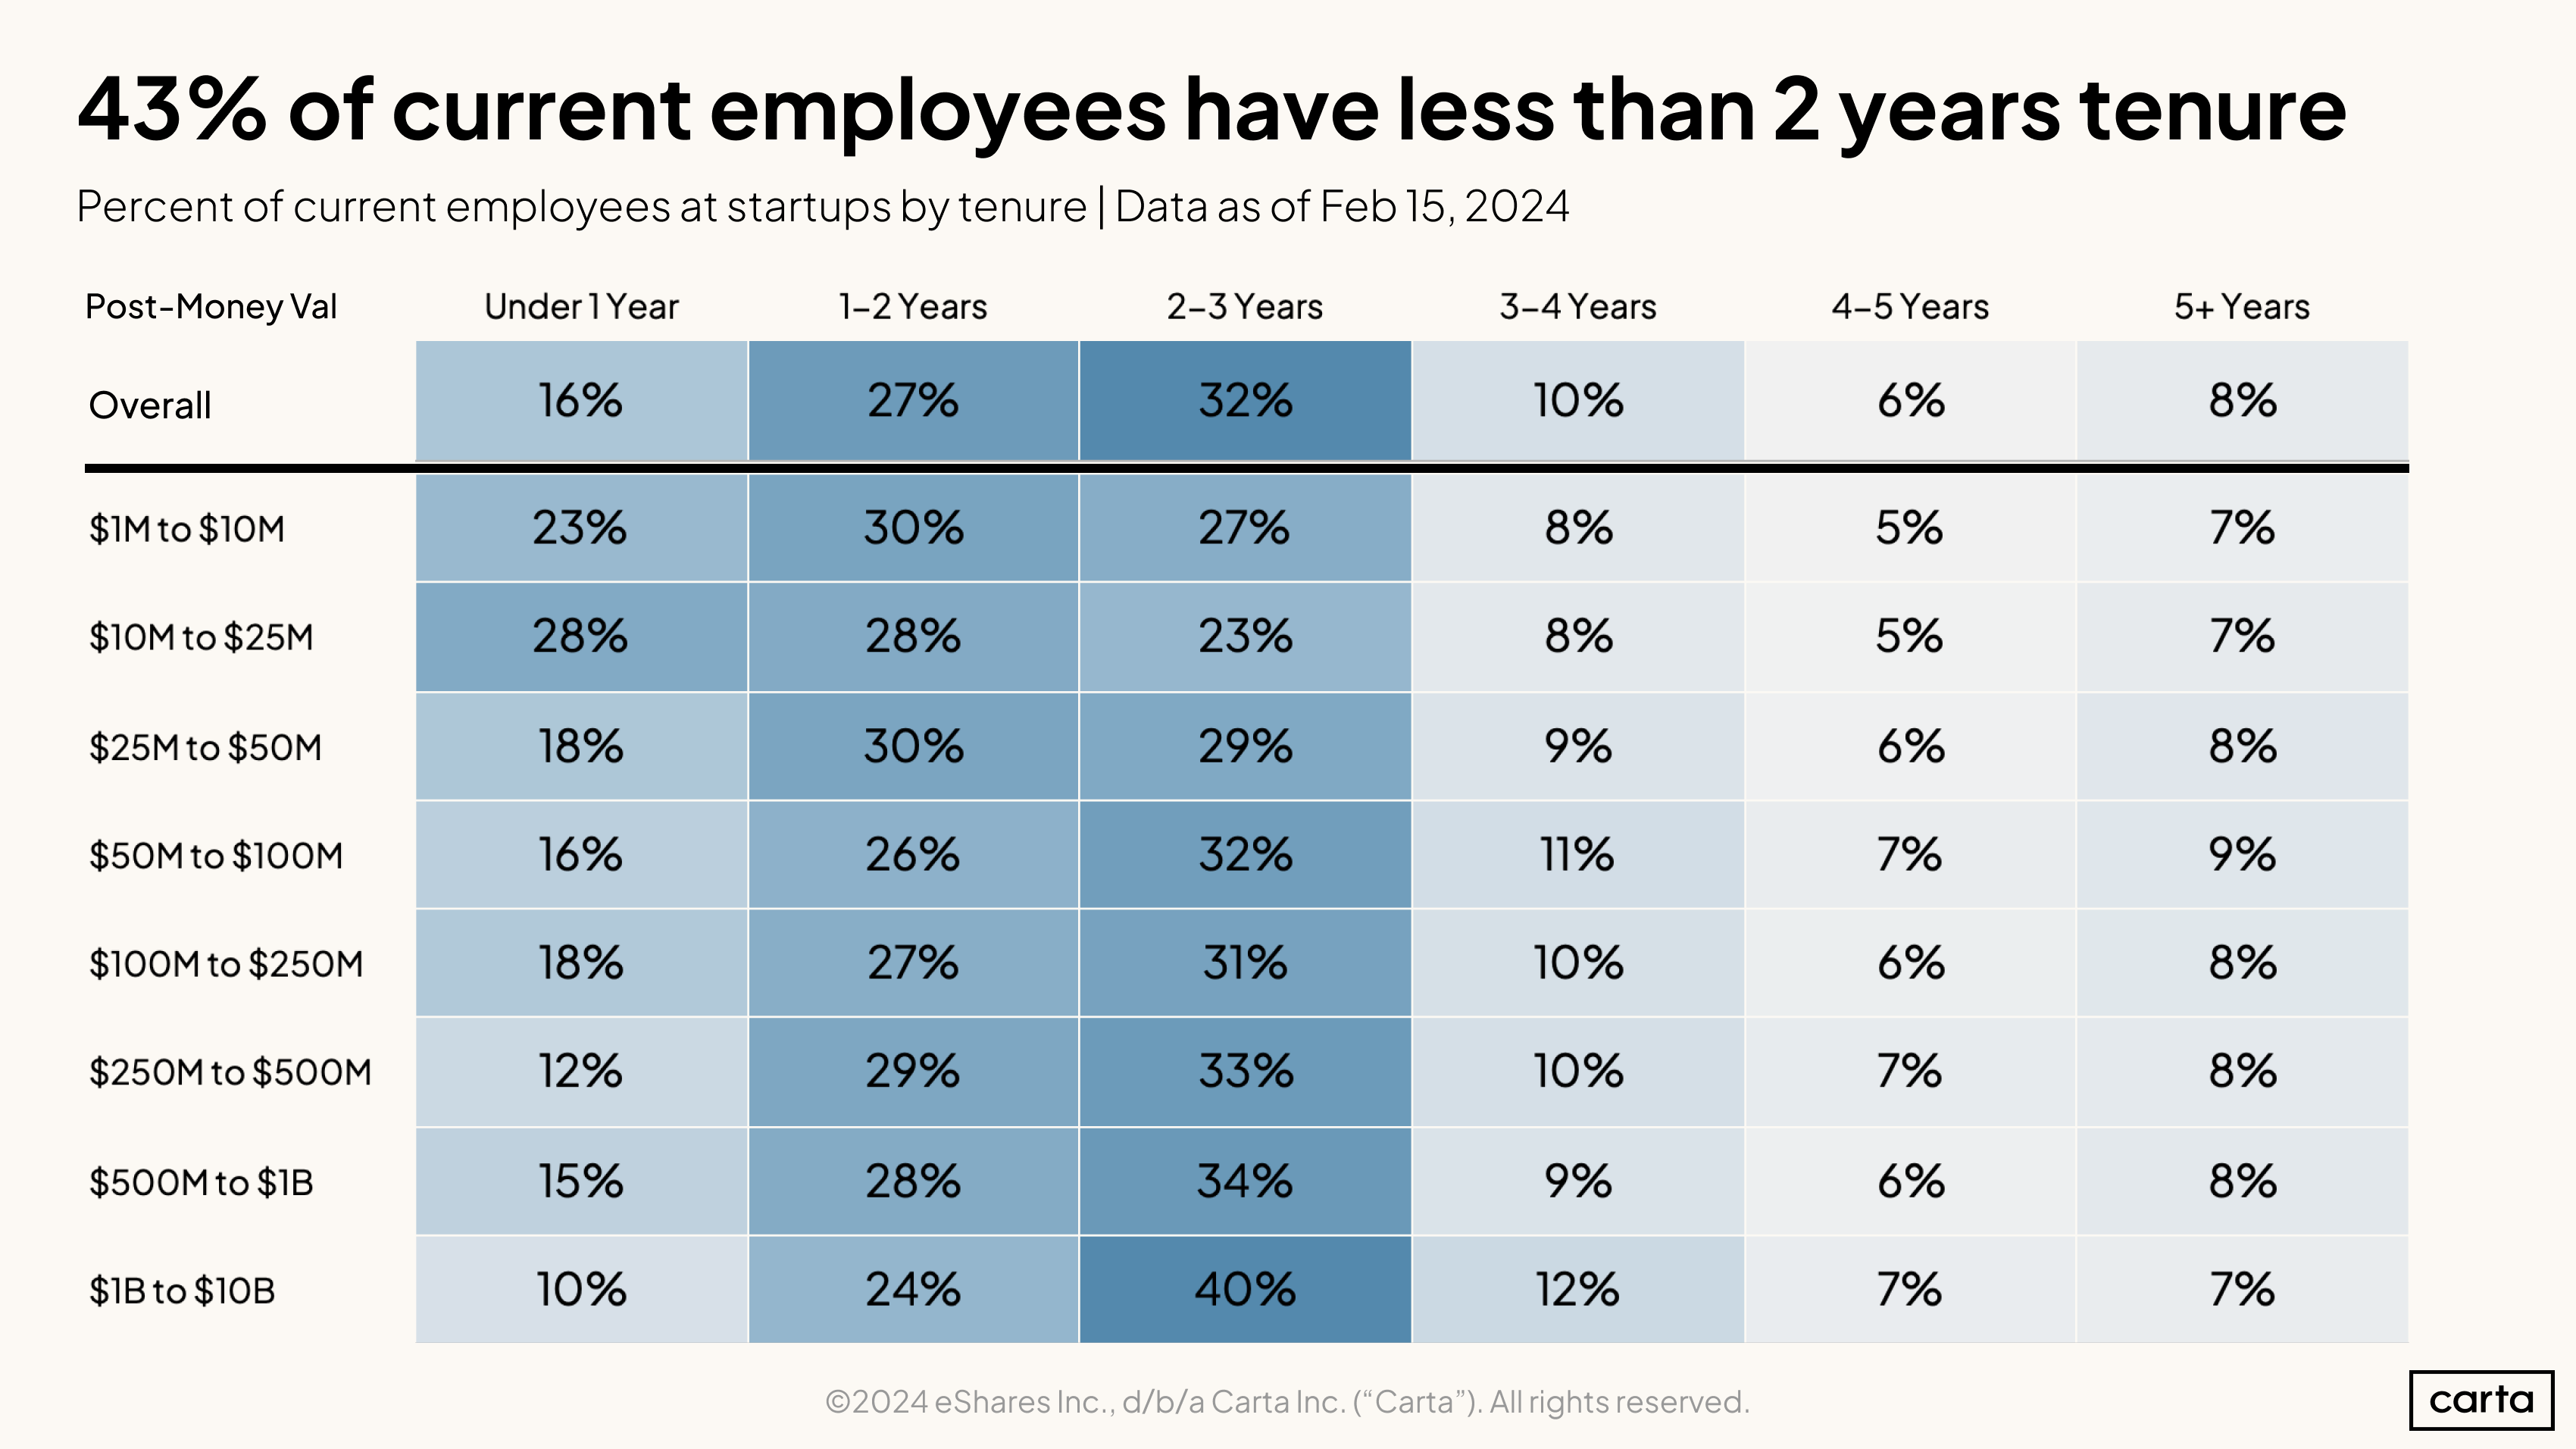
About 43% of all employees on Carta have been at their current company for less than two years, and about 75% for less than three years. Just 8%, meanwhile, have been in their positions for more than five years.
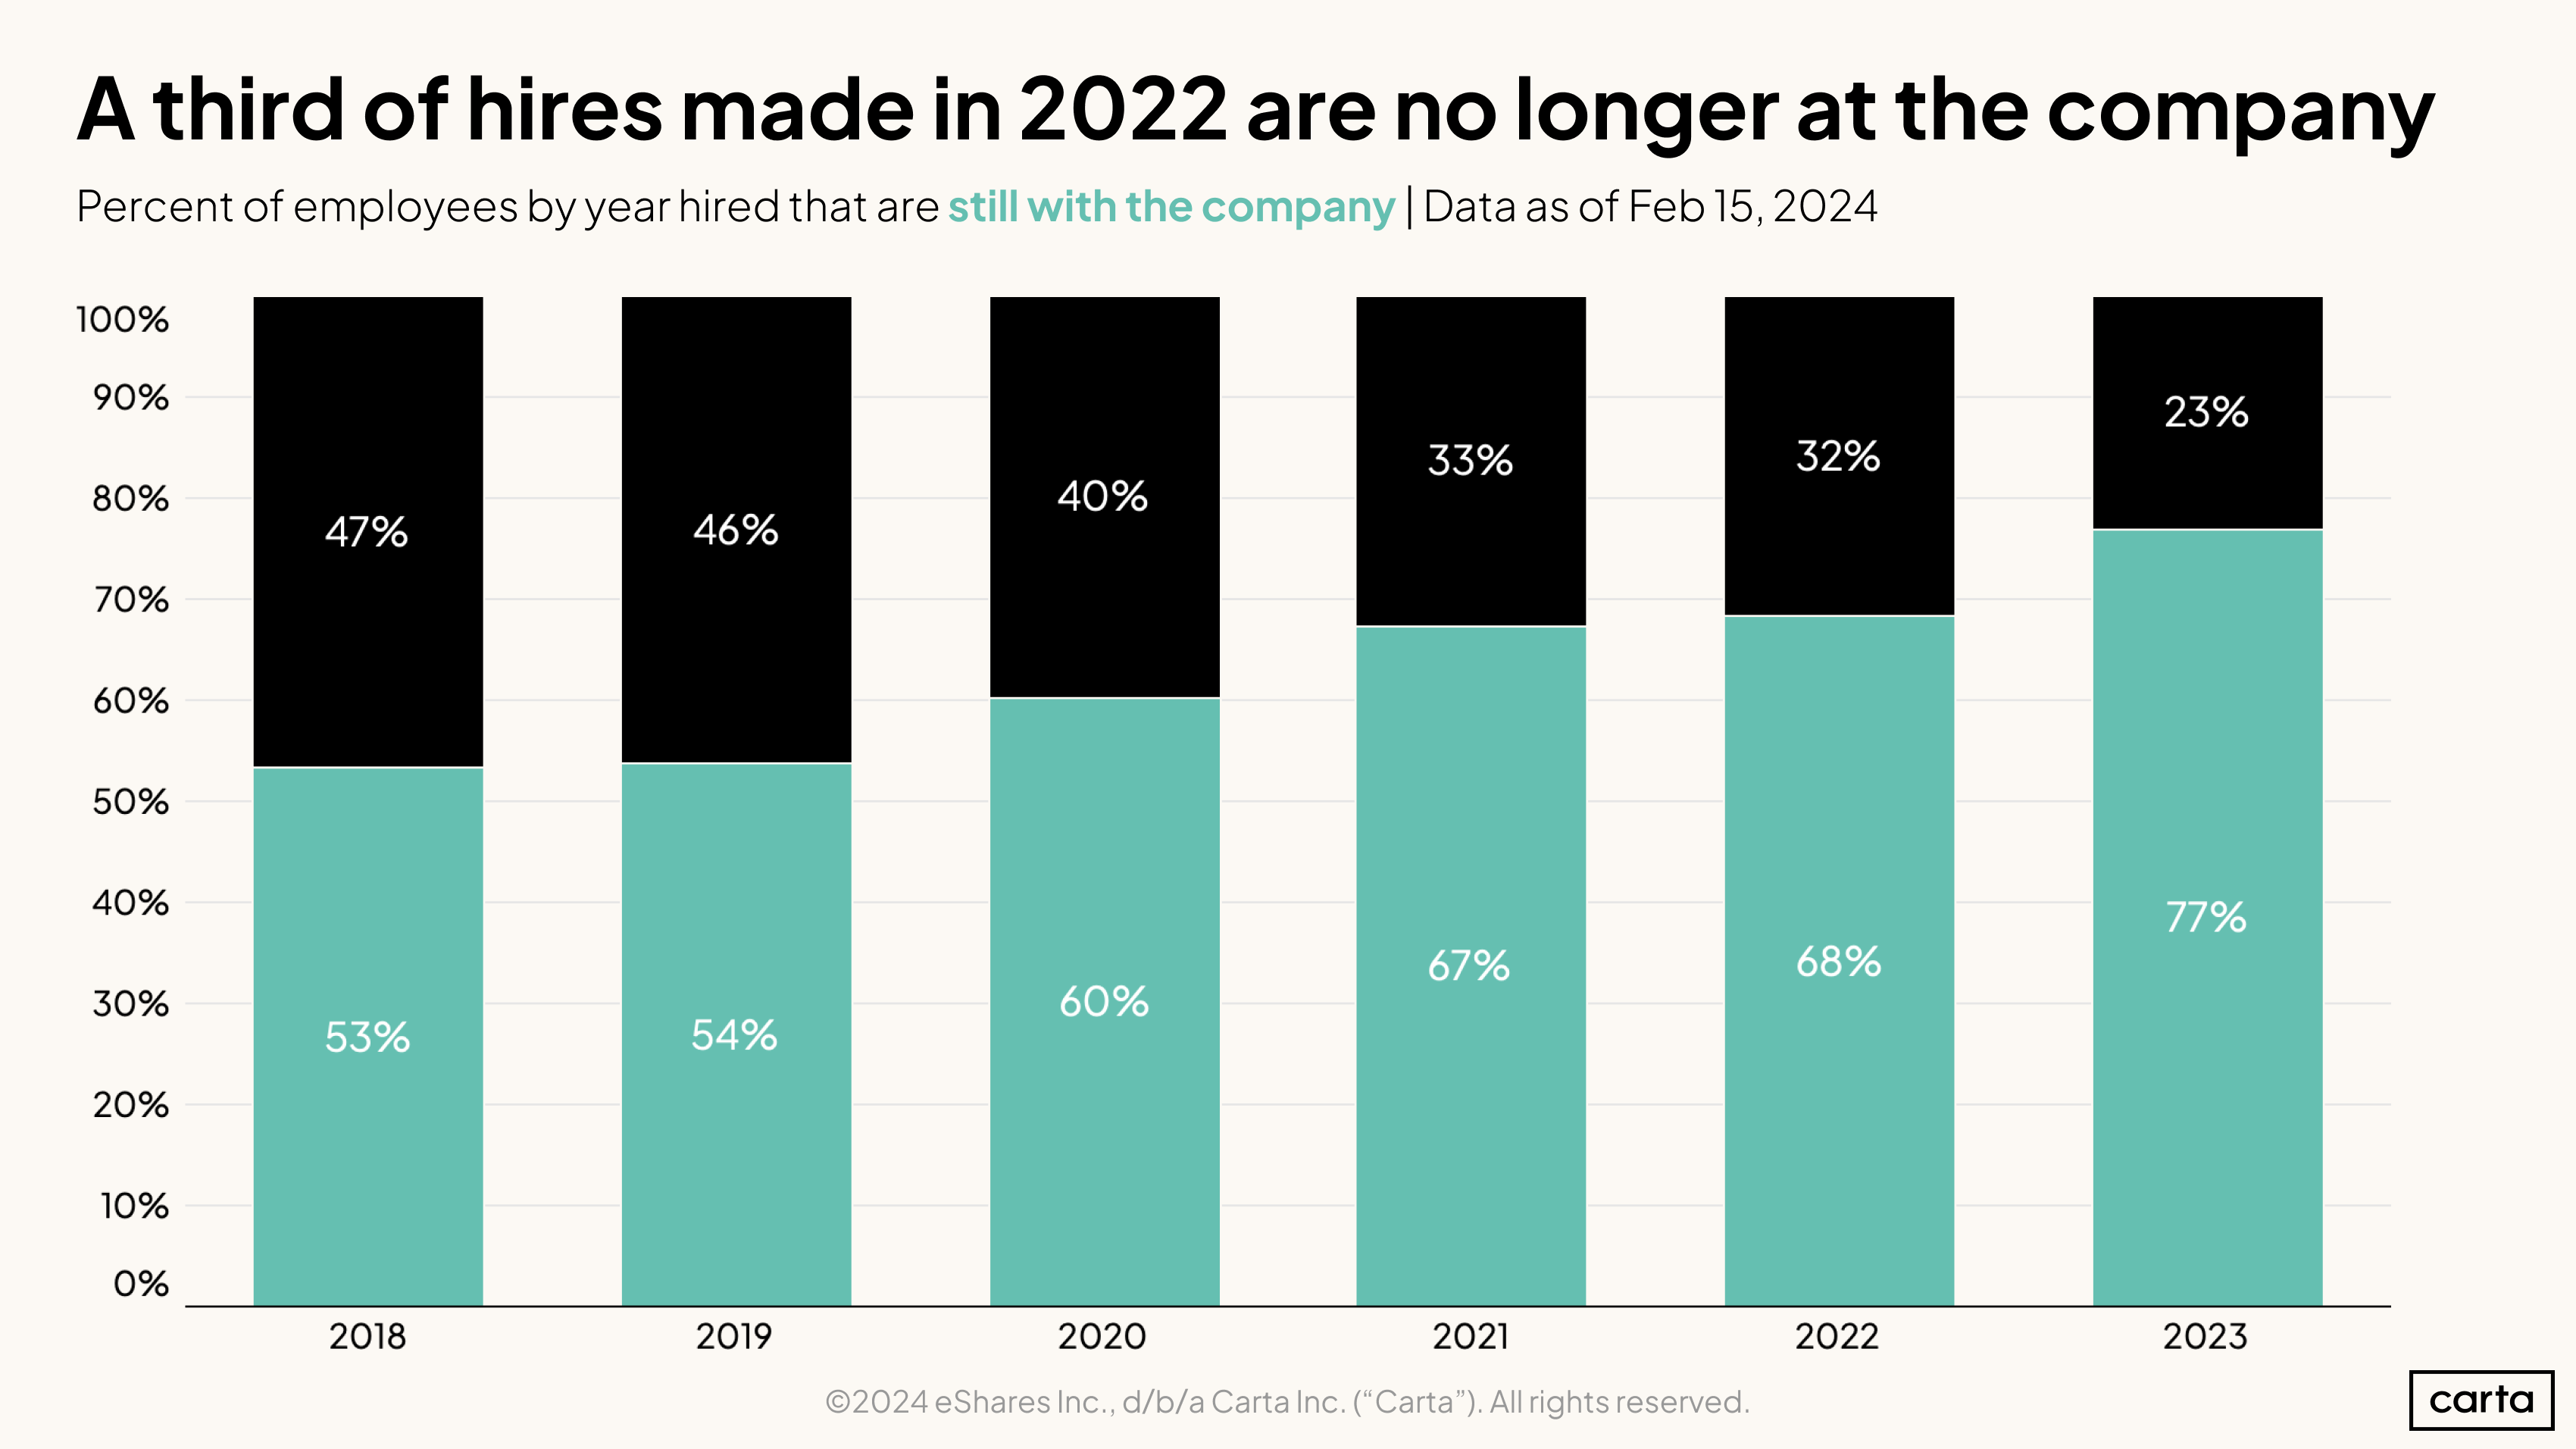
It doesn’t take long before employee turnover starts to add up. Already, more than one in five employees who were hired by startups in 2023 are no longer with the company.
The percentage of hires who are no longer at the company increases the farther back in time you go, as you might expect. But the scope of the change in recent years is surprising. Why is there only a 1% difference between the 2021 and 2022 cohorts?
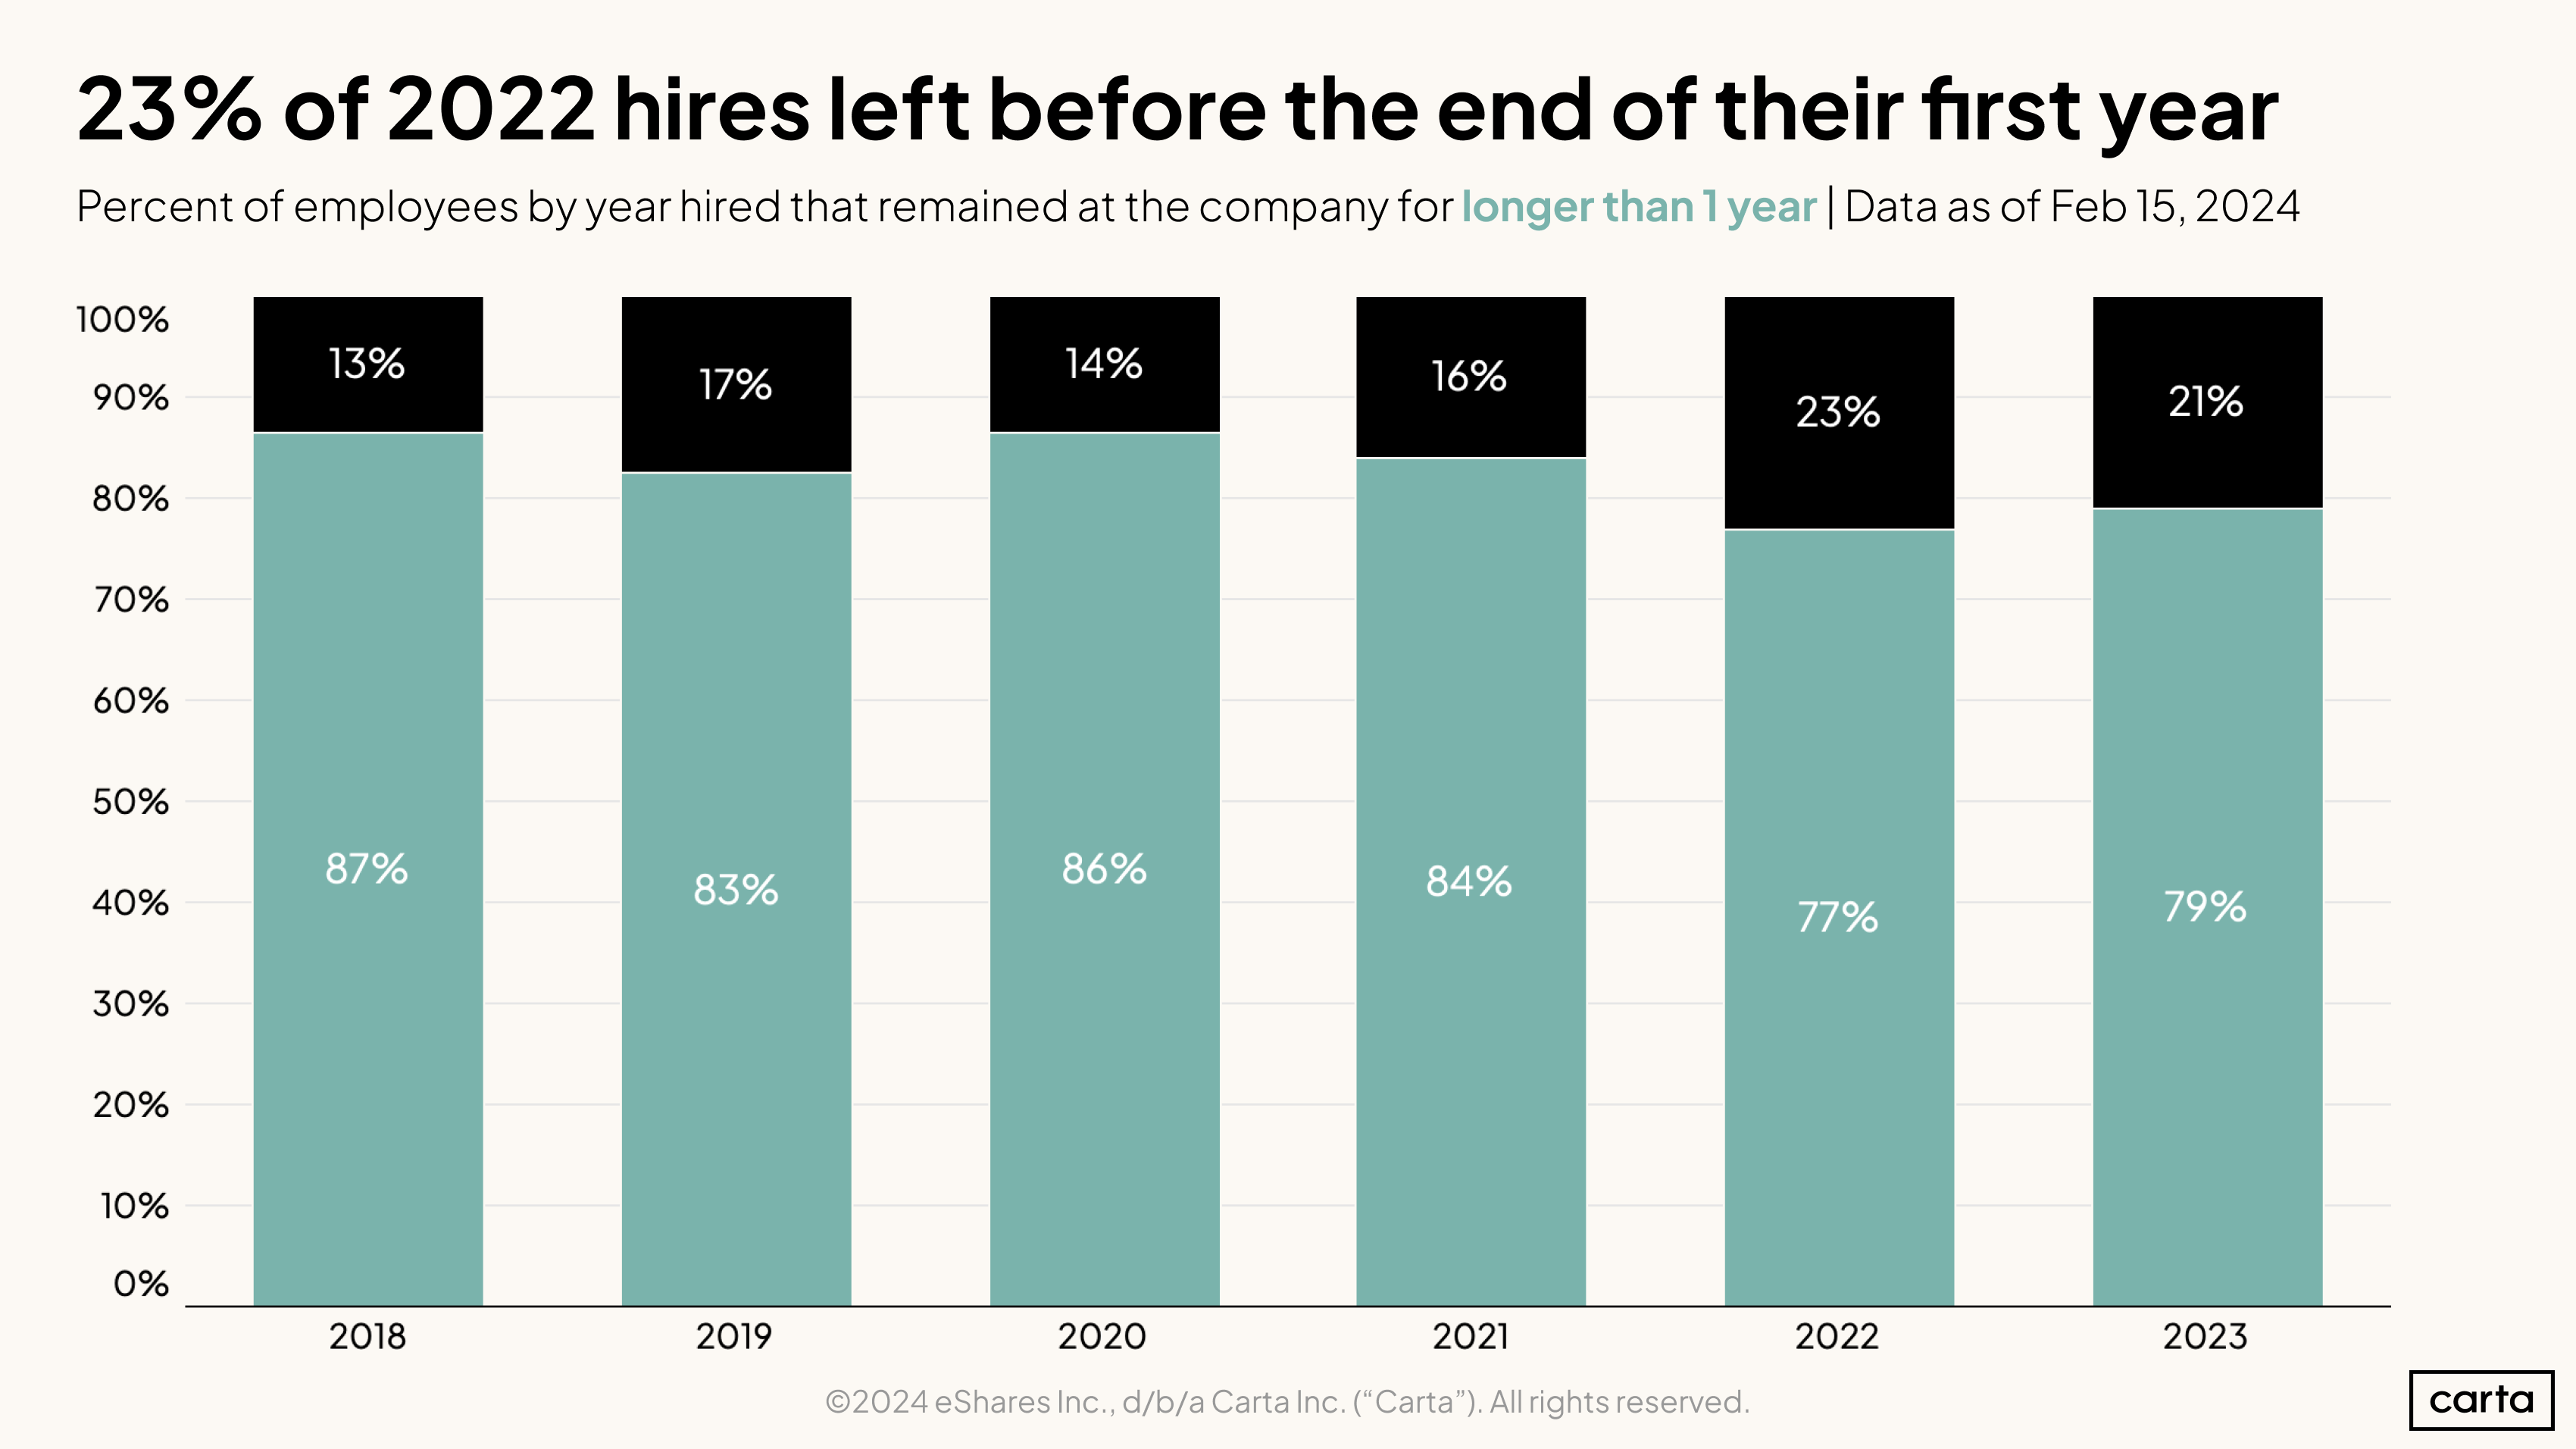
It turns out that 2022 was a year of particularly rapid job change. 23% of hires made in 2022 were no longer with the company one year after their start date—the highest such annual rate we’ve recorded on Carta.
Combined with our data on voluntary and involuntary departures, the data suggests that as startups began to layoff workers in 2022 and 2023, the shortest tenured employees were first to be cut.
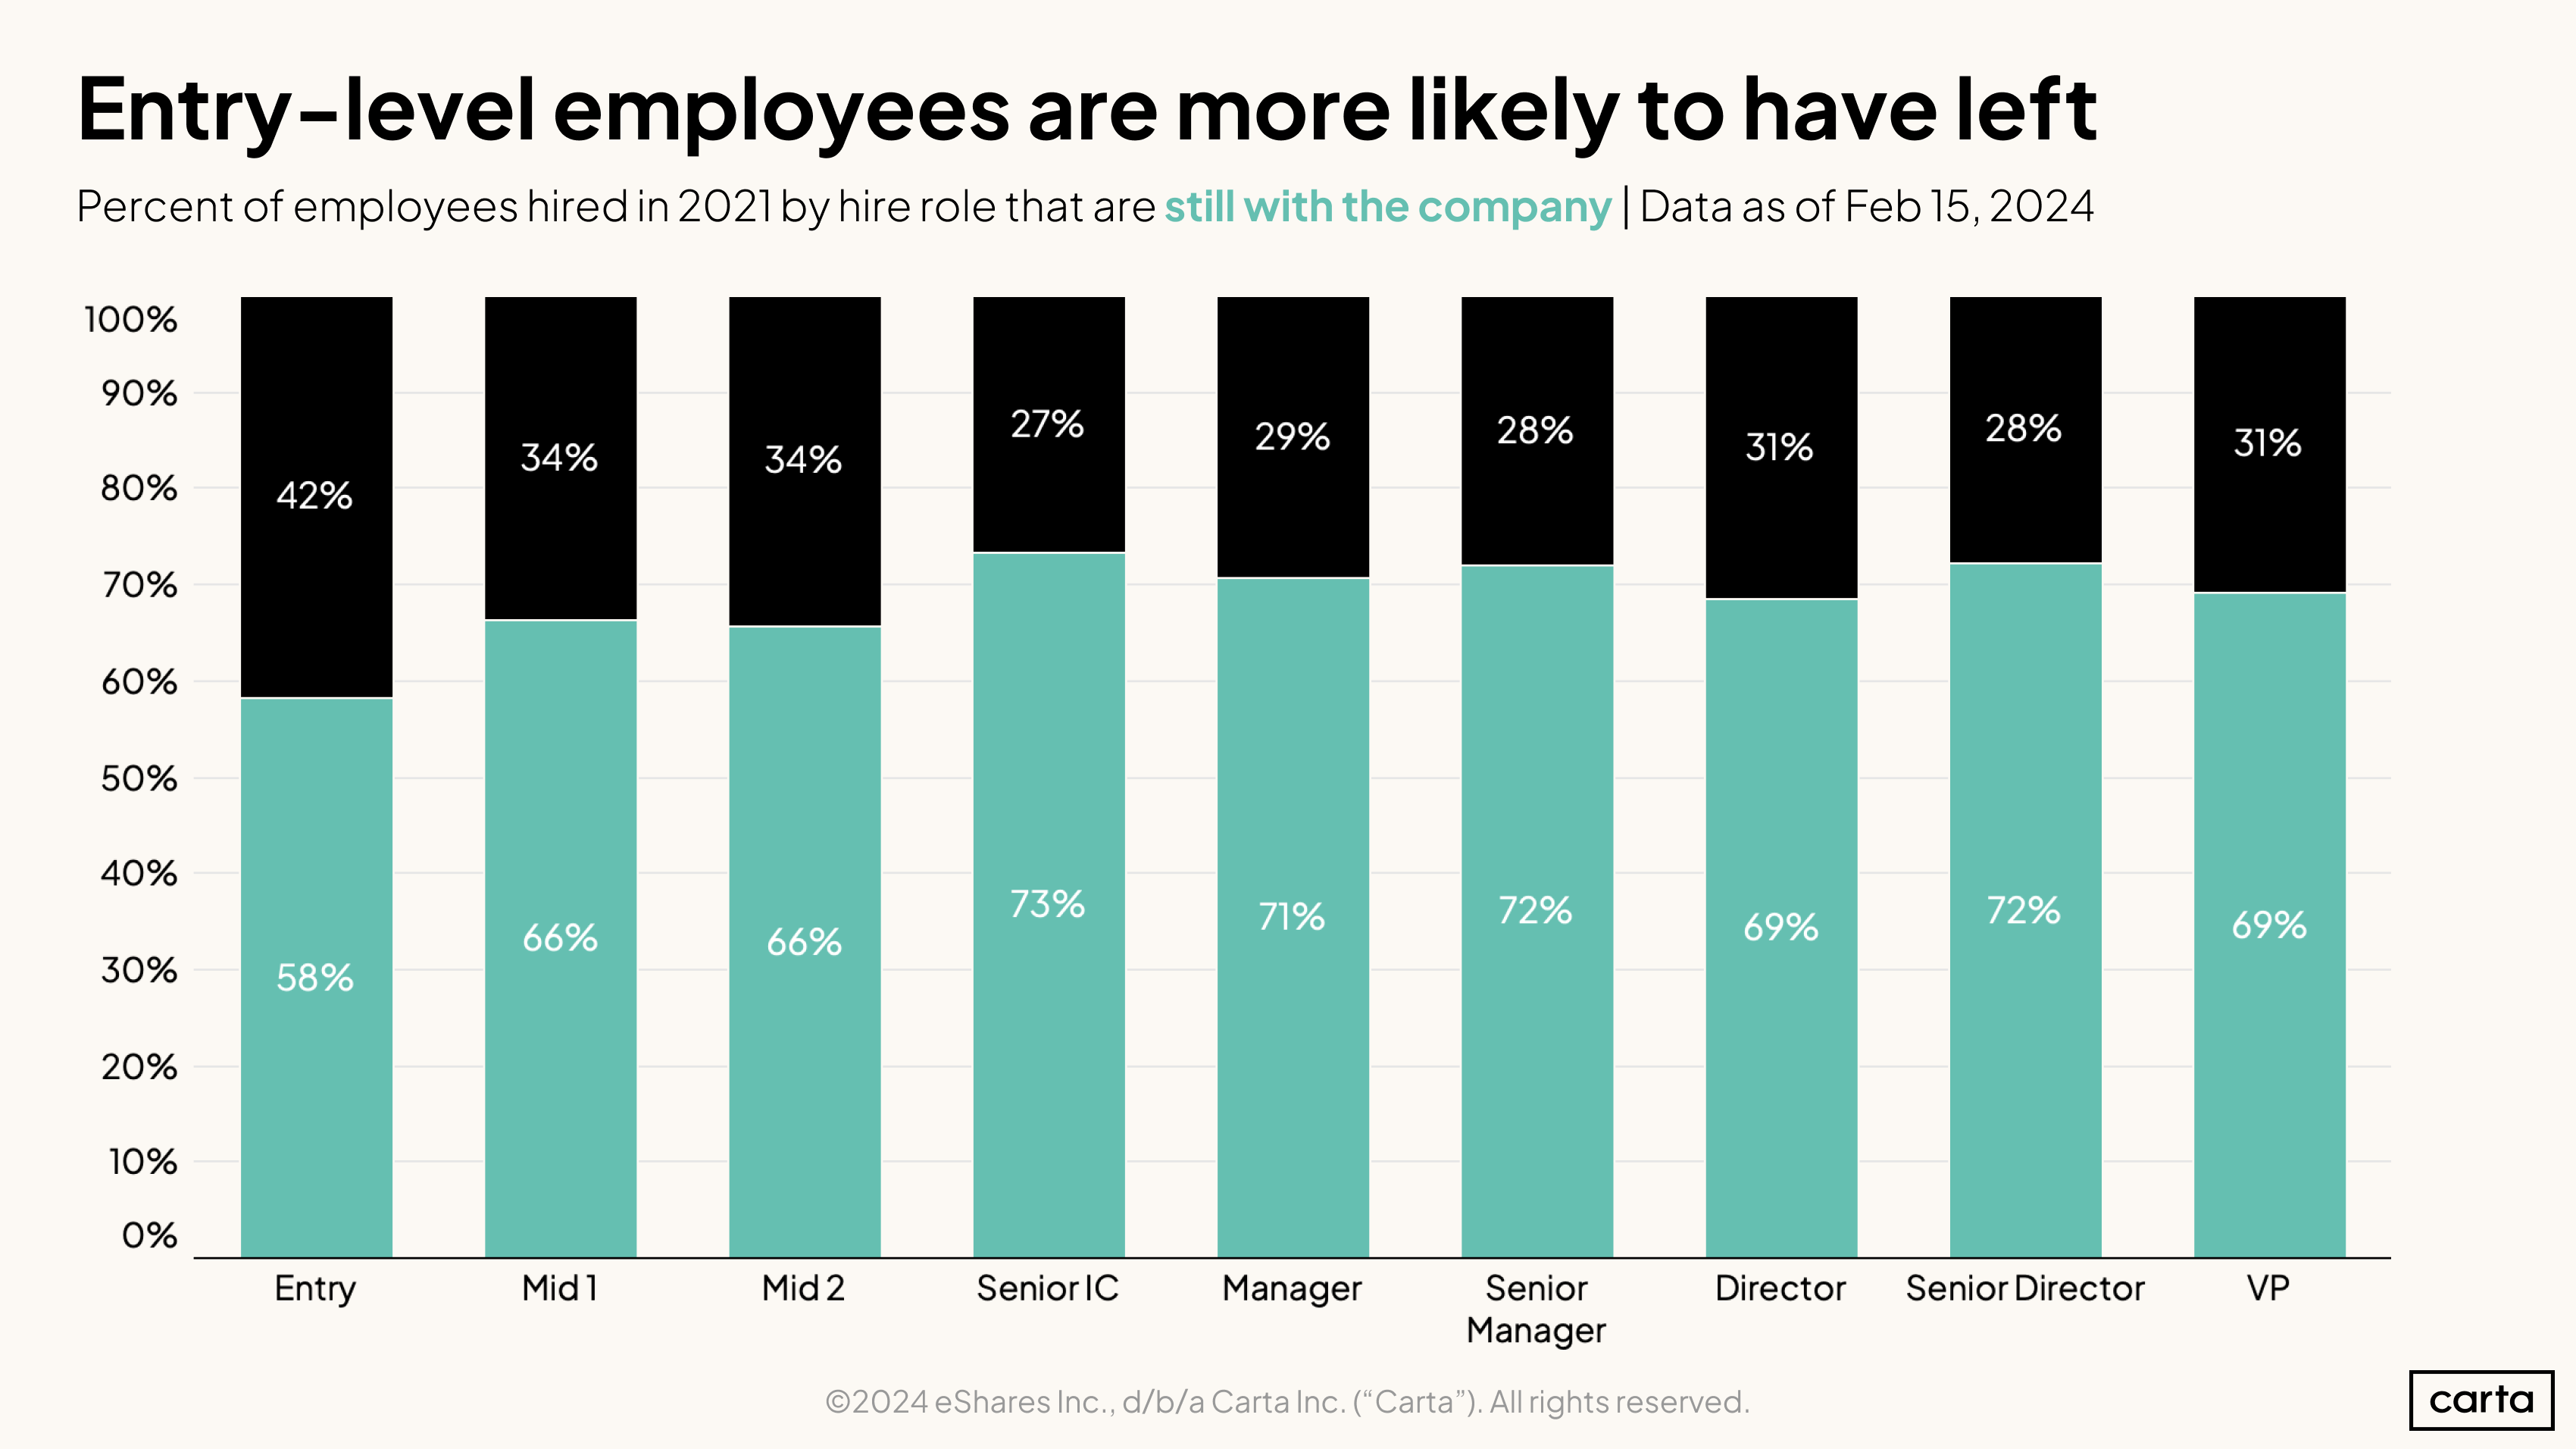
Across all roles, 33% of employees hired in 2021 have since left their companies. That number is noticeably higher among entry-level employees, at 42%. Mid-level employees have also left their jobs at a slightly higher-than-average rate. Employees in higher-ranking roles who were hired in 2021 are more likely to remain in those positions. But there’s little variation in tenure between functions at the manager level and above.
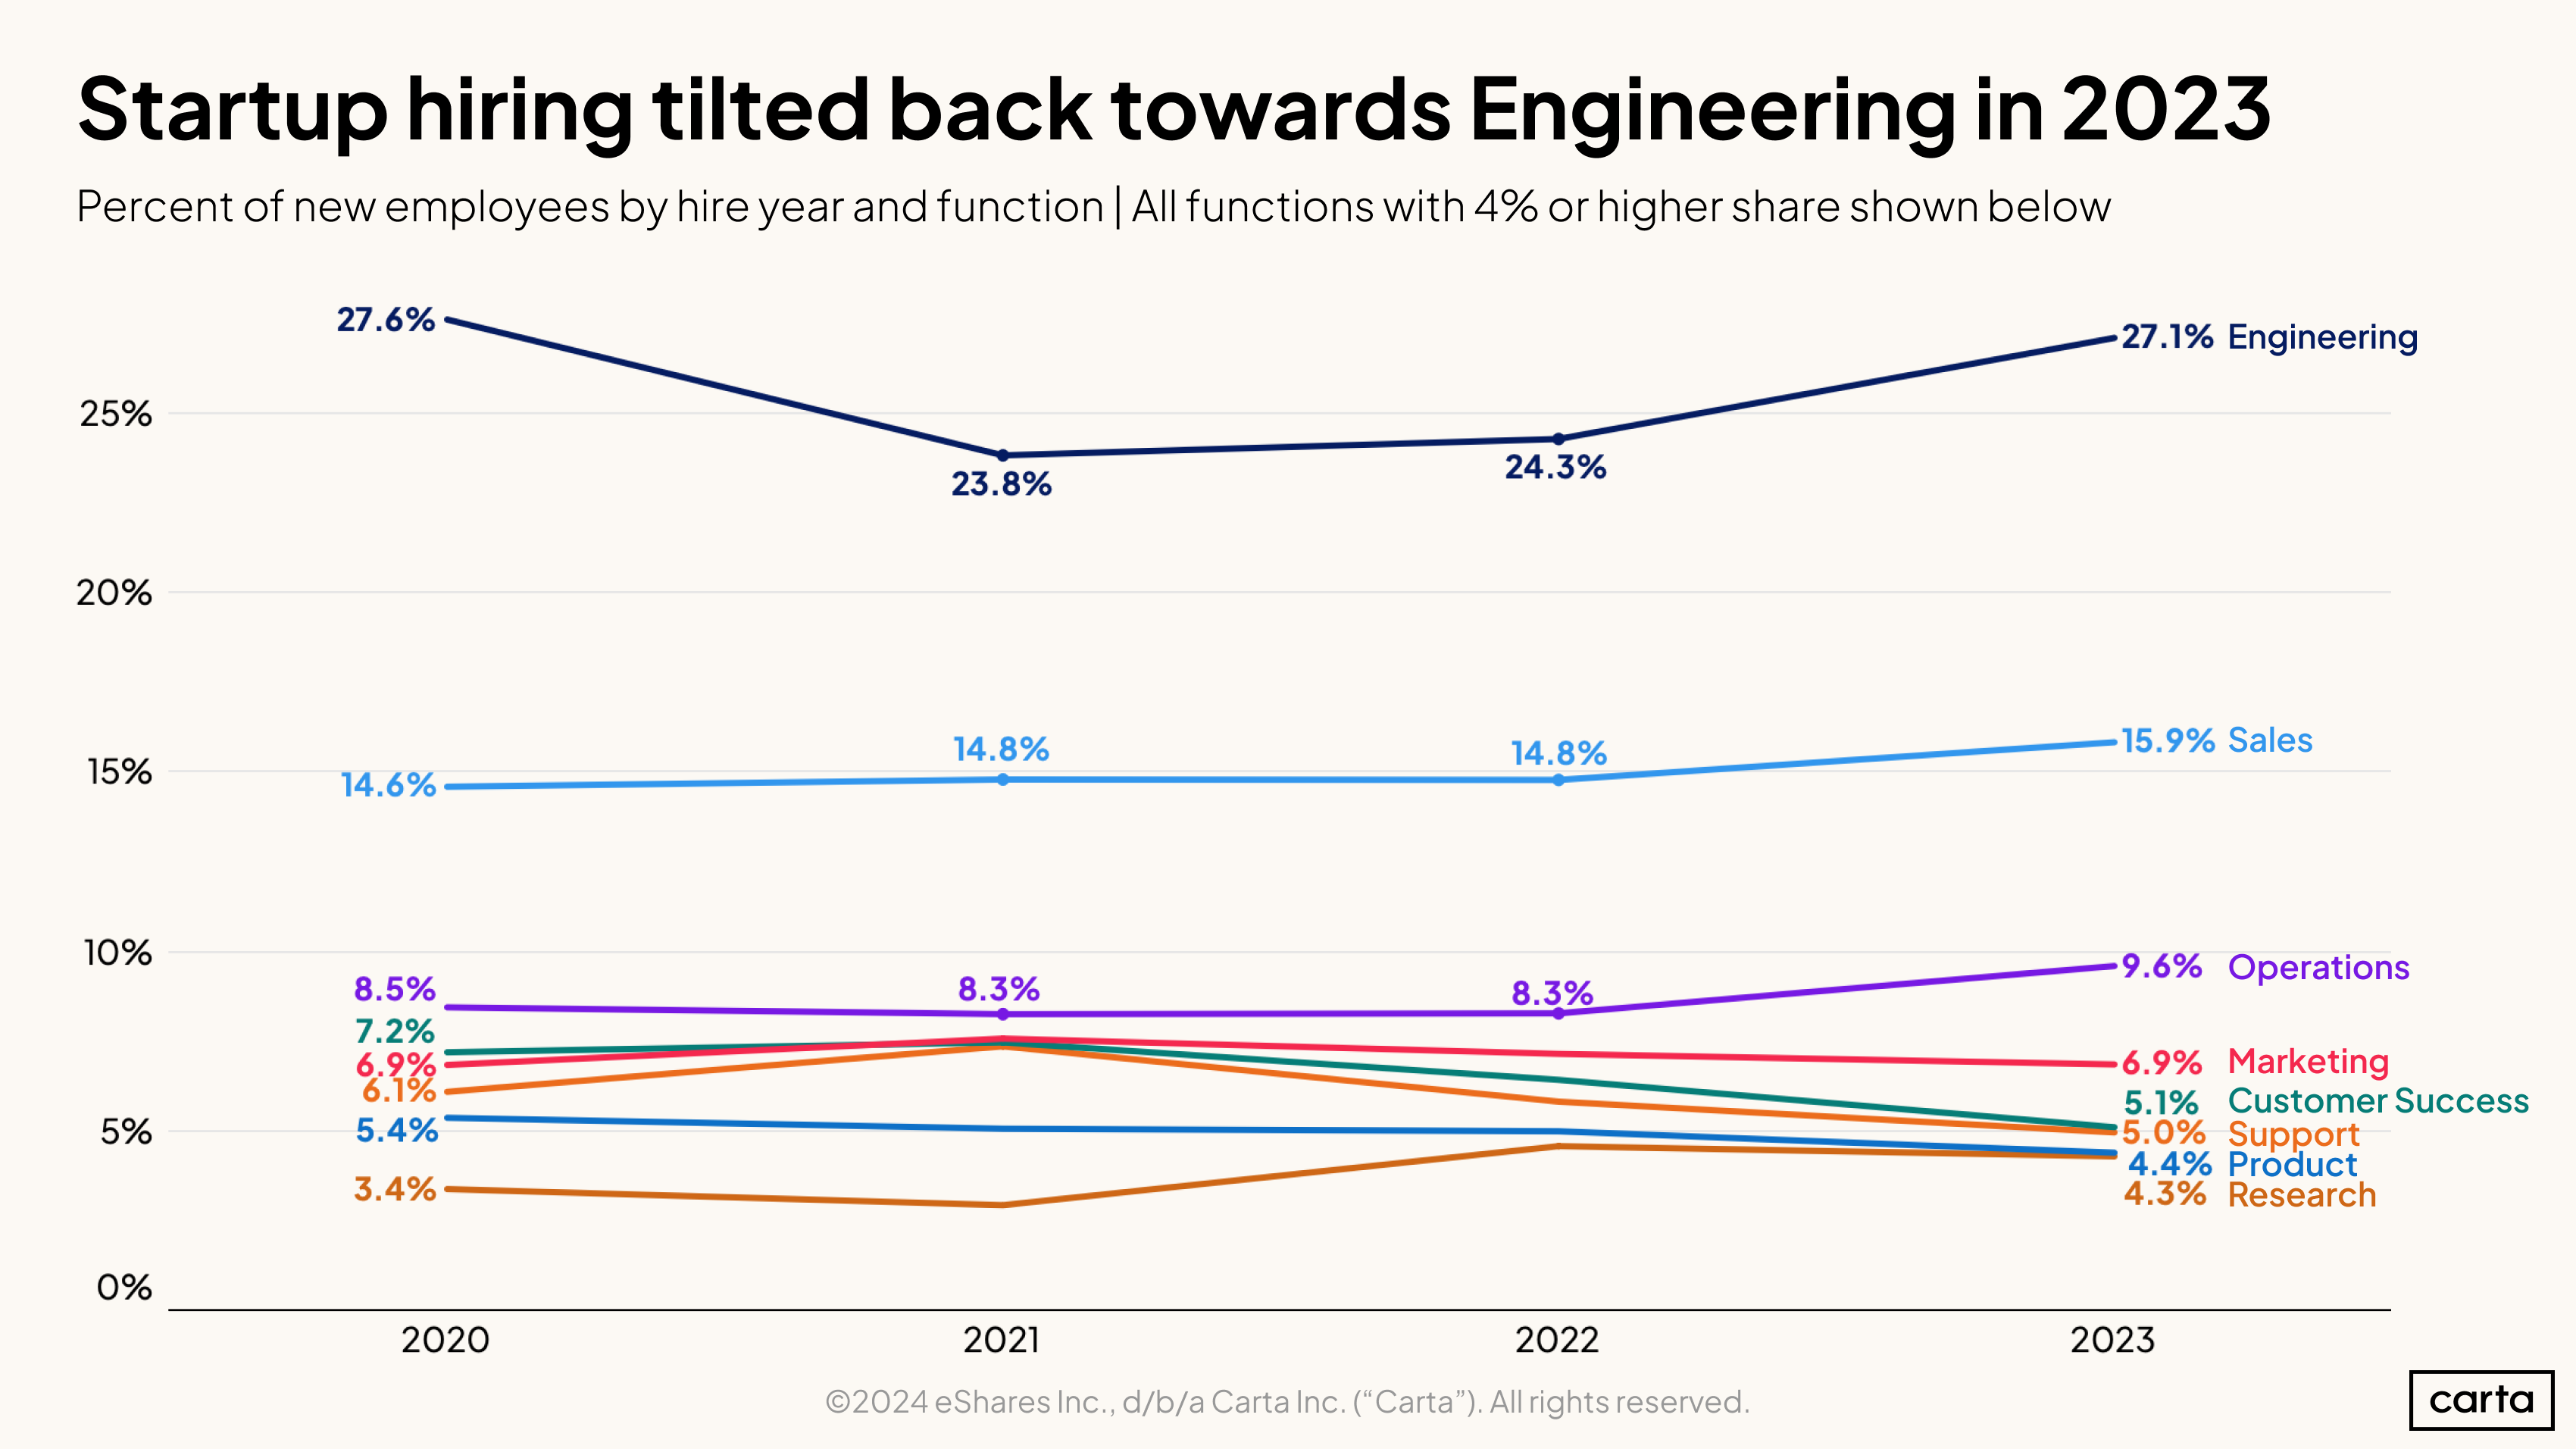
When startup hiring was at its peak in 2021 and 2022, the proportion of all new hires who filled engineering roles declined by a few percentage points. As hiring slowed down in 2023, the proportion of engineering hires ticked back up.
For many startups, particularly those in deep tech, engineering forms the base of the business’s hiring needs. While those companies may cut back on hiring for other job functions, there’s always demand for engineers.
The proportion of new hires who are in sales and operations roles also increased in 2023 compared to prior years. Combine those developments with the increase in engineering hires, and it appears companies are choosing to double down in the areas where they were already doing the most hiring.
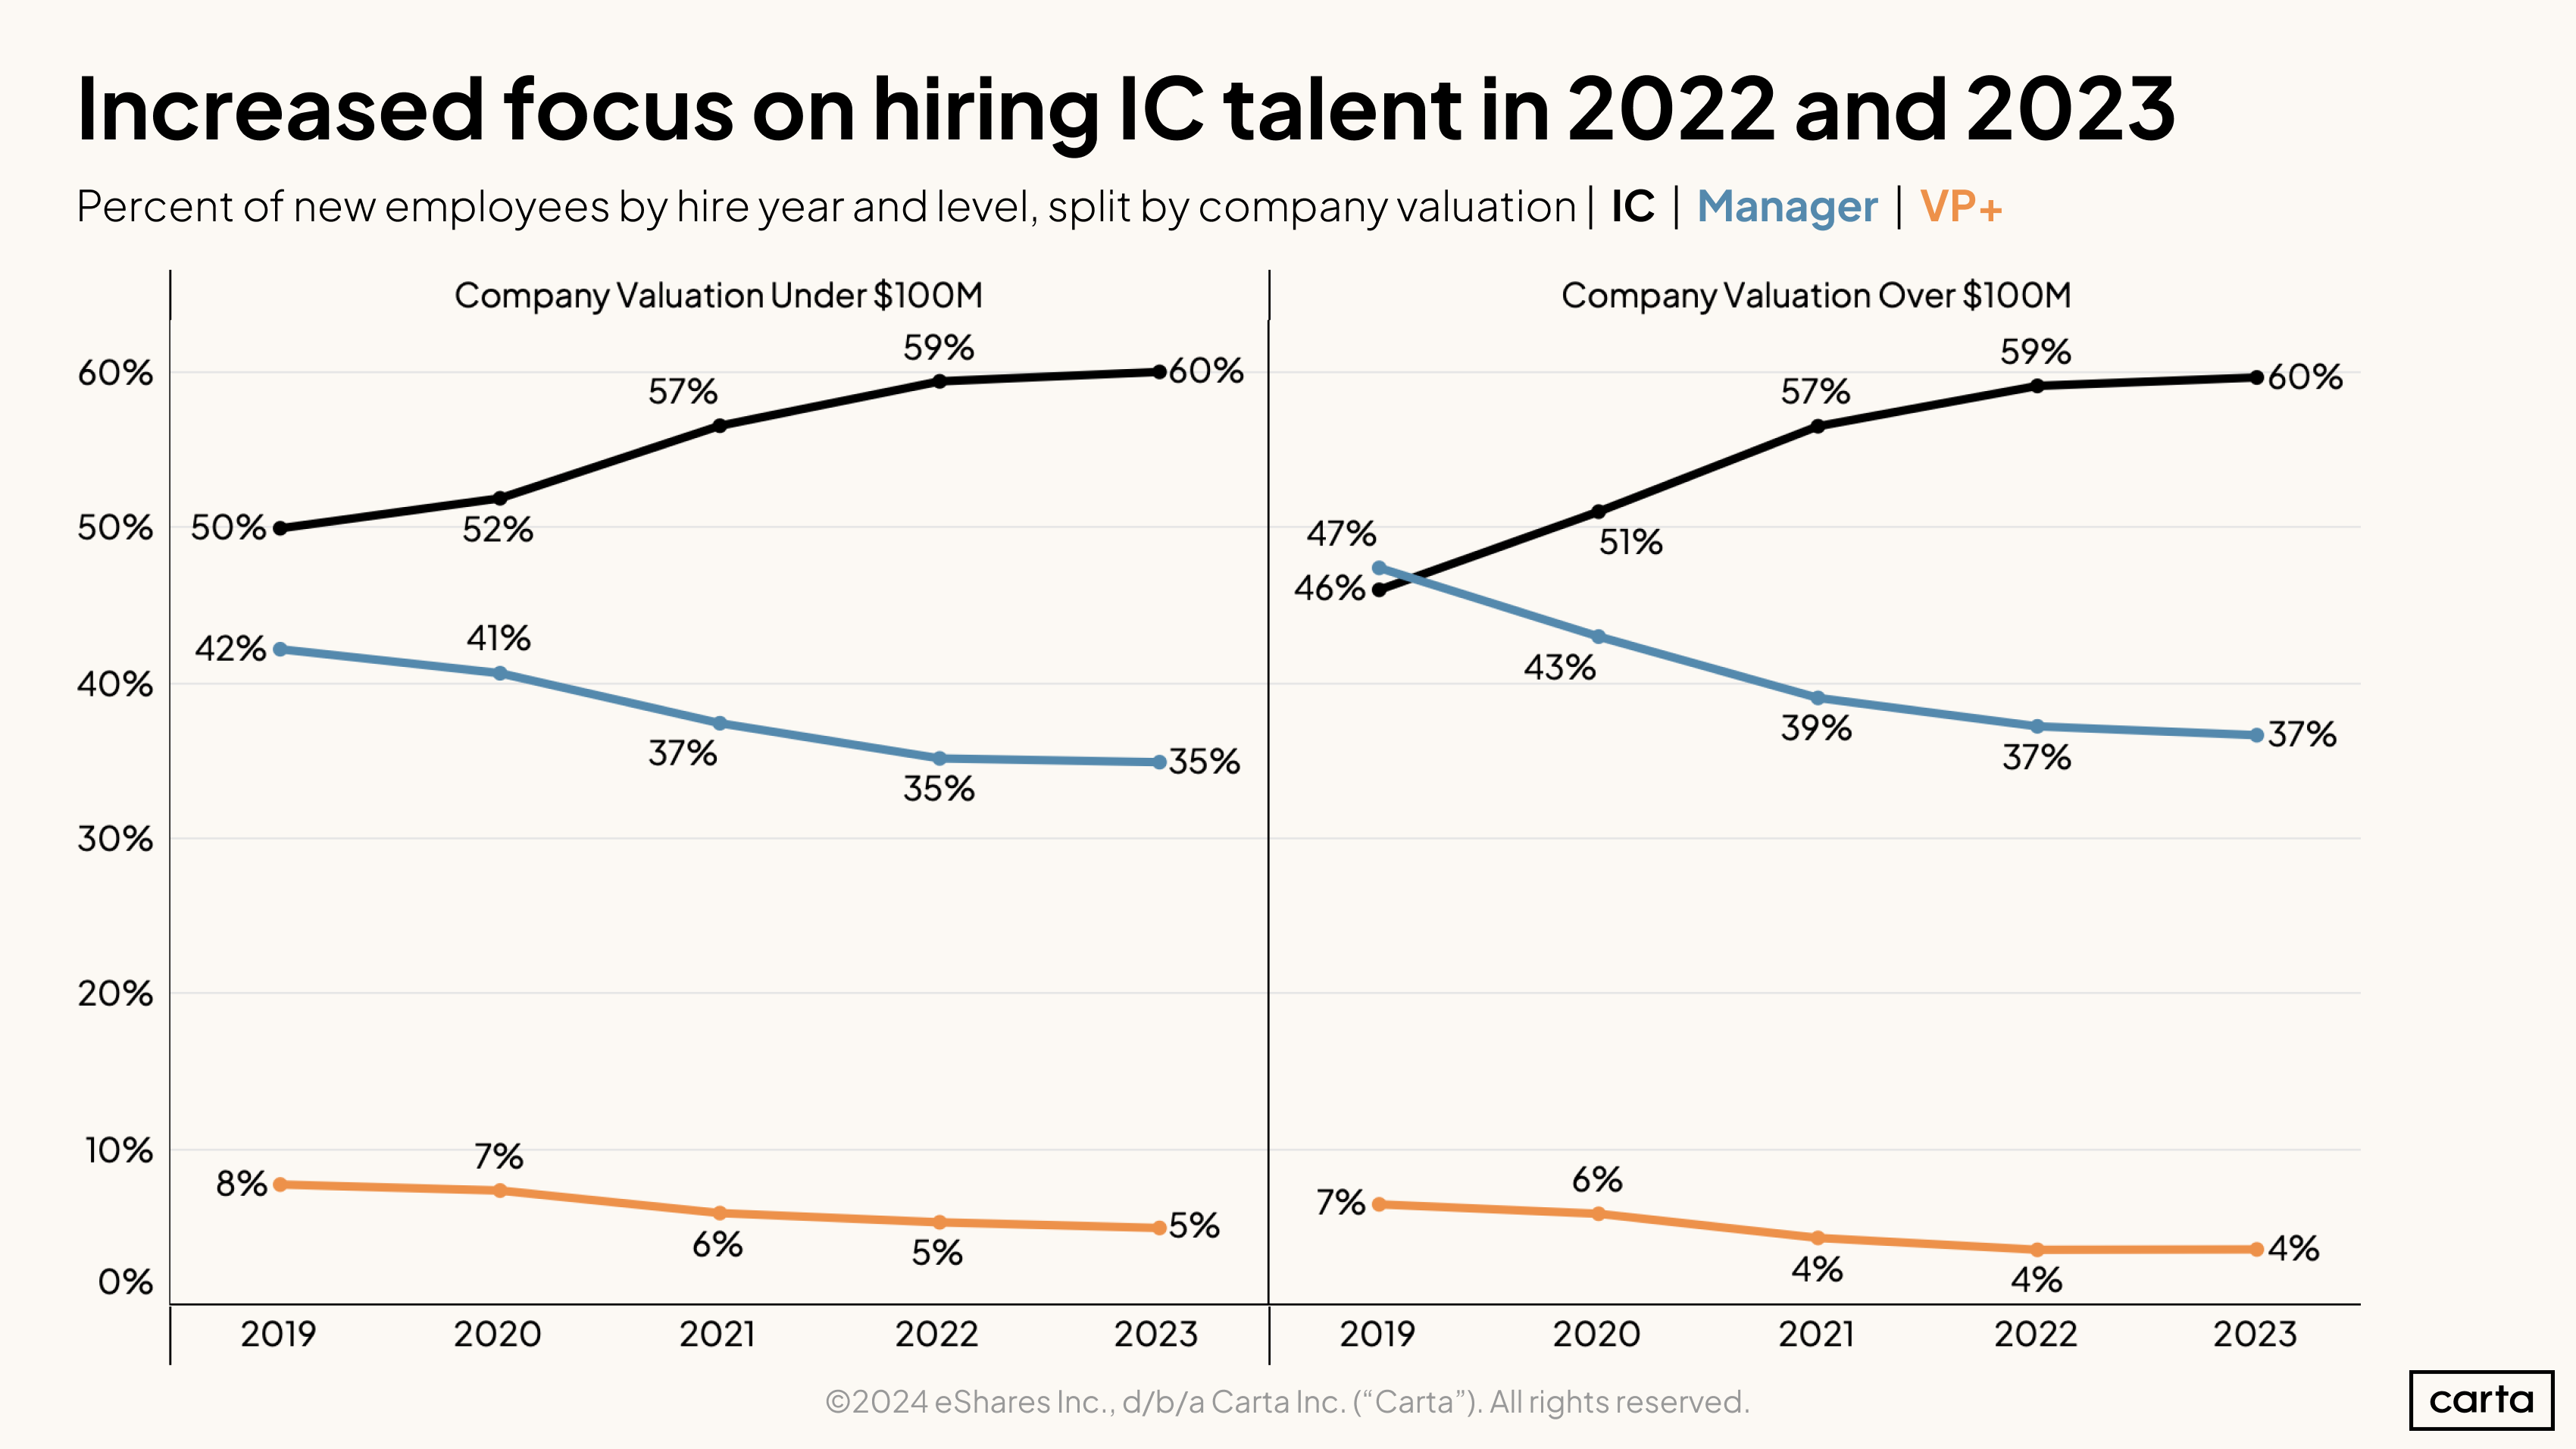
Over the past five years, companies of all sizes on Carta have displayed a new emphasis on hiring individual contributors. Among companies valued at less than $100 million, the rate of hires who are ICs increased from 50% in 2019 to 60% in 2023. Among companies valued at more than $100 million, the rate has increased from 46% to 60% over that span.
More and more, startups are prioritizing IC hires over increasing the size of their management teams. At companies worth more than $100 million, for instance, about 54% of all new hires in 2019 were at the manager level or above; last year, just 41% of hires fit that description.
Salary trends
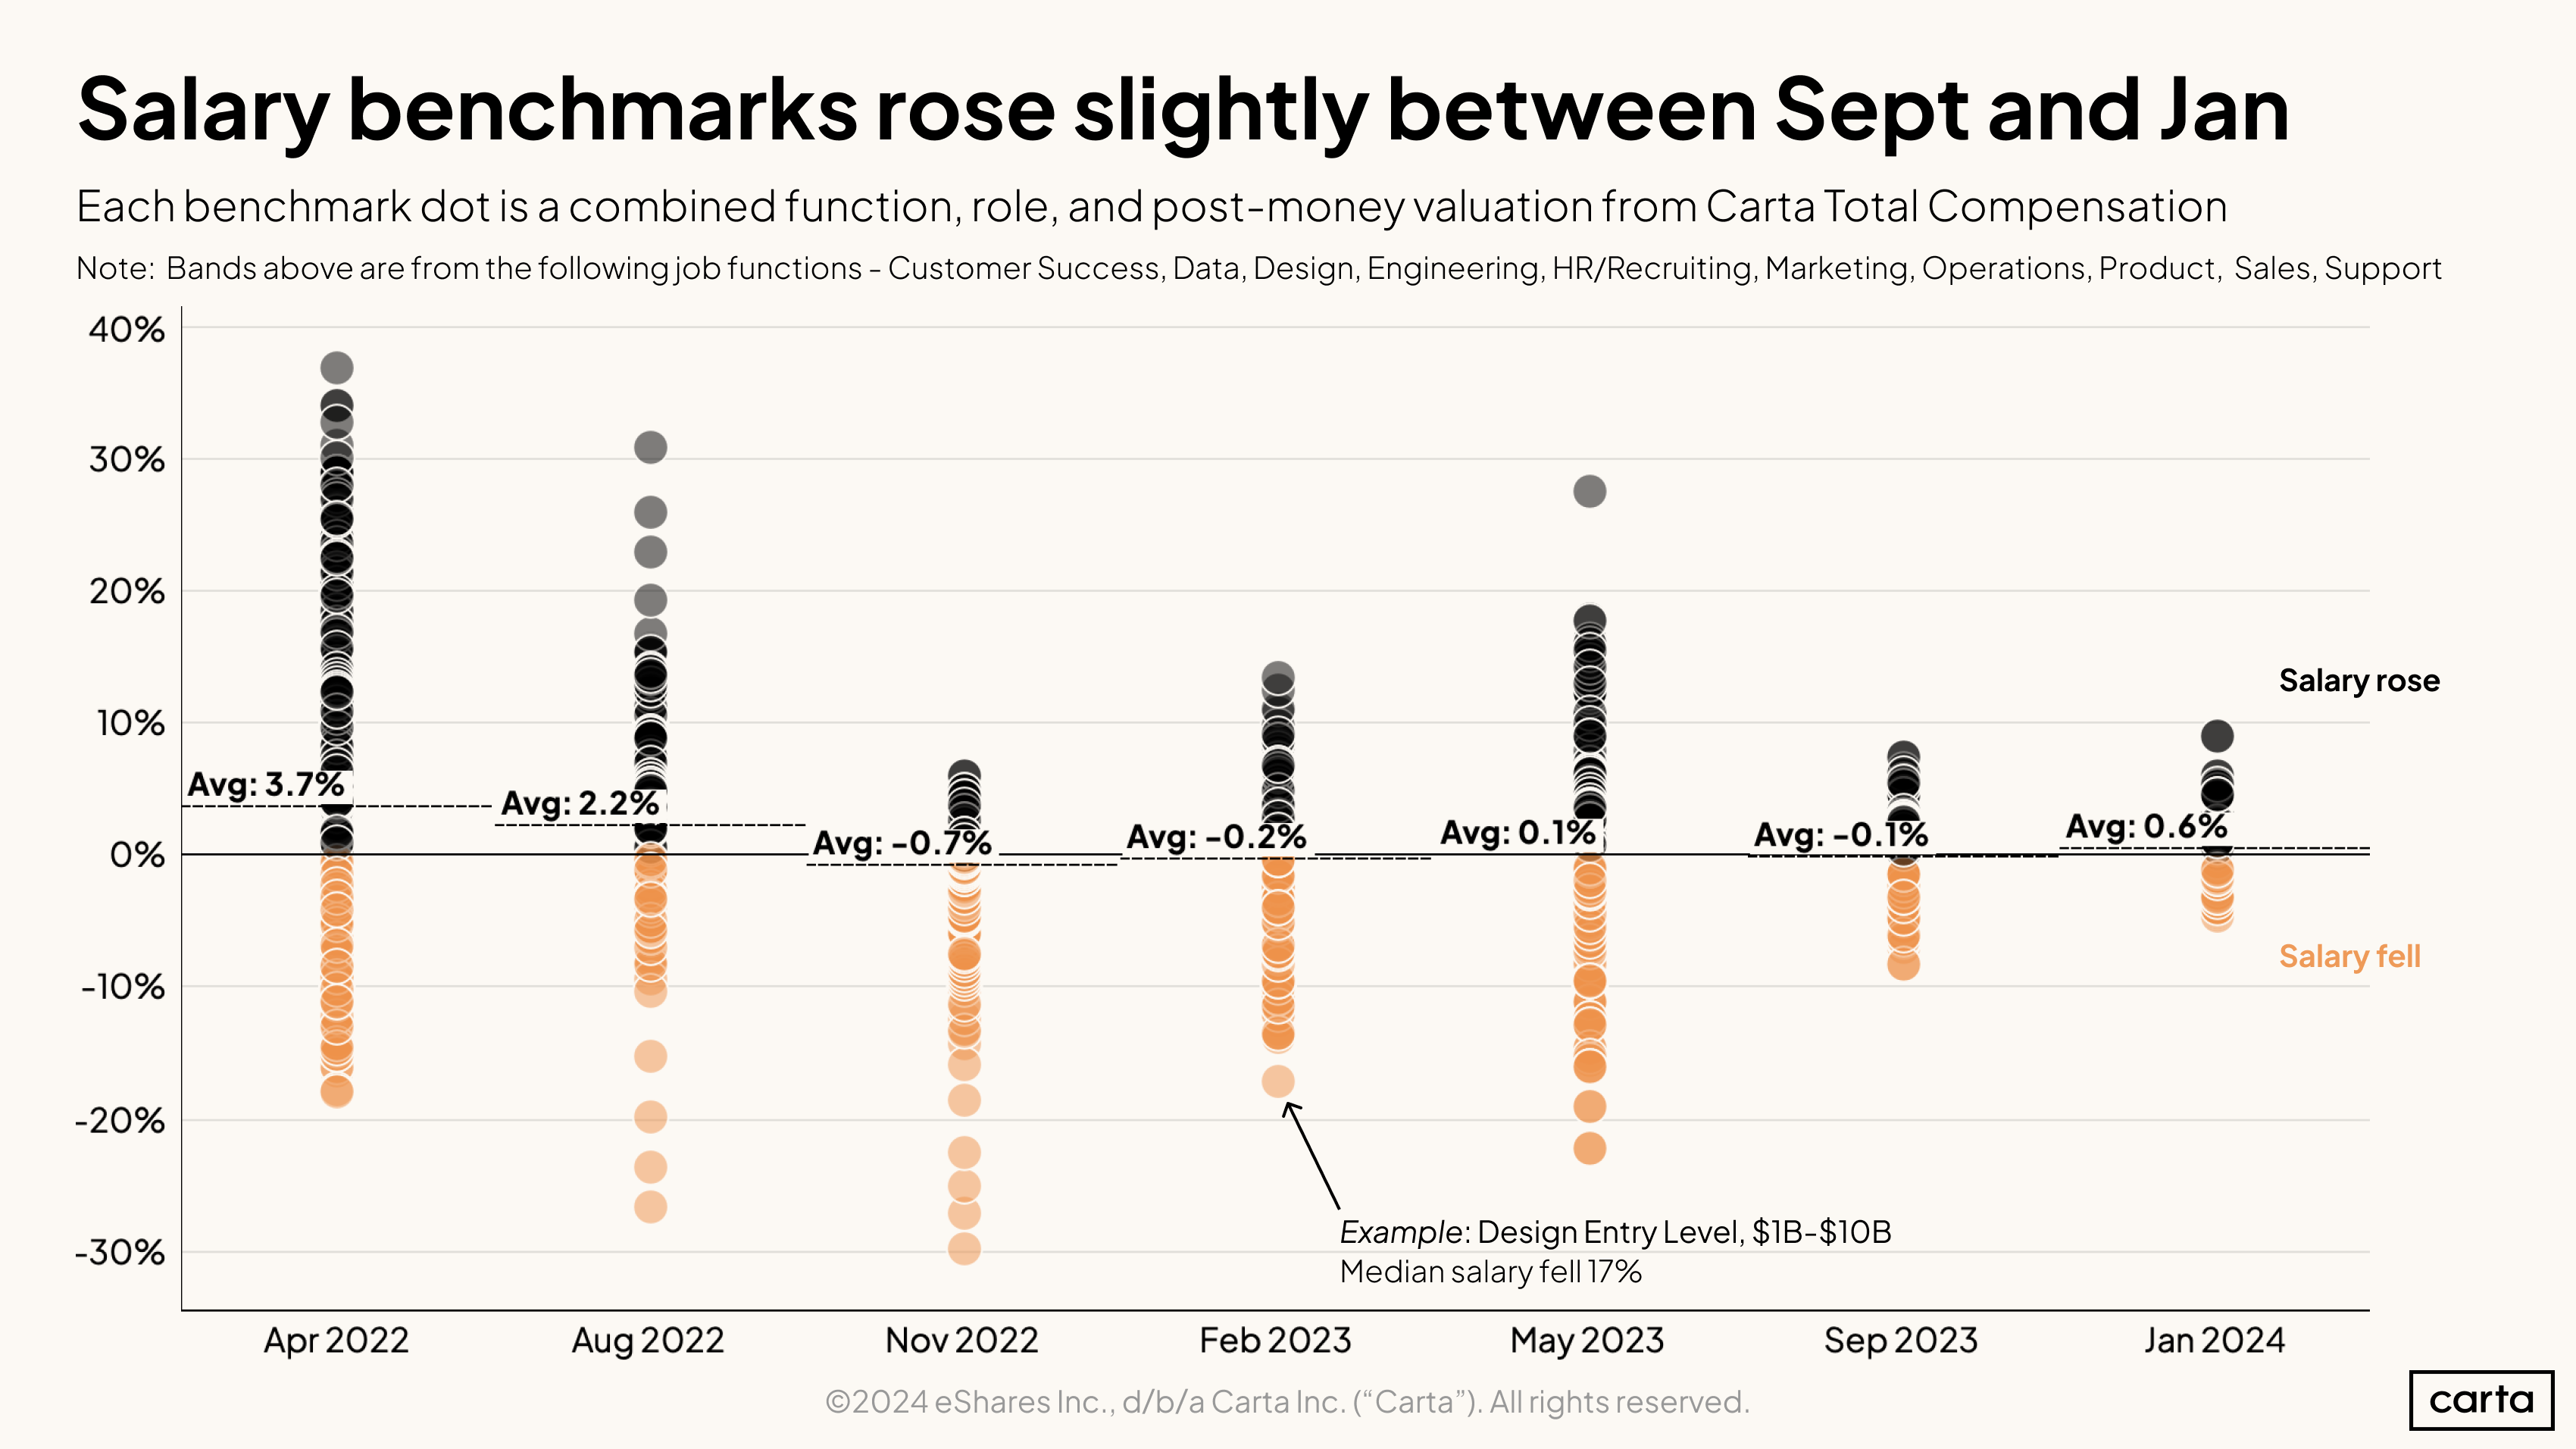
The average salary benchmark across a range of job functions ticked up by 0.6% in January 2024 compared to September 2023. Overall, there was relatively little movement in salary benchmarks over the course of 2023. However, there were some significant shifts in the broader datasets. The change in benchmarks for different job functions grew much more bunched up, with fewer outliers where salary benchmarks either rose or fell by more than 10%.
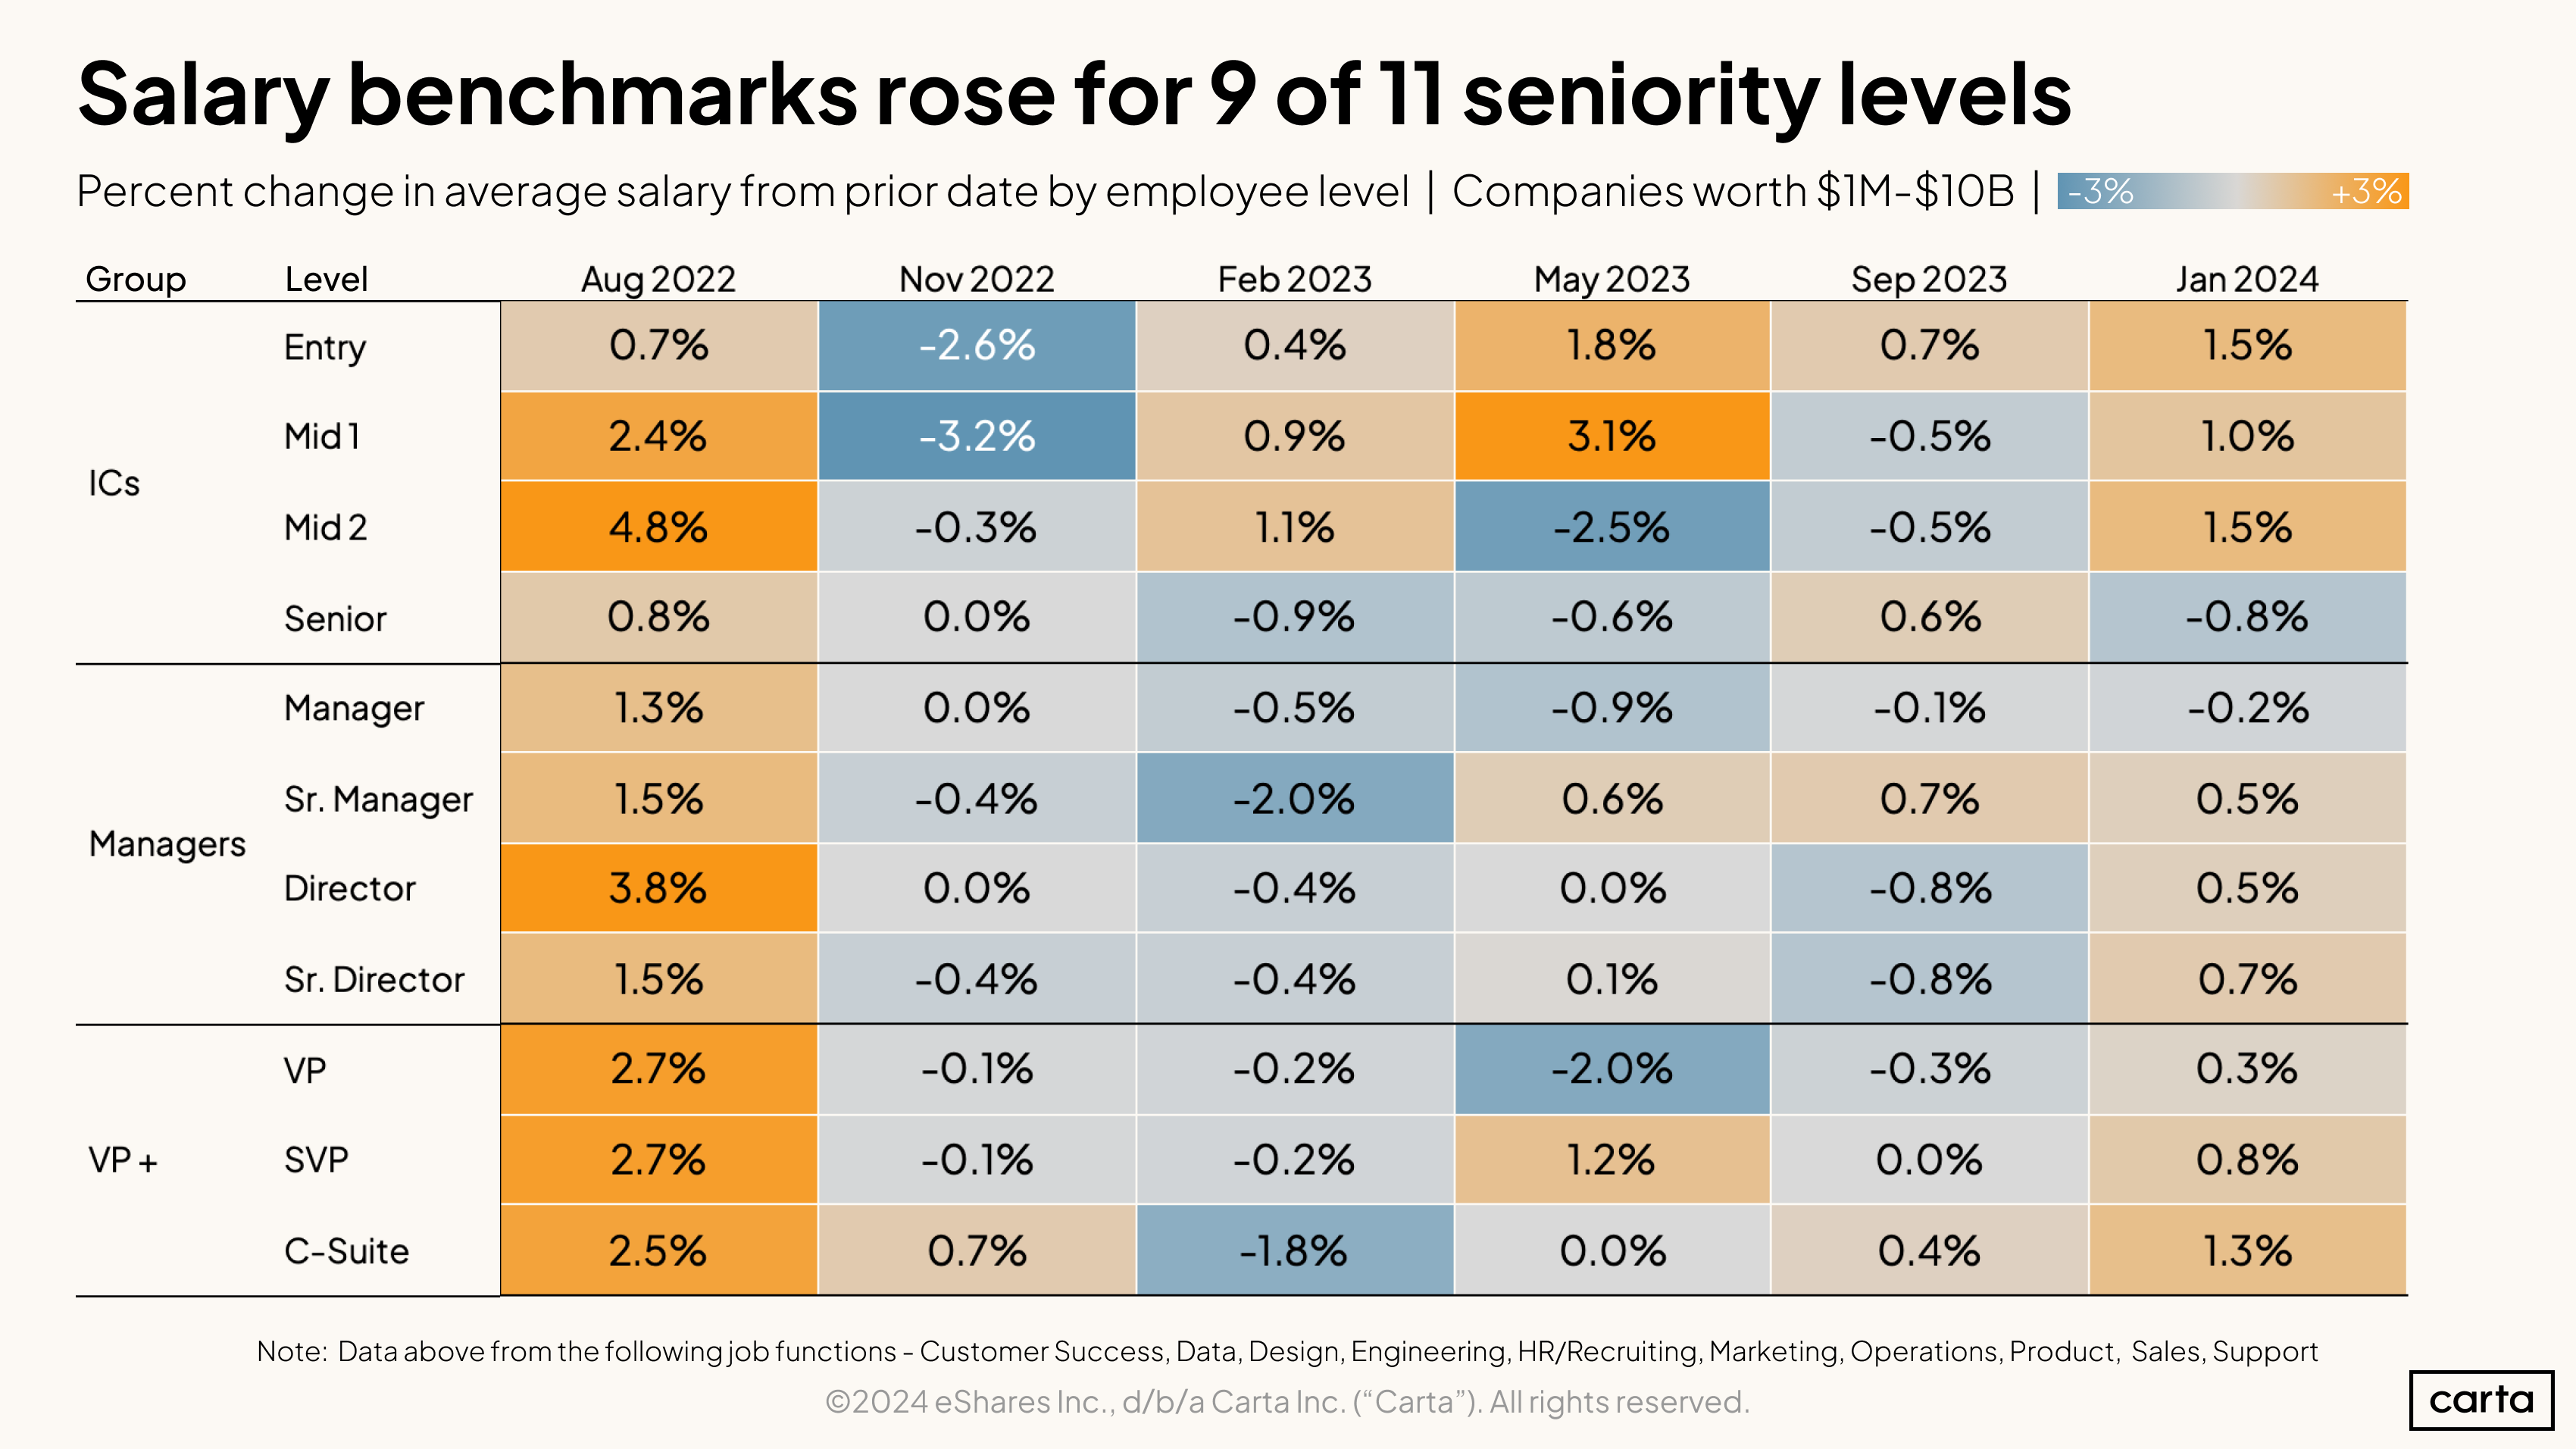
Across most job titles, salary benchmarks for new hires trended up in late 2023 and January 2024. The average salary benchmark increased at nine of 11 seniority levels compared to the previous four months. Individual contributors in roles that are at or near entry level saw some of the biggest salary benchmark gains in recent months. The only job levels where average salary benchmarks decreased in January 2024 compared to September 2023 were senior-level individual contributors and managers.
There are only three job levels where salary benchmarks have increased in each of the past two time periods shown on this chart: entry-level ICs, senior managers, and the C-suite.
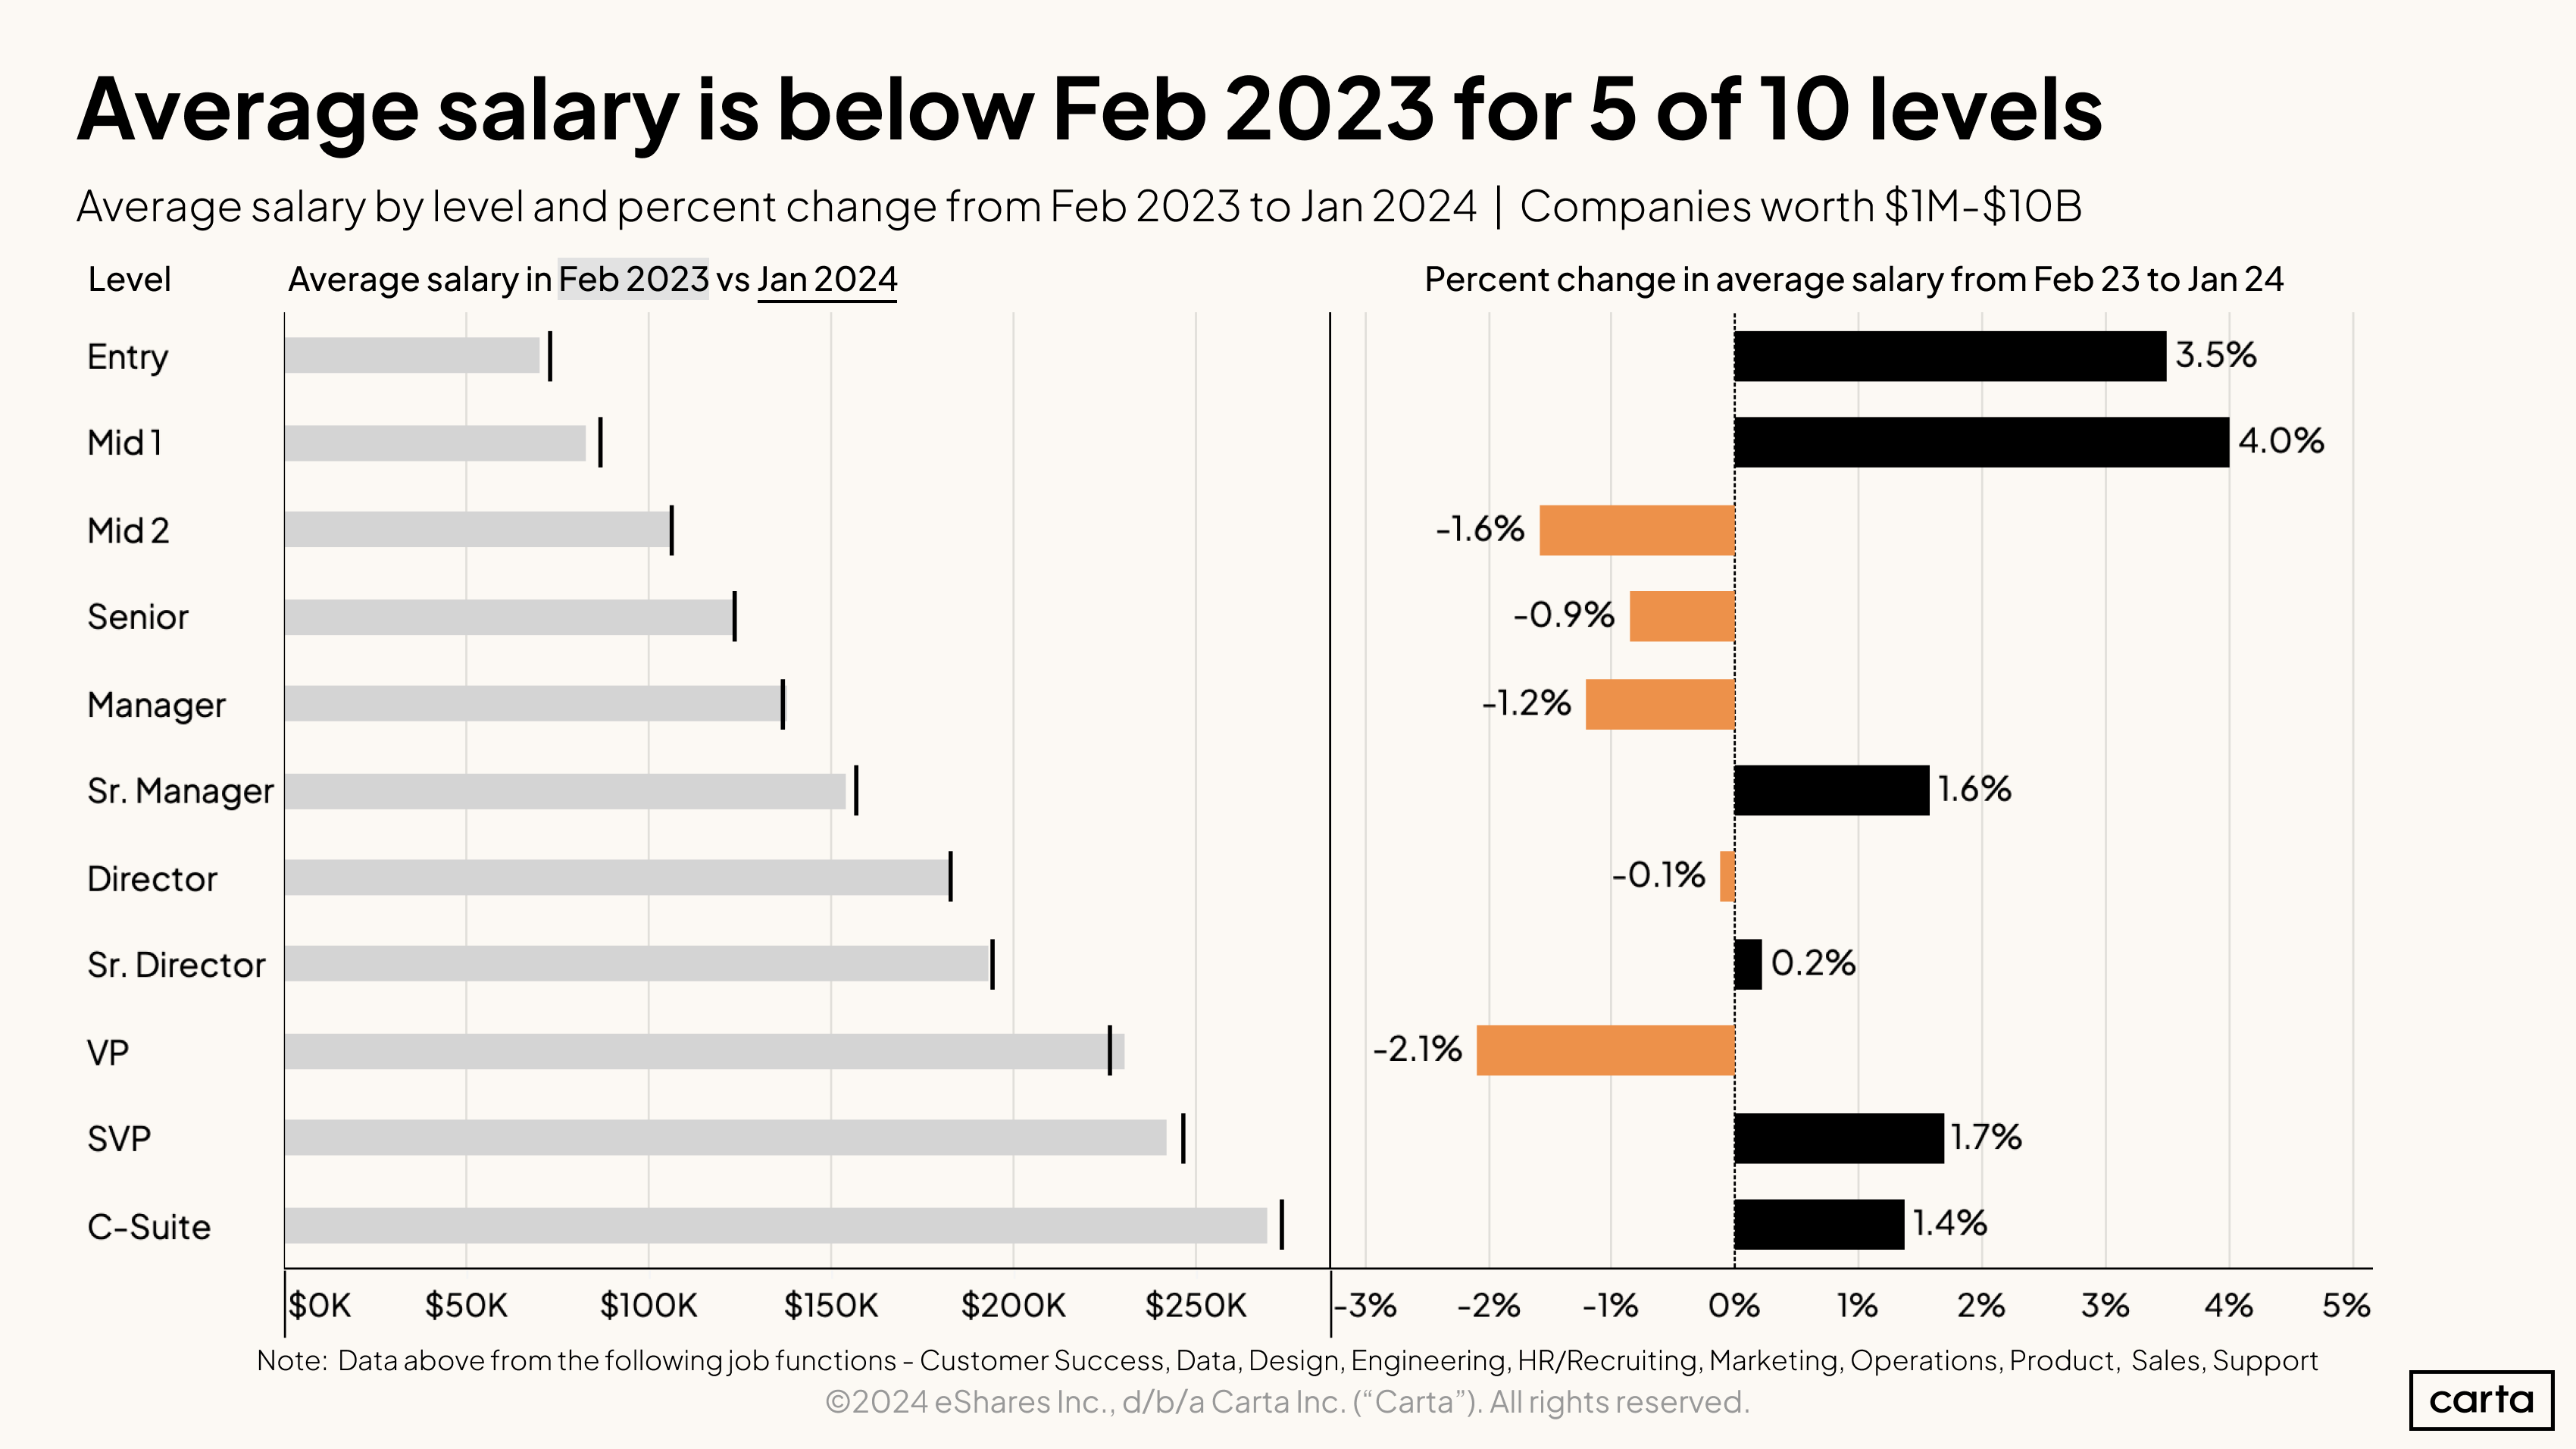
Compared to roughly a year ago, it’s the most inexperienced employees at startups that have seen the biggest salary gains. That includes a 3.5% increase in average salary for entry-level employees between February 2023 and January 2024. The most senior employees have also seen salaries trend up, including a 1.4% bump for those in the C-suite. The past year has been less financially friendly to senior individual contributors, managers, directors, and VPs, all of whom saw average salaries decline between February 2023 and January 2024.
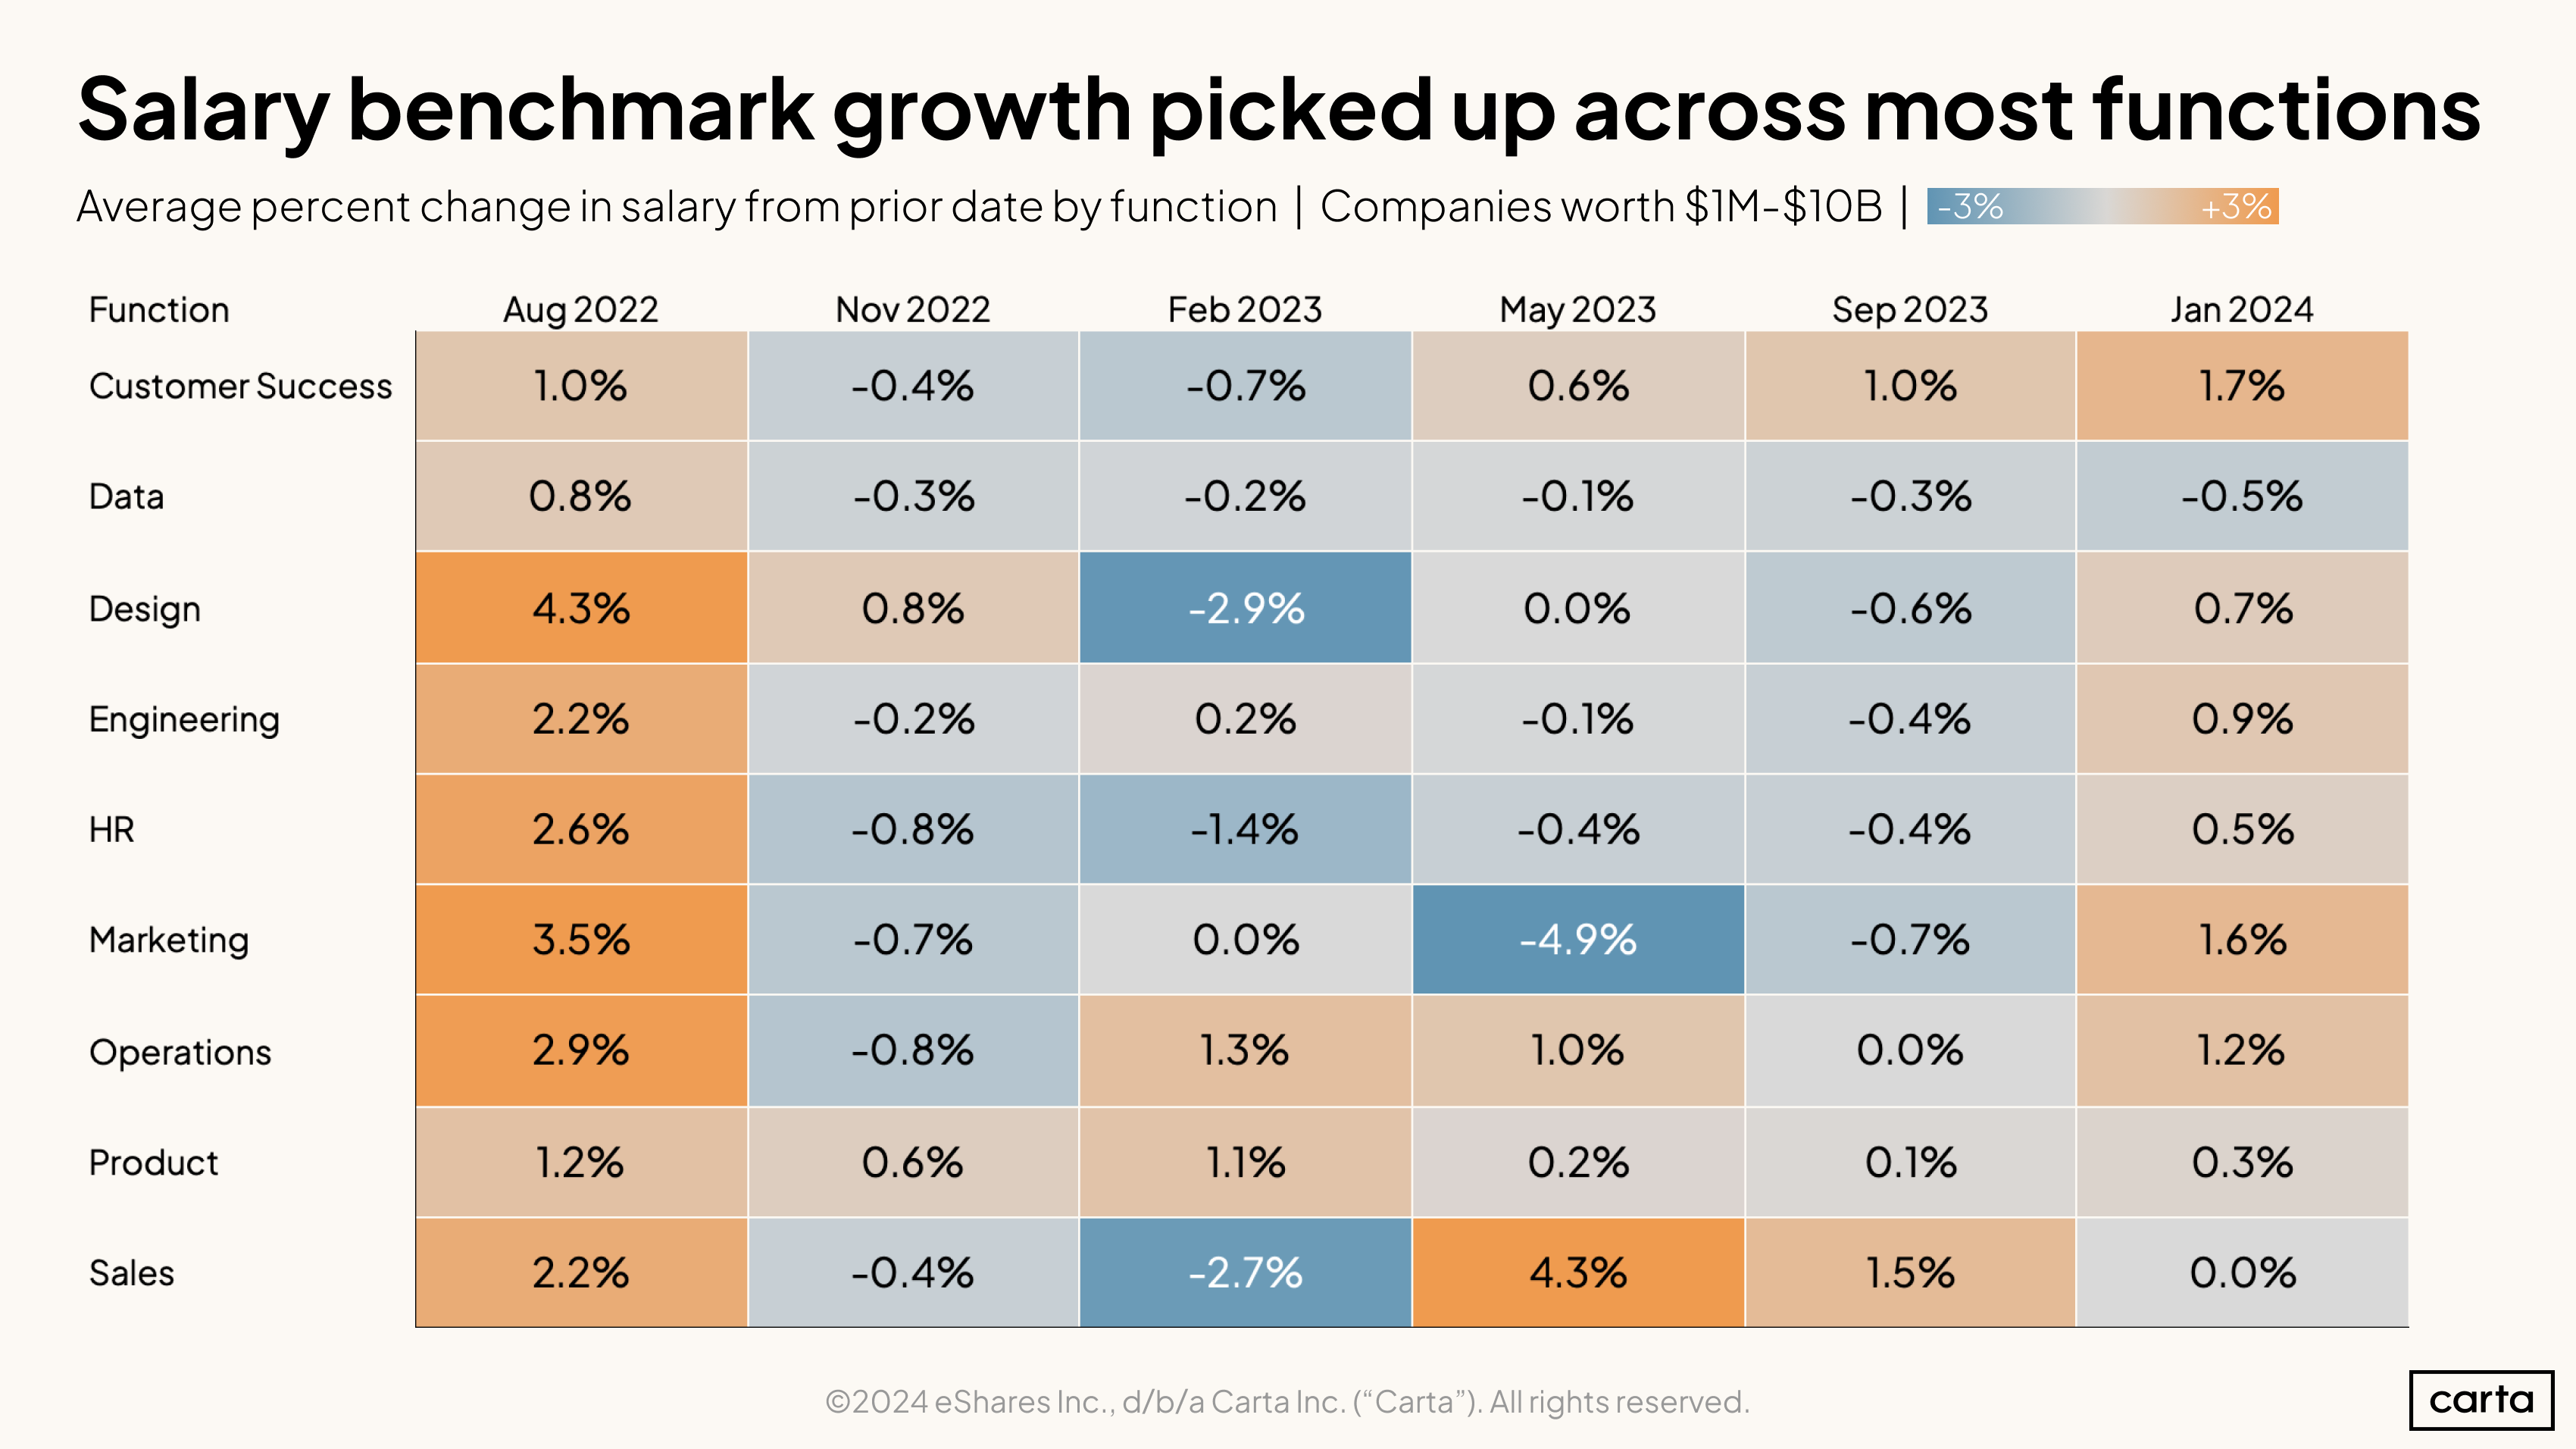
Average salary benchmarks increased during the end of 2023 and early 2024 for employees in nearly every job function, with customer success and marketing seeing the biggest gains. Data was the only job function where the average salary benchmark fell, continuing a negative trend: Salary benchmarks have declined in data for the past five intervals displayed in this chart.
Salary benchmarks grew more in customer success than any other job function between May 2023 and January 2024. Product is the only function where the average salary benchmark has increased in all six of the time periods displayed above.
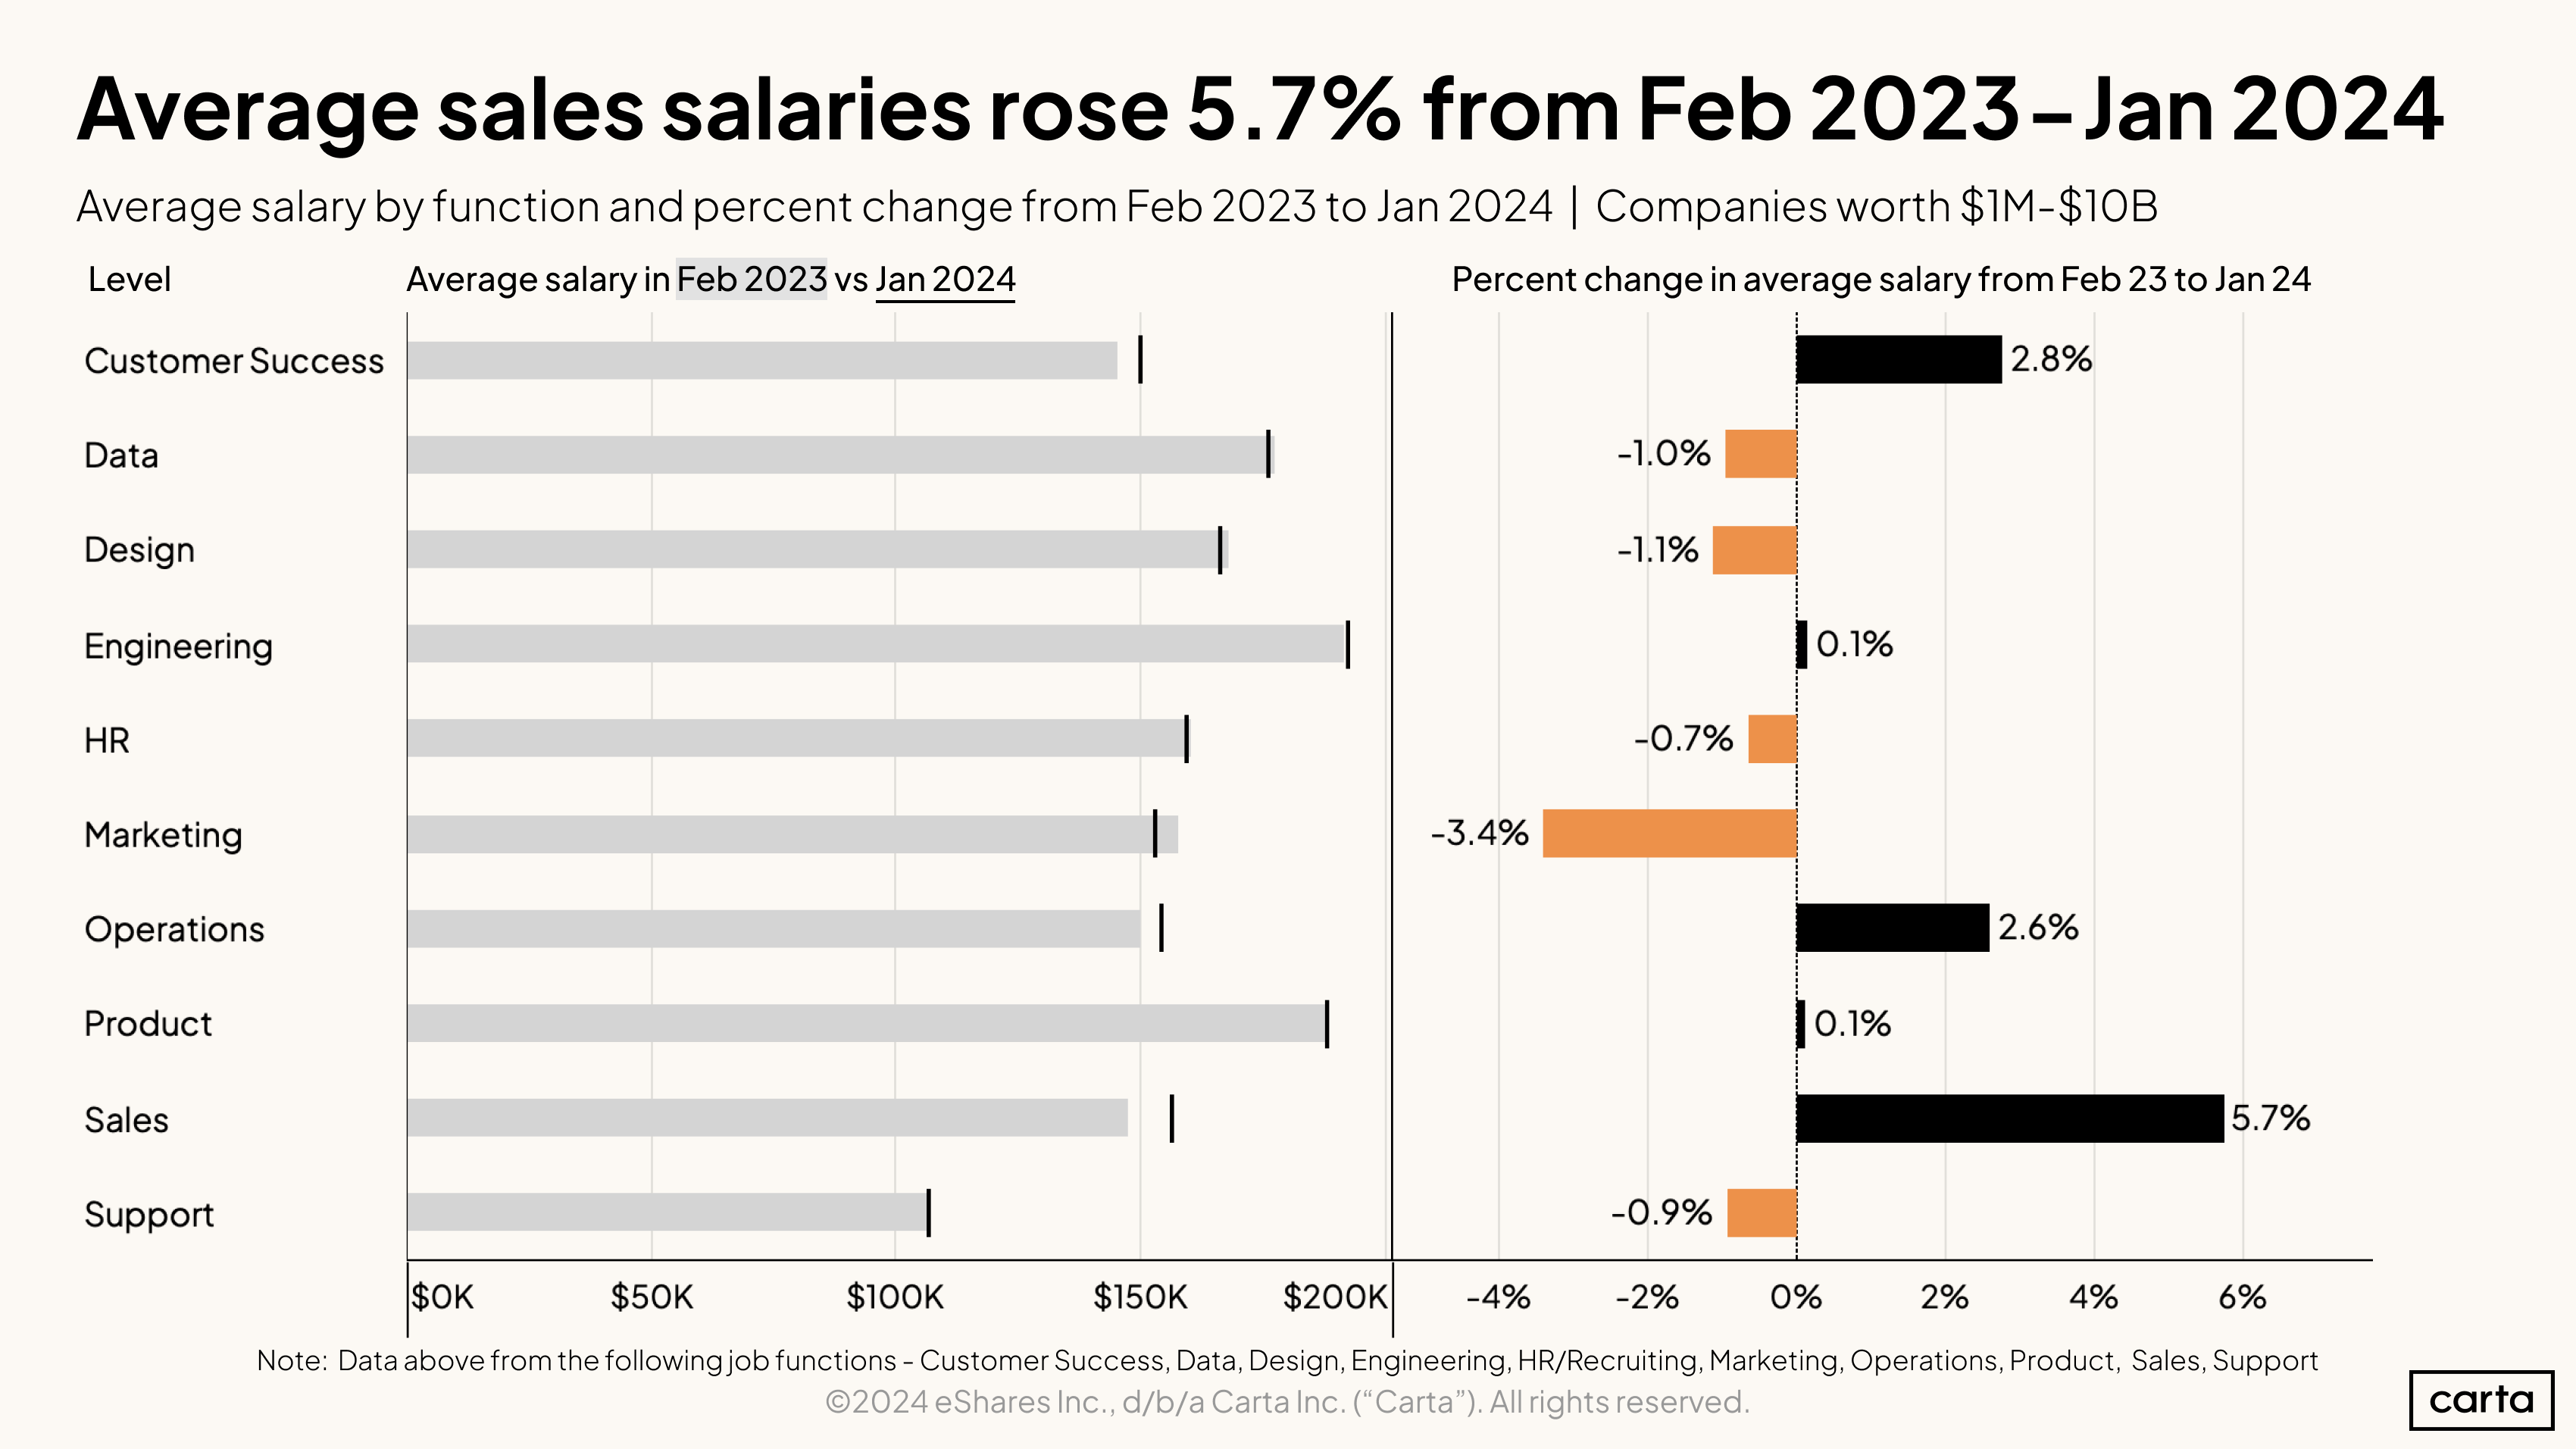
Employees in sales have seen more salary growth than any other job function over the past year, with a 5.7% increase between February 2023 and January 2024. Customer success (2.8%) and operations (2.6%) are the two other functions that have experienced significant salary growth over that span.
For five of these 10 job functions, the average salary has either increased or decreased by 1% or less over the past year. The only functions that have seen larger decreases are design (-1.1%) and marketing (-3.4%).
Equity trends
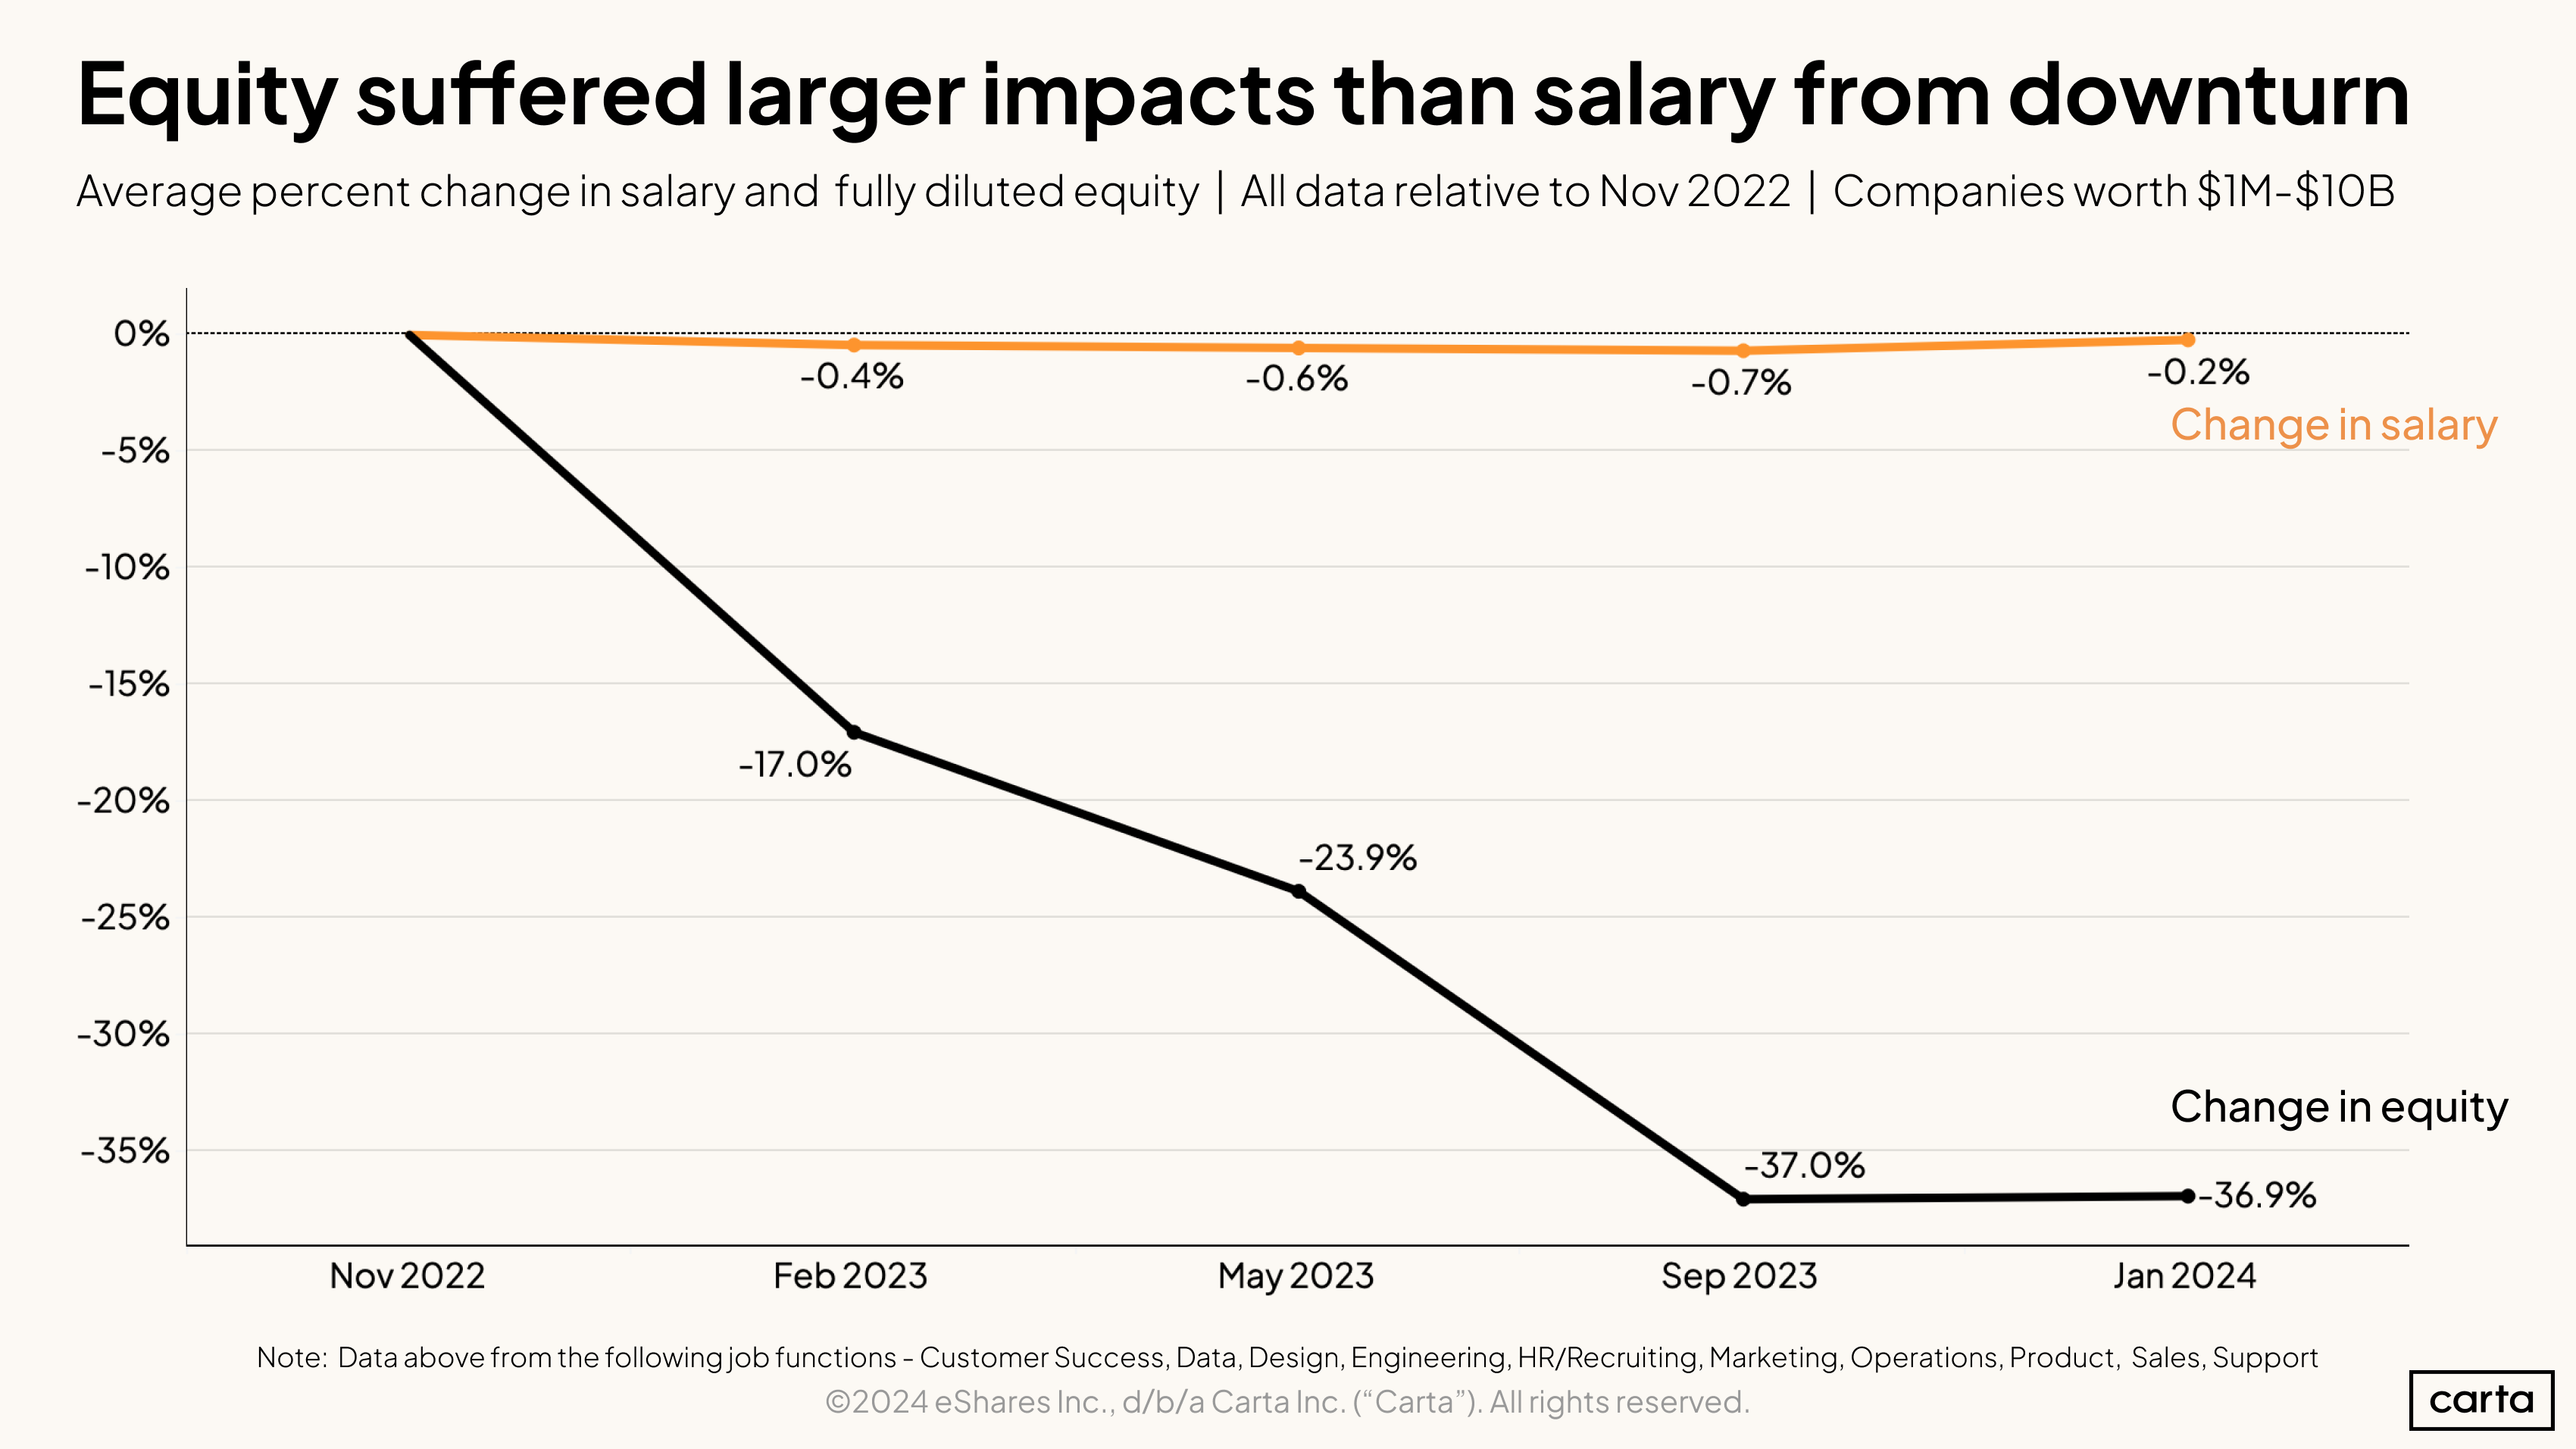
Average salaries for startup employees have barely budged during the downturn that has defined the venture capital market over the past year and a half. But there’s been a significant change in how companies are thinking about the other main ingredient of startup compensation. As measured by the fully diluted percentage of a company’s total equity that an employee receives, the average equity benchmark for new hires is down 36.9% from November 2022. In other words, the average slice of a company’s overall equity pie that new employees receive has shrunk by more than a third.
While the average value of equity packages was declining steadily every few months throughout much of 2023, the market has recently looked more steady. Average equity benchmarks as of January 2024 actually inched up from where they were in September 2023.
A note on the equity metric here—because this is based on the percentage of total equity, it is not affected by the broad decline in startup valuations that has taken place over the past year and a half. Take that new valuation climate into account, and the picture is even less appealing for startup employees. In addition to receiving smaller slices of the equity pie, in many cases, each slice has grown less valuable.
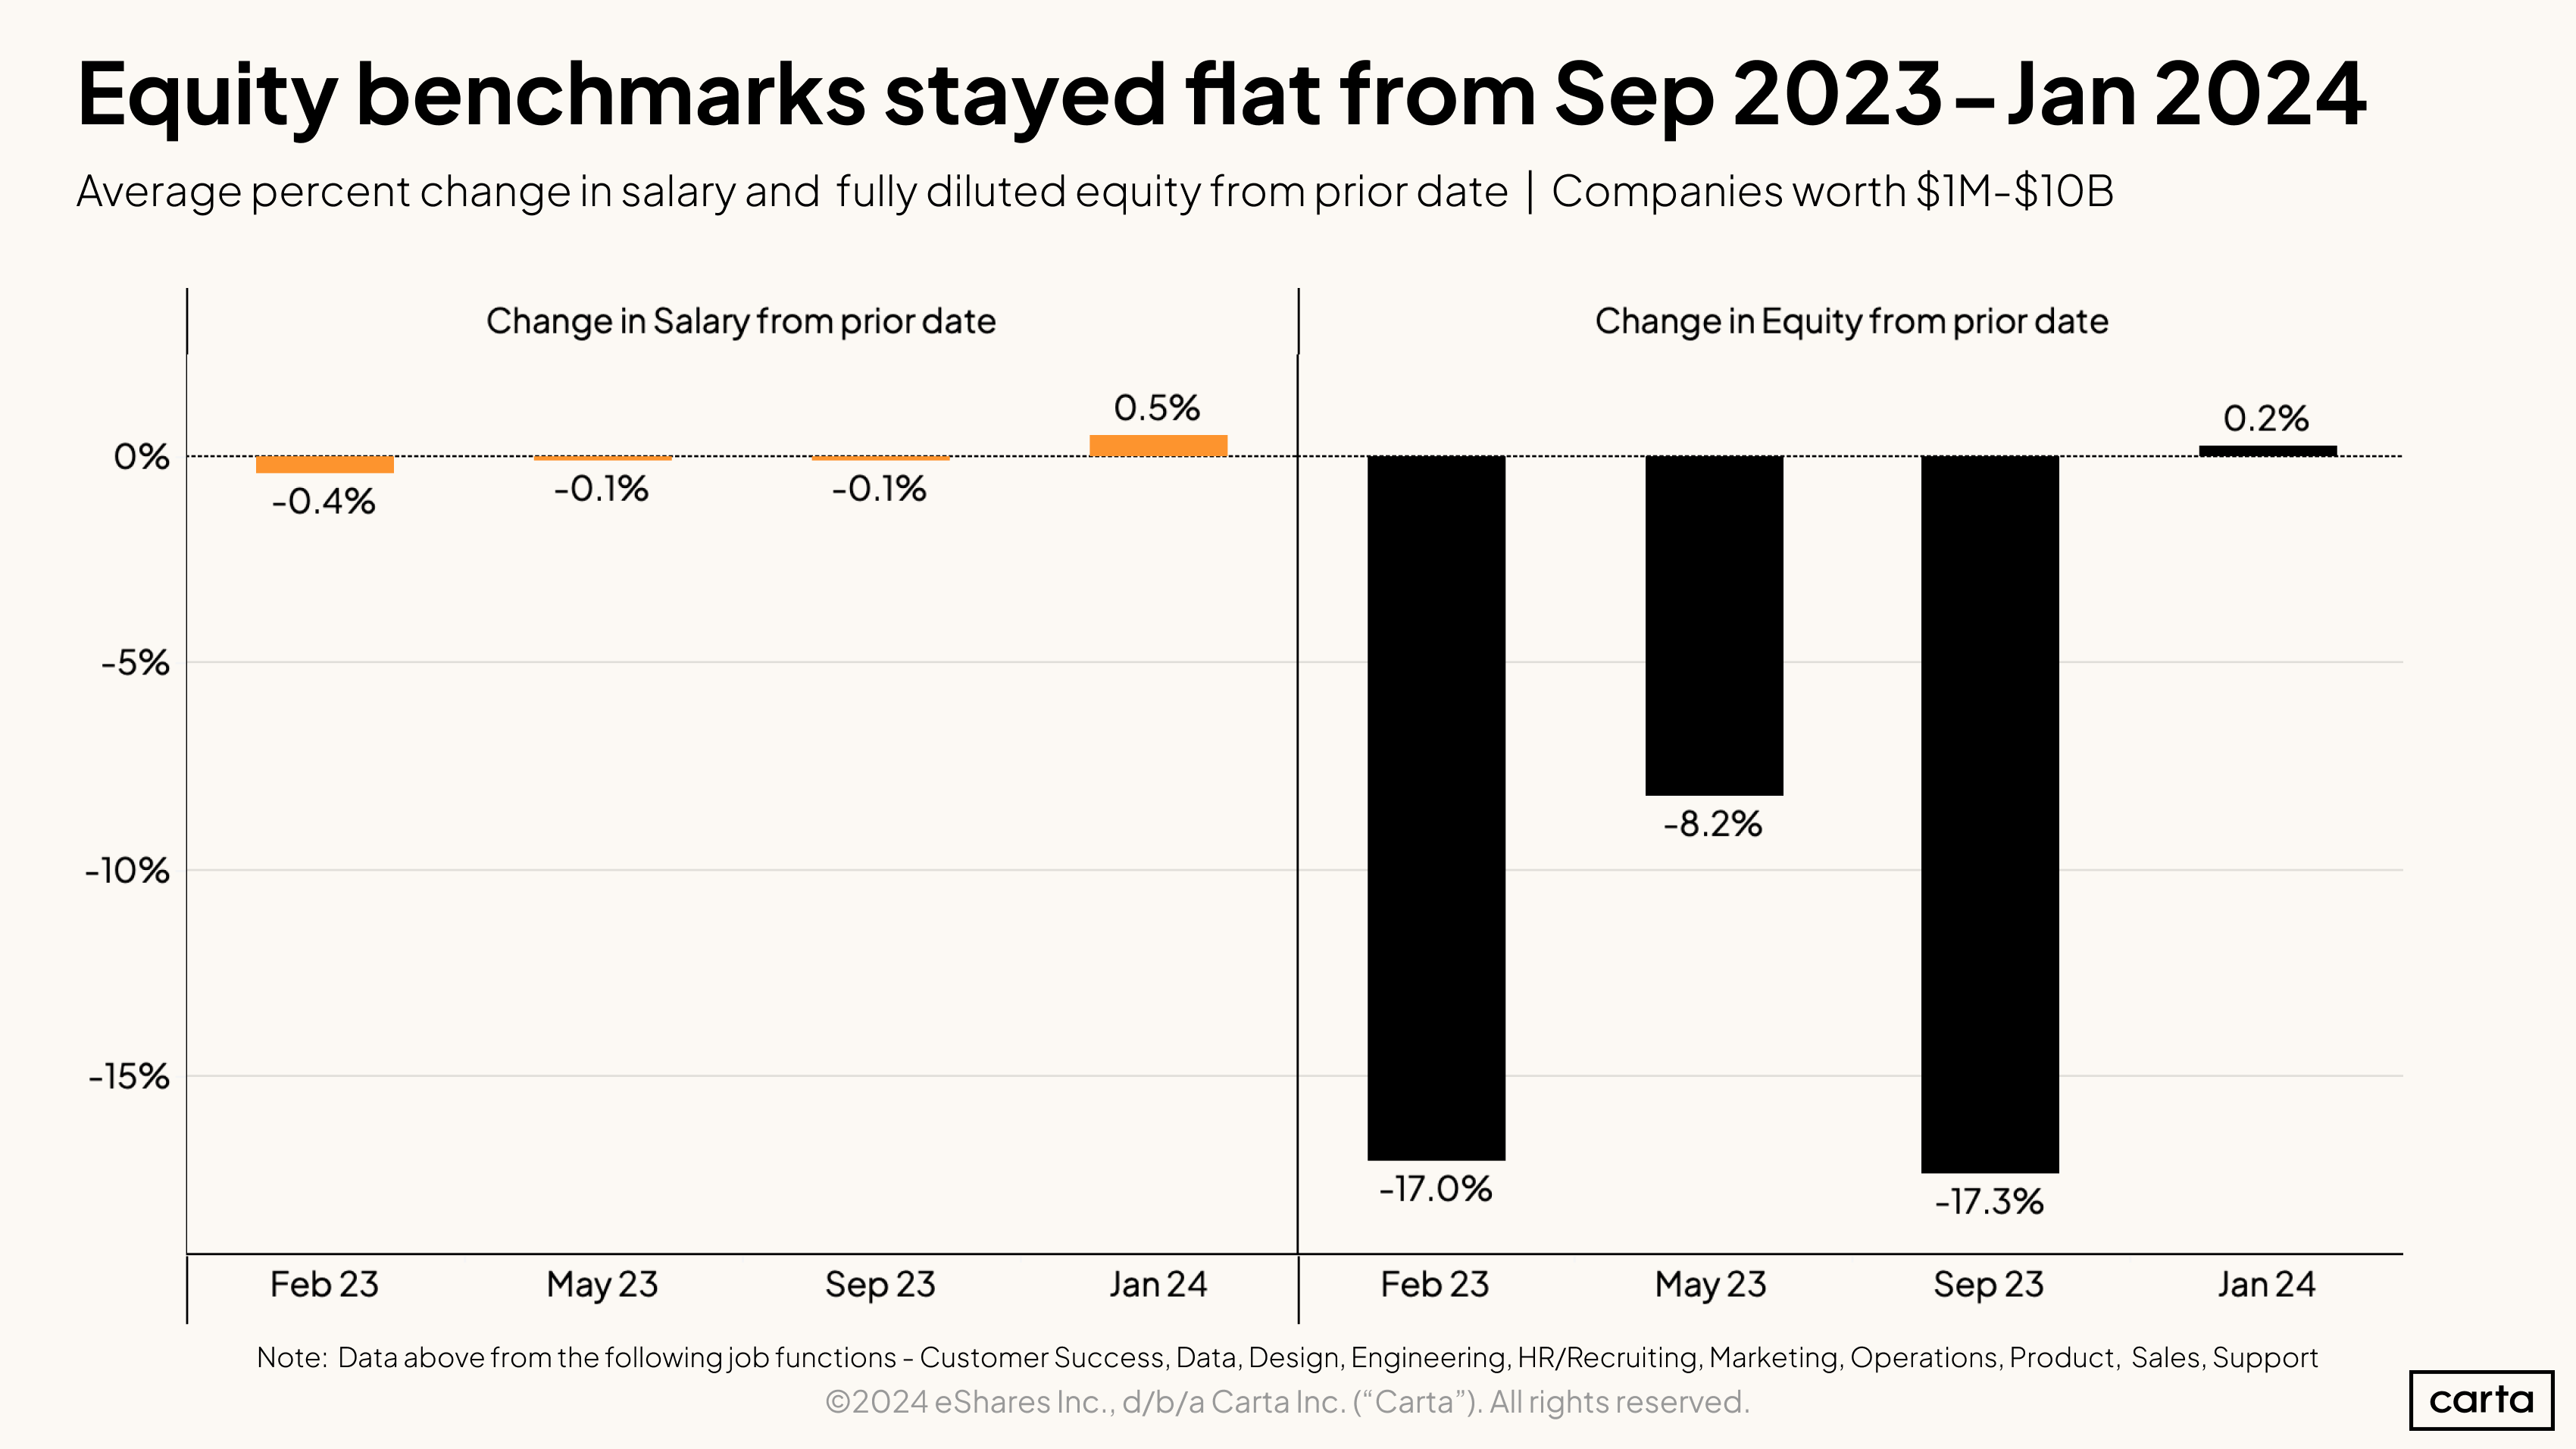
Average salary benchmarks and average equity benchmarks both increased by less than 1% in the period between September 2023 and January 2024. But those slight increases came in two very different statistical contexts. For salary benchmarks, it continued a stretch of stability that’s now continued for more than a year. For equity benchmarks, on the other hand, it was an abrupt change after average equity compensation had been declining significantly throughout much of 2023.
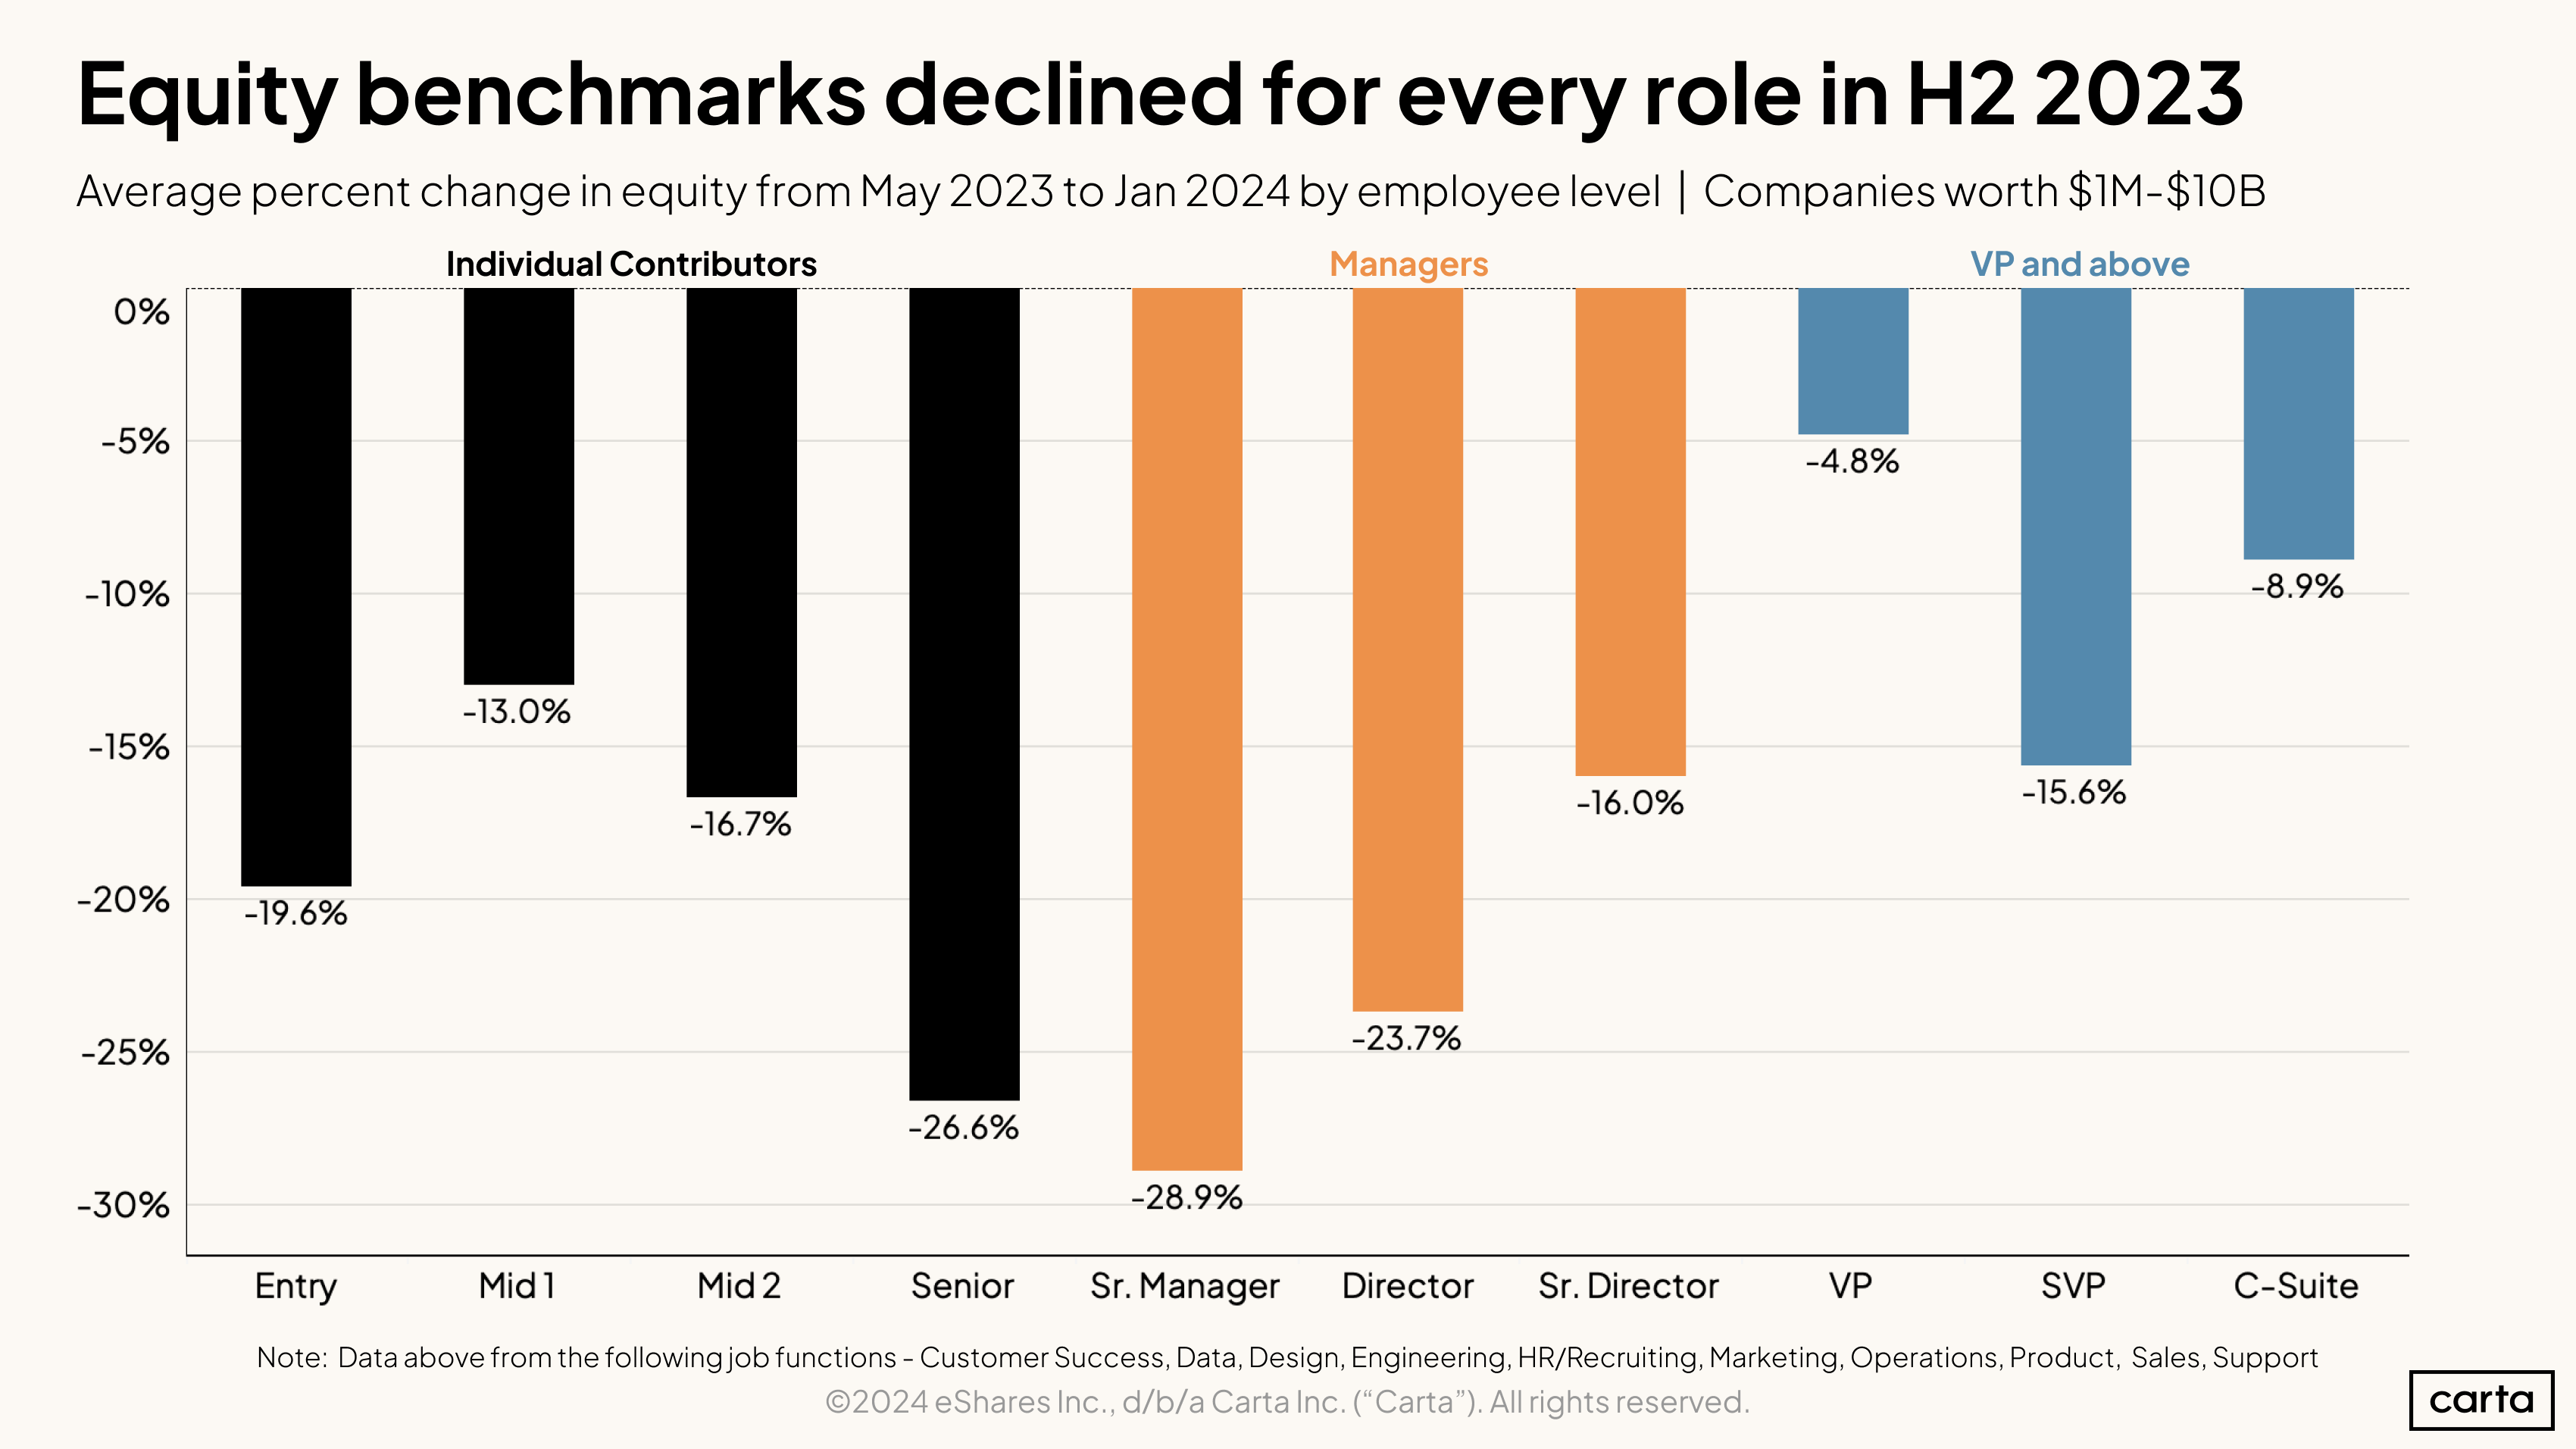
The recent decline in equity benchmarks has affected employees at every job level—although to varying degrees. Senior individual contributors and senior managers have been among the hardest hit, with the average size of equity benchmarks declining by more than 25% between May 2023 and January 2024. Most job levels for ICs and managers have seen equity benchmarks decline by at least 15% over that span. The shift in the market has been less pronounced at the VP level and above. The smallest change has been at the VP level, where average equity benchmarks fell by less than 5% between May and January
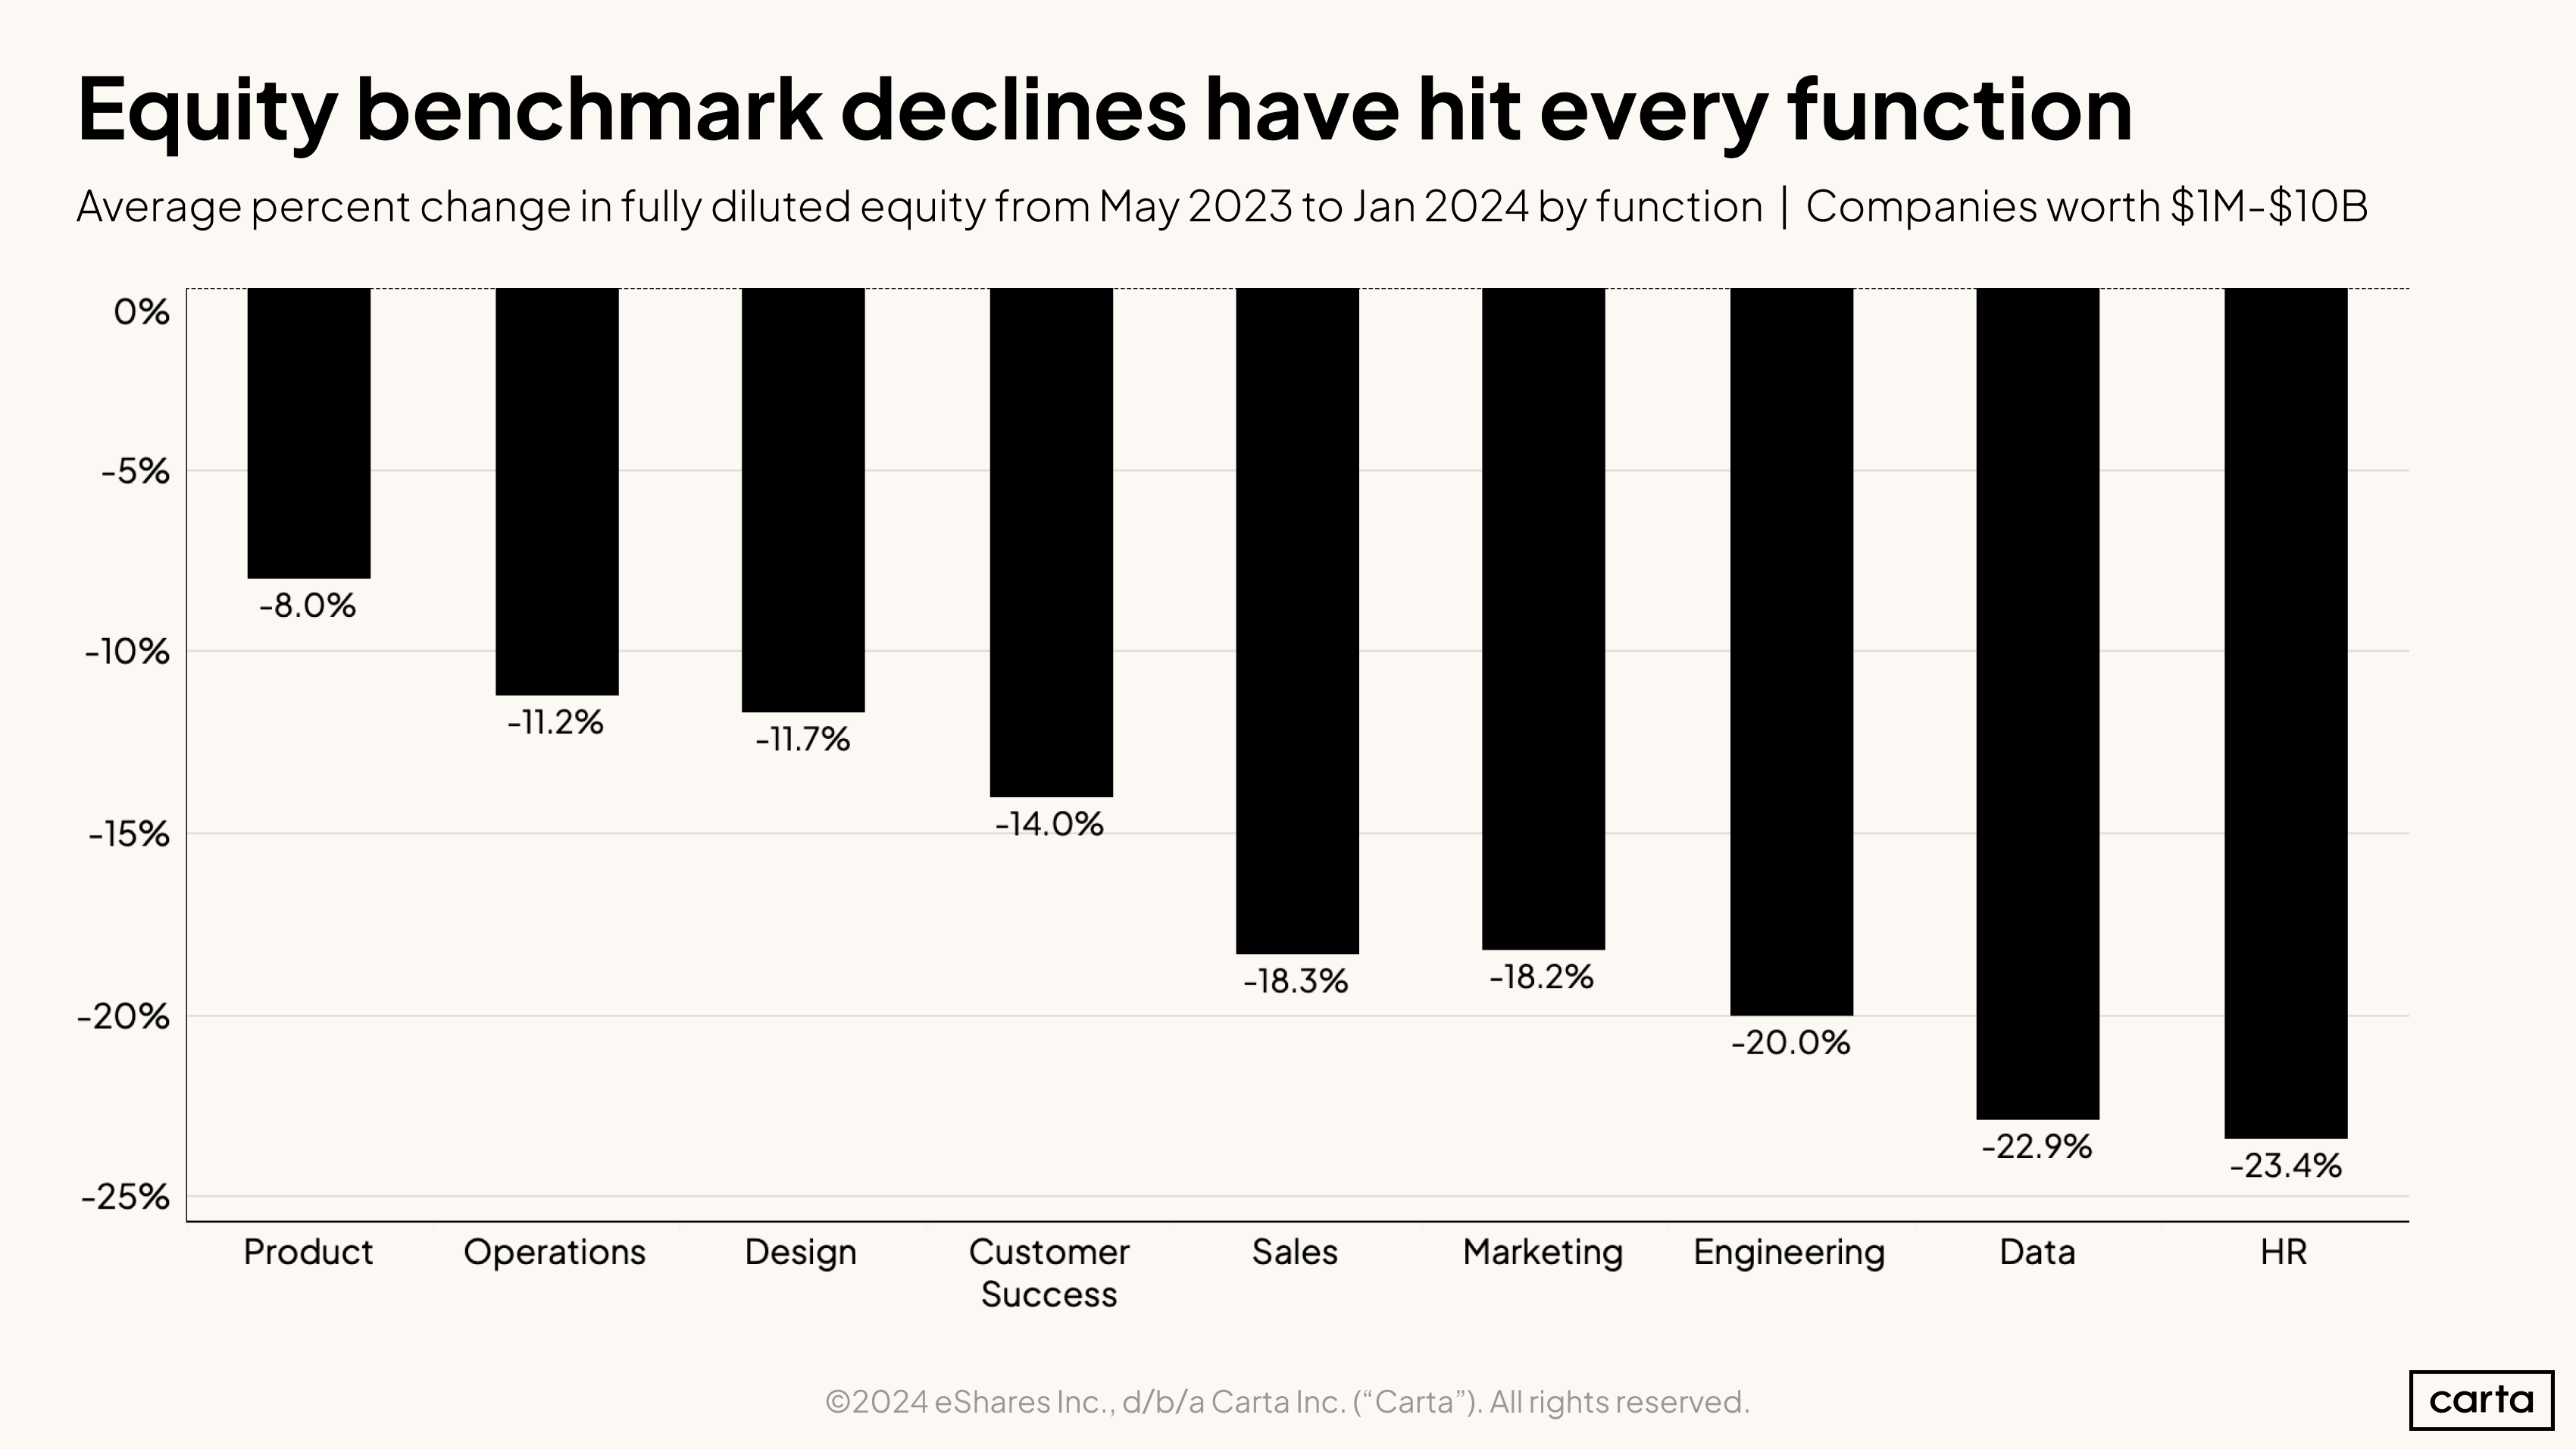
No job function was immune to the widespread decline in average equity benchmarks for new hires that took place in 2023.
Workers in HR and data saw the biggest losses, with the average benchmark for fully diluted equity grants in those functions falling by about 23% between May 2023 and January 2024. The product function was most resilient, with a drop of 8% over that same span.
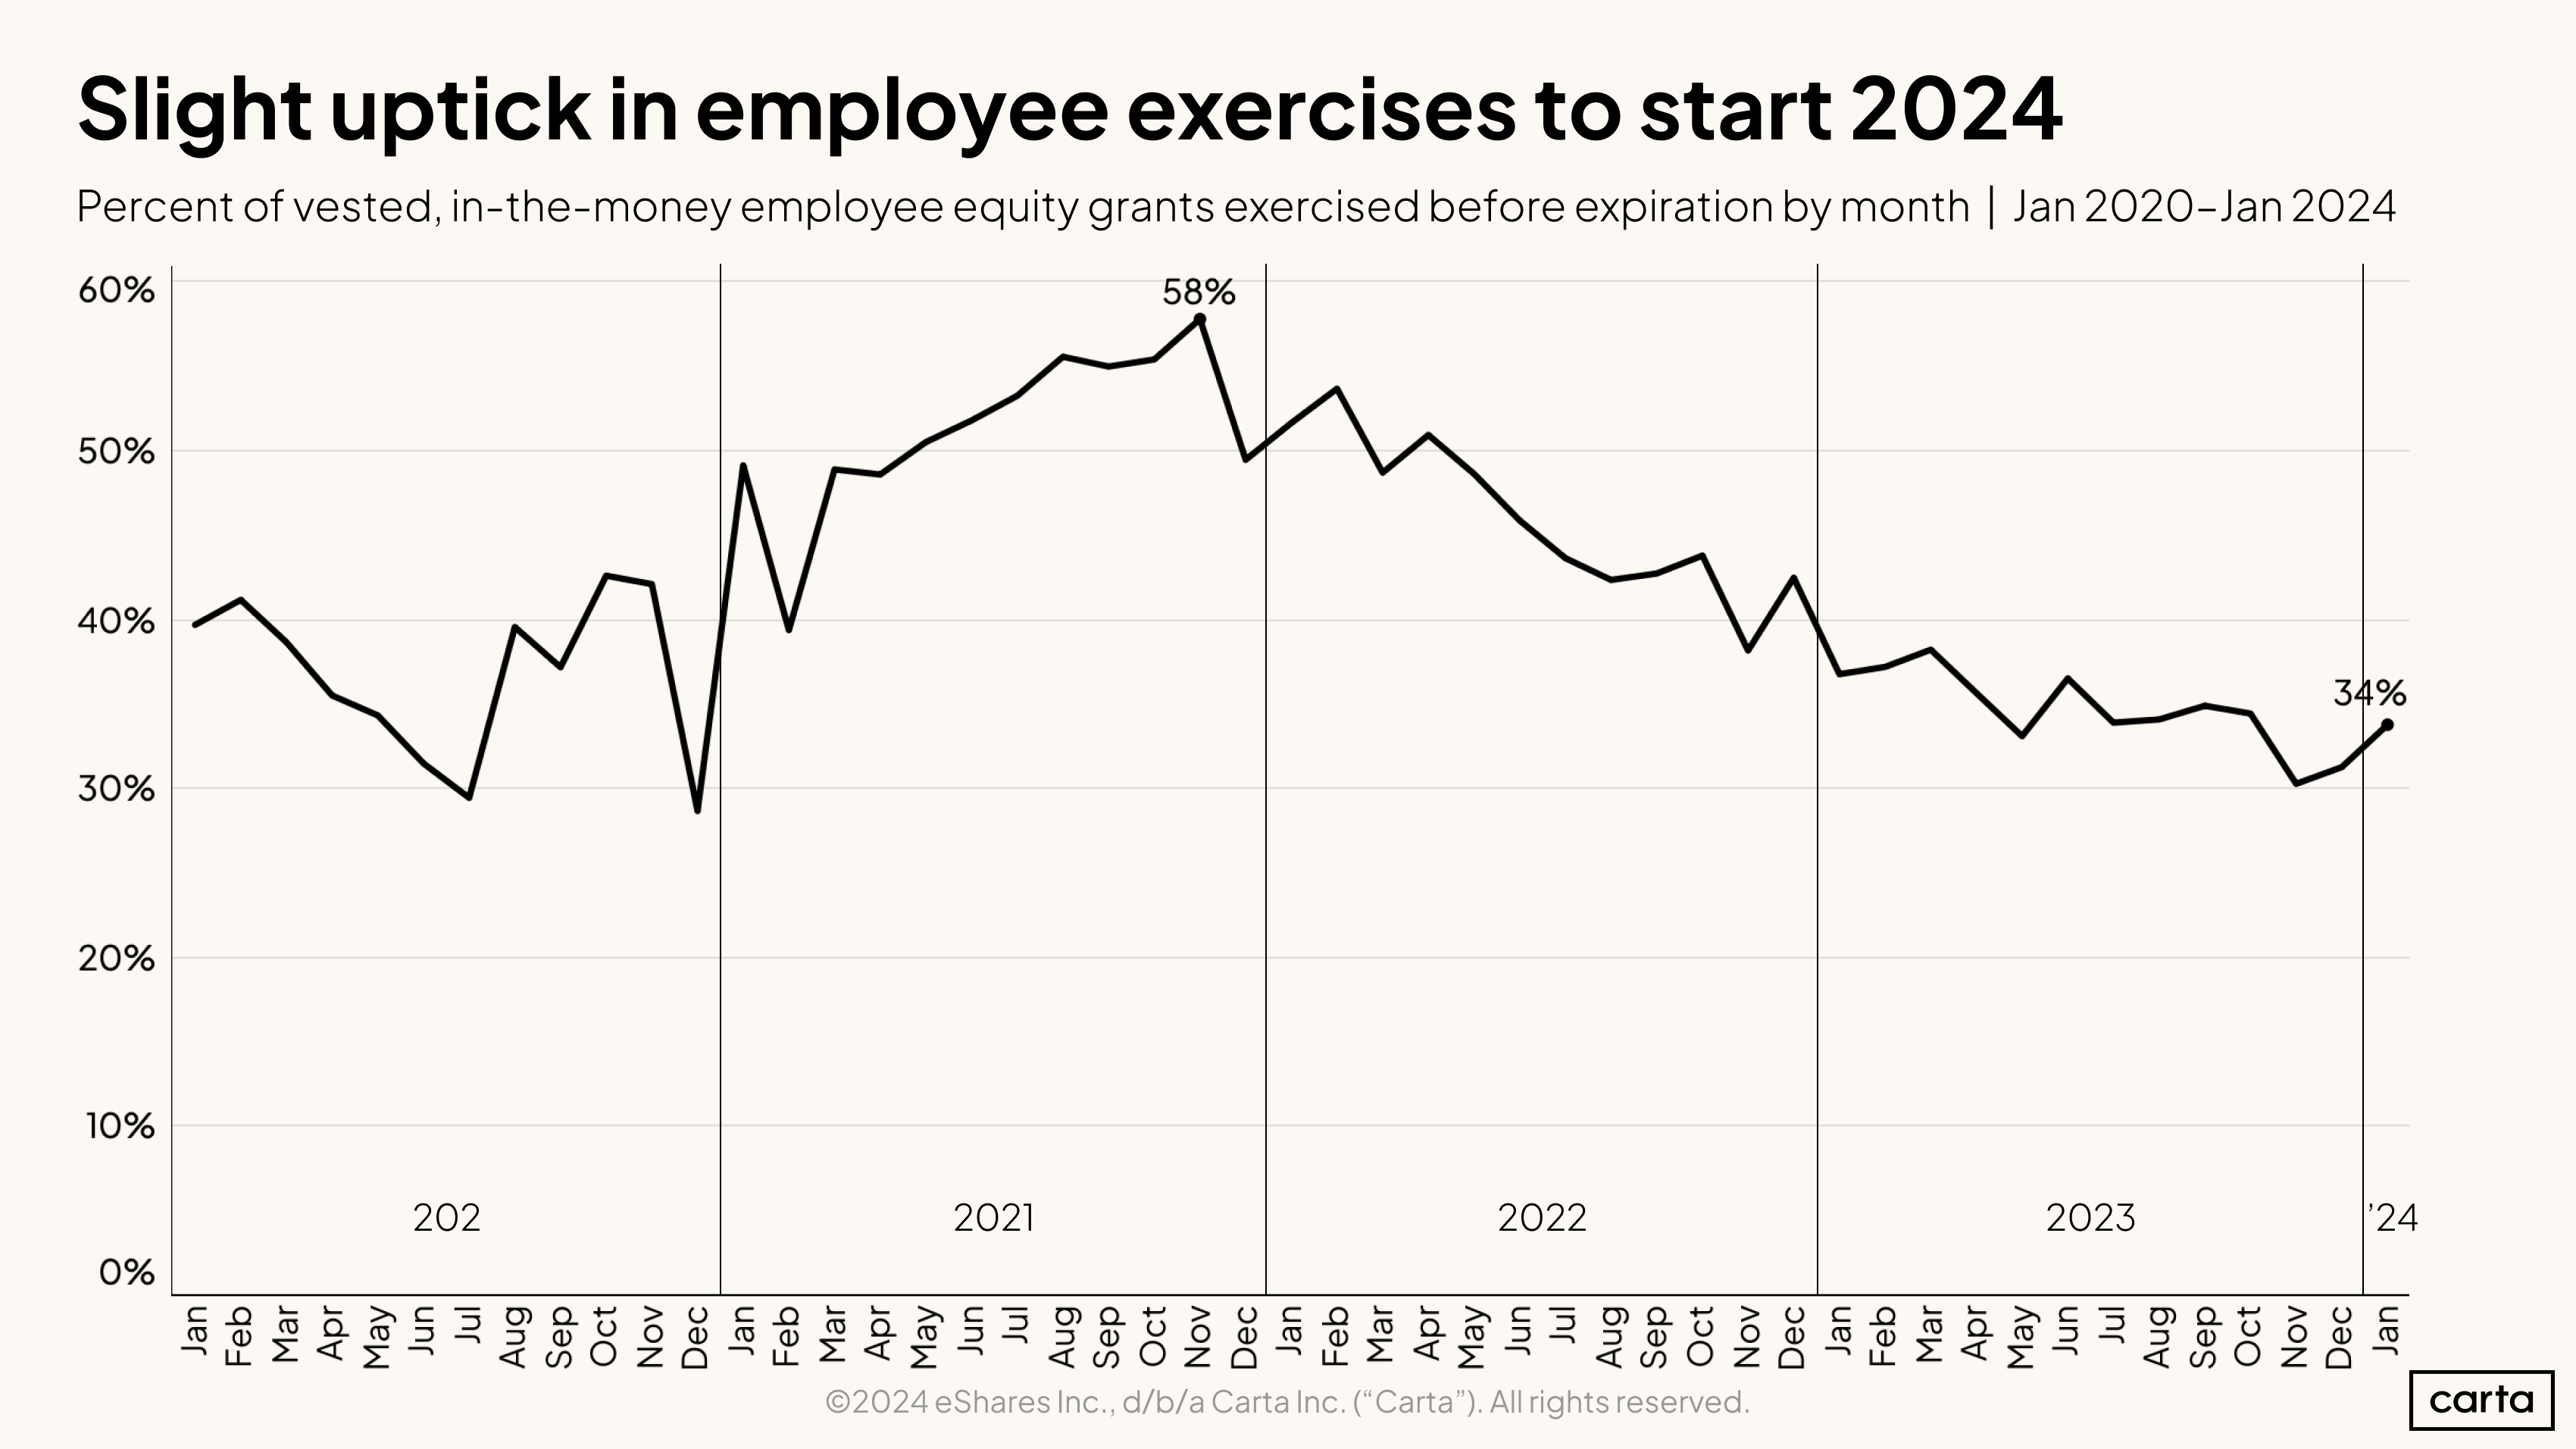
During the course of 2022 and most of 2023, employees grew increasingly less likely to exercise their vested, in-the-money equity grants before those grants expired. The exercise rate on these grants fell from a peak of 58% in November 2021 all the way to 30% in November 2023.
One likely driver of this decline in exercise rate is the concurrent decline in valuations that has taken place across most stages of the startup lifecycle. If the value of issued stock options goes down, then employees are typically less likely to exercise those options.
In Q4 2023, median valuations increased at most startup stages, with Series C the lone exception. And at the same time, the employee exercise rate began to trend back up, climbing to 34% in January 2024.
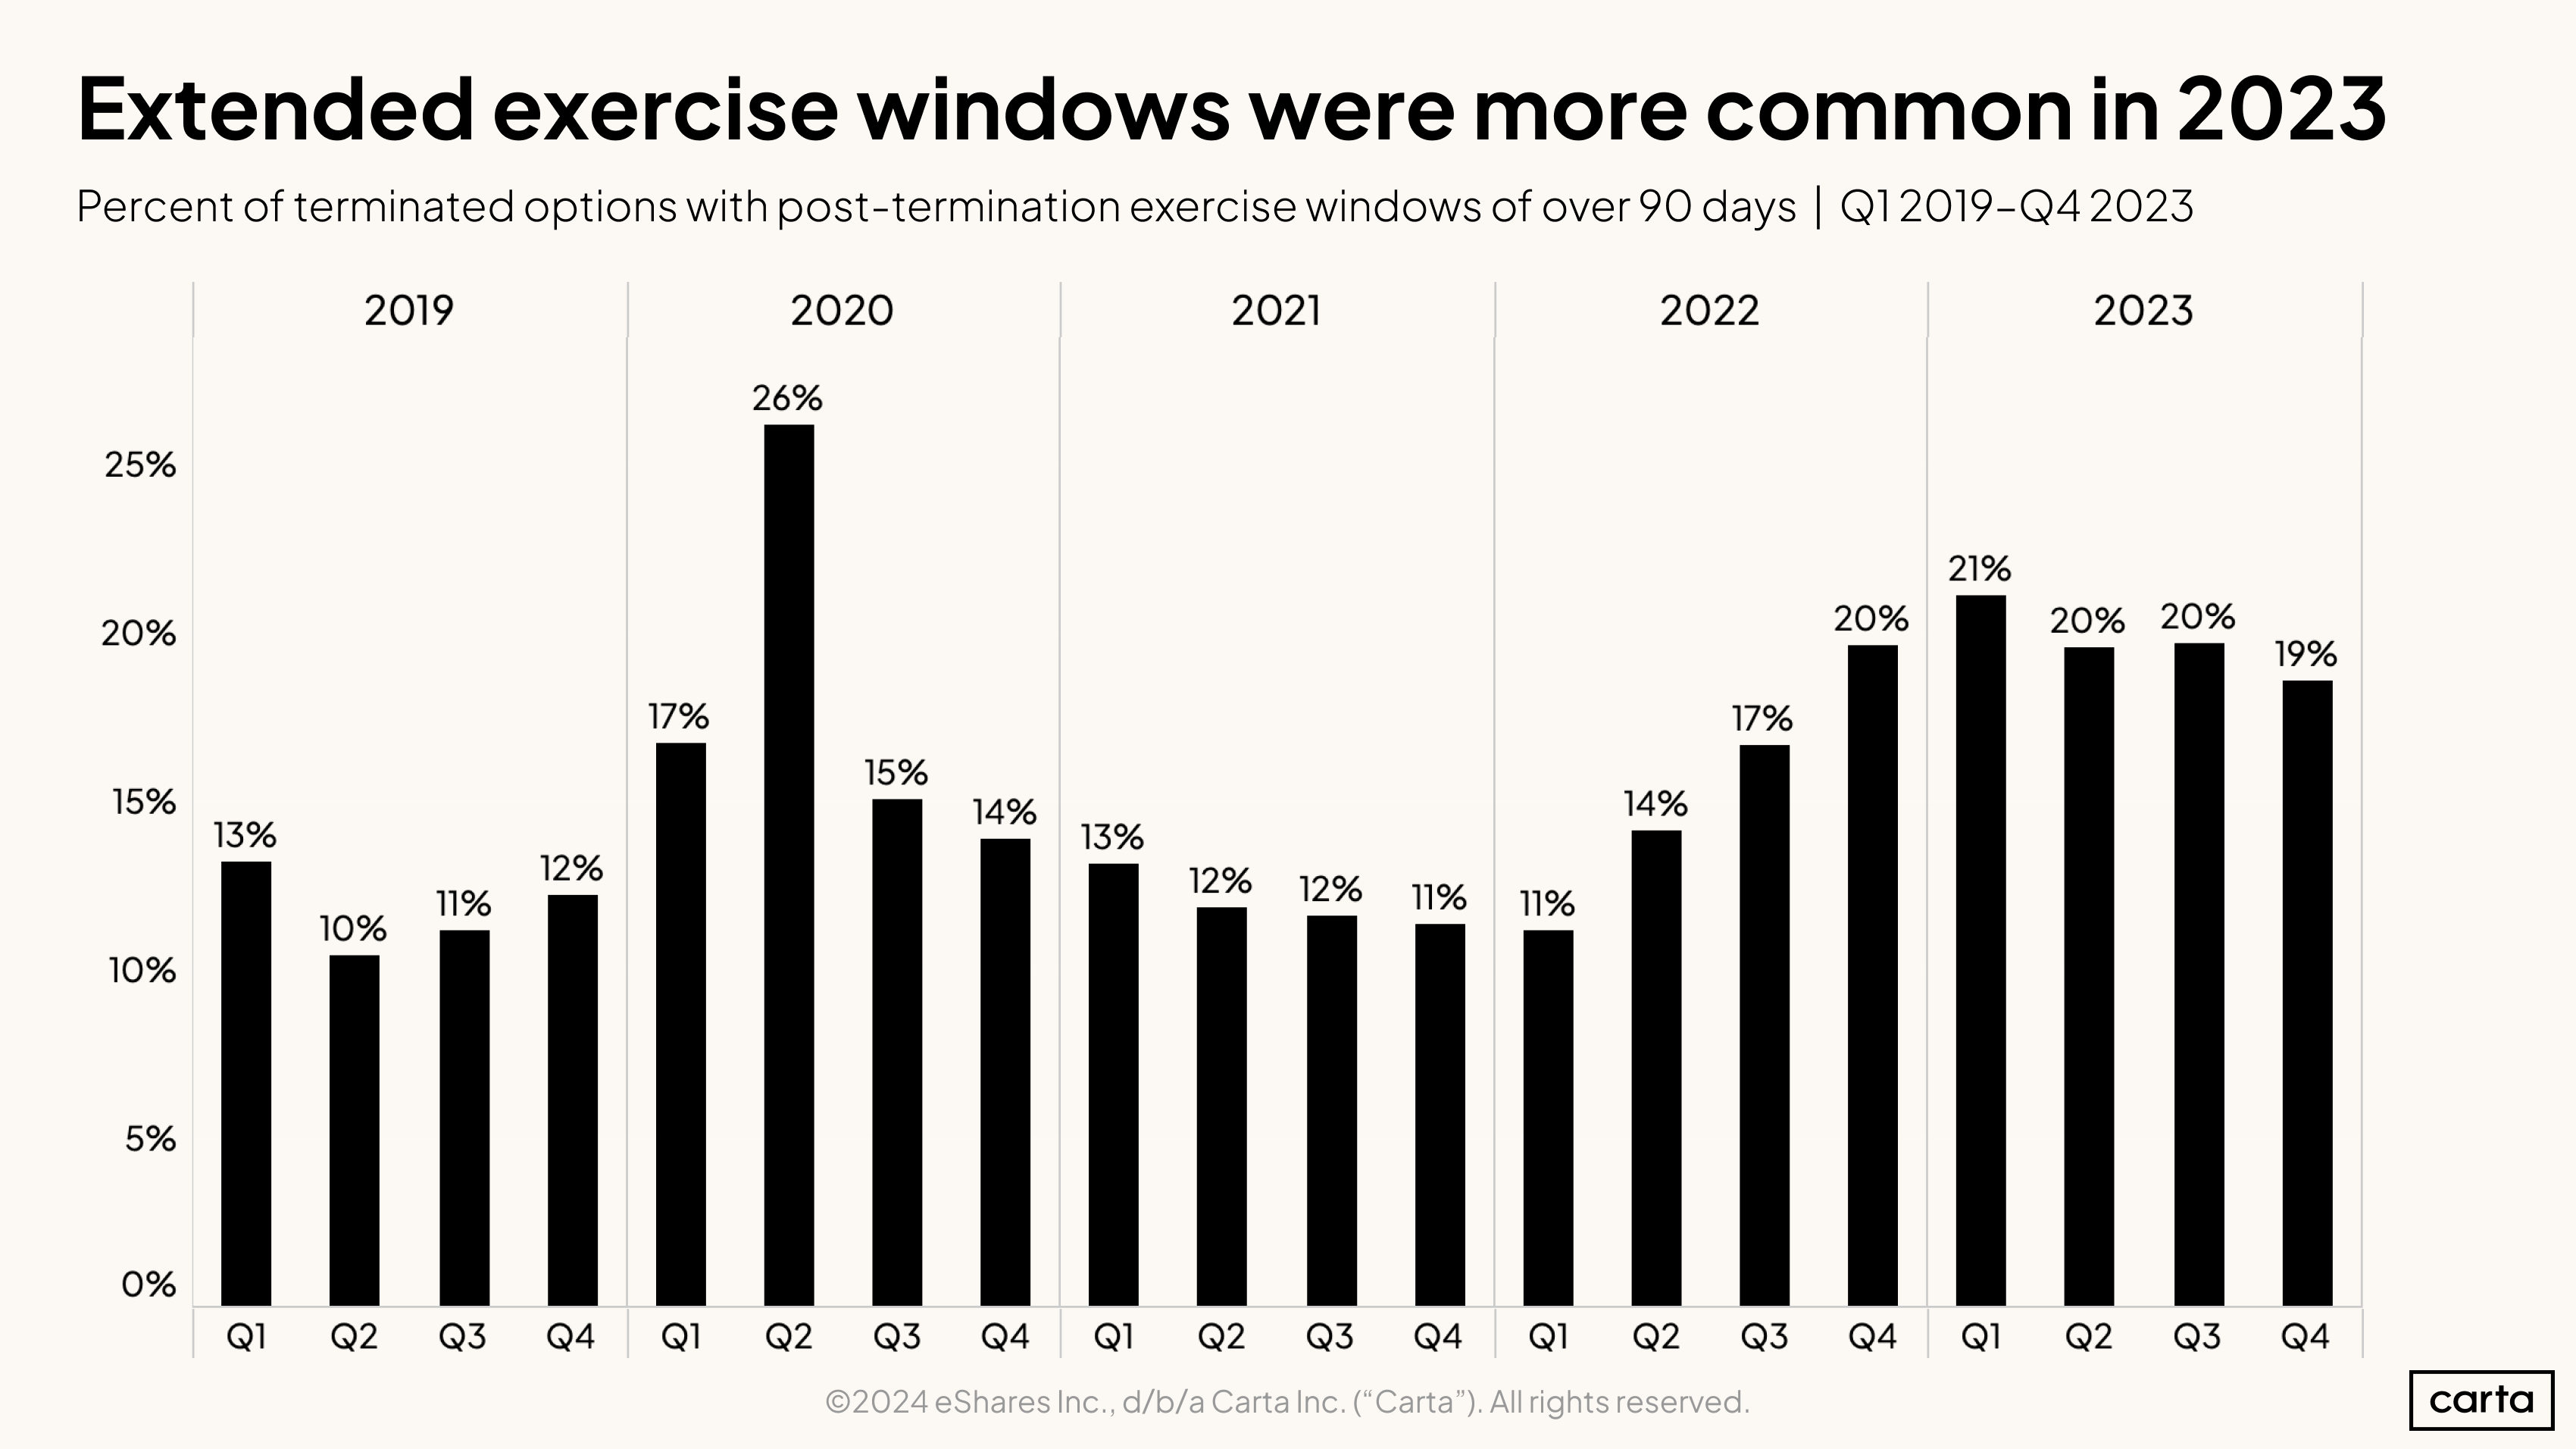
When the majority of employees leave their job, they have 90 days to decide whether to exercise any vested stock options they might hold. Compared to other recent years, however, the size of this majority was smaller in 2023. The extended exercise share hovered at around 20% throughout 2023. That percentage declined slightly as the year progressed, but it remains higher than any point in recent history besides the early pandemic days of Q2 2020.
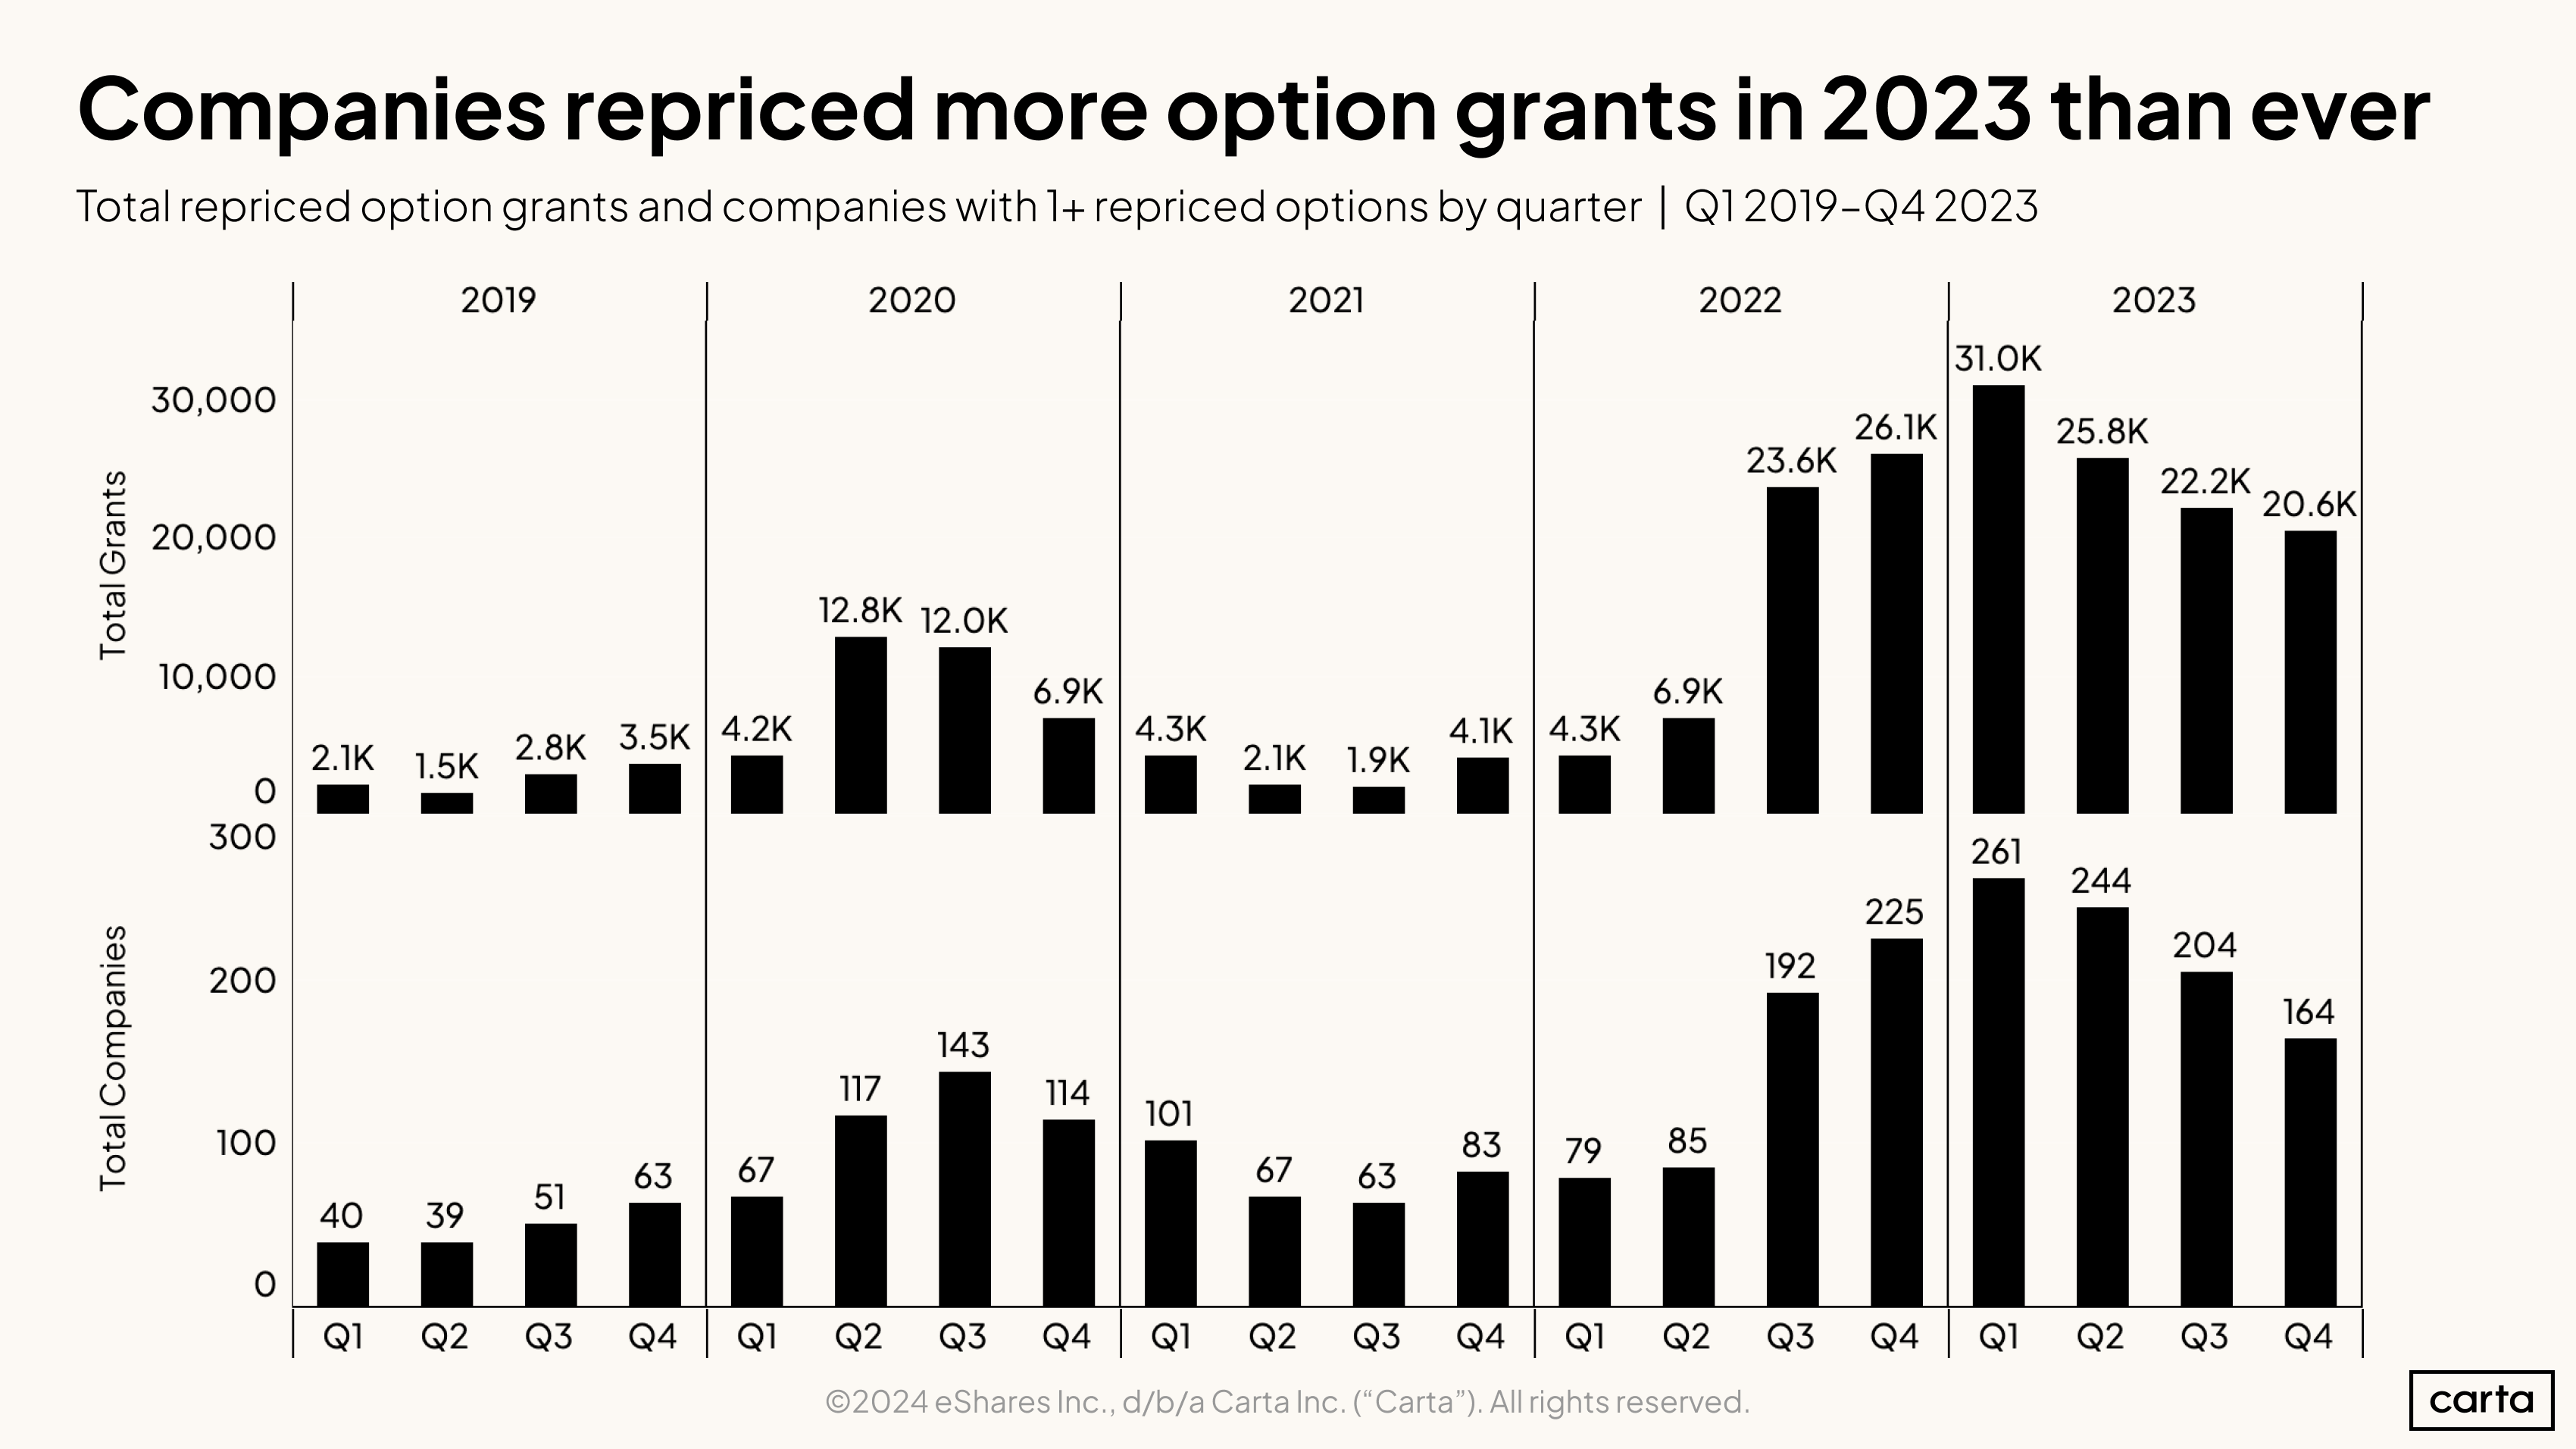
When a company’s valuation decreases, its existing option grants become less attractive to current and future employers. So, with down rounds surging in frequency in 2023, companies responded with a corresponding surge in the number of repriced options. Over the course of the year, 873 companies on Carta combined to reprice some 99,600 previously issued option grants, marking year-over-year increases of 33% and 39%, respectively. By lowering the price of these option grants, startups are able to increase the financial upside for the employees who hold them.
The number of options repricings declined steadily as 2023 progressed, with both the count of companies repricing options and the total number of repriced options falling in every quarter. Still, the past six quarters have been the six busiest quarters for repricings since the start of 2019.
Hiring geography
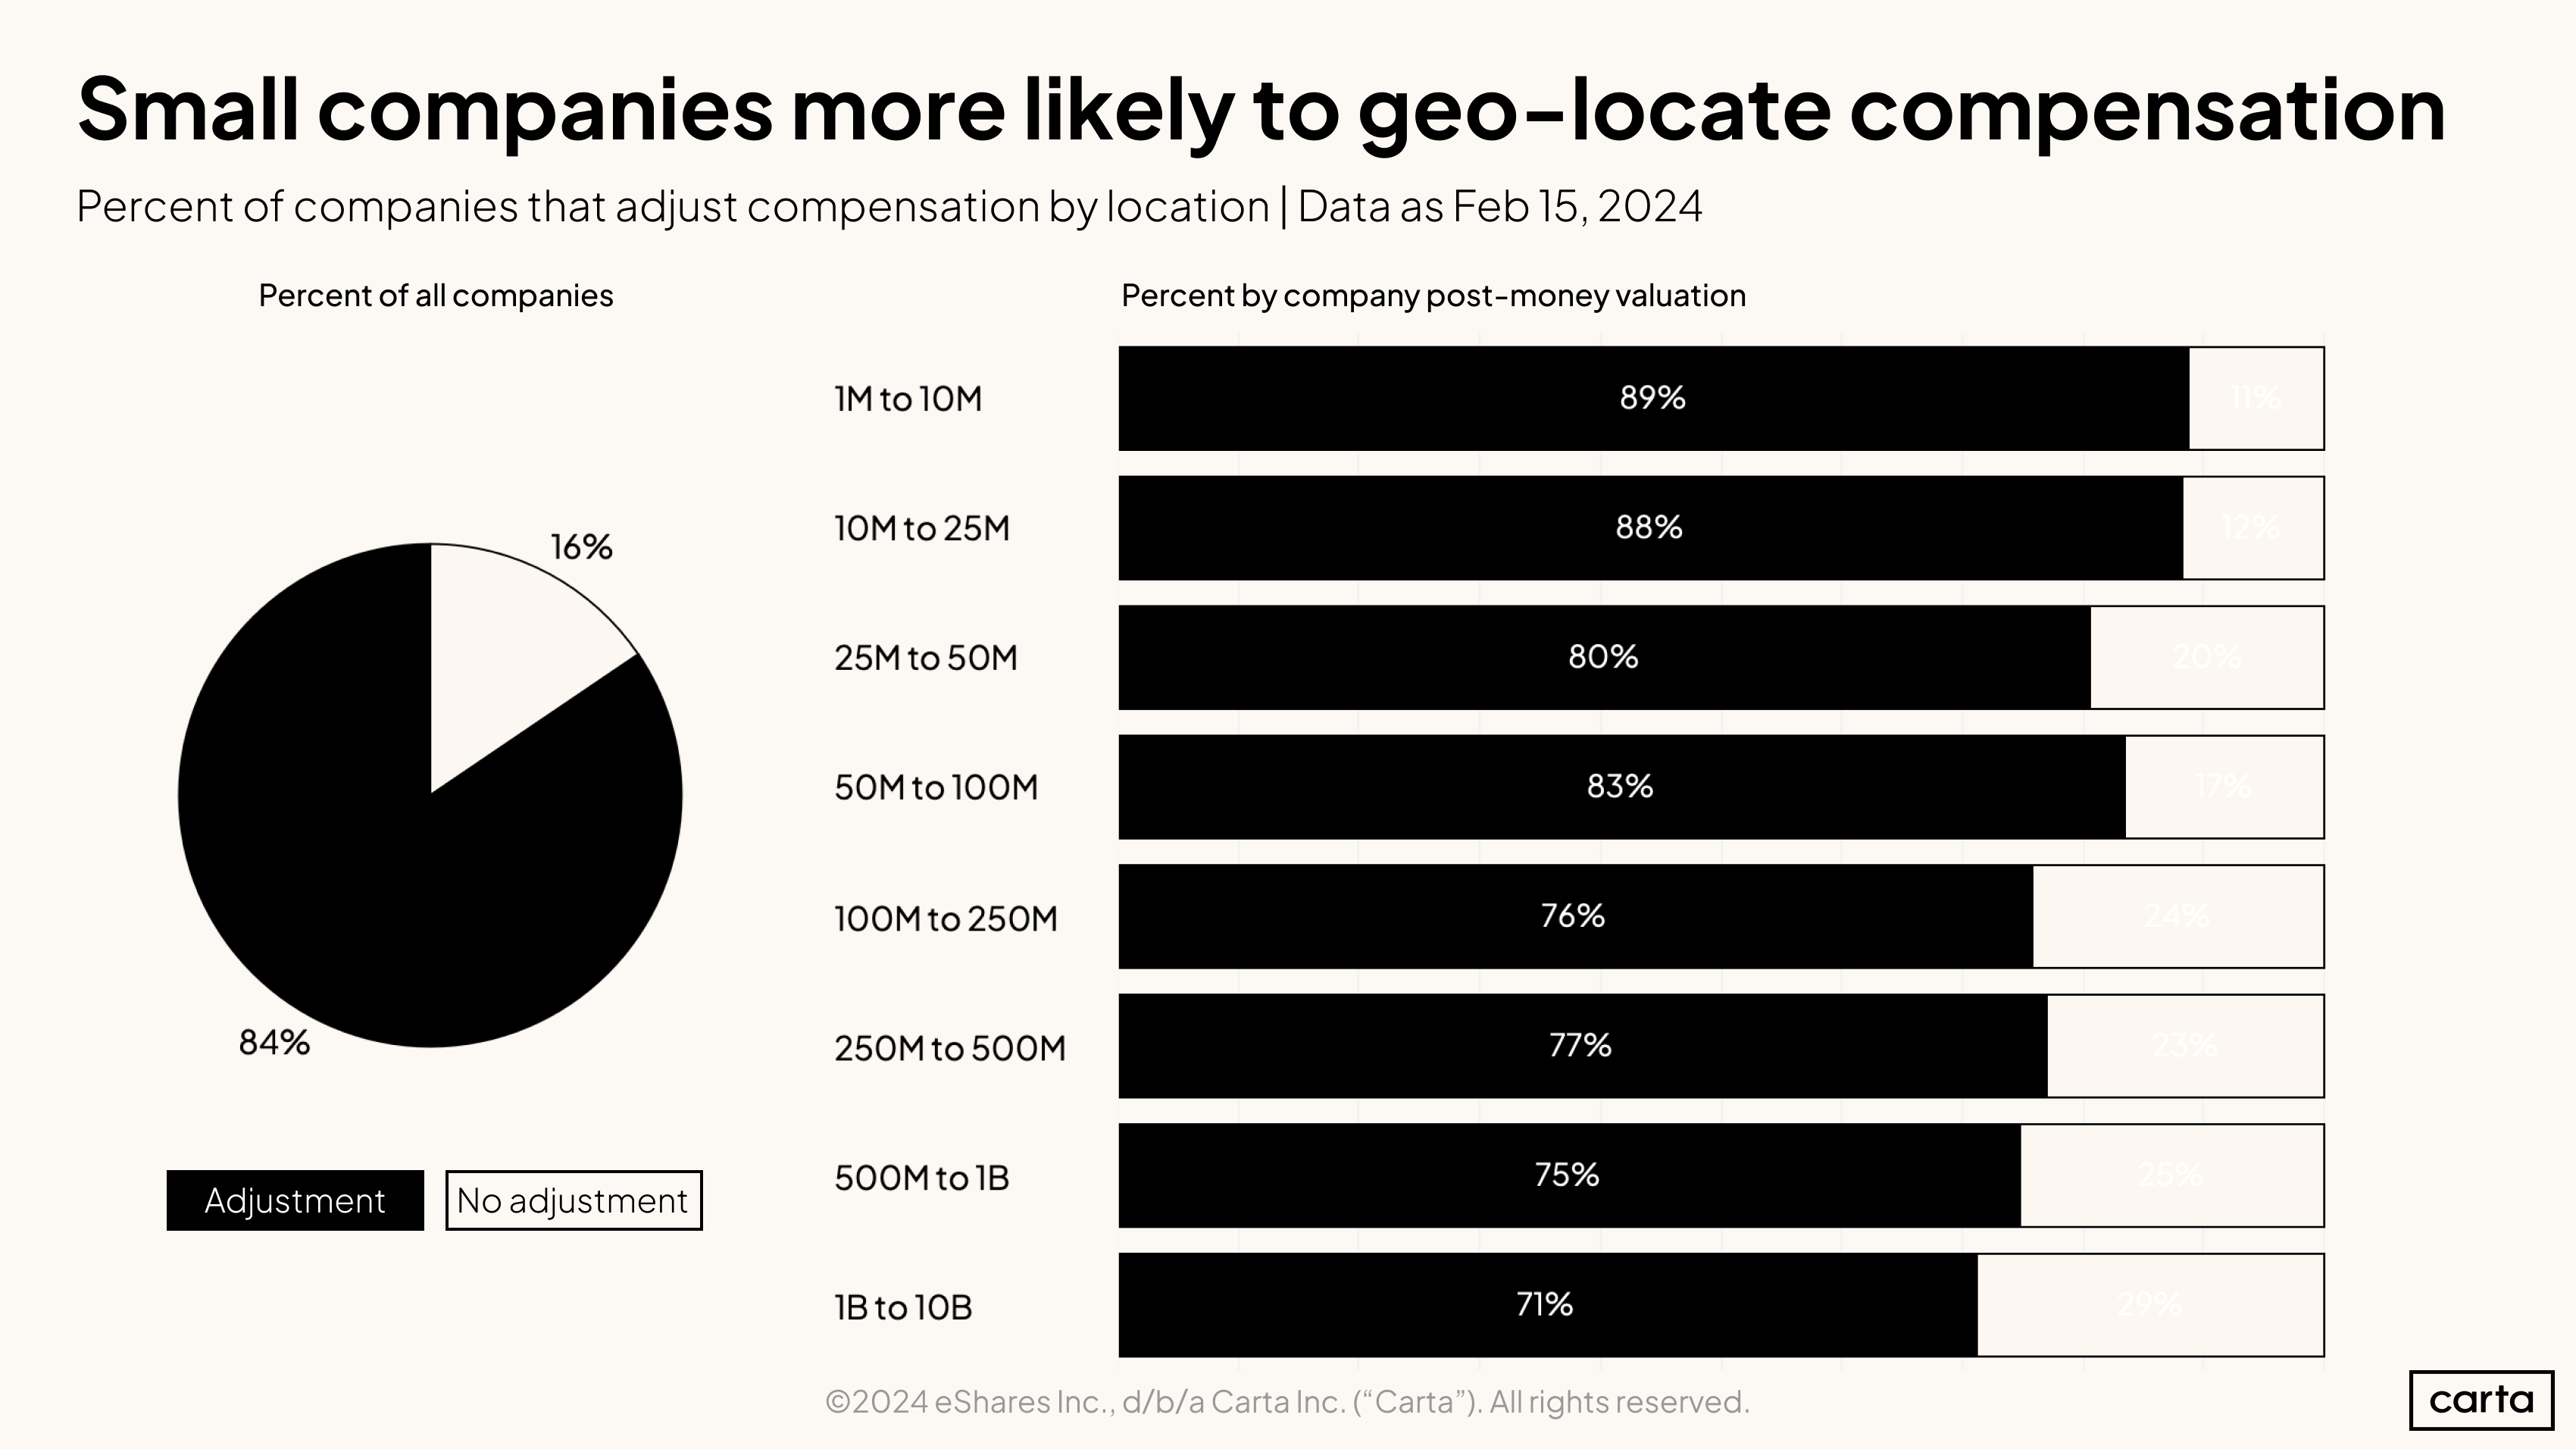
A clear majority of all companies on Carta Total Compensation—about five out of every six—adjust their offered compensation depending on where an employee lives. Smaller companies have proved more likely than larger companies to engage in this type of geo-location.
One reason for this difference could be that smaller companies are more likely to need to geo-locate their compensation in order to attract the best candidates. Larger, more established companies might have more leverage when it comes to hiring.
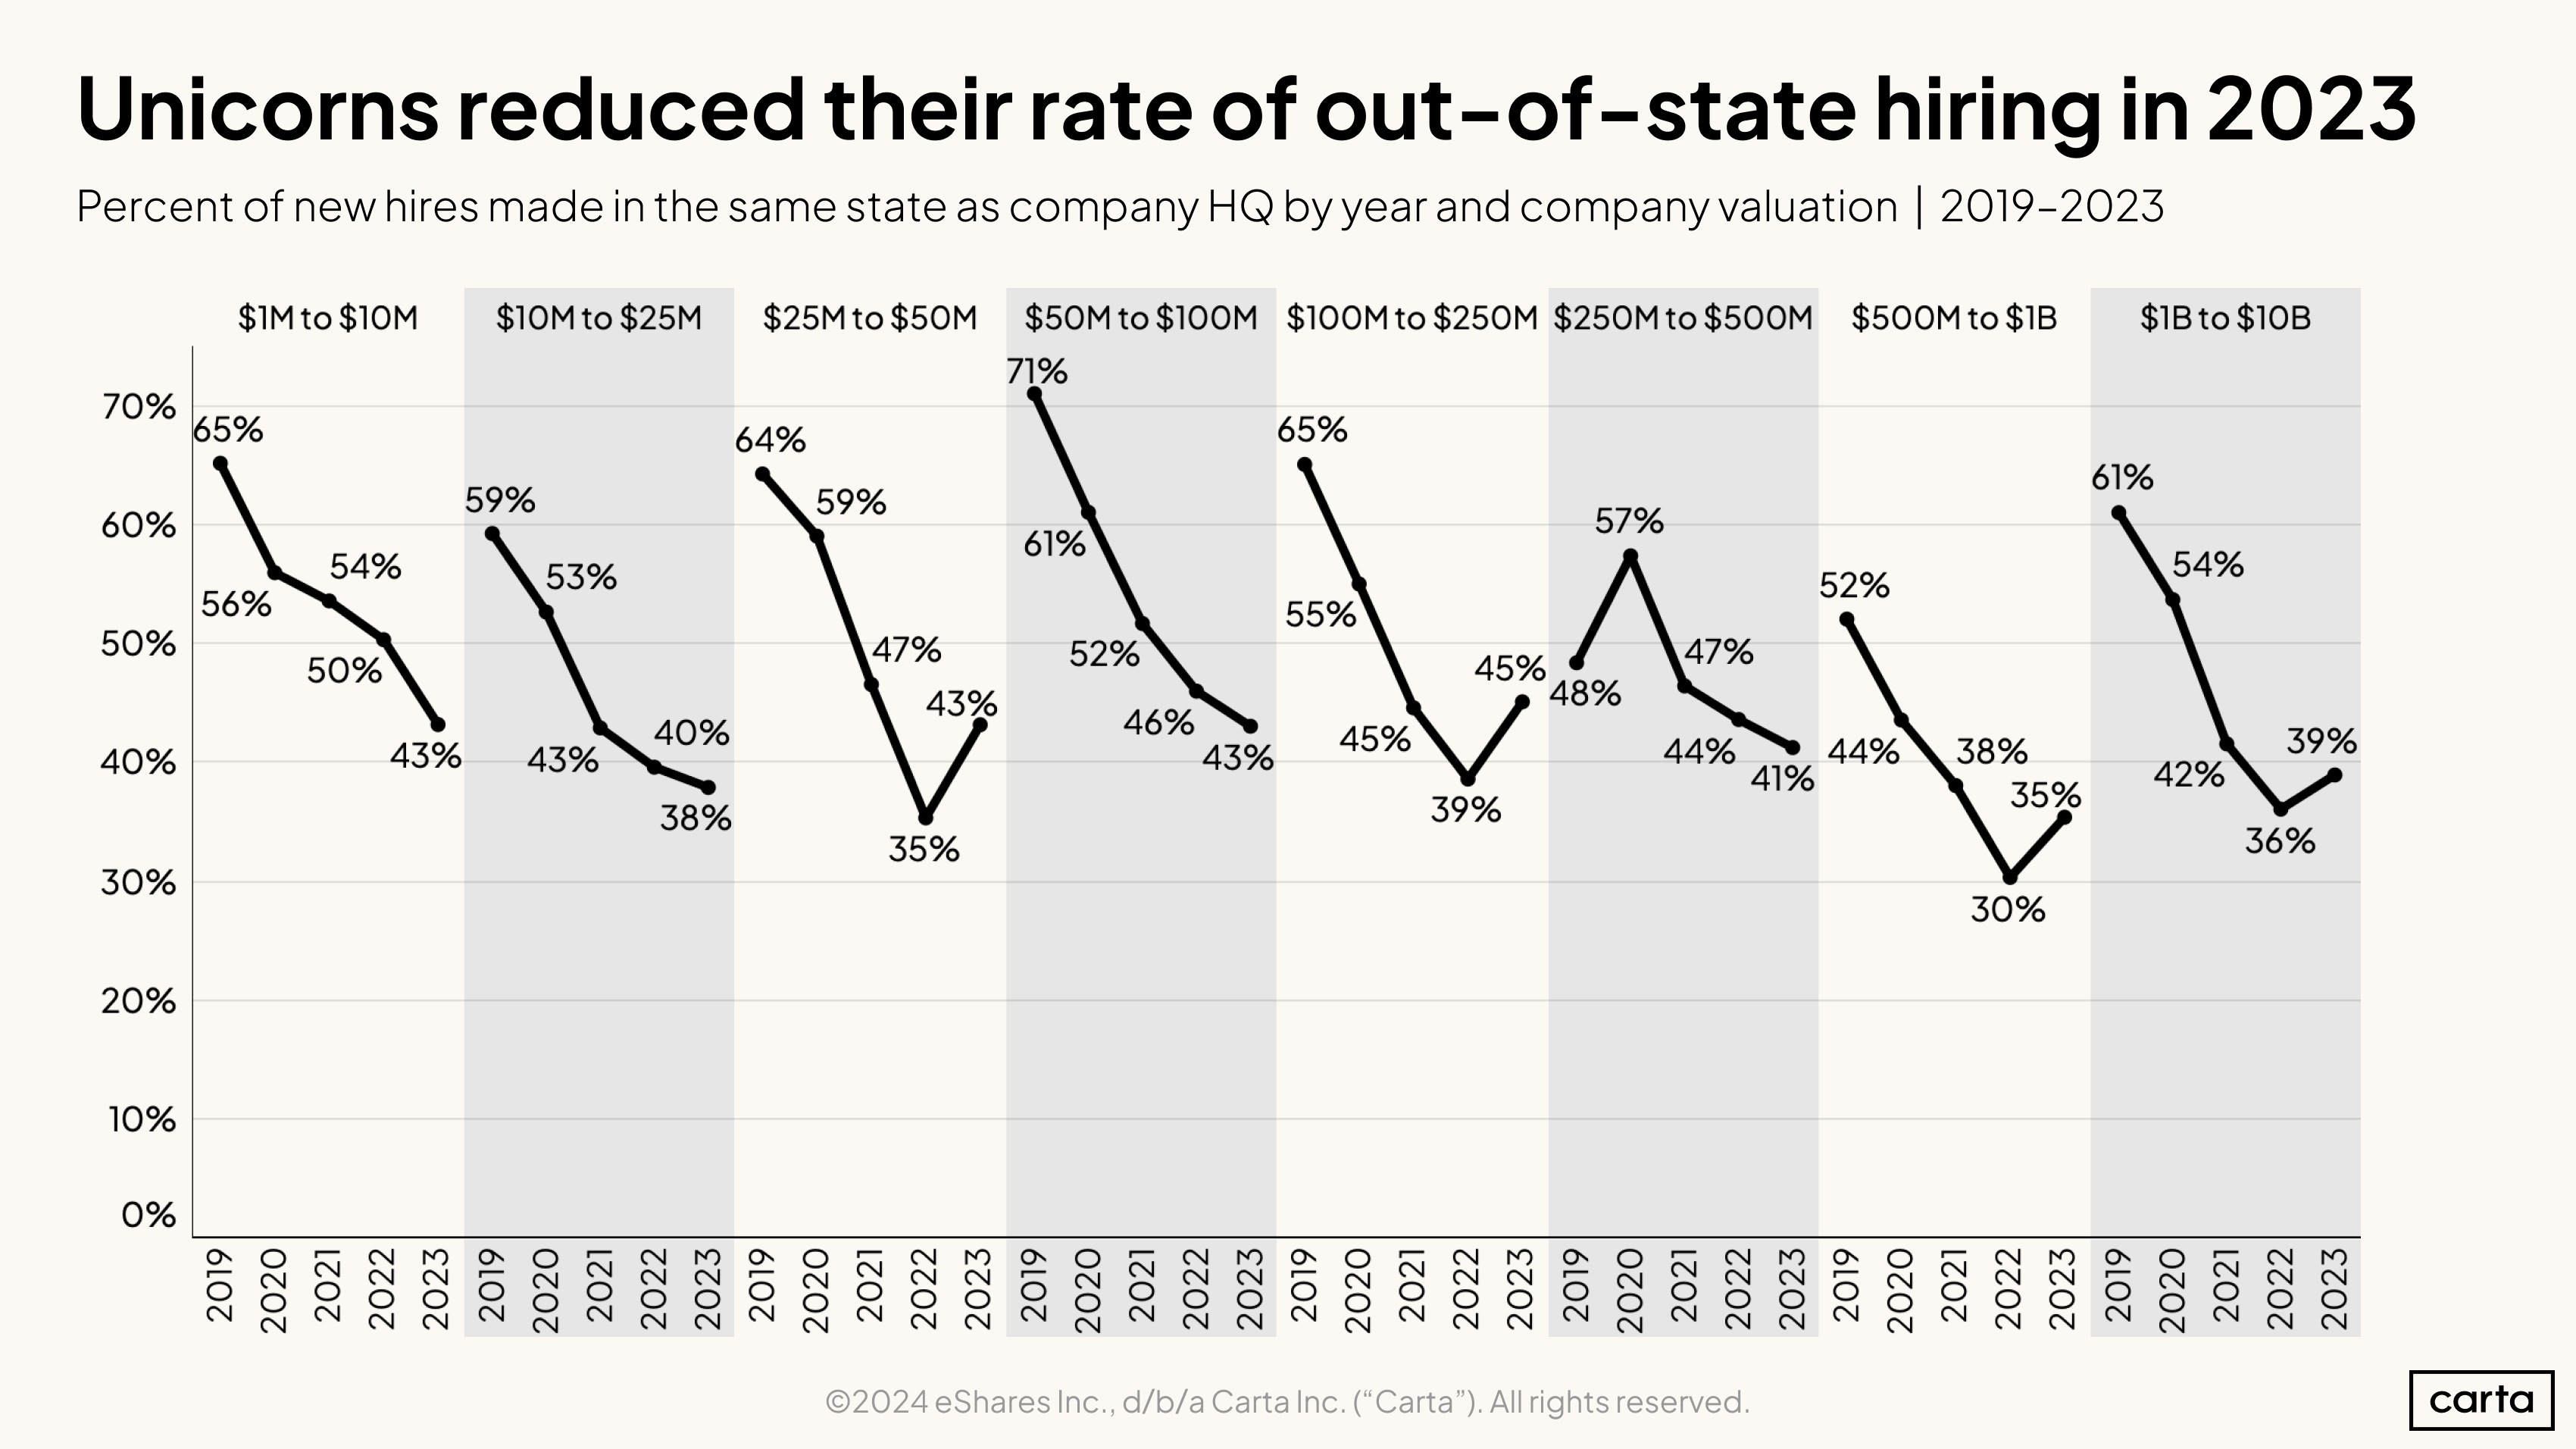
Over the past several years, startups of all sizes grew much more likely to make out-of-state hires. That trend continued in 2023 among the smallest companies. For larger businesses, it was a different story.
For companies valued between $1 million and $25 million, the rate of in-state hires has now declined for four consecutive years. Among companies valued at $500 million to $1 billion, however, the rate of in-state hires climbed from 30% to 35%. For companies valued between $1 billion and $10 billion, it climbed from 36% to 39%.
The rates of in-state hires also ticked up at some earlier stages: For companies valued between $25 million and $50 million, for instance, it rose from 35% in 2022 to 43% in 2023.
Pull back the lens, however, and a clear multi-year trend emerges, even with these 2023 gains. On the whole, startups have grown much more likely in the past several years to cast a wider geographic net when they’re looking for talent.
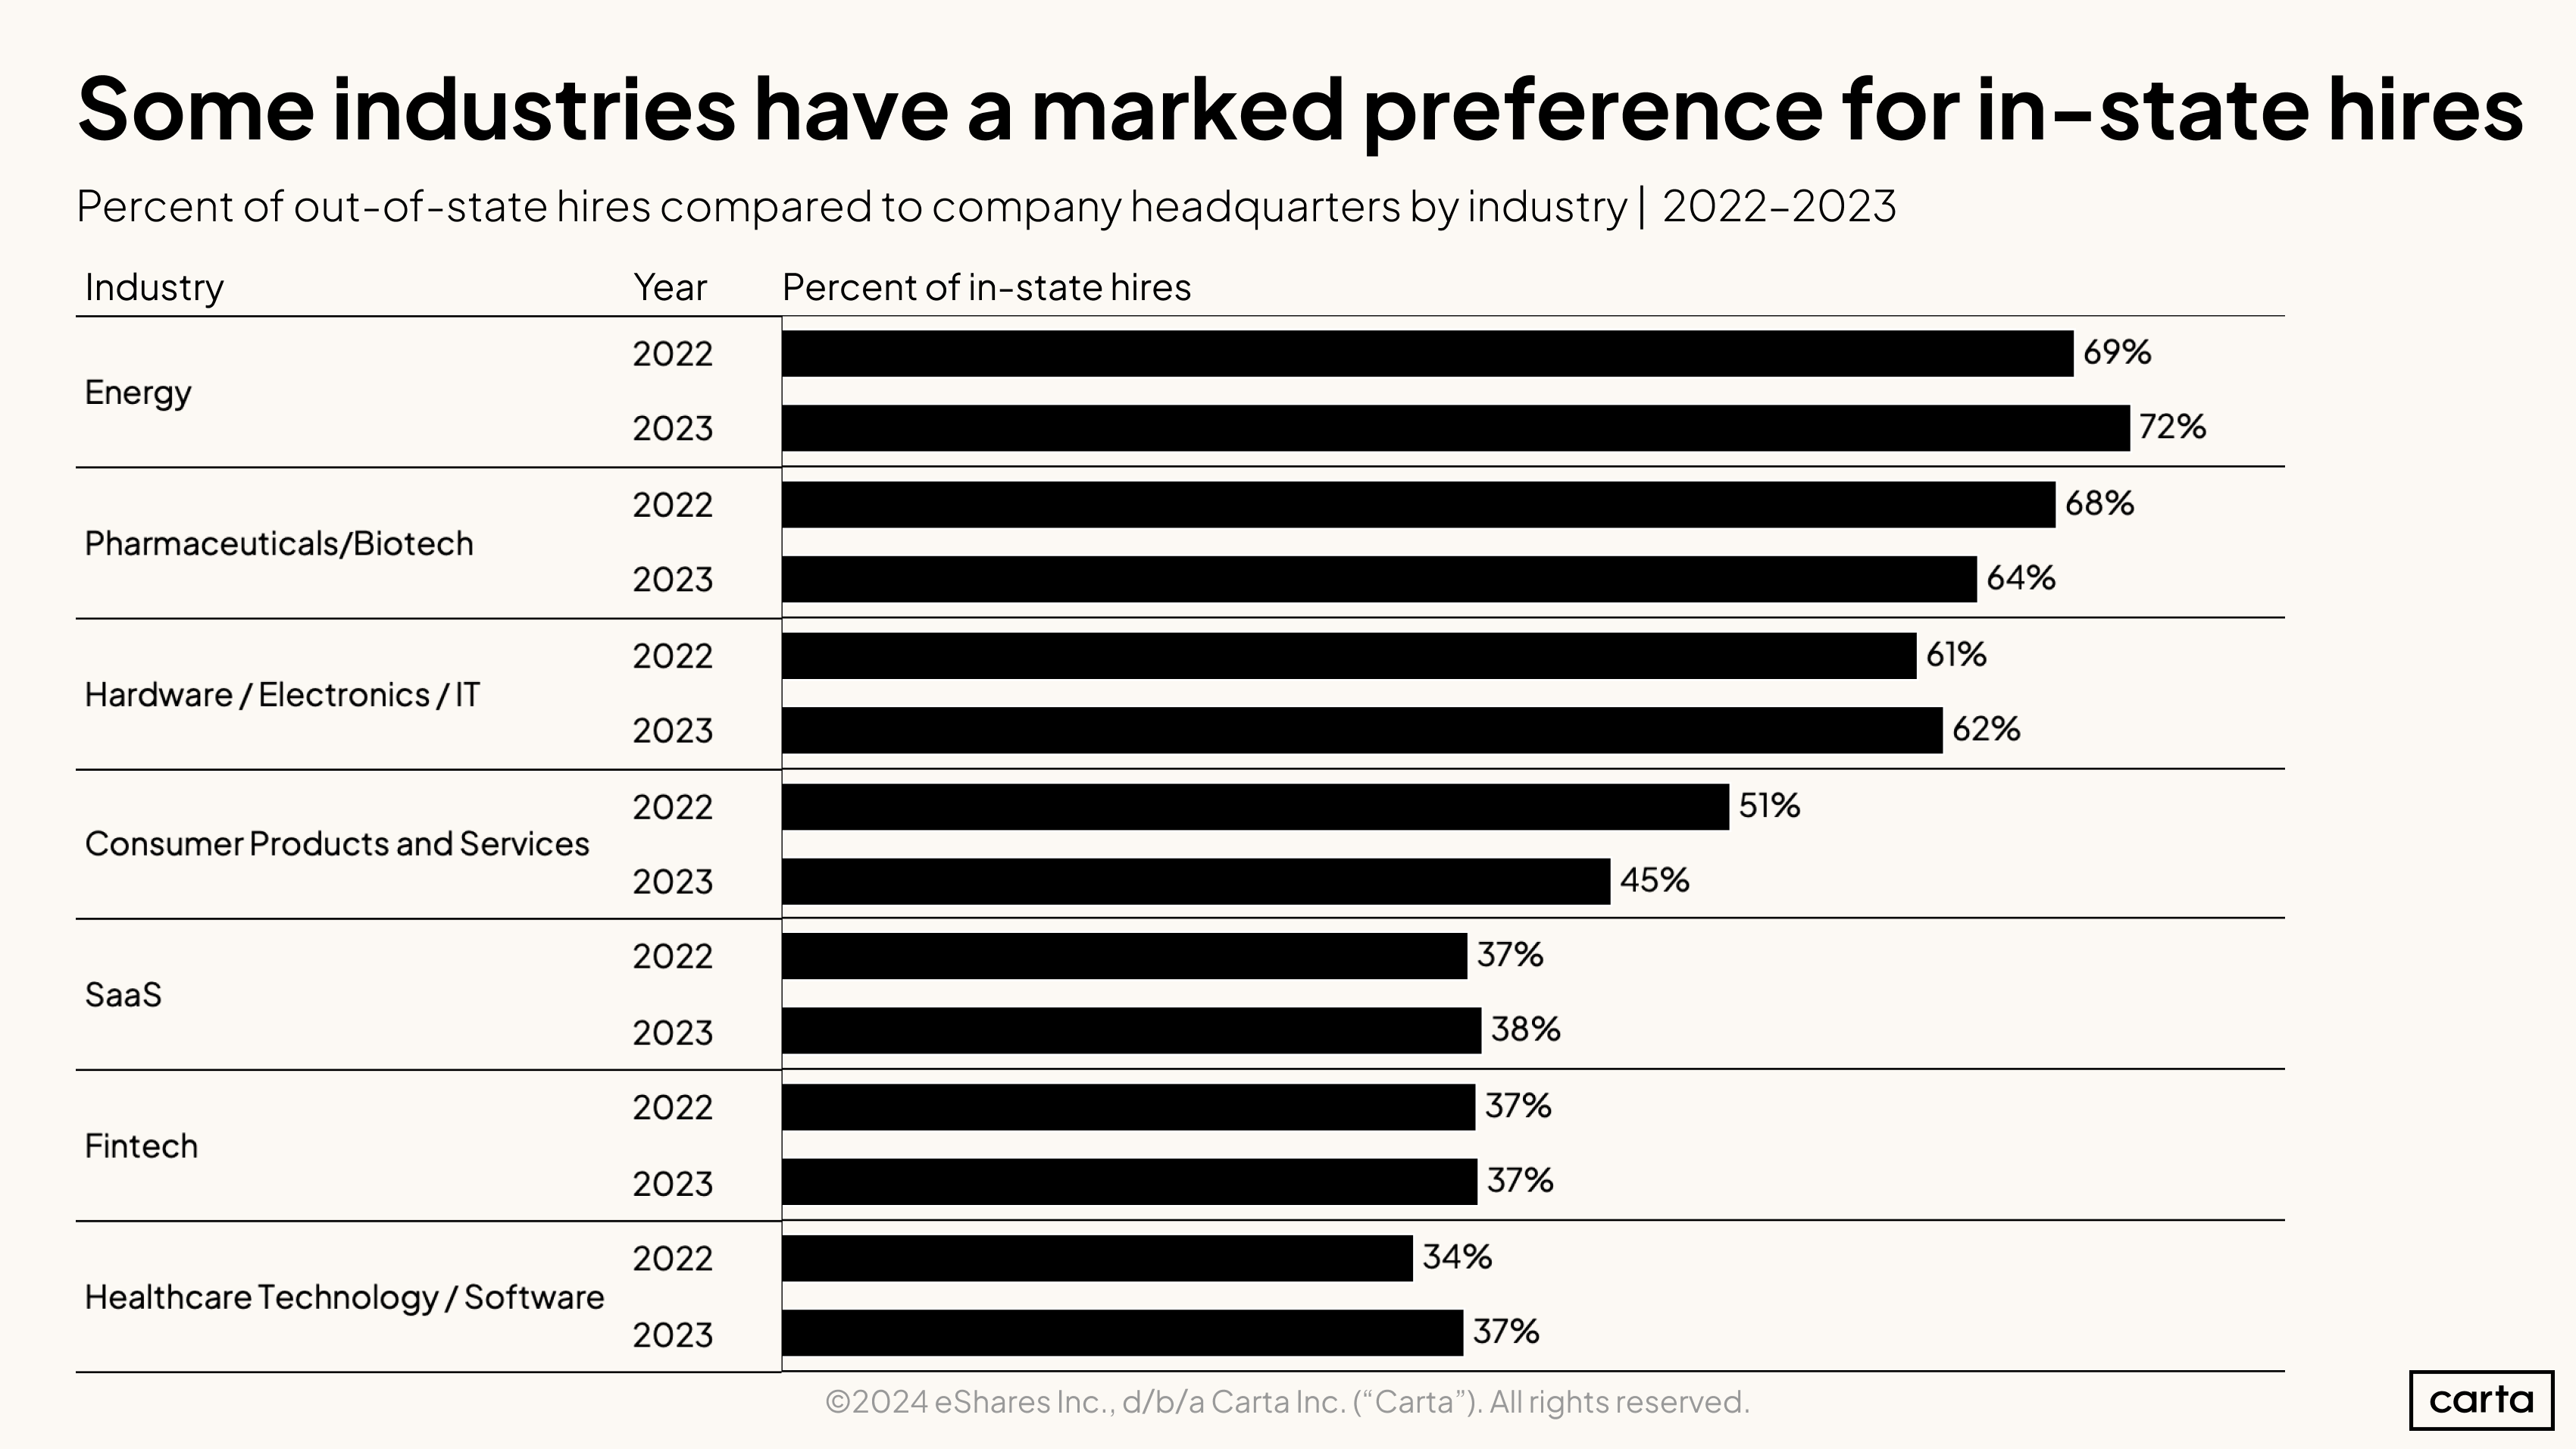
This growing propensity among startups to make out-of-state hires hasn’t unfolded evenly across every sector. Technology- and research-heavy areas like energy, pharmaceuticals, and hardware still tend to have much higher levels of in-state hires, while other industries such as SaaS and fintech have more readily embraced the remote revolution.
There are some clear parallels between this data and the chart displaying how the rates of new hires to departures compare across industries. Energy, hardware, and biotech were three of the four sectors that still saw more hires than job departures in 2023. Those are also the three sectors with the highest rates of in-state hires in 2023.
In other words, the industries that were still growing headcount in 2023 were also the industries making the most in-state hires. Remote work is on this rise, but it still isn’t for everyone.
Additional equity compensation data
Download the equity addendum below to see:
-
Employee option pool sizes by valuation
-
Median advisory shares for pre-seed, seed, and Series A companies
-
Median equity grants for a startup’s first 10 employees
-
Median equity grants for startup board members at the early stages
-
Suggested adjustments to benchmark equity rates for 20 countries
Methodology
Overall dataset
This report is drawn from thousands of CTC customers with over 500,000 data points used by Carta Total Compensation. The data presented above represents an aggregated, anonymized view into the compensation practices of these startups. Companies that have contractually requested that we not use their data in anonymized and aggregated studies are not included in this analysis.
The data presented in this report represents a snapshot as of Feb. 15, 2024. Historical data may change in future studies. New companies signing up for Carta’s services will increase the amount of data available for the report.
Salary & equity
All salaries presented in this report are expressed in U.S. dollars. Except where indicated, total payroll numbers do not include any variable compensation, such as bonuses or commissions, that may be given to employee.
All equity values presented in this report are expressed as a percentage of fully diluted company shares.
In the sections on salary and equity trends, changes over time reflect updates to Carta Total Compensation bands. These benchmarks are updated once per quarter to incorporate newly hired employee data as well as any adjustments to current employee compensation.

