Executive summary
During the rise and fall of an unprecedented bull market across 2021 and 2022, founders and investors had to navigate a wild ride of ups and downs. That volatility diminished in 2023. The startup ecosystem trundled along at a slow but steady pace, with activity near recent lows.
This new equilibrium involves fewer deals and fewer dollars. Total venture deal count on Carta was down 24% year over year in 2023, while cash raised by startups fell by 50%. But the fundraising that took place in 2023 proceeded at a steady pace. In each quarter, startups closed somewhere between 1,209 and 1,574 rounds and brought in between $12.8 billion and $20.3 billion in total capital.
Several facets of the fundraising scene shifted in 2023 in ways that will continue to impact founders and investors in 2024. Startups were forced to extend their runways longer than ever. Bridge rounds boomed in popularity. Series A valuations experienced a second-half surge. But the sort of seismic movements that shaped the venture landscape in recent years were fewer and farther between.
Q4 highlights
-
Down rounds remained elevated: The rate of down rounds across all venture stages landed somewhere between 19% and 20% every quarter last year, including 19.6% of all investments in Q4. These were the four highest quarterly down-round rates since the start of 2018.
-
Seed activity slumped: Startups closed just 462 seed investments in Q4, the smallest total since Q1 2018. Year over year, seed deal count is down 27%.
-
Late-stage valuations took a leap: In Q4 2023, the median pre-money valuation increased by 71% at Series D and by 46% at Series E+ over Q3 medians. These late stages had felt the brunt of the venture slowdown, with valuations plummeting in prior quarters.
Note: If you’re looking for more industry-specific data, download the addendum to this report for an extended dataset.
Key trends
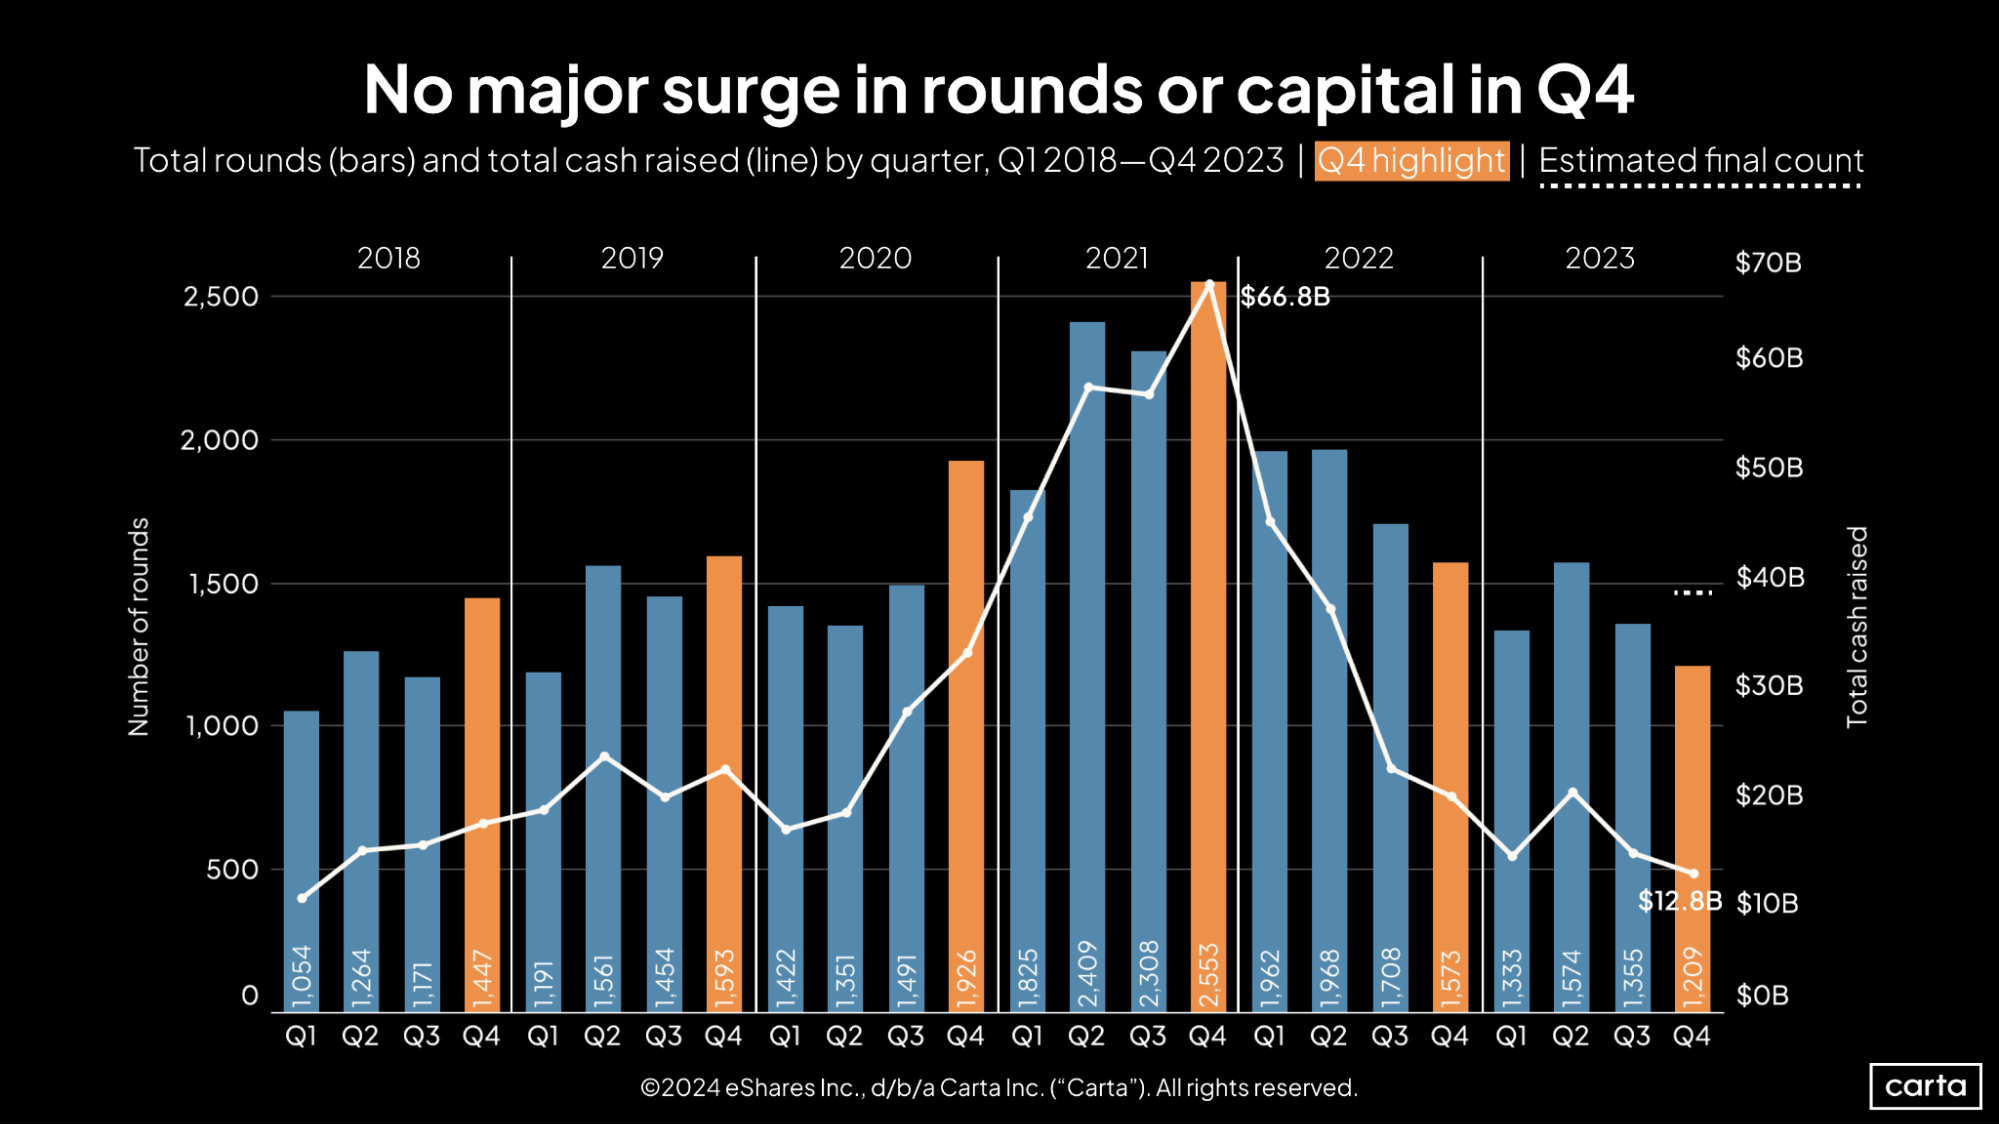
For now, Q4 was the slowest quarter of the year for venture dealmaking, with 1,209 new investments. That would be the lowest quarterly total since Q1 2019. However, the total number of Q4 rounds will likely increase in the months to come as companies report additional transactions.
Still, the comparison to 2019 may be a useful one: That year, there were 5,799 transactions logged on Carta, compared to 2023’s current count of 5,409. In terms of both the number of deals and the amount of capital raised, the data from 2023 looks much more similar to the pre-pandemic years of 2018 and 2019 than any year from the 2020s.
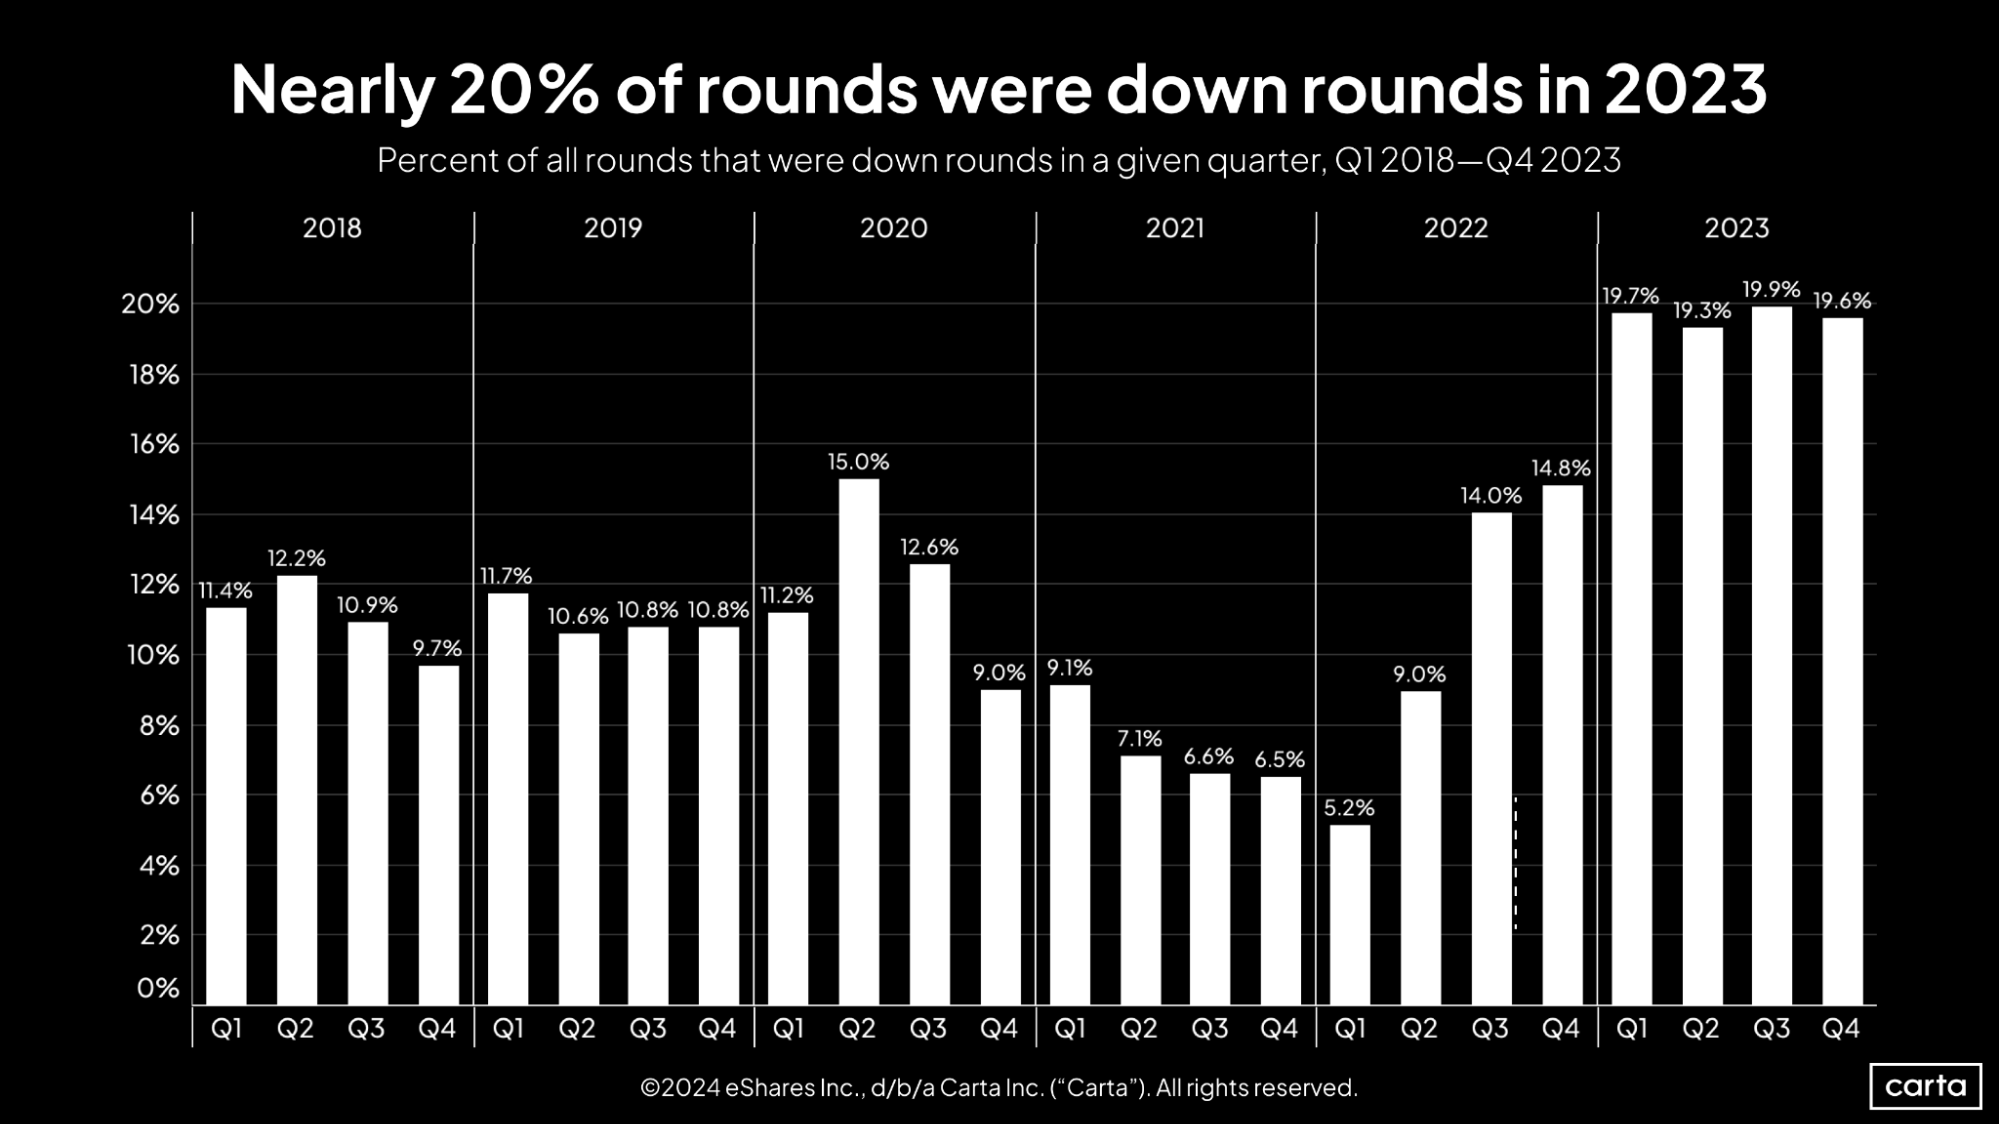
It was the year of the down round. In all four quarters of 2023, more than 19% of new funding rounds came at a lower valuation than the company’s previous round. Those are far and away the four highest quarterly rates the market has seen since the start of 2018.
This new normal has been an adjustment for founders and investors alike. Many had grown used to a funding environment where valuations could generally be expected to proceed in an orderly fashion up and to the right. Instead of a relative rarity, down rounds were a common feature on the startup landscape in 2023.
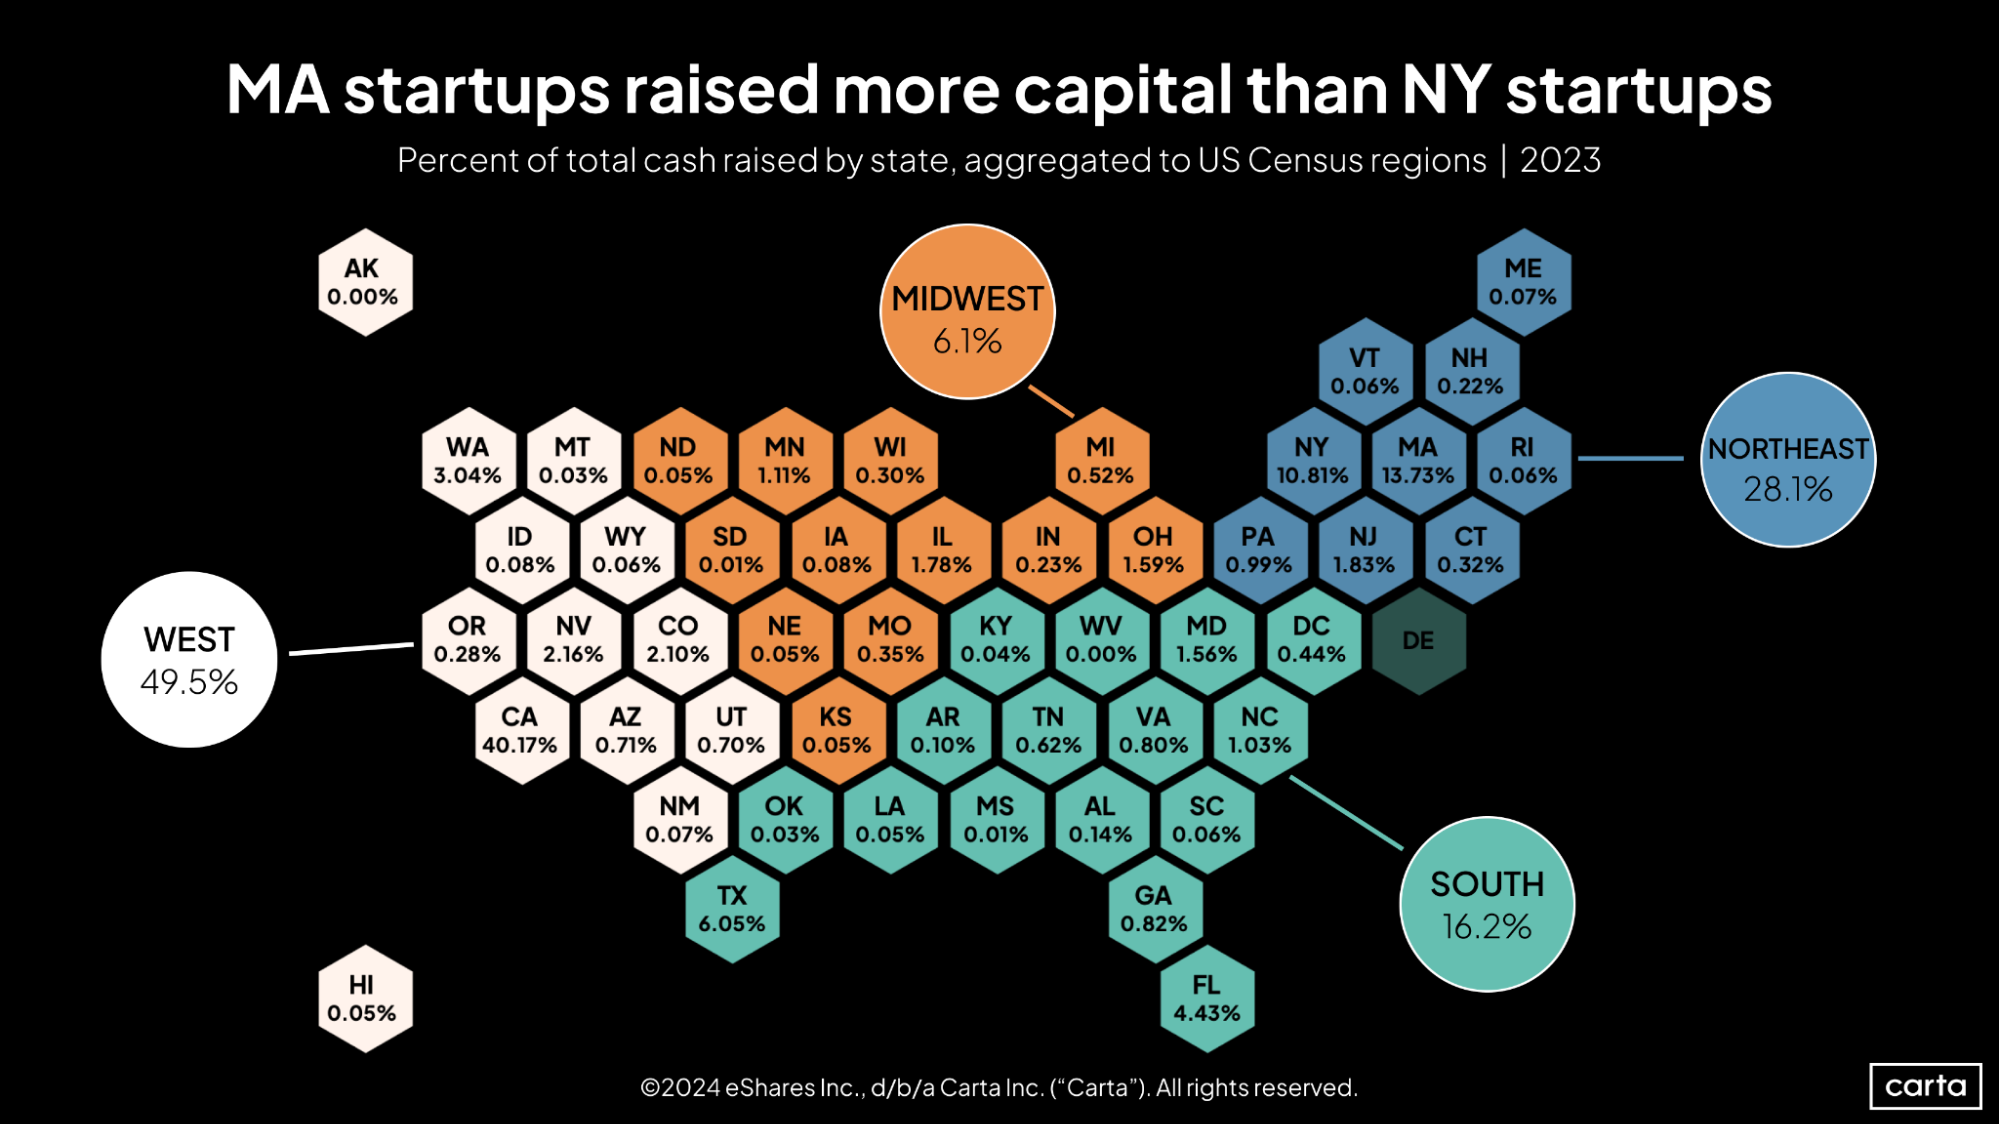
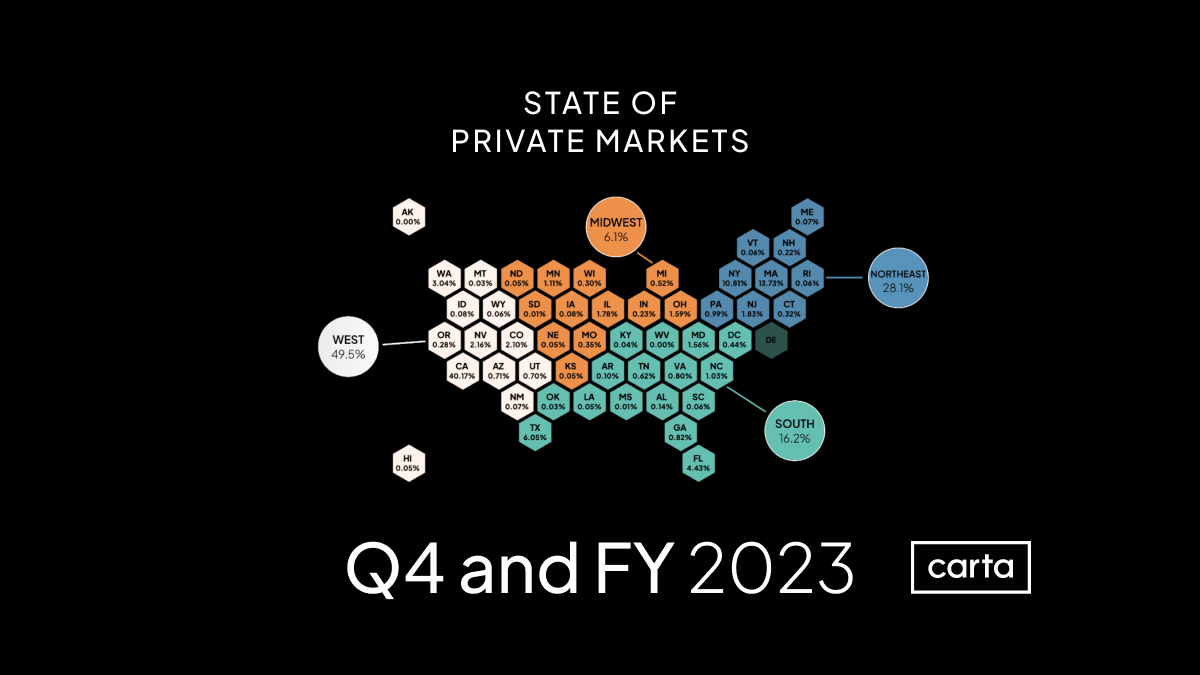
While California retained its usual place at the top of the fundraising heap in 2023, the past year brought a new runner-up. Startups based in Massachusetts raised 13.75% of all capital over the course of 2023, as the Bay State sailed past New York into second place on the national leaderboard.
Two of the year’s other biggest gainers were Texas and Florida. In 2022, each state accounted for 3.2% of all funding. In 2023, Texas’s share climbed to 6.05%, and Florida’s rose to 4.43%. Ohio, New Jersey, and Nevada were other states that saw their share of startup fundraising climb significantly in 2023.
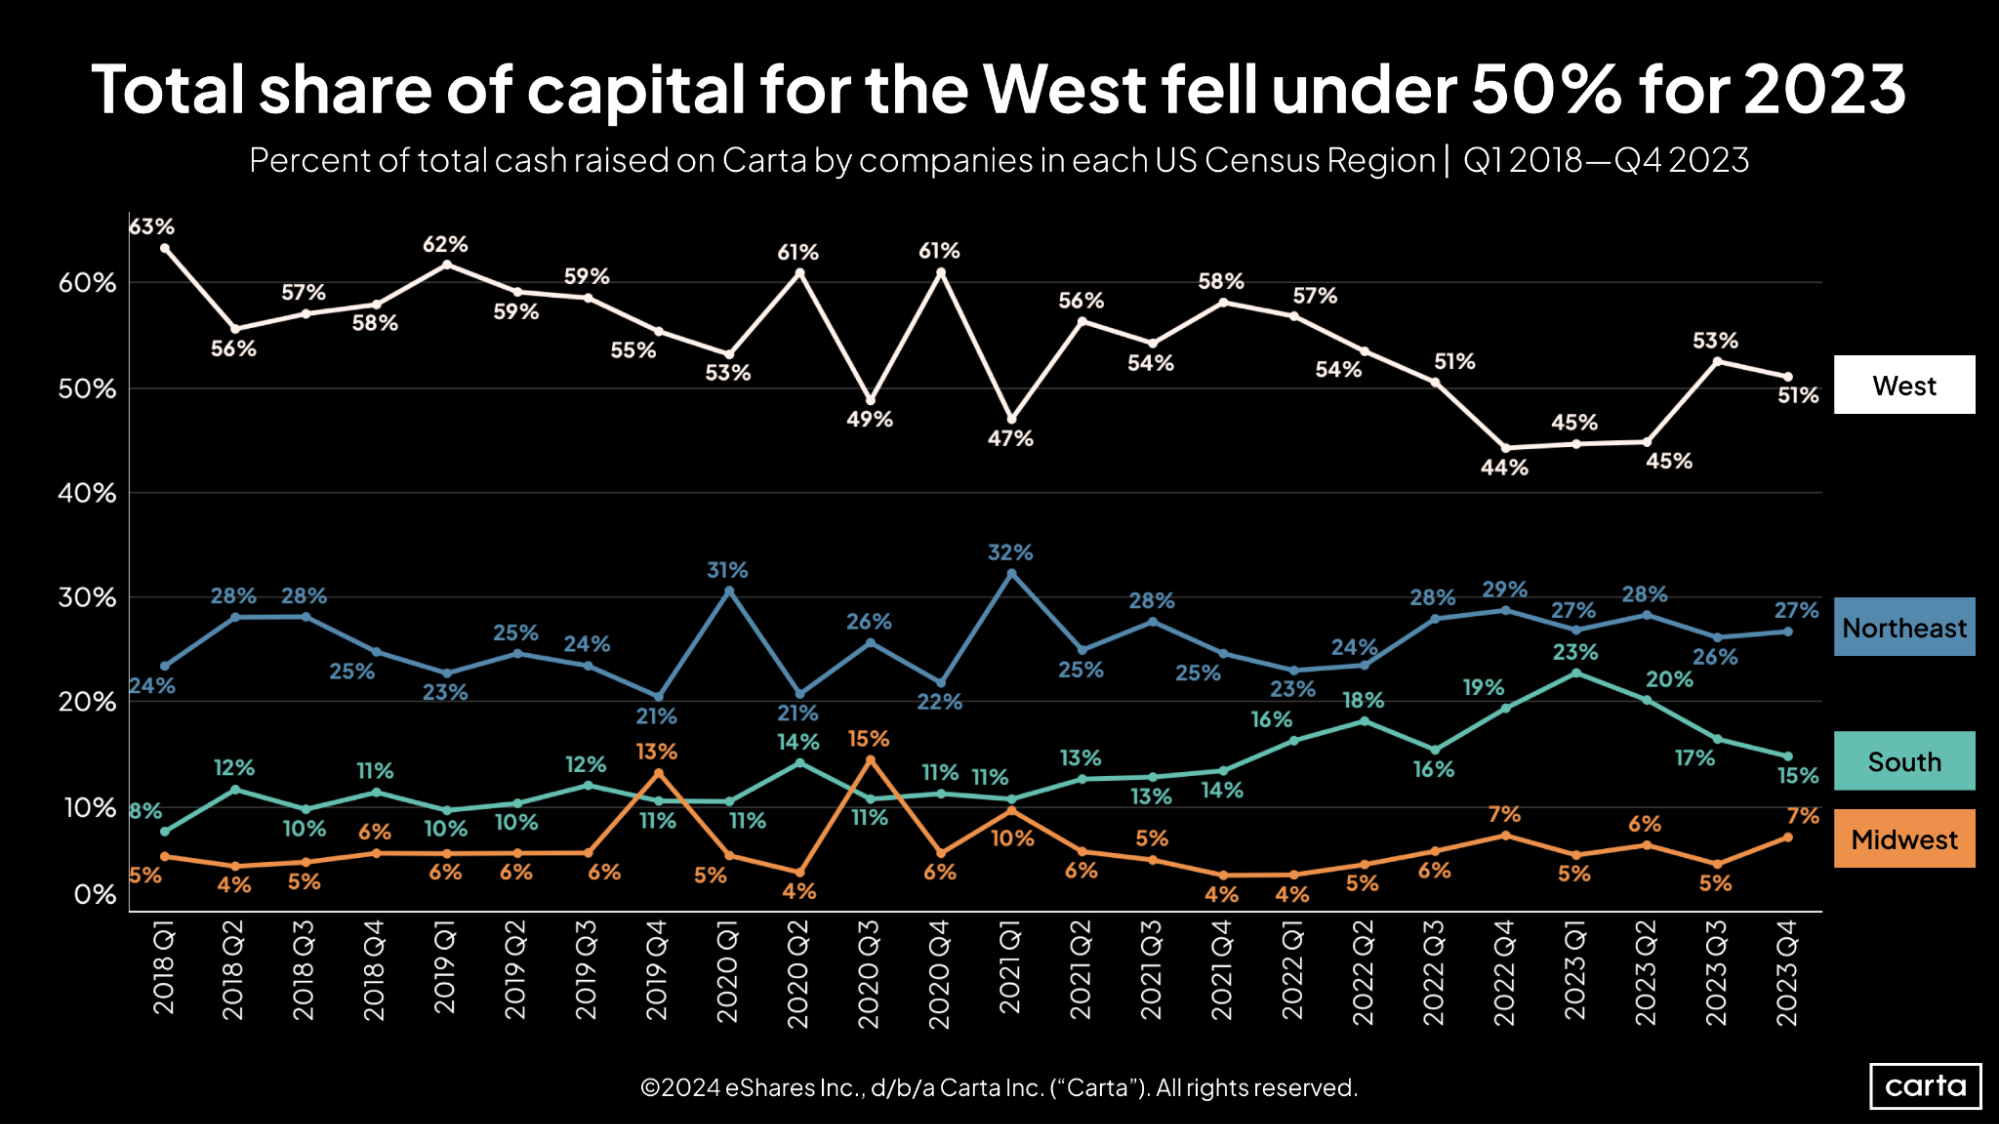
Startups in the South raised 16.2% of all capital in the U.S. over the course of 2023, up from 15.5% the year prior. But despite that annual uptick, the South’s market share has now decreased for three straight quarters, dipping to 15% in Q4 2023, its lowest quarterly mark in two years.
Conversely, the Midwest’s market share grew to 7% in Q4, tied for its highest point in more than two years. The Northeast also brought in a slightly larger portion of all capital in Q4, but that region’s market share has largely held steady over the past year and a half.
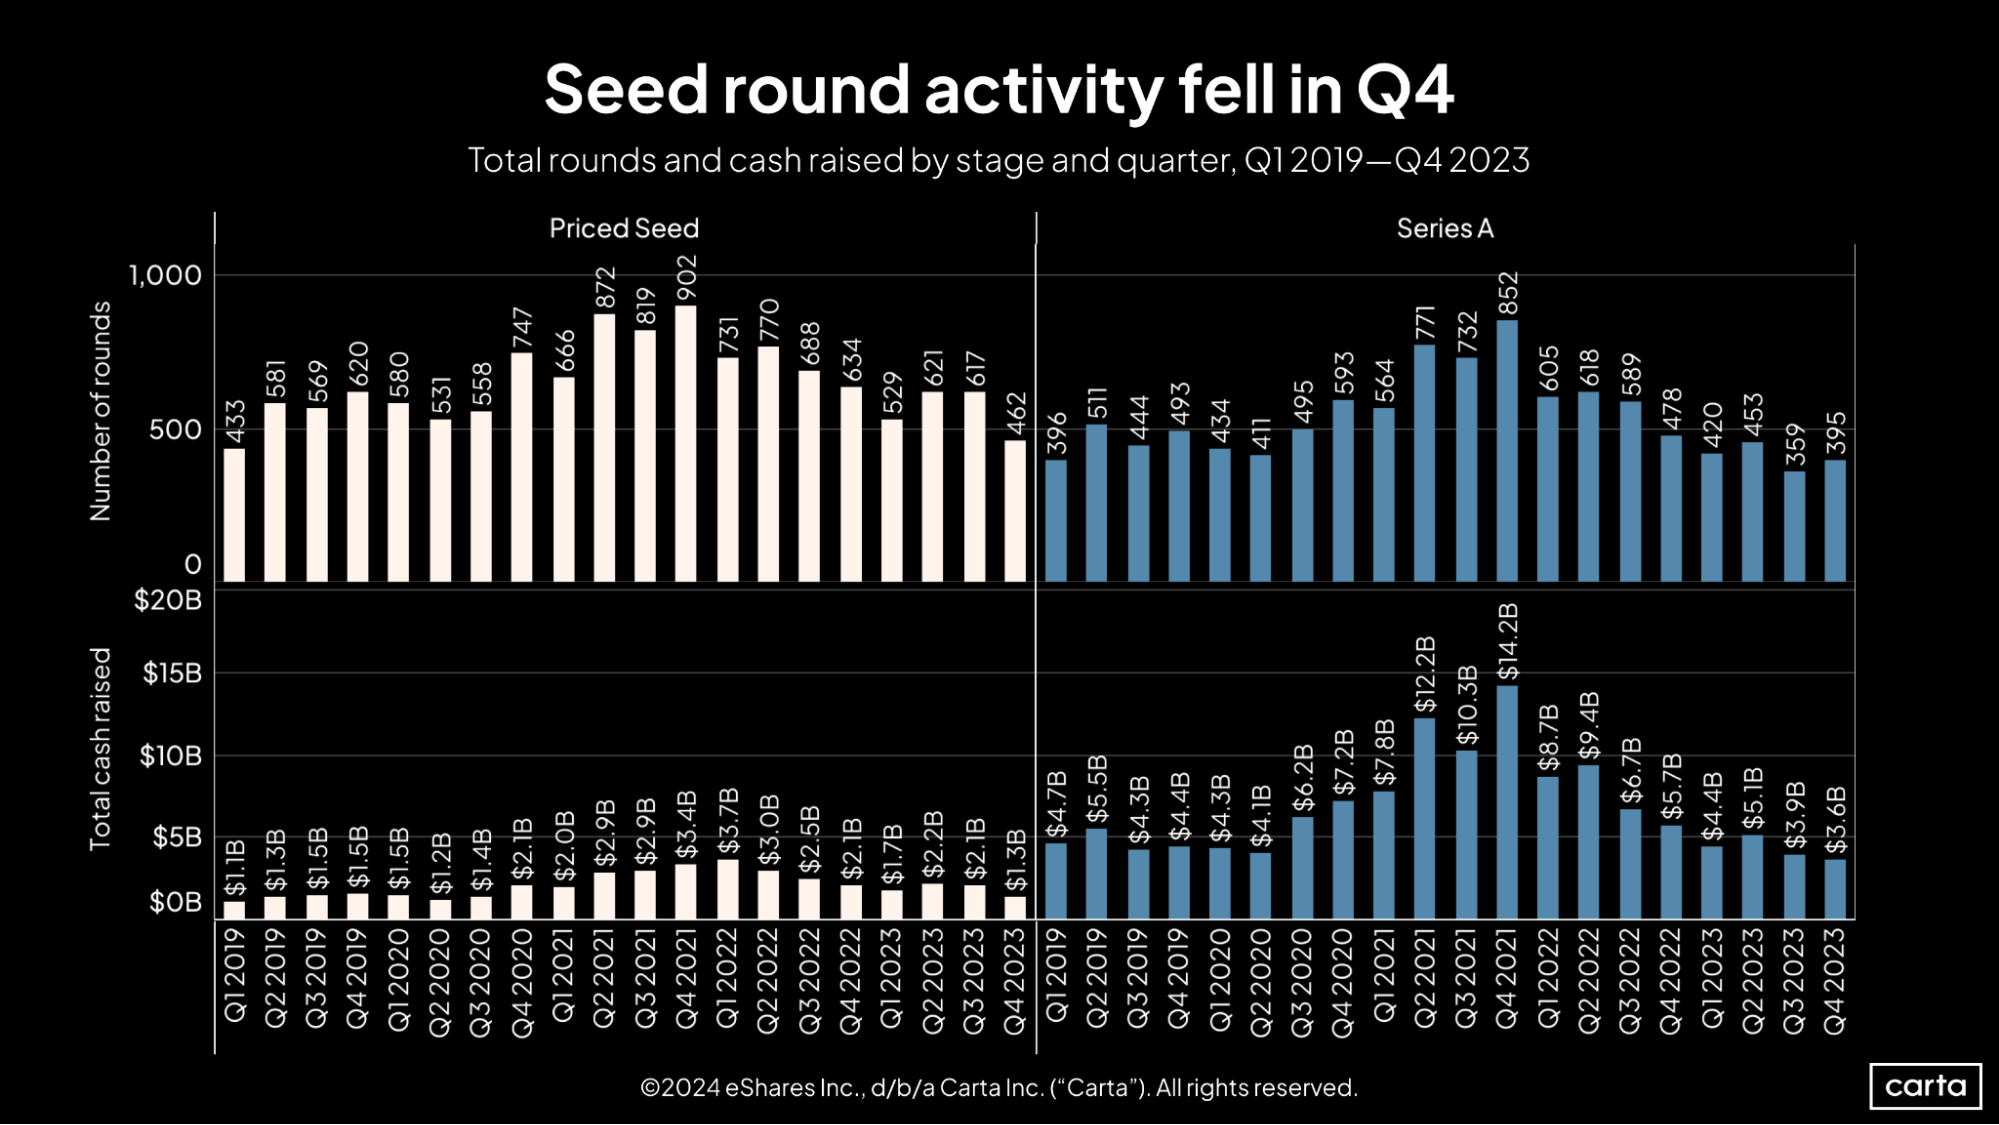
The earliest stages of startup life are typically more insulated from macroeconomic upheaval than later stages. But no stage has been immune from the recent market slowdown.
The number of priced seed rounds on Carta fell to 462 during Q4, its lowest point since Q1 2019. And while the number of Series A rounds increased slightly compared to Q3, there were fewer than 400 deals in the quarter for the second consecutive quarter—a return to a slower pace of Series A dealmaking not seen since Q1 2019. Capital raised in Series A deals also fell to its lowest point in five years.
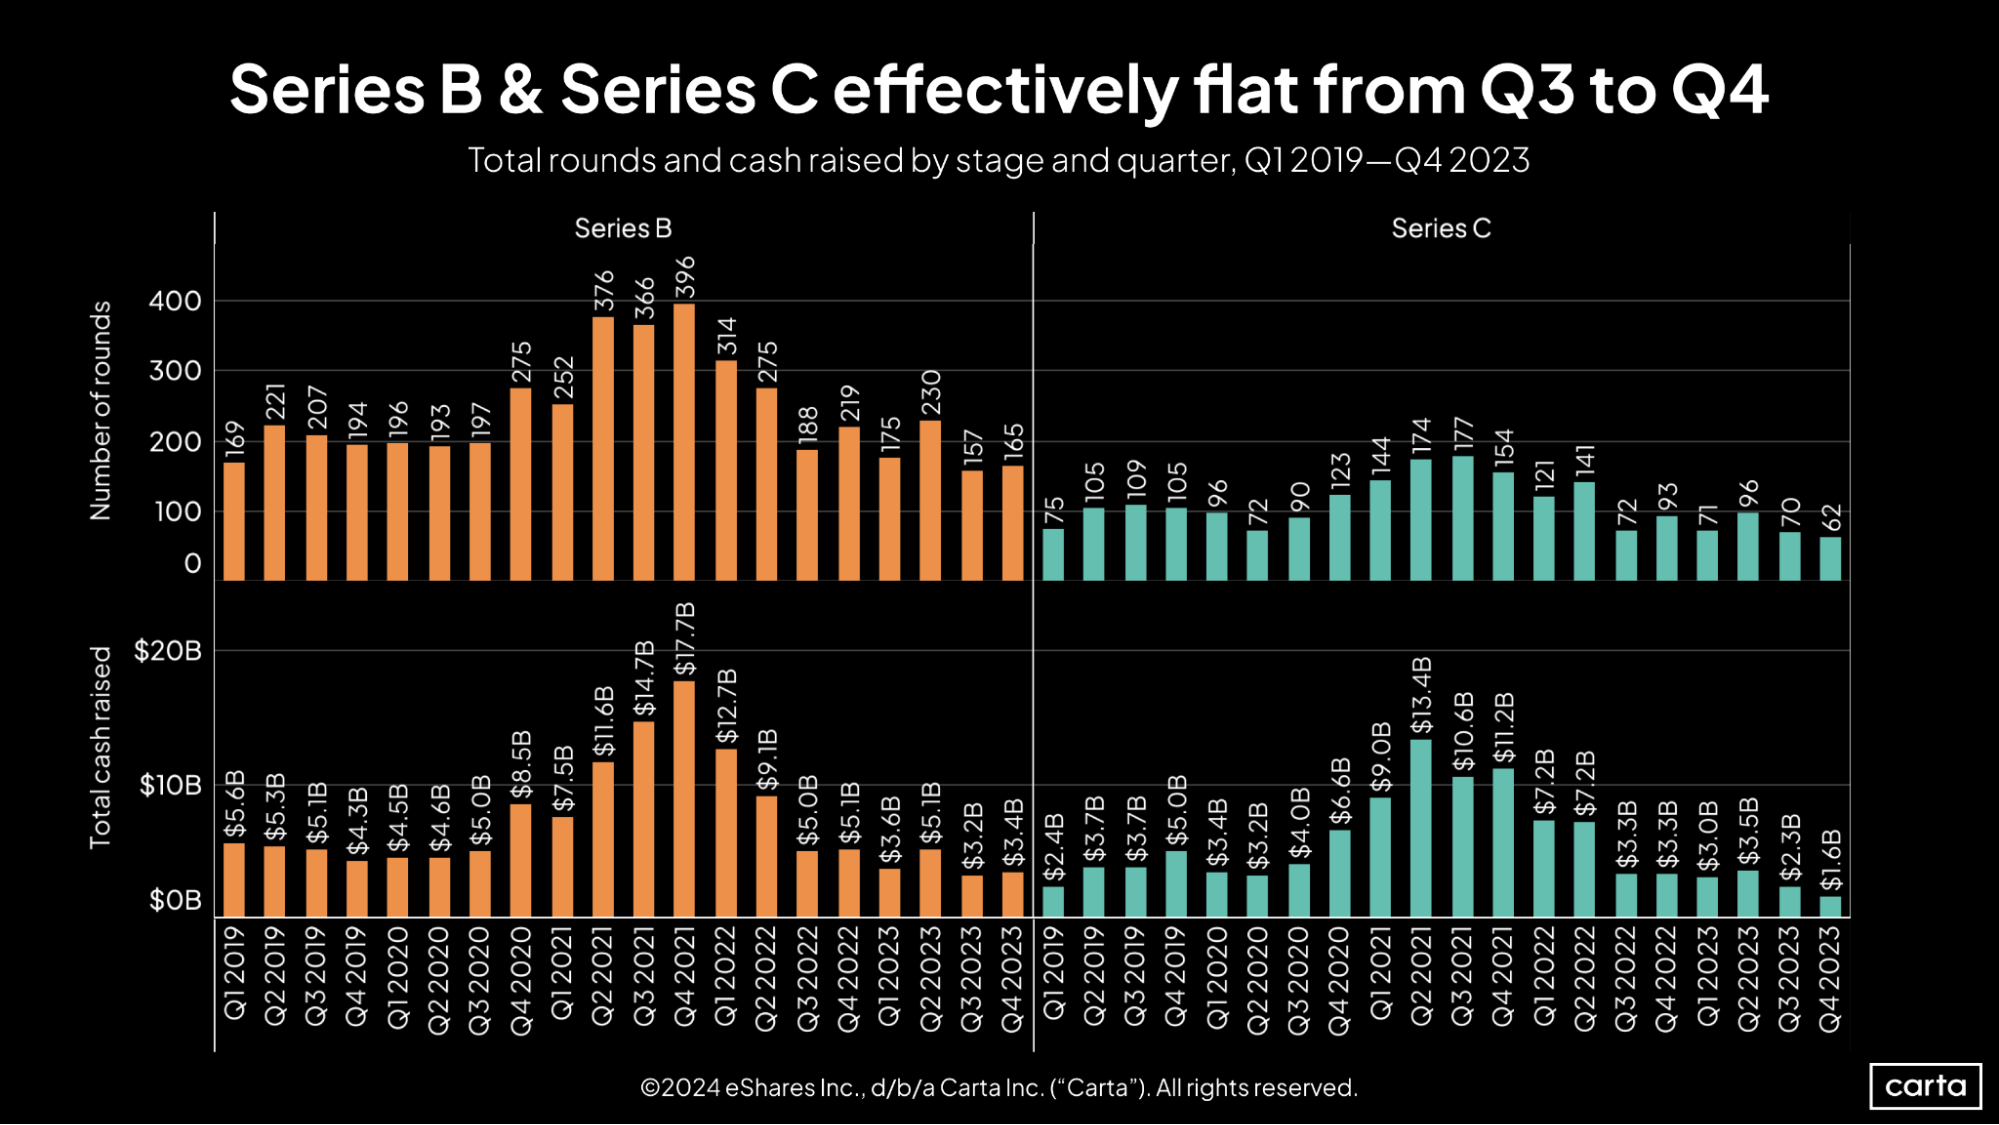
At both Series B and Series C, deal counts and capital raised remain low relative to the previous five years. In Q4, Series B startups combined to raise about $3.4 billion, while Series C startups brought in $1.6 billion. That’s the second-lowest quarterly total at Series B since the start of 2019, and at Series C, it’s the lowest.
On a year-over-year basis, Series B deal count was down 25% in Q4 and capital raised fell 33%. At Series C, deal count declined by 33% and cash raised by 52%.
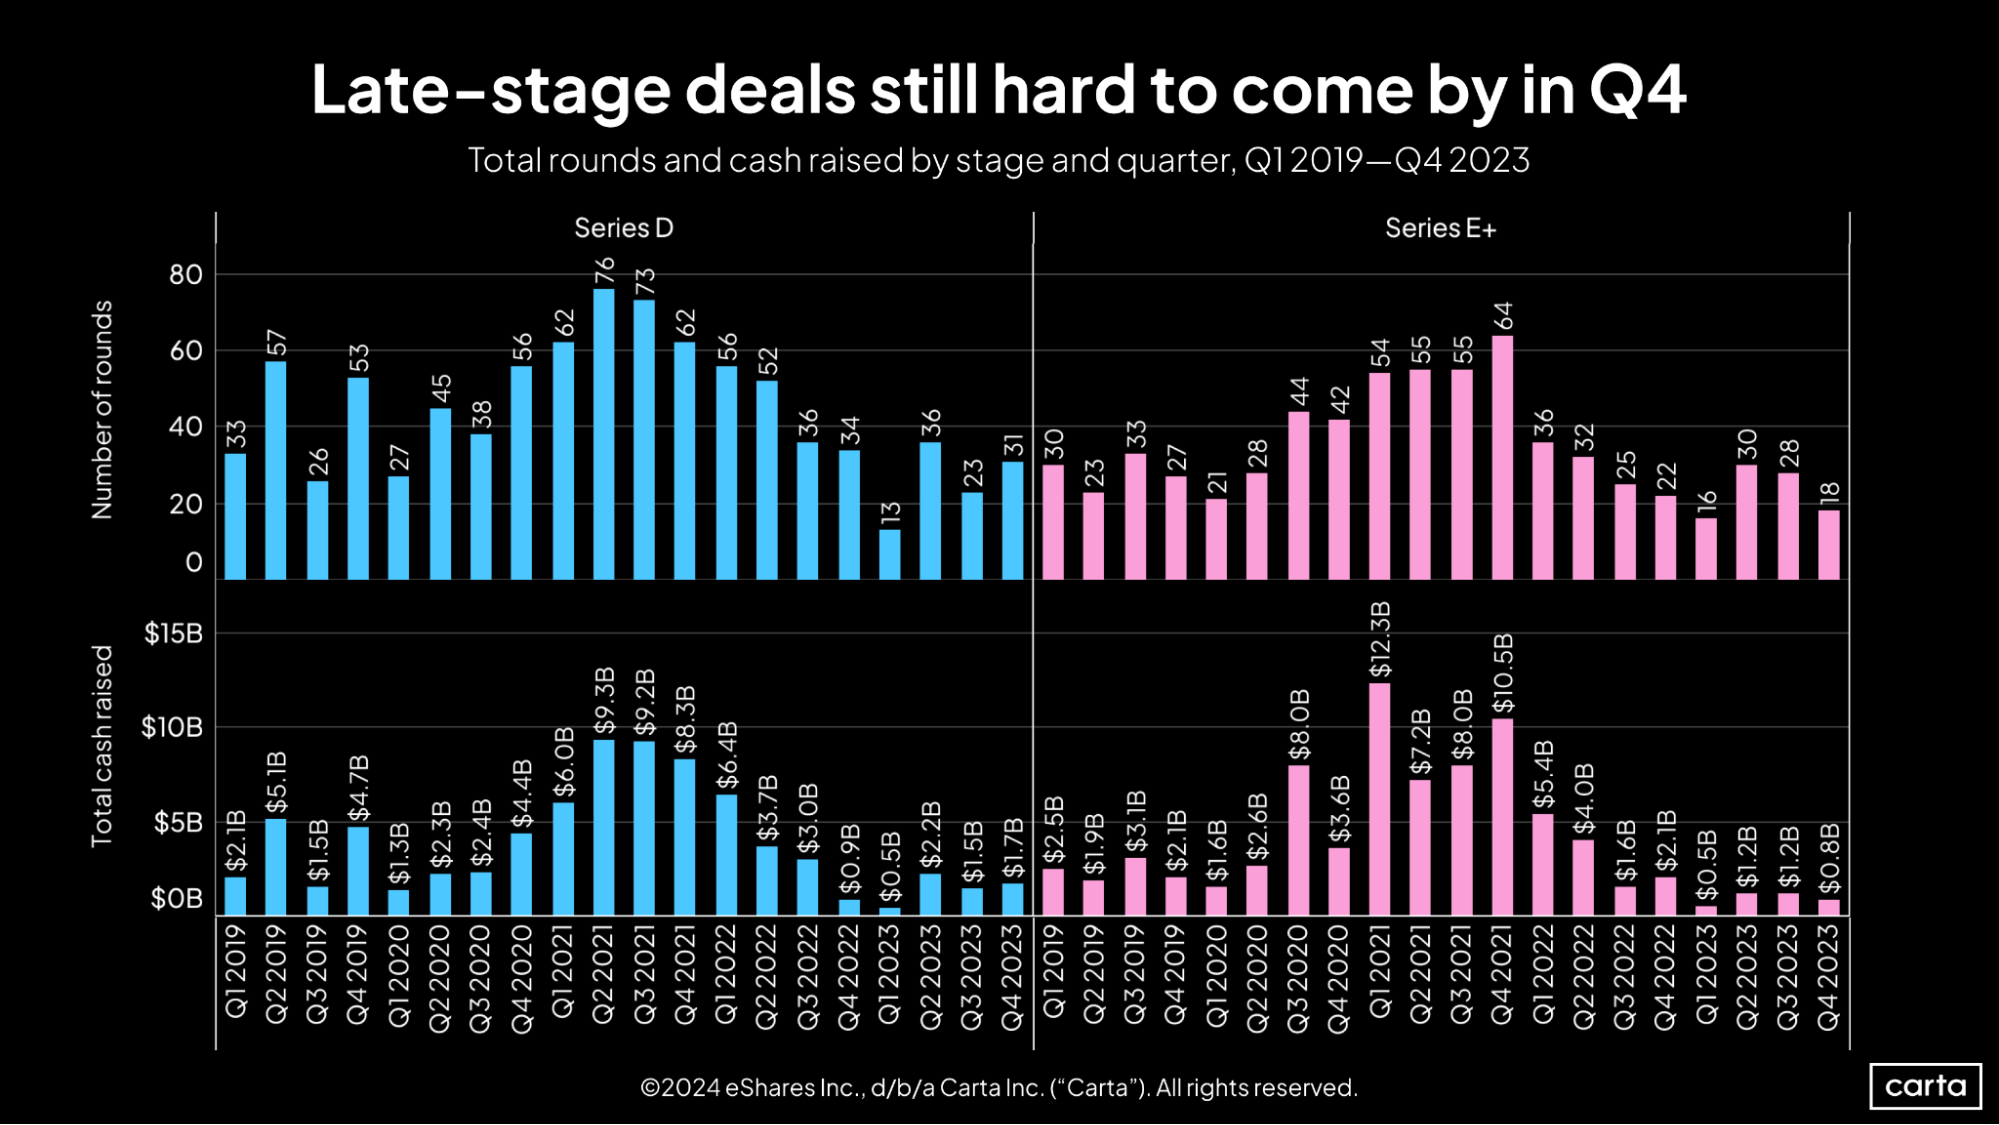
It appears the market for Series D fundings may have turned a corner after bottoming out in Q1 2023. The number of rounds and the value of capital raised have now both increased at Series D in two of the past three quarters.
New investments remain sparse at Series E and beyond, with just 92 such transactions on Carta throughout all of 2023. That’s down 20% from a year ago and a whopping 60% drop from the bull market of 2021.
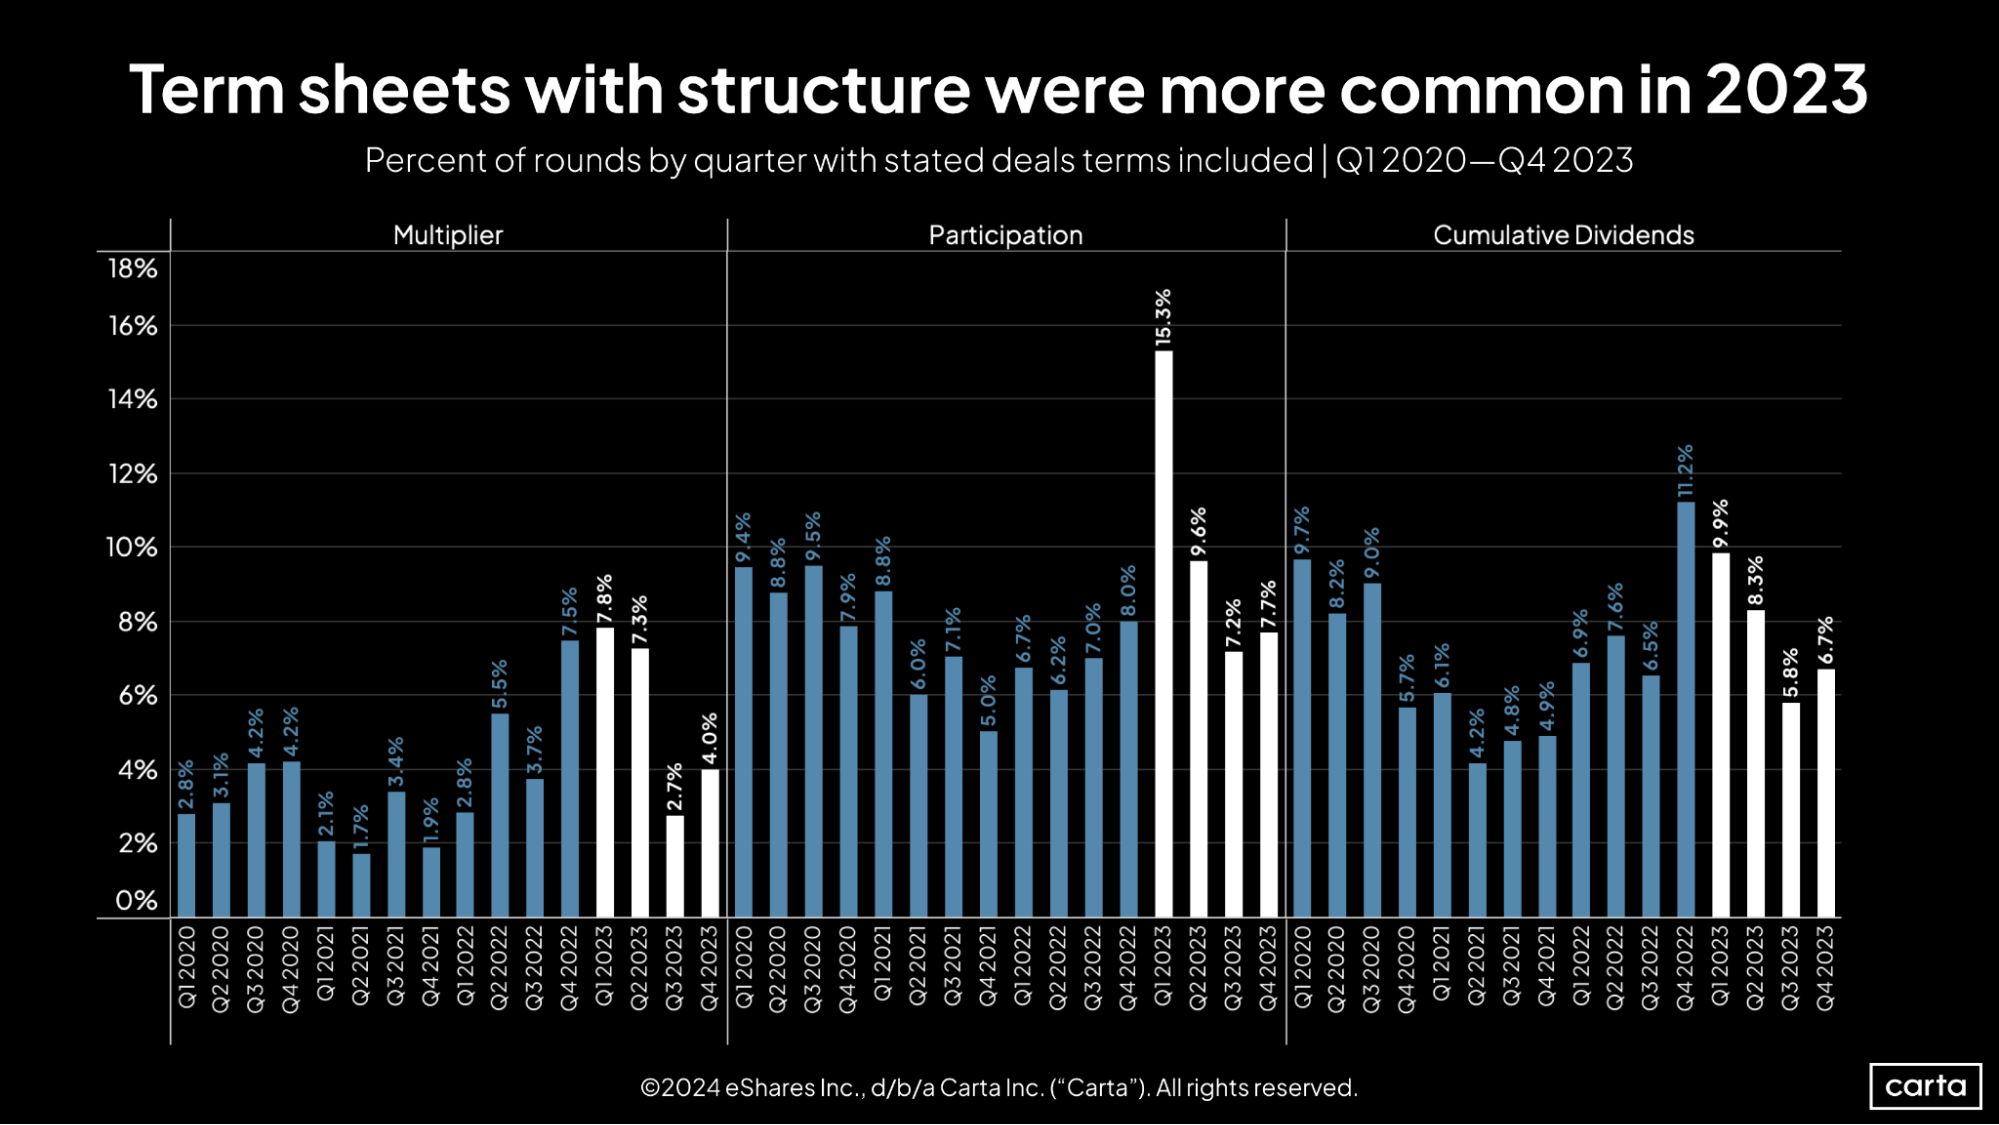
During late 2022 and early 2023, there was a relative surge in the frequency of structured deal terms like multipliers and cumulative dividends. These terms were still quite uncommon—they featured in less than 10% of all transactions—but they were more common than before.
The tide began to shift in the second half of the year, particularly with respect to multipliers. On the whole, structured terms were more common in 2023 than in past years, but it appears the market is already normalizing.
Fundraising & valuations
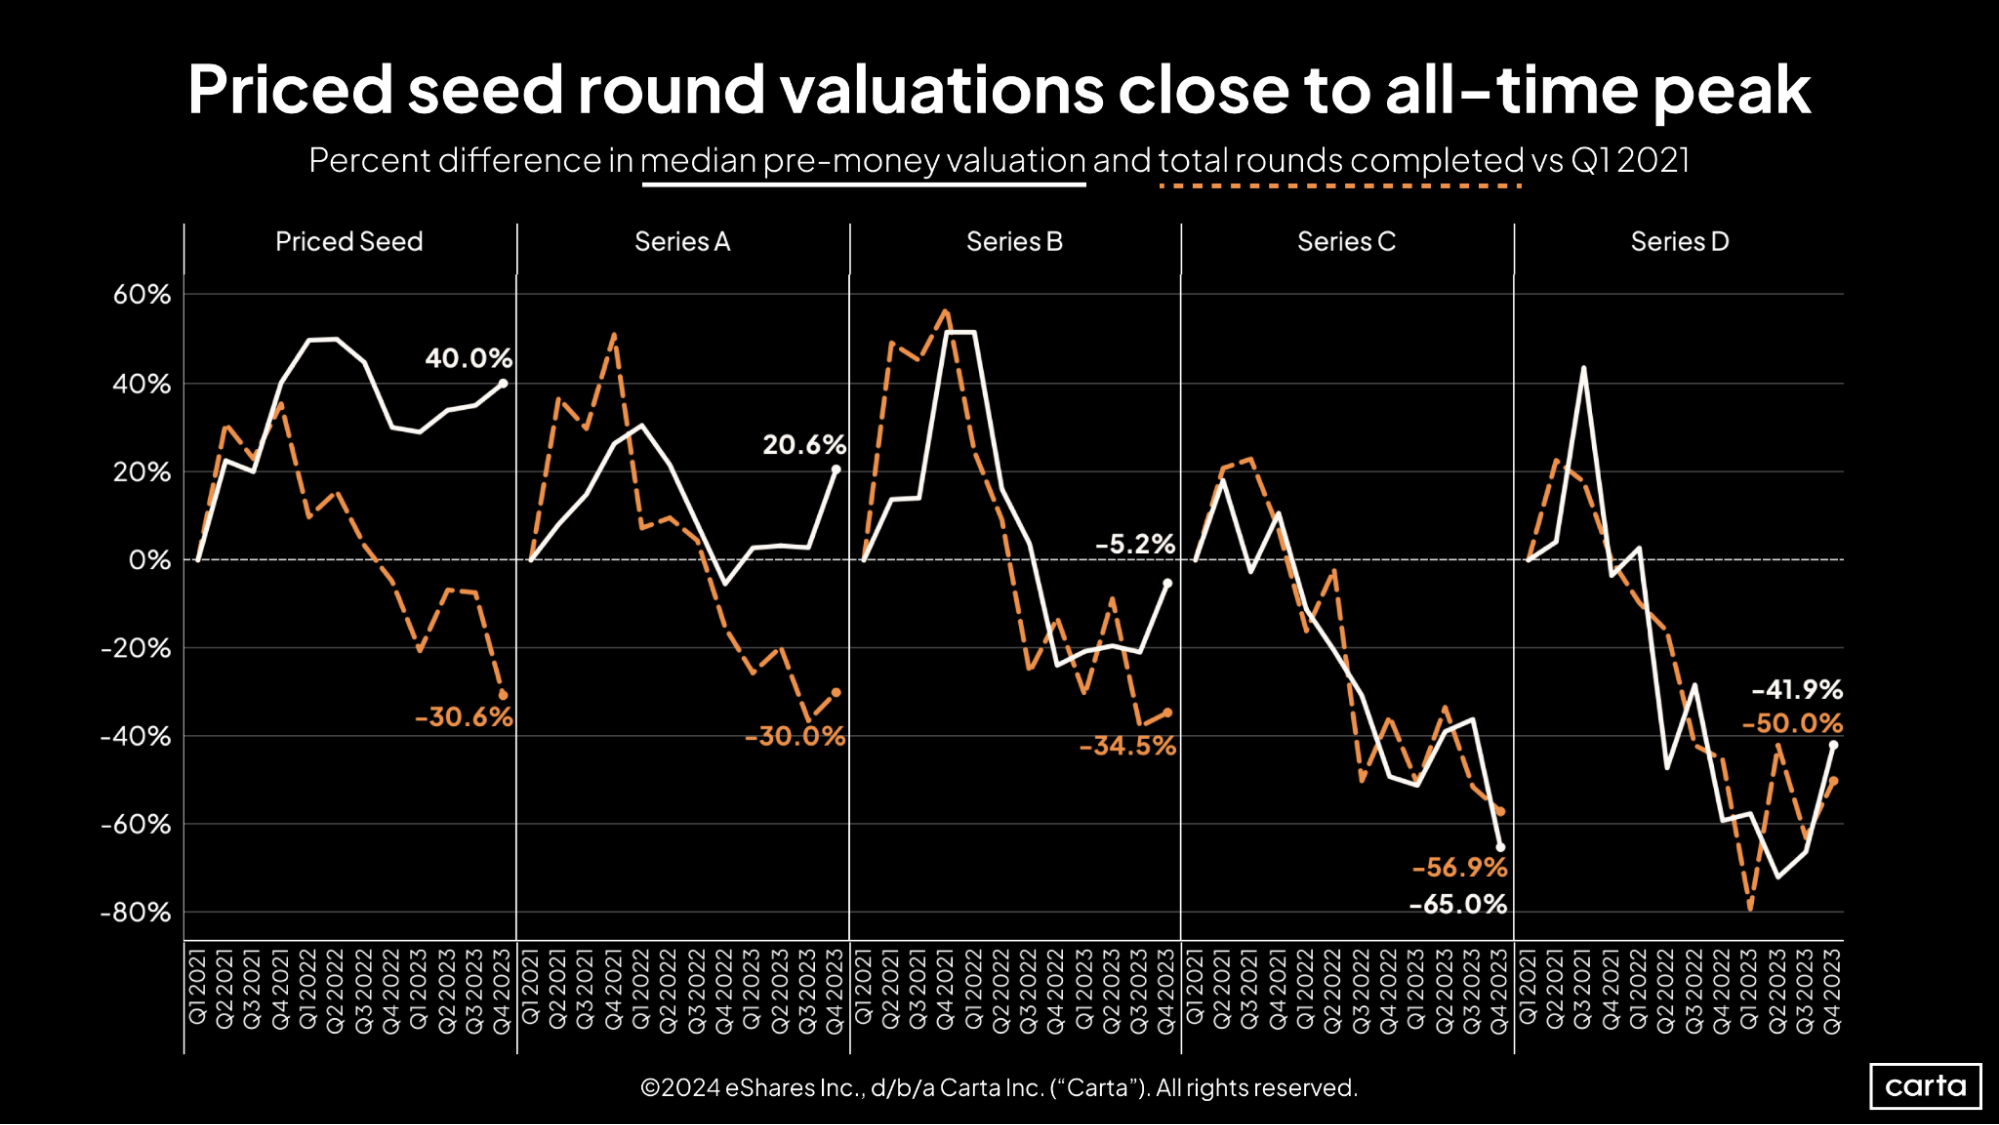
In terms of both median valuations and deal count, the startup fundraising market has changed considerably since the start of 2021. In general, the changes get more significant the further you progress in the venture lifecycle.
At seed, the median valuation inched up again in Q4 and is now 40% higher than it was nearly three years ago. Deal count, meanwhile, is down more than 30%. There’s no such mixed bag at Series D: There, the median valuation is down nearly 42%, and deal count has fallen by 50%.
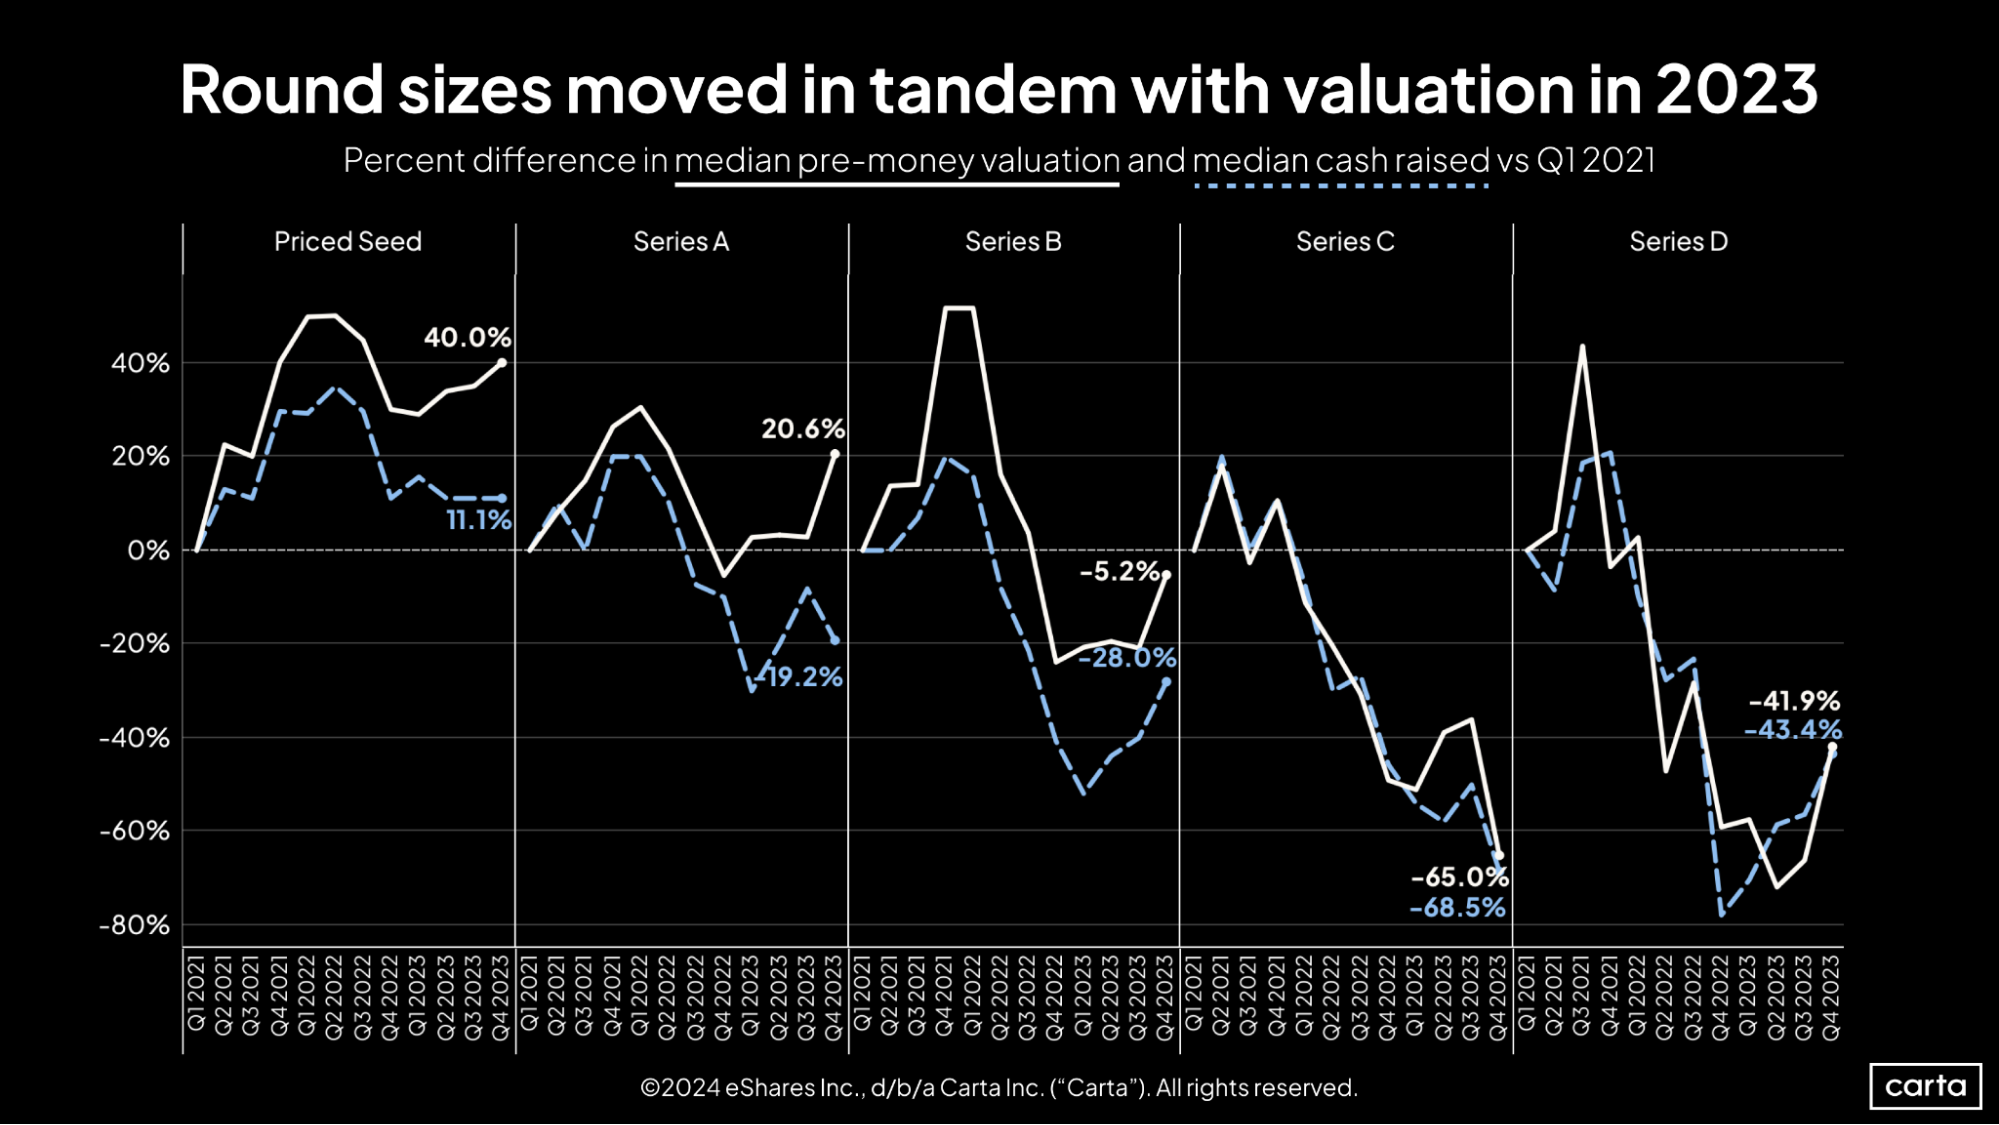
At the later stages of the startup lifecycle, median pre-money valuations have tracked closely with median round sizes over the past three years. There’s more divergence at the early stages, particularly Series A, where valuations are up about 20% since the start of 2021 and round sizes are down about 20%. At Series B and Series D, both valuations and round sizes showed positive momentum after steep fall-offs in 2022. At Series C, however, the statistical declines that began in 2022 persisted in 2023.
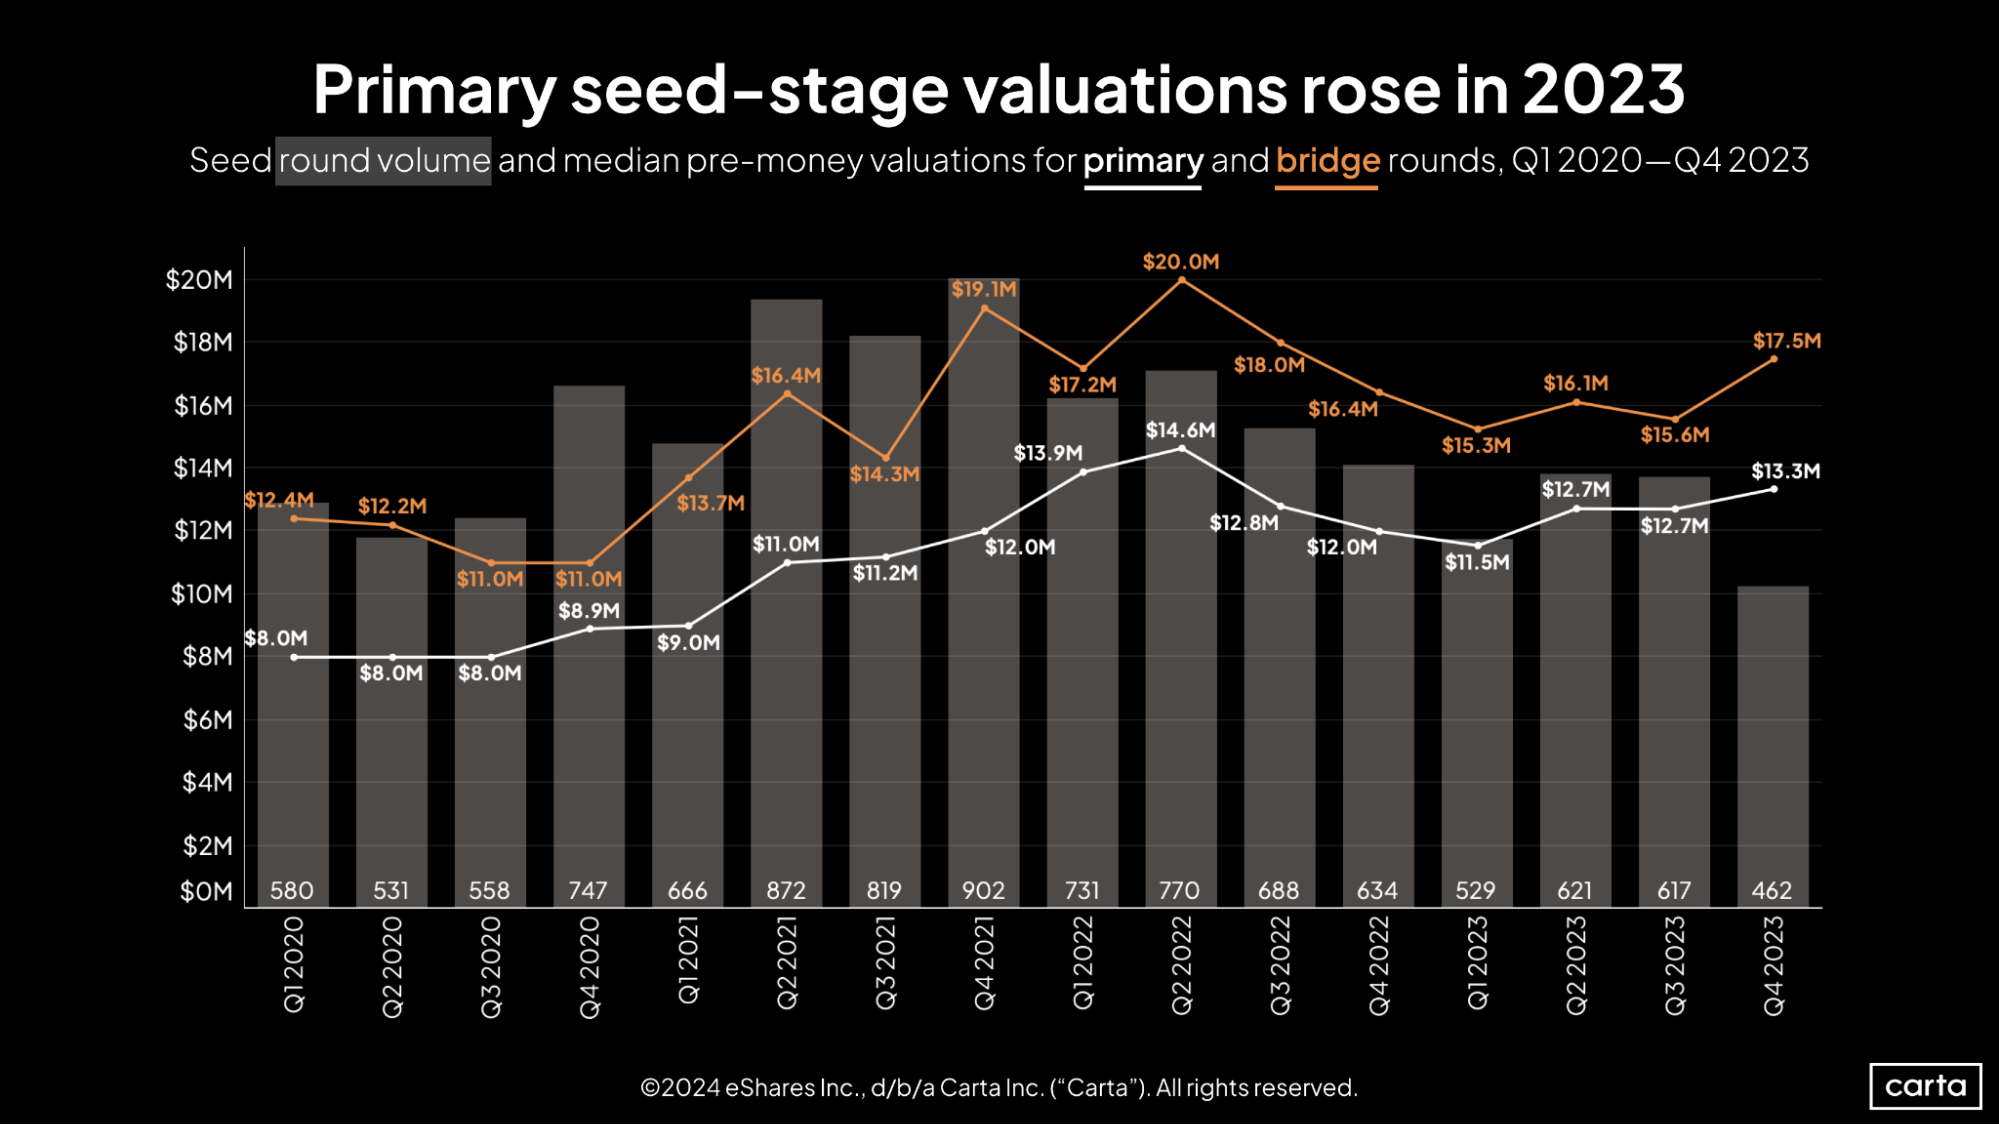
While deal count took a notable dip at the seed stage in Q4, the median pre-money valuation on primary funding rounds continued to climb, reaching $13.3 million. That’s the third-highest quarterly median so far this decade. There were ups and downs in 2022, but on a longer timeline, the median seed valuation on primary deals has been trending steadily upward for the past four years.
The median valuation on bridge rounds raised by seed companies also jumped in Q4, reaching $17.5 million. Seed is the only stage where the median bridge valuation has been higher than the median primary valuation in every quarter since the start of 2020.
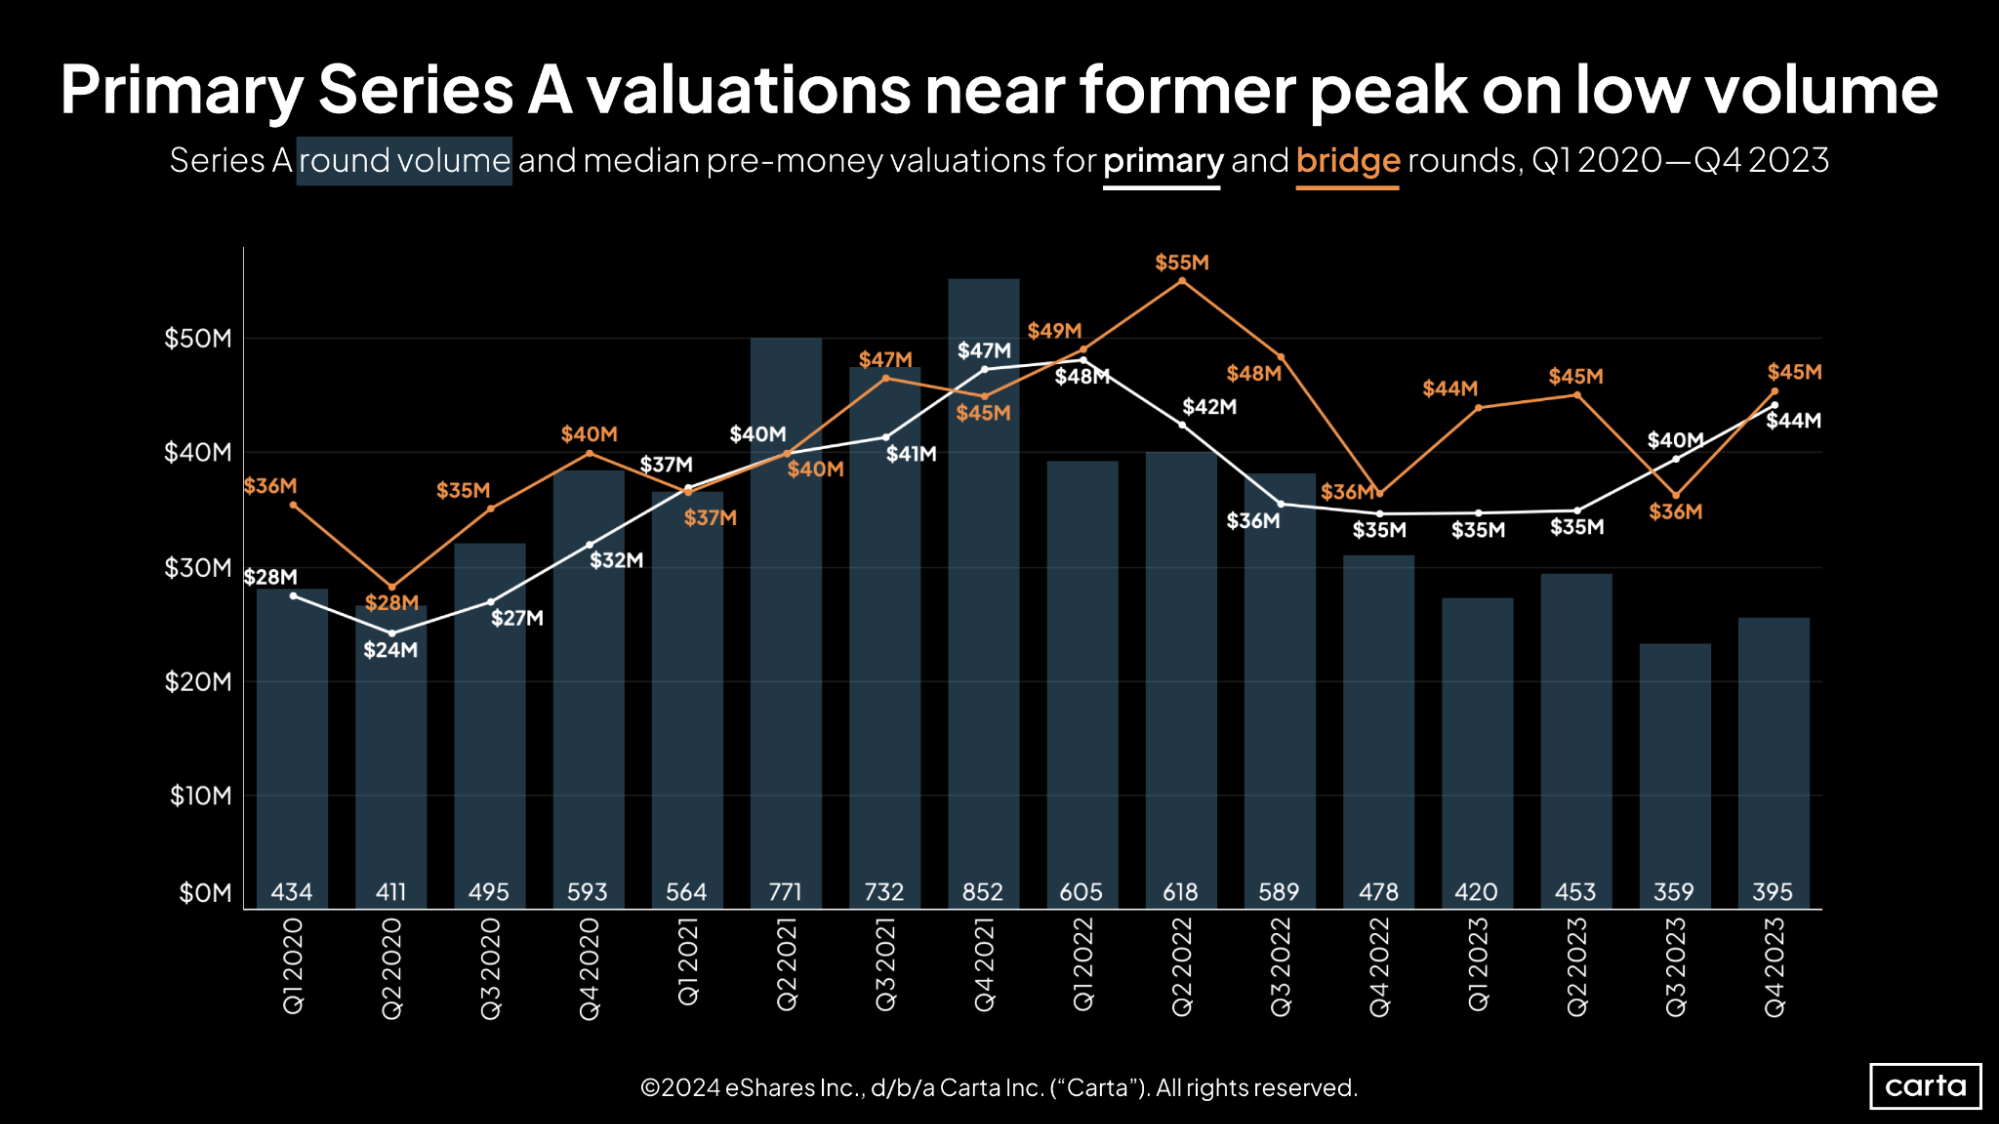
The median pre-money valuation on primary Series A fundings was $44 million in Q4. Just like at the seed stage, this was the third-highest quarterly median since the start of 2020. After staying flat around $35 million for several consecutive quarters, valuations have now grown significantly over the past two quarters.
The recent history of Series A bridge valuations has been more volatile, including a 25% quarter-over-quarter increase in Q4. About 45% of all Series A fundings in Q4 were bridge rounds, the highest rate on record.
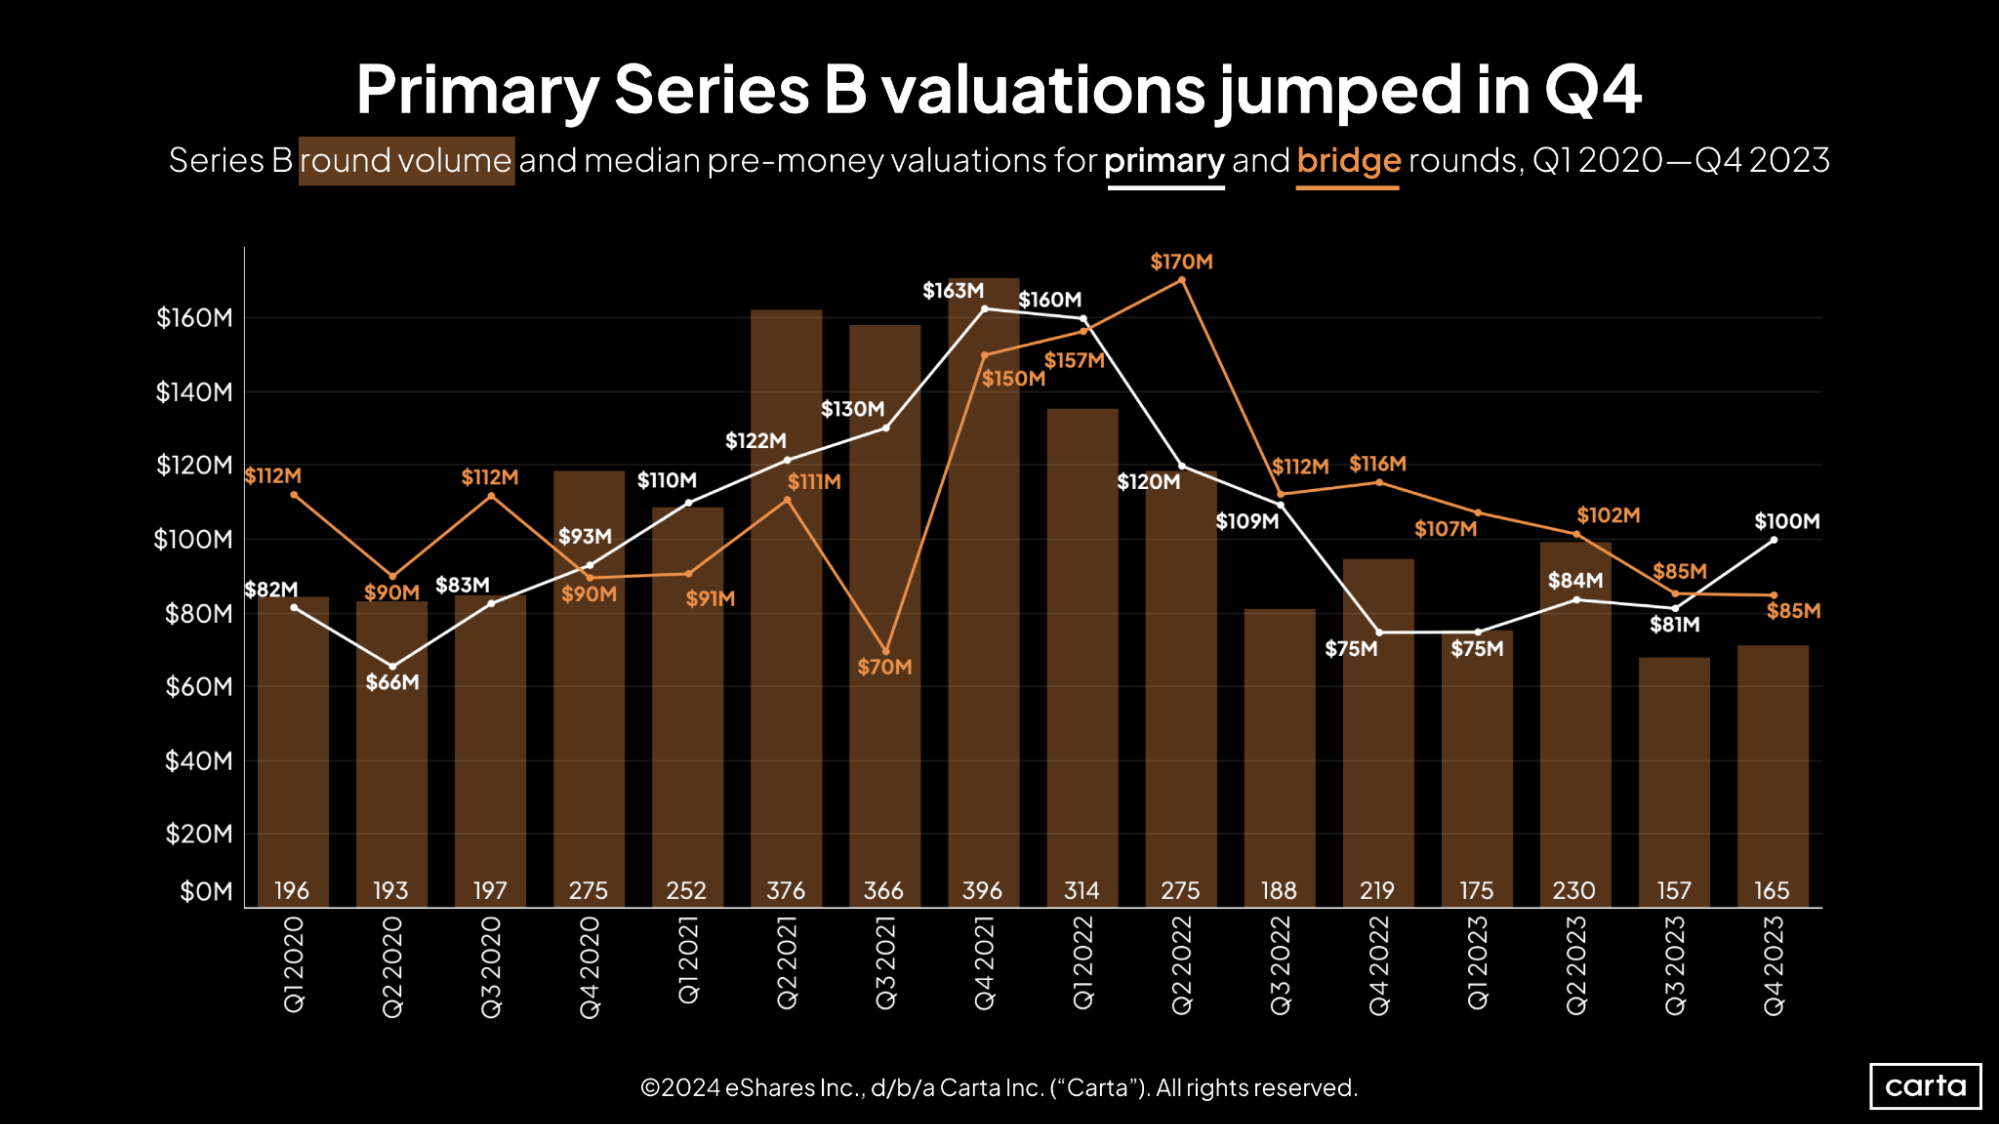
Bridge rounds were also quite popular among Series B startups in Q4. But valuations were not as promising as they were at Series A. The median pre-money valuation on Series B bridge fundings has now declined for four straight quarters, dropping to $85 million in Q4.
Conversely, the median valuation for primary Series B deals jumped by 23% in Q4, reaching its highest point in the past five quarters. The median primary valuation was larger than the median bridge valuation in Q4, continuing a historical seesaw. For the previous six quarters, bridge valuations had been higher than primary valuations; before that, primary valuations had been higher than bridge valuations for six quarters.
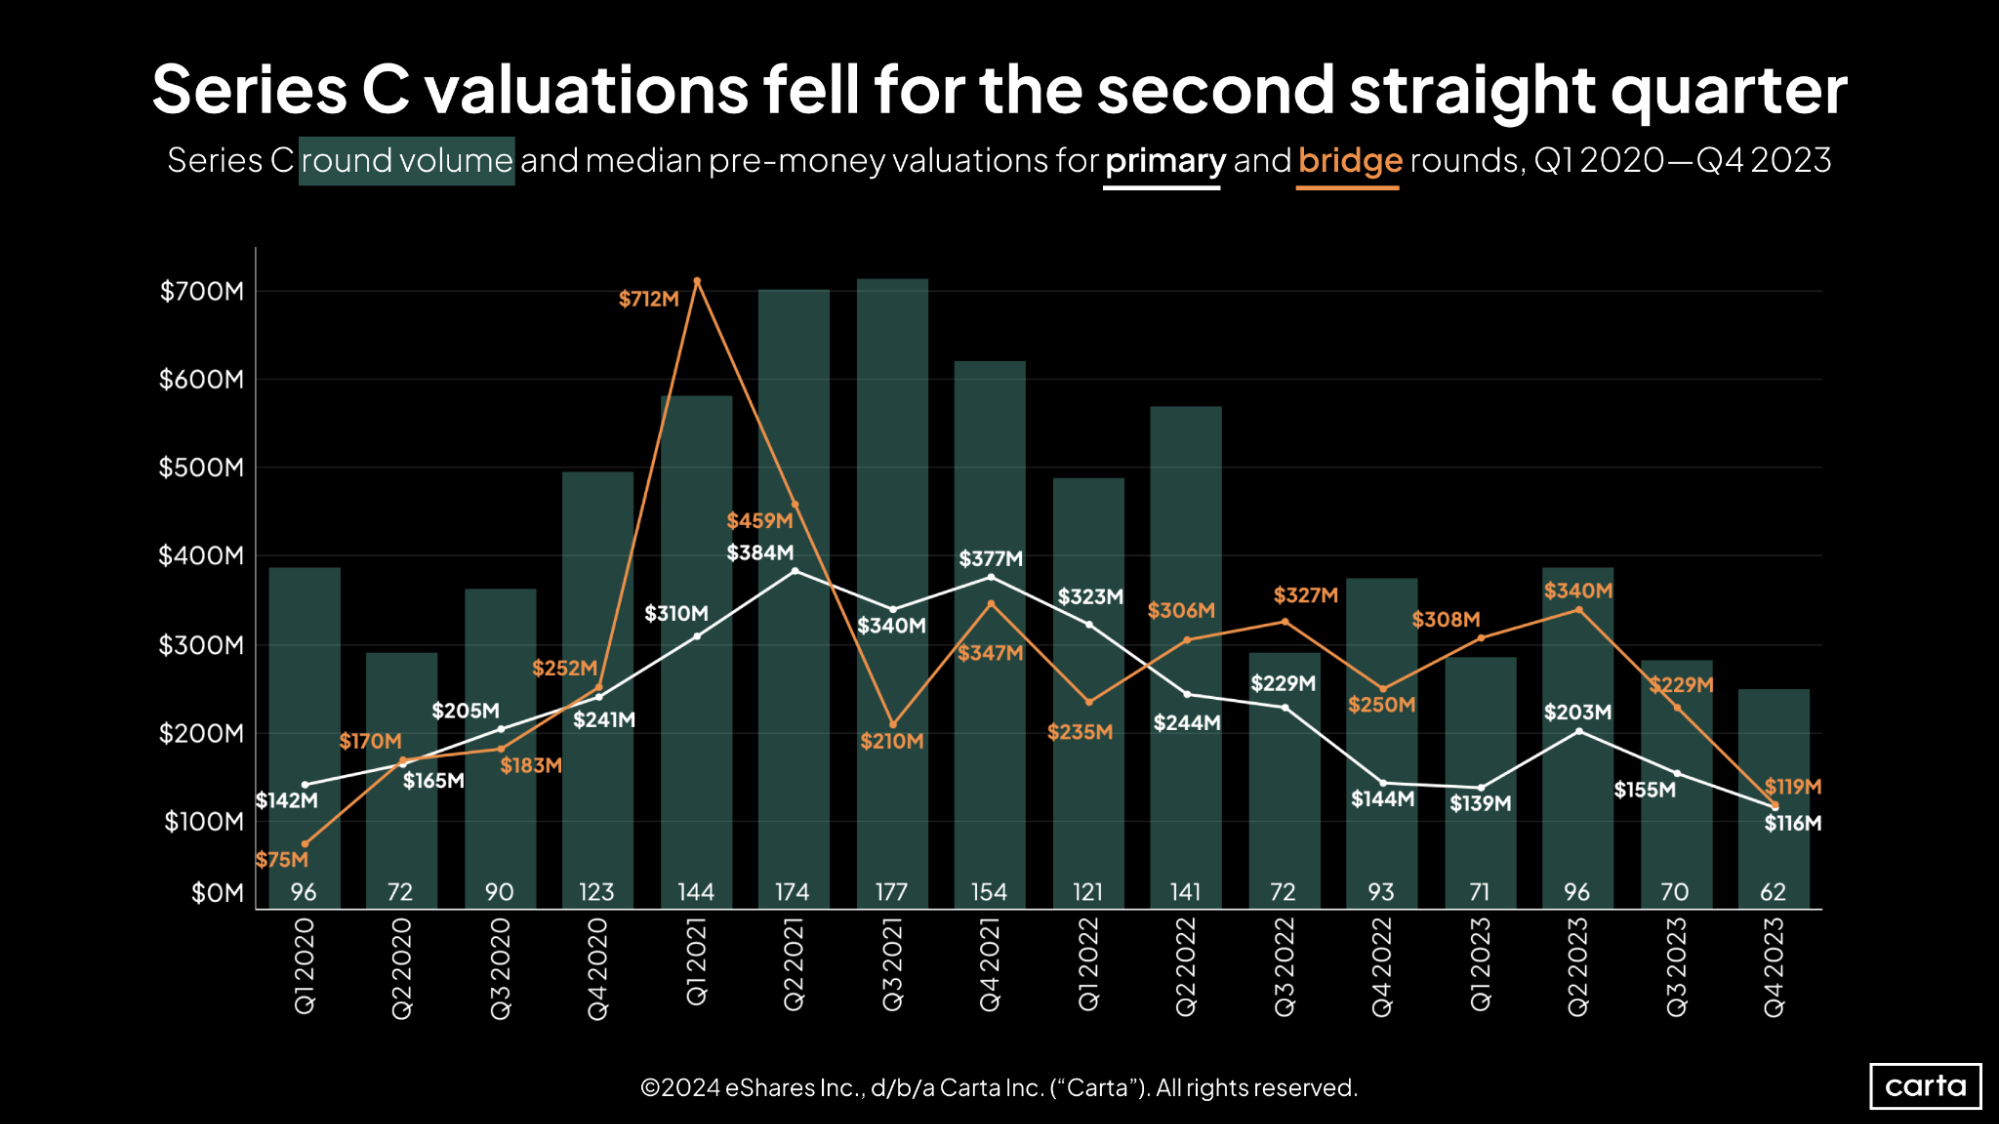
It was a difficult year all around for startups raising Series C funding. In Q4, the median primary valuation at Series C fell to its lowest point of the past four years, and the median bridge valuation fell to its second-lowest point of the past four years. Deal count also fell to its lowest point of the past four years.
Primary valuations are down 19% year over year, while bridge valuations have fallen by 52%. While seed, Series A, and Series B have all shown at least some positive recent momentum, the median primary valuation at Series C has declined in seven of the past eight quarters.
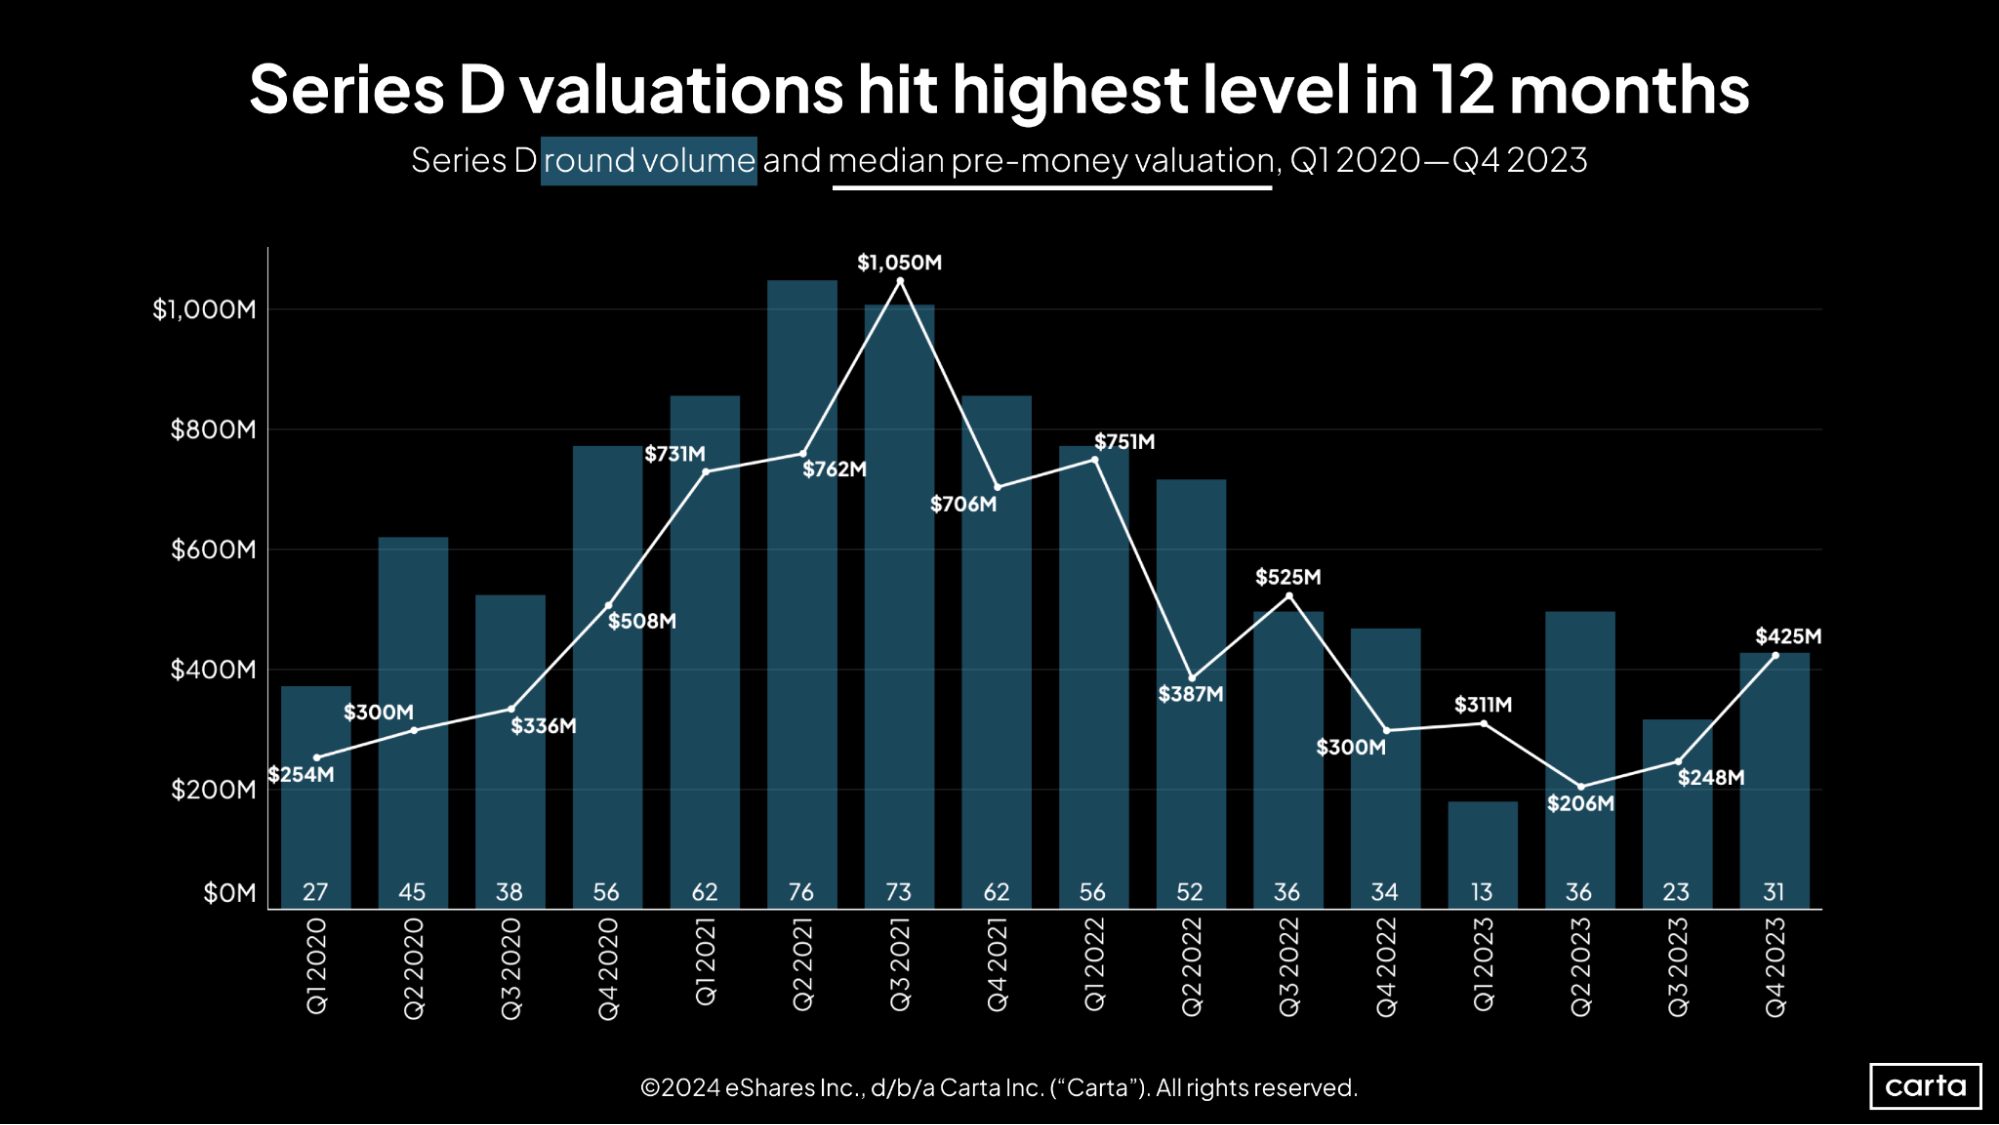
After several months in the doldrums, the Series D market picked up some speed in Q4, with the median valuation rising 71% compared to the previous quarter. Deal count also climbed 35%.
The number of Series D investments had plunged to the lowest volume of the decade in Q1 2023, and the median valuation sank to its lowest point of this decade in Q2. Since then, both metrics have shown signs of positive momentum.
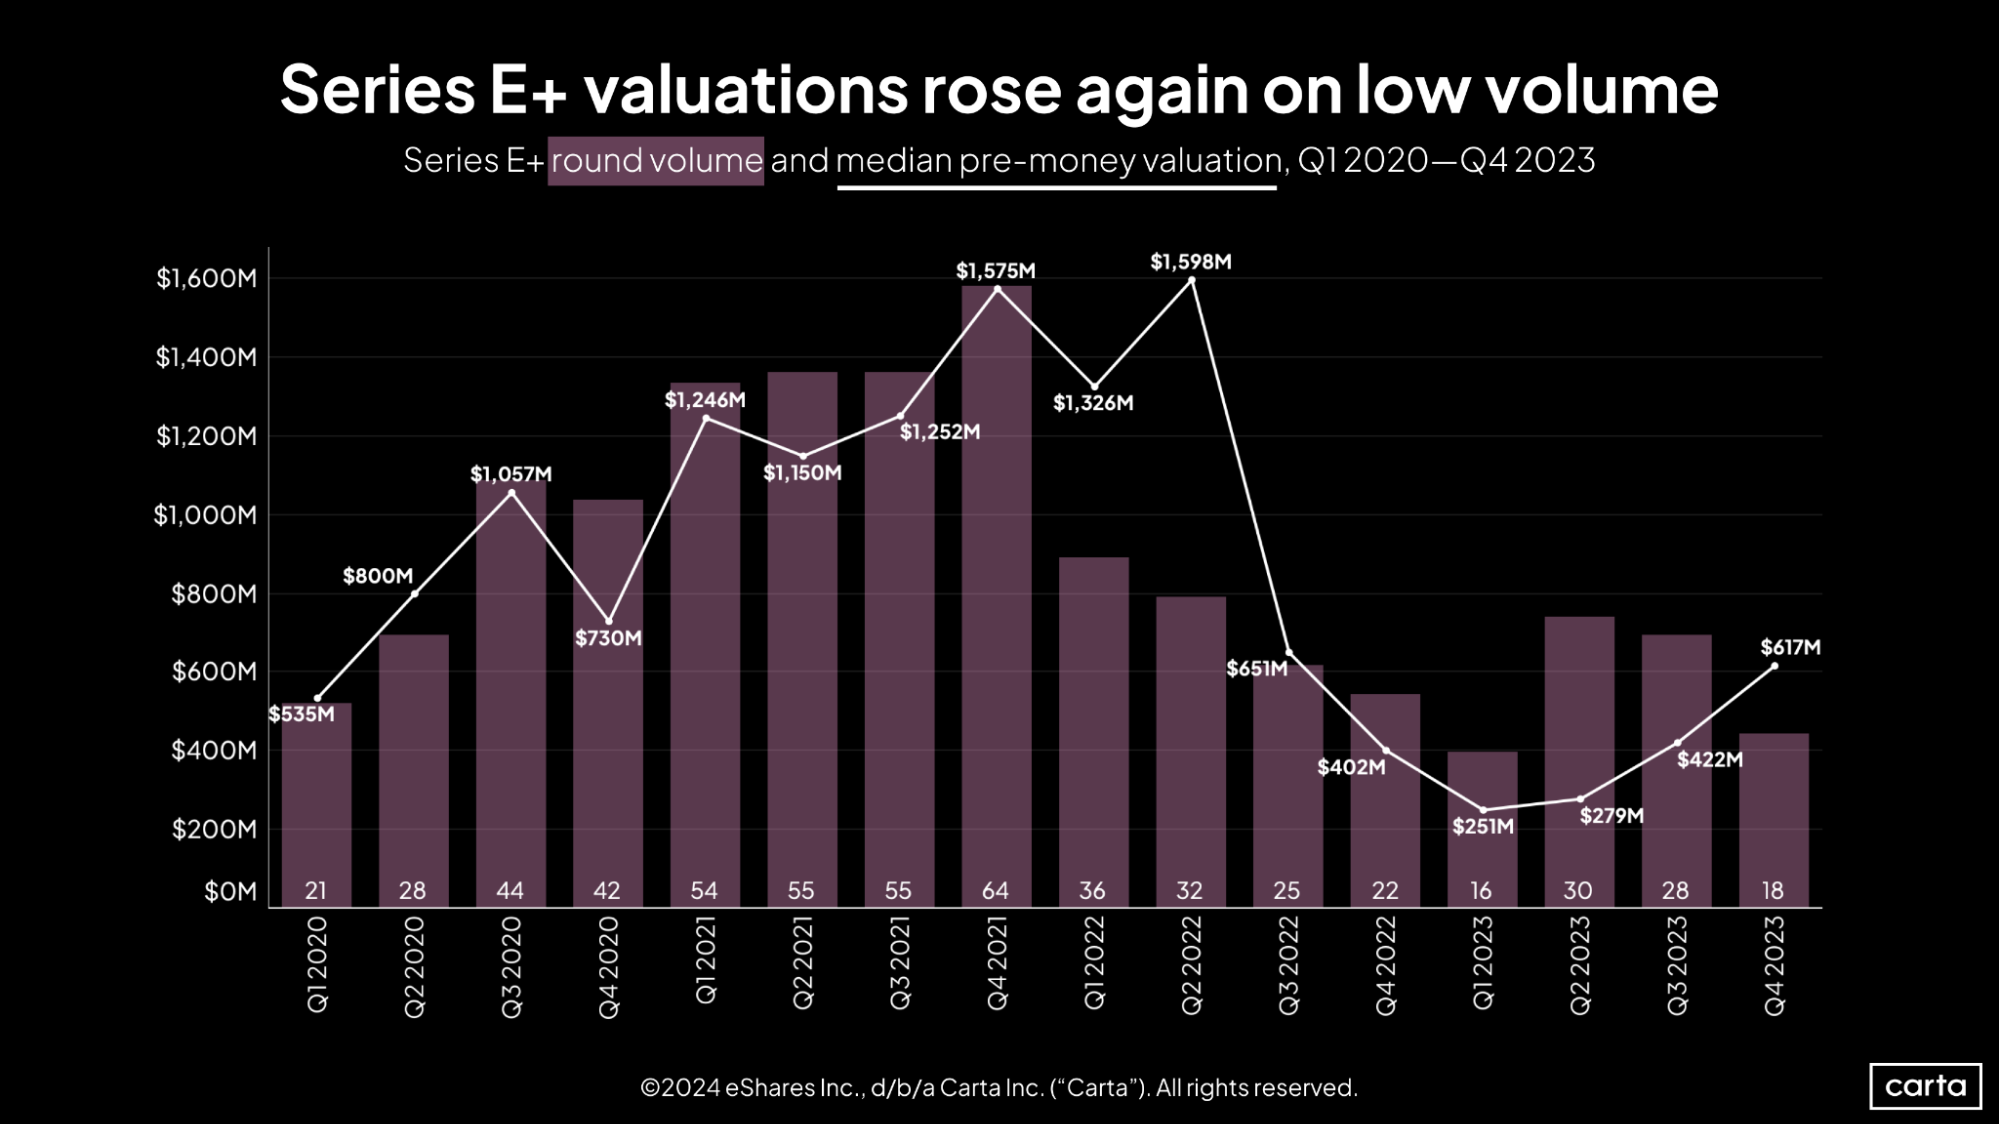
While late-stage deal counts remained low throughout 2023, valuations spent most of the year in a state of steady ascent. The median pre-money valuation at Series E and beyond reached $617 million in Q4, good for a 53% year-over-year increase.
Even with that increase, the median valuation at Series E+ is still less than half of what it was for most of 2021 and 2022. Unless valuations skyrocket in the quarters to come, expect down rounds to remain quite common for mature private companies that raised VC funding during the heat of the bull market.
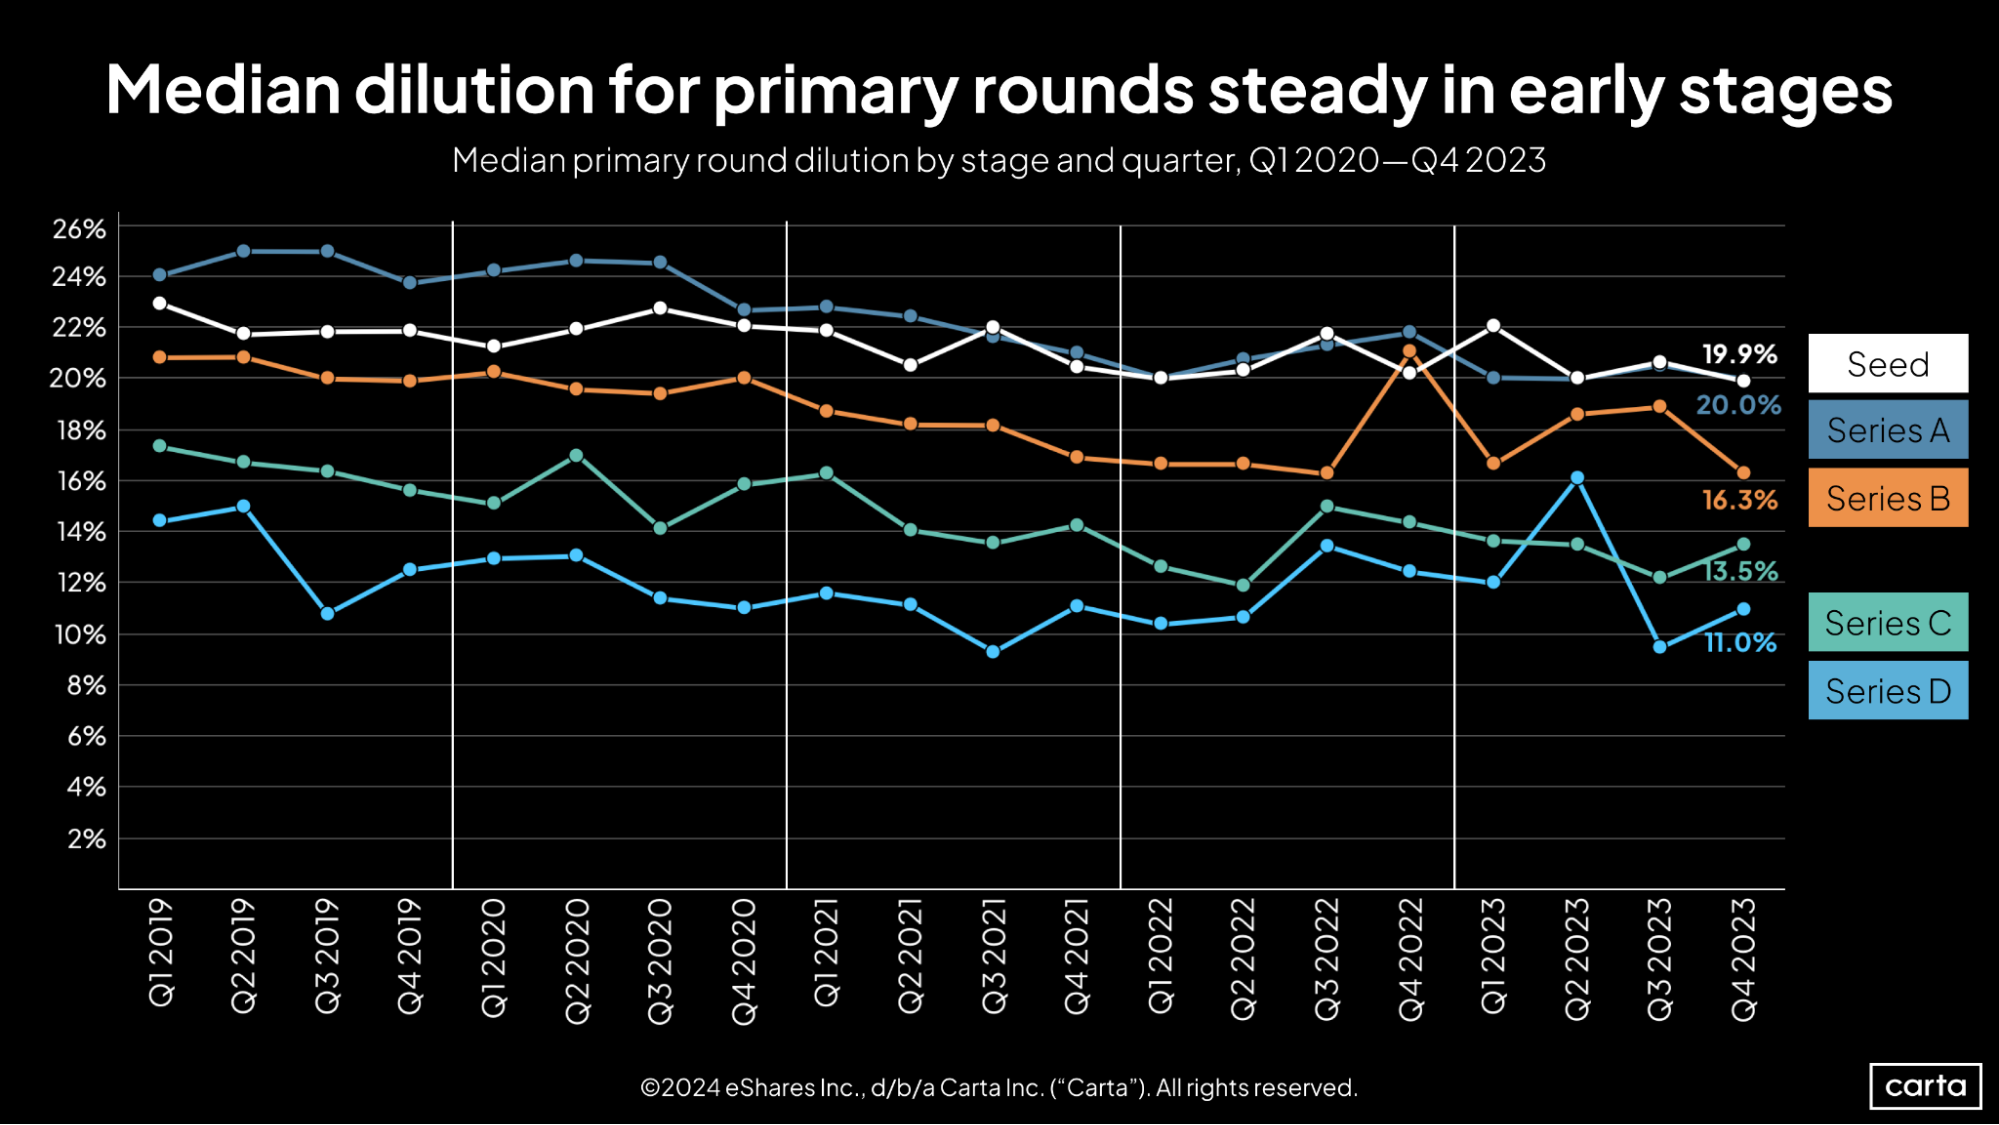
On a year-over-year basis, dilution—defined here as primary round size divided by pre-money valuation—has declined at every stage of the startup lifecycle. This continues a trend that has played out over the past several years. Slowly but surely, the numbers show that founders are selling off a smaller portion of their company when they raise new funding rounds. At most stages, the year-over-year declines have been small. At Series B, the decline has been more pronounced. Median dilution on new Series B fundings in Q4 was 16.3%, down from 21.1% a year earlier.
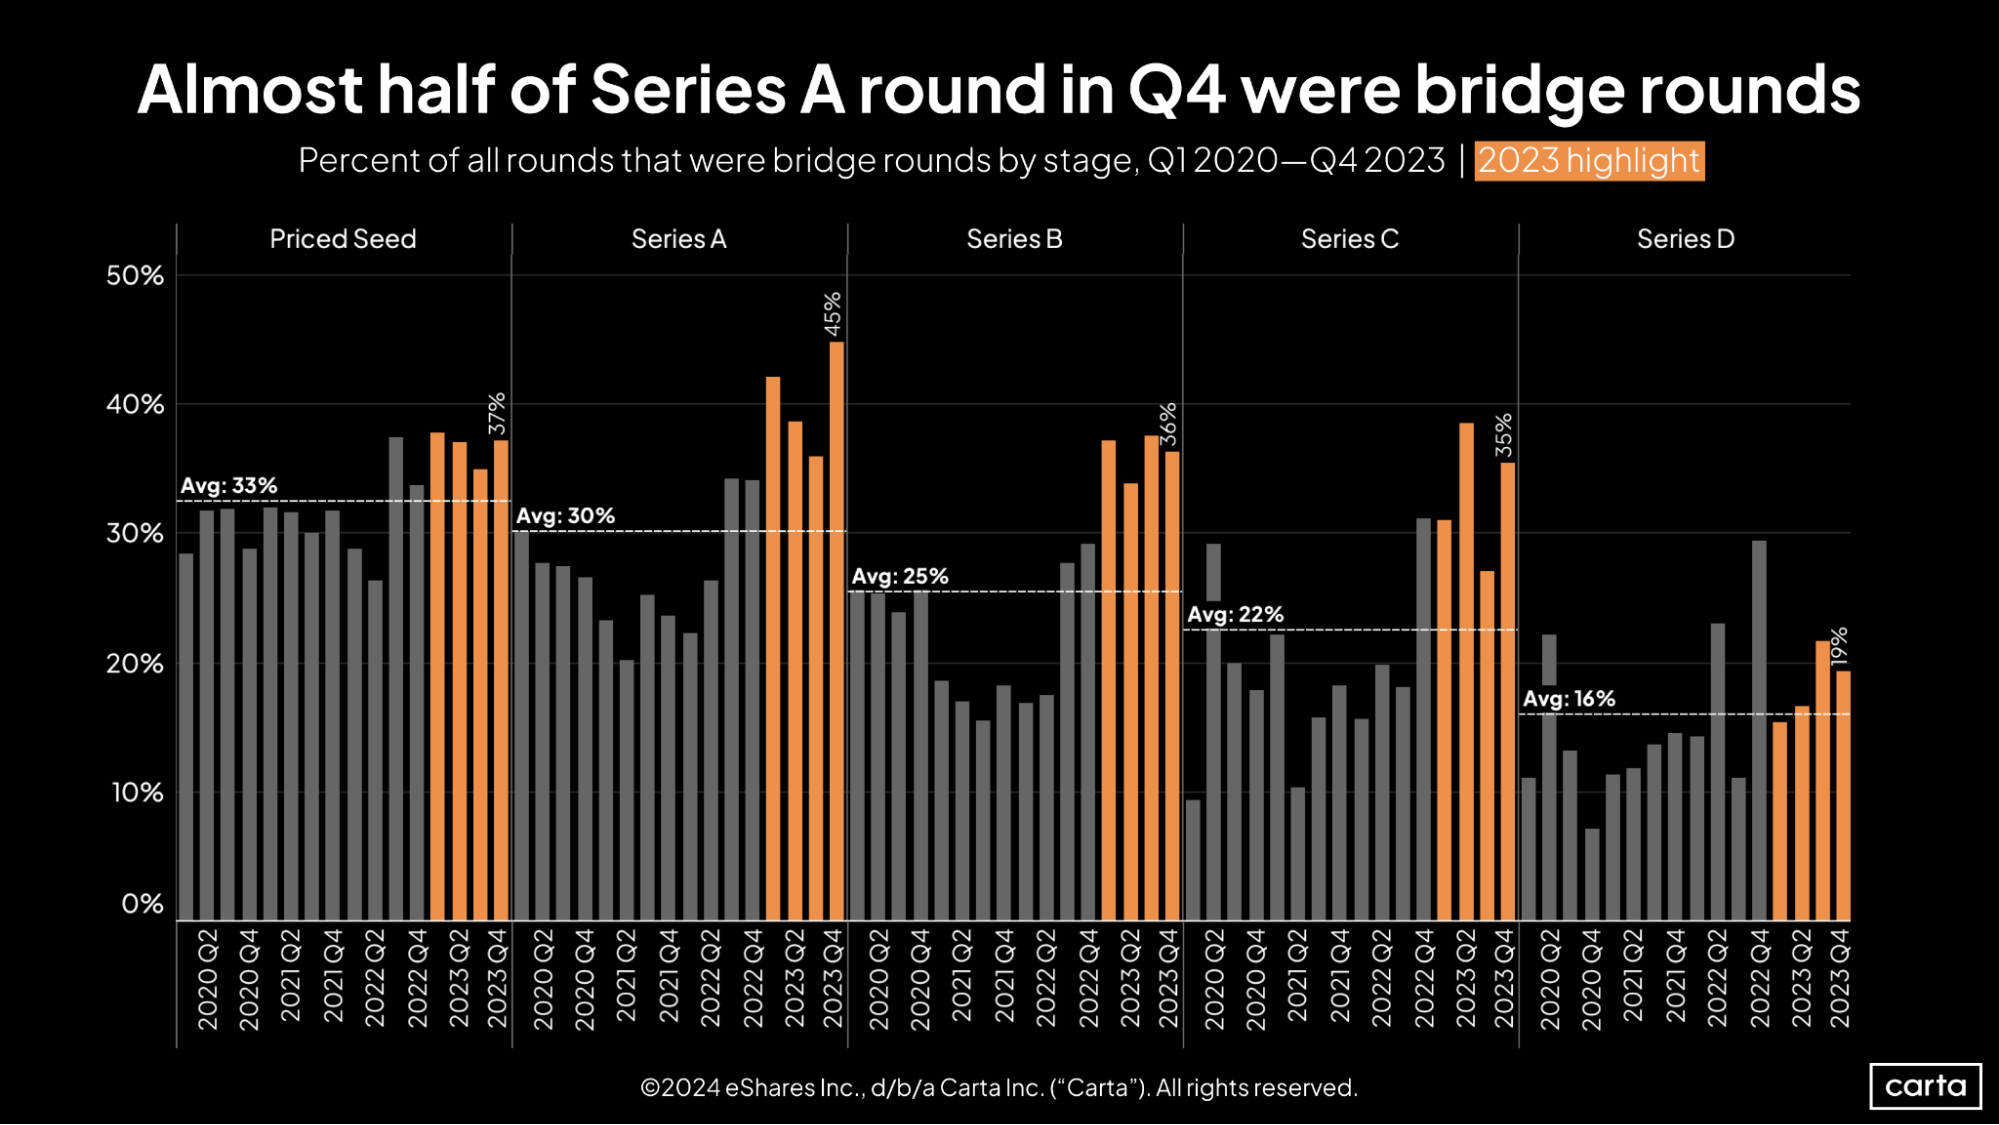
It was a busy year for bridge rounds at every stage. For companies that were struggling to raise new primary capital at their desired valuation—or to raise new primary capital at all—bridge rounds became an increasingly appealing way to extend runway and focus on navigating a changed fundraising landscape. In Q4, some 45% of all fundings raised by Series A startups were bridge rounds, the highest quarterly rate for any stage so far this decade.
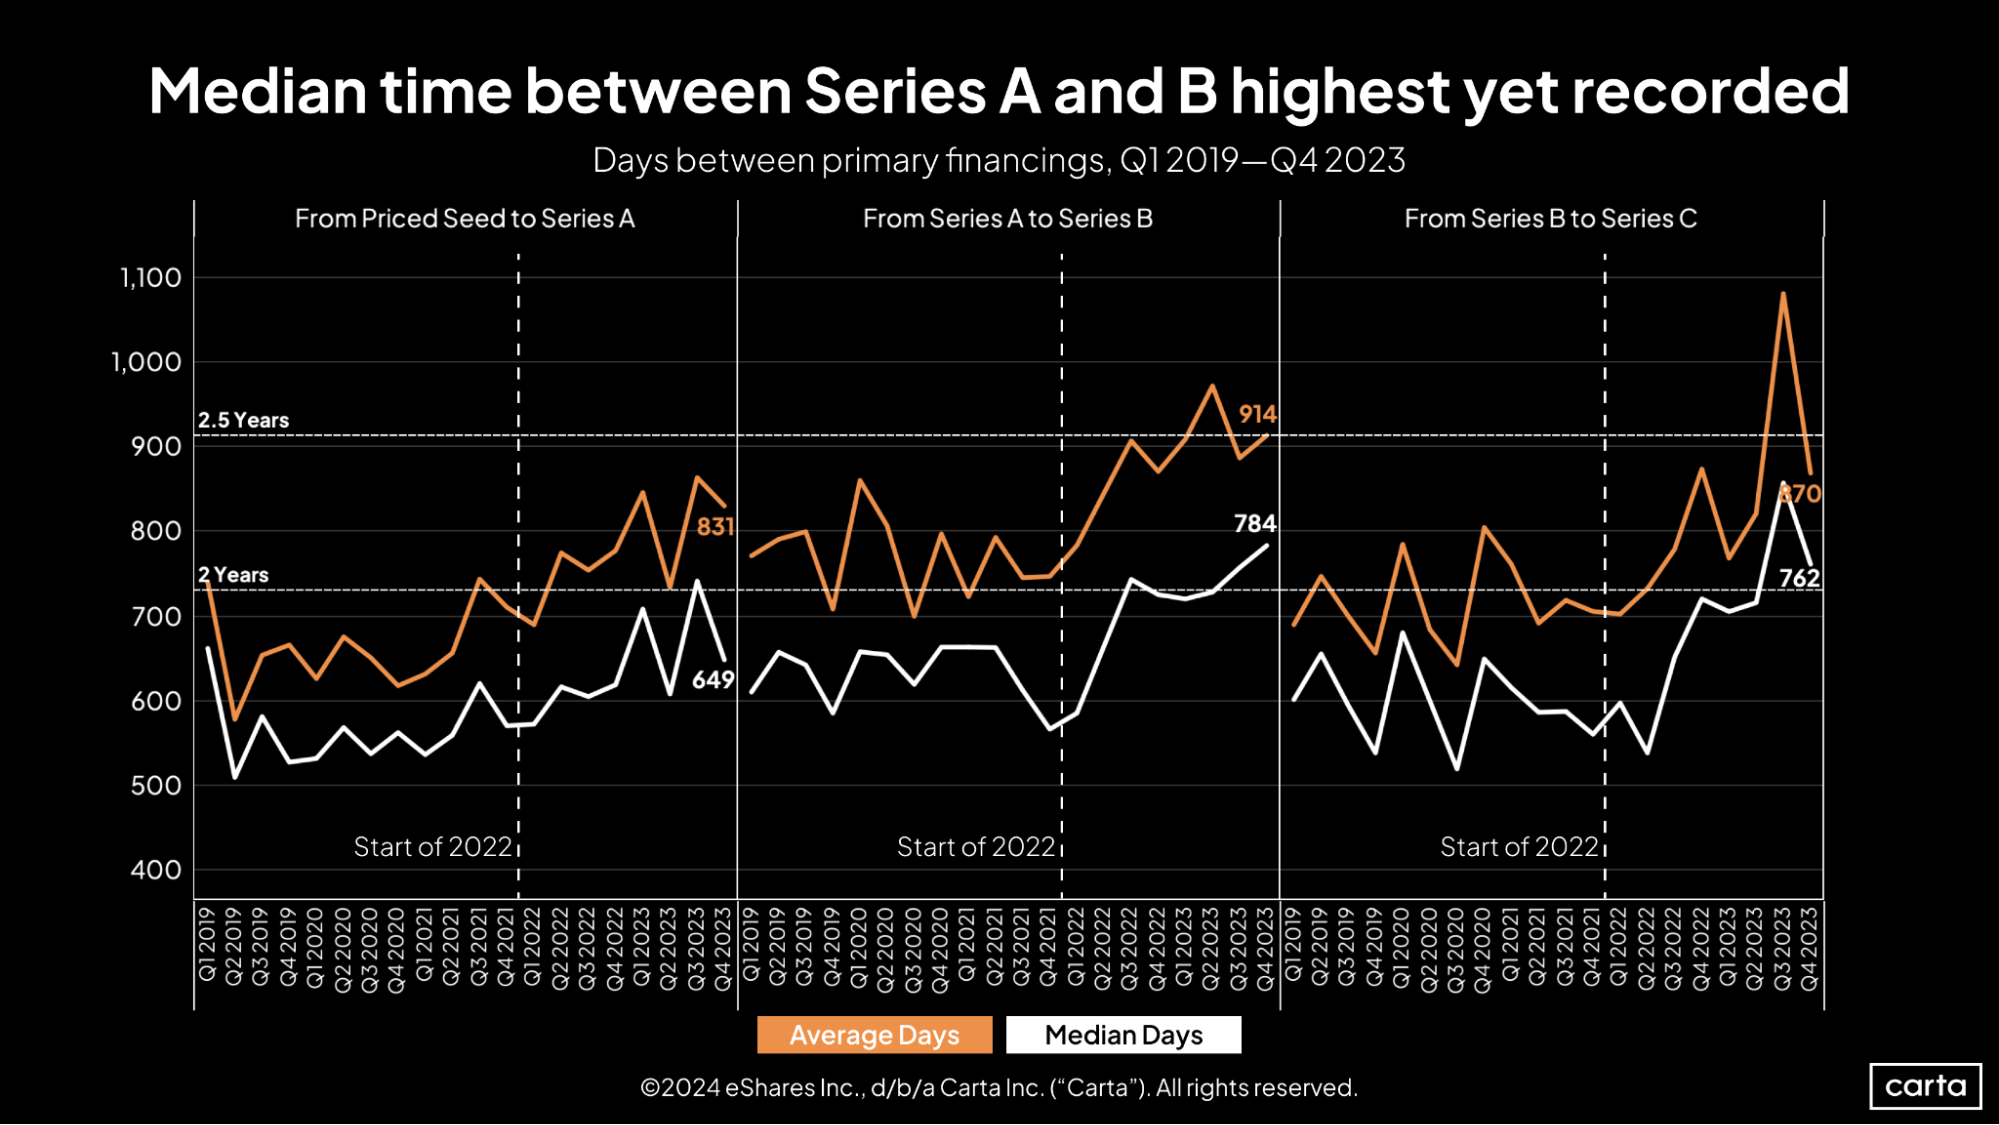
In Q4, the median time between a company’s Series A and its Series B extended to 784 days (about two years and two months), the longest interval on record. In general, the time between rounds has been trending up in recent years at Series A, Series B, and Series C. For founders, ensuring your startup has enough runway has never been more important.
However, for companies raising a Series A or Series C, the median time since the previous round decreased notably in Q4, with the gap for Series A startups falling by more than 50 days. Across all three stages, trend lines for median and average time between rounds have tracked quite closely.
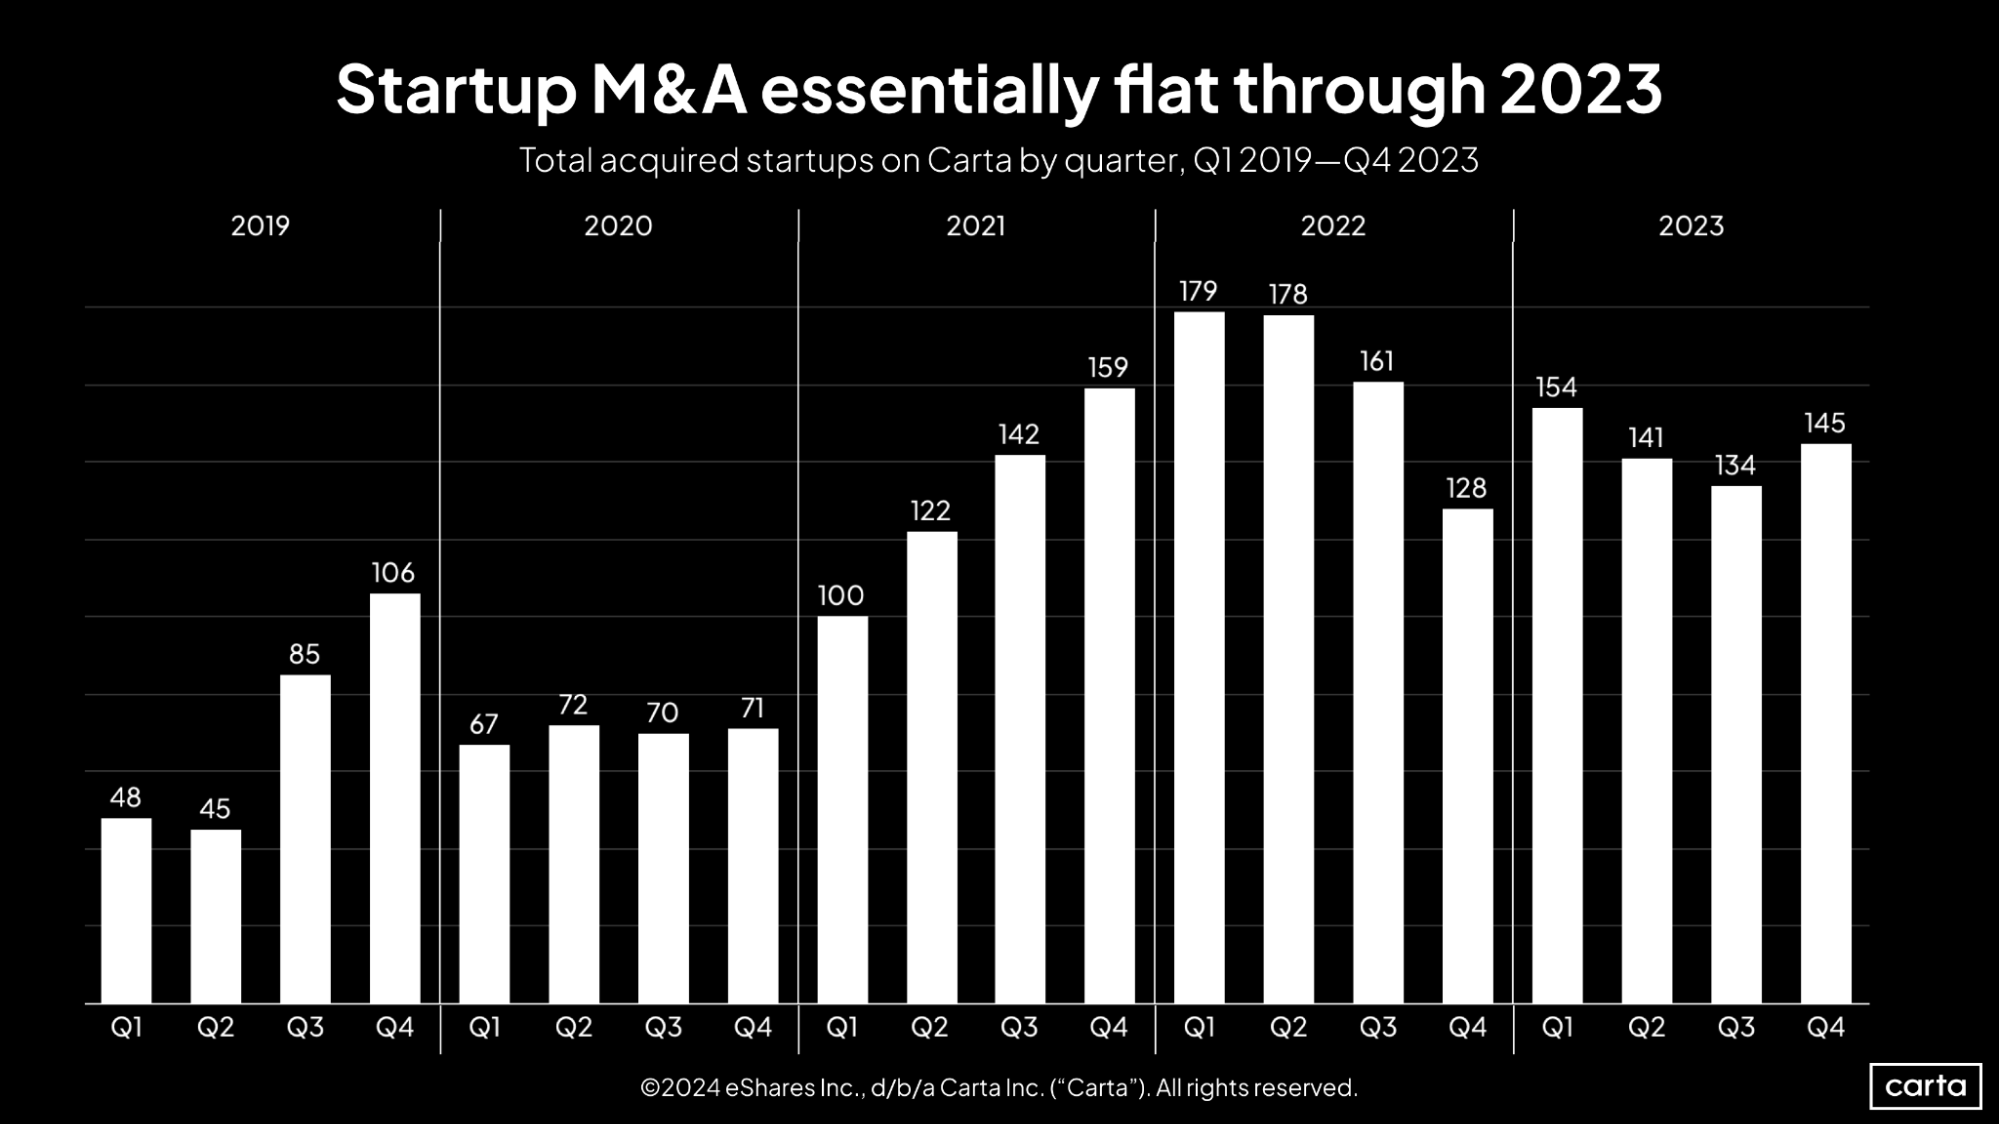
The number of startups exiting through M&A mostly stayed steady throughout 2023, ending the year with 145 transactions in Q4. For the full year, companies on Carta were the target in 574 M&A deals, down about 11% from 2022. Compared to IPOs—the other primary exit pathway for venture-backed startups—the M&A market has stood up quite well amid a cooler dealmaking market.
Still, it was a relatively quiet year for M&A activity across the broader corporate landscape, as would-be buyers grappled with high interest rates, geopolitical uncertainty, and other variables.
Employee equity & movement
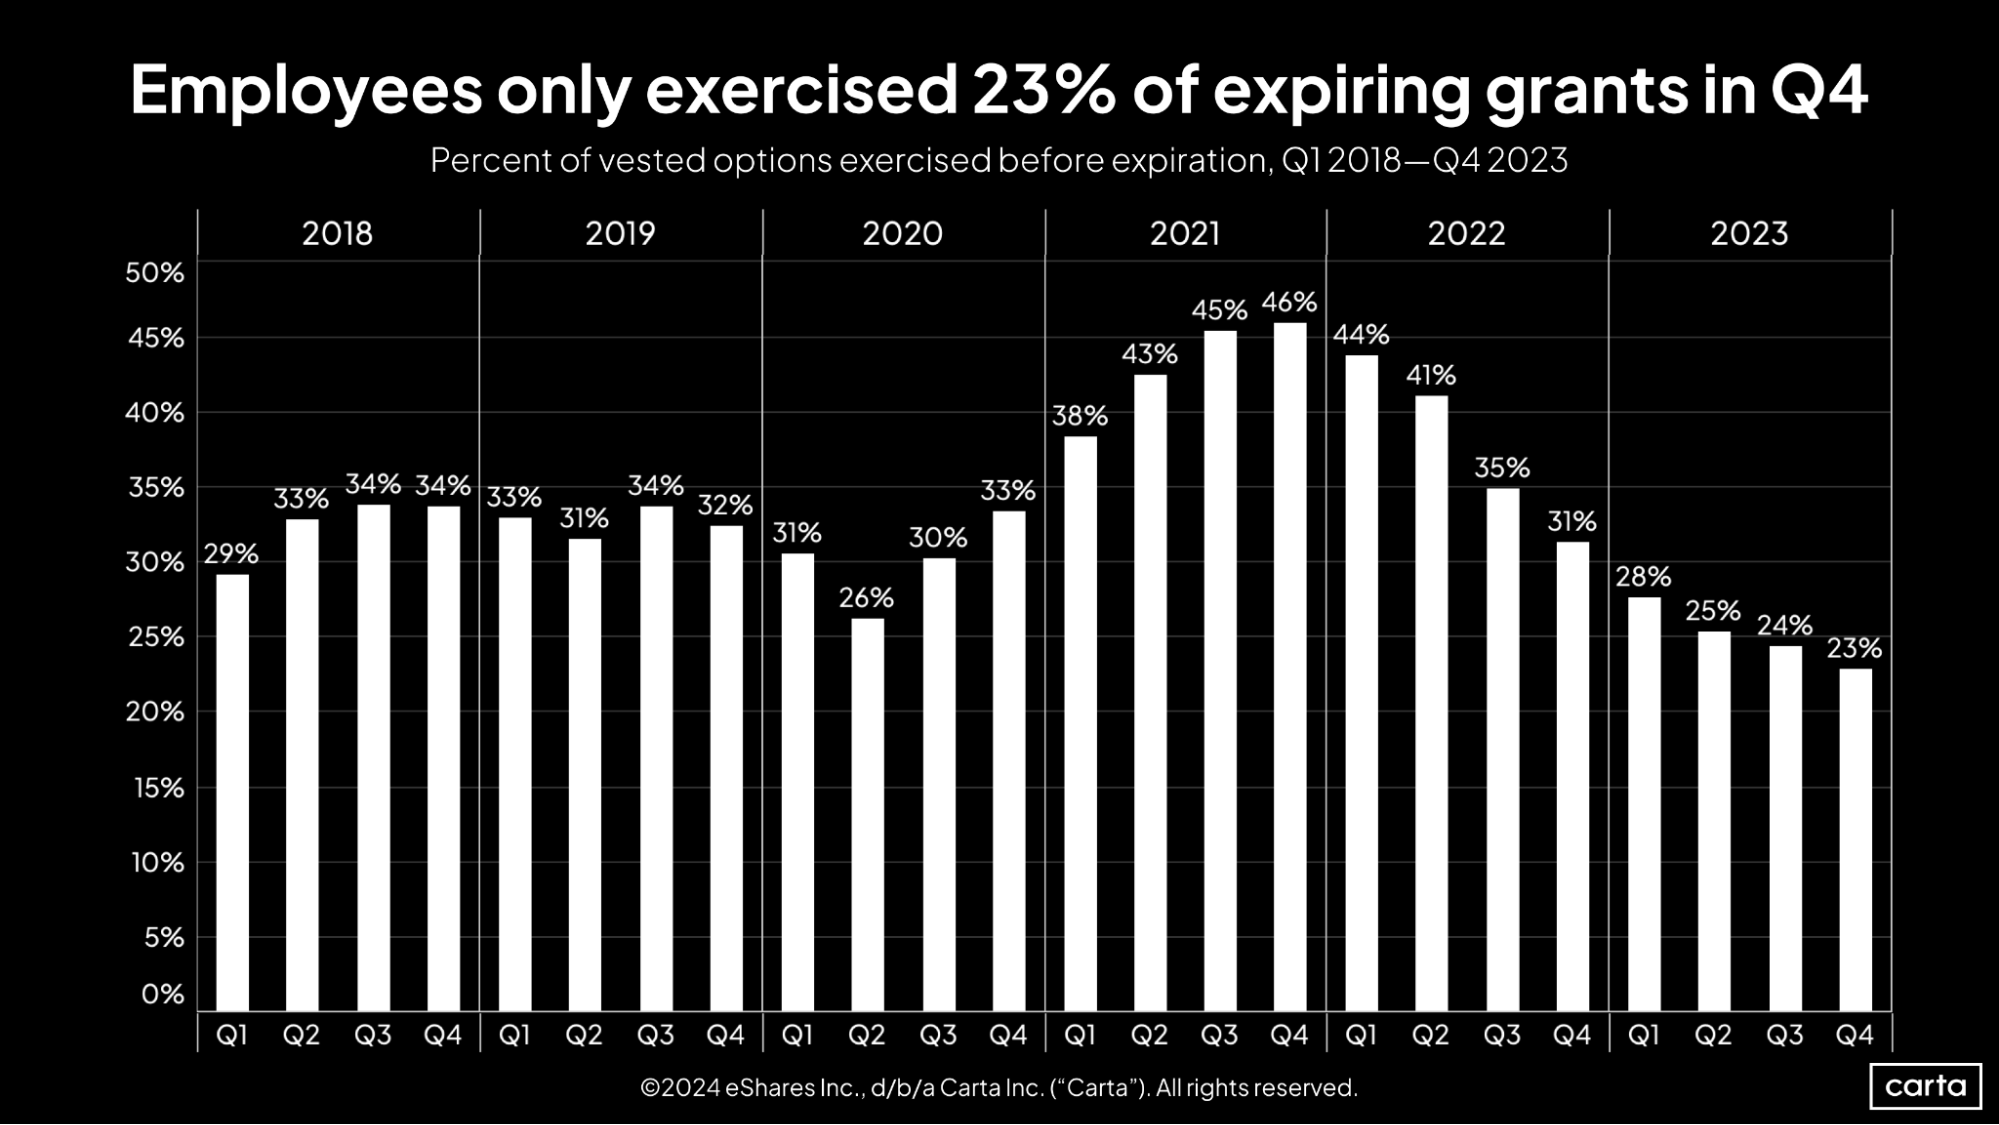
For employees, the attractiveness of stock options continues to wane. Workers exercised just 23% of their vested options before expiration during Q4, the lowest rate of the past six years. Given the valuation reset that’s occurred in venture capital over the past two years, it appears a growing number of employees believe that exercising their options isn’t a worthwhile investment.
The employee exercise rate has now declined for eight straight quarters, falling from 46% to 23% over that span. The past three quarters have brought the three lowest employee exercise rates since at least the start of 2018.
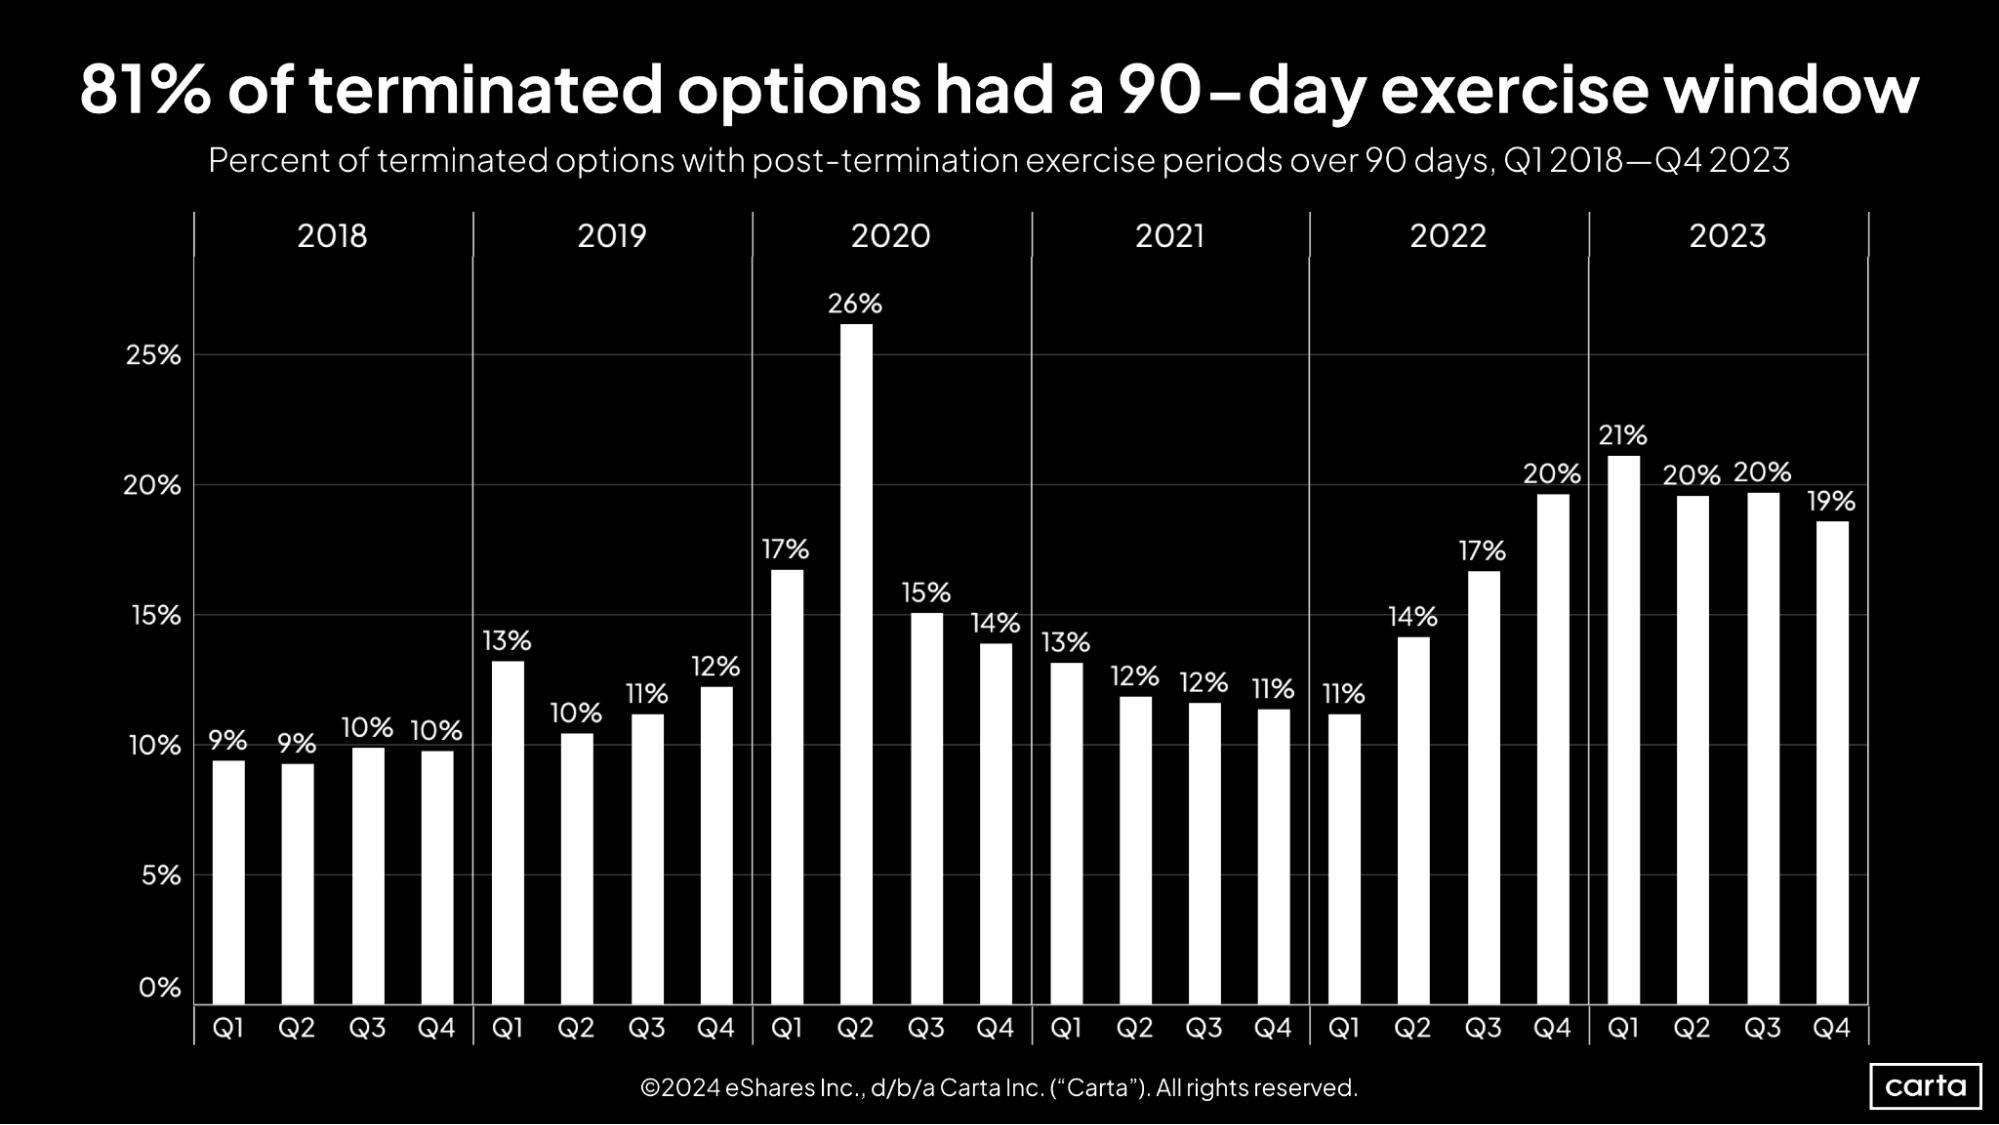
When companies part ways with an employee who holds vested stock options, the employee frequently has 90 days to decide whether to exercise those options. Throughout 2023, however, the percentage of options with a post-termination exercise period (PTEP) longer than 90 days remained high relative to recent years, reaching 20% in three of the past four quarters.
Offering an extended PTEP is seen as a courteous way to provide more financial flexibility to departing employees; thus, a PTEP longer than 90 days has historically been more common during periods of frequent layoffs or other economic hardships. The high rates of extended PTEP in recent quarters are likely a sign of the stress caused by 2023’s venture slowdown.
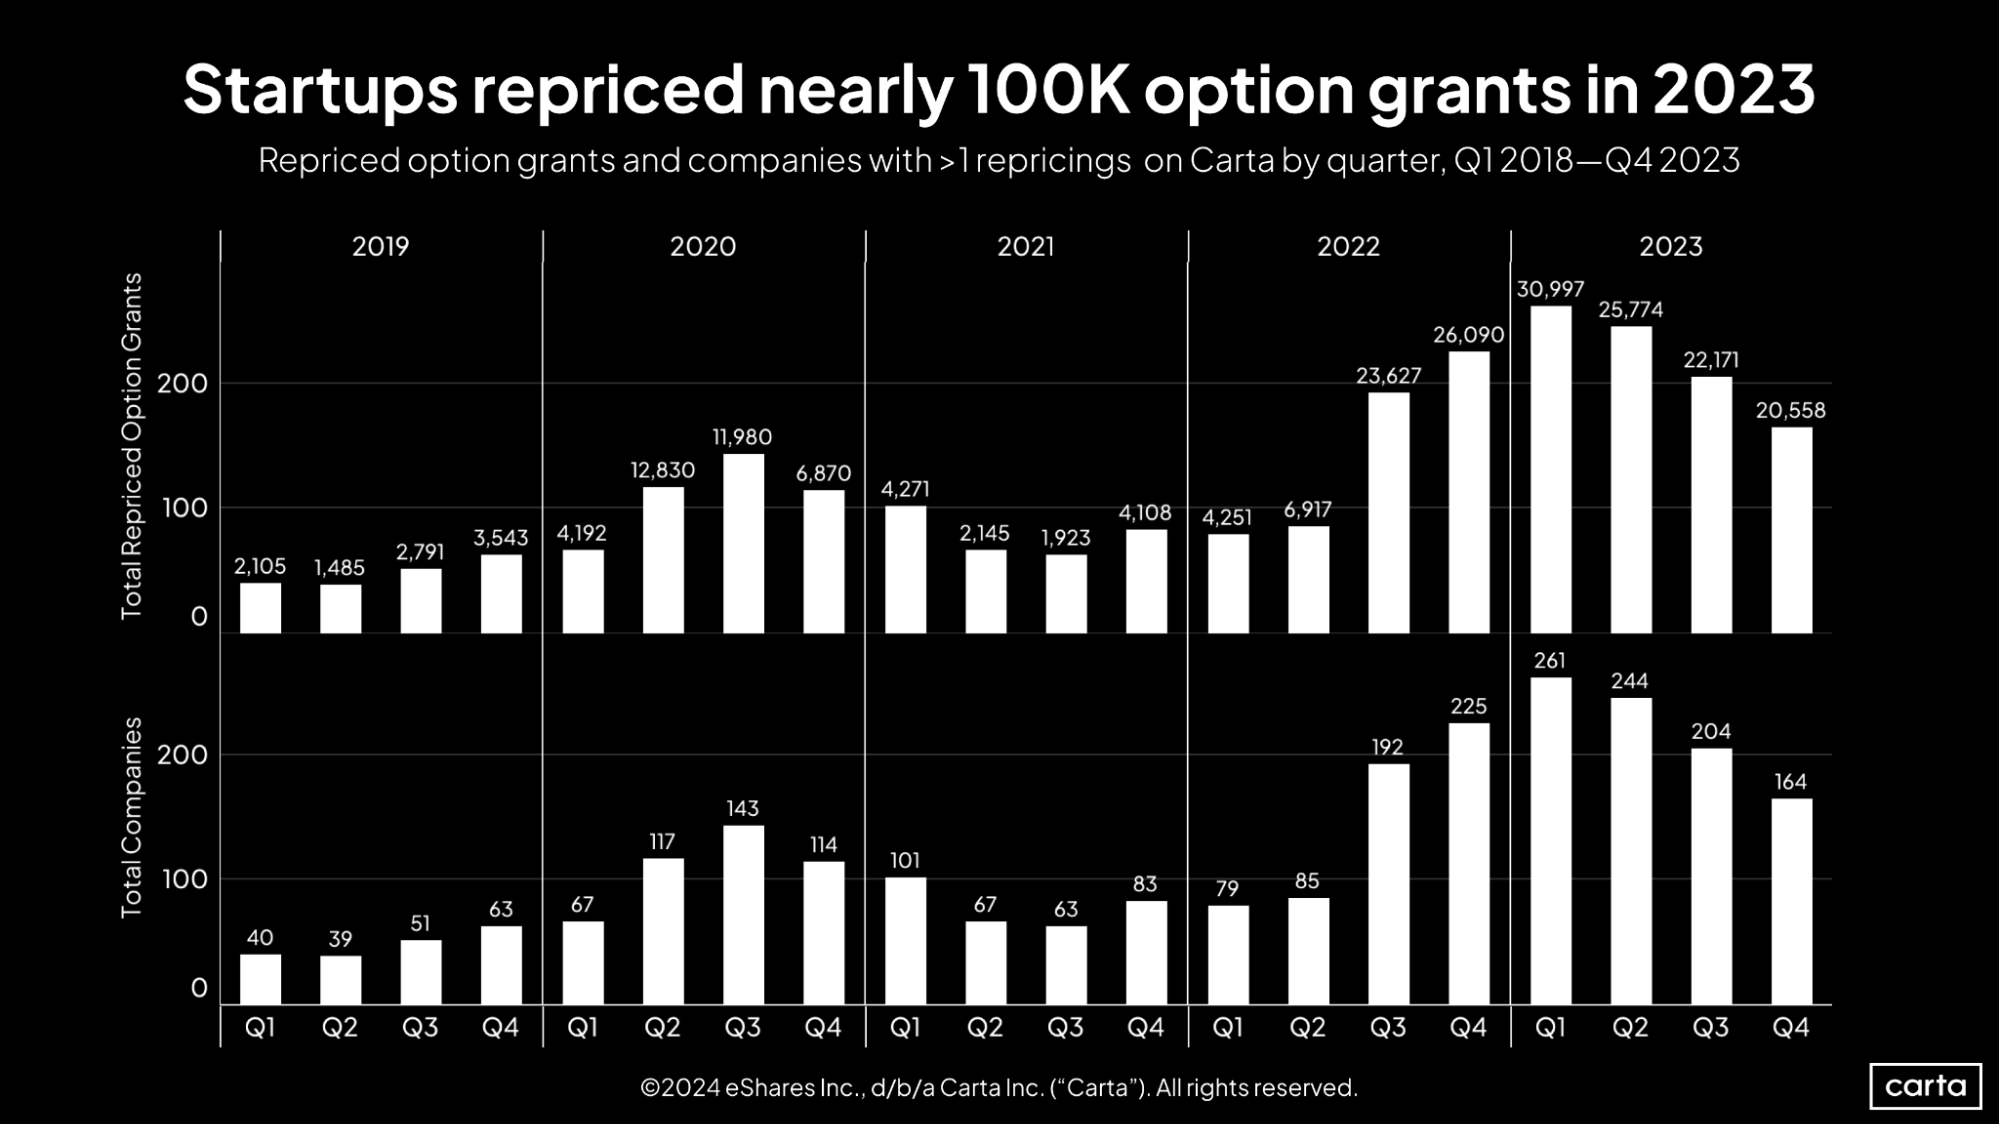
The number of companies opting to reprice previously issued stock options grants has now declined for three straight quarters. Still, the rate of repricings reached lofty levels in 2023, with startups on Carta repricing just shy of 100,000 grants over the course of the year.
This increase in repricings is part and parcel of the recent increase in down rounds. If a company’s valuation declines, any previously issued stock options grow less attractive, and some might sink underwater. Repricing those grants is a way for startups to make sure stock options remain an attractive currency for current employees.
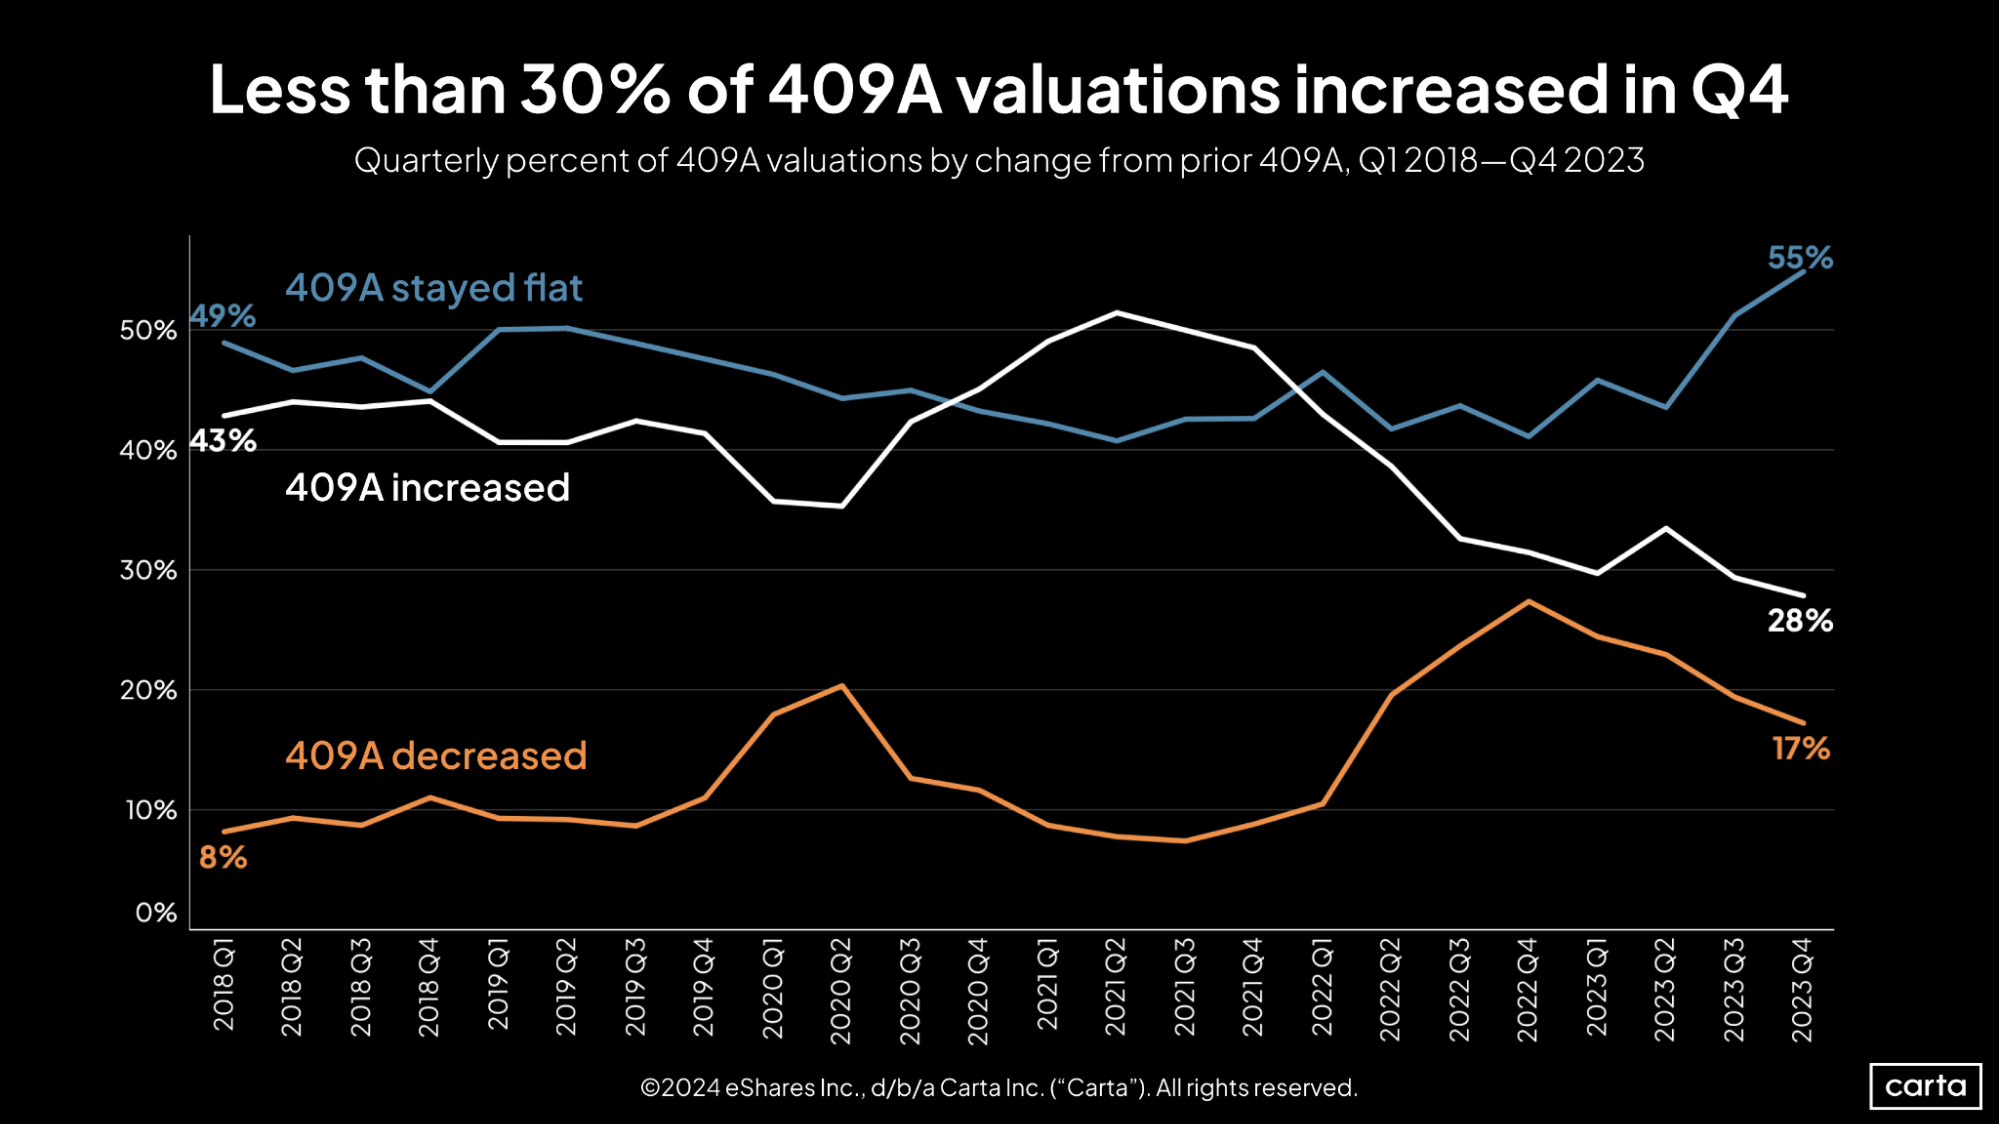
At least once each year, startups must receive a new 409A valuation appraisal that determines the baseline price of any new stock options or equity issued to employees. The rate of these 409A valuations that were an increase over the company’s prior valuation fell to 28% in Q4, the lowest point in at least the past six years. However, the rate of 409A appraisals that represent a valuation decrease was also in steady decline throughout 2023. These twin decreases were offset by a spike in the frequency of flat 409A valuations. That rate jumped to 55% in Q4, a new recent high.
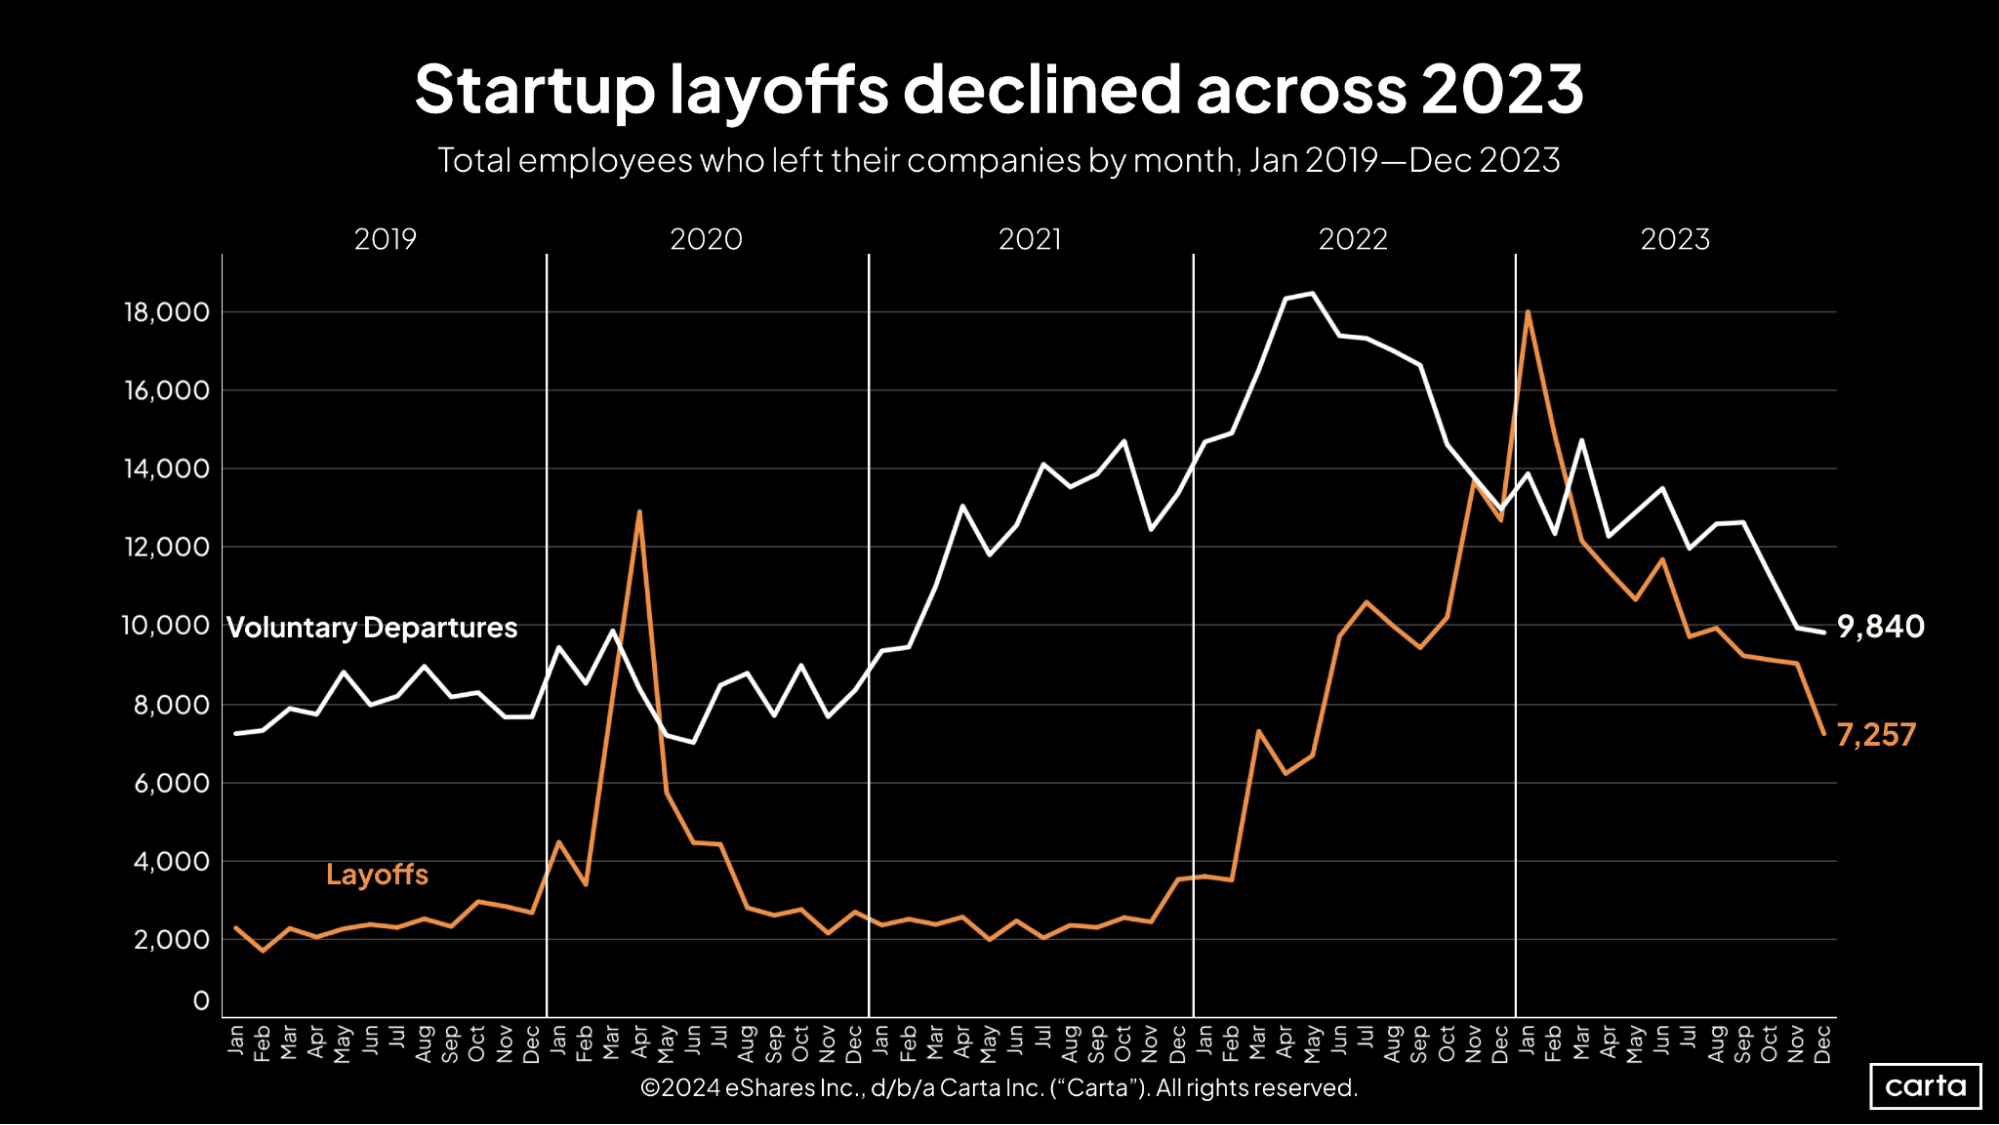
At the start of 2023, the startup job market was marked by high turnover. But as the year progressed, both layoffs and voluntary job departures grew increasingly less common, with the number of layoffs falling off at a particularly sharp rate.
Across the two categories combined, there were 17,097 departures on Carta during December. That’s down 46% from January, when there were 31,908 combined departures. The rate of voluntary job-hopping has declined by about half from its recent peak in early 2022, while the rate of layoffs is down nearly 60% from its January highpoint.
Industry-specific data
Download the addendum to this quarter's report to get industry-specific data on fundraising and valuations.
Methodology
Carta helps more than 43,000 primarily venture-backed companies and 2,400,000 security holders manage over $3.0 trillion in equity. We share insights from this expansive dataset about the private markets and venture ecosystem to help founders, employees, and investors make informed decisions and understand market conditions.
Overview
This study uses an aggregated and anonymized sample of Carta customer data. Companies that have contractually requested that we not use their data in anonymized and aggregated studies are not included in this analysis.
The data presented in this private markets report represents a snapshot as of January 26, 2024. Historical data may change in future studies because there is typically an administrative lag between the time a transaction took place and when it is recorded in Carta. In addition, new companies signing up for Carta’s services will increase historical data available for the report.
Financings
Financings include equity deals raised in USD by U.S.-based corporations. The financing “series” (e.g. Series A) is taken from the legal share class name. Financing rounds that don’t follow this standard are not included in any data shown by series but are included in data not shown by series. Primary rounds are defined as the first equity round within a series. Bridge rounds are defined as any round raised after the first round in a given series. If there is no indication that a round is a primary or bridge round, both are included.
In some cases, convertible notes are raised and converted at various discounted prices within a series (e.g. Series A-1, Series A-2, Series A-3). In these cases, converted securities are not included in cash raised, and only the post-money valuation of the new money is included.
Terminations
Terminations entered into Carta must include a reason. Involuntary terminations include both terminations for performance and company layoffs. Voluntary terminations are employees who decided to leave of their own accord. Other termination reasons, including for cause, death, disability, and retirement were not included in the data and make up less than 1% of all terminations combined.
