- The state of startup compensation, H1 2022
- Startup headcount
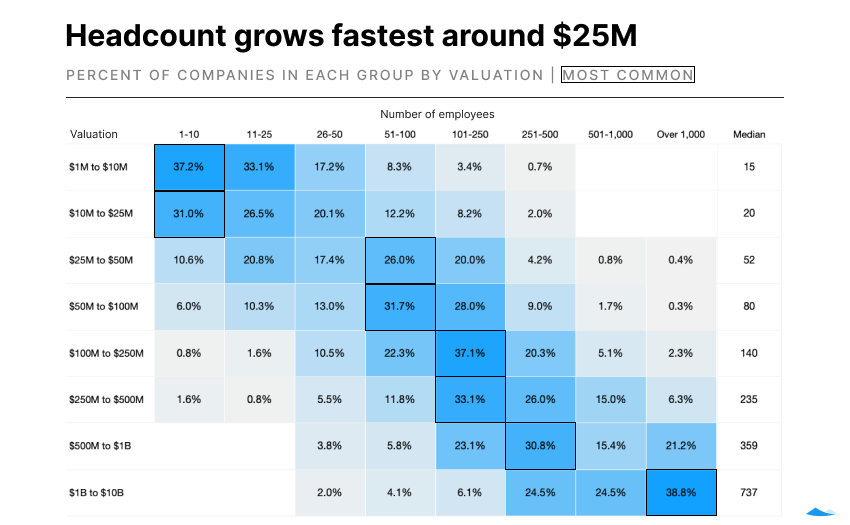
- Headcount growth by valuation
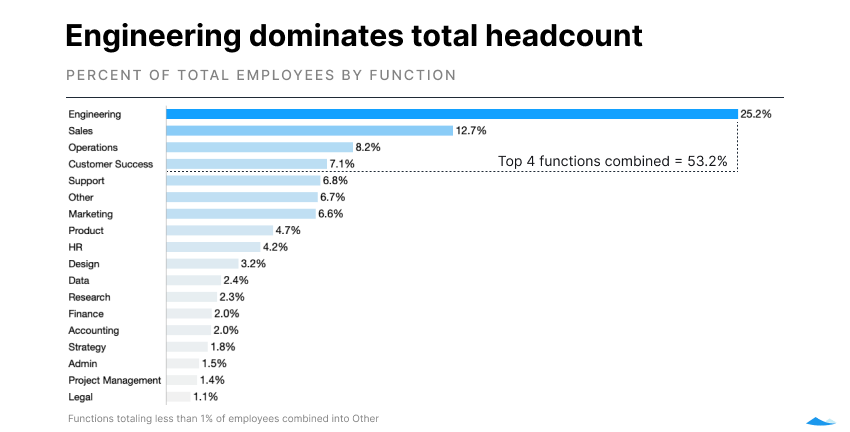
- Headcount by job function
- Workforce by level
- Headcount adjustments in 2022
- Payroll and employee stock option pools
- Payroll by valuation
- Payroll by job function
- Equity ownership
- Salary trends
- Median individual salaries
- Growth trends
- Employee salary growth
- Median salary by valuation
- Remote work and compensation by geography
- Hiring by company valuation
- Geo-adjustment by valuation
- Compensation by metro area
- Regional trends
- Differences in regional compensation for tech workers
- Year-over-year changes in regional comp
- Download the addendum
- Methodology
For most startups, payroll is the primary driver of cash burn. And with inflation and economic unease on the rise, knowing trends within compensation is critical. How can a founder balance the need to conserve capital with the imperative to grow? How can leaders pay employees fairly through boom and bust cycles?
At Carta, we see it as our responsibility to share the insights that come from an unmatched amount of data about the private market. That includes data on startup headcount, payroll and equity metrics, salary medians, and remote work. We created this compensation report from data using more than 127,000 employee records from startups that use Carta Total Comp, the premier compensation management platform for private companies.
Key trends:
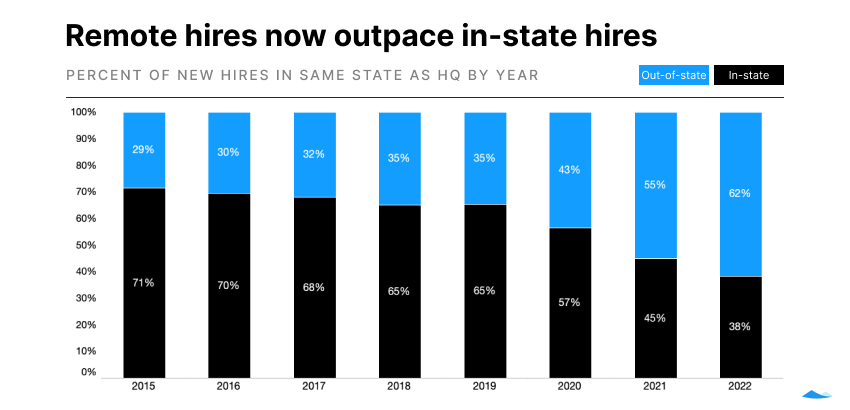
Remote hiring soars: In 2019, about 35% of new hires were based in a different state than the primary company headquarters. So far this year, that number has ballooned up to 62%.
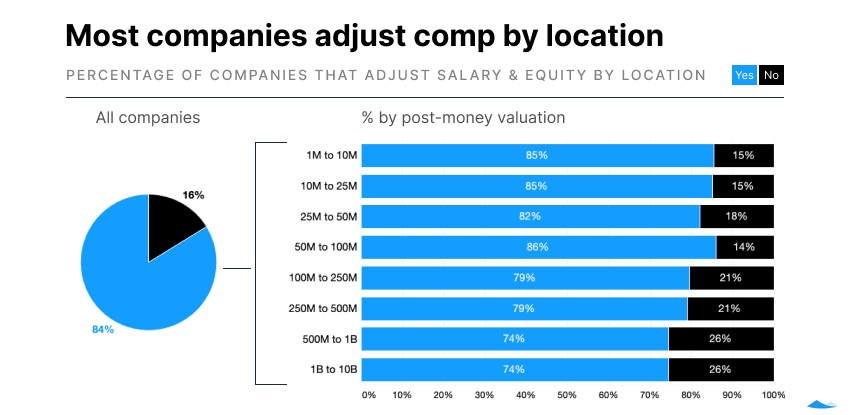
Geo-adjusting is the norm: The vast majority of companies (84%) take employee location into account when deciding on compensation packages.
Engineering is a key hire: Engineering accounts for nearly half of payroll spend in companies valued between $1 and 10 million.
Terminations rise: Across all of Carta’s platform, involuntary terminations made up 29% of departures in May 2022 (the rest were employees leaving their jobs by choice). That’s nearly double the 15% termination share recorded in August of 2021.
Note: If you’re looking for compensation benchmarks against companies like yours, you can also download the addendum to this report to get an extended dataset.
Startup headcount
Headcount growth by valuation
Headcount expands as a company’s valuation increases, though not always linearly. The median company valued at $50 to 100 million employs 52 people in addition to the founders. Once a startup hits the $1 billion mark, it typically has more than 700 employees. Only 12% of these unicorns have fewer than 250 employees.
Headcount by job function
The largest job function at most tech startups is engineering. Over a quarter of the employees are engineers, followed by people in sales, operations, and customer success roles. Those top four functions comprise over half of total headcount.
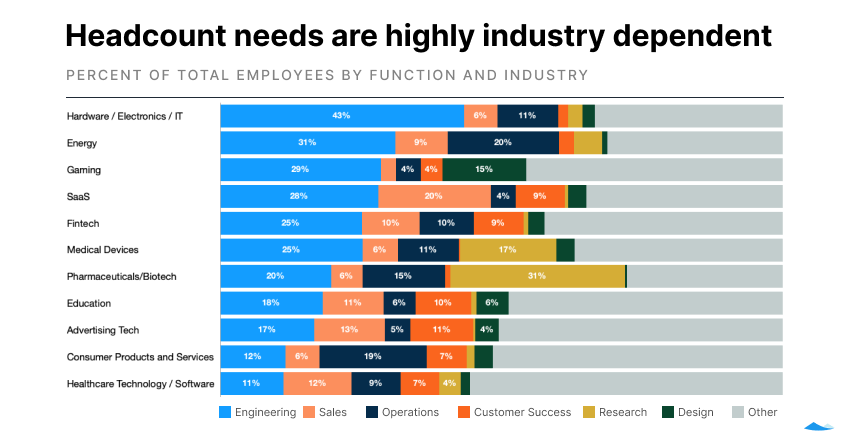
Hardware startups tend to splurge on engineering talent (as they need both software and hardware engineering). Fields related to medicine (medical devices and biotech) require a major investment in research. Gaming startups tend to have many more designers on staff. While SaaS startups devote 20% of total headcount to sales, that percentage is much smaller in nearly every other industry.
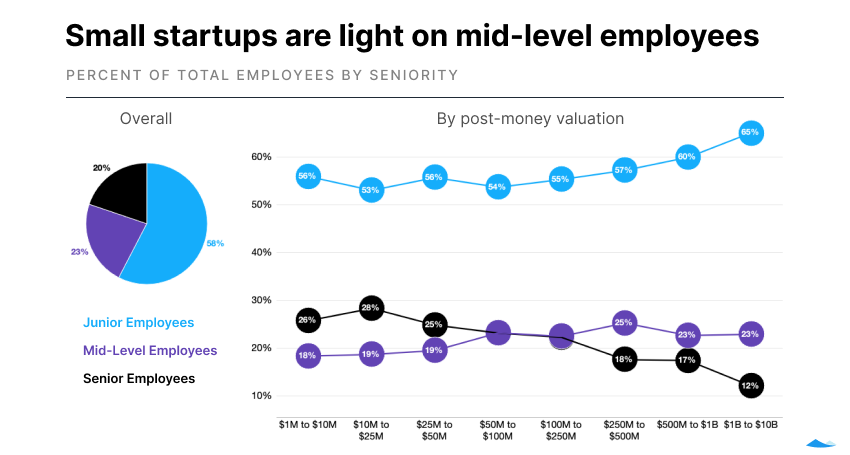
Workforce by level
Leveling can present a challenge to leadership as a company grows. As a young startup, you may not need a complicated org structure, but as you grow all new levels you introduce will need to be fair to everyone. (A good compensation philosophy can help you plan objectively, as can this free template of the leveling system used on the Carta Total Comp platform.)
Junior employees (levels 1–4 in Carta Total Comp) make up the majority of the startup workforce. Smaller companies have a larger percentage of senior employees (levels 7–11) than mid-level employees (levels 5–6), but this pattern inverts at around $250 million in valuation. By the time a company is valued at $1 billion, senior employees make up only 12% of the overall workforce.
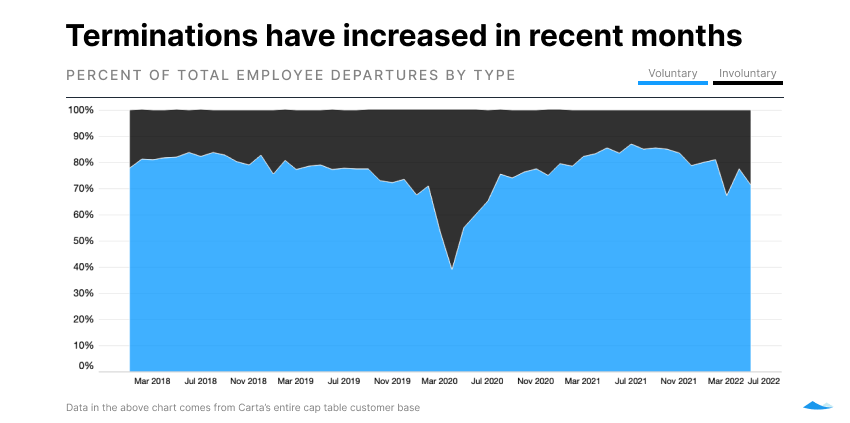
Headcount adjustments in 2022
According to data from across all of Carta’s 29,000+ cap table customers, involuntary terminations made up 29% of departures in May 2022 (the rest being employees leaving their jobs by choice). That’s nearly double the 15% termination share recorded in August of 2021. As layoffs increase, we may see fewer employees leave their companies on their own initiative—and a corresponding softening in the competitive market for talent.
Payroll and employee stock option pools
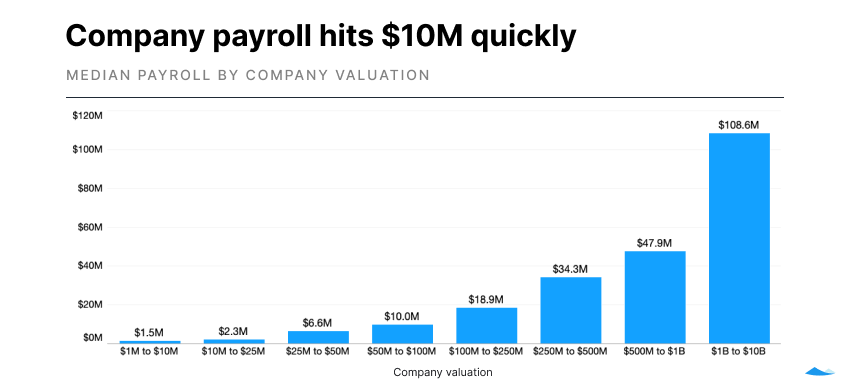
Payroll by valuation
Early-stage startups tend to spend early on payroll and ramp up quickly, with a $10 million payroll median for companies at valuations of $50–100 million. You can see company payroll benchmarks broken into percentiles (10th, 25th, 50th, 75th, and 90th) by downloading the addendum to this report now.
Payroll by job function
Engineering accounts for the largest share of payroll spend across company valuations. This job function is at least 30% of spend, no matter the size or maturity of the company. Other functions slot in after engineering, but rapidly shrink under 10% in most cases.*
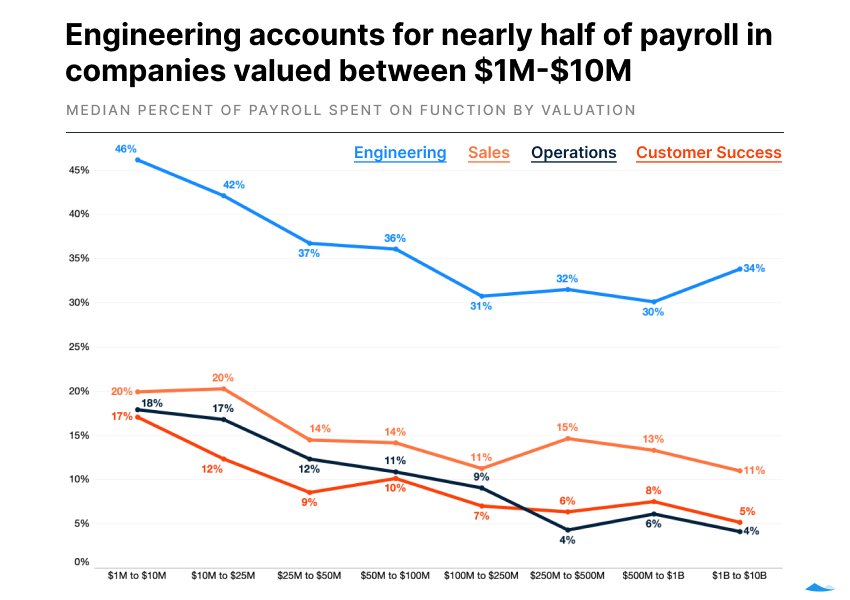
Apportioning payroll by function becomes more complex as a company grows. A company valued at $5 million may only have headcount in five or six functions, while a more mature company might employ people across 20 or more functions.
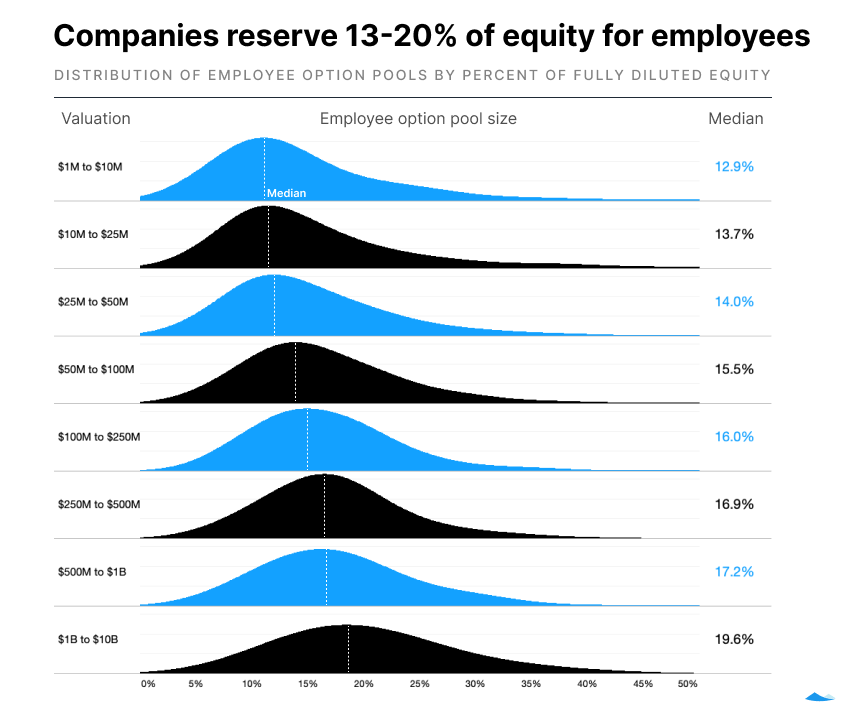
Equity ownership
While the total percentage of company equity reserved for employees varies widely, it’s clear that employees take a larger overall share as the company grows. The median company worth $25 million designates around 14% of its shares for employees, while the median unicorn has an employee pool of around 20% of fully diluted shares.
Salary trends
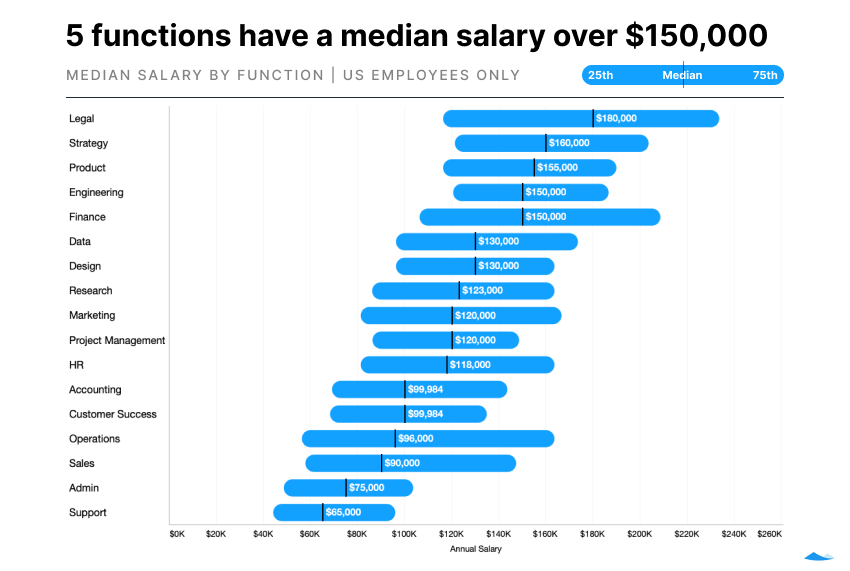
Median individual salaries
Legal, strategy, product, and engineering—in that order—have the highest median salaries for individual tech employees across job functions, levels, and company valuations. While engineering costs companies far more overall, legal roles at early startups tend to be highly leveled (a startup is far more likely to hire an engineer straight out of college than a general counsel). Engineers are overrepresented at the top end of the salary scale, however—over 40% of employees making $500,000 or more are engineers.
Six job functions have median salaries below $100,000, while five have a median of over $150,000..
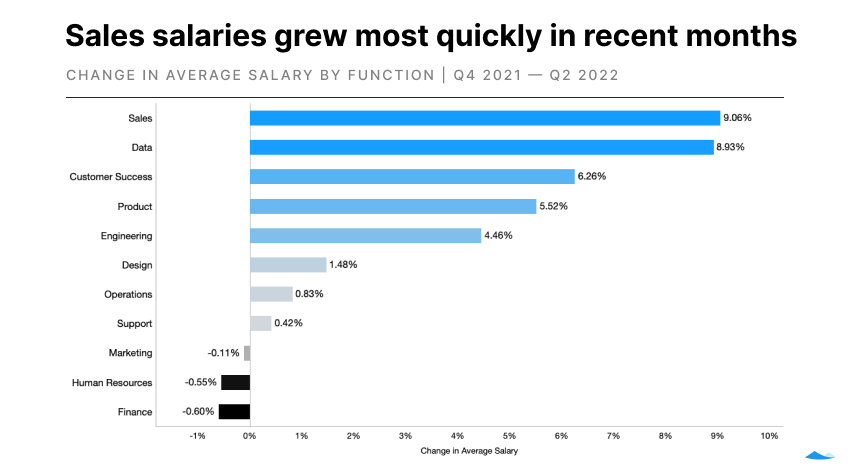
Growth trends
Median salaries aren’t static. Between late 2021 and Q2 2022, five functions saw more than 4.5% growth in average salaries. Only three functions saw salaries shrink in this timeframe (and each by less than 1%).
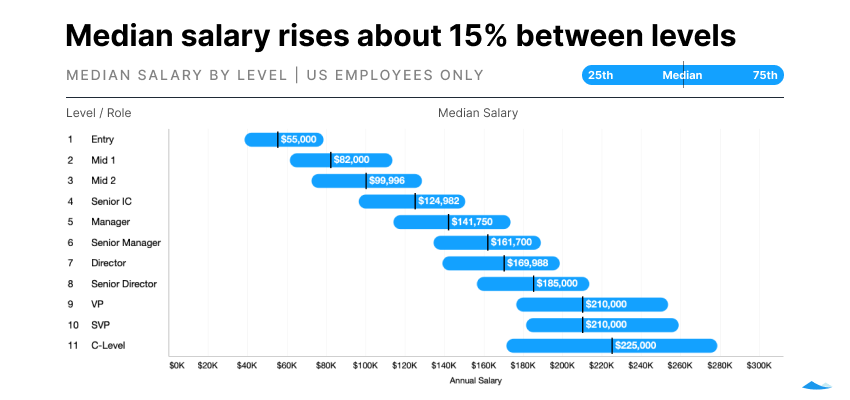
Employee salary growth
Tech employees typically begin making six-figure salaries around level 3 (keeping in mind that startups take a wide variety of approaches to leveling their employee base).
In the aggregate, salaries jump by about 15% per level as employees rise up the ranks. The seeming plateau between levels 9 and 10 is likely a byproduct of the dataset narrowing considerably at these levels, as most small startups don’t divide their senior executives into VP and SVP categories.
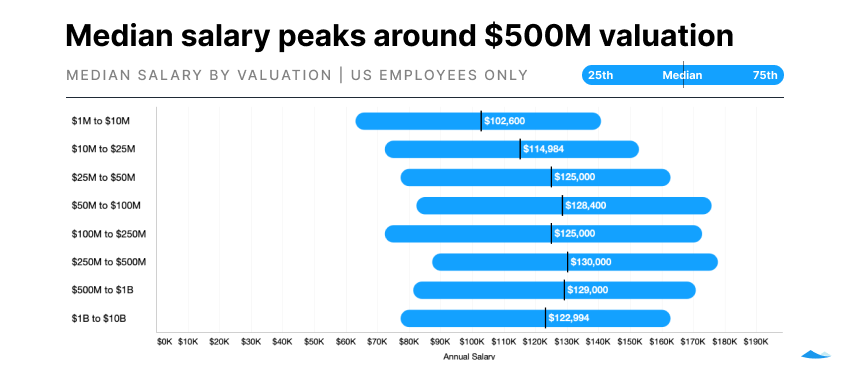
Median salary by valuation
The median salary is somewhat less dependent on company size than level or function. While smaller companies do have lower median salaries, the gap is nearly erased by the time the company hits $50 million in valuation. In fact, larger companies see the median salary modestly decline as more of their workforce is made up of employees just beginning their careers.
Remote work and compensation by geography
In 2019, about 35% of new hires were based in a different state than the primary company headquarters. So far this year, that number has ballooned up to 62% as the pandemic transformed many companies’ approach to remote work. (Companies of sufficient size may have office locations in multiple states—but that was equally true in pre-pandemic years. Something has certainly shifted in the startup worker’s ability to work where they please.)
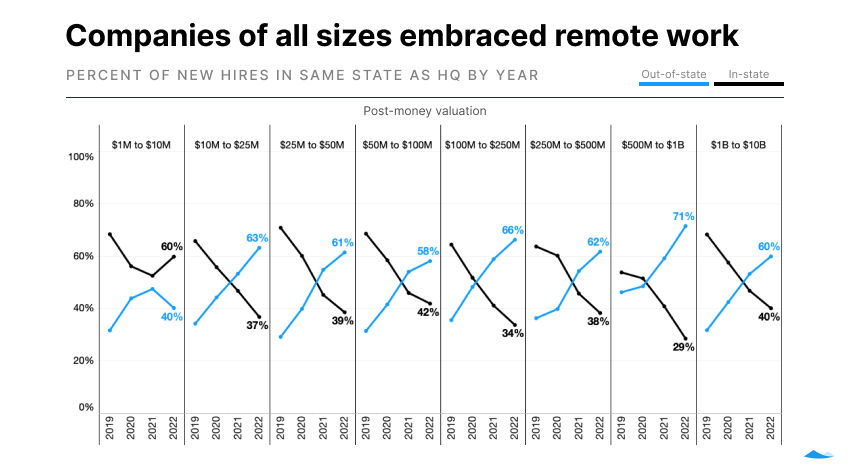
Hiring by company valuation
The remote trend is happening in businesses of nearly all sizes, with companies valued at less than $10 million as an interesting counterpoint. It may be that at the very earliest stages, being co-located is more valued as founders and early employees create company culture. Companies at this size also hire fewer people, so the overall number of employees impacted is relatively small.
Geo-adjustment by valuation
As remote work becomes a fact of life, founders are increasingly faced with a key decision: Should they adjust compensation by location?
The vast majority of companies (84%) do take location into account when deciding on compensation packages. Startups with more modest valuations are more likely to adjust compensation by location. Around a quarter of companies valued more than $500 million choose to pay employees equally, no matter their current location.
A very small percentage of companies have begun paying certain job functions (primarily engineering) identically across all locations, but this approach is far from the norm. Companies that decide not to geo-adjust their compensation may do so as a perk to retain employees, who can choose to work remotely from lower-cost locations, or as a strategy to attract new workers.
Compensation by metro area
Given that most founders and company leaders choose to adjust compensation by location, what adjustments should be applied between major U.S. metro areas?
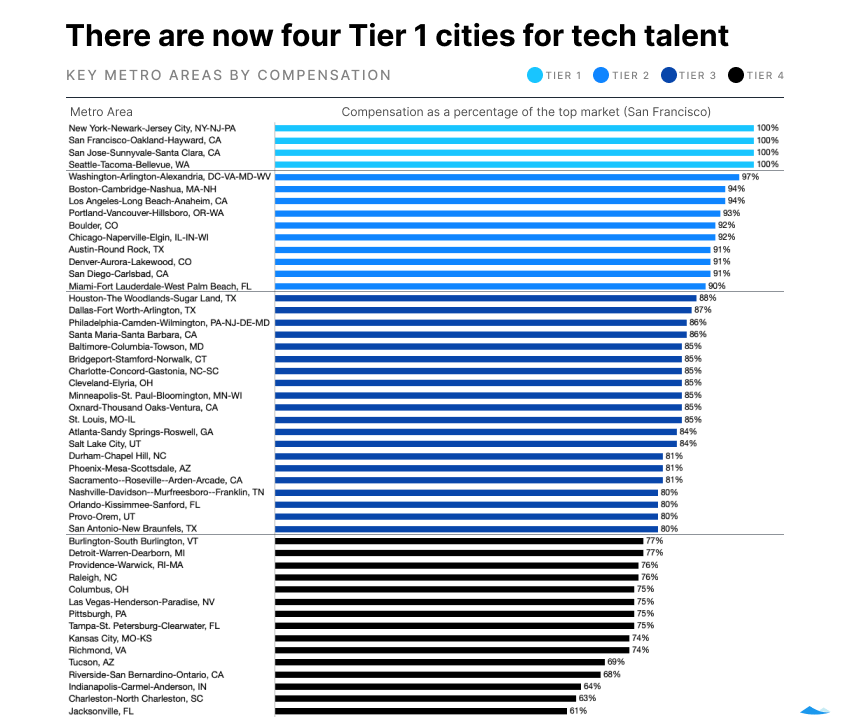
Each metro is given a comp score within Carta Total Comp, expressed as a percentage of the top metro areas. Currently, there are four Tier 1 metros in the U.S. Employees in San Francisco, San Jose, Seattle, and New York can expect to receive the highest pay packages (though, of course, the cost of living is quite high in these places as well).
Tier 2 metros are defined as compensating at 90–99% of the Tier 1 metro areas. Tier 3 equates to 80–89%, while Tier 4 refers to 79% or below.
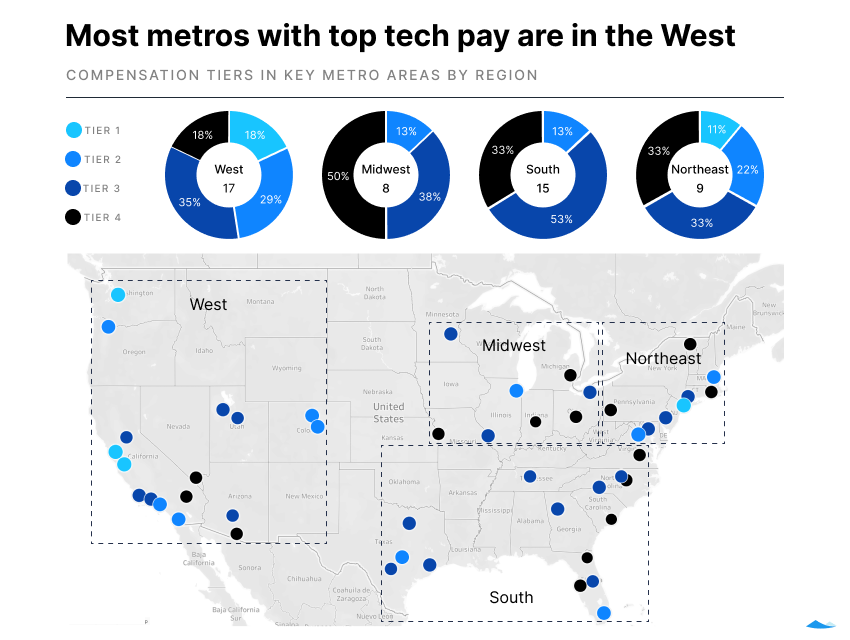
Regional trends
The West continues to be the premier region for tech talent, with established hubs like San Francisco alongside growing cities like Salt Lake City and Portland. Austin and Miami are strong performers in the South (at 91% and 90% of Tier 1, respectively). Relative compensation across the Midwest lags behind, with only Chicago seeing typical compensation at 90% or more.
Differences in regional compensation for tech workers
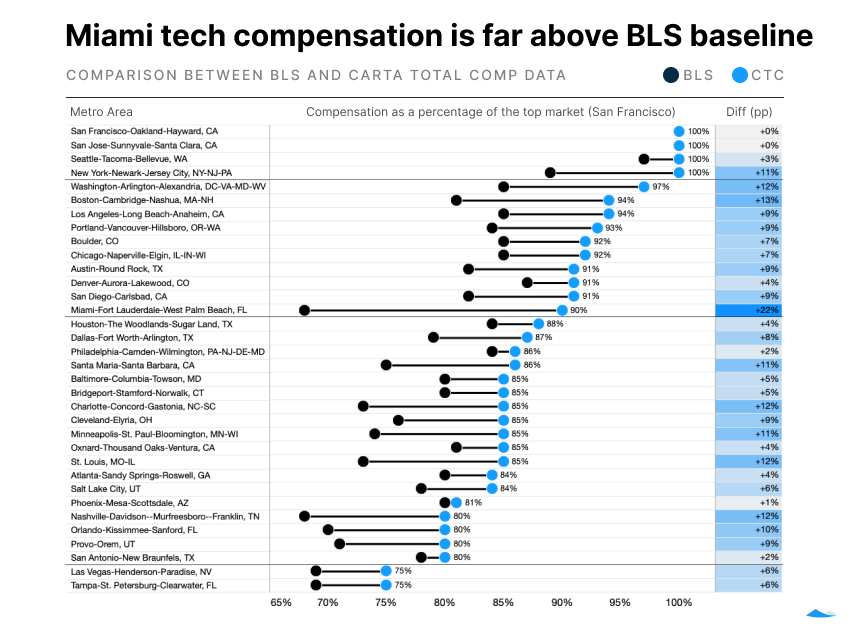
The compensation market for tech workers by region is fundamentally different than for employees in other industries. When we compare values taken from Carta Total Comp’s models to the standard adjustments recommended by the Bureau of Labor Statistics (BLS):
Carta Total Comp data shows higher pay in 32 metros areas when compared with BLS figures.
In nine metro areas, the gap is more than 10 percentage points
In Miami, tech workers are paid 90% of tech workers in San Francisco—while the standard BLS adjustment would have them making only 68% of a San Francisco worker.
Year-over-year changes in regional comp
As remote work has become more of an expectation in 2022, salaries have begun to converge toward the higher-tier metros. This is likely due to a combination of factors. Some employees have become remote but kept their salary. Some companies with newly remote workforces are now competing for talent in a variety of markets across the country, rather than just in their home states.
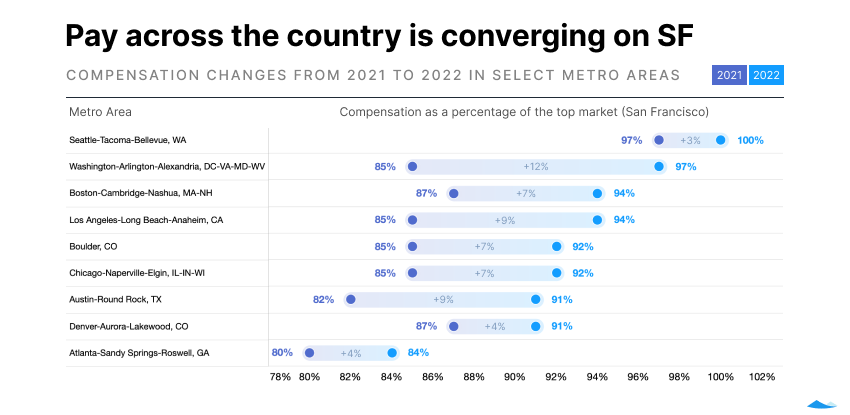
This trend, if it continues, will have far-reaching implications for both tech workers and the company leaders looking to make their next key hires. Companies could look abroad for talent more now that US cities are equalizing. New talent hubs may emerge outside of major cities. Non-tech salaries may rise to keep pace—or the difference between tech/non-tech compensation within a given city might expand. Market uncertainty could also begin to cool salaries across markets. We’ll continue to regularly report on the trends, and you can also find real-time compensation data on the Carta Total Comp platform.
*Note: this analysis does not take into account variable compensation for sales, which if included would increase overall payroll and the relative share of sales as a function.
Download the addendum
Methodology
This report examines compensation trends across venture-backed companies to provide useful benchmarks to company leaders.
Overall dataset
Carta helps more than 2,000 venture-backed companies compensate their employees through Carta Total Comp. The data presented above represents an aggregated, anonymized view into the pay strategies of these startups. Collectively Total Comp companies employ more than 125,000 employees. Companies that have contractually requested that we not use their data in anonymized and aggregated studies are not included in this analysis.
The data presented in this report represents a snapshot as of June 10, 2022. Historical data may change in future studies. New companies signing up for Carta’s services will increase the amount of data available for the report.
Industry groupings
We grouped industries as follows: “SaaS” includes CRM software, edtech, and HR software in addition to other software as a service companies; “health + biotech” also includes healthcare devices and healthcare tech; “consumer” includes consumer products and services, such as food, cannabis, and video games; “hardware + logistics” also includes renewable energy, semiconductors, telecom, and transportation; “fintech” includes financial exchanges; “data + security” includes cloud distribution, analytics, and cybersecurity; and “adtech + marketplace” also includes ecommerce and social media.
Metro analysis
All location analysis in the above report uses metropolitan statistical areas, or MSAs, as the geographic unit. We included the 49 metro areas in which Carta Total Comp has sufficient density of employees to make reasonable determinations as to the relative level of compensation.
Salary
All salaries presented in this report are expressed in U.S. dollars. Total payroll numbers do not include any variable compensation, such as bonuses or commissions, that may be given to employees.
All equity values presented in this report are expressed as a percentage of fully diluted company shares.
*Note: this analysis does not take into account variable compensation for sales, which if included would increase overall payroll and the relative share of sales as a function.

DISCLOSURE: This communication is on behalf of eShares Inc., d/b/a Carta Inc. (“Carta”). This communication is for informational purposes only, and contains general information only. Carta is not, by means of this communication, rendering accounting, business, financial, investment, legal, tax, or other professional advice or services. This publication is not a substitute for such professional advice or services nor should it be used as a basis for any decision or action that may affect your business or interests. Before making any decision or taking any action that may affect your business or interests, you should consult a qualified professional advisor. This communication is not intended as a recommendation, offer or solicitation for the purchase or sale of any security. Carta does not assume any liability for reliance on the information provided herein. ©2022 eShares Inc., d/b/a Carta Inc. (“Carta”). All rights reserved. Reproduction prohibited.