The U.S. venture capital market is an immense engine for job creation and a crucial driver of economic growth. Each year, venture investors put many billions of dollars to work in the attempt to find and help build the next generation of great companies. That capital supports a vast ecosystem of founders, startups, and employees that extends to every corner of the country.
Each year since 2018, Carta has reported on the state of equity and diversity within this venture ecosystem. Using aggregated and anonymized data from tens of thousands of startups employing more than 1.5 million people, we examine how opportunities to found companies, raise venture funding, and work at startups are distributed according to race and gender.
Our goal: to gather, analyze, and share data on the state of startups to see where inequities exist throughout the critically important entrepreneurial ecosystem.
One such place is in the realm of startup valuations. At every stage from seed to Series C, median pre-money valuations over the past two years have been higher for startups with male CEOs than for startups with women as CEOs. The same trend holds for check sizes. At each stage, the median round size among companies led by women is smaller than the median for companies led by men.
These are just two examples out of many. In some areas, the venture ecosystem has made clear progress toward improving diversity over the past several years. In others, however, there exists much more work to be done.
This data comes from U.S.-based stakeholders who opted to fill out a demographic profile page for the purposes of aggregated, anonymized equity compensation analysis. We cover over 108,000 founders and 877,000 startup employees. In some cases we’ve used data science classifiers to aggregate missing data on demographic categories. More on our approach here.
Employees
Race & Ethnicity
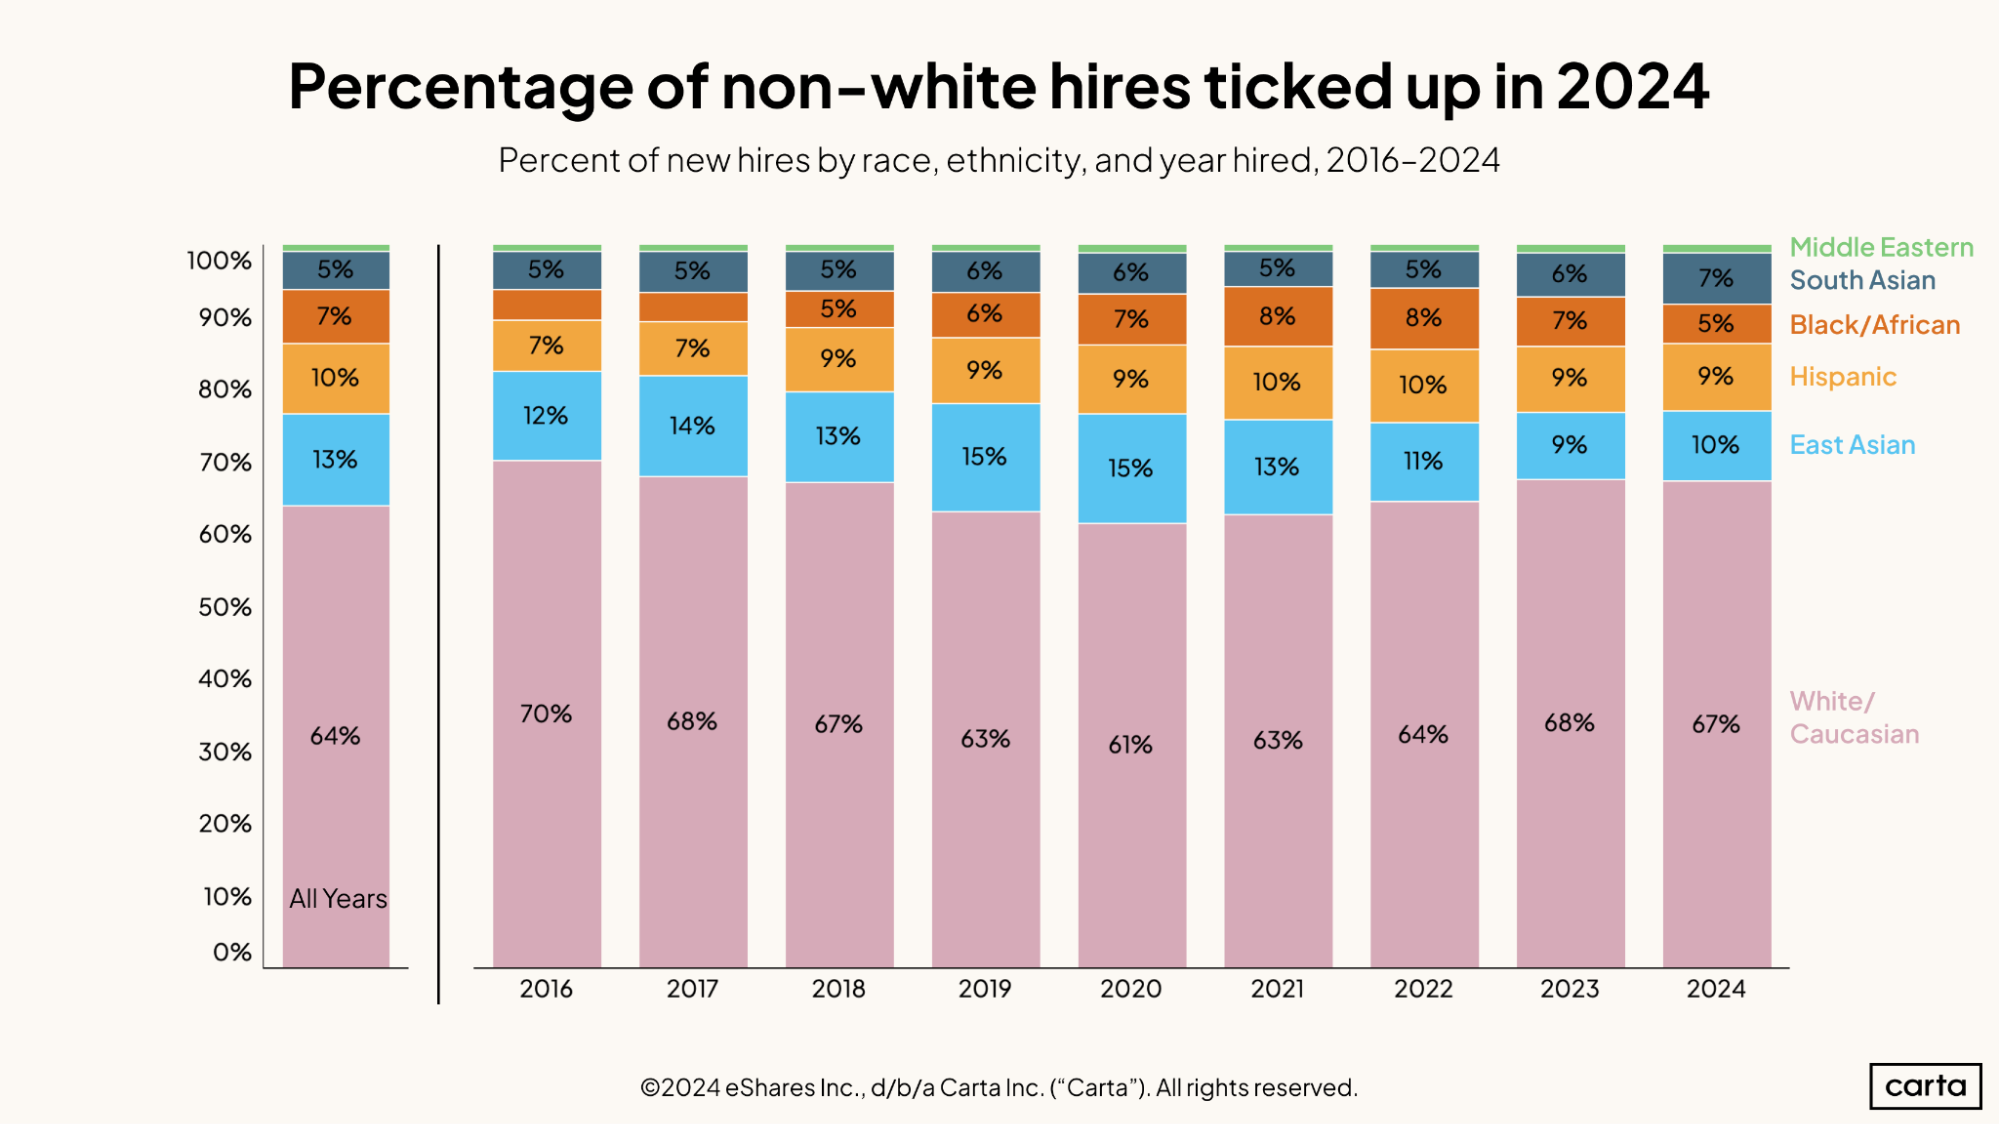
So far this year, according to Carta data, about 33% of new hires come from a non-white ethnic and racial background, up from 32% in 2023. This ends a streak of three consecutive years in which the proportion of hires from non-white racial and ethnic backgrounds had declined. Back in 2020, 39% of all new hires on Carta identified as a race or ethnicity other than white.
Over the past nine years combined, white employees have made up about 64% of all new hires on Carta. This year’s rate is thus higher than the recent average. Conversely, employees from East Asian backgrounds have made up a smaller-than-usual percentage of new hires in 2024. They comprised 10% of new hires in 2024, a few percentage points lower than the 13% rate over the past nine years.
So far this year, the percentage of new hires who identify as South Asian has increased to 7%, the highest it’s been since at least 2016. The percentage of new hires who identify as Black or African, meanwhile, has dropped to 5%, the lowest figure since 2018.
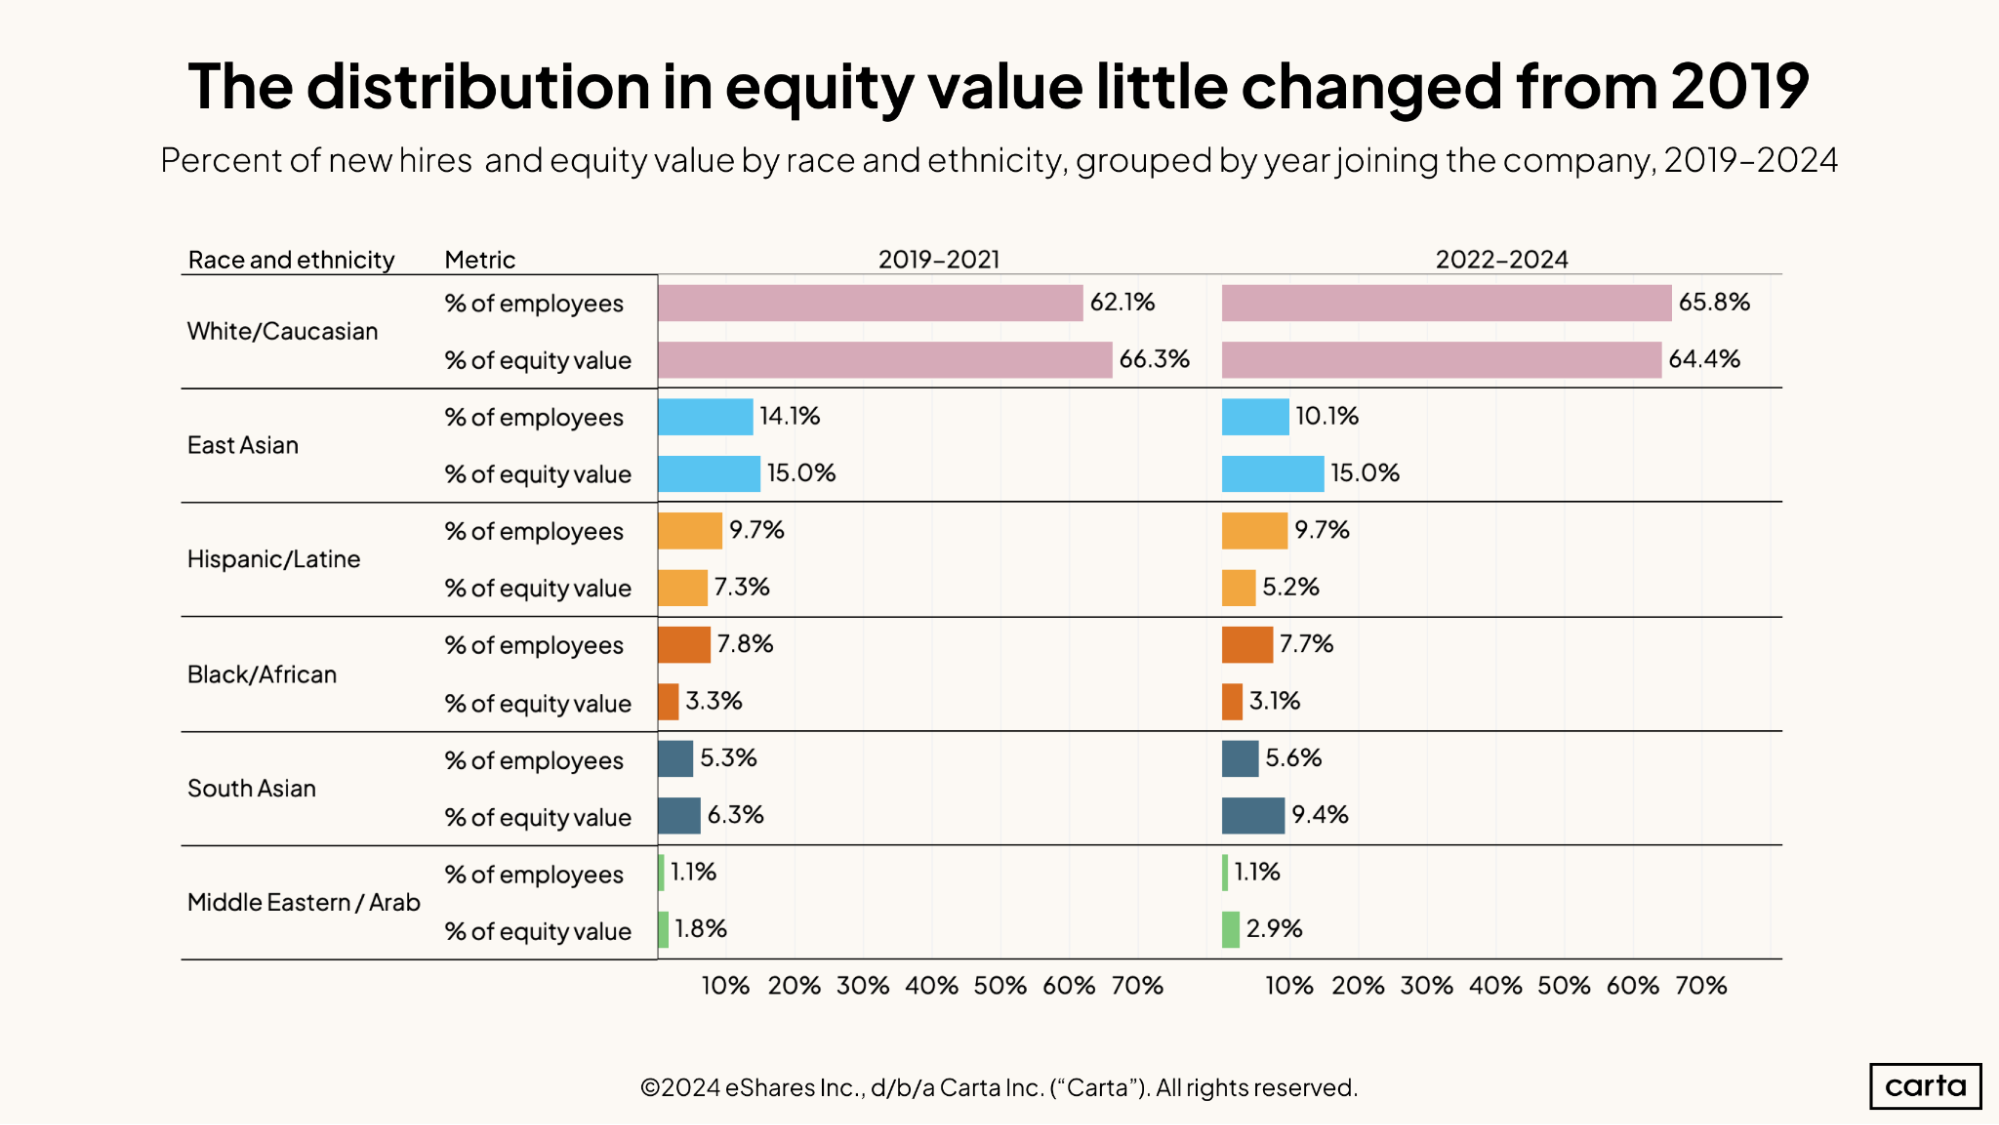
The distribution of newly issued equity among various racial and ethnic groups has mostly stayed consistent in the past three years compared to the previous three-year period. The largest change came among South Asian employees, who saw their share of equity increase from 6.3% to 9.4%.
Just about 10% of all employees on Carta hired since the start of 2022 identify as East Asian. Yet these employees hold about 15% of the total equity value that’s been issued to employees over that span. The percentage of equity held is also higher than the percentage of jobs held among employees who identify as South Asian and as Middle Eastern or Arab.
This statistical relationship suggests that employees from these racial and ethnic backgrounds are more likely to hold the sorts of high-ranking roles that receive higher-than-average amounts of equity. These trends have intensified in the past three years compared to the previous three-year period.
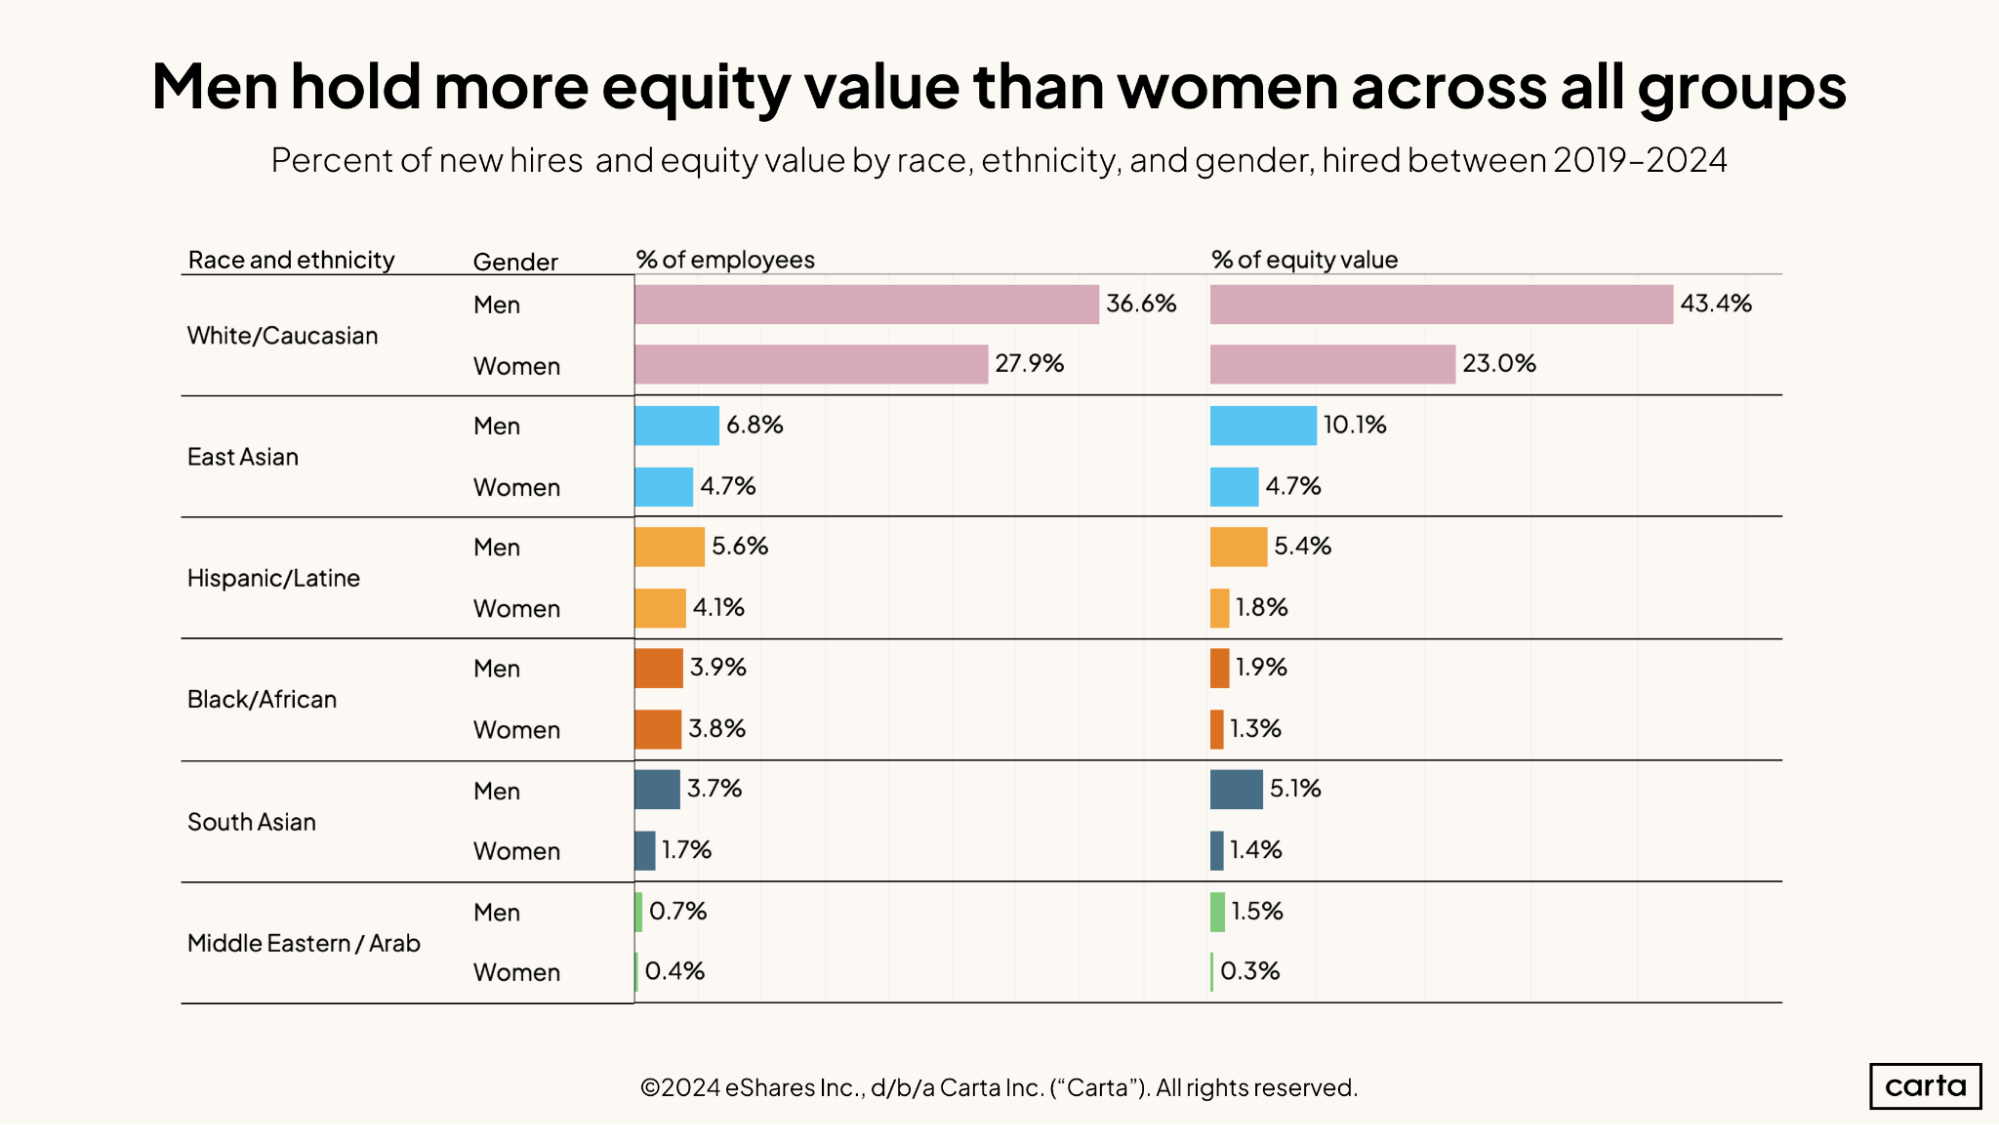
Across every racial and ethnic group in this study, men make up a higher percentage of all new hires than women and receive a larger portion of all issued equity. But in each racial and ethnic group, the gender skew is more extreme when it comes to equity.
For example, white men account for 36.6% of new hires since the start of 2019, and white women account for 27.9%. However, white men have received 43.4% of issued equity over that span, compared to 23% for white women, a difference of more than 20 percentage points. That’s a much wider gap.
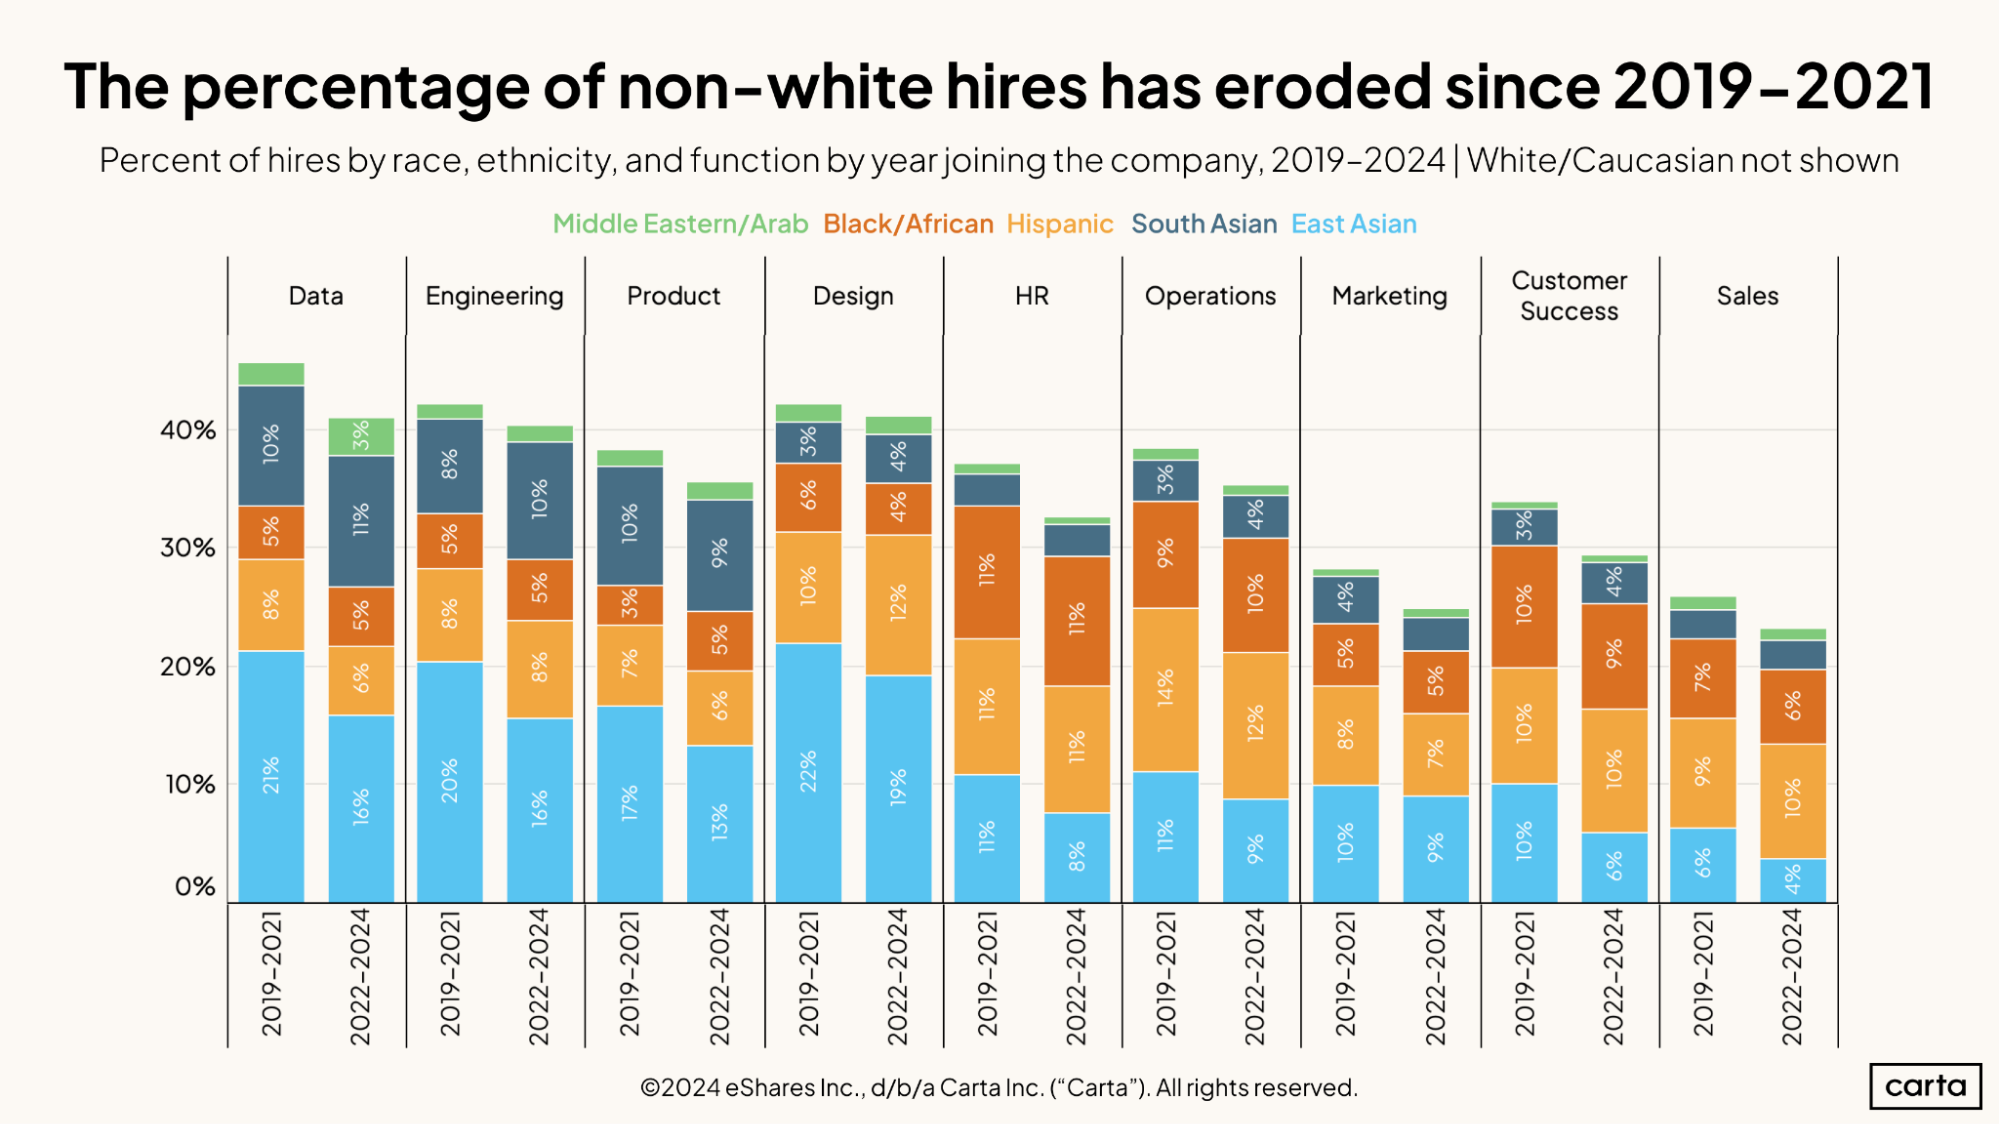
Racial and ethnic diversity has been decreasing at startups across the board. In every major job function, the percentage of new hires from non-white racial and ethnic backgrounds has been lower from 2022 through 2024 than it was from 2019 through 2021.
In many job functions, much of this shift is due to a decline in the number of hires from East Asian backgrounds. In the data function, East Asian employees made up 16% of new hires from 2022 through 2024, down from 21% in the stretch from 2019 through 2021. In engineering, the portion of East Asian hires fell from 20% to 16% over the same span.
Gender
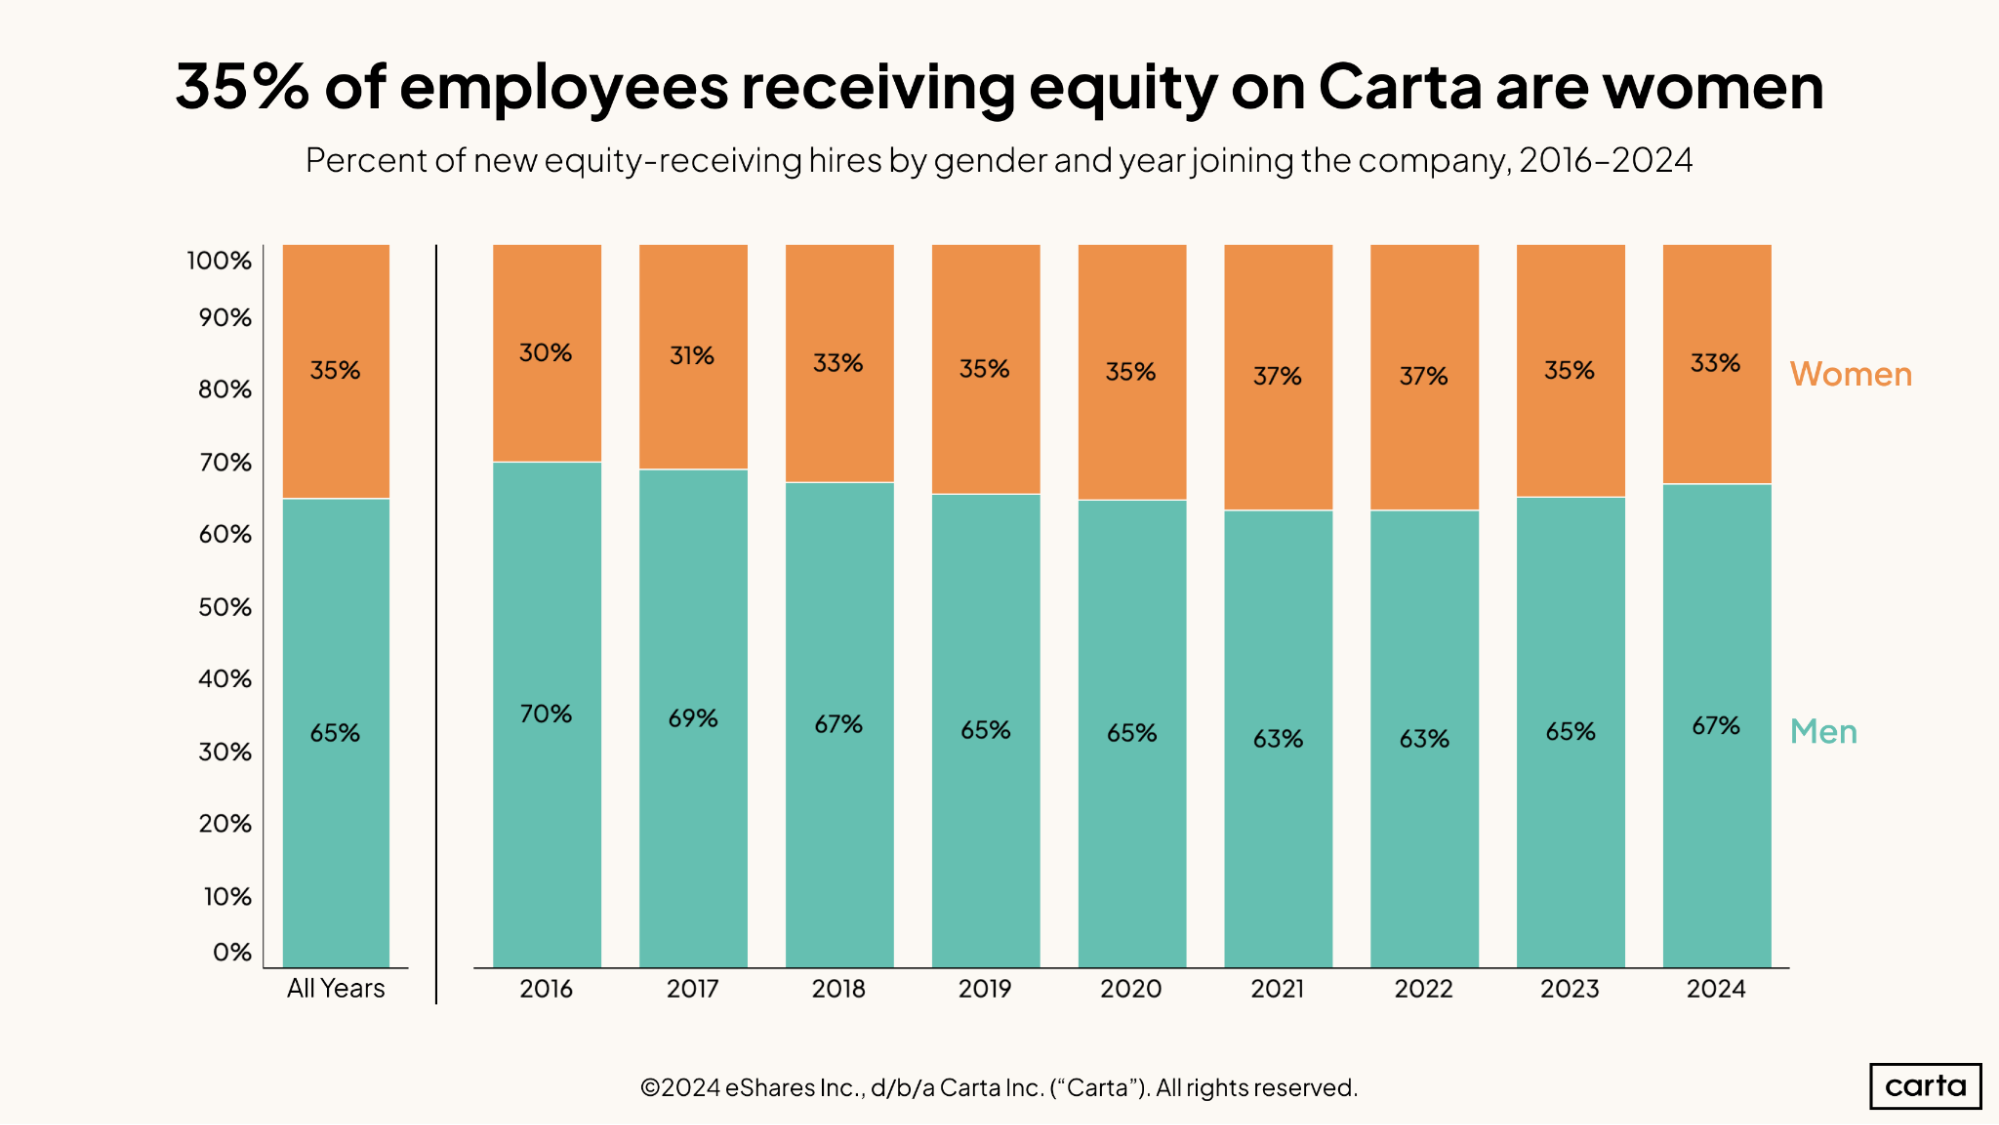
The portion of all new hires in equity-receiving roles who are women has fallen to 33% in 2024, its lowest point since 2018. The rate of new hires who were women rose steadily throughout the late 2010s and early 2020s, climbing from 30% in 2016 to 37% in 2021. Now, it’s fallen in two straight years.
Still, the gender divide in hiring in 2024 isn’t too far off recent norms. Across the past nine years combined, about 65% of all new equity-receiving hires have been men and about 35% have been women.
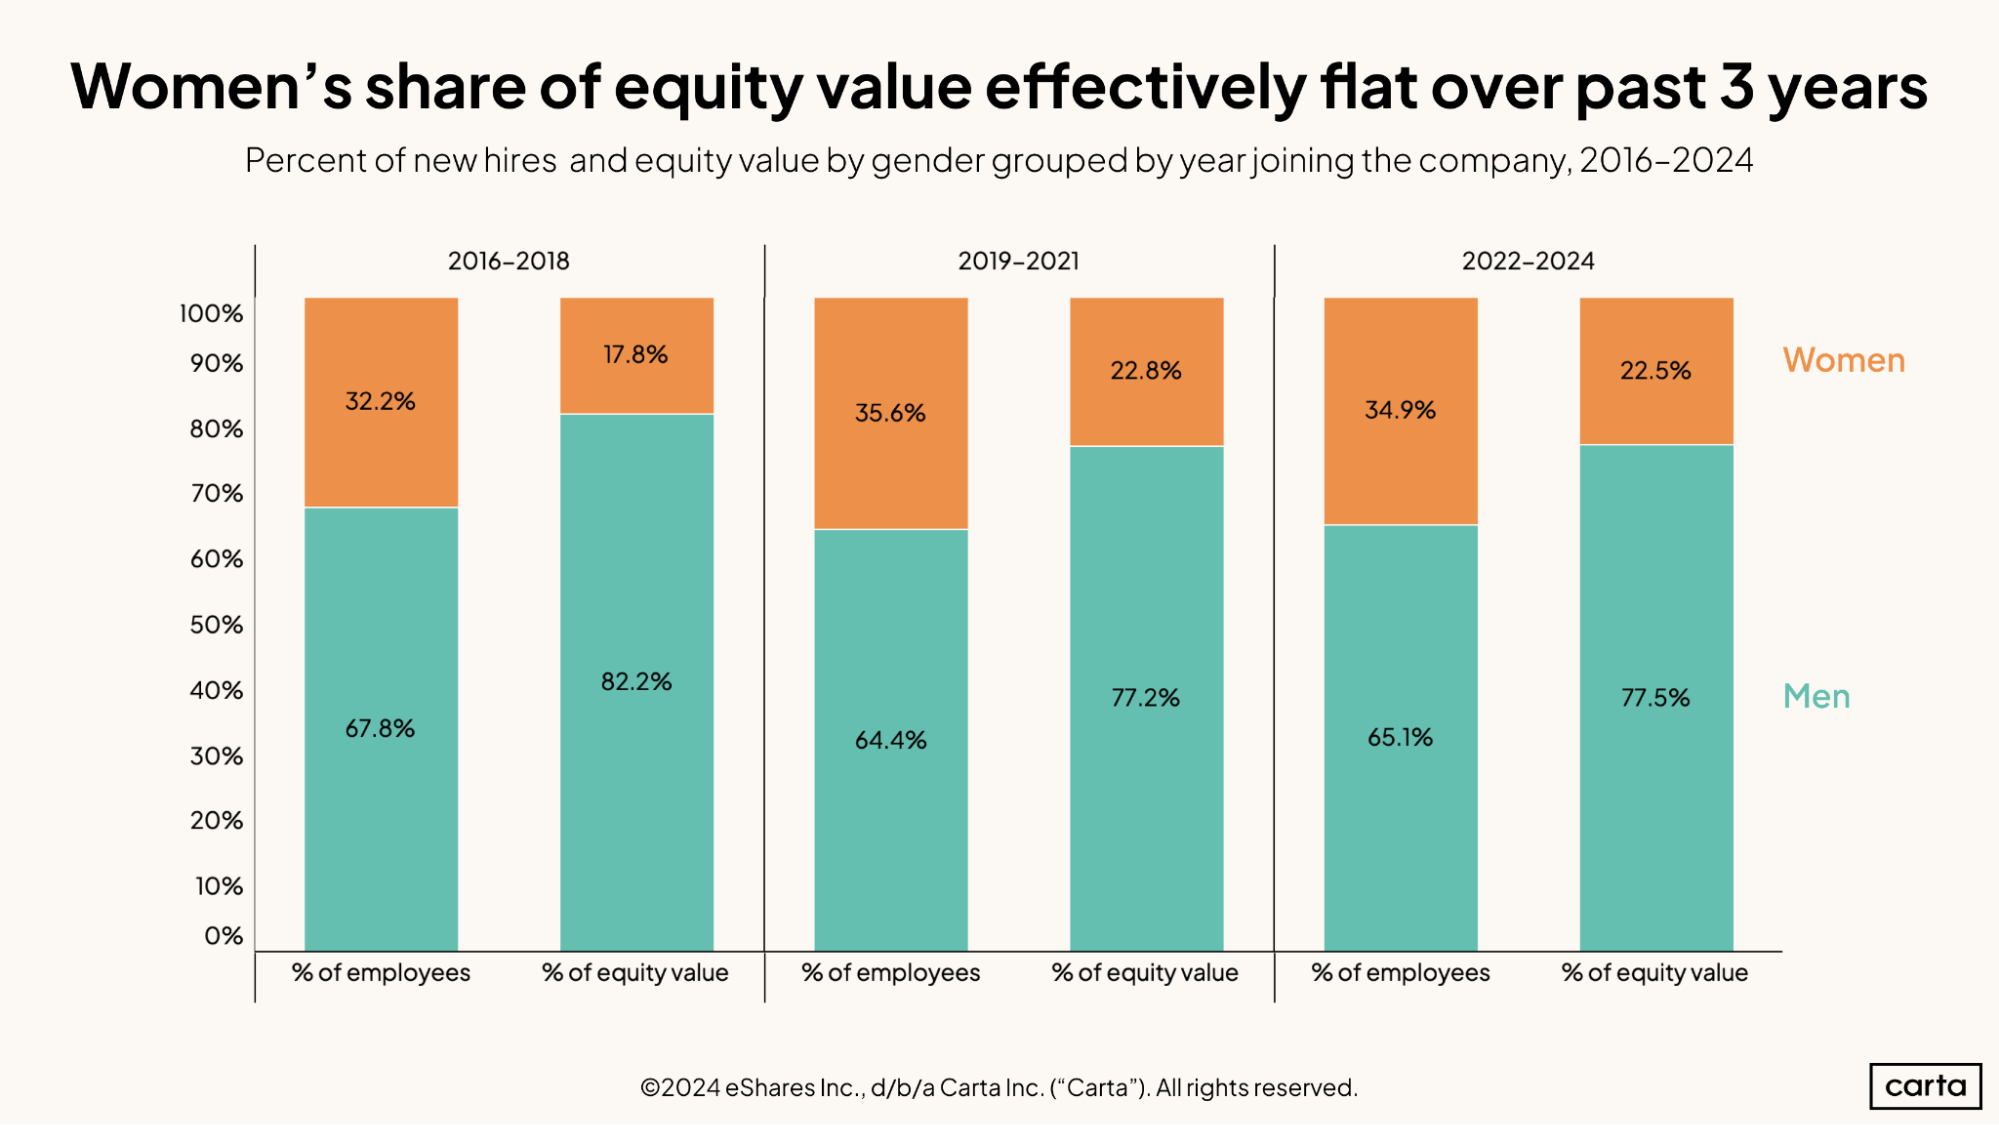
Over the past three years combined, just about 35% of all new hires on Carta were women; those women received 22.5% of all new equity issued on Carta. In both cases, those percentages are nearly identical to where they fell during the previous three-year period.
There is a little more variation compared to the three-year period before that, from 2016 to 2018. In that stretch, the share of all new hires that are women was nearly three percentage points lower than it was from 2022 through 2024, while the share of equity value that went to women was nearly five percentage points lower.
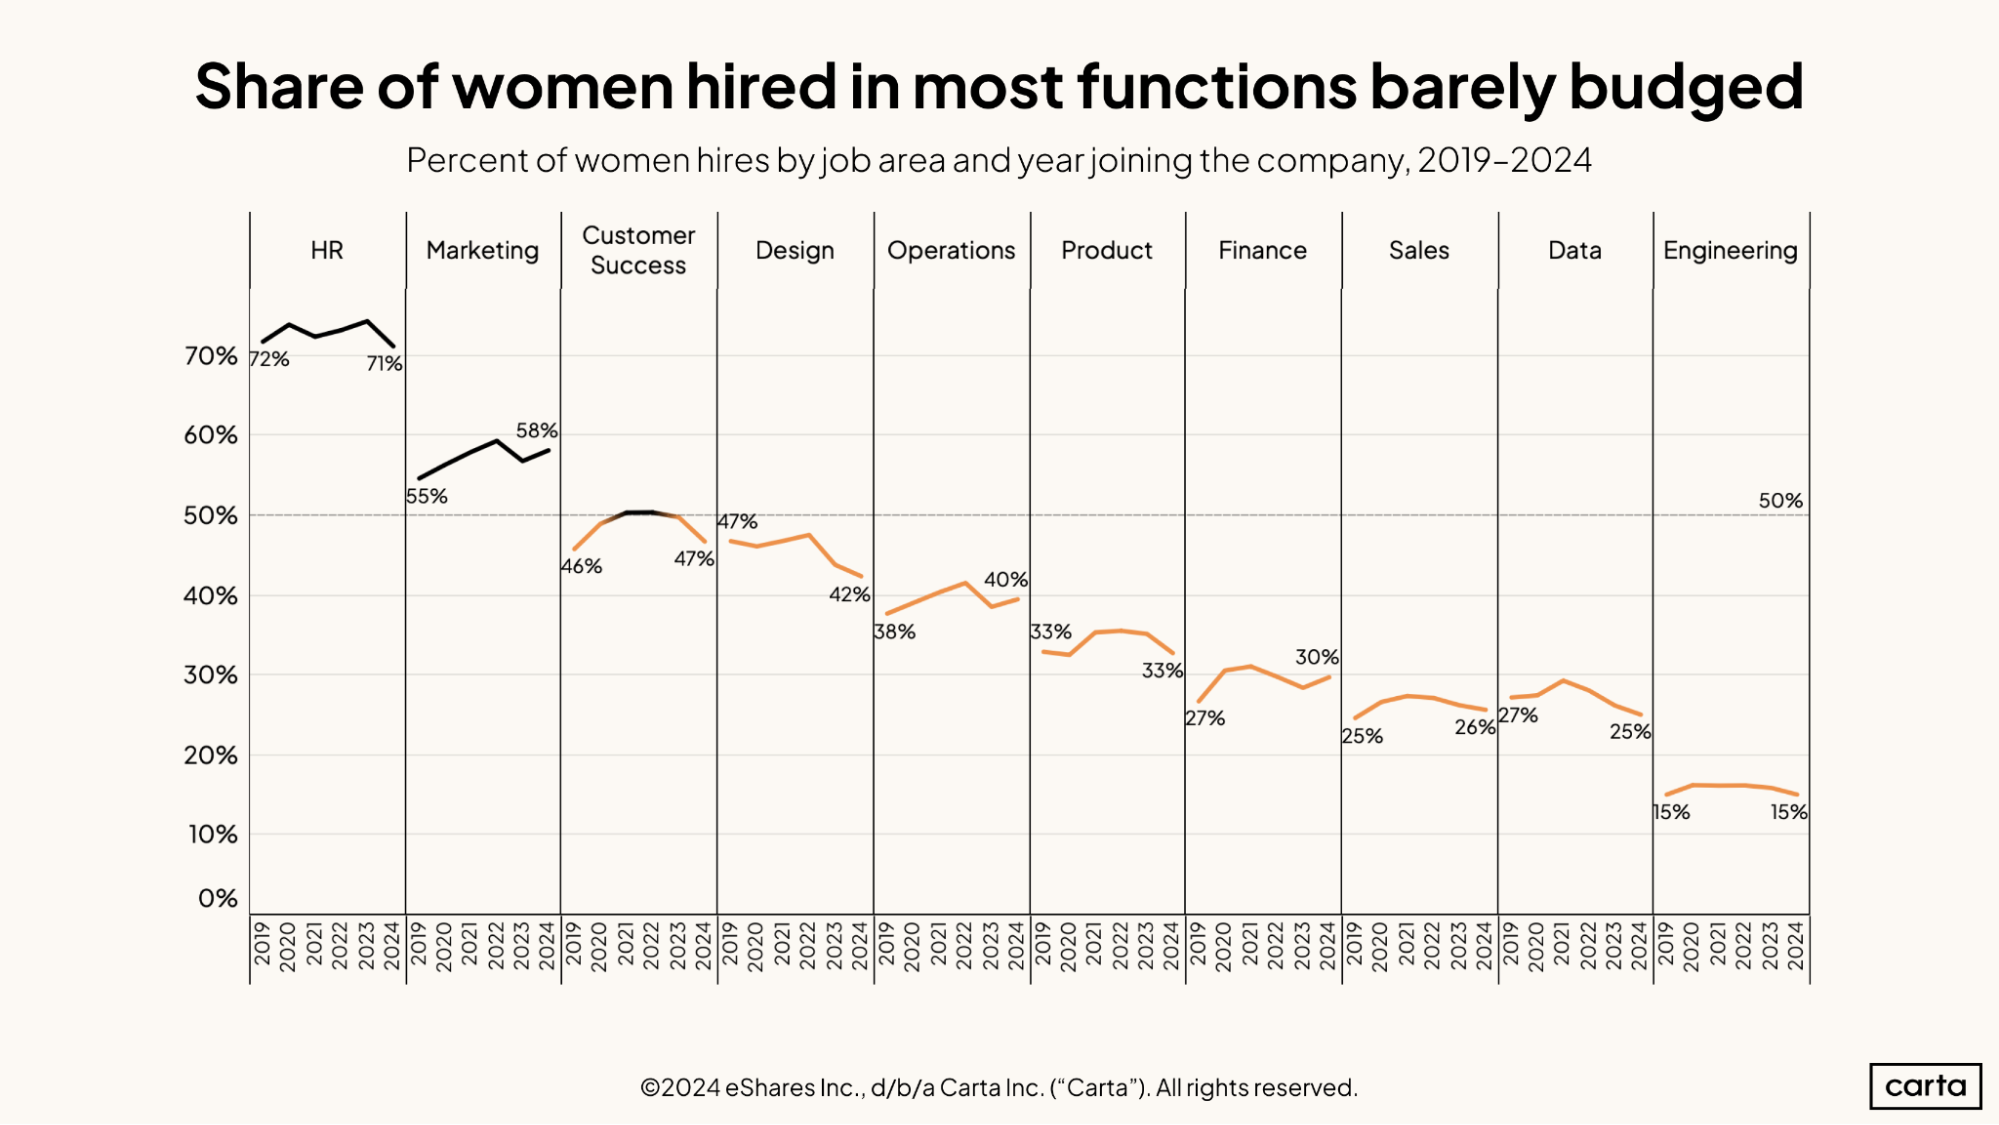
Over the past six years, there were a few shifts in the gender divide among new hires across different job functions. For the most part, however, these changes were slight.
In HR, the percentage of new hires who are women went from 72% in 2019 to 71% in 2024. In marketing, the rate went from 55% to 58%. These are the only two job functions where women make up at least 50% of all hires.
The biggest shift in the market occurred in design, where the rate of new hires who are women has fallen from 47% to 42%. In engineering, the gender demographics of new hires are unchanged over the past six years, with women still filling just 15% of all roles.
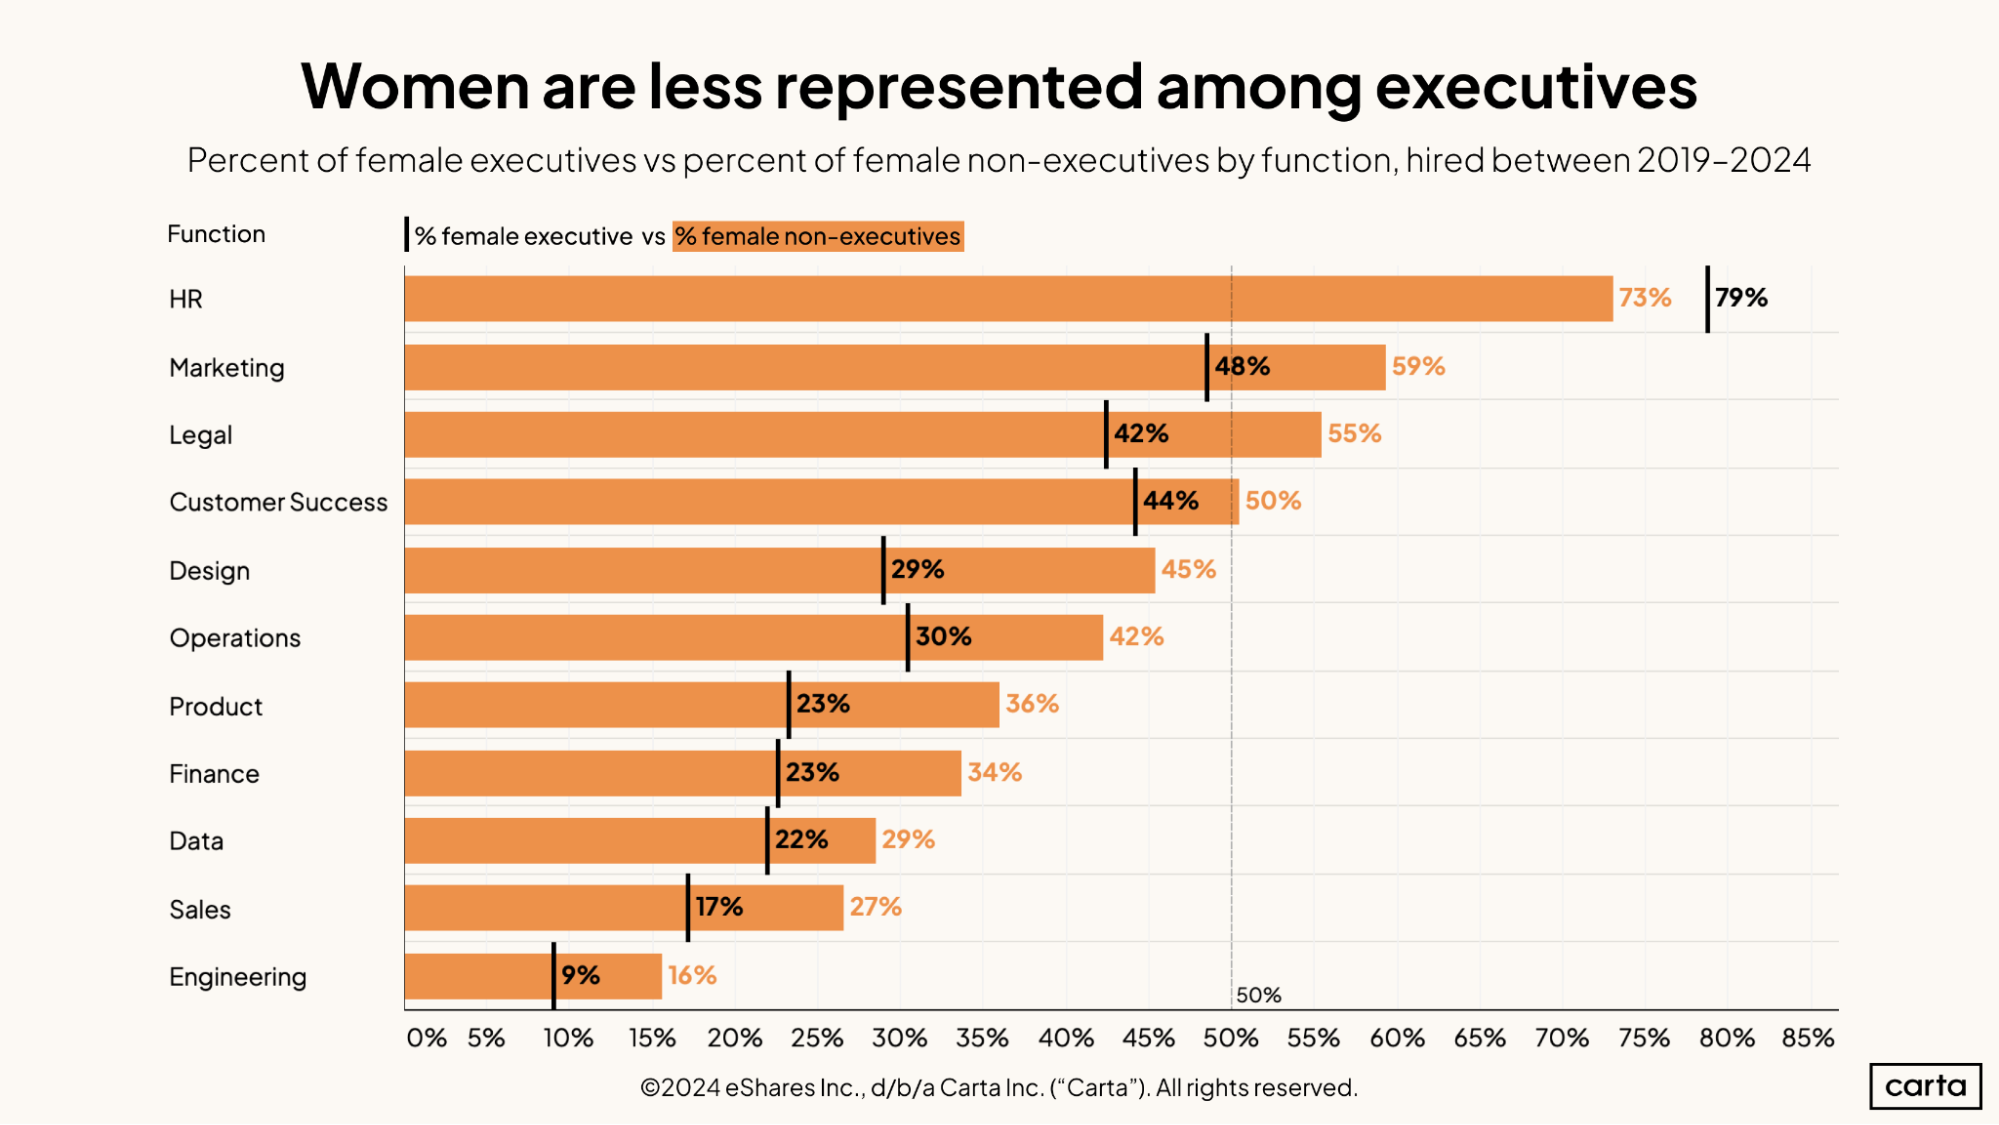
In every job function except for HR, the percentage of women who fill executive roles is smaller than the percentage of women in non-executive roles. Relative to the number of women employed across startups as a whole, women remain underrepresented in the C-suite.
HR is also the only job function in this study in which women make up more than 50% of executives. In every other function, men are the majority. In key job functions such as product, finance, sales, and engineering, women account for less than a quarter of all executives over the past six years—in some cases far less.
Executives tend to receive larger equity packages than rank-and-file employees. This underrepresentation of women in executive roles helps explain why the percentage of all issued equity that women receive is smaller than the overall percentage of women among all employees.
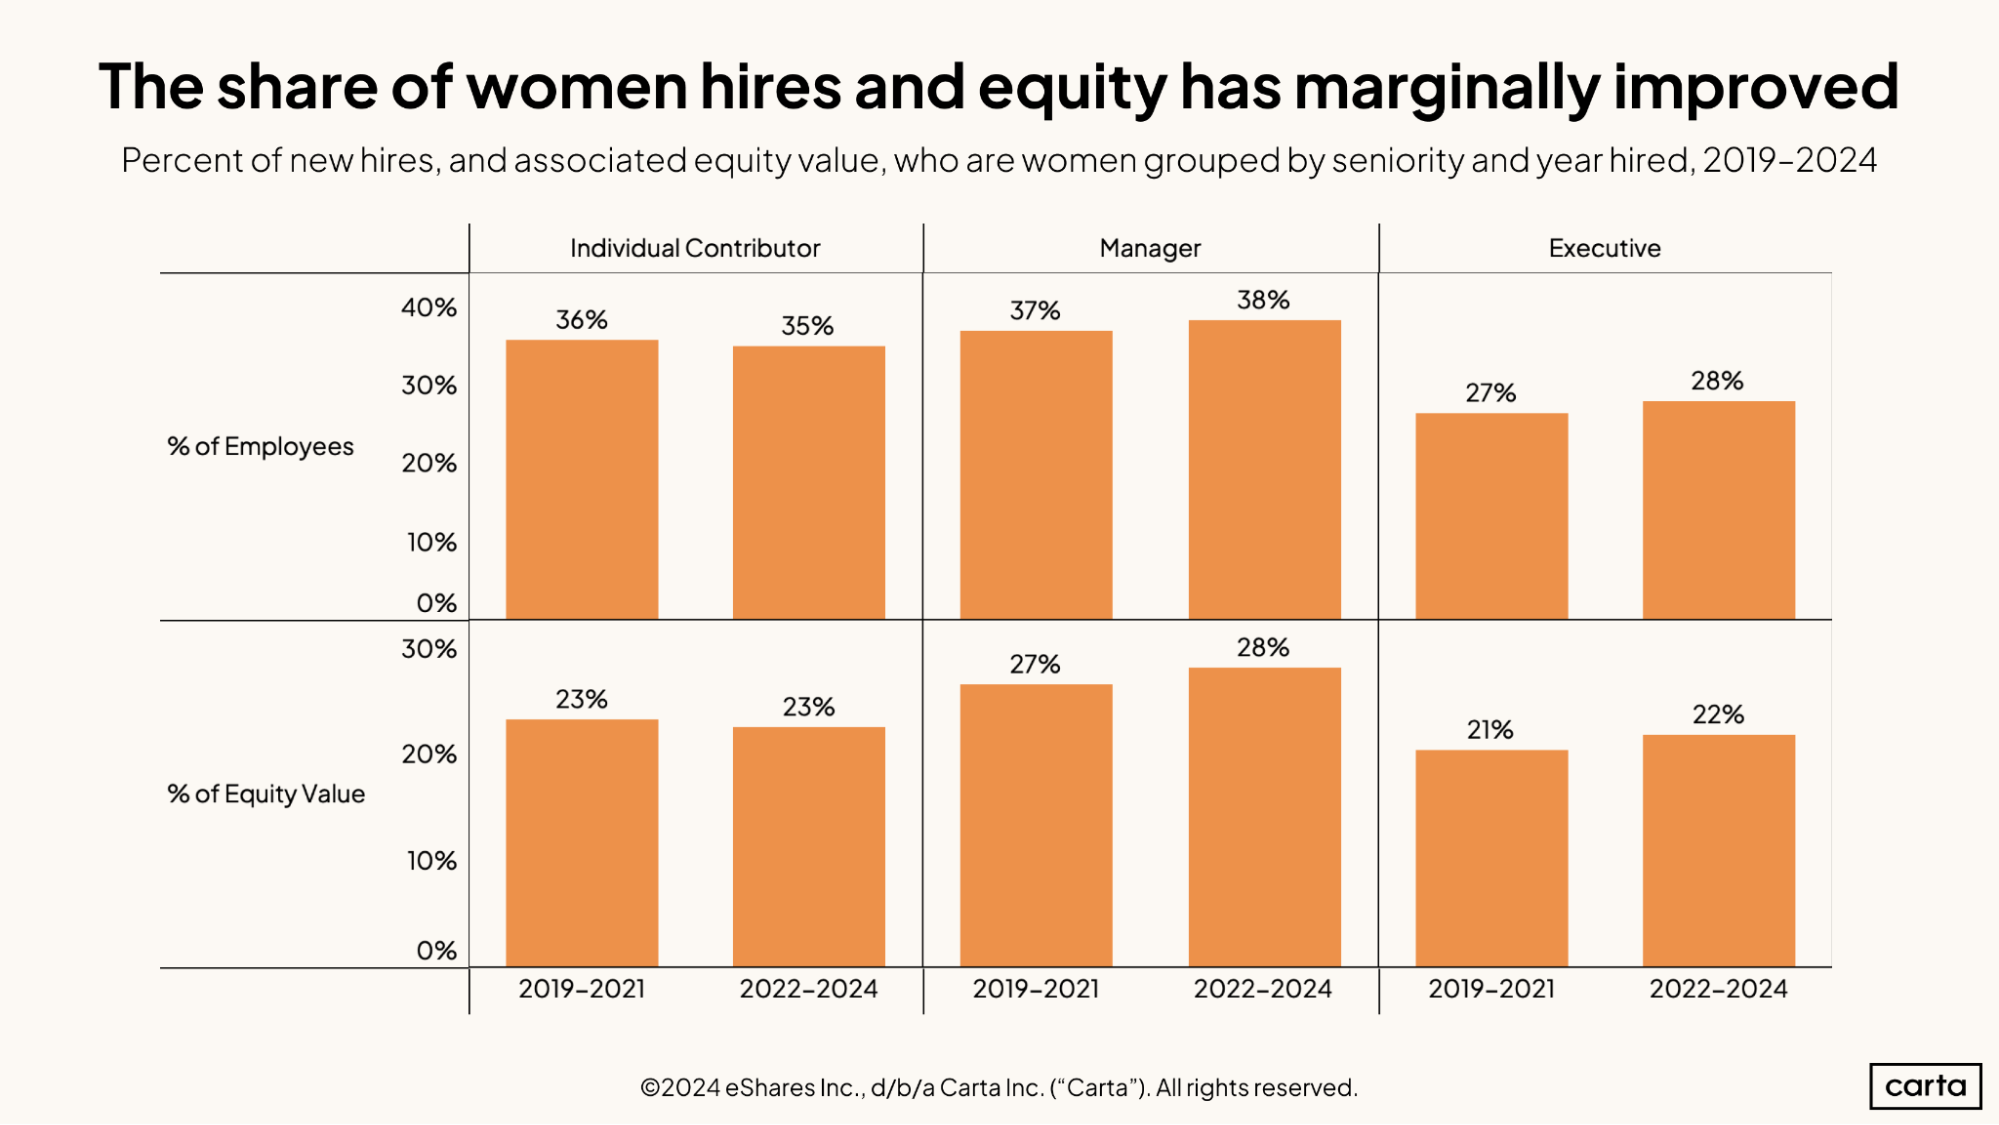
Since the start of 2022, the percentage of managers and executives who are women has increased slightly compared to the rates from 2019 through 2021. Women have accounted for 38% of all managerial hires over the past three years, compared to 37% in the previous time period.
These women have also received a slightly larger piece of the equity pie. Women received about 28% of all equity issued that was issued to managers over the past three years, up from 27%.
However, as these numbers show, the proportion of equity issued at managerial and executive levels that goes to women still lags well behind the proportion of jobs that go to women. The reverse is true for men in these roles. This statistical relationship means that the average man who’s hired as a manager or executive receives more equity value than the average woman hired as a manager or executive.
Founders
Race & Ethnicity
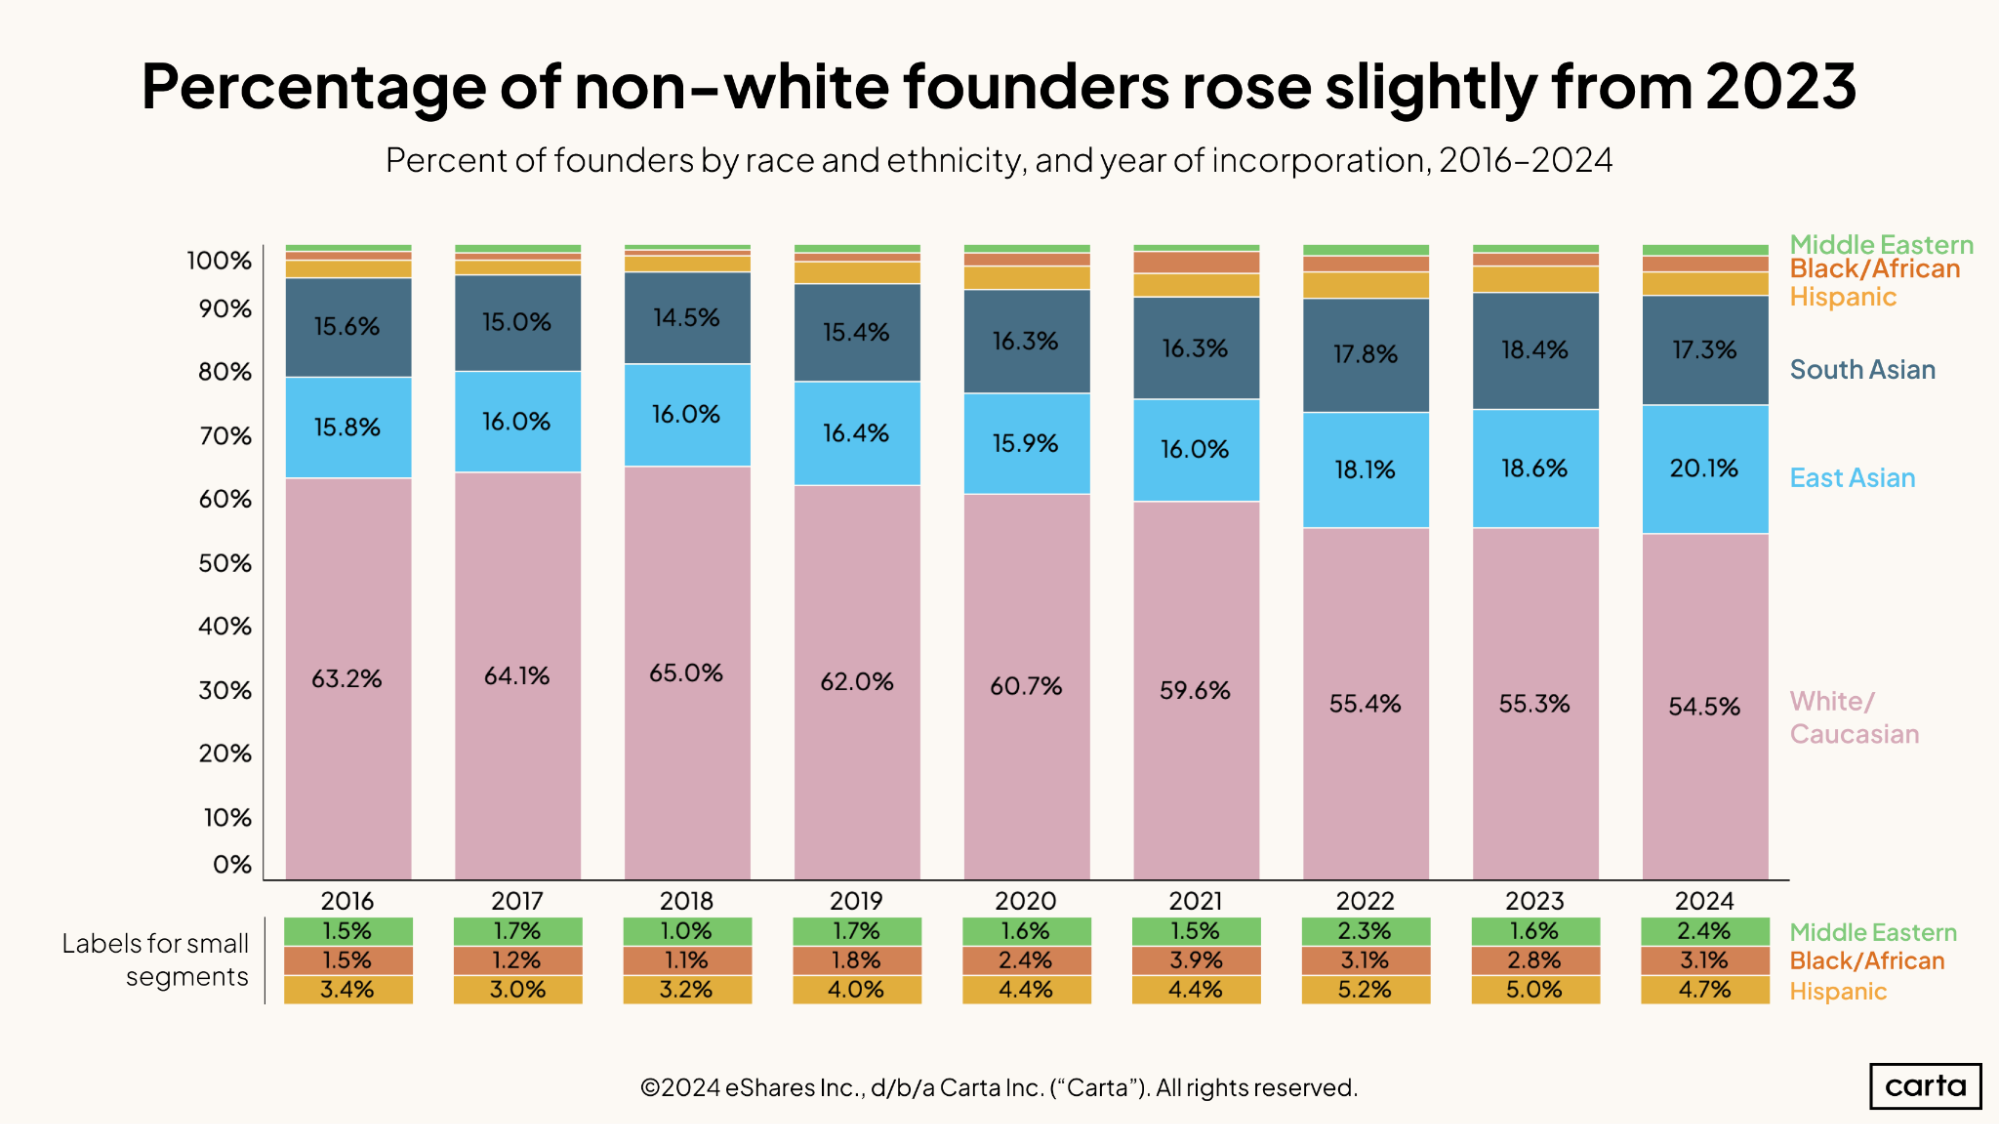
The percentage of startup founders who come from non-white racial and ethnic backgrounds continues to rise. In 2024, the proportion of founders on Carta who are either East Asian, South Asian, Hispanic, Black or African, or Middle Eastern rose to 45.5%, the highest it’s ever been.
In 2018, non-white founders comprised just 35% of the founder population on Carta. That figure has now climbed by more than 10% in just six years.
Over that span, every non-white racial and ethnic background has seen an increase in its percentage of founders. The percentage of founders who are Black or African nearly tripled from 2018 to 2024, rising from 1.1% to 3.1%.
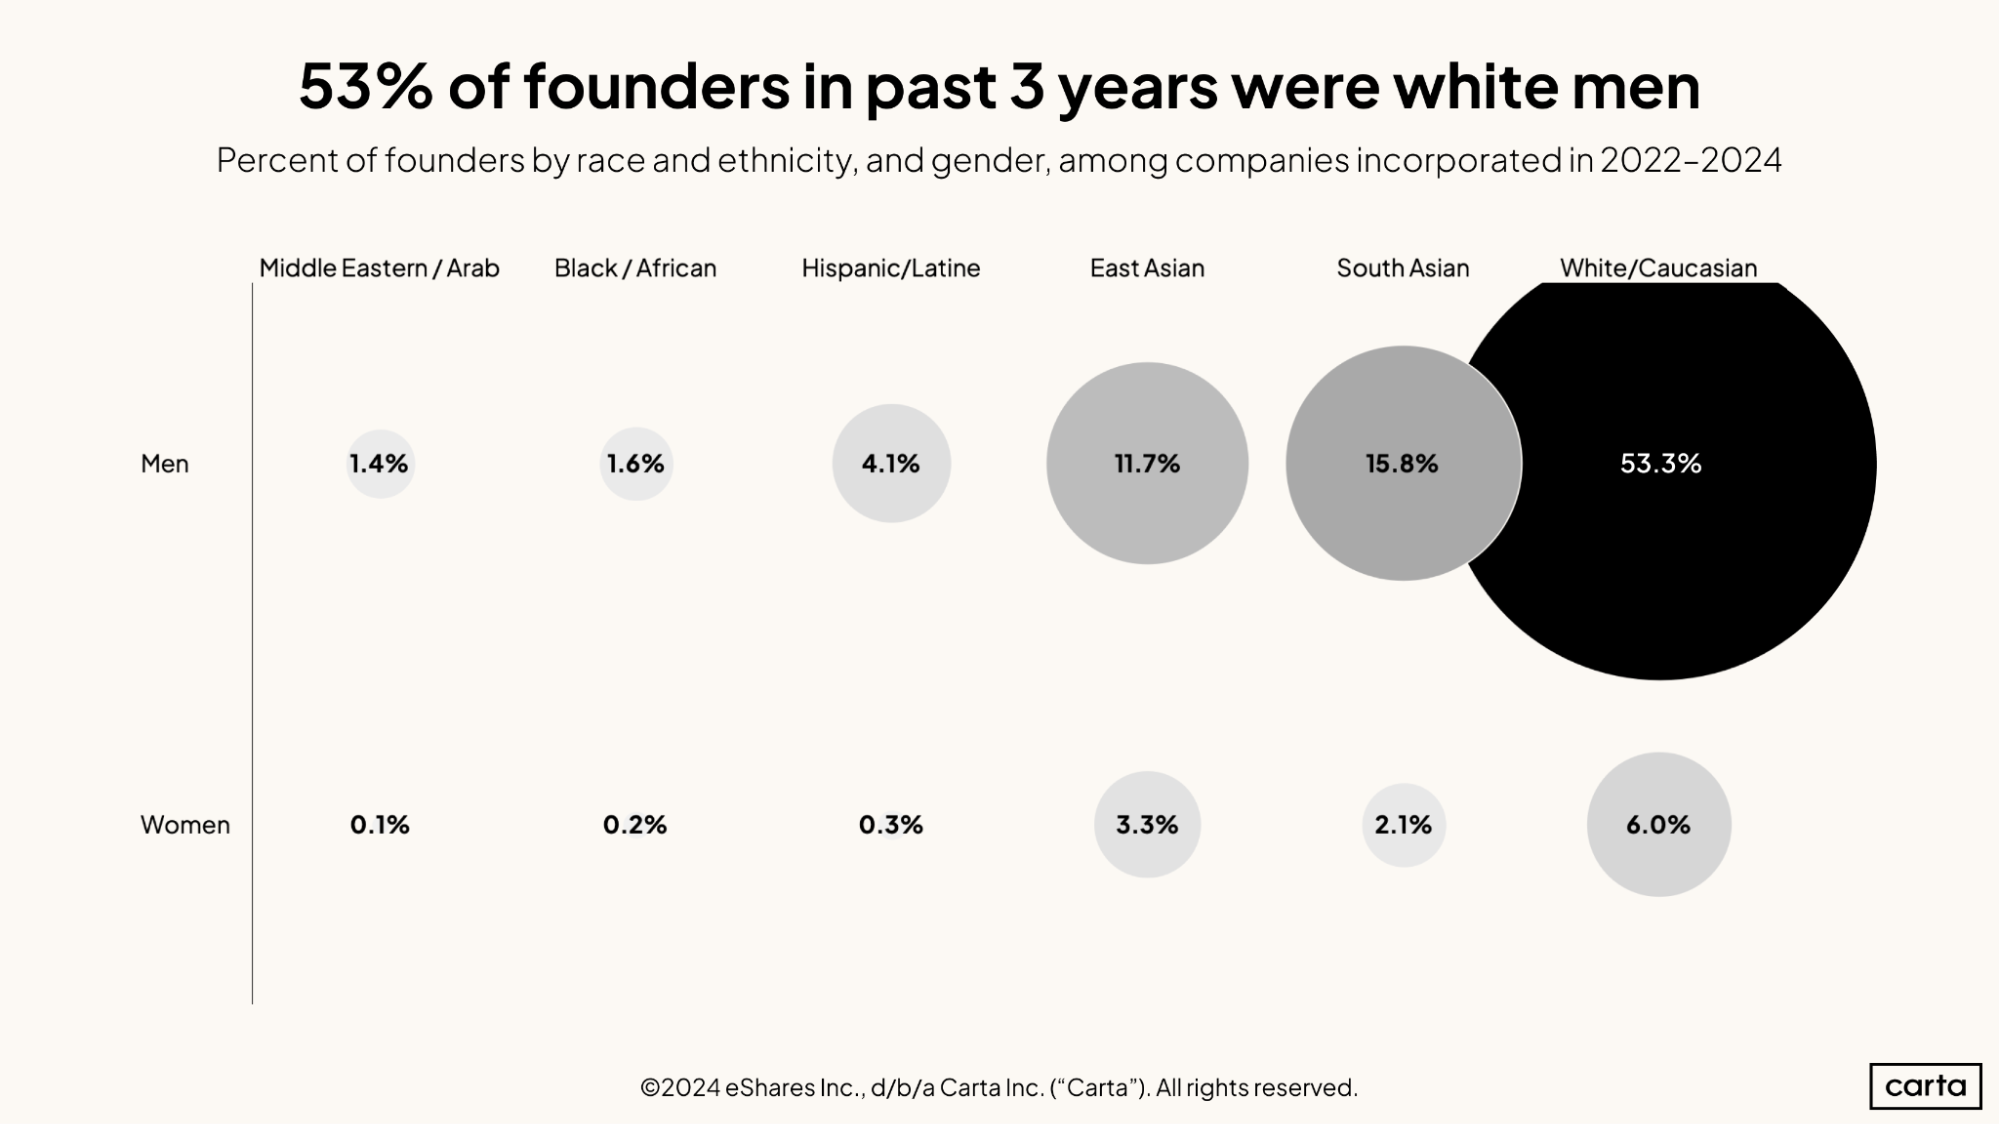
These recent increases in diversity don’t change the fact that a majority of all founders are white men. Over the past three years, 53.5% of all founders on Carta were White men. The next most commonly represented demographic groups were South Asian men, who made up 15.8% of all founders, and East Asian men, at 11.7%.
Across all racial and ethnic groups, 88.1% of founders who formed companies on Carta between 2022 and 2024 were men. Female founders who come from Hispanic, Black or African, and Middle Eastern backgrounds each account for less than 0.5% of the total founder population.
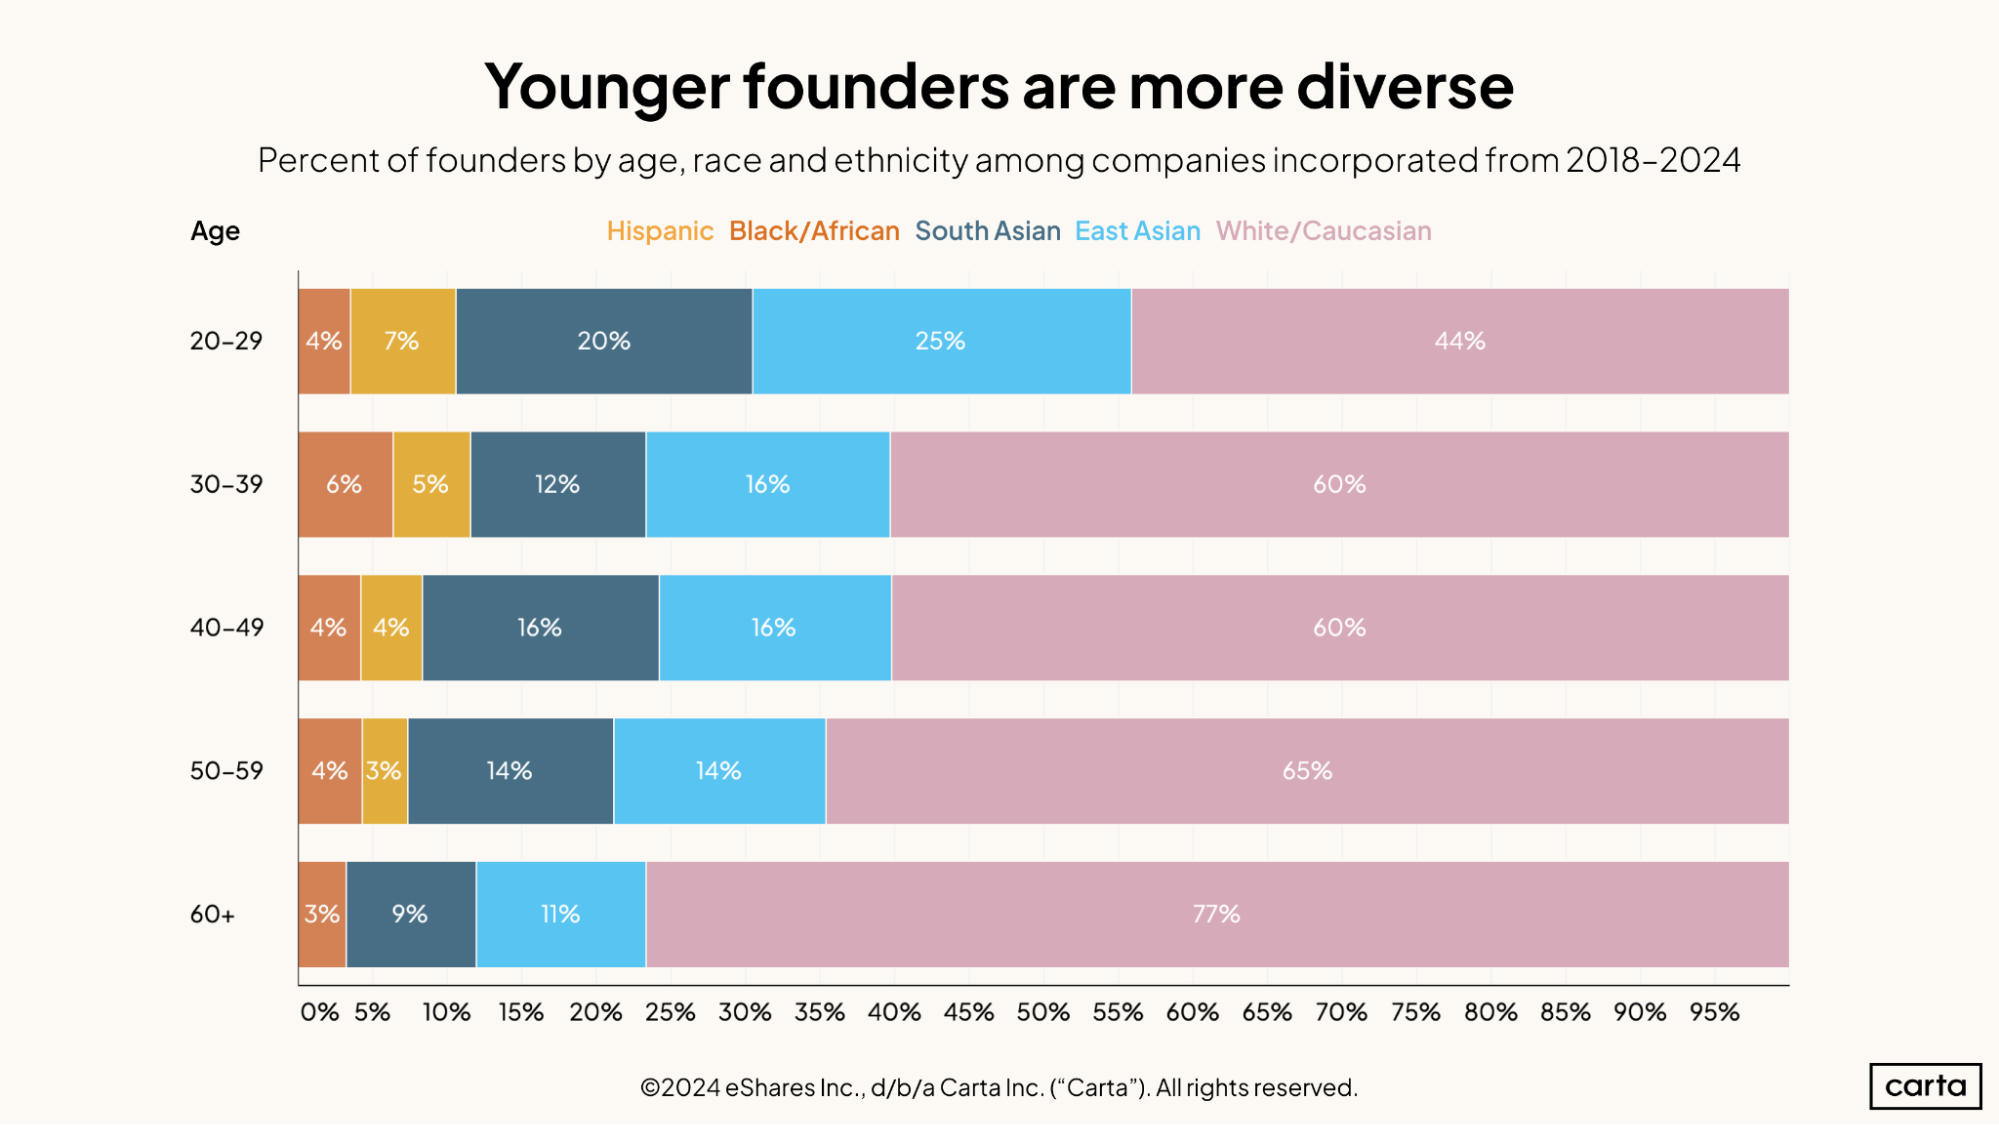
If we group all founders on Carta by age, younger cohorts are far more racially and ethnically diverse than older cohorts. Just 44% of all founders between the ages of 20 and 29 are white, with the other 56% coming from non-white racial and ethnic backgrounds. Contrast that to the group of founders who are 60 or older, of whom 76% are white.
It seems clear that the population of entrepreneurs with both the desire and the means to found a company is growing steadily more diverse as time goes on. It’s also possible other variables exist that make it less likely that founders from non-white backgrounds will continue to start new companies into their 50s and 60s.
In the 20 through 29 cohort, founders from East Asian and South Asian backgrounds account for 45% of all new founders, higher than the rate of white founders. In older cohorts, this number is much smaller: About 28% of founders aged 50 to 59 are of East Asian or South Asian descent. In the over 60 cohort, the number drops to 20%.
Gender
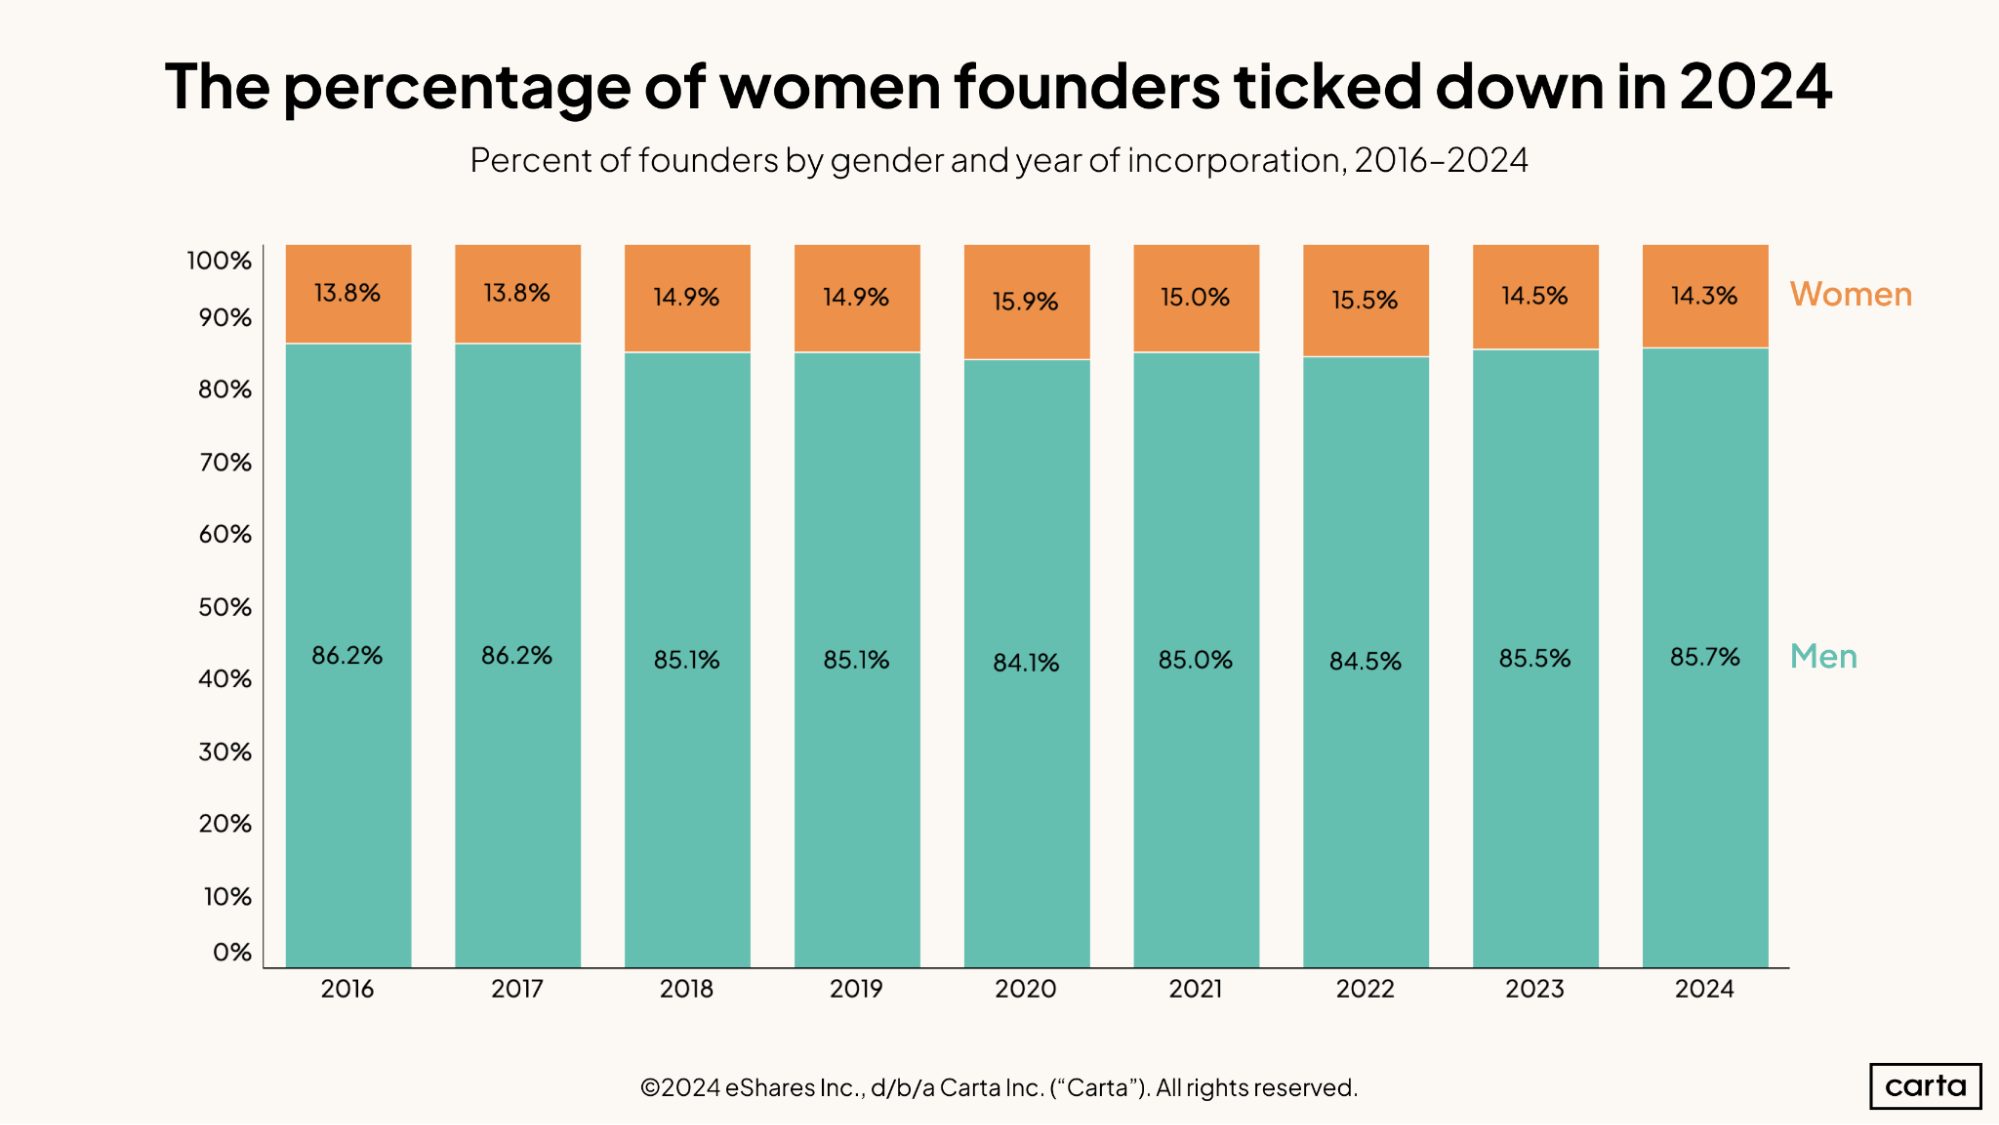
The percentage of all new founders on Carta who are women fell slightly in 2024, dropping from 14.5% to 14.3%. The recent peak for the prevalence of female founders came in 2020, when women comprised 15.9% of the total founder pool.
While the variations are slight, the recent history of this gender divide among founders follows a clear pattern: From 2016 through 2020, women made up a steadily growing segment of the total founder population. From 2021 onward, the percentage of founders who are women has been steadily shrinking.
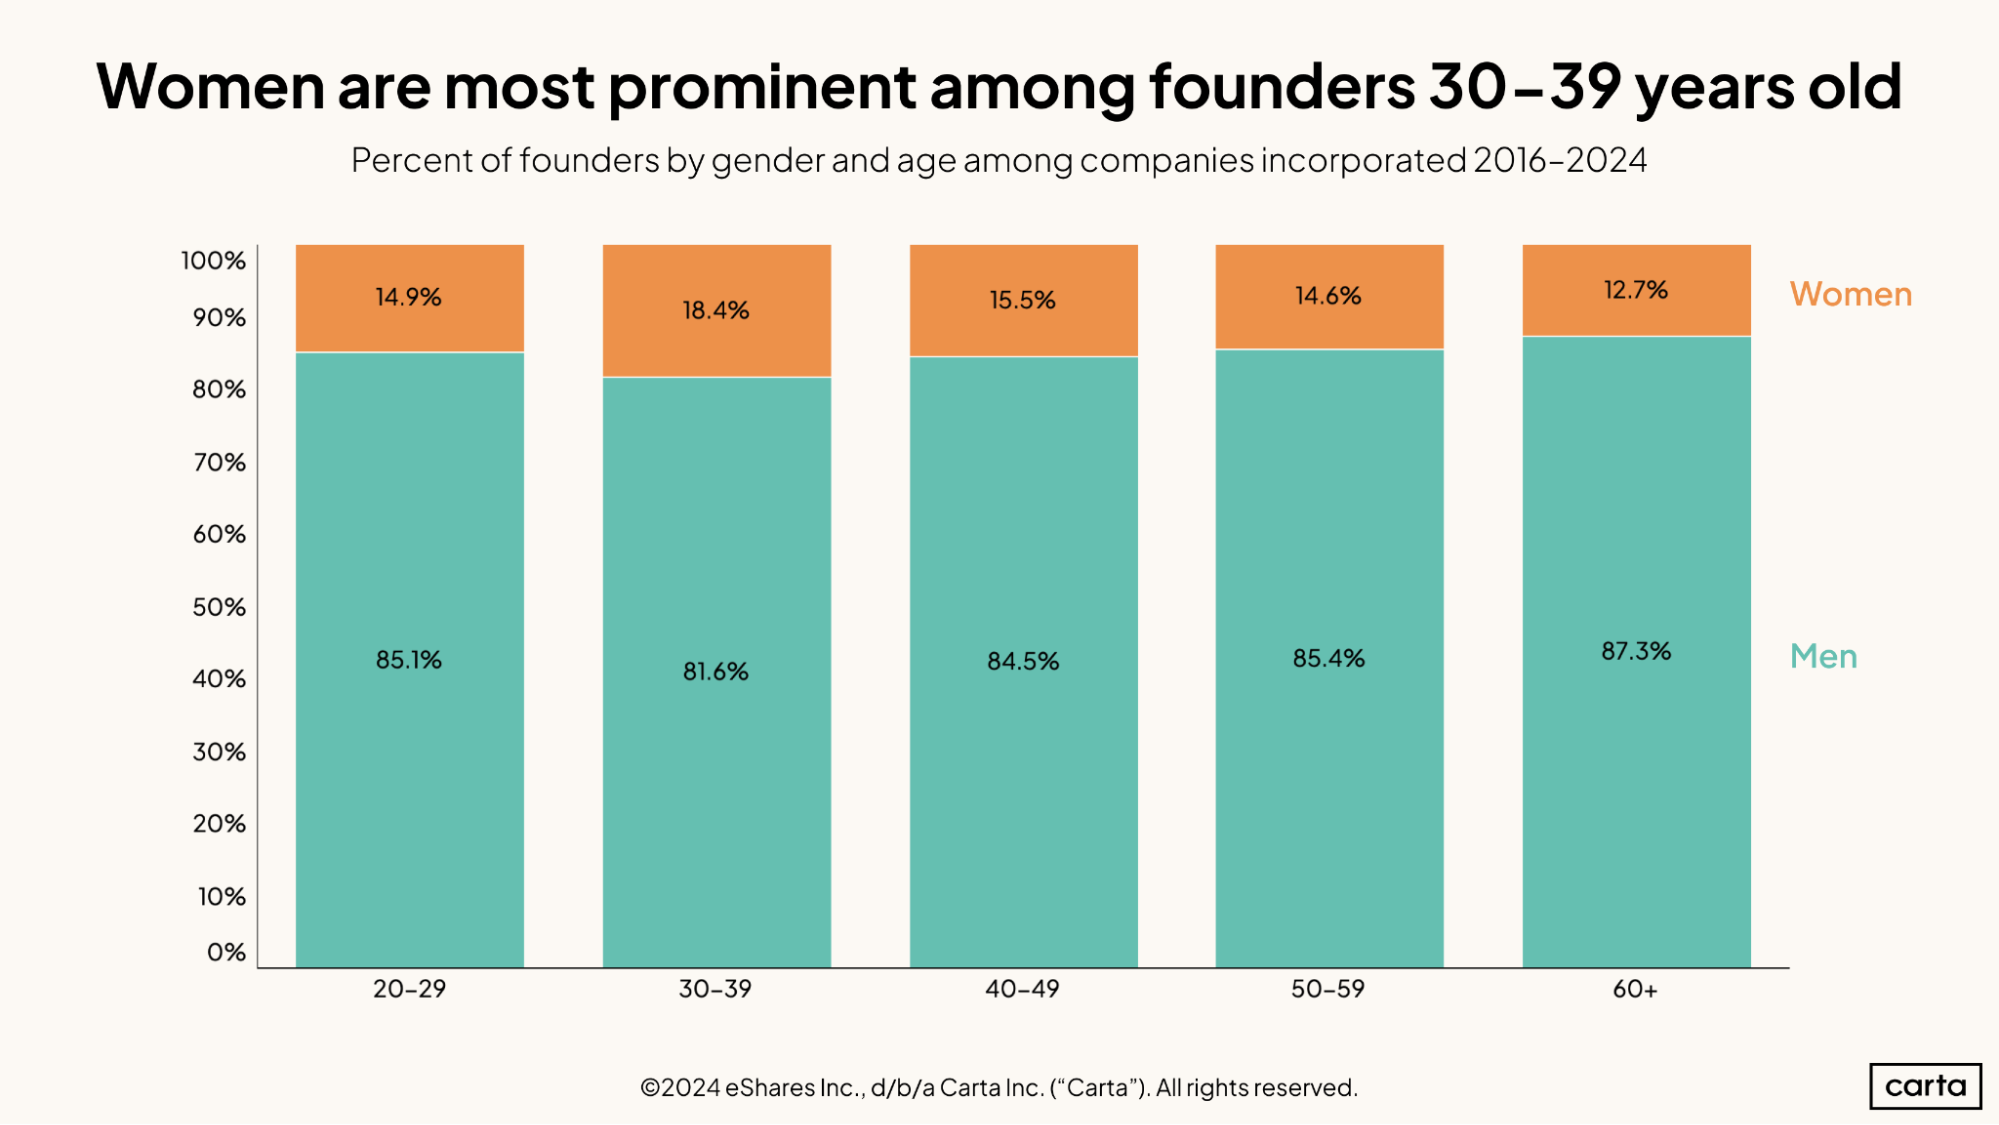
As we saw above, the populations of younger founder cohorts are more racially and ethnically diverse than the populations of older founder cohorts. The same is true in terms of the gender diversity of founders—but only to a point.
Over the past nine years, just 12.7% of all founders over the age of 60 have been women. That number tends to increase with each younger cohort. Women account for 14.6% of all founders in their 50s, 15.5% of founders in their 40s, and 18.4% of founders in their 30s.
Then, however, the trend reverses course: Among founders in their 20s, just 14.9% are women. At this point, the youngest generation of startup founders has even less gender diversity than the generation that came before.
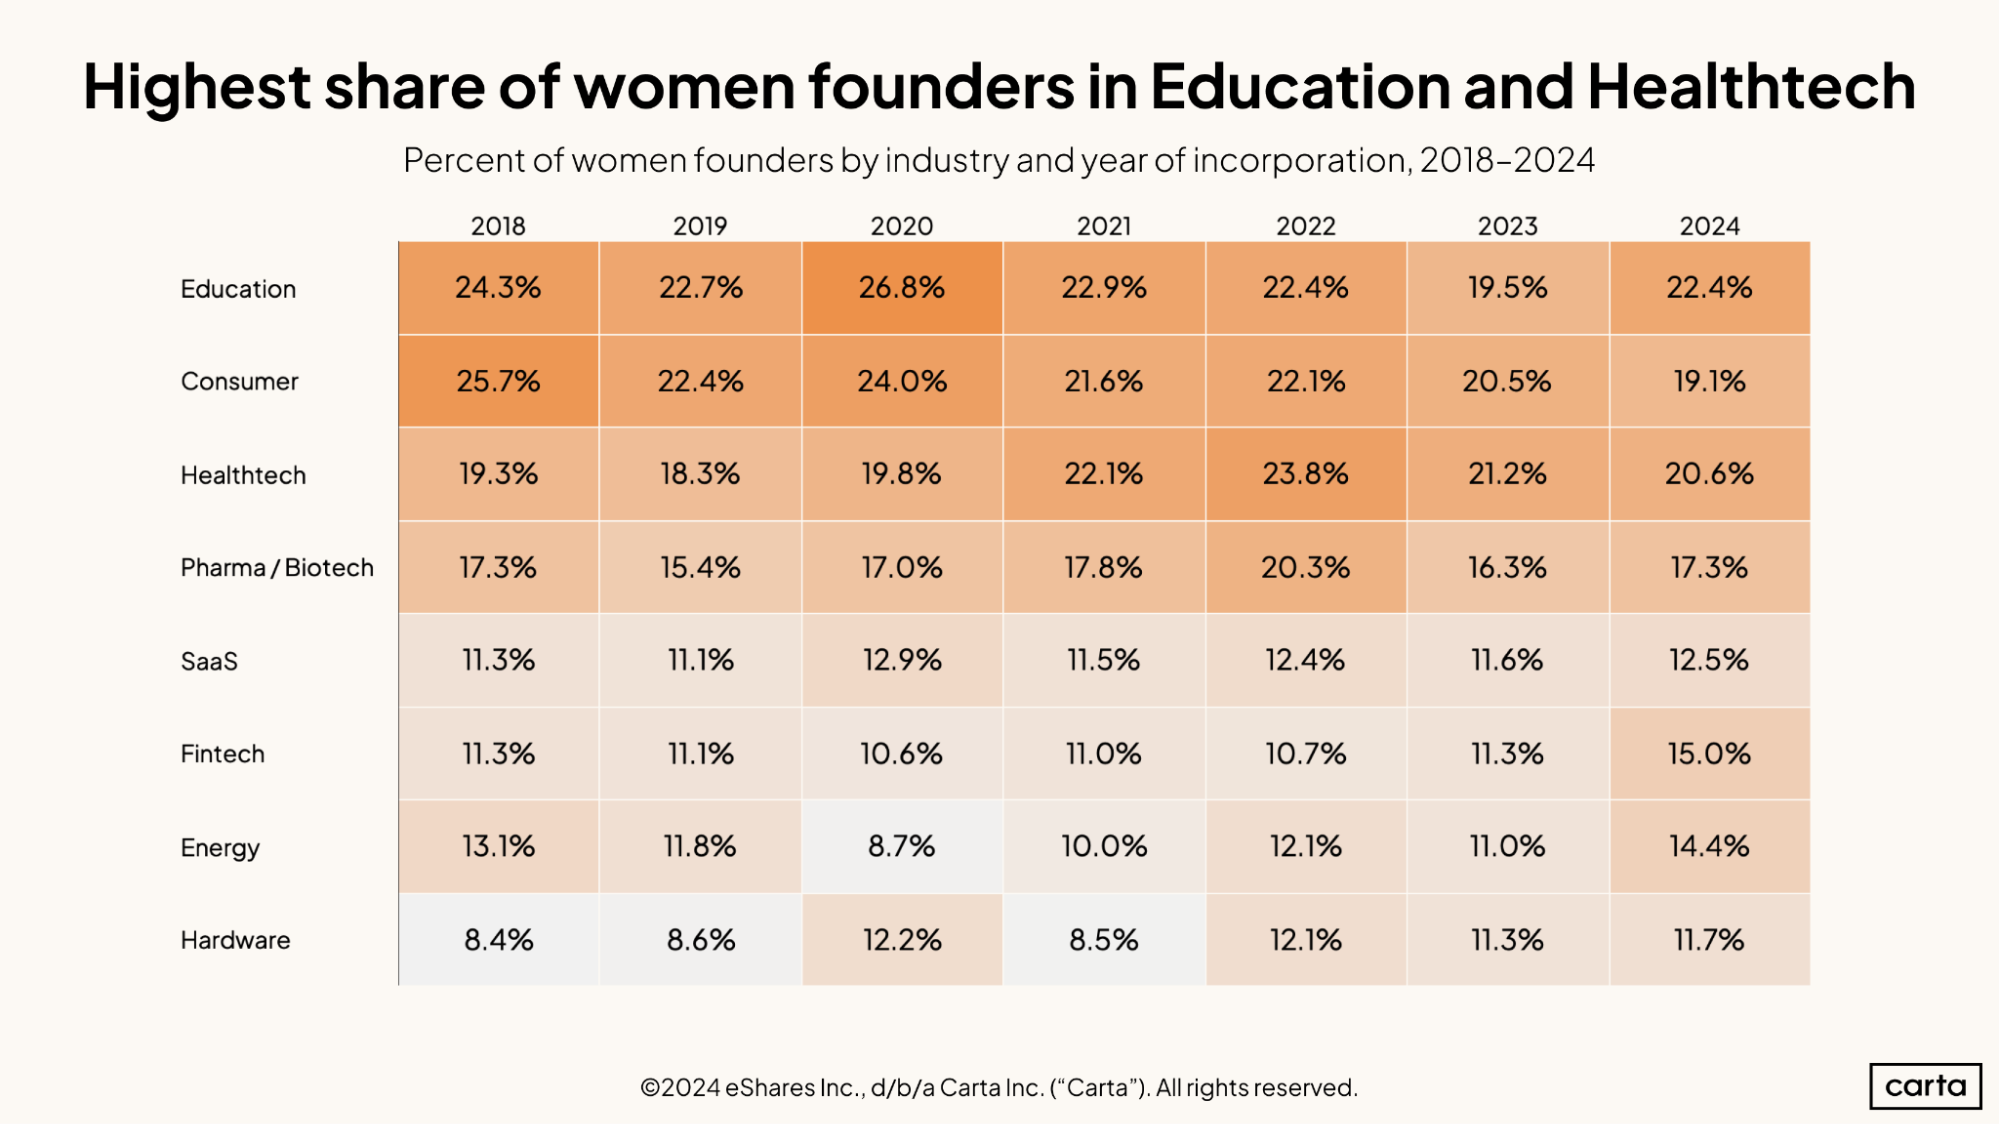
Some 22.4% of all founders in the education sector for companies incorporated in 2024 have been women, the highest proportion of any major startup sector. Historically, women have been most prevalent among founders in the education, consumer, healthtech, and pharma/biotech sectors. The same proved true this year.
Women make up a smaller portion of all founders in SaaS, fintech, energy, and hardware. But the percentage of founders who are women ticked up this year in all four industries. The most significant gain came in fintech, where 15% of all founders this year were women, up from 11.3% in 2023.
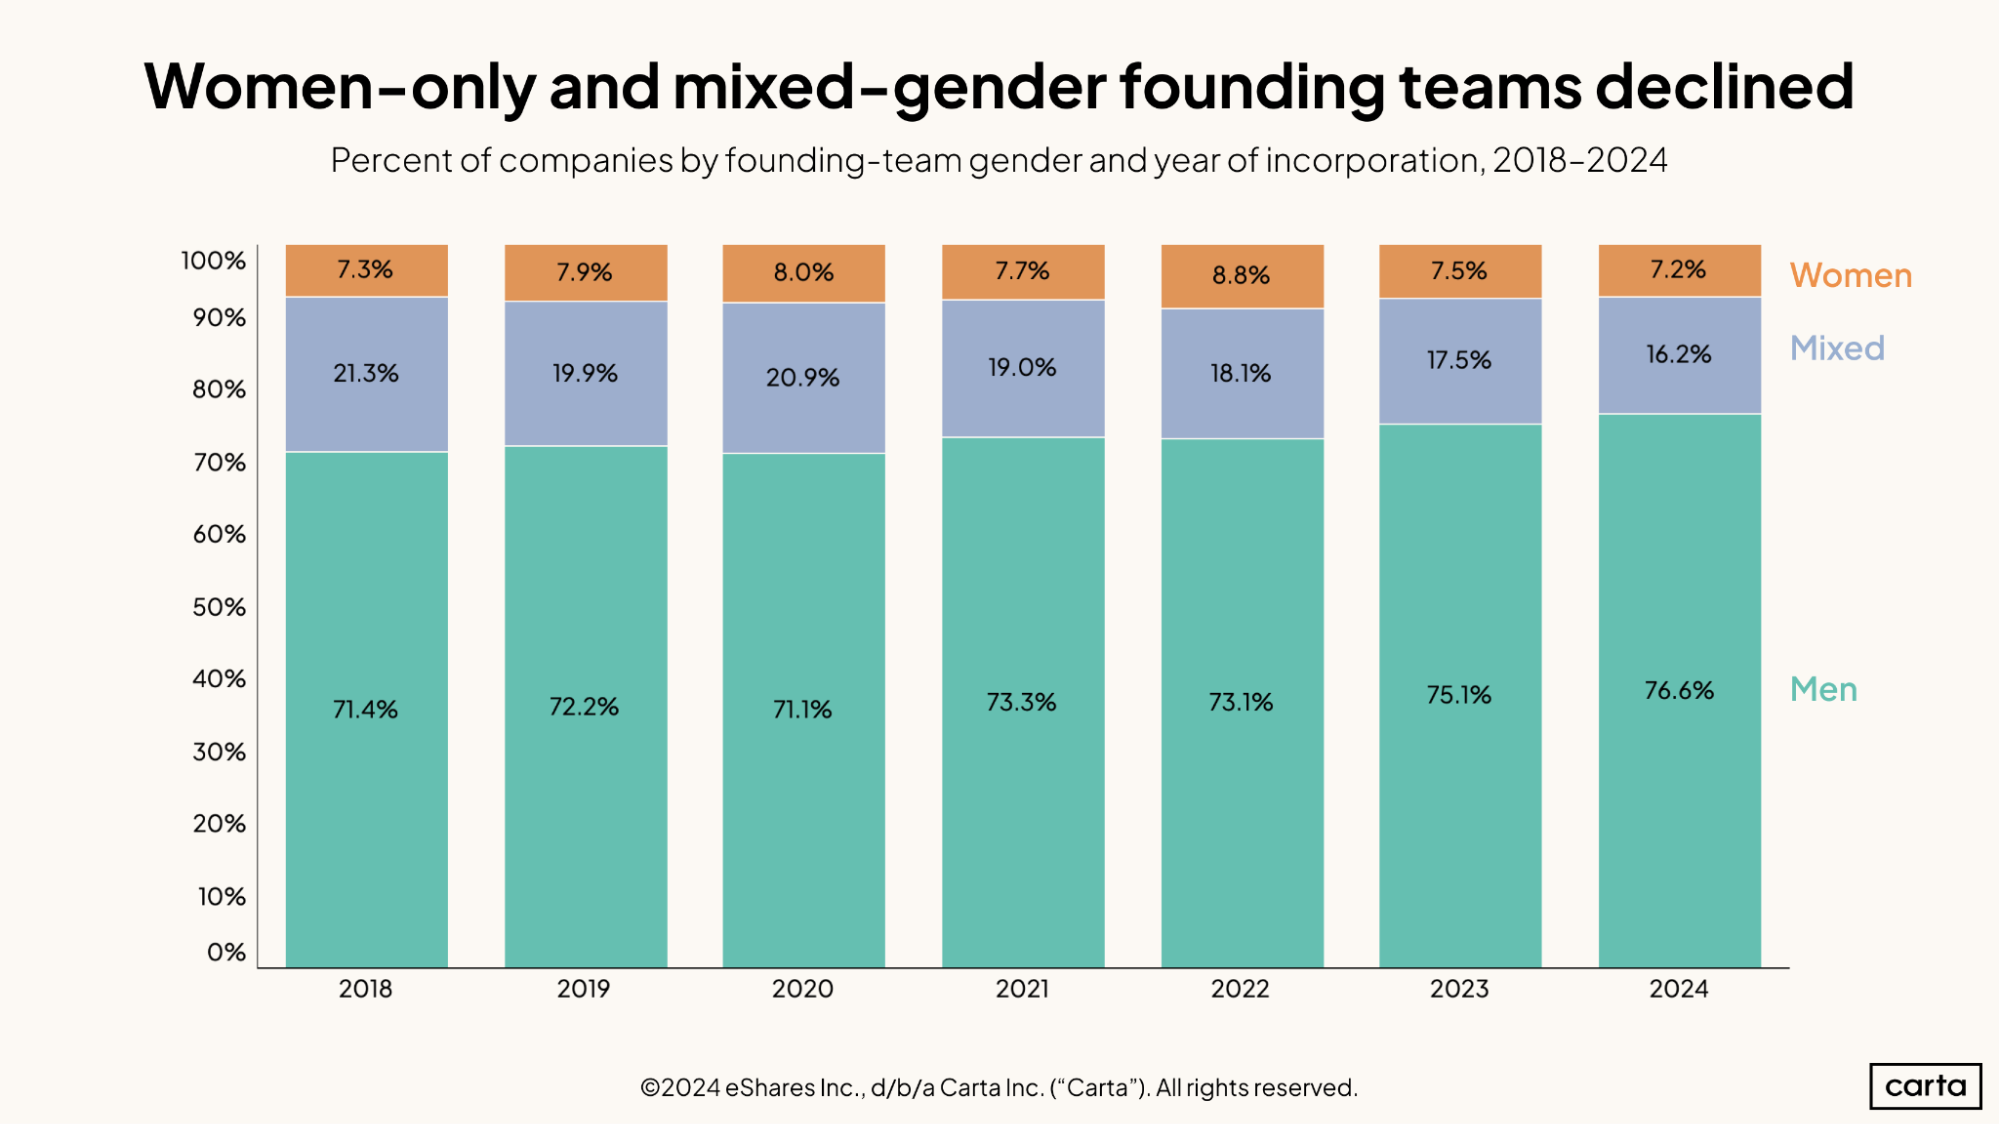
The percentage of new founder teams on Carta consisting only of women declined for the second straight year in 2024, falling to 7.2%. The percentage of mixed-gender founding teams, meanwhile, dropped for the fourth straight year, down to 16.2%.
Conversely, the rate of founder teams composed entirely of men increased for the second year in a row, climbing to 76.6%, the highest it’s ever been. In 2024, new startups were more likely to have zero women on their founding team than in any other year in recent history.
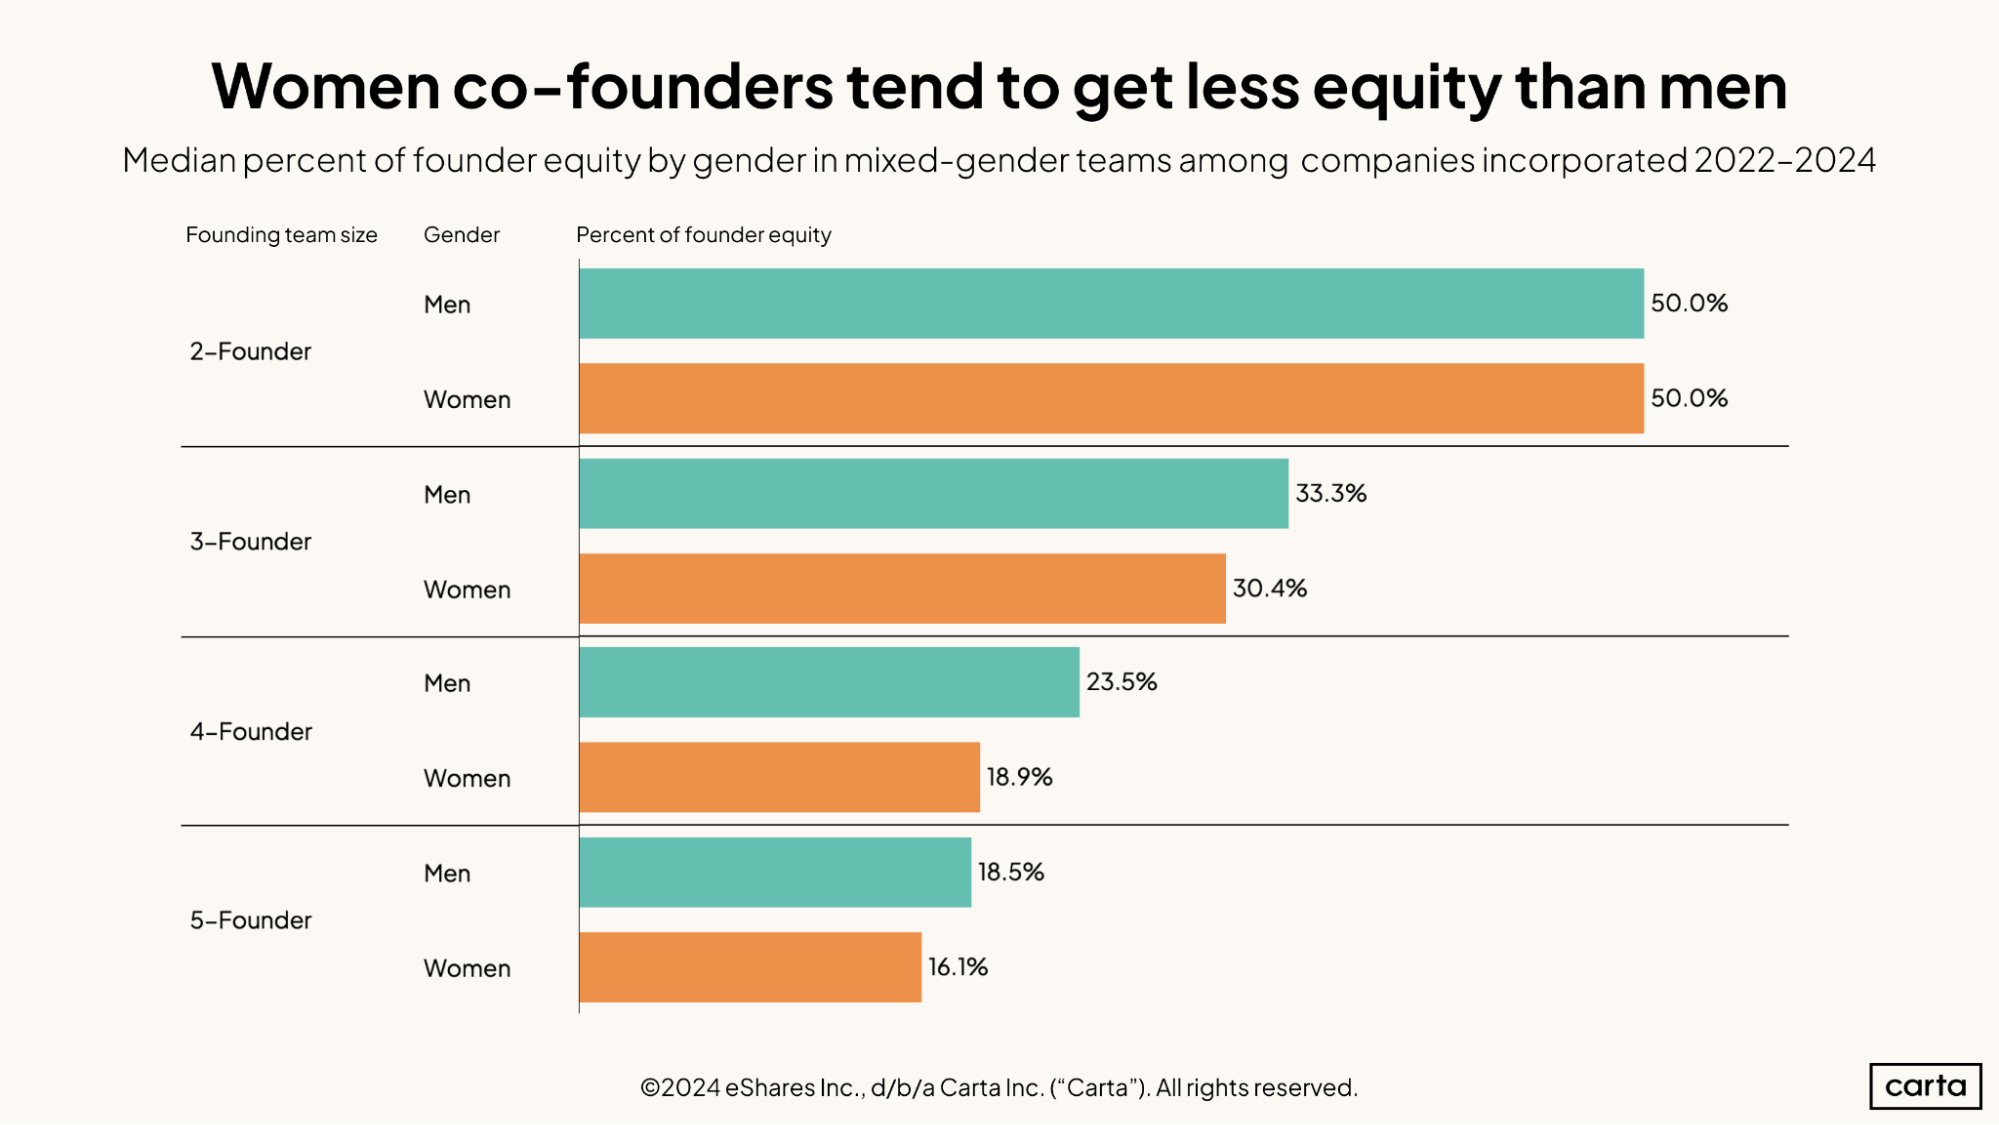
Among mixed-gender founding teams with two people, the median amount of founder equity received for both men and women sits at an even 50%. Among larger teams, however, men typically receive a slightly larger slice than women of the founder equity pie.
If a startup has three founders, male founders receive a median of 33.3% of all founder equity. Women, meanwhile, receive a median 30.4% of founder equity in the same situation. The largest difference is among four-founder teams: At those startups, the median equity share for male founders is 23.5%, compared to 18.9% for women.
Funding
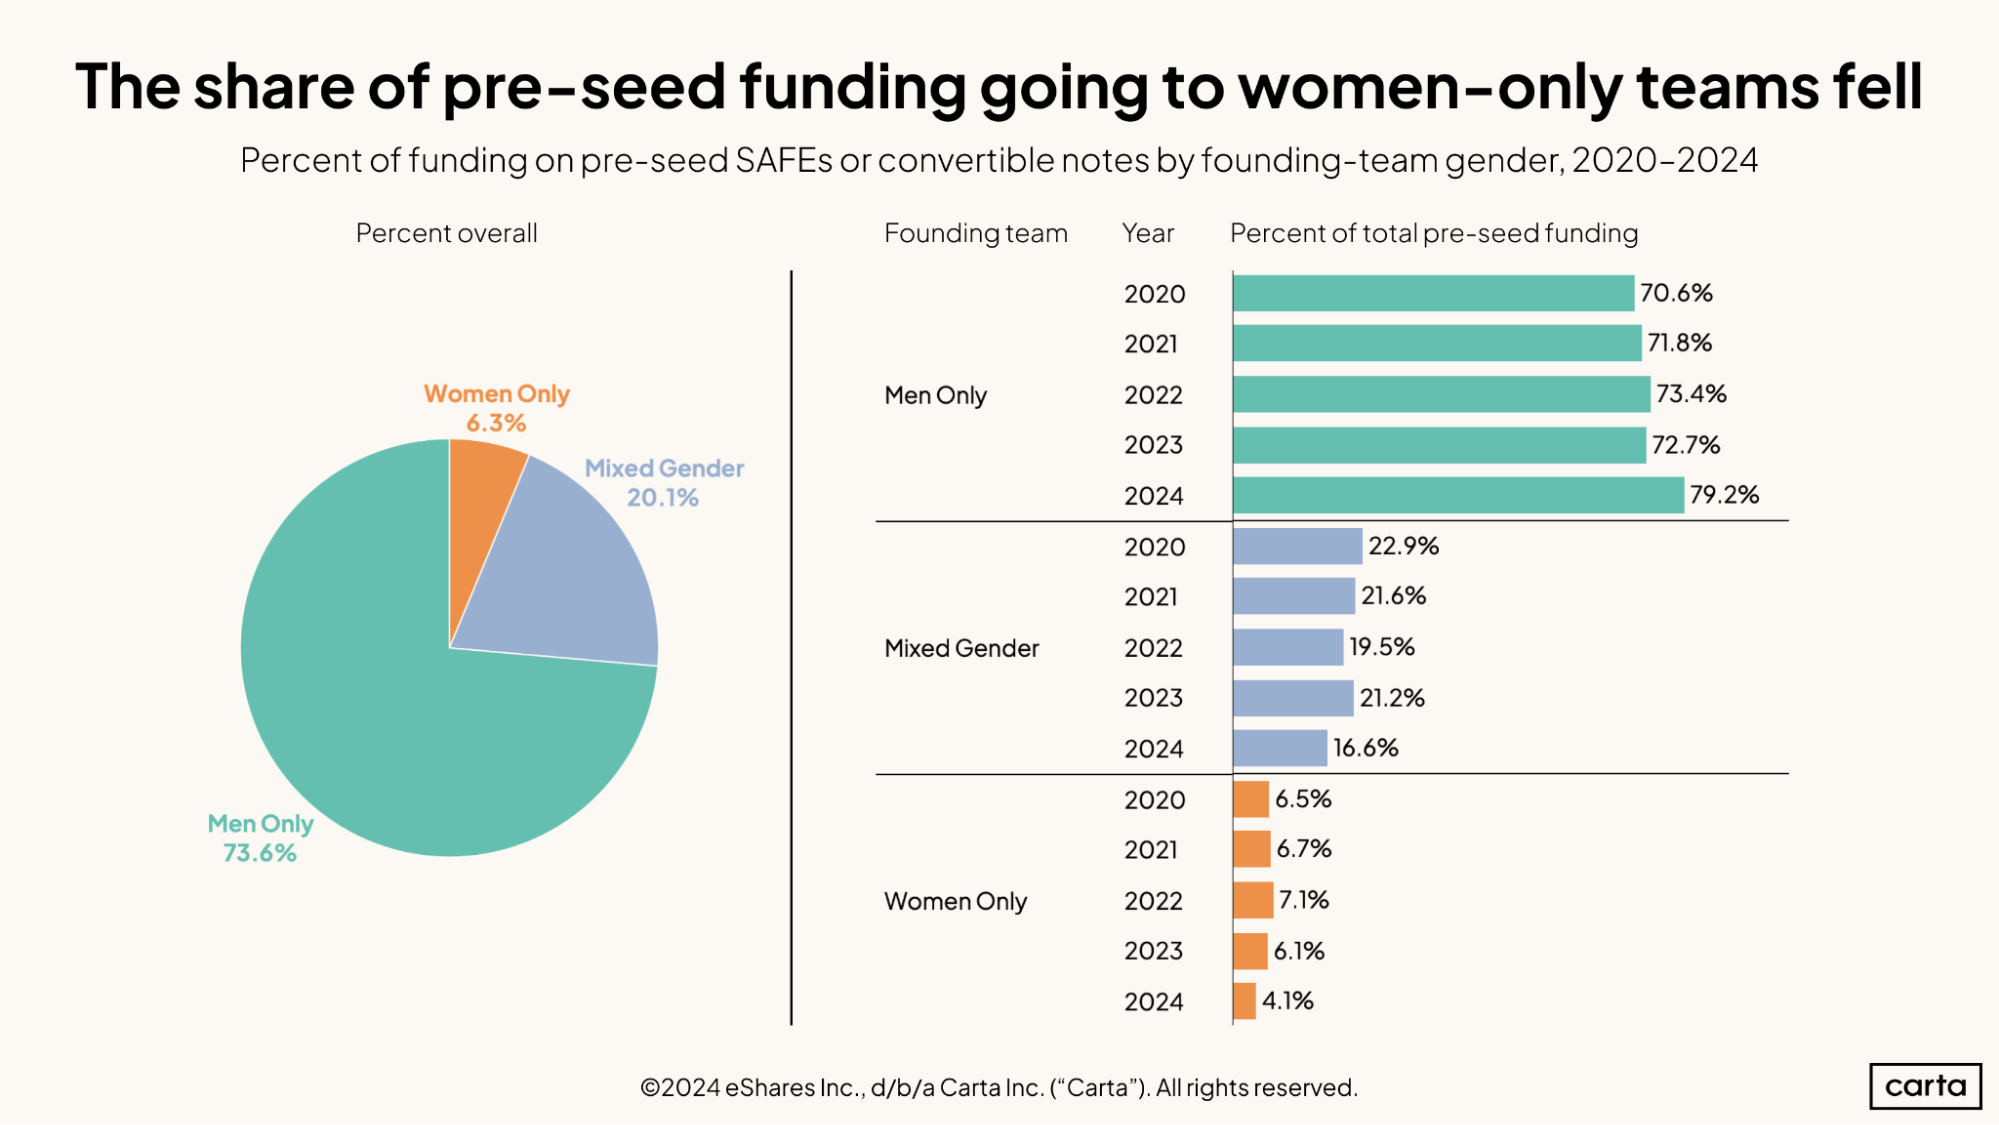
Startups with women-only founding teams were responsible for just 4.1% of all pre-seed capital raised on Carta during 2024. That’s the lowest annual rate of the past five years, and by a wide margin: In 2023, women-only founding teams raised 6.1% of all pre-seed cash.
This aligns with the recent trend we’ve seen in new company formation. Just as the proportion of all startups that were founded by women-only teams declined to a recent lowpoint in 2024, so too did the proportion of all pre-seed capital raised by women-only teams.
Across the past five years combined, women-only teams have raised about 6.3% of all pre-seed funding. Mixed gender teams have raised another 20.1%, while men-only teams have raised the remaining 73.6%.
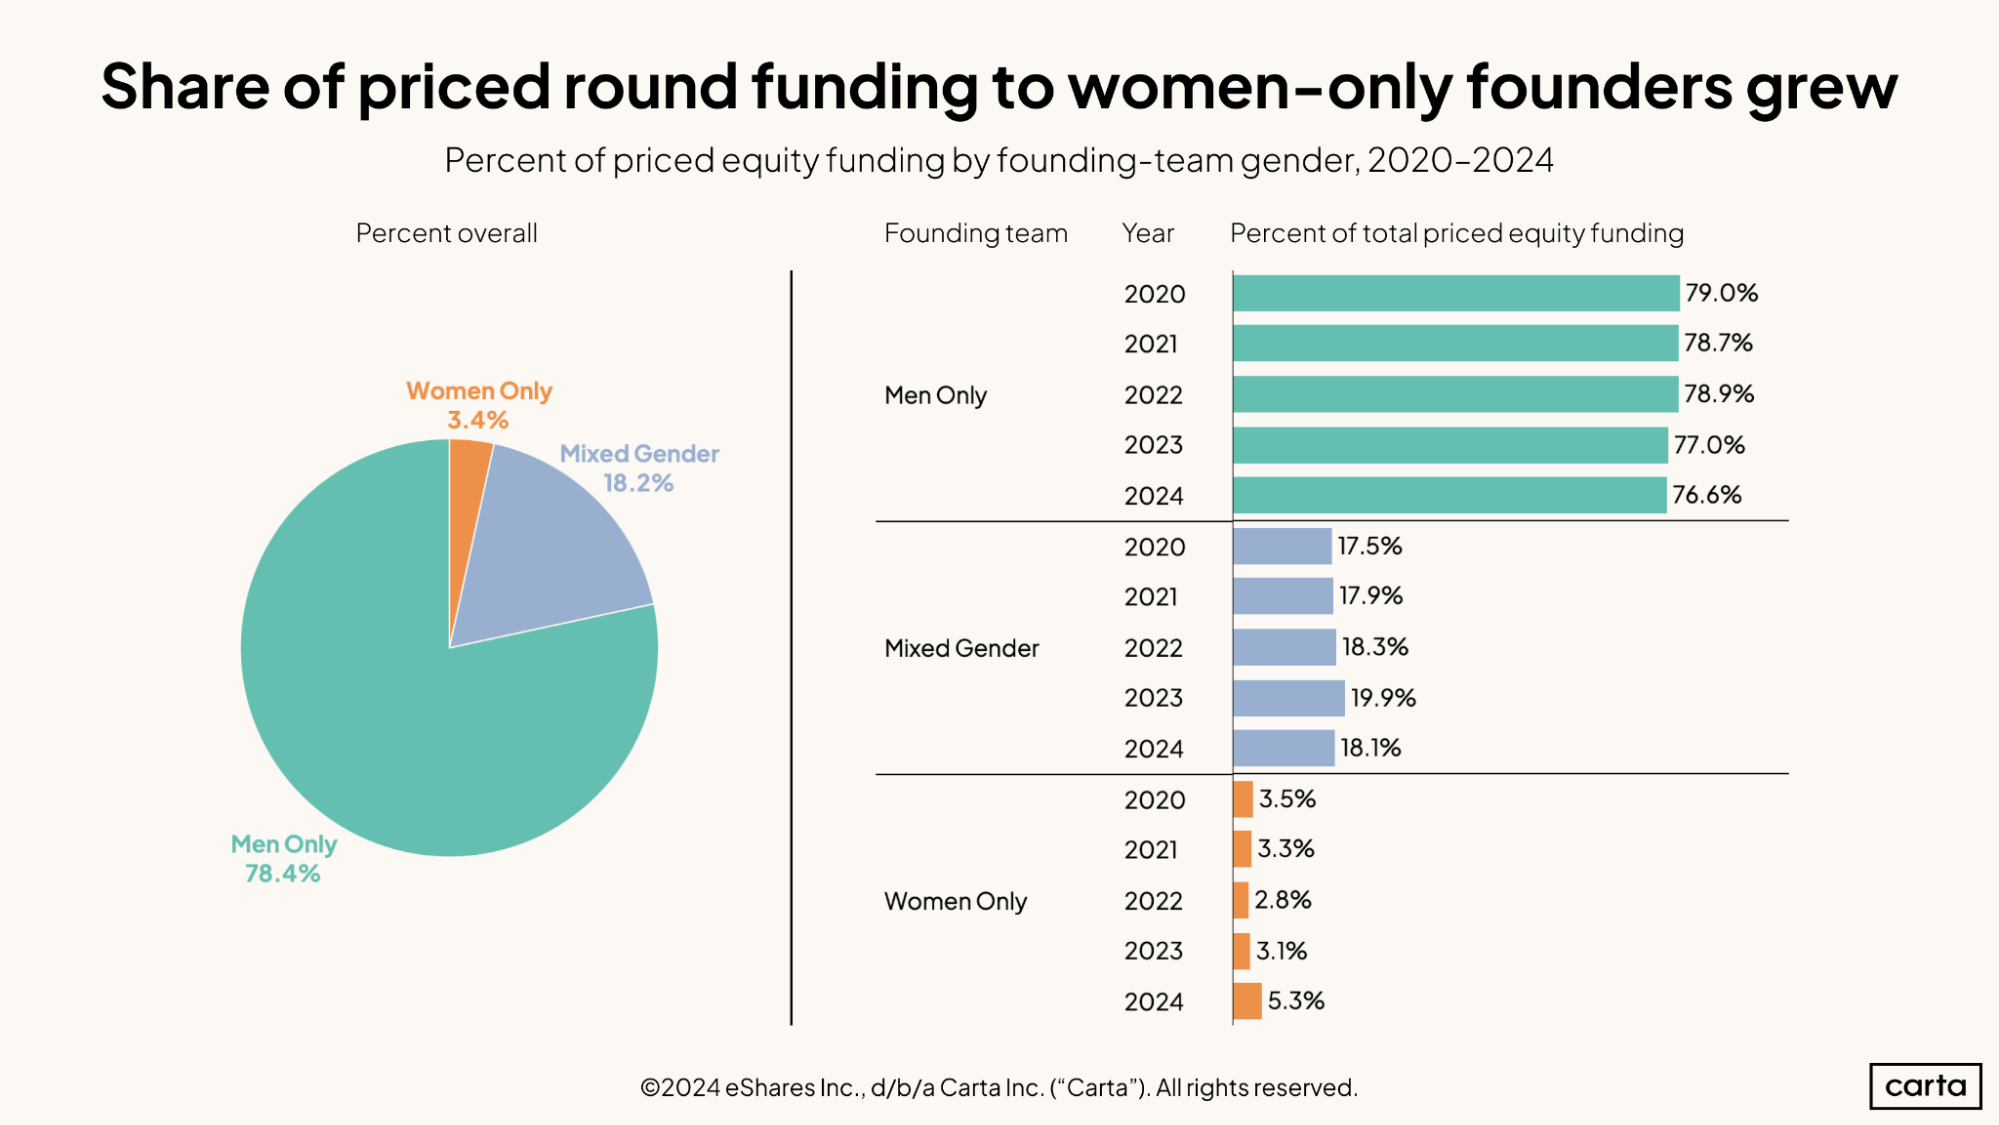
At later stages in the startup lifecycle, women-only founding teams made significant fundraising gains in 2024. Startups with women-only founding teams raised 5.3% of all capital raised in priced rounds across Carta this year, a leap from 3.1% in 2023.
The percentage of all VC funding in priced rounds that goes to startups with men-only founding teams has been gradually declining since 2020. In 2024, startups in this segment were responsible for 76.6% of all capital raised, compared to a running five-year average of 78.4%.
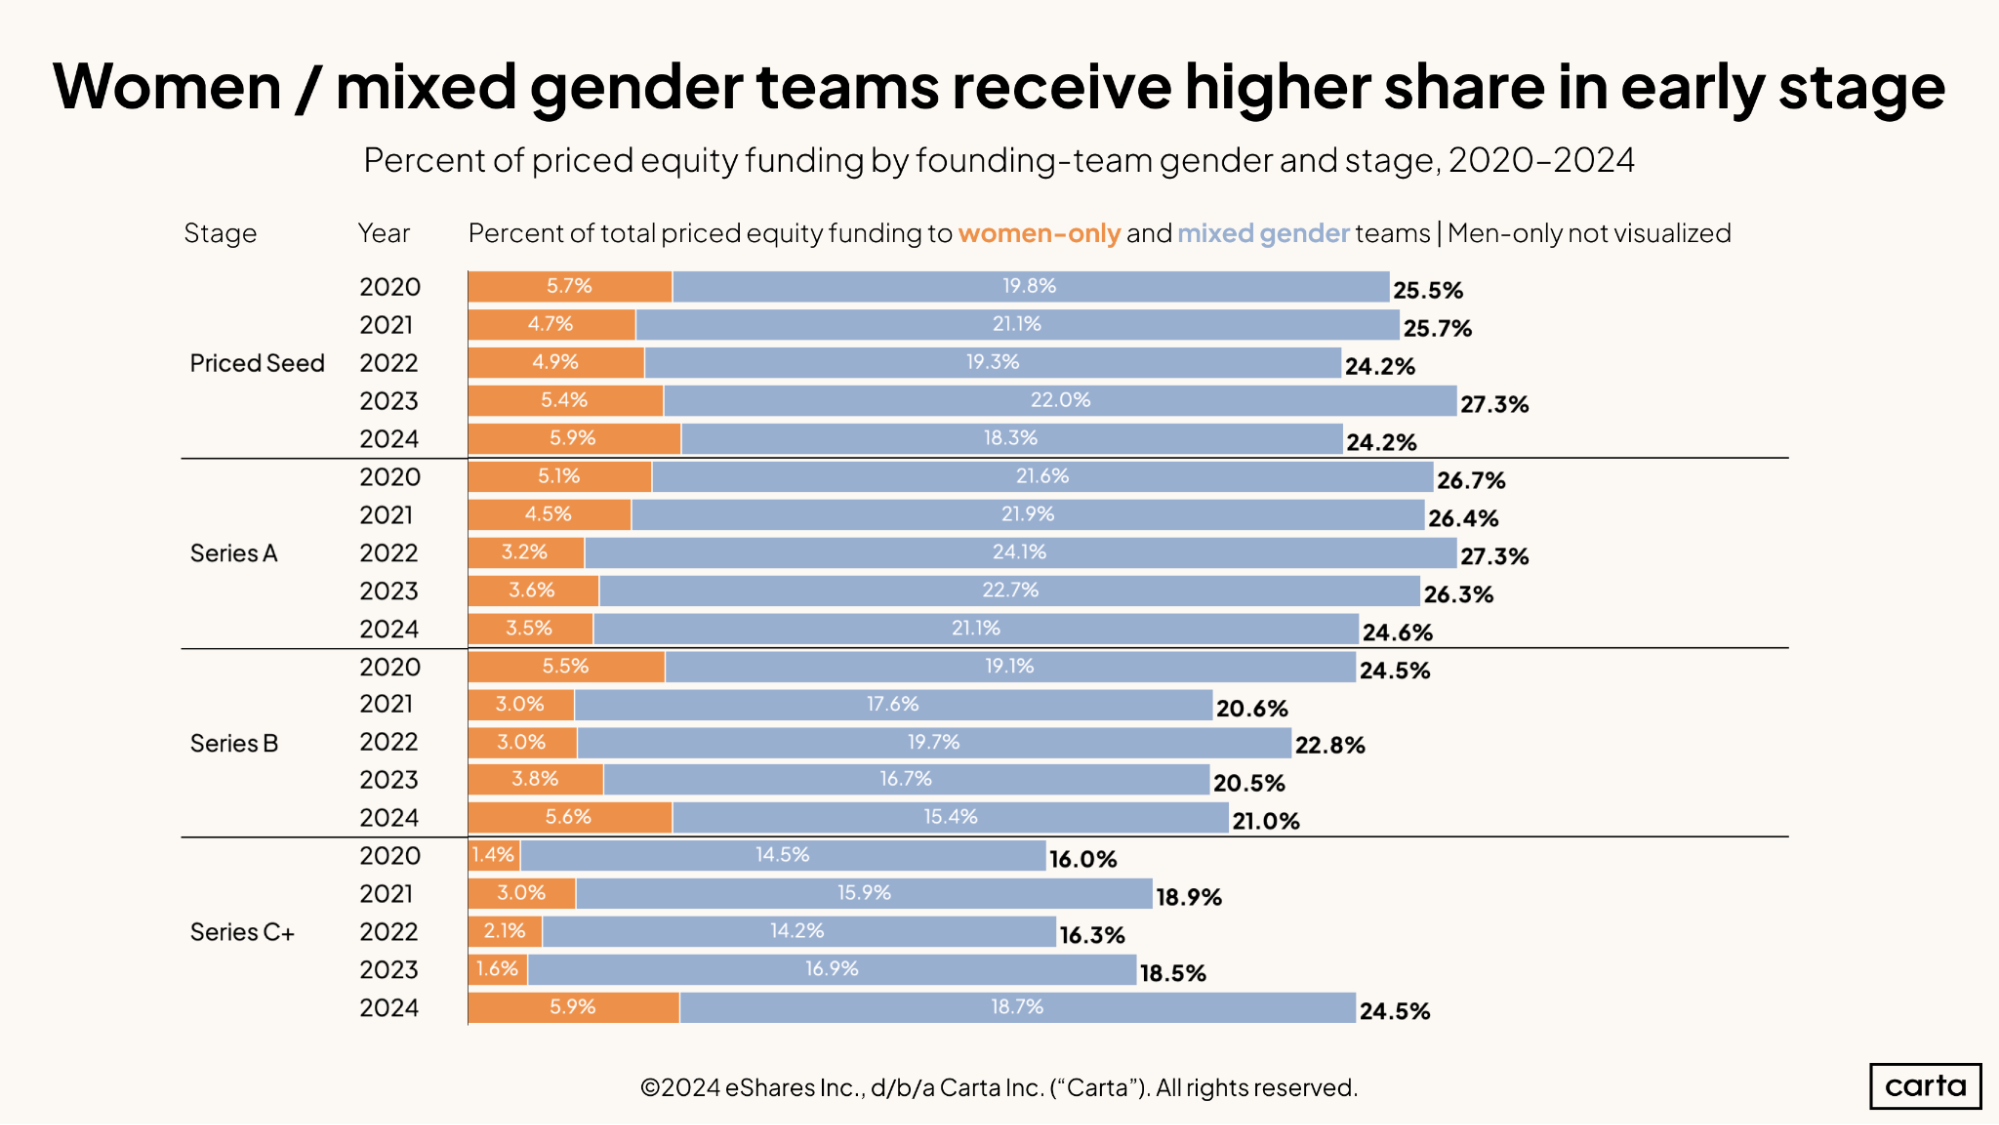
The preceding chart shows that women-only founding teams increased their share of all funding raised in 2024. This one shows that many of these fundraising gains occurred at the later stages of startup life. At Series C and beyond, startups led by women-only teams brought in 5.9% of all capital raised in 2024, a huge jump from previous years. In 2023, women-only teams raised just 1.6% of all capital at these stages.
At Series B, startups led by women-only founding teams raised 5.6% of all VC funding in 2024. Again, this is a notable uptick from other recent years.
The only priced fundraising stage where women-only founding teams didn’t gain ground in 2024 was Series A. Women-only teams were responsible for 3.5% of all capital raised at that stage this year, down from 3.6% the year prior.
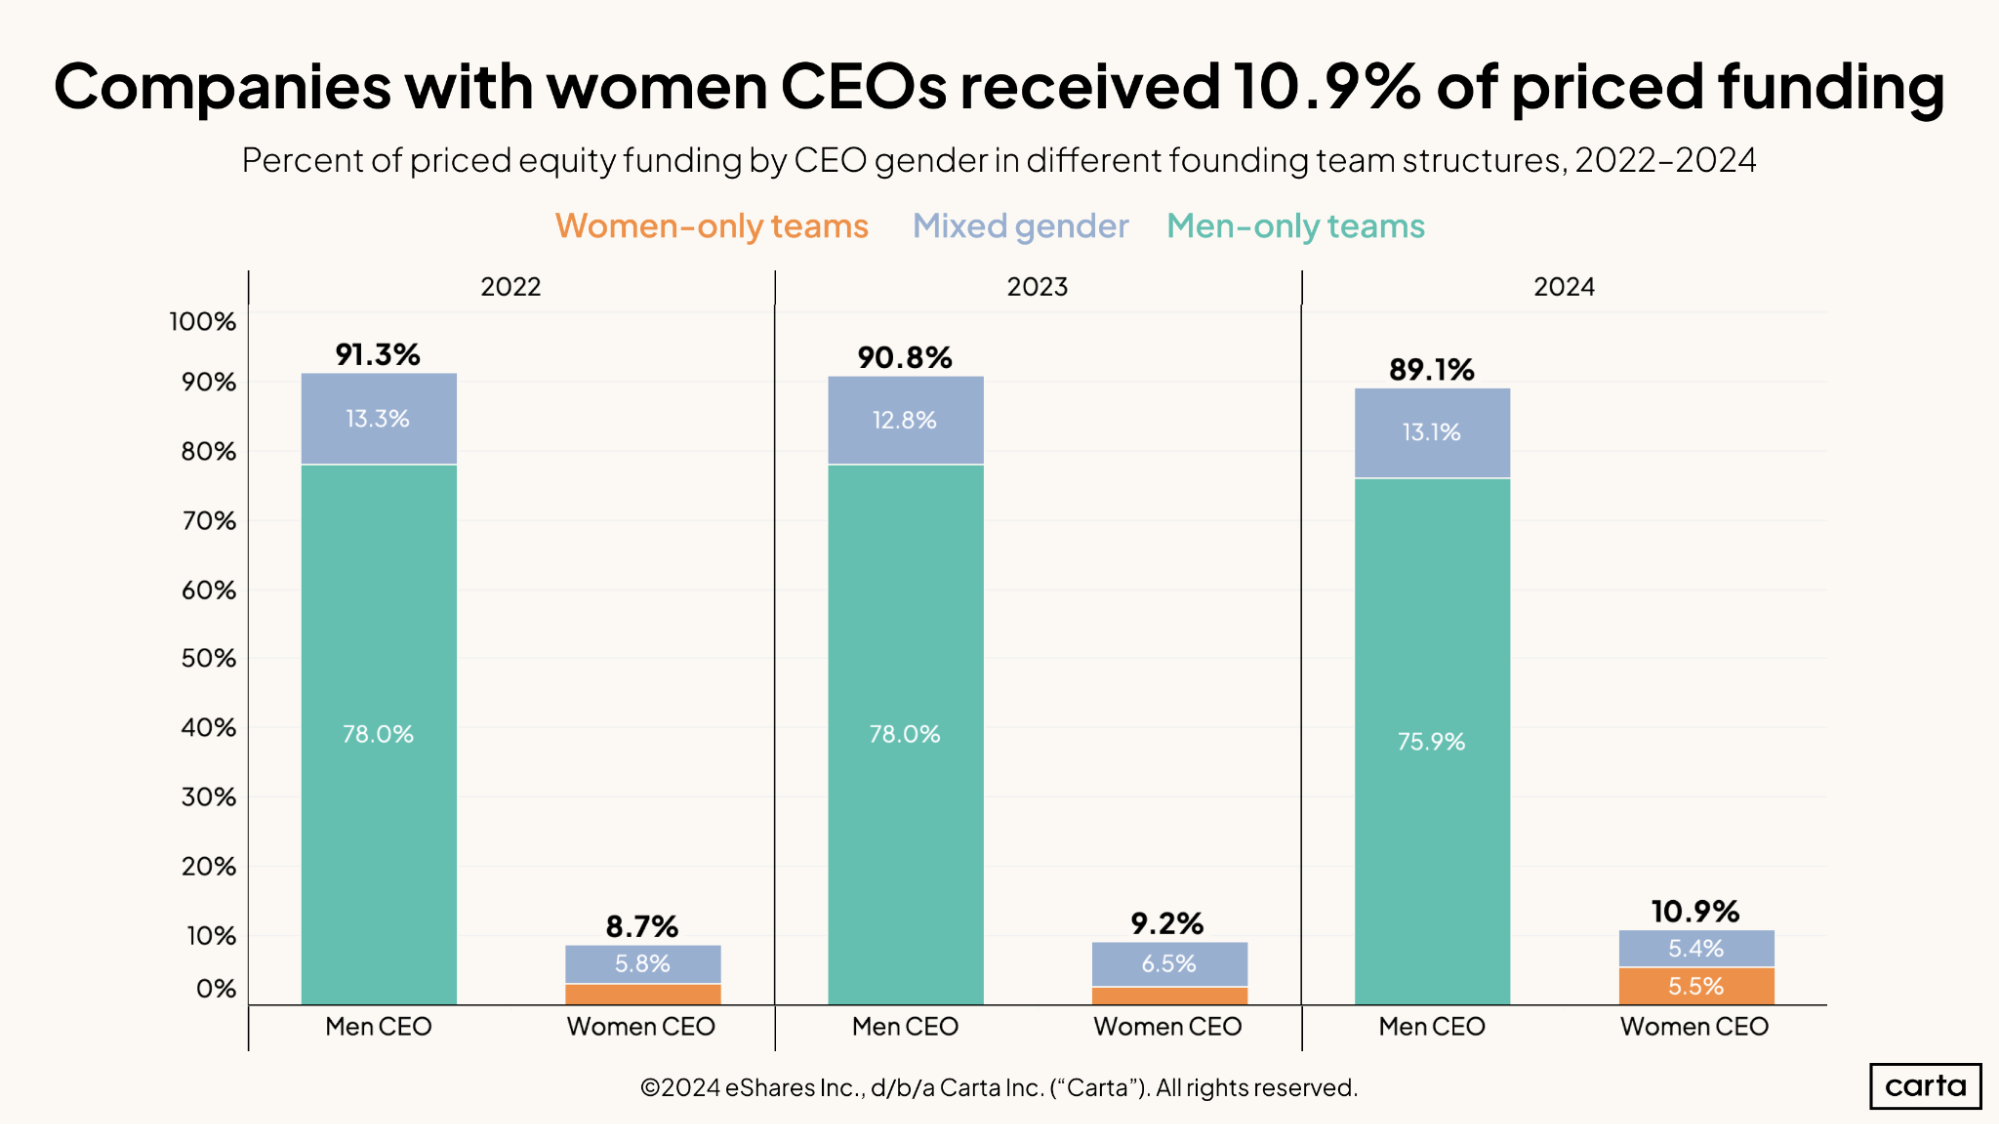
A little more than 89% of all venture capital raised in priced rounds during 2024 went to startups with male CEOs. Just under 11% of priced funding this year went to startups with women as CEOs.
The gap between those two numbers is vast. In the past two years, however, it has begun to narrow. Just 8.7% of funding in 2022 went to startups with women as CEOs, compared to 10.9% in 2024. The share of funding going to women-only founding teams, meanwhile, rose from 2.9% to 5.5% over the same span.
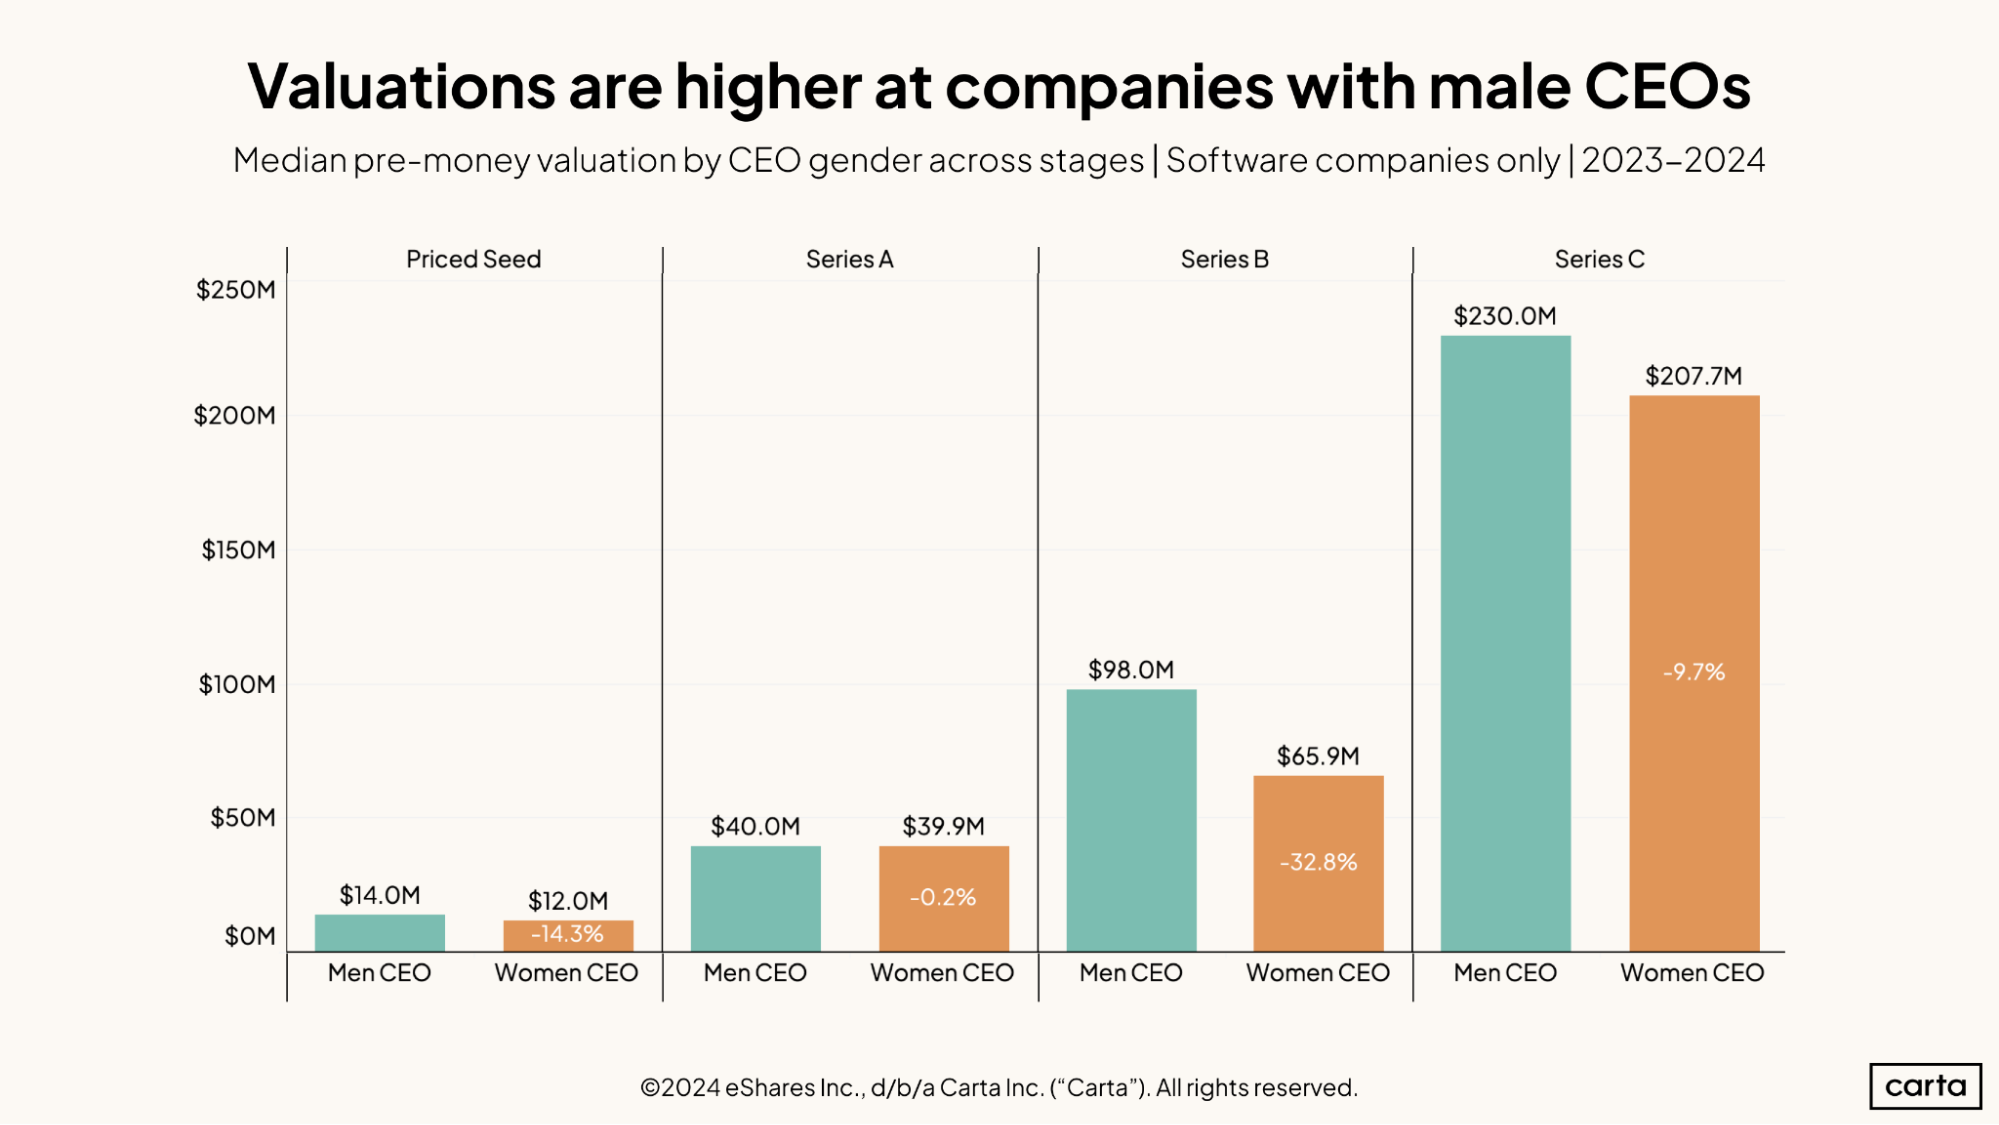
Across each major stage of startup fundraising for software companies, companies with male CEOs have achieved higher valuations than startups with female CEOs over the past two years.
At the seed stage, the median valuation for startups where a woman holds the CEO role is 14.3% lower than the median valuation for startups with a male CEO. At Series A, the gap is just 0.2%. But at later stages, it gets bigger: At Series B, the median valuation for startups with a female CEO is 32.8% lower than for startups with a male CEO, and at Series C, it’s 9.7% lower.
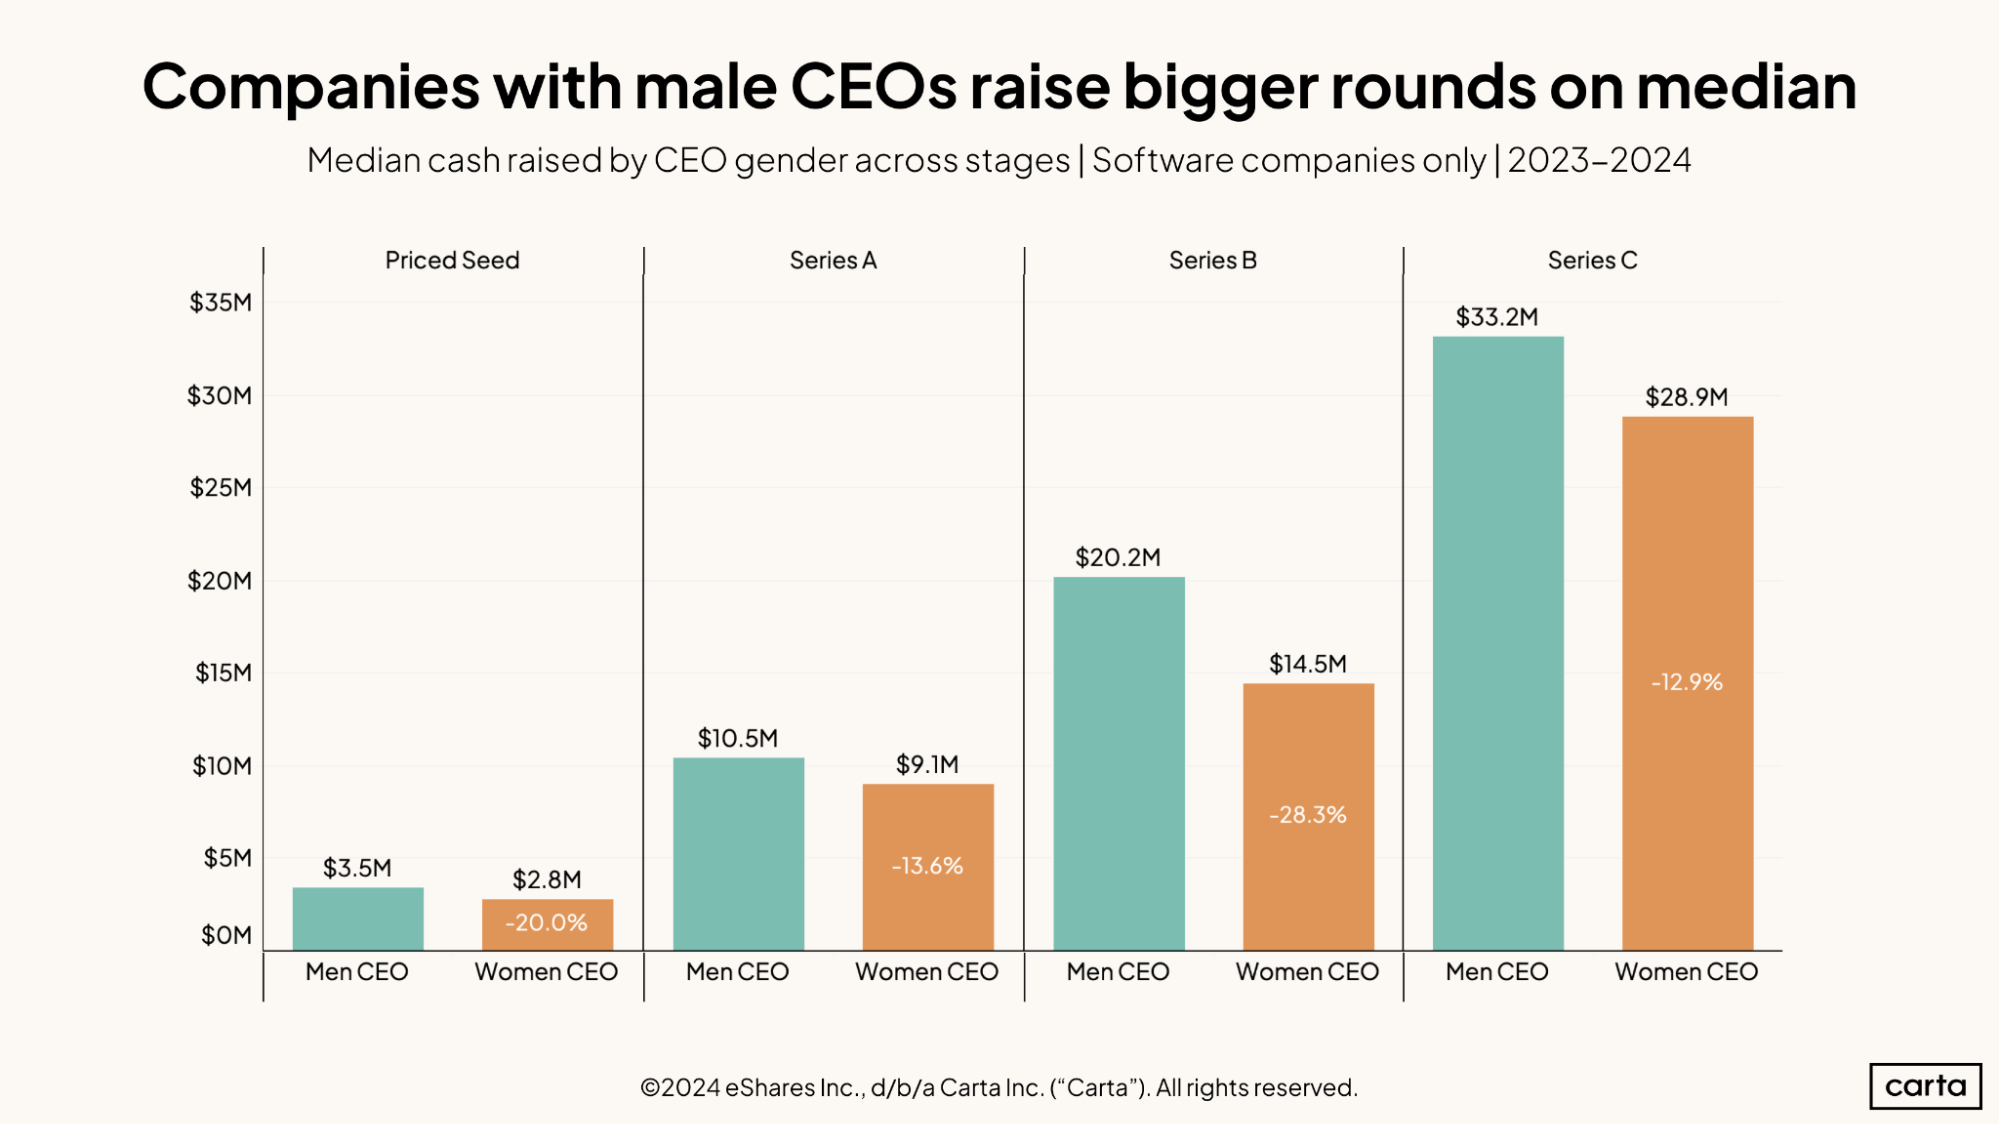
In addition to achieving higher valuations, software companies with male CEOs also tend to raise larger rounds than companies with women in the top job.
At most stages, the gap in median round sizes over the past two years is roughly similar to the gap in valuations. At seed, for instance, the median round size for companies with women as the CEO is 20% lower than for companies with men as CEO, compared to the aforementioned 14.3% gap in seed valuations. At Series C, the median round size for women-led companies is 12.9% lower, while the median valuation is 9.7% lower.
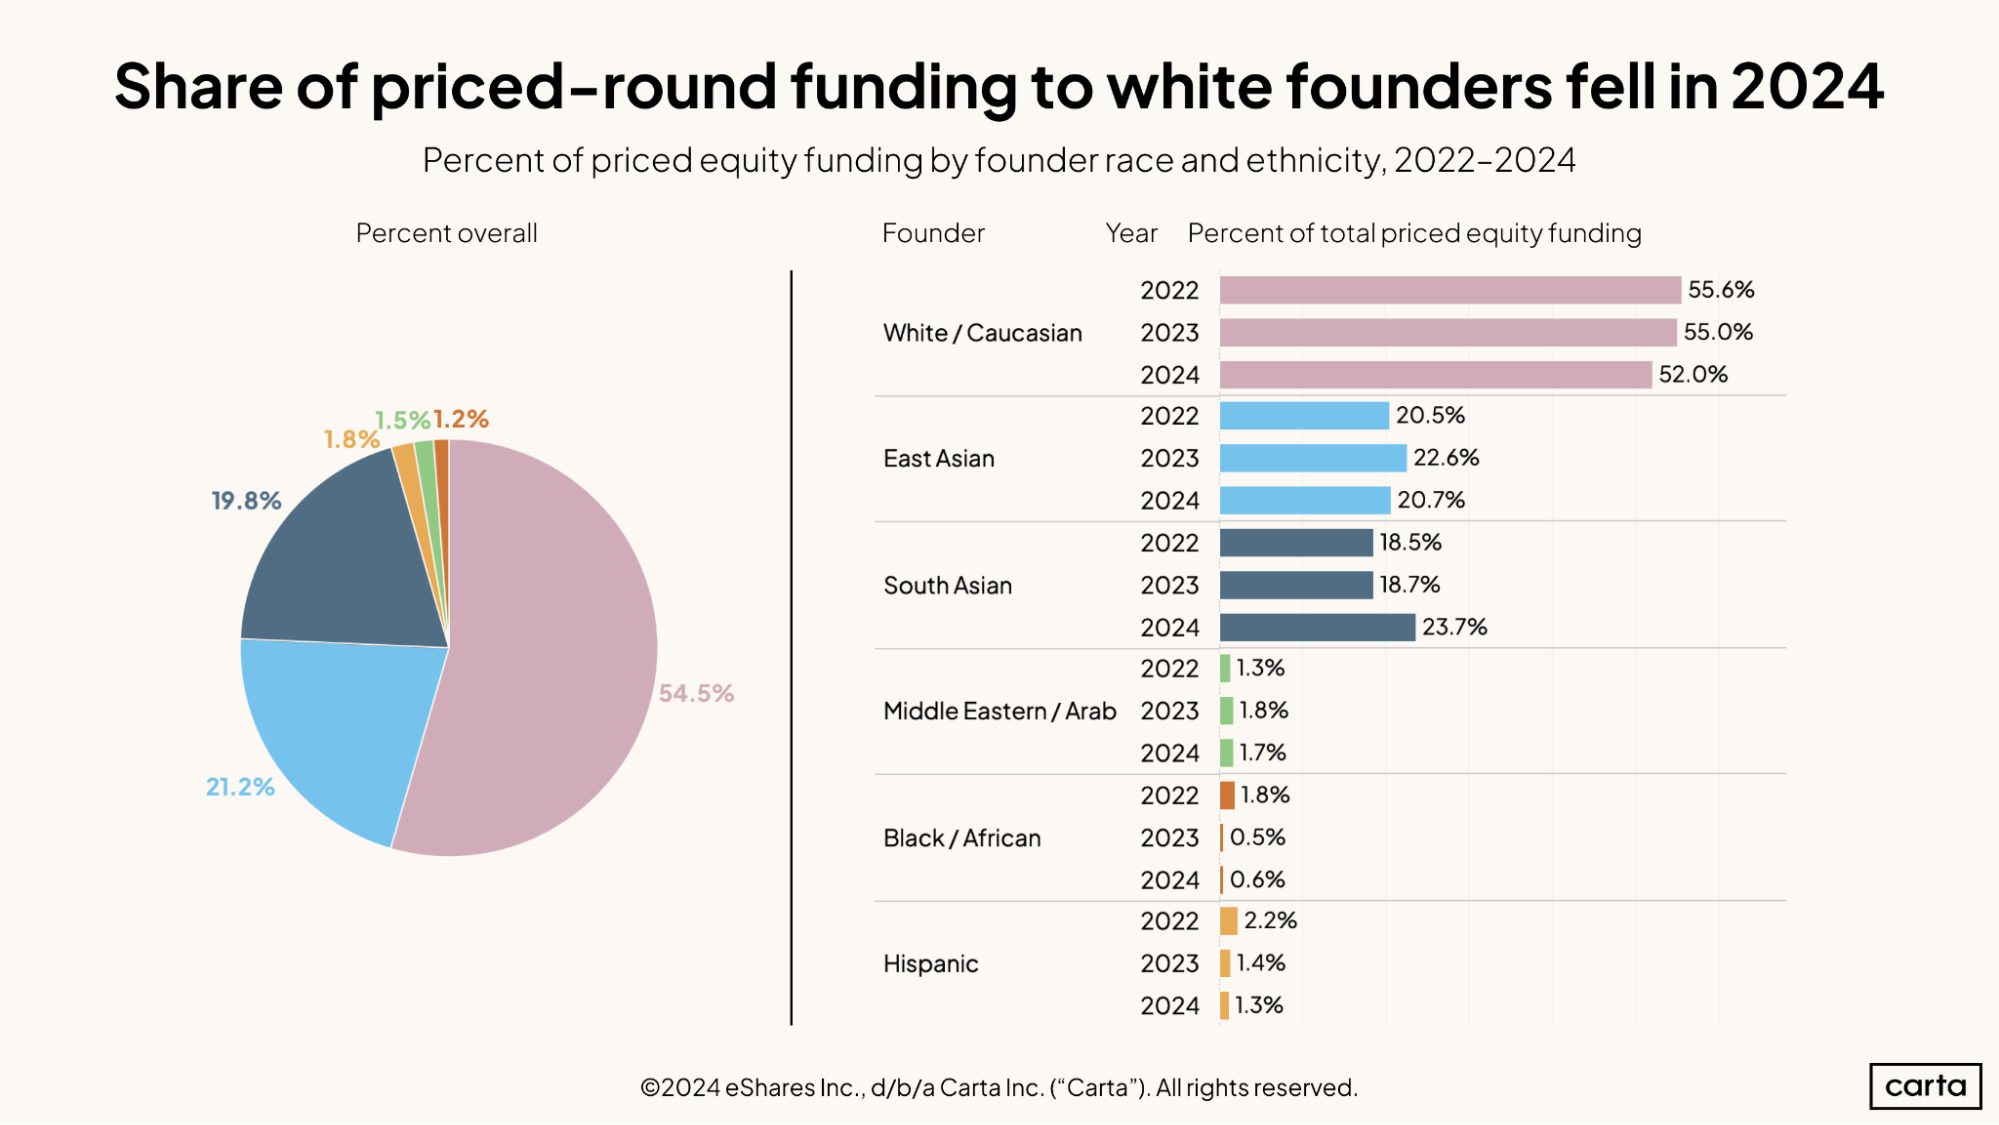
The percentage of capital going to white founders decreased in 2024 among priced funding rounds, falling to 52%. Startups with South Asian founders, on the other hand, saw an increase in their share of priced funding in 2024, at 23.7%—up five full percentage points from the year before.
The share of all priced funding going to startups with Black and African founders has declined compared to two years ago, falling from 1.8% to 0.6%. The share of funding going to Hispanic founders has also dipped since 2022, dropping from 2.2% to 1.3%.
Methodology
The Annual Equity Report includes data from more than 870,000 U.S.-based employee stakeholders who have been issued equity via the Carta platform and over 108,000 founders of corporations that manage their company equity on Carta.
Sample sizes
We cover analyses only where we have sufficient data. From the point of view of ensuring anonymity, each data point must be backed by at least 10 entities (people or companies, typically) in order to be included. However, in most cases we have and require much more data than that to reach statistical significance or produce a legible pattern or trend.
Throughout this report, when discussing gender we only included men and women. There was not enough data regarding non-binary individuals to reach statistical significance. Gender indicated in the data is based on how individuals identified themselves.
Valuing equity
The value of an employee’s first equity grant, sometimes shortened to “equity value,” is calculated by multiplying the strike price by the total number of shares in the grant the employee was initially awarded in their role. It is different from the value that the employee may eventually be able to realize from the equity, which is largely driven by opportunities for liquidity and the price an employee is able to get when they sell.
This “equity value” allows us to compare the relative amounts that companies have offered to employees by demographics, geography, or job role and level. Because this number is generated when the equity is first granted, it allows us to compare equity compensation sooner than if we waited for the equity value to mature over time.
Equity granted at earlier company stages tends to be less correlated to future value than equity granted later which is reflected in lower strike prices in equity grants issued by early-stage companies. The notional value of equity as we are using it does not reflect any variance in the hypothetical possibility of upside between earlier- and later-stage companies (where the growth curve may be steeper the earlier one joins a company, but the attendant risk is likewise different). Nonetheless, we find this metric helpful to compare how companies are choosing to compensate different groups of employees by role, demographics, and location.
Race and ethnicity
Carta offers U.S.-based stakeholders a demographic profile page they can opt to fill out for the purposes of aggregated, anonymized equity compensation analysis. For people who hold multiple stakeholding roles on the Carta platform, their demographic information is attached to each role—such as employee and founder
“Hispanic” is an ethnic category that applies regardless of race; other races include only those who did not self-identify as Hispanic. We acknowledge that this does not fully represent intersectional identities.
We shorten “Black/African-American” to “Black,” and “Hispanic/Latinx” to “Hispanic” for readability—though we know that those terms and the experiences of these groups aren’t identical. The category “East and Southeast Asian” is shortened to “East Asian” throughout the report for readability; this group includes those who the U.S. Census refers to as coming from the “Far East” or “Southeast Asia.” Native Hawaiians and Pacific Islanders are included in “Other,” alongside people of Indigenous American and mixed backgrounds. As our dataset grows each year, we will look for opportunities to report on each of these groups.