Through the first nine months of 2024, fintech startups on Carta combined to raise about $3.8 billion in new venture capital funding. That was already nearly equal to the $4 billion in total funding that fintech startups raised throughout all of 2023.
After fundraising plunged to historically low levels last year, it seems increasingly safe to say that the fintech fundraising market has picked back up.
The concept of “fintech” was created back when the idea of combining financial systems with technology was still a novel one. Today, just about every young company that helps its customers move, store, borrow, spend, or invest money qualifies as a fintech startup. Some of the most common sub-sectors within fintech today include payments, banking, personal investments, corporate finance, and crypto.
In terms of dollars raised, the first nine months of the year represented a strong bounceback for these fintech startups. Other metrics, however, present a more nuanced picture, suggesting that some investors are still placing their bets with care:
Fintech deal counts have held steady. Fintech startups on Carta are averaging 110 deals per quarter so far in 2024, compared to 111 per quarter in 2023.
At the seed stage, activity has slowed. Fintech startups on Carta closed fewer than 40 new seed deals in both Q2 and Q3. Before that, there’d been at least 40 fintech seed deals in 14 consecutive quarters.
Down rounds are on the rise. At least 20% of all new fintech investments have been down rounds in four of the past five quarters.
Bridge rounds remain common, too. At both the seed stage and Series A, nearly 50% of all fintech deals closed in Q3 were bridge rounds.
For a closer look at each of these trends—plus several other facets of fintech fundraising—here are nine graphs that help chart the course of how the fintech industry has evolved in 2024.
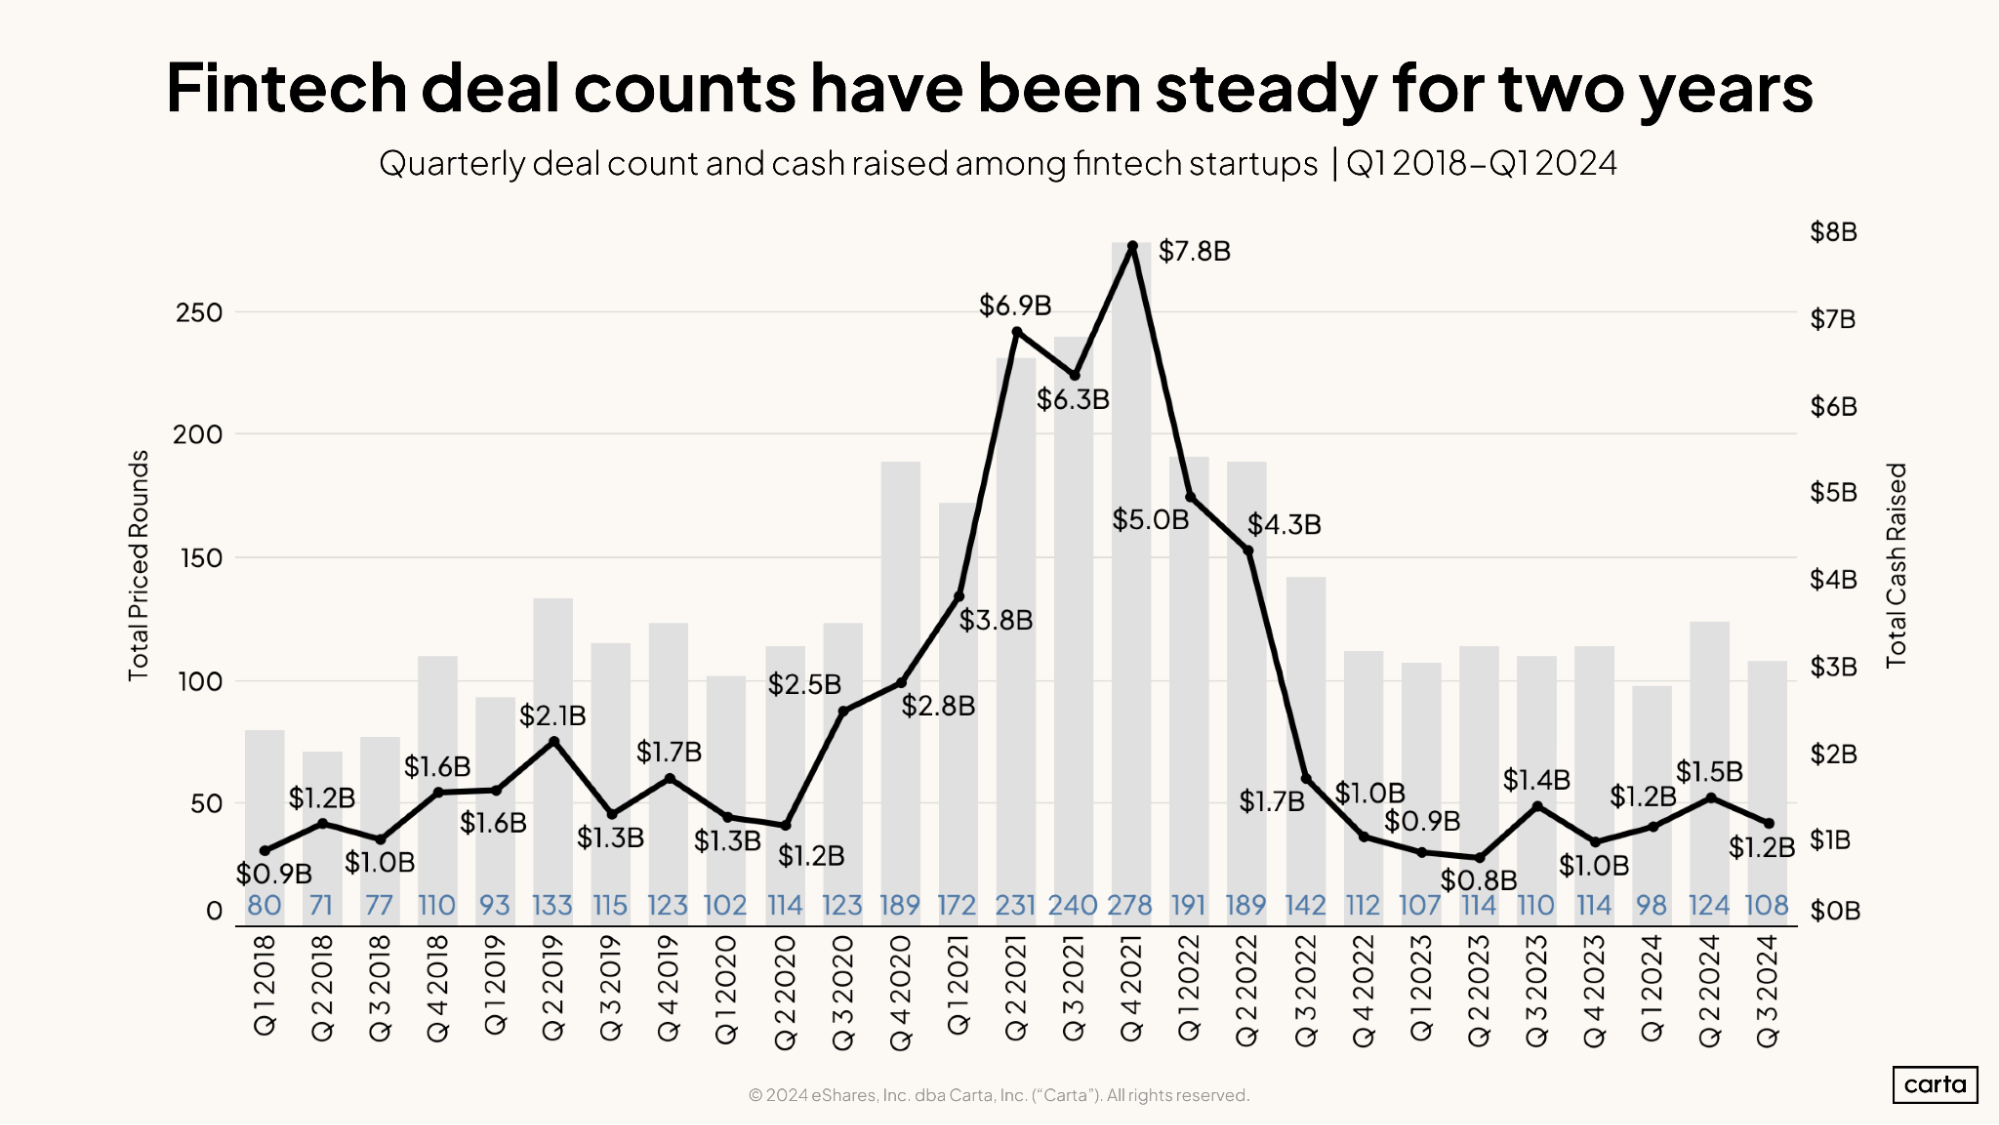
In Q3, fintech startups on Carta closed 108 new rounds across all stages and brought in $1.2 billion in new venture funding. Both of those figures will likely continue to rise as companies log additional transactions on Carta’s platform. But for now, at least, Q3 represents a slight slowdown from Q2, which was the busiest quarter for fintech fundraising since Q3 2022.
Compared to this same time a year ago, fintech activity looks quite similar. The number of investments fell by less than 2% year over year, while capital raised was down 14%.
Fintech startups have now topped the $1 billion mark in five straight quarters. It now seems safe to say that the fintech fundraising slowdown reached its nadir in the first half of last year, when funding levels dipped below $1 billion in both Q1 and Q2.
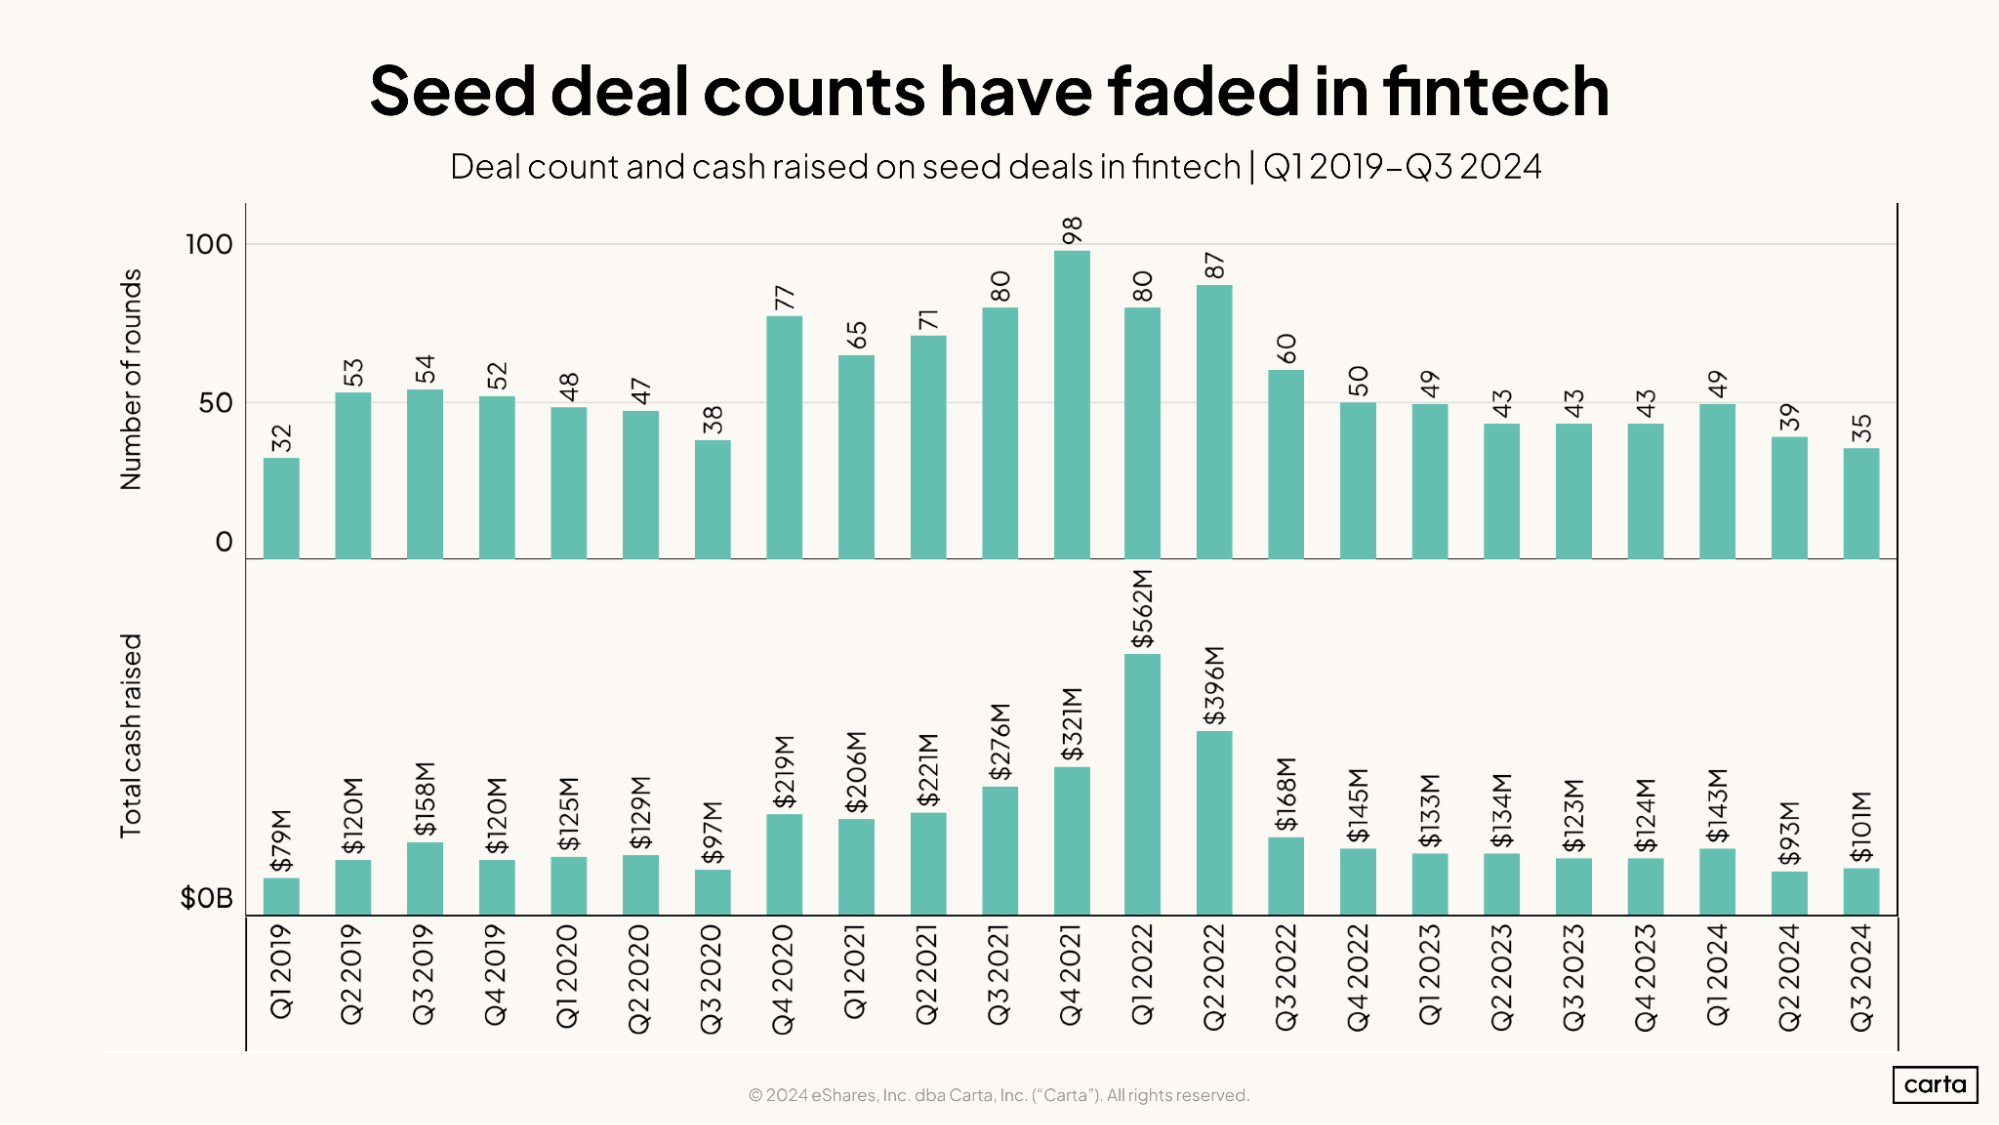
The past two quarters have been relatively slow ones for fintech funding at the seed stage. In Q3, fintech startups on Carta closed just 35 new seed deals, and in Q2, they raised just $93 million in new seed capital. Both of those are the lowest quarterly totals since Q1 2019.
So far this year, fintech startups are averaging 41 new seed investments and $112 million in capital raised per quarter. These represent slight declines from 2023, when the sector averaged 44.5 deals and $129 million in new funding each quarter.
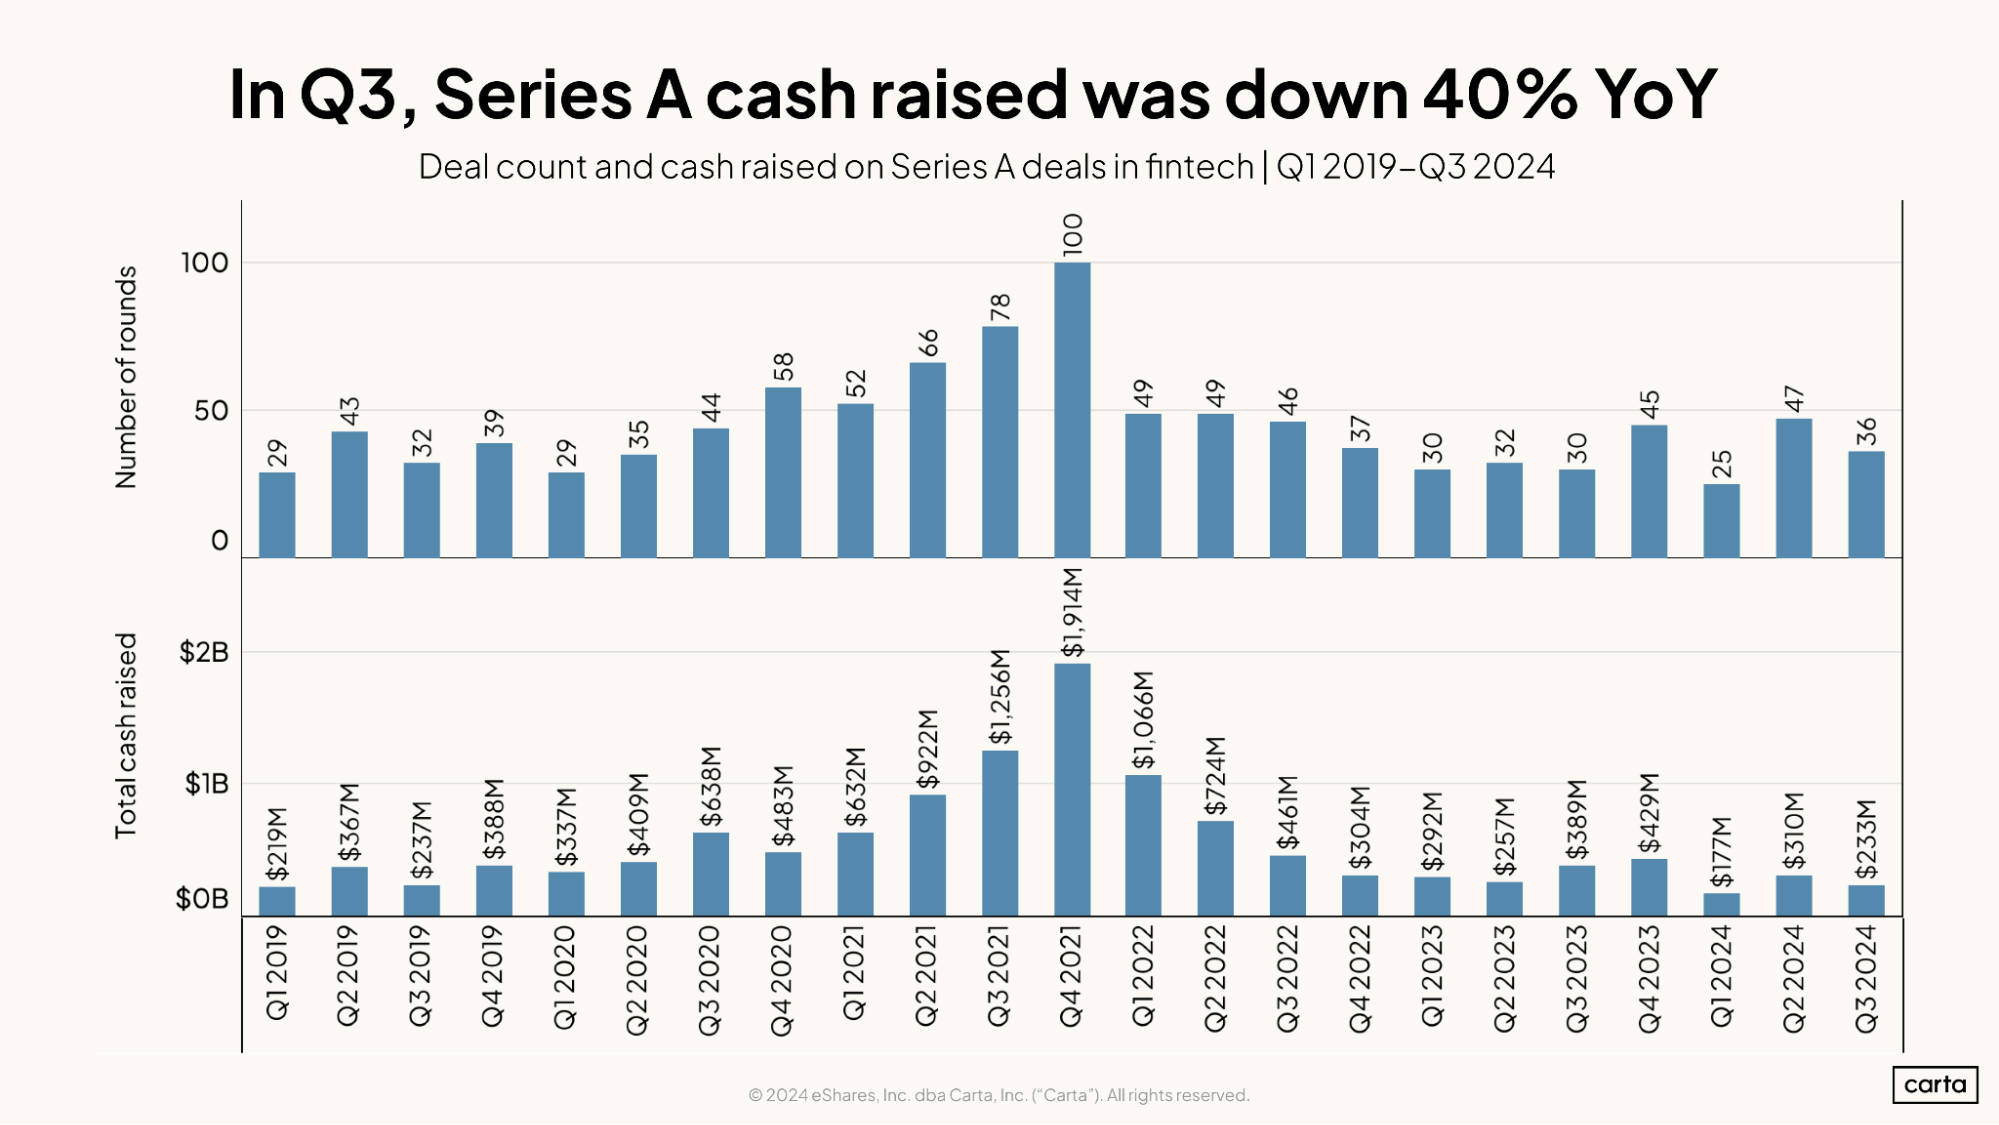
After a painfully slow Q1, fintech deal counts have picked back up at Series A in the past two quarters. Q2 was particularly busy, with 47 transactions closed—the highest quarterly figure since Q2 2022.
In terms of capital raised, however, the Series A market is lagging well behind last year. In Q1 2024, fintech startups raised about $177 million in Series A funding, and in Q3, they raised about $233 million. Those represent the two lowest quarterly totals of the past five years.
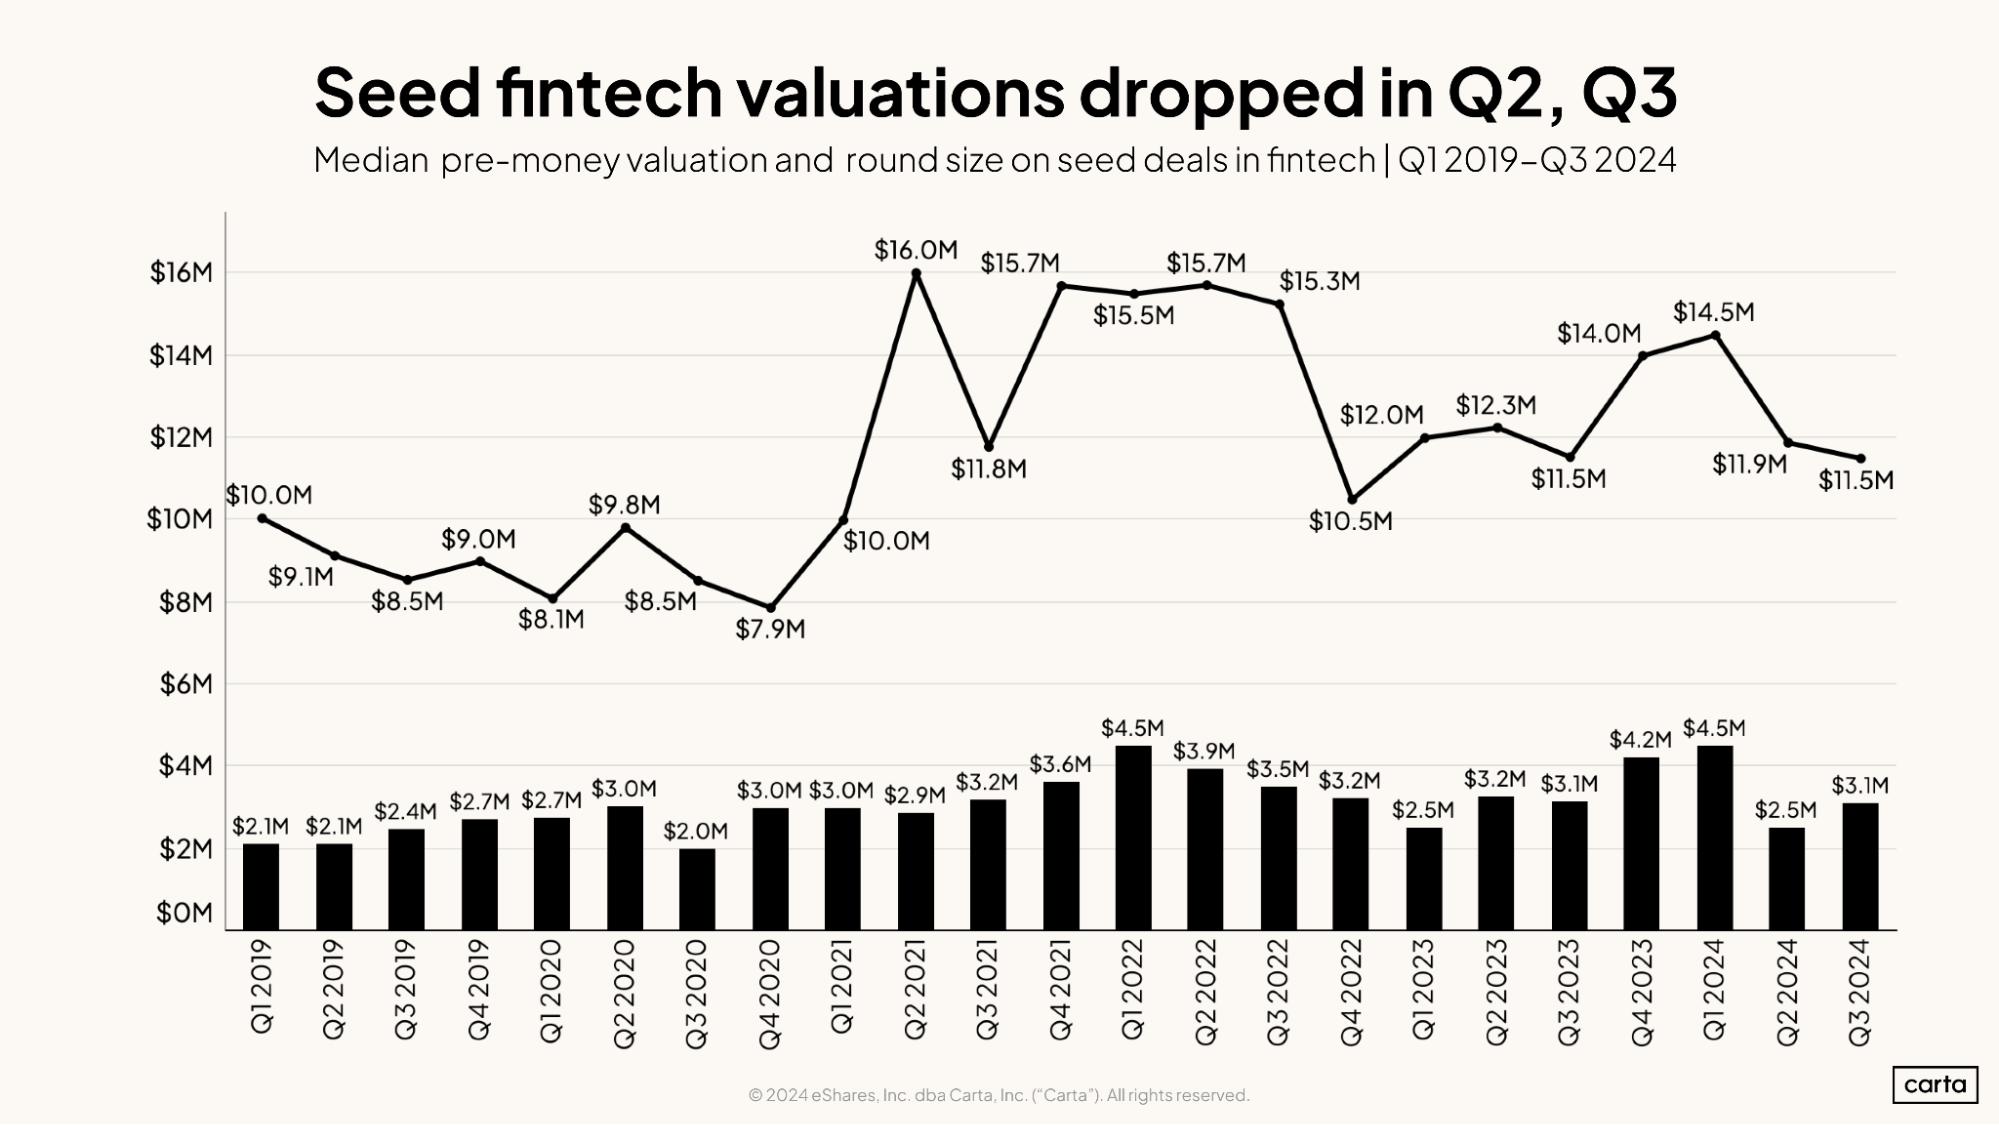
Seed valuations in the fintech space have shown some significant fluctuation in the past two years. In Q3, the median seed valuation dropped to $11.5 million. That’s the same as it was a year ago, back in Q3 2024. But it marks a 21% decline from two quarters ago, in Q1 2024, when the median reached $14.5 million.
It’s a similar story in terms of median deal size: Seed rounds got a little bit bigger in Q4 2023 and Q1 2024, then smaller the past two quarters. In Q3, the median fintech seed deal was $3.1 million, compared to $3.8 million across all sectors.
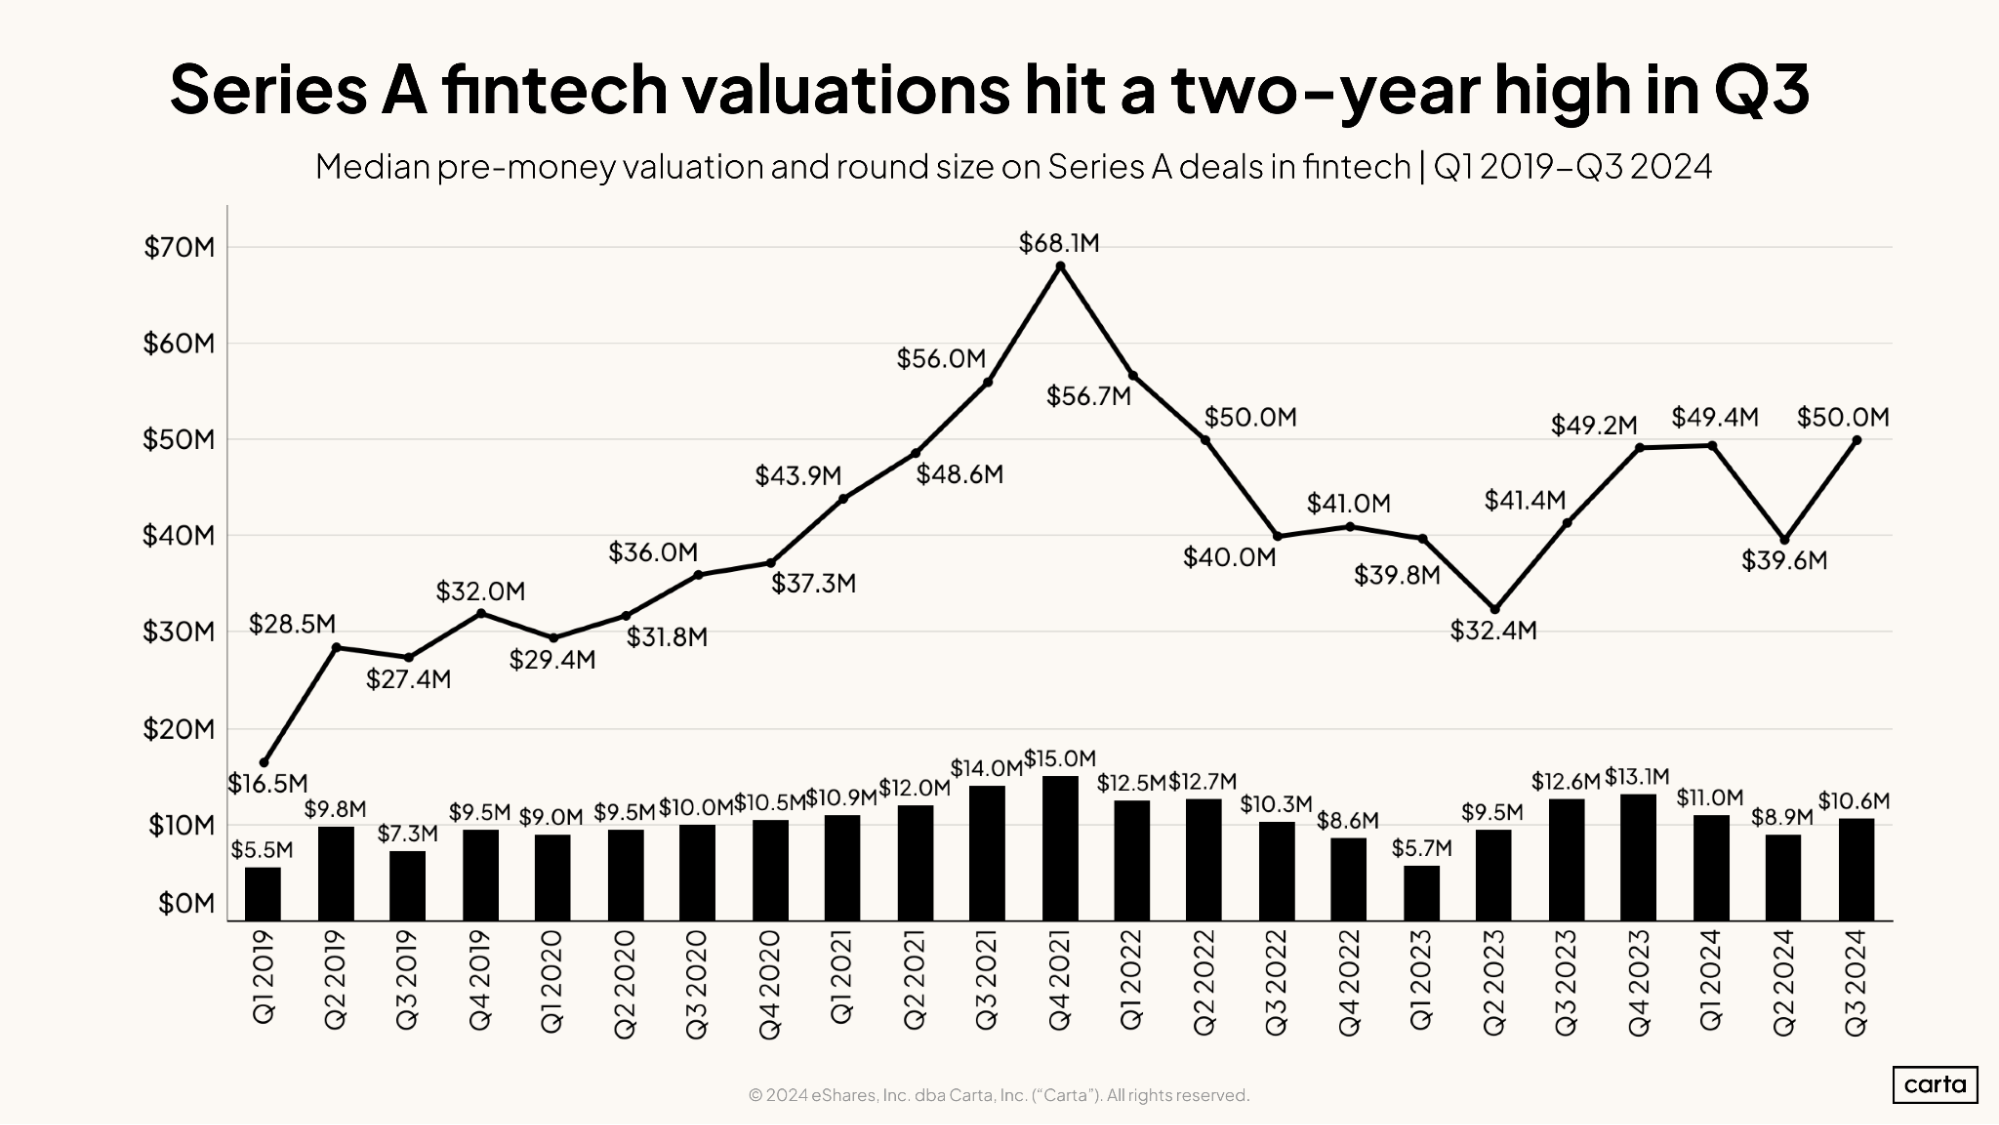
In three of the past four quarters, the median Series A valuation in fintech has landed between $49 million and $50 million. That’s a relatively high mark compared to much of recent history—certainly compared to 2019 and 2020, when median valuations were consistently below $40 million.
Deal sizes for Series A fintech rounds have not grown to the same degree. Over the past four full years—dating back to Q3 2020—the median valuation has grown by 39%. The median deal size, meanwhile, has only increased by 6%.
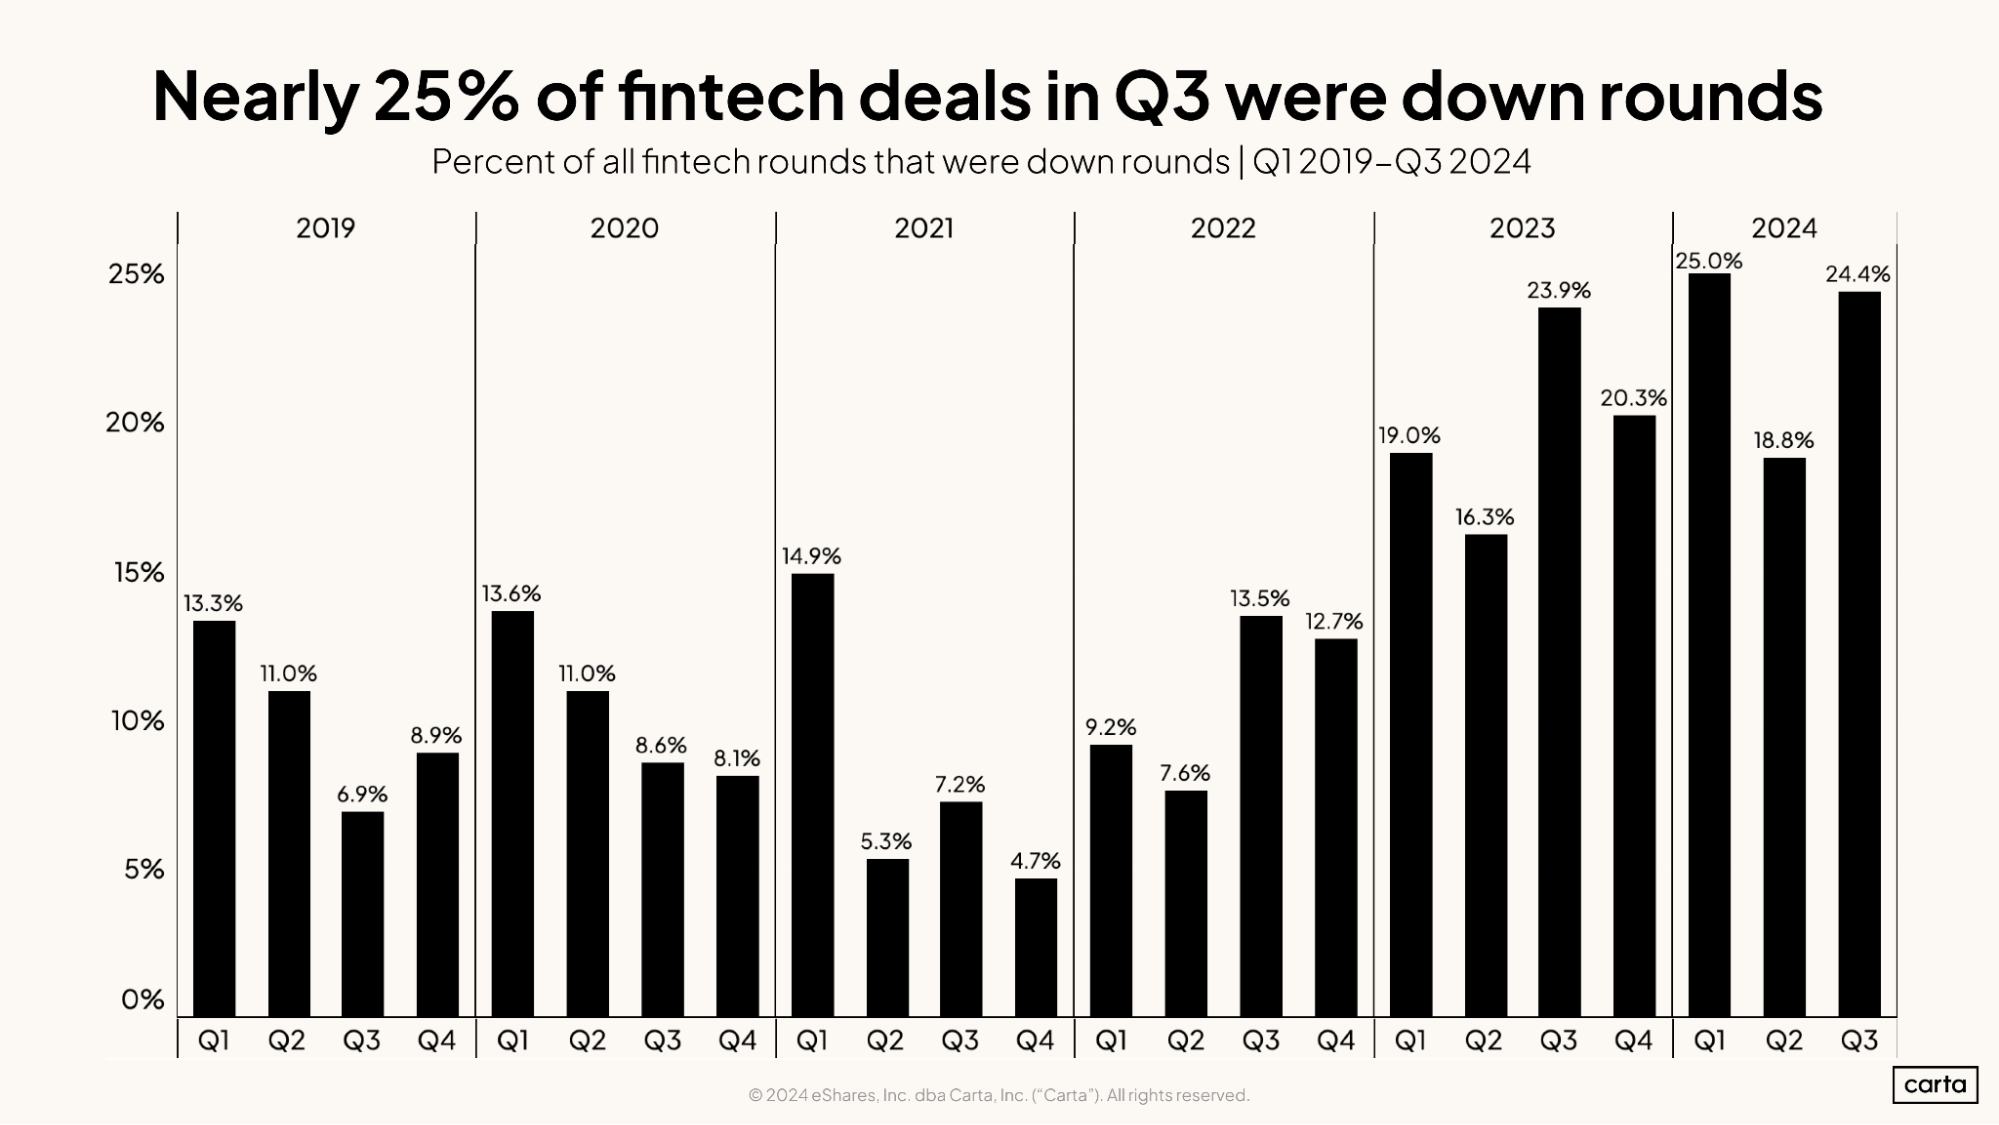
Over the past three years, down rounds have grown much more common for fintech startups. Across all funding stages, 24.4% of rounds closed in Q3 came at a reduced valuation compared to the company’s previous funding round. That’s the second-highest quarterly mark of the past six years. The only one higher came two quarters ago, in Q1, when the down-round rate reached an even 25%.
These sorts of rates represent a huge change from a few years ago. Back in Q4 2021, near the height of the venture boom, less than 5% of fintech investments were down rounds.
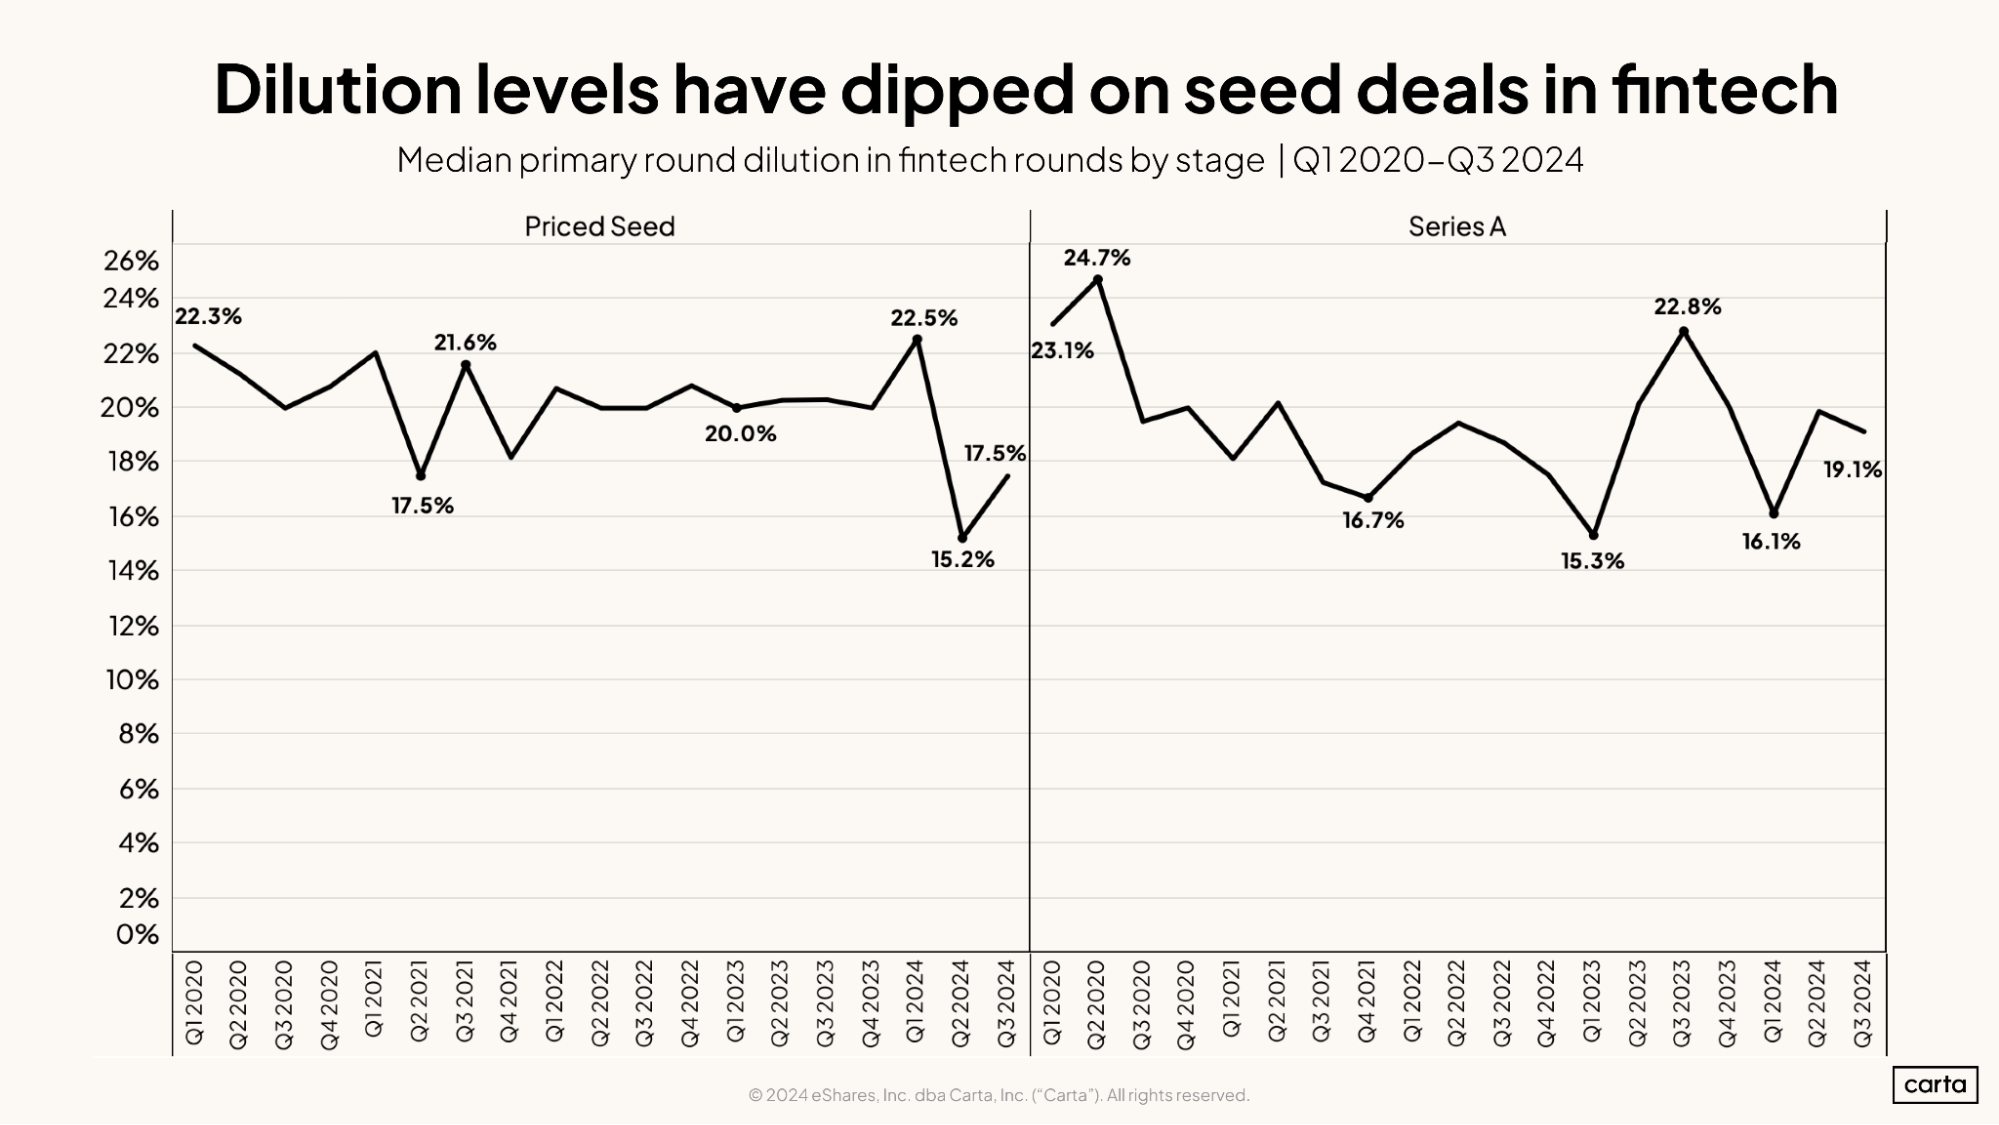
After jumping to 22.5% in Q1, the median dilution on new seed deals fell significantly in the past two quarters. In Q3, typical seed dilution was 17.5%, the second-lowest quarterly rate so far this decade.
The median seed dilution across all industries in Q3 was 20%. Compared to their peers in other fields, fintech startups have been able to retain a slightly larger percentage of their shares when they raise new seed funding.
At Series A, median dilution on fintech deals in Q3 was 19.1%. Again, that’s lower than the median across all industries, which landed at 20.4% last quarter. This trend of lower dilution in fintech has been a recent development: Back in Q1 2020, median dilution on Series A fintech deals was equal to the median dilution on Series A transactions as a whole, at 23.1%.
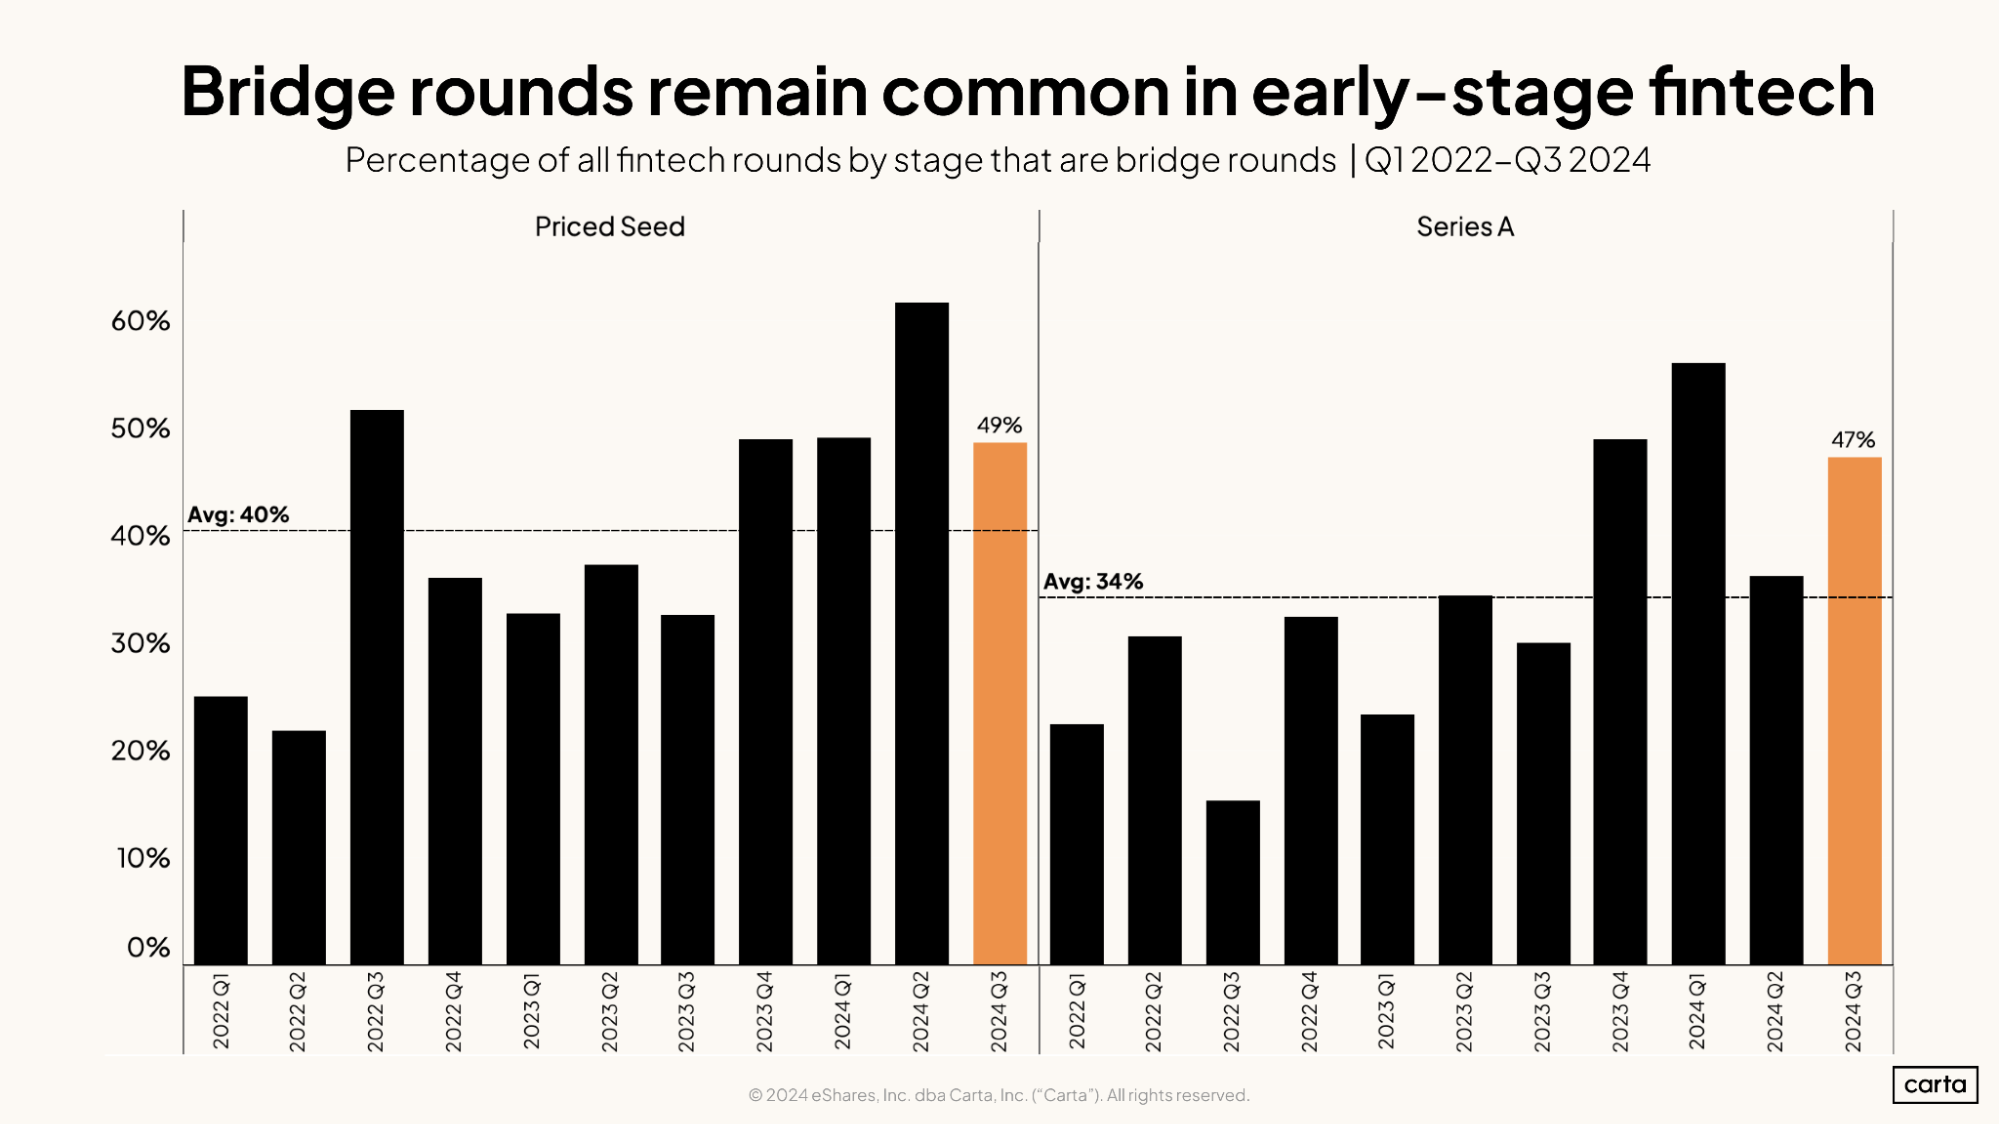
At both seed and Series A nearly 50% of all investments that took place in Q3 were bridge rounds. In both cases, this continues a recent trend of lofty bridge-round rates. At seed, a whopping 62% of deals back in Q2 were bridge rounds, the highest quarterly rate on record.
Bridge rounds have grown more common in the past few years across nearly every industry. As valuations declined and it became harder to raise primary rounds during the venture slowdown, more and more companies turned to bridge rounds as an alternative. Fintech is no exception.
In fact, the trend is even more pronounced in fintech—at least in recent quarters. Across all sectors, about 40% of investments raised by seed startups in Q3 were bridge rounds. At Series A, the rate across all sectors was 39%.
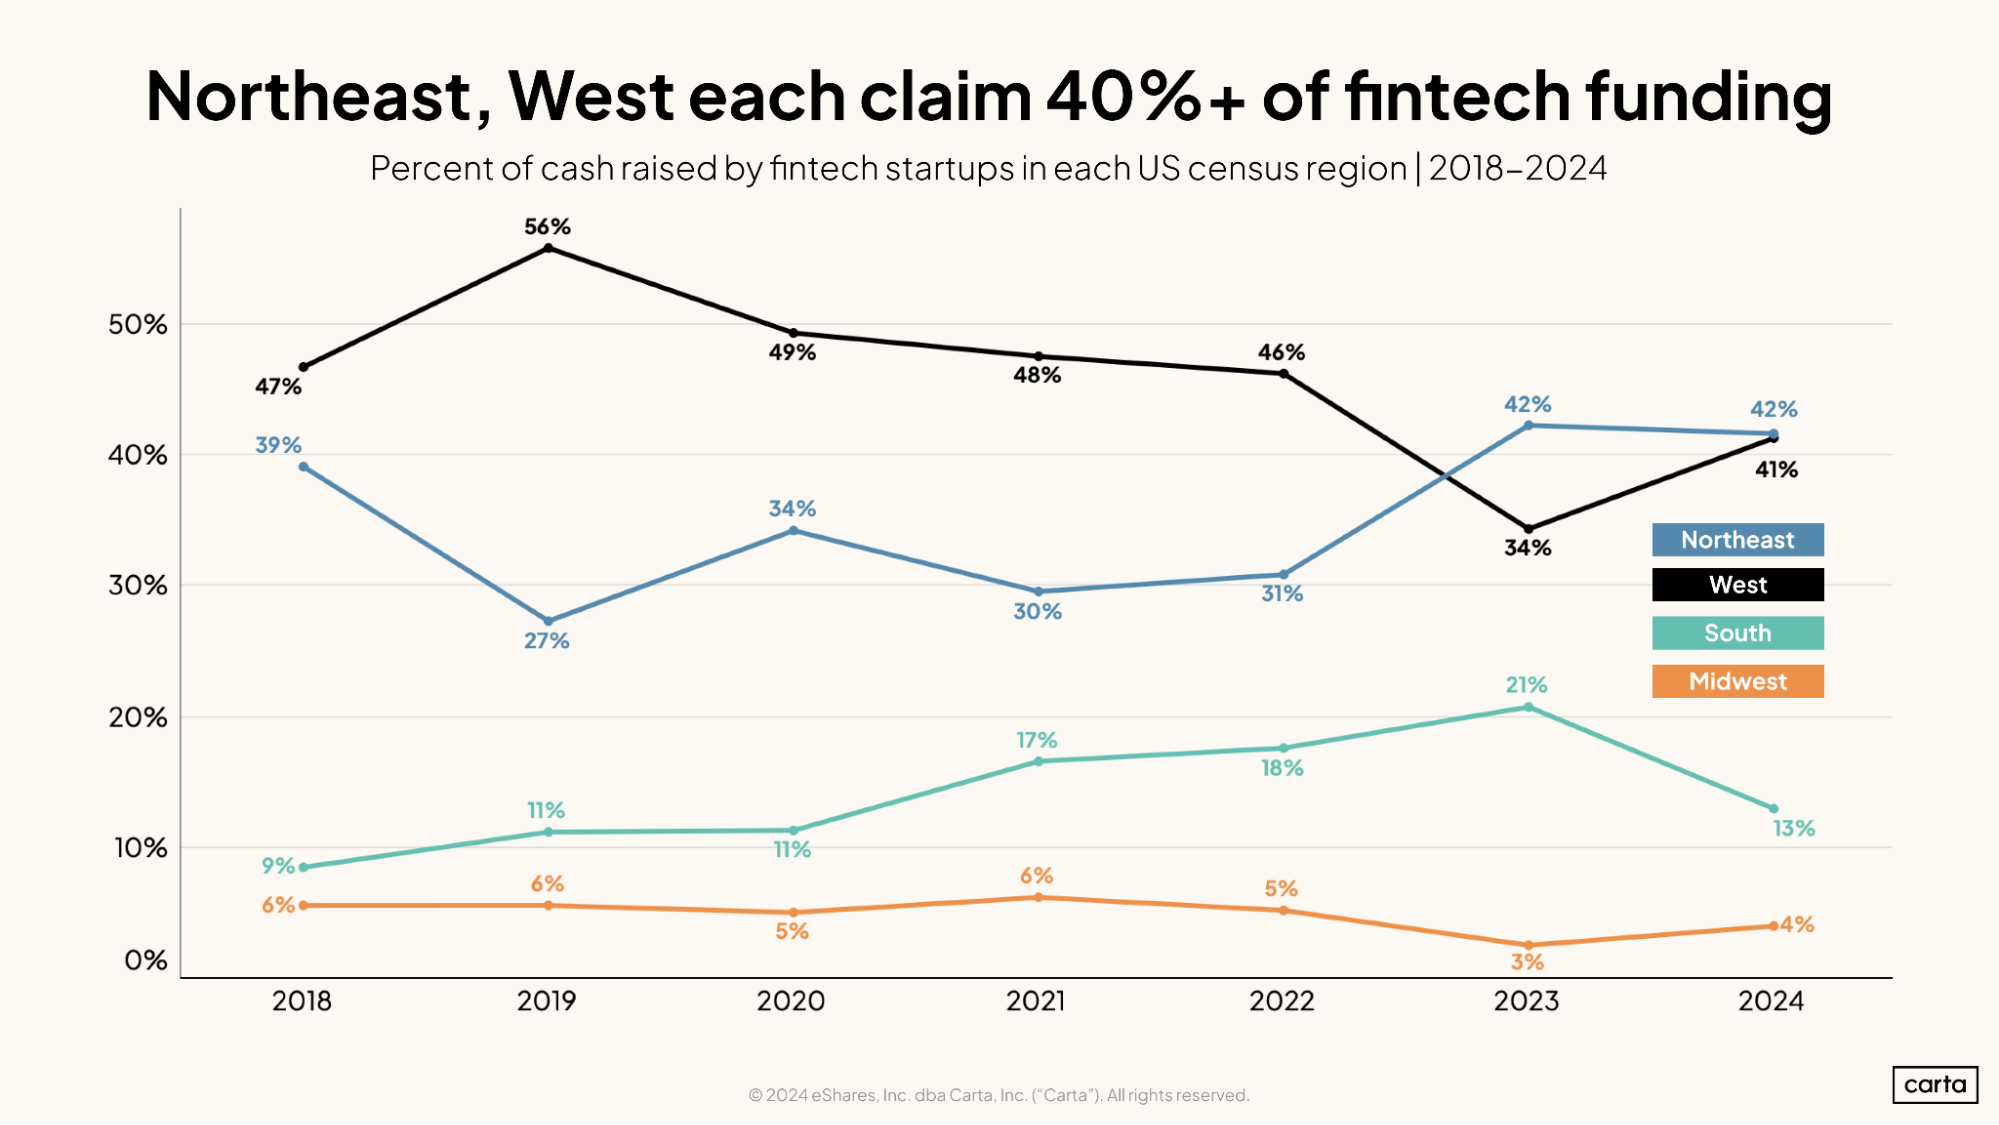
The West and the Northeast are the primary geographic hubs for venture fundraising in fintech. Combined, startups based in those two census regions accounted for 83% of all cash raised in fintech during Q3, compared to just 17% in the South and Midwest.
From 2018 through 2022, the West was busier than the Northeast. In the past two years, however, the Northeast has taken over the top spot—aided, surely, by New York City’s perch as a world financial hub. From Q4 2023 through Q3 2024, fintech startups accounted for about 16% of all capital raised in the NYC metro.
Get more industry-specific data
Download the addendum to our Q3 2024 report to get industry-specific data on fundraising and valuations:

DISCLOSURE: This communication is on behalf of eShares, Inc. dba Carta, Inc. ("Carta"). This communication is for informational purposes only, and contains general information only. Carta is not, by means of this communication, rendering accounting, business, financial, investment, legal, tax, or other professional advice or services. This publication is not a substitute for such professional advice or services nor should it be used as a basis for any decision or action that may affect your business or interests. Before making any decision or taking any action that may affect your business or interests, you should consult a qualified professional advisor. This communication is not intended as a recommendation, offer or solicitation for the purchase or sale of any security. Carta does not assume any liability for reliance on the information provided herein. © 2026 Carta. All rights reserved. Reproduction prohibited.