Employee equity isn’t just for startups backed by venture capital firms. Increasingly, companies owned by private equity firms—a much larger source of private capital—are now also using equity as a key part of their compensation strategies, especially for management teams.
The ways that equity is used at these PE-backed corporations and LLCs can be quite different from how equity is deployed by VC-backed startups. It can also differ significantly from one PE-backed company to the next.
This report relies on data from more than 1,500 corporations and 500 LLCs on Carta that are backed by private equity firms to shed new light on how equity compensation works within this multitrillion-dollar segment of the economy. We examine several of the key variables and characteristics that can define an equity strategy, including different types of equity securities, different vesting schedules, the typical size of equity grants, and different performance conditions that might impact how and when equity grants ultimately vest. We particularly focus on equity granted to management teams, also referred to as executives, as these represent the leadership at PE-backed companies.
Consistent and reliable data around compensation at PE-backed companies can be notoriously difficult to find. This report aims to give decision-makers at these companies a new level of insight into how their peers and competitors across the private-market landscape are using equity to attract and retain high-end talent.
Highlights
Monthly vesting is more common at corporations than LLCs: About 63% of initial equity grants issued to executives at PE-backed corporations were on monthly vesting schedules, while 15% were annual. That stands in stark contrast to PE-backed LLCs, where 72% of initial executive grants vest annually and less than 10% vest monthly.
Most performance conditions are linked to financial returns: When equity grants issued to management teams at PE-backed LLCs come with performance conditions, the majority of those conditions—about 52%—are linked to MOIC, IRR, or some other metric that measures the financial return generated for the PE owner. A smaller segment of performance conditions are linked to achieving an exit.
Median grants to CEOs top 2% of equity: At PE-backed corporations, the median initial equity grant issued to a new CEO comprises about 2.6% of the company’s fully diluted equity. At PE-backed LLCs, the median initial grant issued to new CEO hires in 2024 was about 2.2% of company ownership.
PE-backed corporations
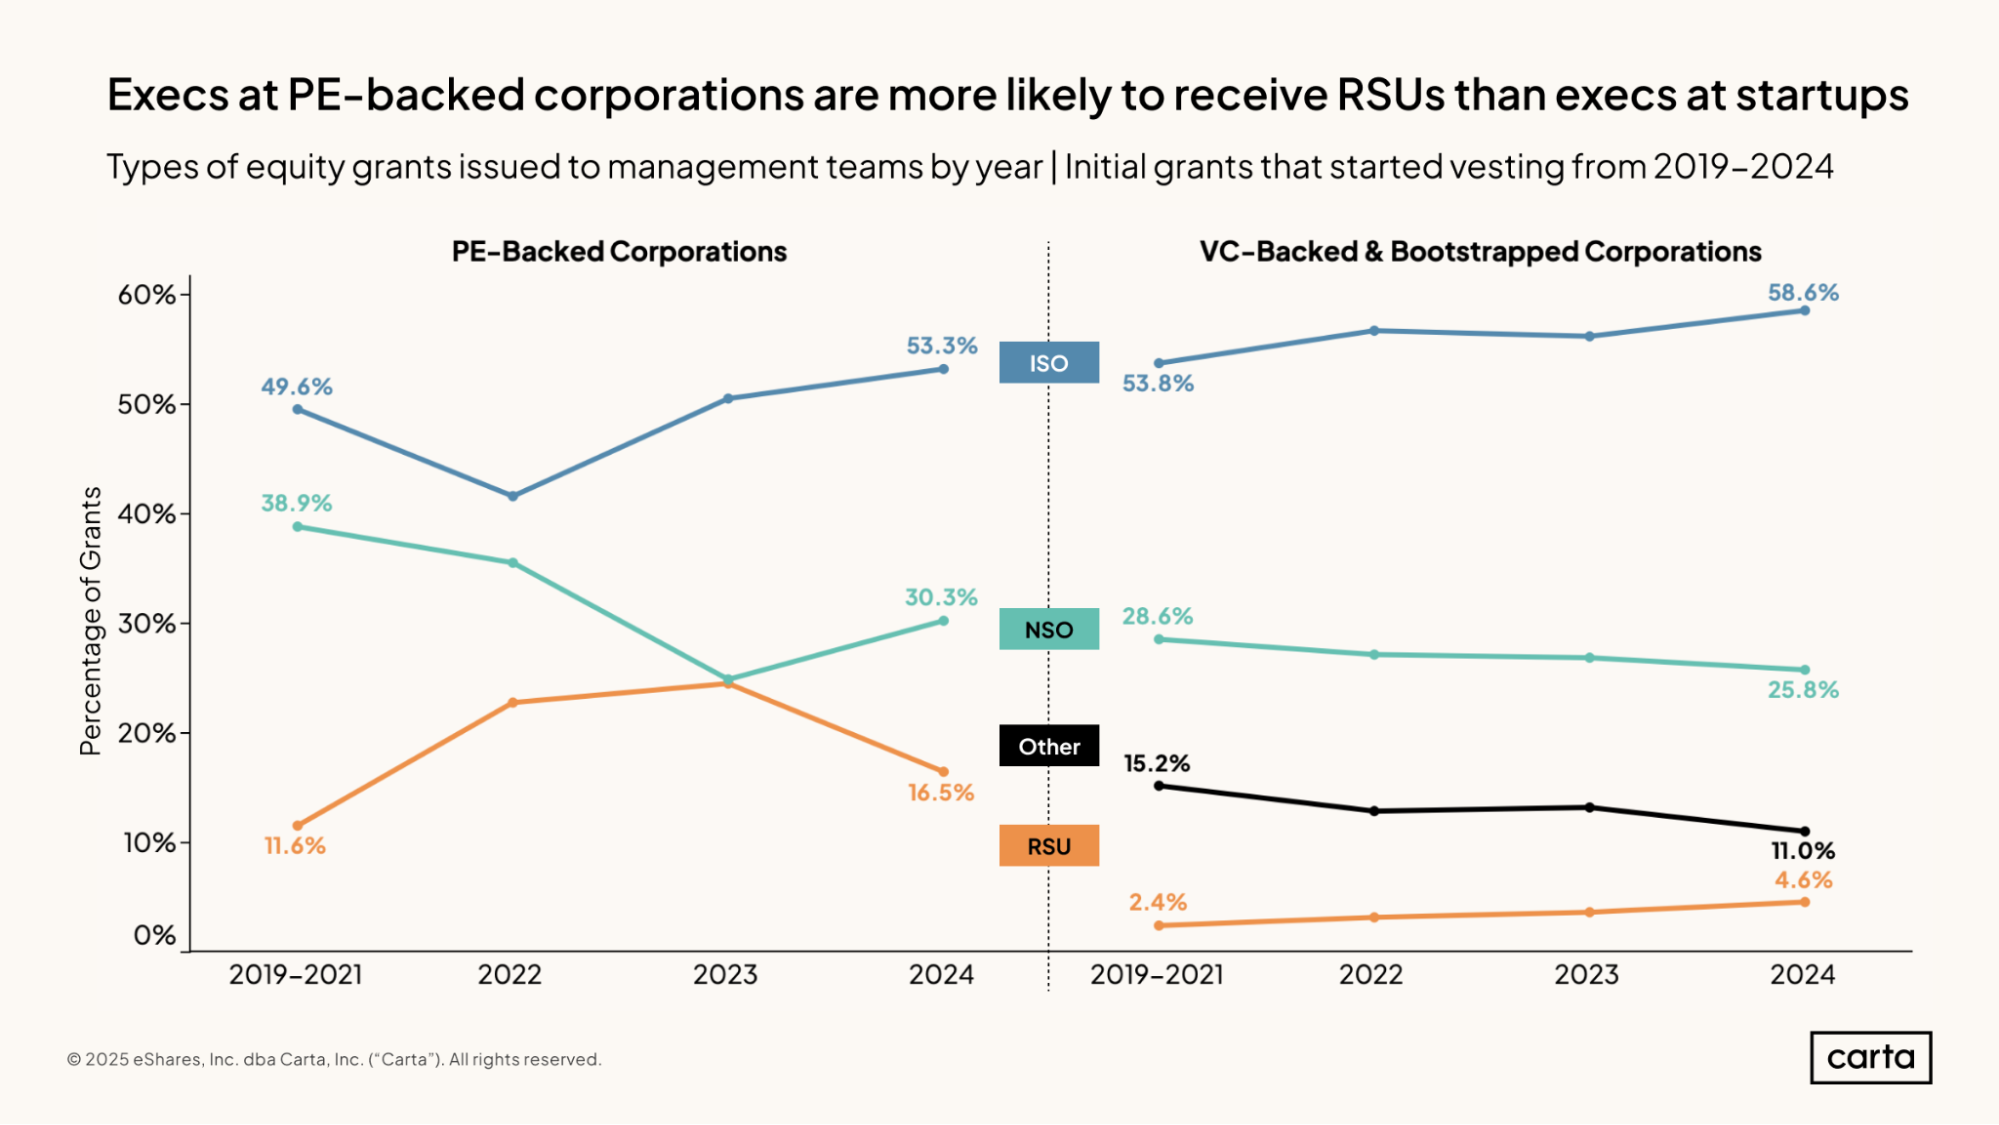
At both PE-backed corporations and VC-backed corporations, more than 50% of initial equity grants issued to executives in 2024 were in the form of incentive stock options (ISOs), and over 25% of grants were non-qualified stock options (NSOs). In recent years, ISOs have been growing more common among both populations.
Across the first half of the 2020s, PE-backed corporations have been much more likely than VC-backed corporations to issue restricted stock units (RSUs) to new executive hires. RSUs accounted for 16.5% of all equity grants at PE-backed corporations in 2024, down from 24.5% the year before.
This difference is perhaps to be expected. It’s a common progression for young startups to initially issue stock options to new employees, then eventually transition to RSUs as the company grows. As a company’s valuation increases, the strike price that employees would be required to pay to exercise their options grows commensurately higher.
Stock options and RSUs are both ways to give employees an equity ownership stake once certain vesting criteria have been met, but they function in different ways. While stock options give employees the option to buy equity shares in the company in the future at a predetermined price, RSUs convert directly to equity shares at no extra cost to the holder, besides any applicable taxes.
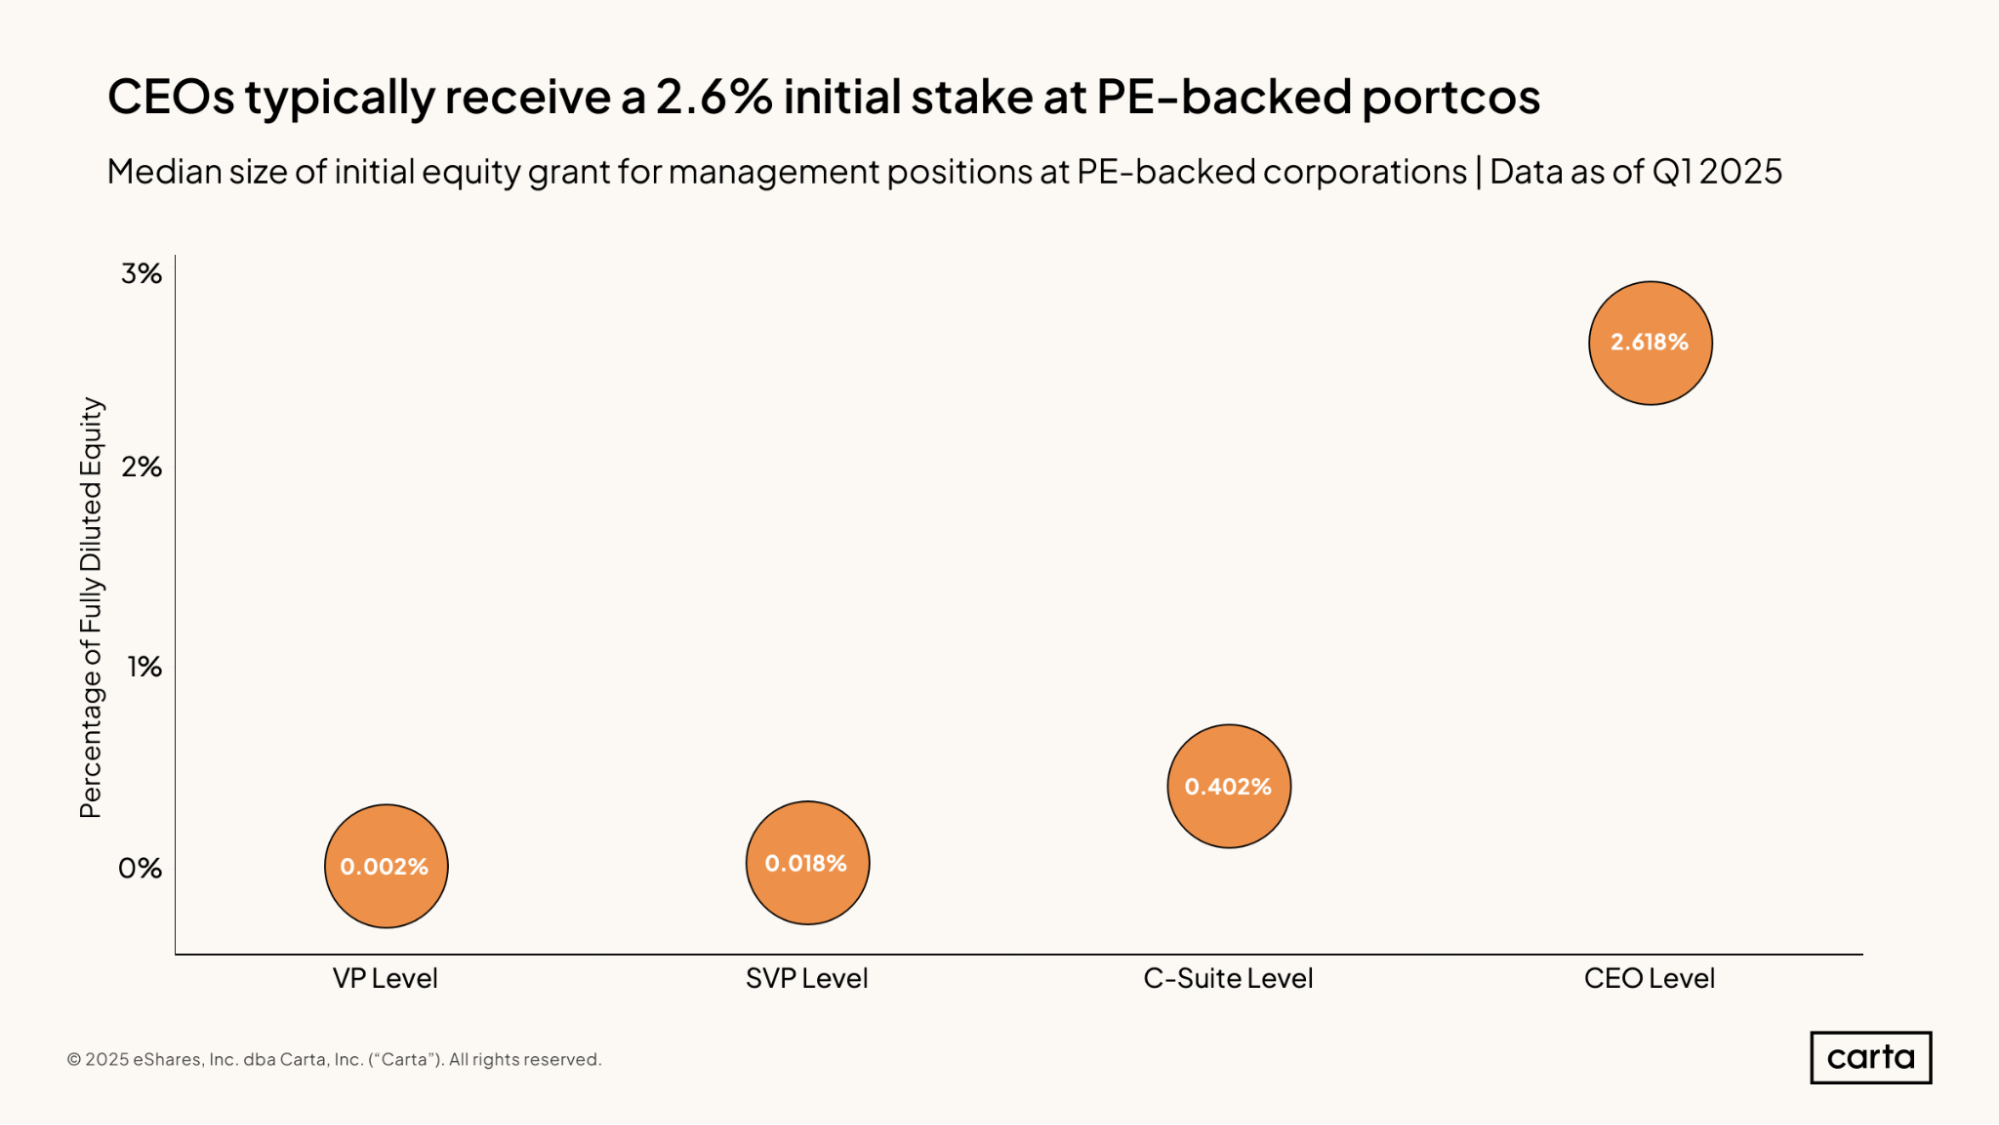
The median CEO hire at a PE-backed corporation receives an initial grant comprising about 2.6% of the company’s fully diluted equity. That’s six or seven times larger than the median equity grant for other C-suite hires at PE-backed corporations, which is about 0.4%.
Hires at the SVP and VP level typically receive far smaller initial grants than executives higher up the org chart. The median grant for CEOs is more than 1,000 times larger than it is for VPs.
In addition to these initial grants, many executives will receive additional equity grants in the future in the form of refresh grants or bonuses, increasing their eventual share of the equity pie.
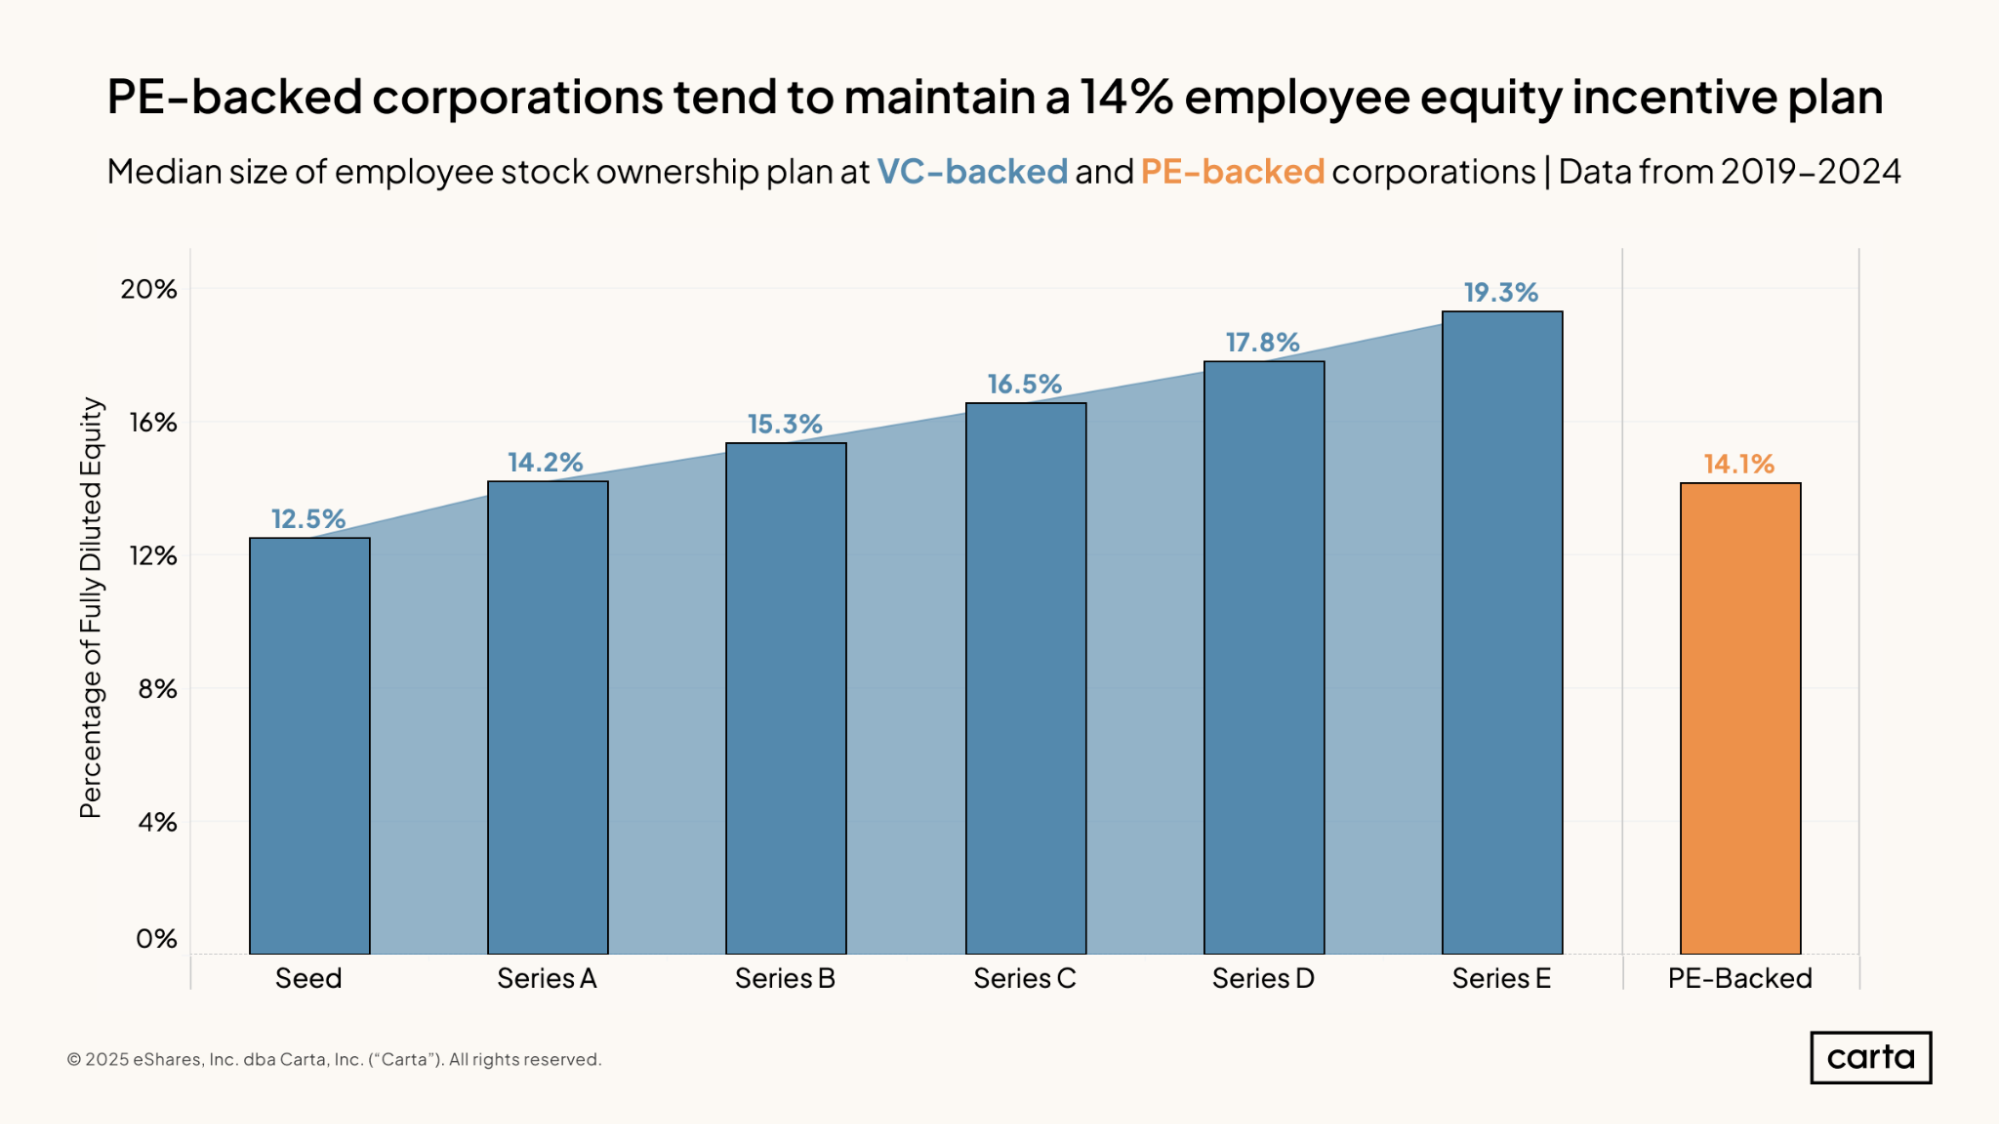
The median PE-backed corporation sets aside 14.1% of its fully diluted equity for its employee incentive plan. This pool of equity is used both for initial equity grants to new hires and for equity refreshes and bonuses for existing employees.
In terms of the relative size of its employee equity plan, the median PE-backed corporation is roughly equivalent to the median Series A startup. Venture capital-backed startups typically expand the size of their equity plans as they raise successive rounds of funding, with pools at late-stage startups often nearing 20% of all equity.
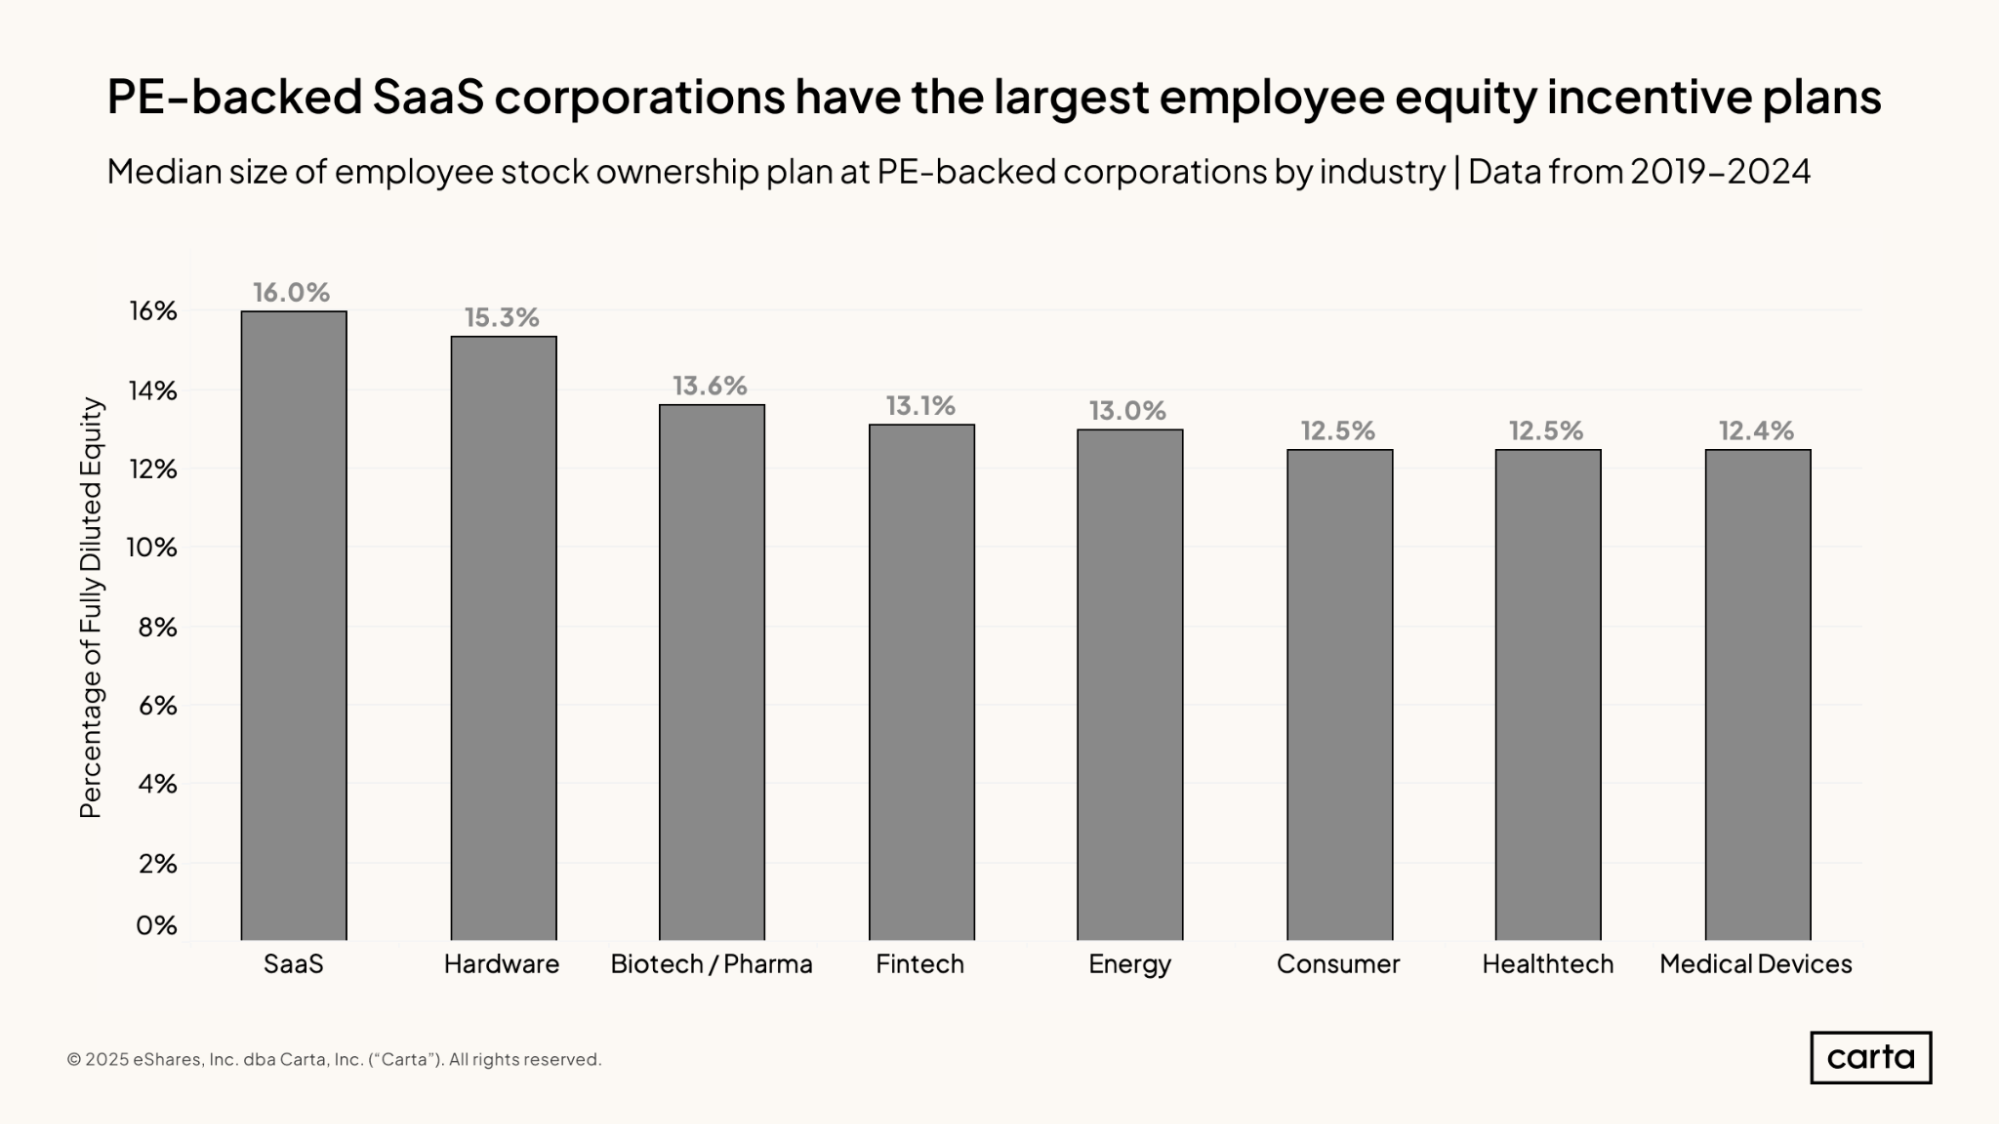
While the median employee ownership plan across all PE-backed corporations comprises 14.1% of all equity, that figure varies across sectors. The largest incentive plans are found in the SaaS industry, where the median pool comprises 16% of all equity, followed by hardware, at 15.3%.
The other six sectors shown here are grouped more closely together, with median plan sizes ranging from 12.4% to 13.6%.
Some companies that are currently PE-backed corporations were formerly VC-backed corporations. SaaS is the most popular sector for VC funding. And we’ve seen that employee equity plans tend to be higher at later-stage VC-backed corporations than at the median PE-backed corporation. It stands to reason that some PE-backed SaaS companies have larger employee equity plans because of their background as venture-backed startups.
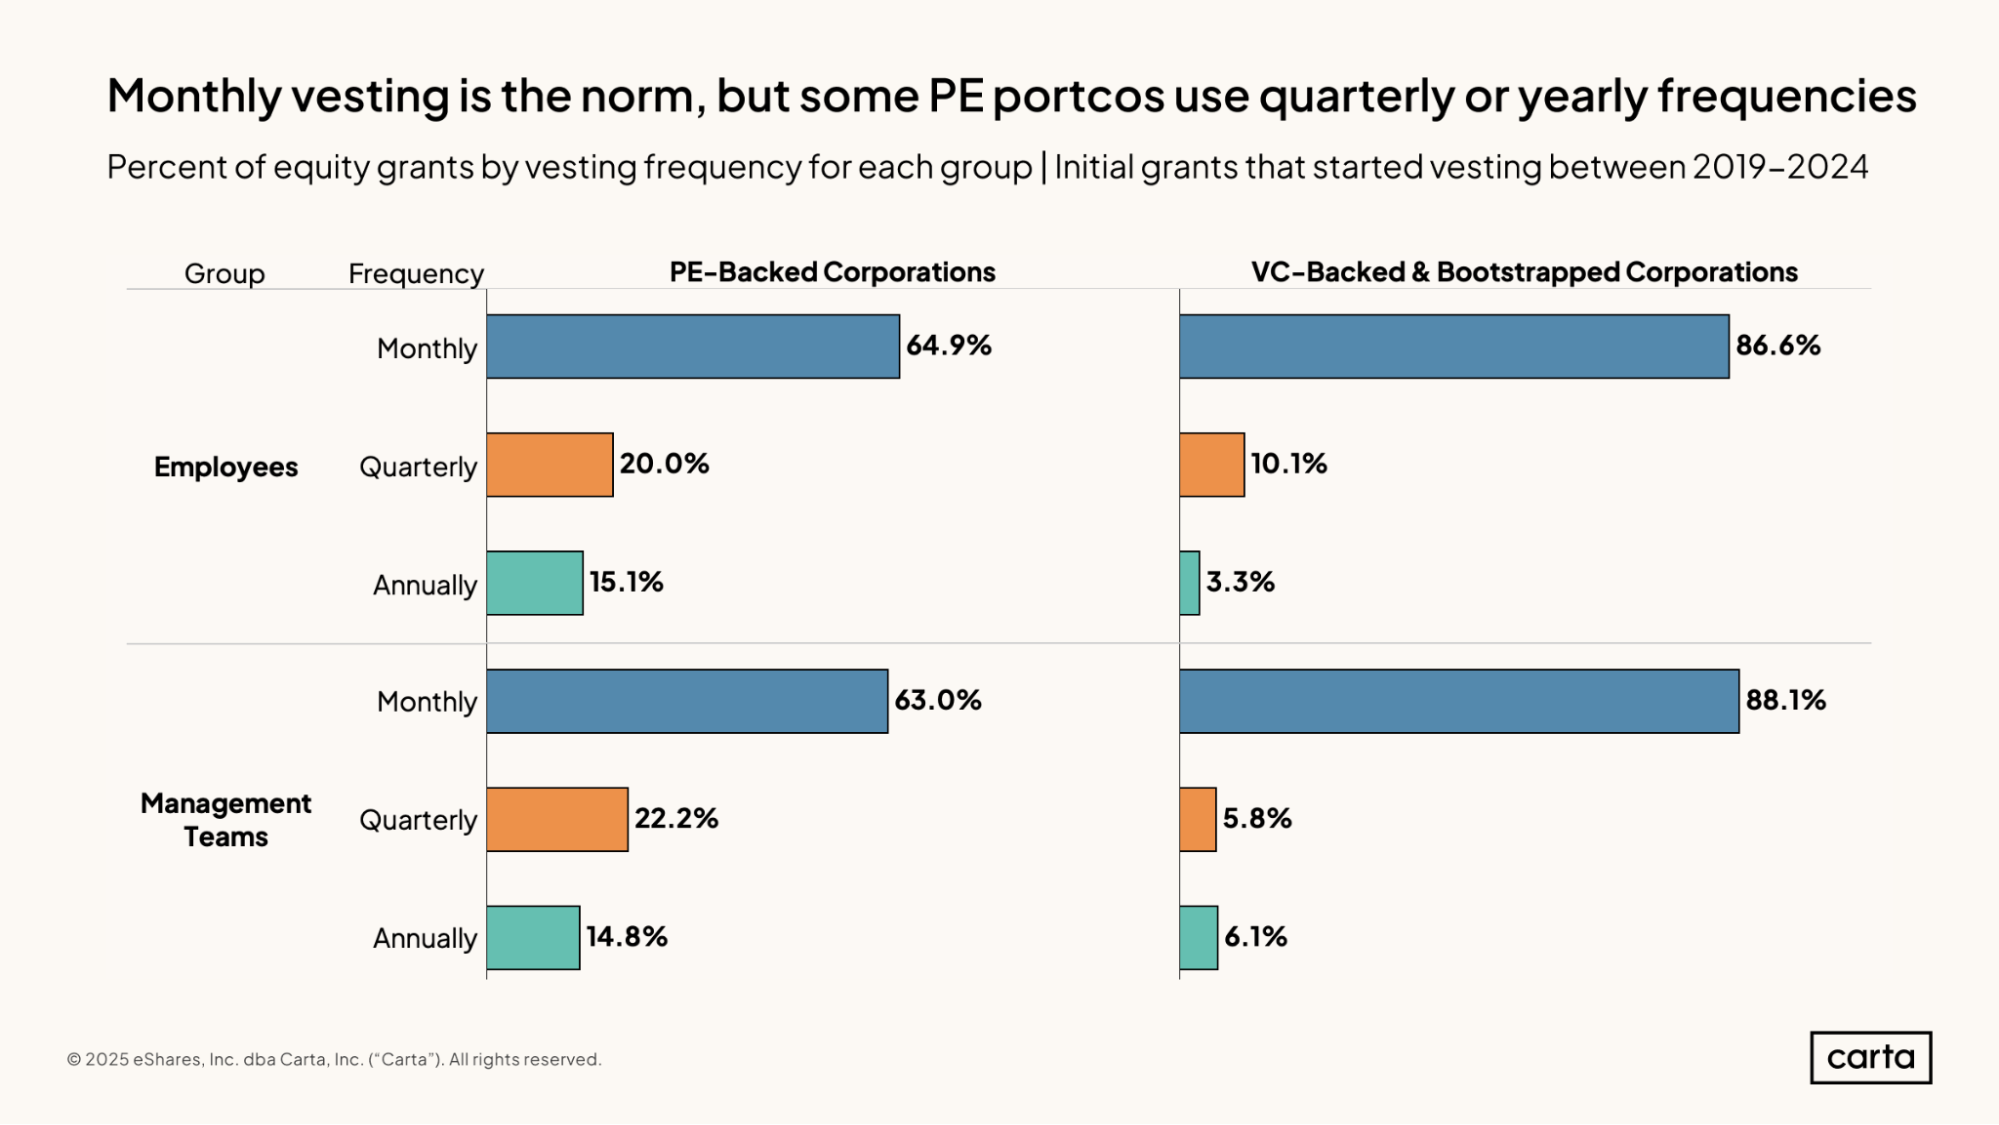
For both employees and management teams at PE-backed corporations, it’s most common for initial equity grants to vest on a monthly basis. About 65% of employees and 63% of management teams at PE-backed corporations begin their employment with monthly vesting plans.
These percentages are lower than they are for VC-backed corporations, where monthly vesting is even more common. This high frequency of vesting can help aid talent retention, supplying employees with a regular source of financial upside.
While monthly plans are still the norm, it’s more common for PE-backed corporations than it is for VC-backed corporations to issue grants that vest on a quarterly or annual basis. Among executives, for instance, about 37% of initial grants at PE-backed corporations vest either quarterly or annually, compared to less than 12% at VC-backed corporations.
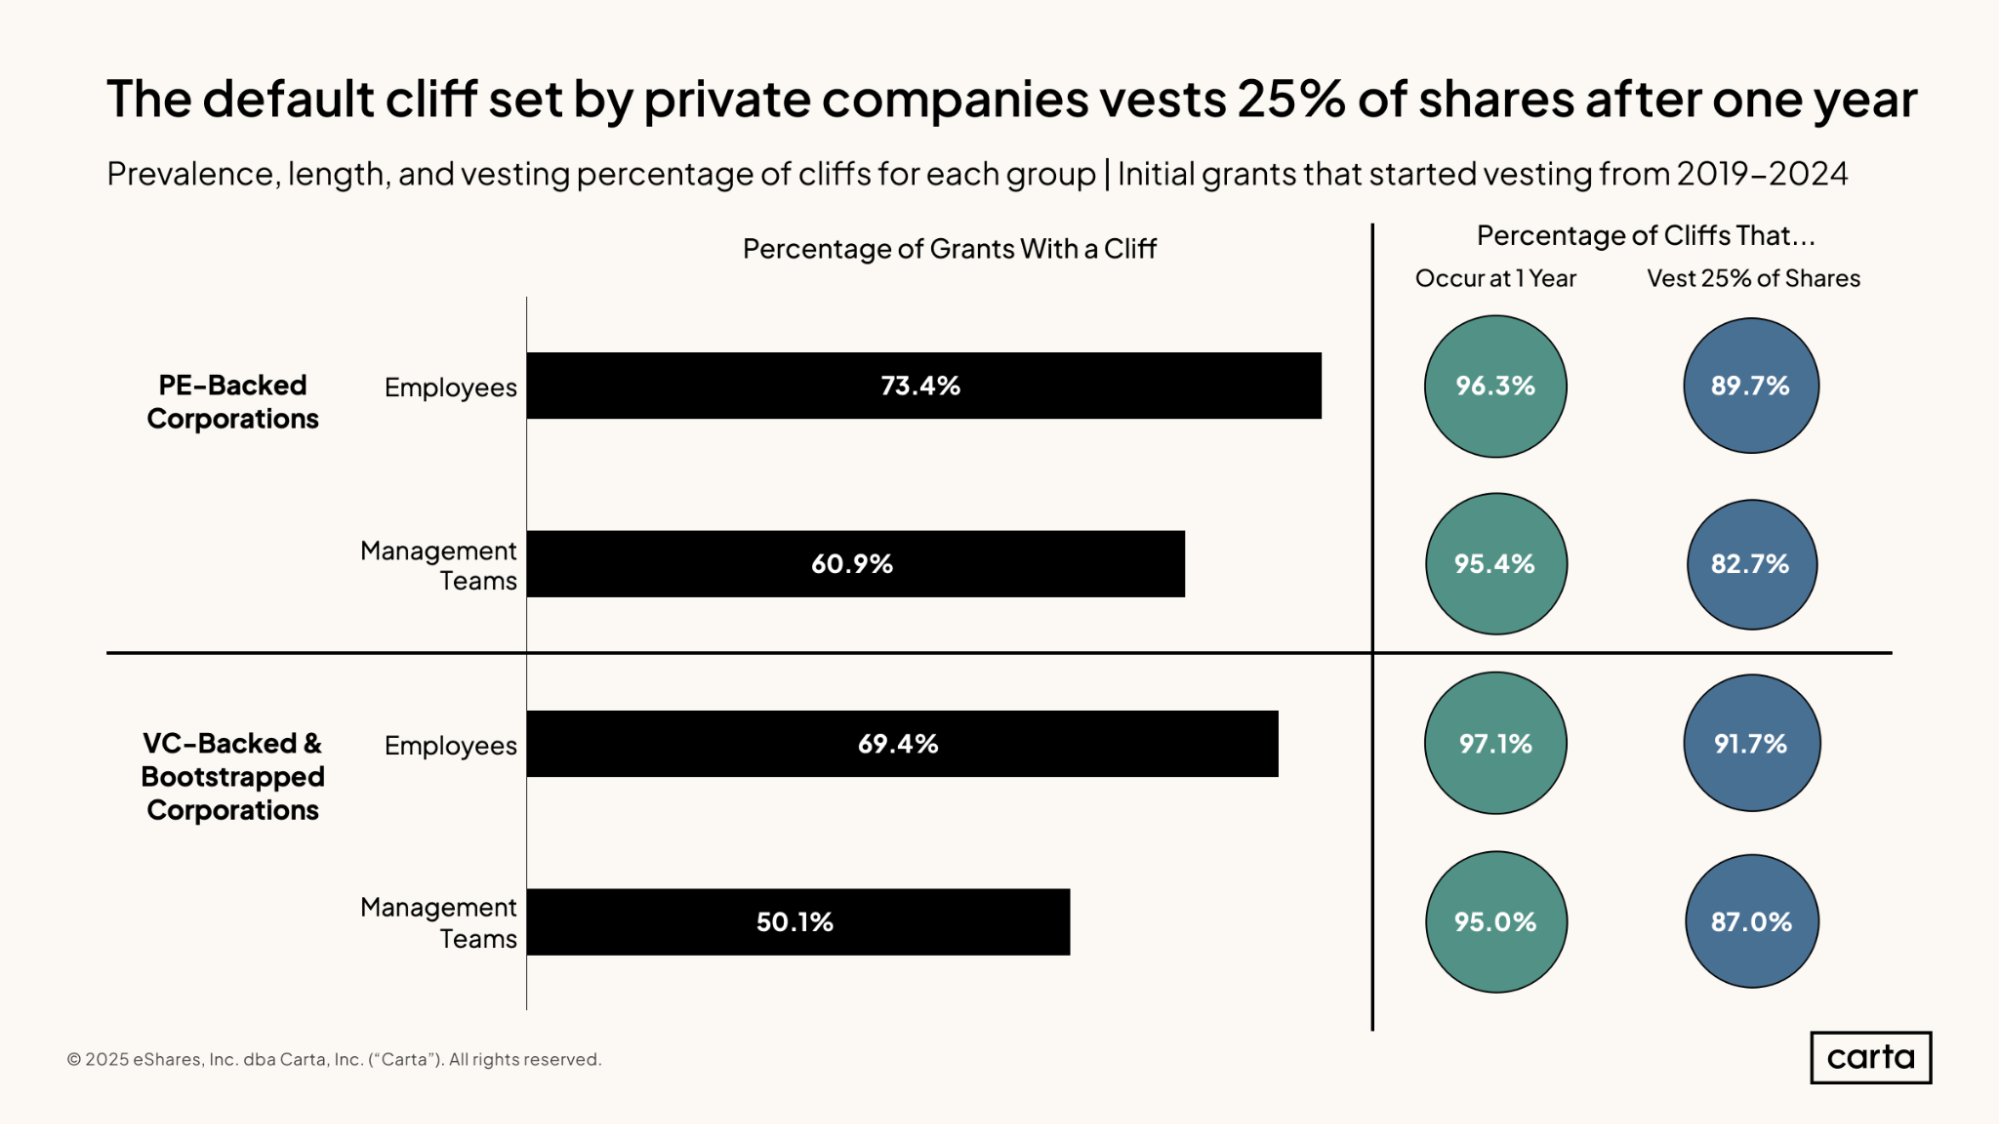
The majority of all initial grants issued to both employees and management teams across both PE-backed and VC-backed corporations have some sort of cliff that must be reached before shares begin to vest. But this majority is slimmer in some groups than it is for others. For instance, about 73% of employees at PE-backed corporations have an initial cliff, compared to just over half of executives at VC-backed corporations.
When initial grants do have a cliff, that cliff is nearly always one year, at which point it’s typical for 25% of shares in the grant to vest. In plain terms, this initial cliff means that most employees at PE-backed companies who receive equity grants must remain in their roles for one year before they start to accrue ownership.
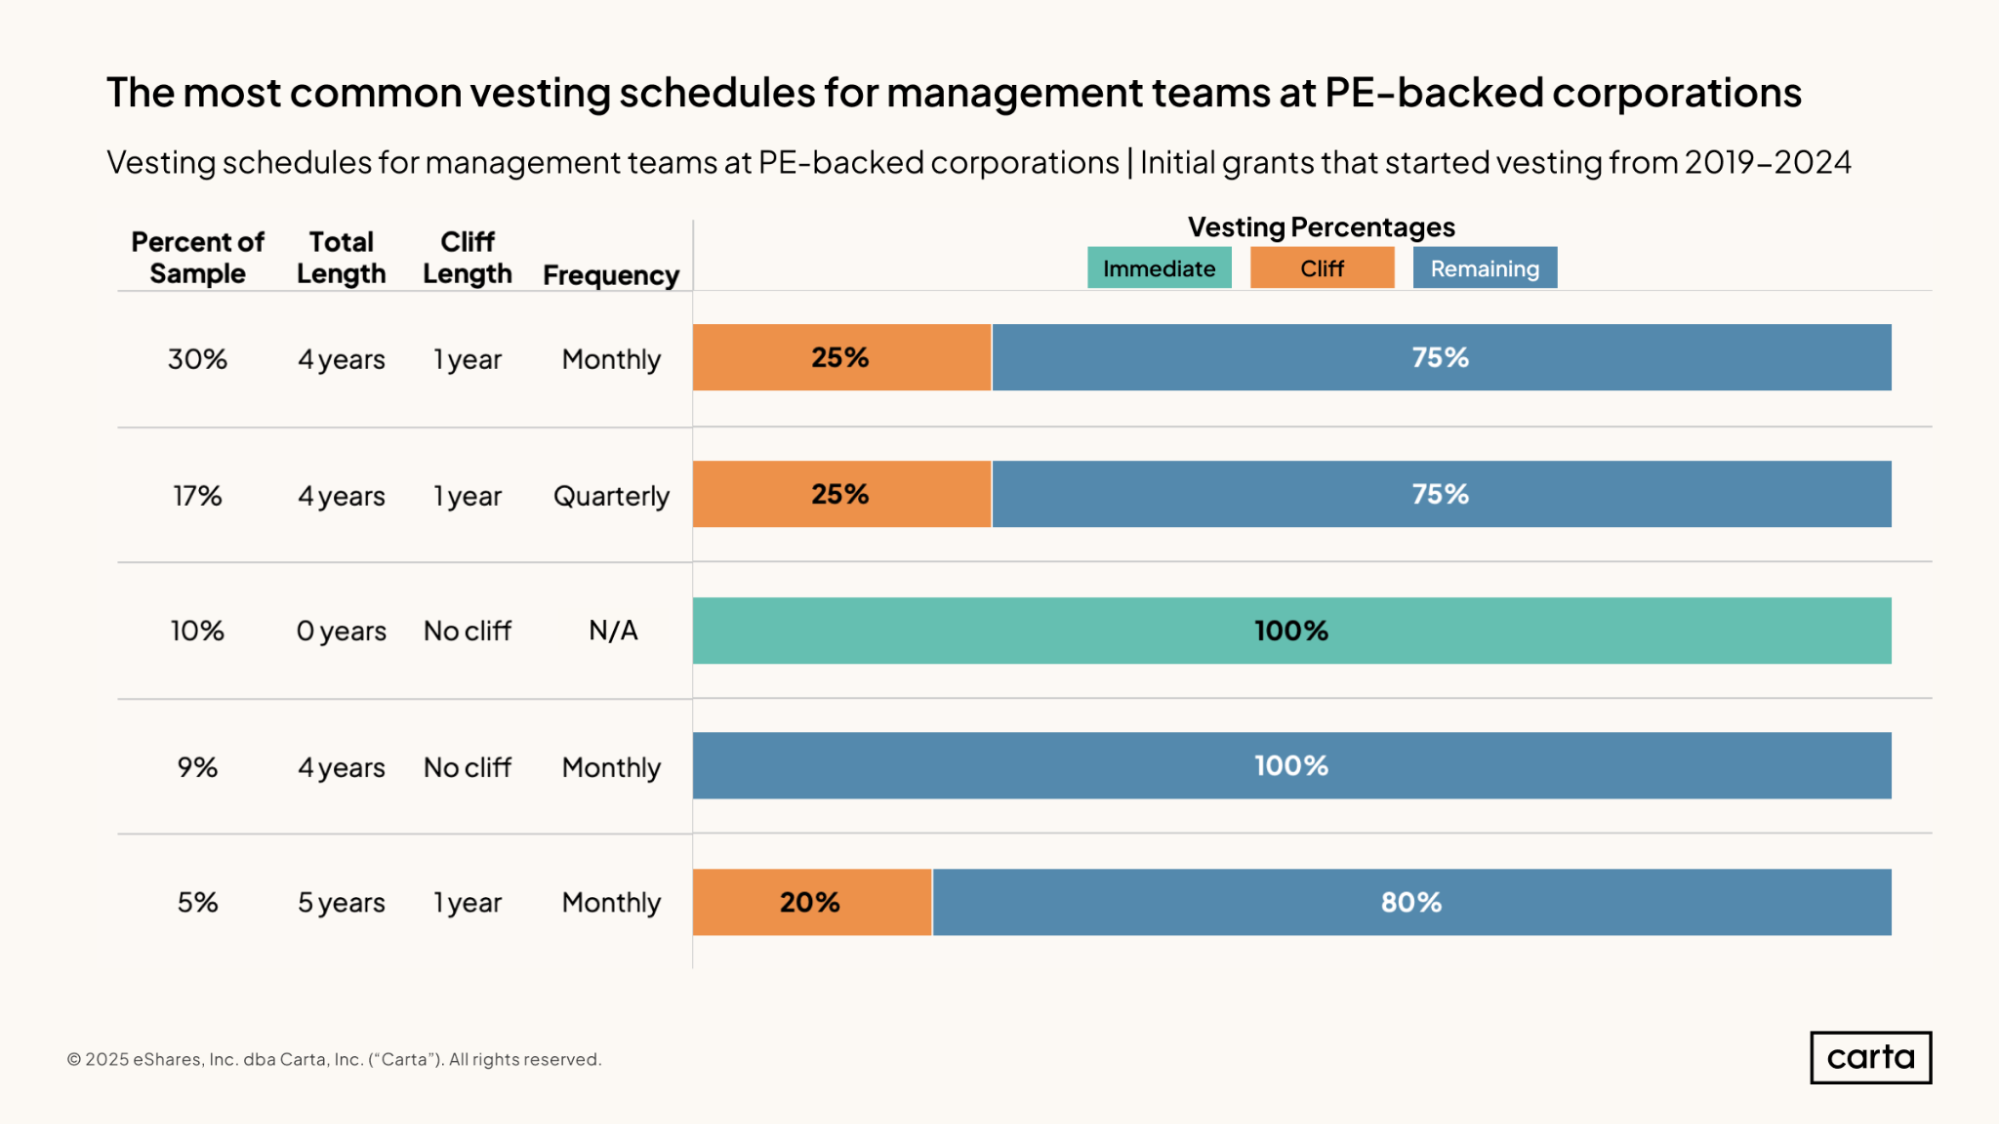
Vesting schedules can vary by total length, the length of the initial cliff, and the frequency at which vesting occurs. The most common combination for management teams at PE-backed corporations is a four-year initial grant with a one-year cliff that vests on a monthly basis: This category comprises about 30% of all newly issued grants.
The next most common structure, at 17%, is a four-year grant with a one-year cliff that vests quarterly, followed by a grant that vests immediately. There are several other combinations of vesting schedules not shown here that are used in less than 5% of all initial grants at PE-backed corporations.
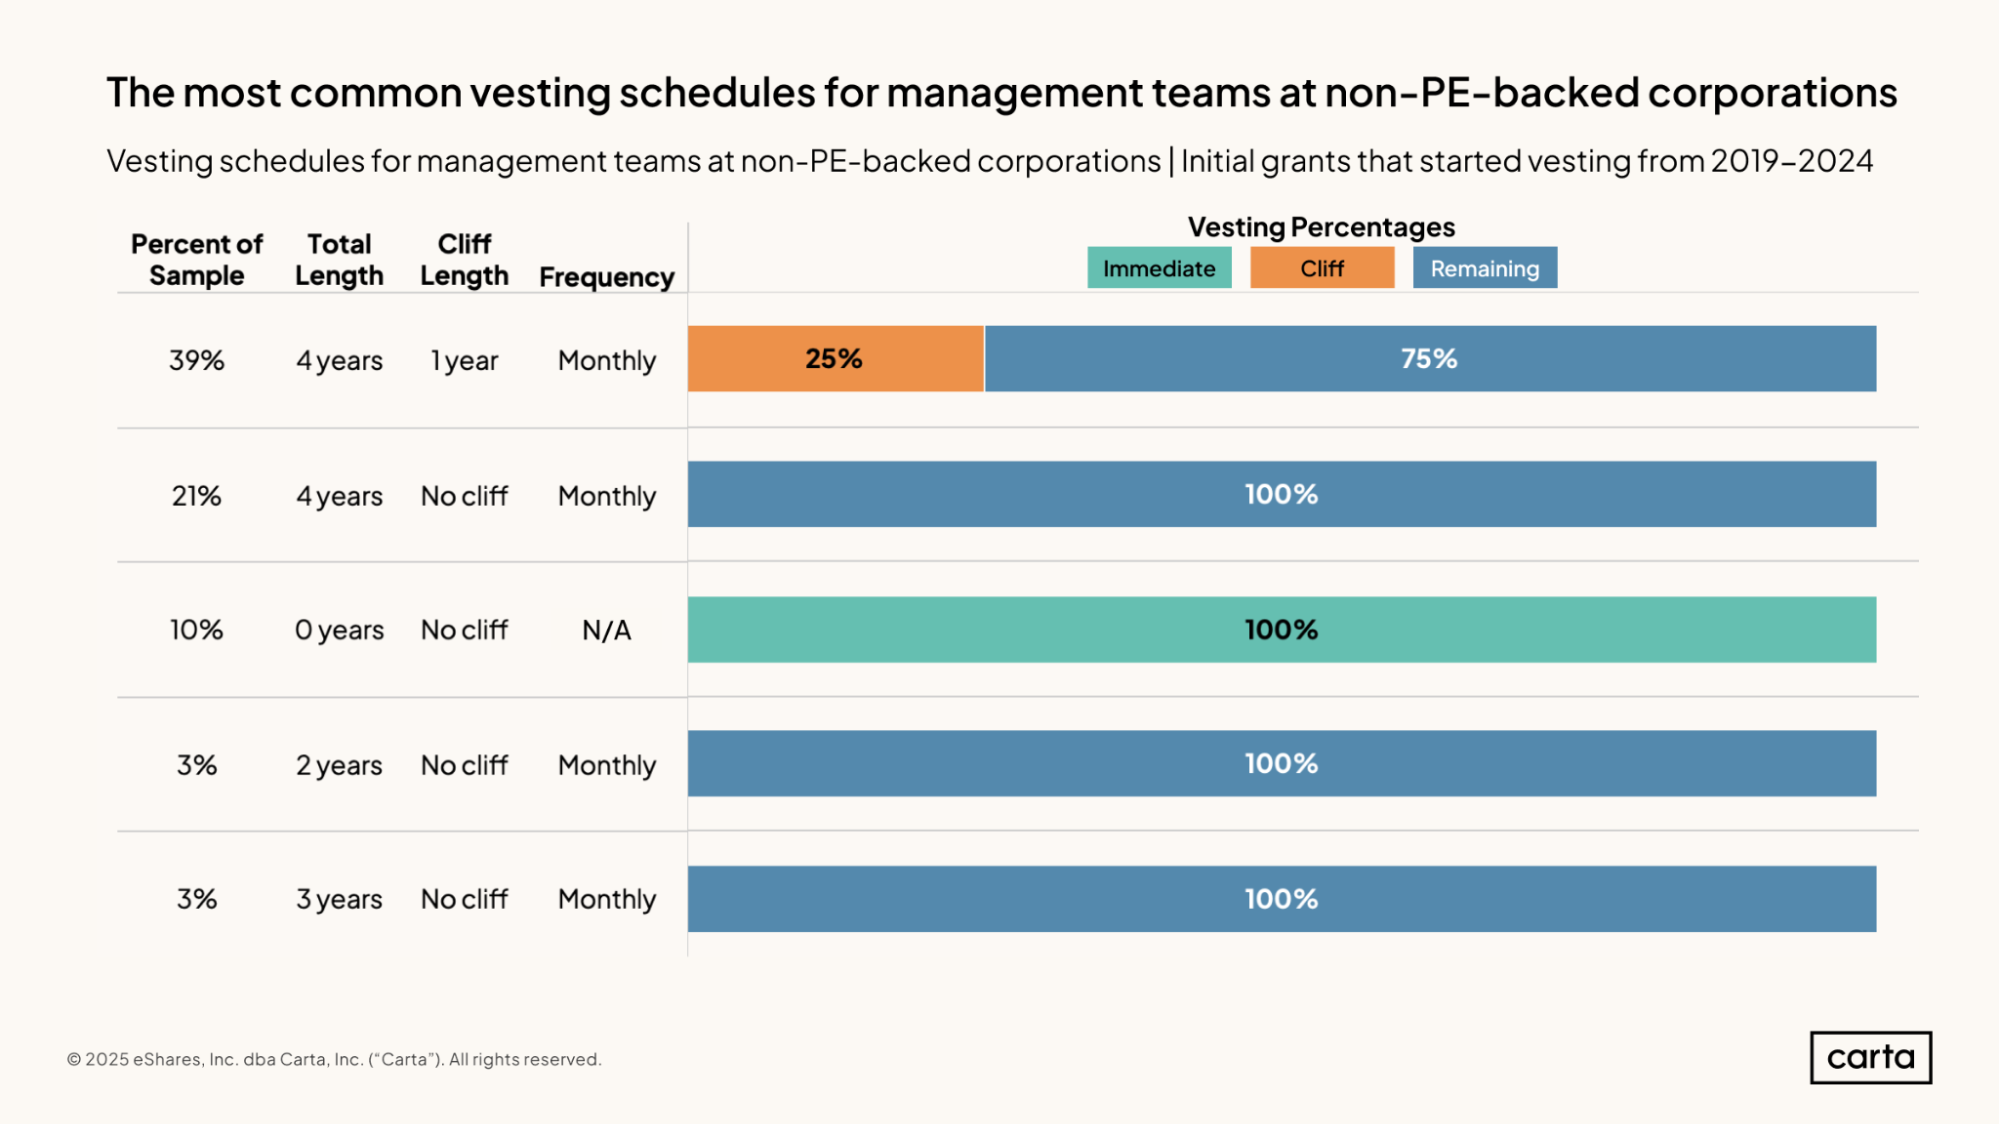
As is the case at PE-backed corporations, the most common vesting schedule at corporations outside the PE universe is a four-year grant with a one-year cliff that vests on a monthly basis.
At corporations that are not backed by PE, employee equity plans with quarterly vesting plans are far less common. Instead, all five of the most common vesting schedules involve either monthly vesting or no vesting at all (i.e., the entire grant vests immediately).
PE-backed LLCs
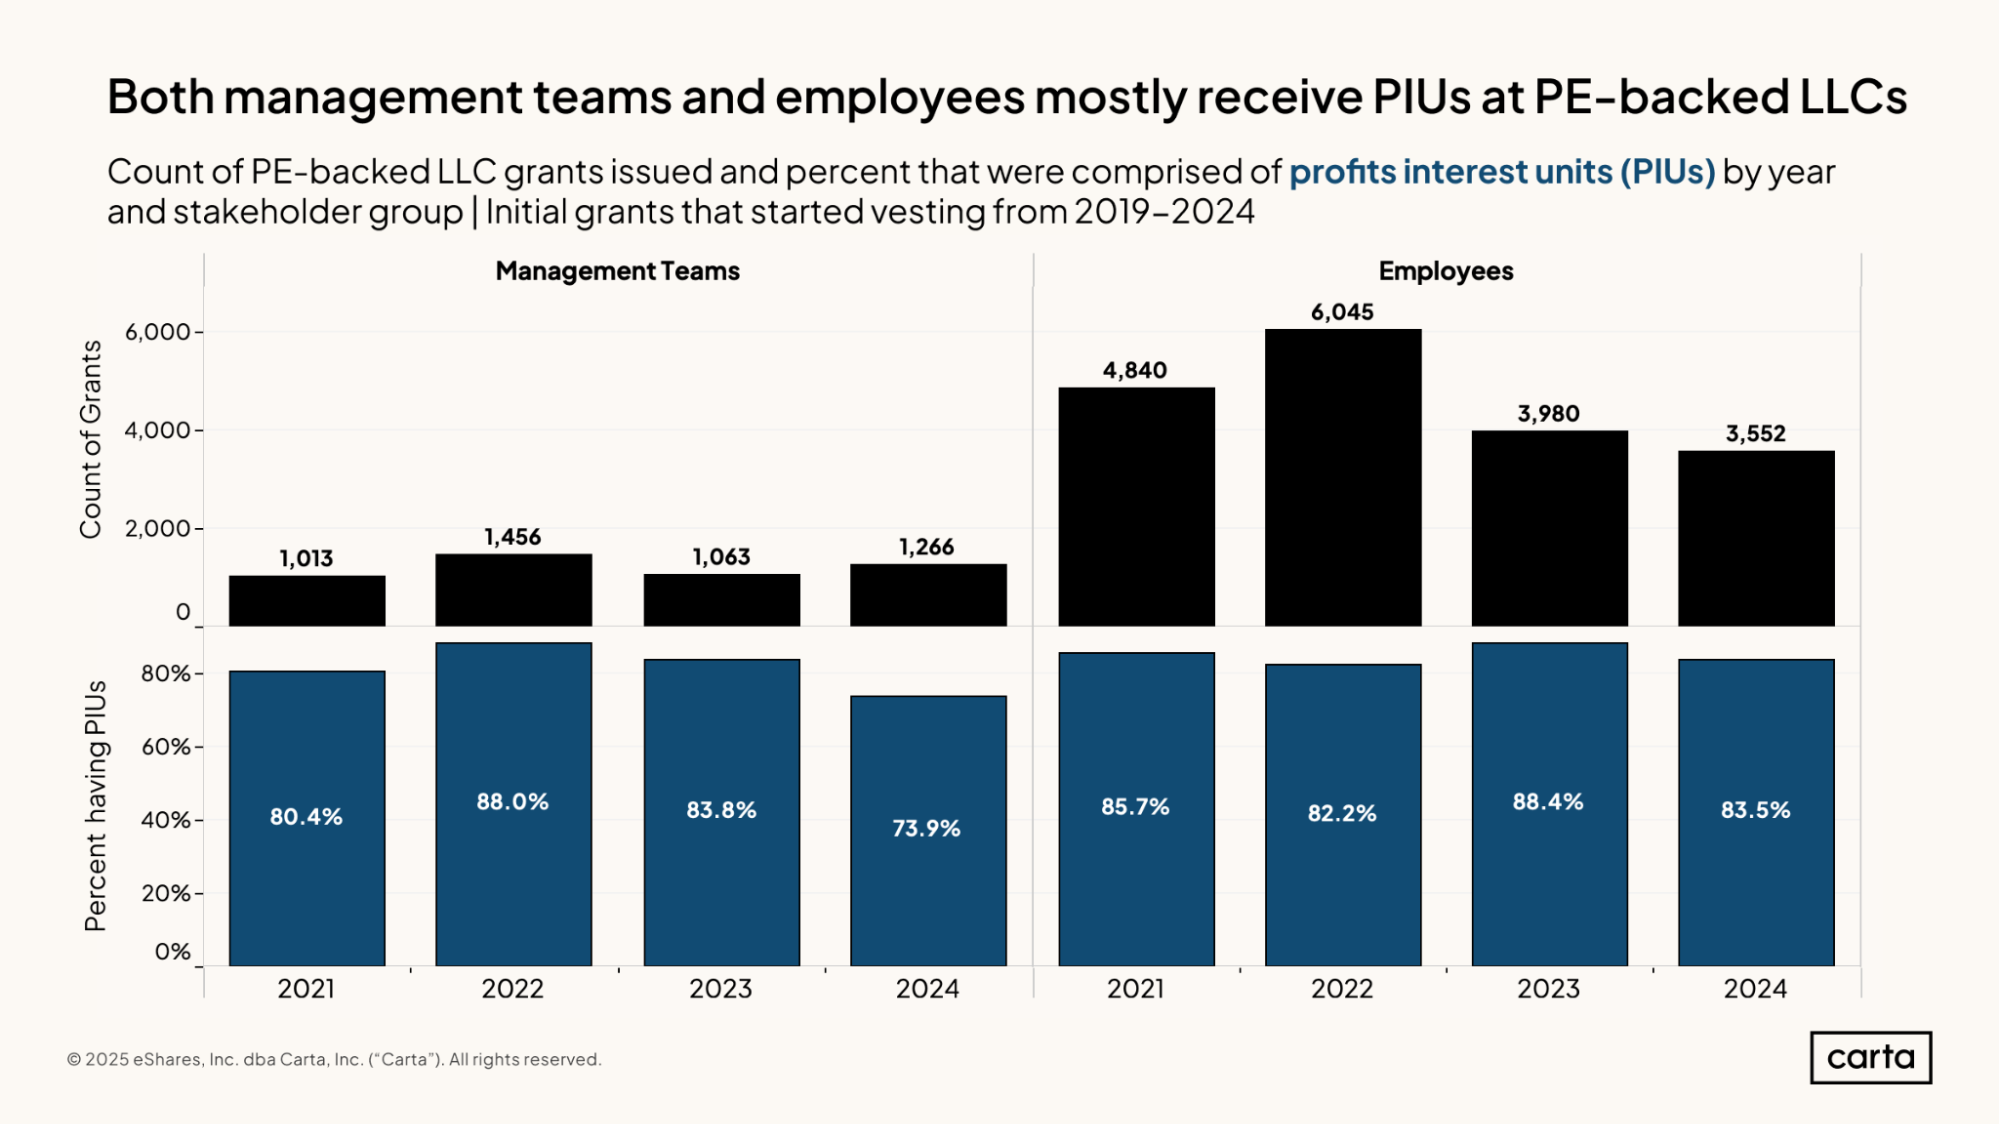
Across both management teams and rank-and-file employees, a clear majority of LLC grants issued by PE-backed LLCs take the form of profit interest units (PIUs). Last year, however, the frequency of PIUs declined for both executives and other employees. Among management teams, for instance, 73.9% of newly issued grants in 2024 were PIUs, down from 83.8% in 2023.
Some of the most common other types of grants issued to employees at PE-backed LLCs include capital interest units (CIUs), options, warrants, and custom interests. CIUs are typically more likely to be issued to outside investors than to employees.
The number of initial LLC grants issued to management teams on Carta rose by 19% in 2024 compared to 2023. Conversely, the number of initial grants issued to employees fell by 11%, the second straight year of declines.
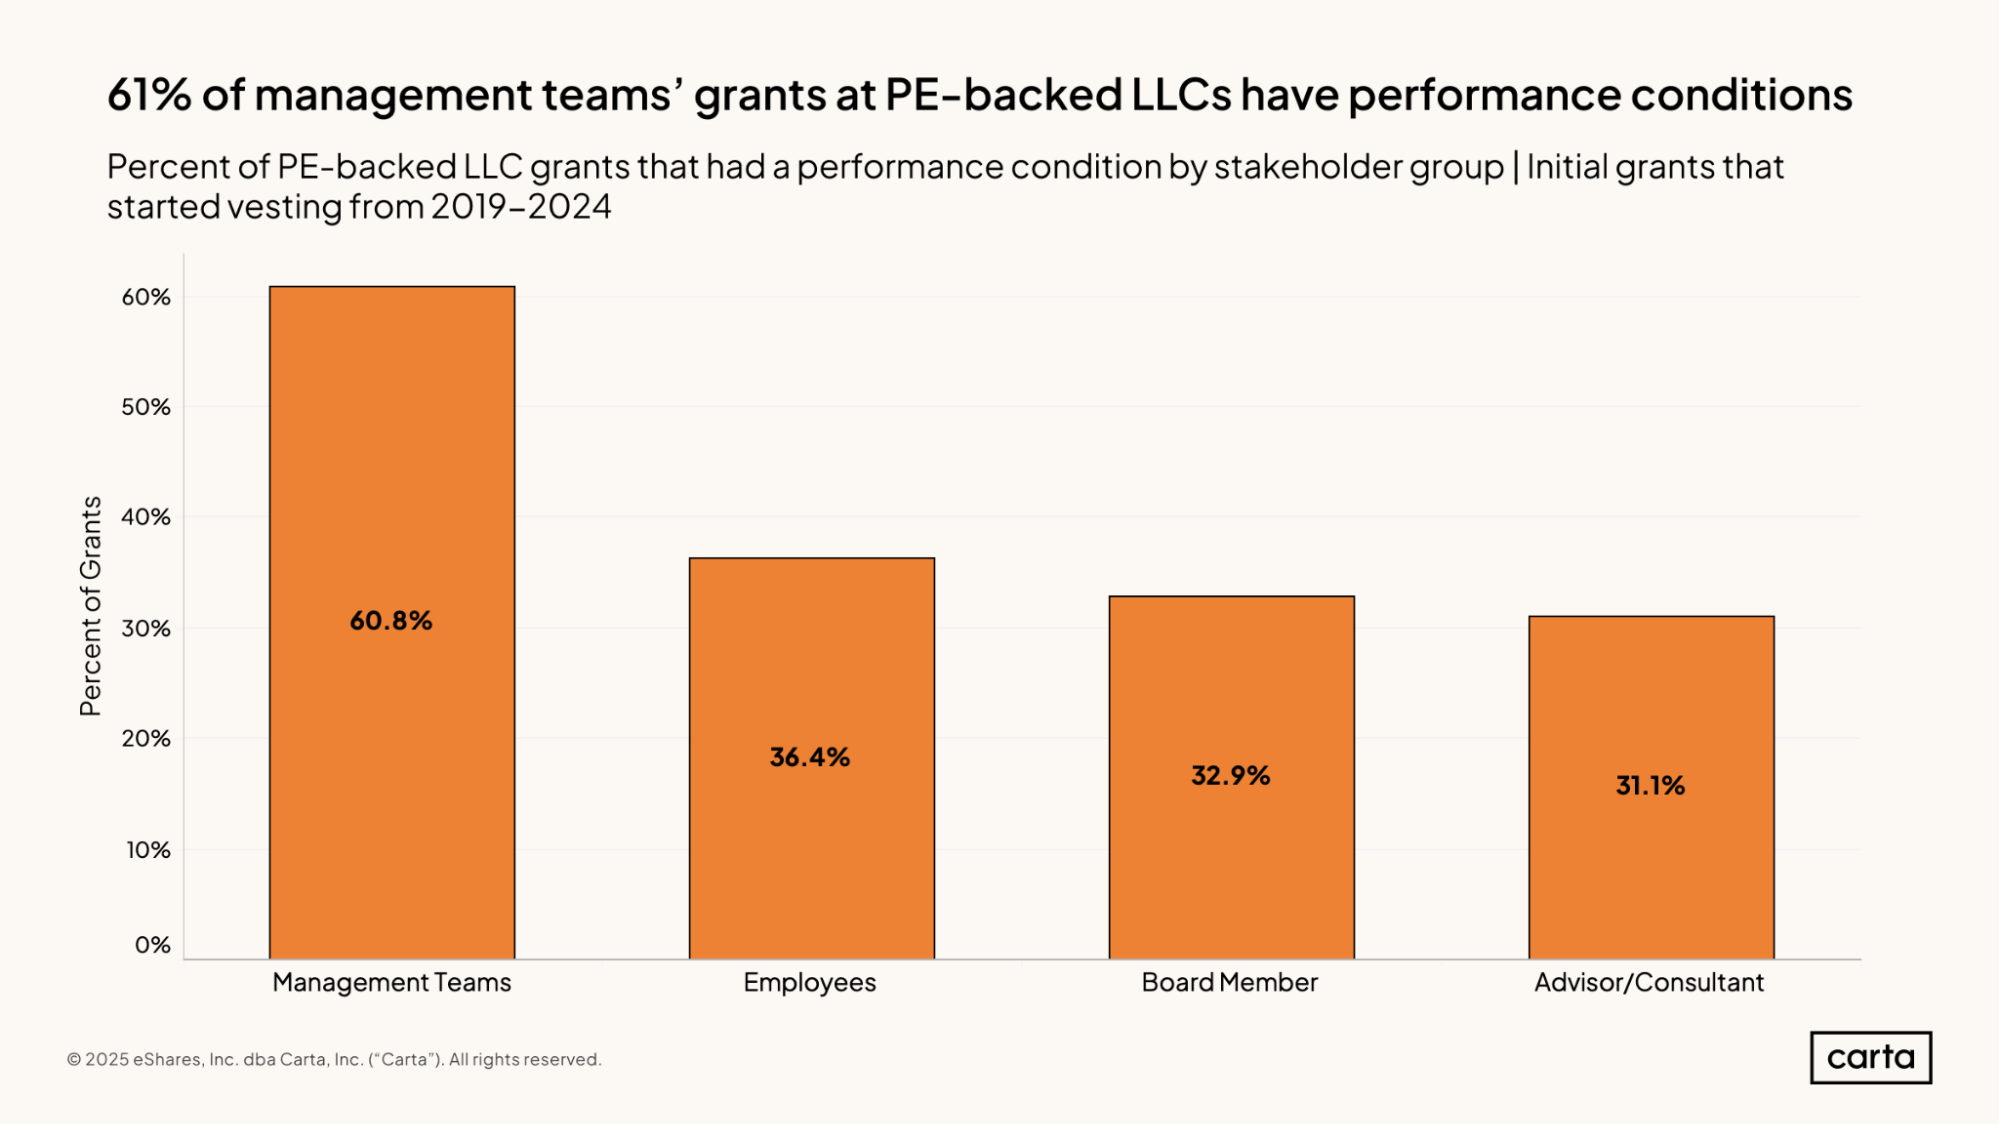
At PE-backed LLCs, nearly 61% of all initial grants issued to members of management teams are conditional on some sort of performance metric. It’s much less common for the equity grants issued to members of other stakeholder groups to come with performance conditions.
This alignment of incentives between ownership and management reflects the key role that executives play in driving performance. Compared to rank-and-file employees or board members, management teams typically play a larger role in determining financial outcomes.
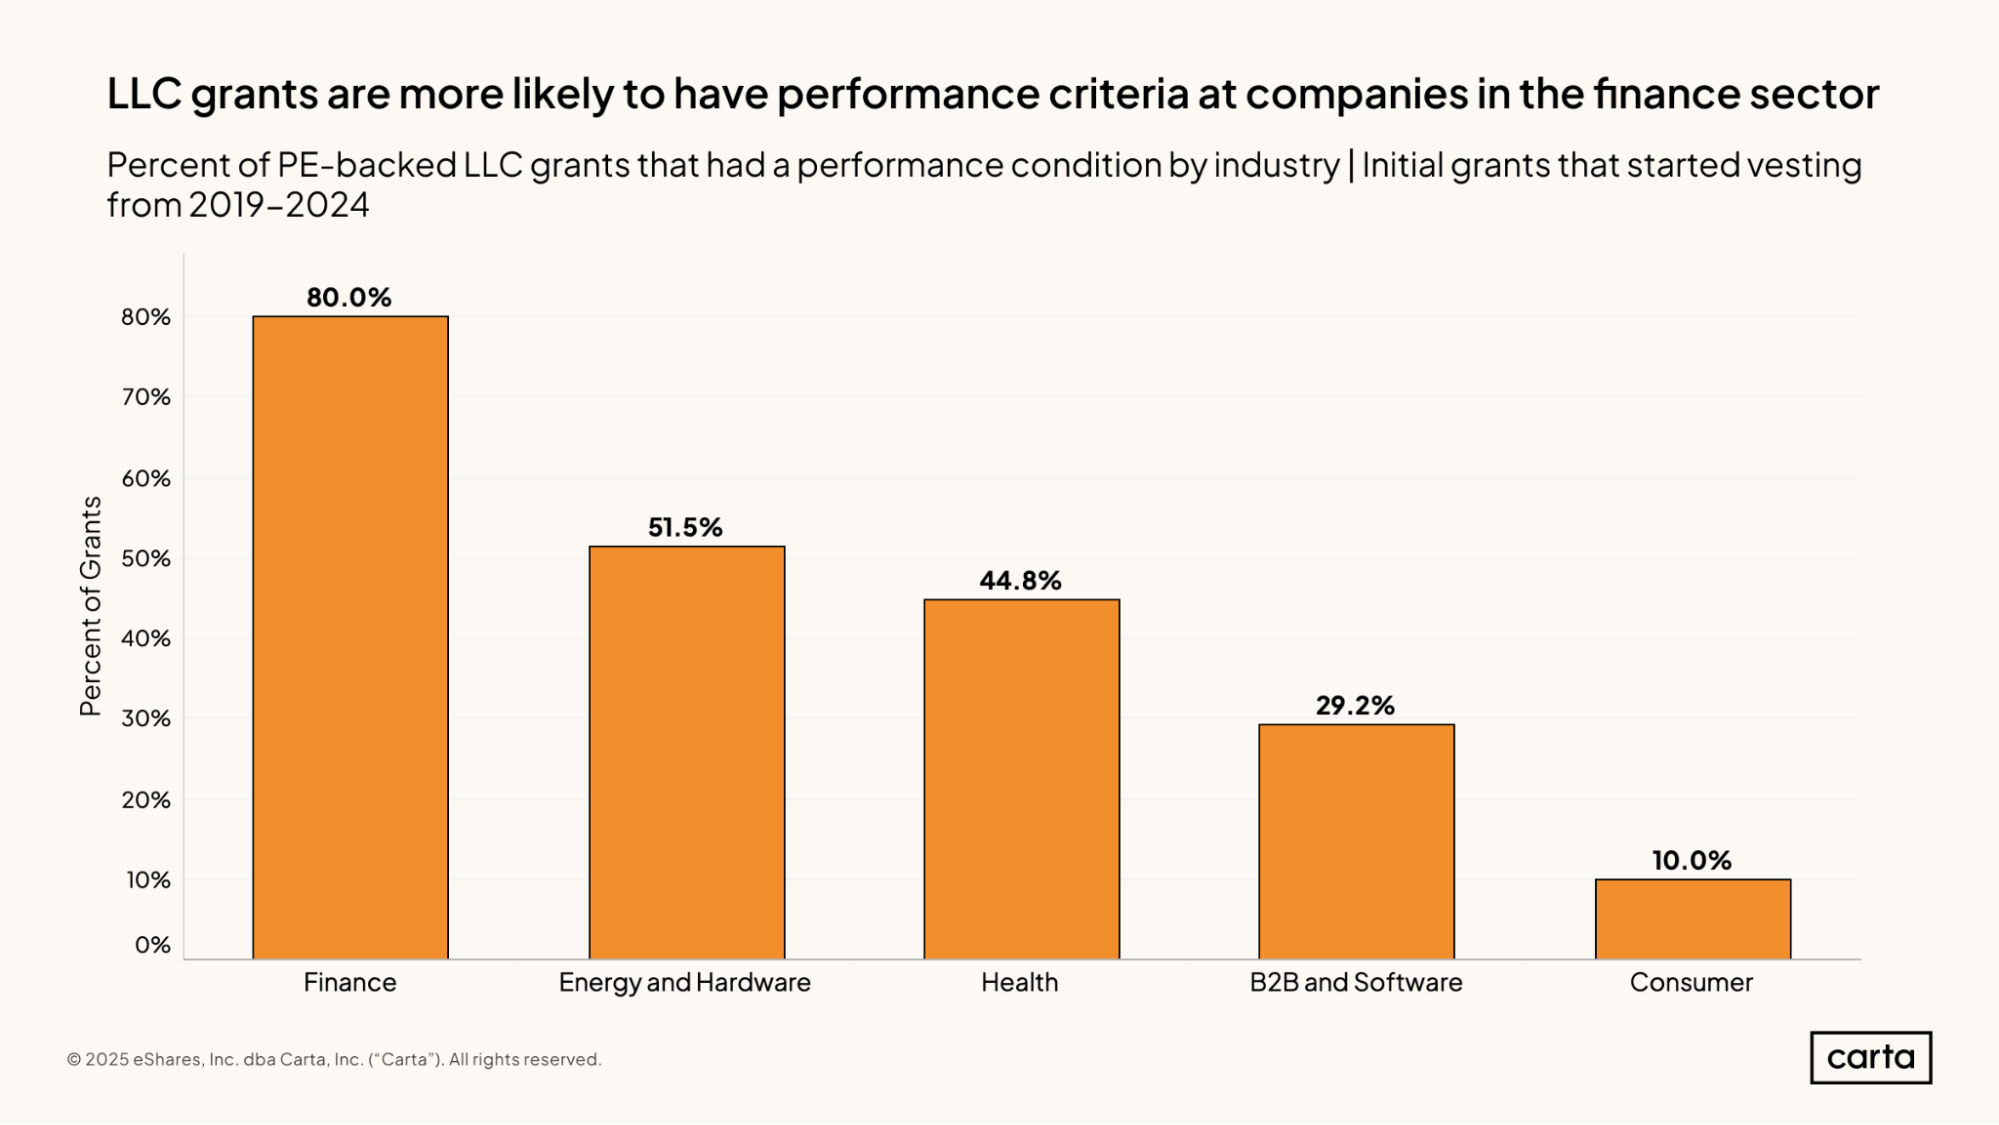
The prevalence of performance conditions at PE-backed LLCs varies widely depending on the industry. In finance, 80% of all initial grants issued by PE-backed LLCs from 2019 through 2024 had some type of performance condition. In consumer, just 10% of issued grants have performance conditions. These performance conditions are also relatively infrequent in B2B and software, at 29.2%.
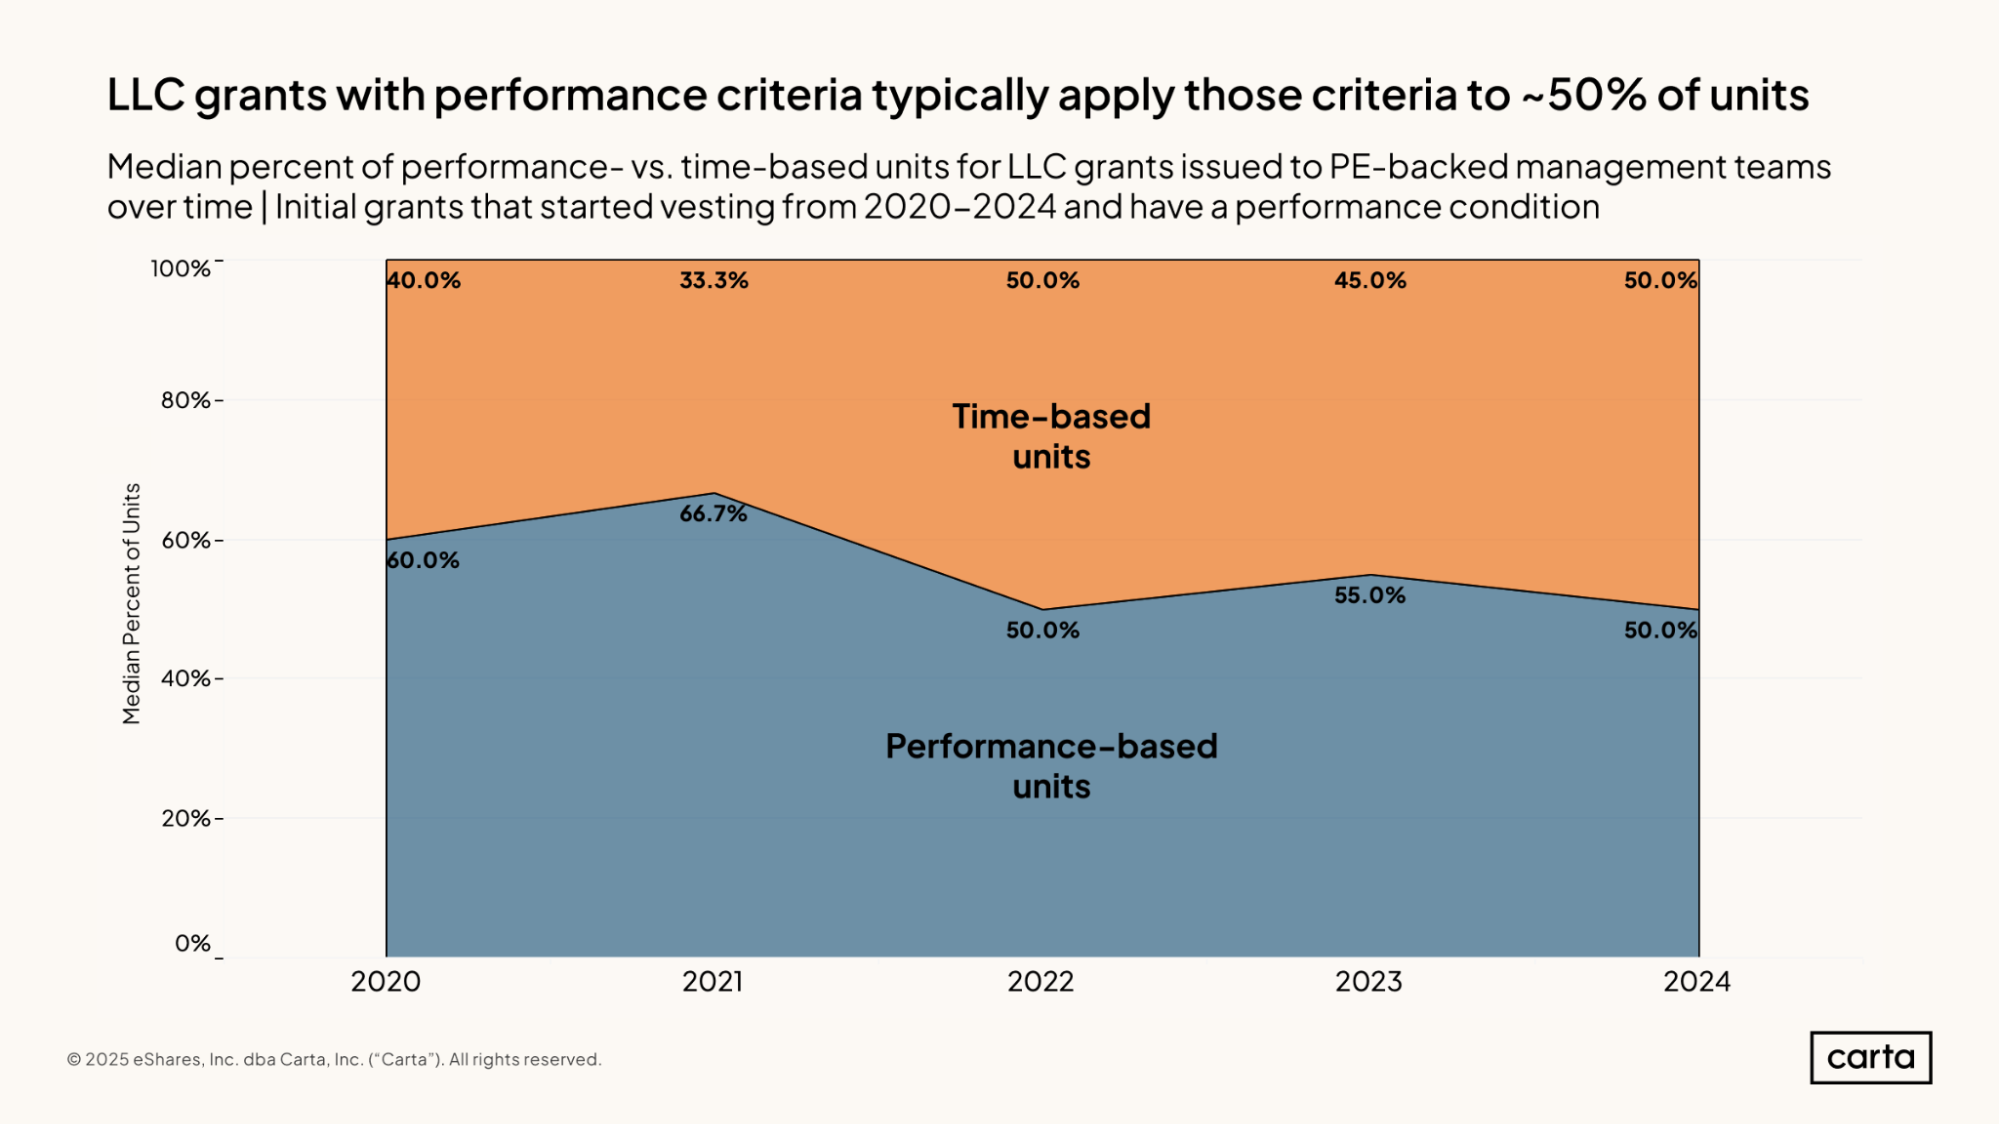
Grants at PE-backed LLCs that include performance criteria typically reserve those criteria for a portion of units, leaving some of the units as purely time-based. Among the population of grants that use performance criteria, the median grant in 2024 was 50% performance-based, while the other 50% of units were based on employee tenure.
Compared to 2020 and 2021, the median grant in 2024 is a little less reliant on performance-based units and a little more reliant on time-based units. This shift in the compensation market corresponds to a broader downturn in dealmaking and valuations across the breadth of the private markets. As investors have adjusted their expectations for financial performance, they’ve grown less likely to link performance to vesting.
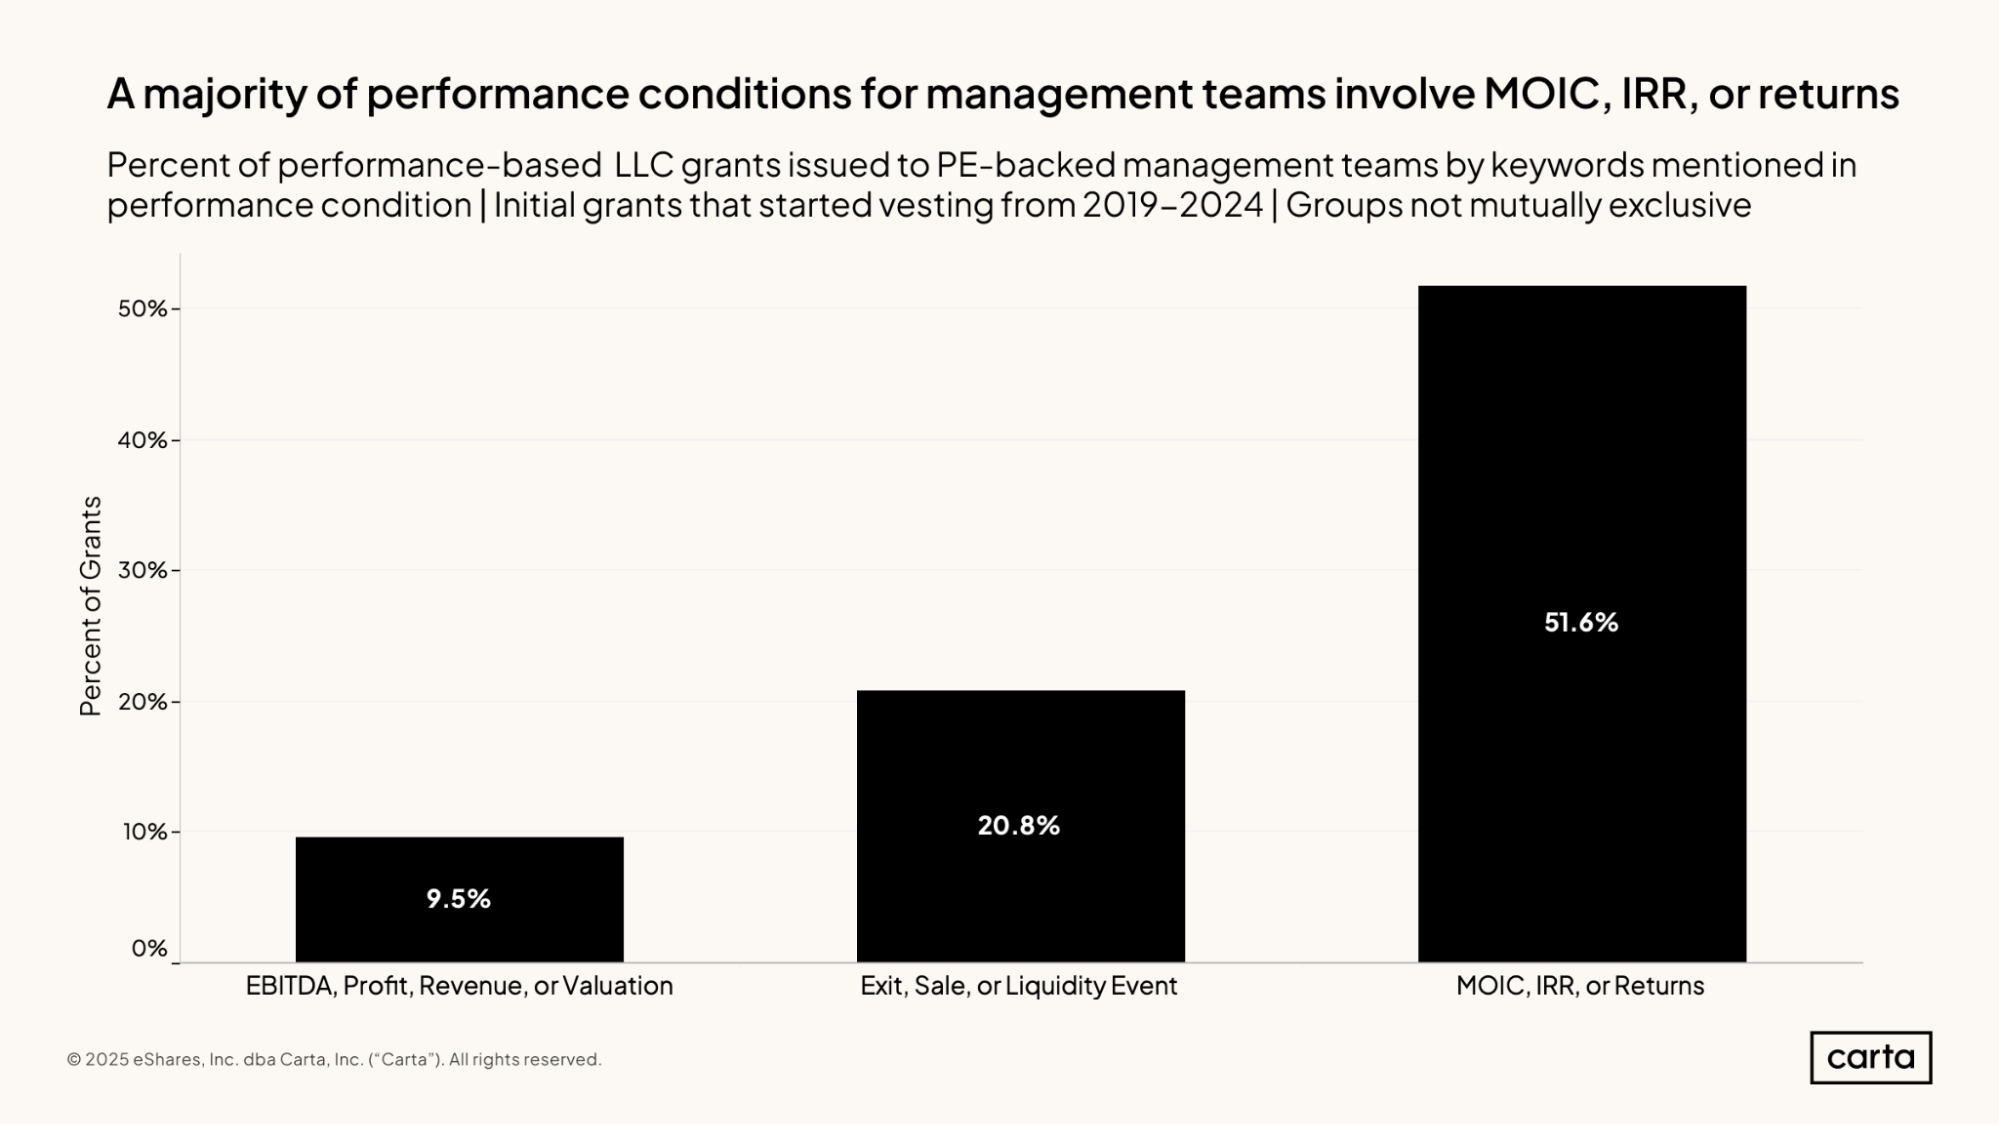
When equity grants issued to management teams at PE-backed LLCs have performance conditions, it’s most common for those conditions to be based on MOIC, IRR, or some other metric tracking the return on investment that the company ultimately generates for its PE owners. This is a way of closely linking the incentives of management and those owners, ensuring that both are focused on positioning the company for a successful exit in the relatively near future.
Over half of all performance conditions at PE-backed LLCs are tied to these return-based metrics. Meanwhile, 20.8% of performance conditions are tied to achieving a sale or other liquidity event, while 9.5% are tied to EBITDA, profit, revenue, or valuation. These latter metrics can track financial performance in the shorter term, while MOIC, IRR, and returns are focused on the final financial outcome.
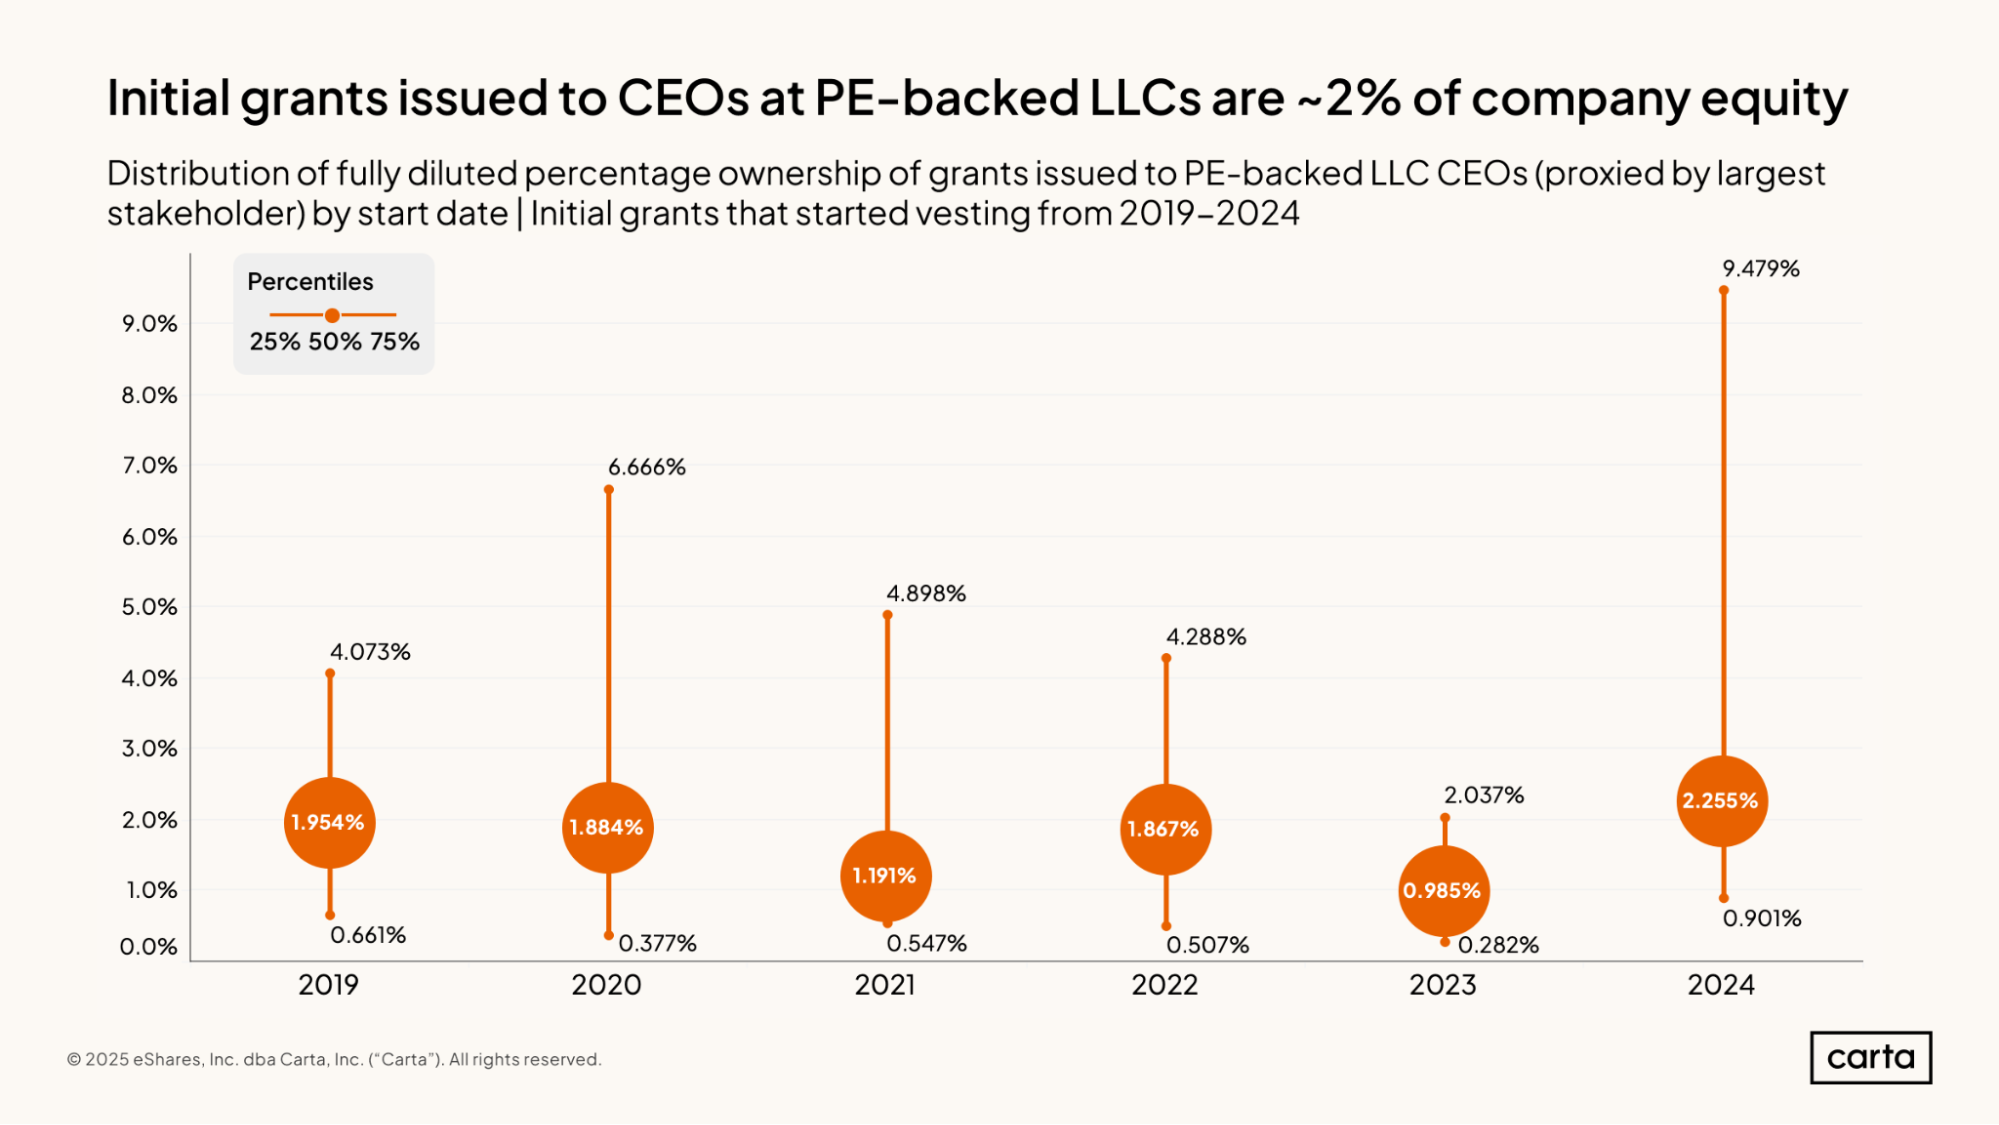
The median initial grant to CEOs at PE-backed LLCs in 2024 was about 2.25% of the LLC’s fully diluted units. That’s the highest median initial grant for CEOs in the past six years. At the 75th percentile, initial grants to CEOs last year comprised almost 9.5% of the LLC’s equity, which is also higher than any other 75th percentile figure dating back to at least 2019.
In most recent years, the median initial grant to CEOs has hovered around 2% of total units. There has been some notable annual variance, however: In both 2021 and 2023, the median was closer to 1%.
In general, larger equity grants are a sign of a more talent-friendly market. When competition for CEO talent grows more intense, companies might be inclined to offer larger grants to help attract their top choices.
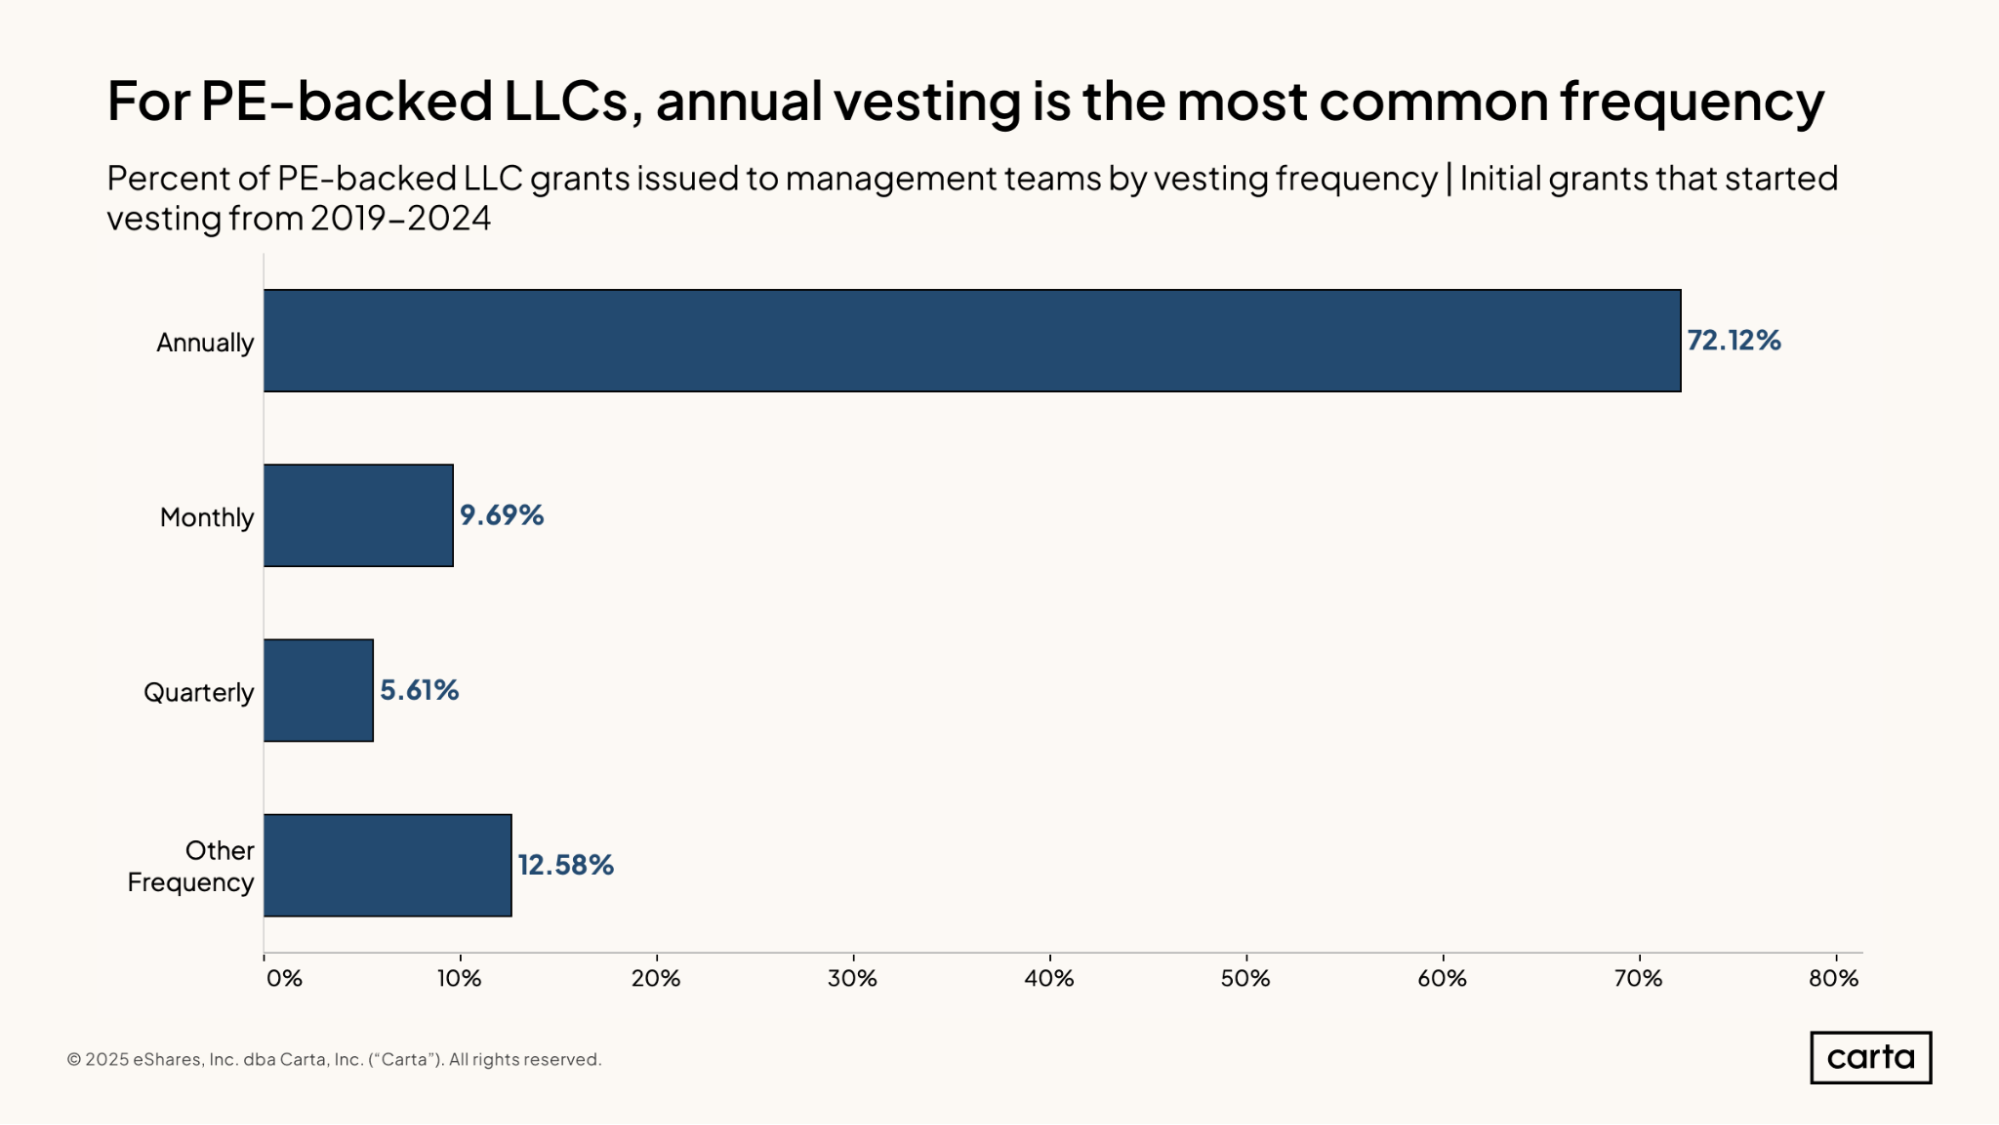
At PE-backed LLCs, a large majority of initial grants issued to management teams vest on an annual basis, and less than 10% vest on a monthly basis. This stands in stark contrast to vesting trends among PE-backed corporations, as we saw earlier: Just 14% of equity grants issued to management teams at PE-backed corporations vest annually, while 65% have monthly vesting schedules.
Monthly vesting schedules can create a steadier pace of compensation and more financial flexibility for equity or interest holders while tying vesting more closely to an employee’s true length of tenure. For employers, however, monthly vesting schedules typically create more complexity than annual vesting. More frequent vesting means administrators and other workers must spend more time managing and updating cap tables and other financial systems.
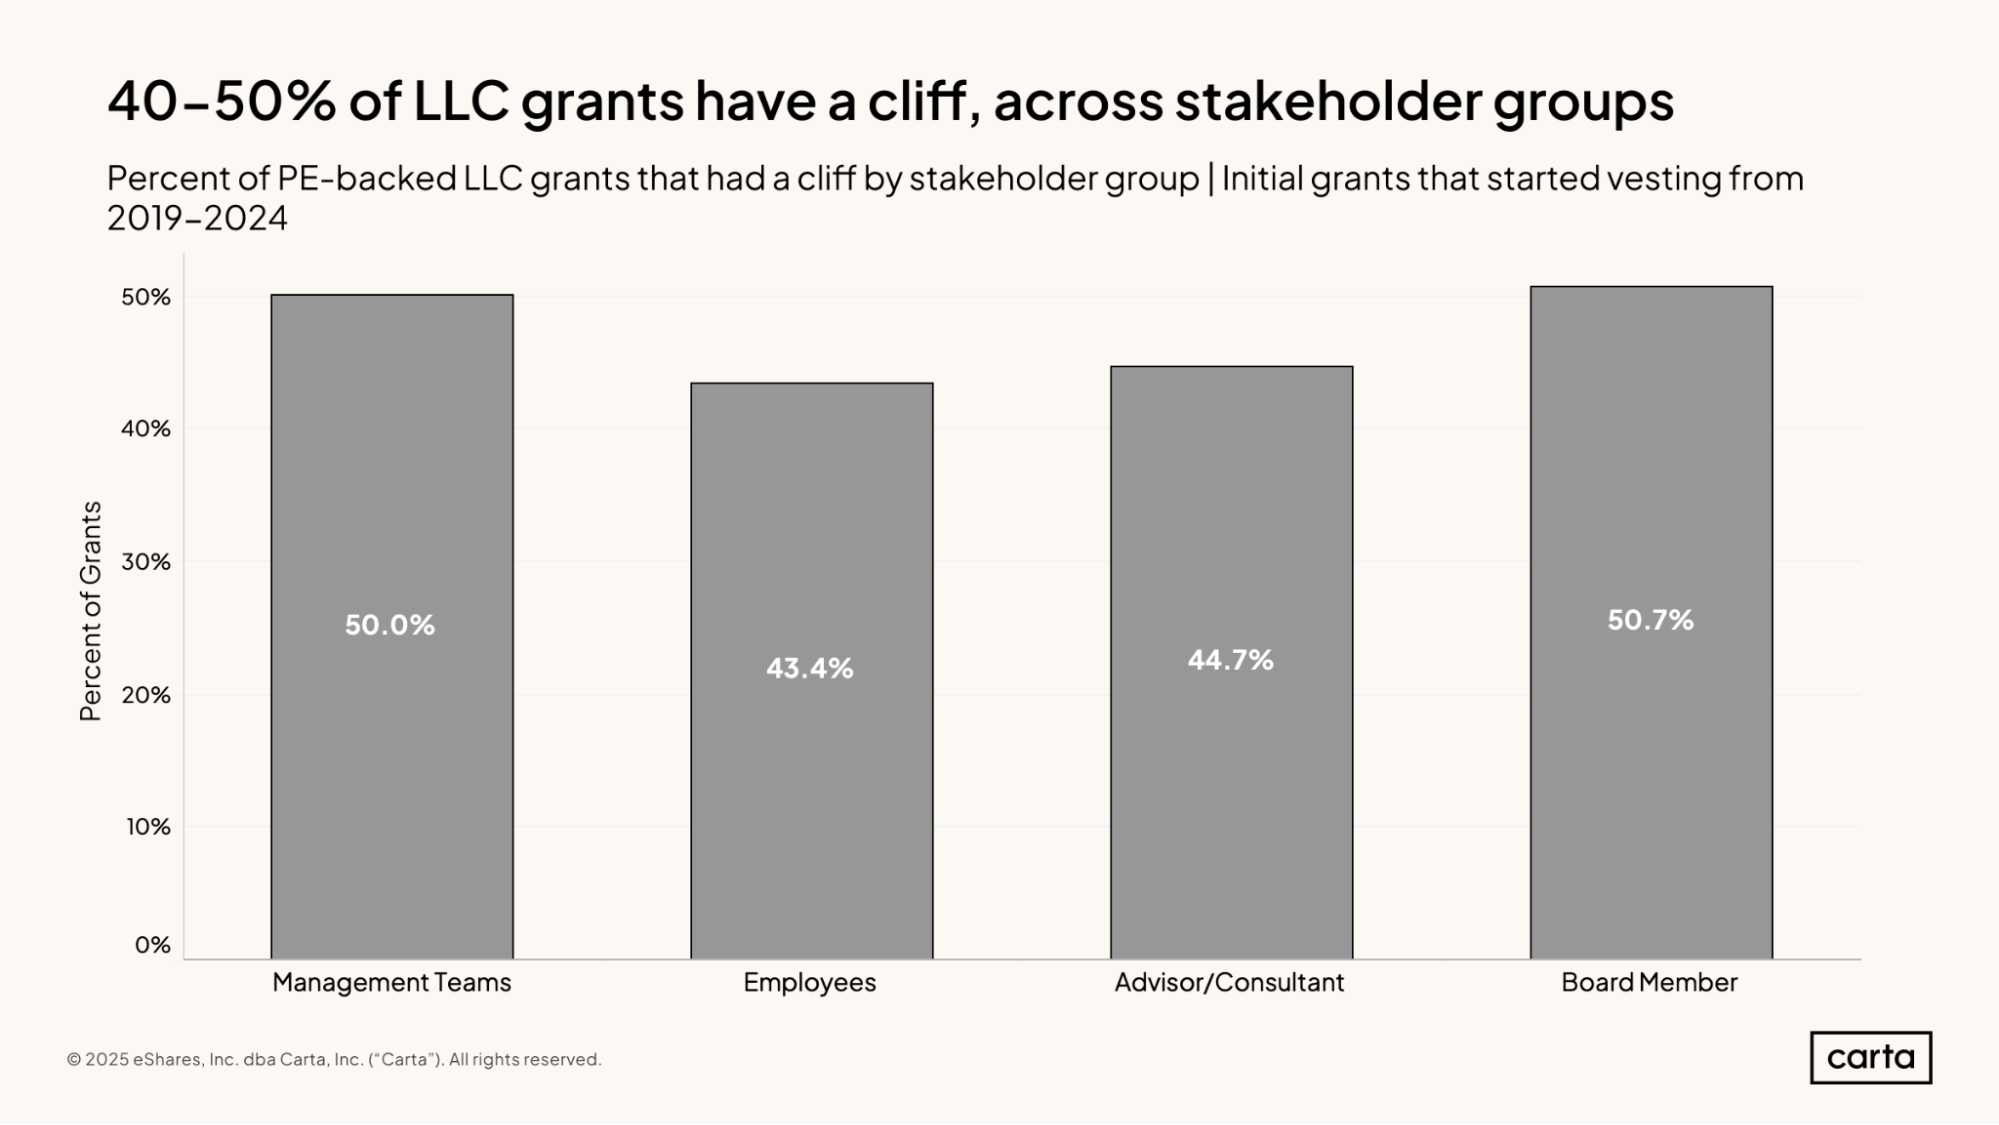
Across all stakeholder groups, somewhere between 43% and 51% of all initial LLC grants have some sort of cliff before those grants begin to vest. Cliffs are a little more common for management teams and board members than they are for employees and advisors/consultants.
Vesting cliffs are less common at PE-backed LLCs than they are at PE-backed corporations. Among PE-backed corporations, 72.9% of initial equity grants issued to employees have some sort of cliff, plus 60.2% of initial grants issued to management teams.
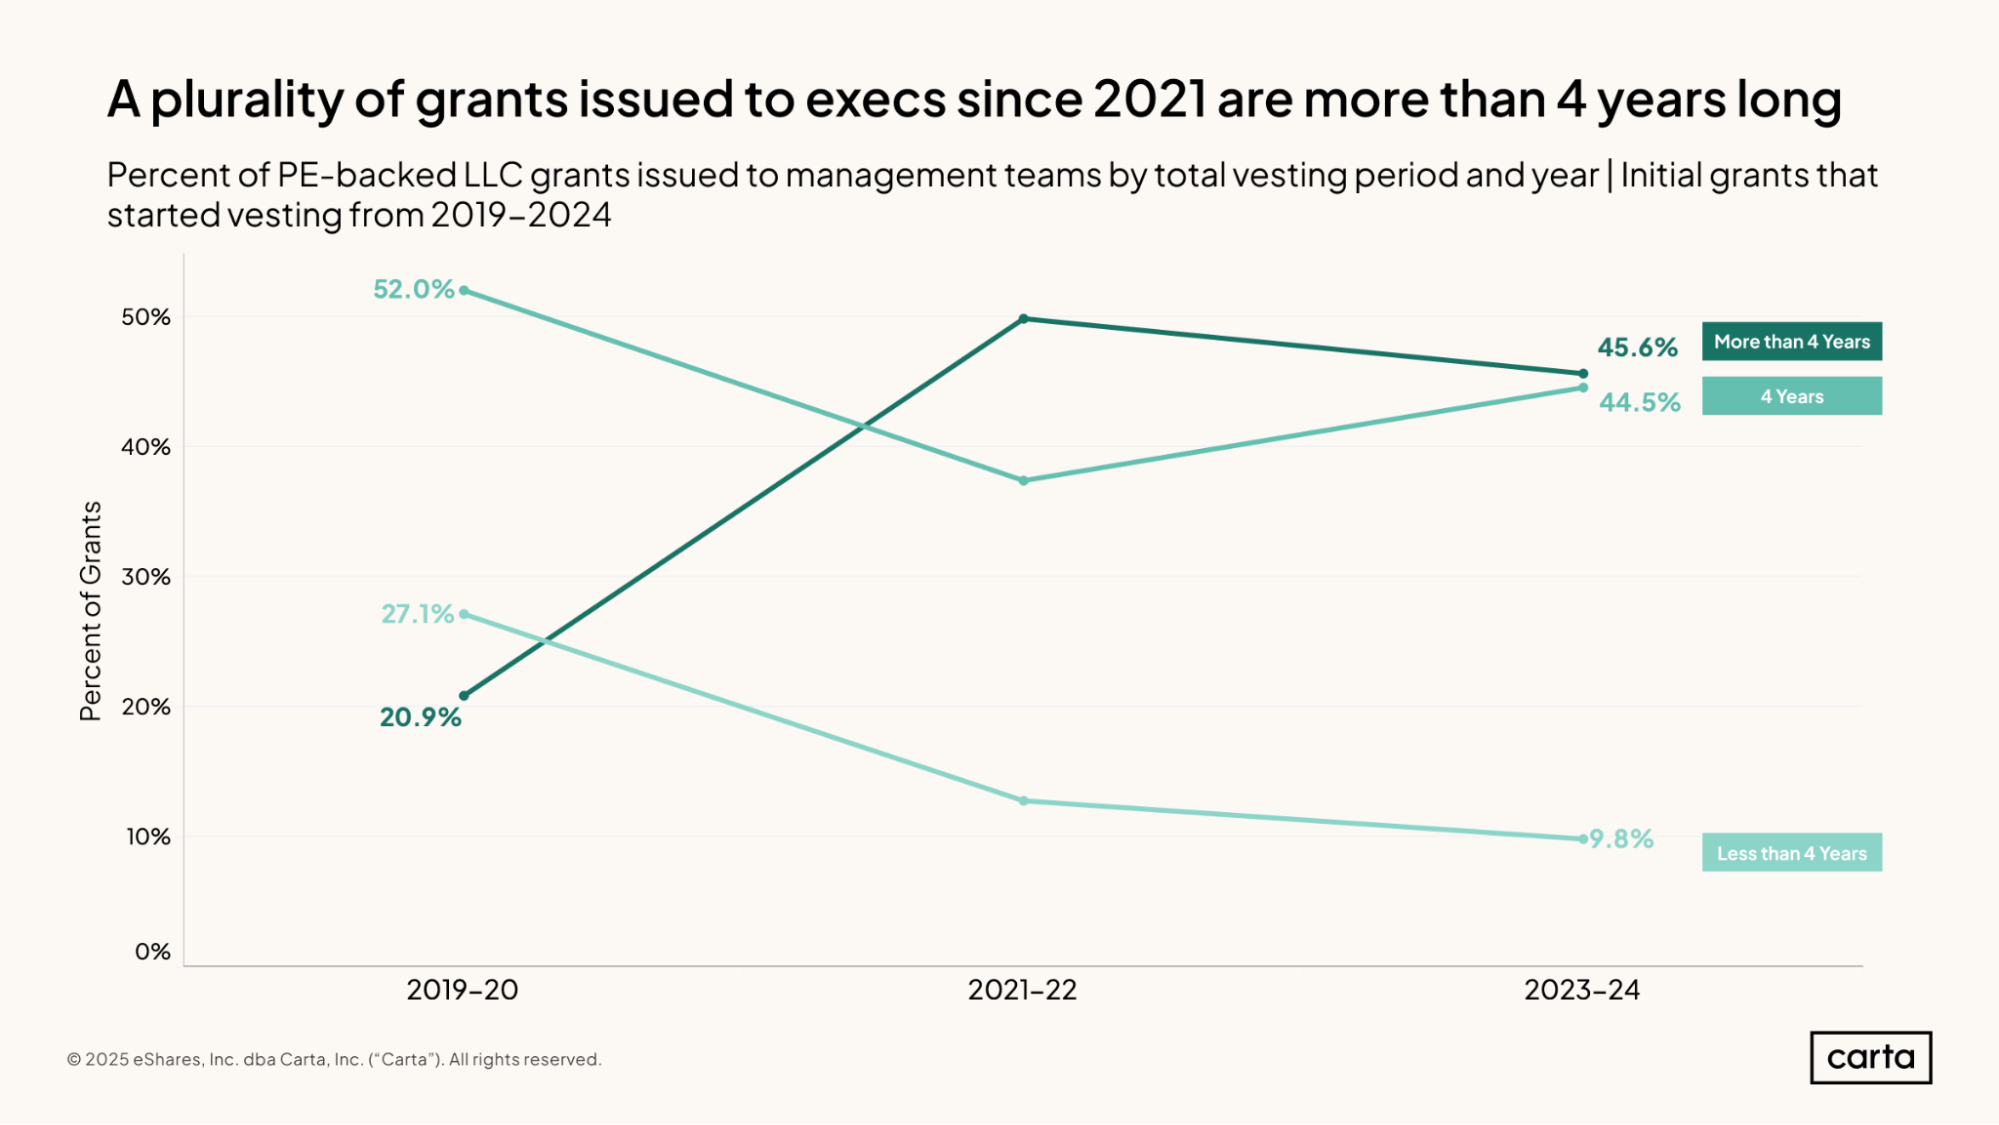
Across 2023 and 2024, 44.5% of new LLC grants issued to management teams at PE-backed LLCs had a four-year vesting period, and another 45.6% had a vesting period longer than four years. Less than 10% of equity grants issued over that span had a vesting period shorter than four years.
This represents a notable shift from the distribution of vesting schedules on LLC grants issued back in 2019 and 2020. In that period, vesting schedules of longer than four years were the least common option. By 2023 and 2024, they had become the most common option.
This upward trend in the length of vesting schedules at PE-backed LLCs has coincided with an increase in the typical holding period for private equity portfolio companies. As investors prepare to hold on to their investments for longer stretches of time, they may want to incentive their management teams over longer durations, too.
Methodology
General
Carta helps nearly 3,000 PE-backed companies manage their equity. We share insights from this unmatched dataset about the private equity industry to help executives, employees, and investors make informed decisions and understand market conditions. This study uses an aggregated and anonymized sample of Carta customer data. Companies that have contractually requested that we not use their data in anonymized and aggregated studies are not included in this analysis.
The data presented in this private equity report represents a snapshot as of March 2025. Historical data may change in future studies because there is typically an administrative lag between the time a transaction took place and when it is recorded in Carta. In addition, new companies signing up for Carta’s services will increase historical data available for the report.
Definition of PE-backed companies
PE-backed companies encompass both corporations and LLCs. Corporations and LLCs are considered “PE-backed” if they are financed by a private equity firm, including both growth equity and buyout strategies.
Stakeholder groups
Equity grants were categorized according to the stakeholder who owns them. “Management teams” or “executives” include leadership roles such as vice presidents, presidents, C-suite officers, and founders. “Employees” include other non-leadership staff. Non-staff stakeholders include “advisors/consultants” and “board members.”
DISCLOSURE: This communication is on behalf of eShares, Inc. dba Carta, Inc. ("Carta"). This communication is for informational purposes only, and contains general information only. Carta is not, by means of this communication, rendering accounting, business, financial, investment, legal, tax, or other professional advice or services. This publication is not a substitute for such professional advice or services nor should it be used as a basis for any decision or action that may affect your business or interests. Before making any decision or taking any action that may affect your business or interests, you should consult a qualified professional advisor. This communication is not intended as a recommendation, offer or solicitation for the purchase or sale of any security. Carta does not assume any liability for reliance on the information provided herein. ©2025 Carta. All rights reserved. Reproduction prohibited.


DISCLOSURE: This communication is on behalf of eShares, Inc. dba Carta, Inc. ("Carta"). This communication is for informational purposes only, and contains general information only. Carta is not, by means of this communication, rendering accounting, business, financial, investment, legal, tax, or other professional advice or services. This publication is not a substitute for such professional advice or services nor should it be used as a basis for any decision or action that may affect your business or interests. Before making any decision or taking any action that may affect your business or interests, you should consult a qualified professional advisor. This communication is not intended as a recommendation, offer or solicitation for the purchase or sale of any security. Carta does not assume any liability for reliance on the information provided herein. © 2026 Carta. All rights reserved. Reproduction prohibited.