Executive summary
By several measures, the startup fundraising market looks friendlier to founders today than at any point in the past several years.
To begin with, startups are raising more capital. Collectively, companies on Carta pulled in more than $49 billion in Q3 2026. Over the past two quarters, they’ve raised north of $100 billion. That’s the strongest six-month stretch for fundraising since Q4 2021 through Q1 2022.
Startups are raising that capital at higher valuations. At every fundraising stage, median valuations are significantly higher in 2026 than in 2025. At most stages, median valuations are now higher than in 2021, at the height of the pandemic bull market.
While achieving these lofty valuations, founders are retaining more ownership than ever before. Median dilution in new funding rounds continues to plummet at every stage. And fundraising timelines are accelerating, with the typical time between priced rounds shrinking at most stages over the past year, in some cases by multiple months.
More capital. Higher valuations. Less dilution. Less time between rounds. For founders, it’s an appealing combination.
But there’s a key caveat. As these shifts have taken place, the number of new VC rounds closing has declined. In Q3, total deal count across all stages was down 21% year over year.
When a startup does successfully raise capital, recent metrics are increasingly encouraging. Particularly in terms of valuations, the sky seems to be the limit.
But will a startup be able to raise capital at all? For many founders in the market today, that may be the most pertinent question.
Q3 highlights
Capital is pouring into the hardware sector: Through the end of Q3, hardware startups on Carta had raised nearly $34 billion in 2026, more than doubling the amount of cash raised during the first three quarters of 2025. Compared to other major sectors, hardware startups at both seed and Series A tend to raise larger rounds and attain higher valuations.
AI is eating up a larger share of late-stage funding: About 57% of all capital invested on Carta so far this year at Series B and beyond has gone to AI startups, the highest share of AI fundraising ever for these late-stage rounds. At seed and Series A, AI accounts for 44% of cash raised this year, down from 48% in 2025.
Silicon Valley is as central as ever: Startups based in the Bay Area are responsible for more than 40% of all cash raised on Carta so far this year, more than three times higher than New York, the next busiest startup hub. Aided by this Bay Area boom, California has claimed about 53% of all cash raised in 2026, and the West census region’s share is at 60%.
Fundraising overview
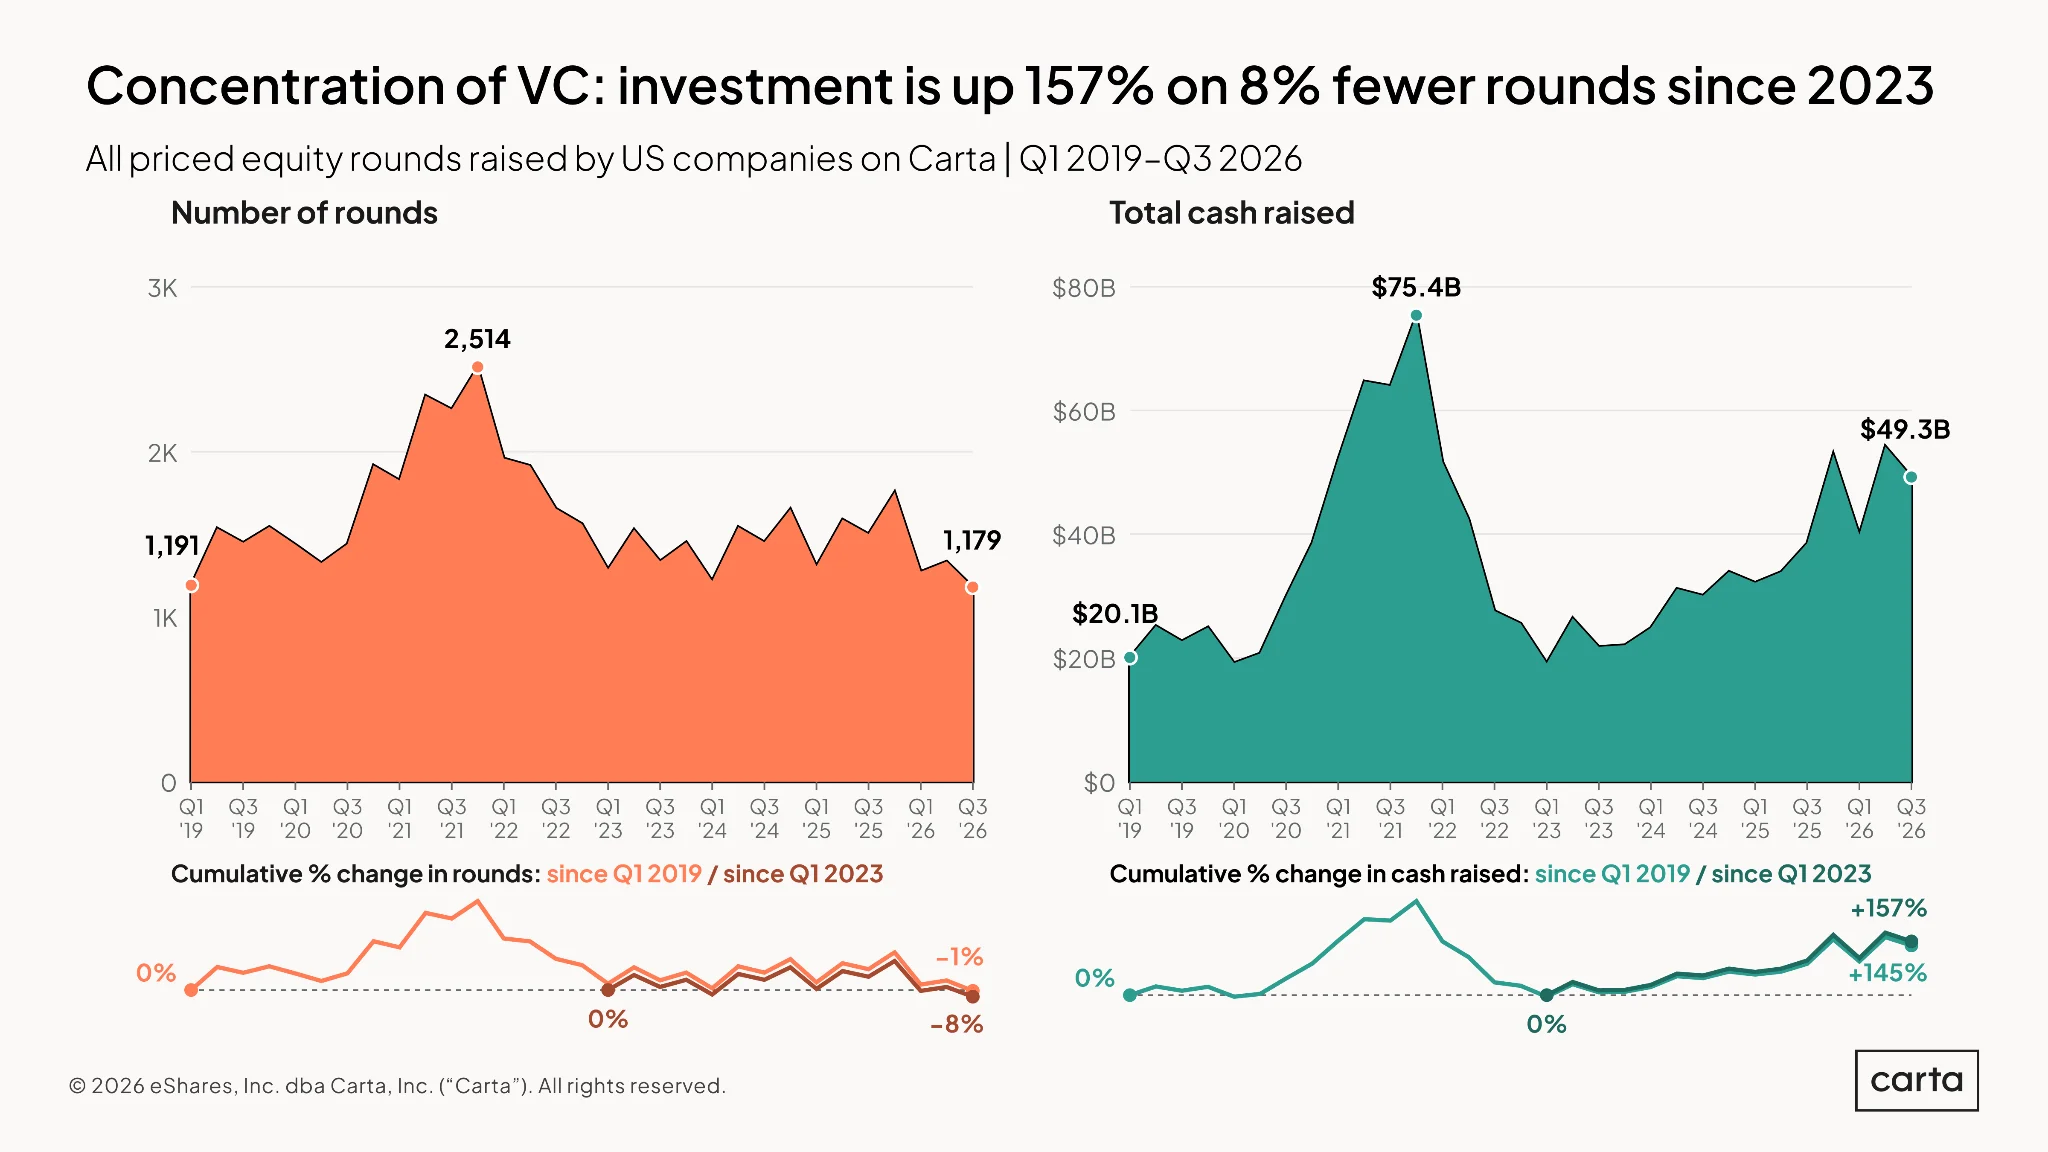
Companies on Carta combined to raise $49.3 billion in new venture funding across 1,179 rounds in Q3. Since the market’s recent low point in early 2023, quarterly fundraising totals have been steadily climbing, boosted by the massive sums being raised by the most highly regarded AI startups. Over the past two quarters alone, startups on Carta have added more than $100 billion to their collective coffers.
As investors have poured more and more capital into the venture ecosystem in 2026, the number of rounds being raised has slightly declined. For example, the amount of cash raised in Q3 2026 is 157% higher than the total from Q1 2023, while the quarterly round count is 8% lower. This means that, over that same span, the average VC round size has more than doubled.
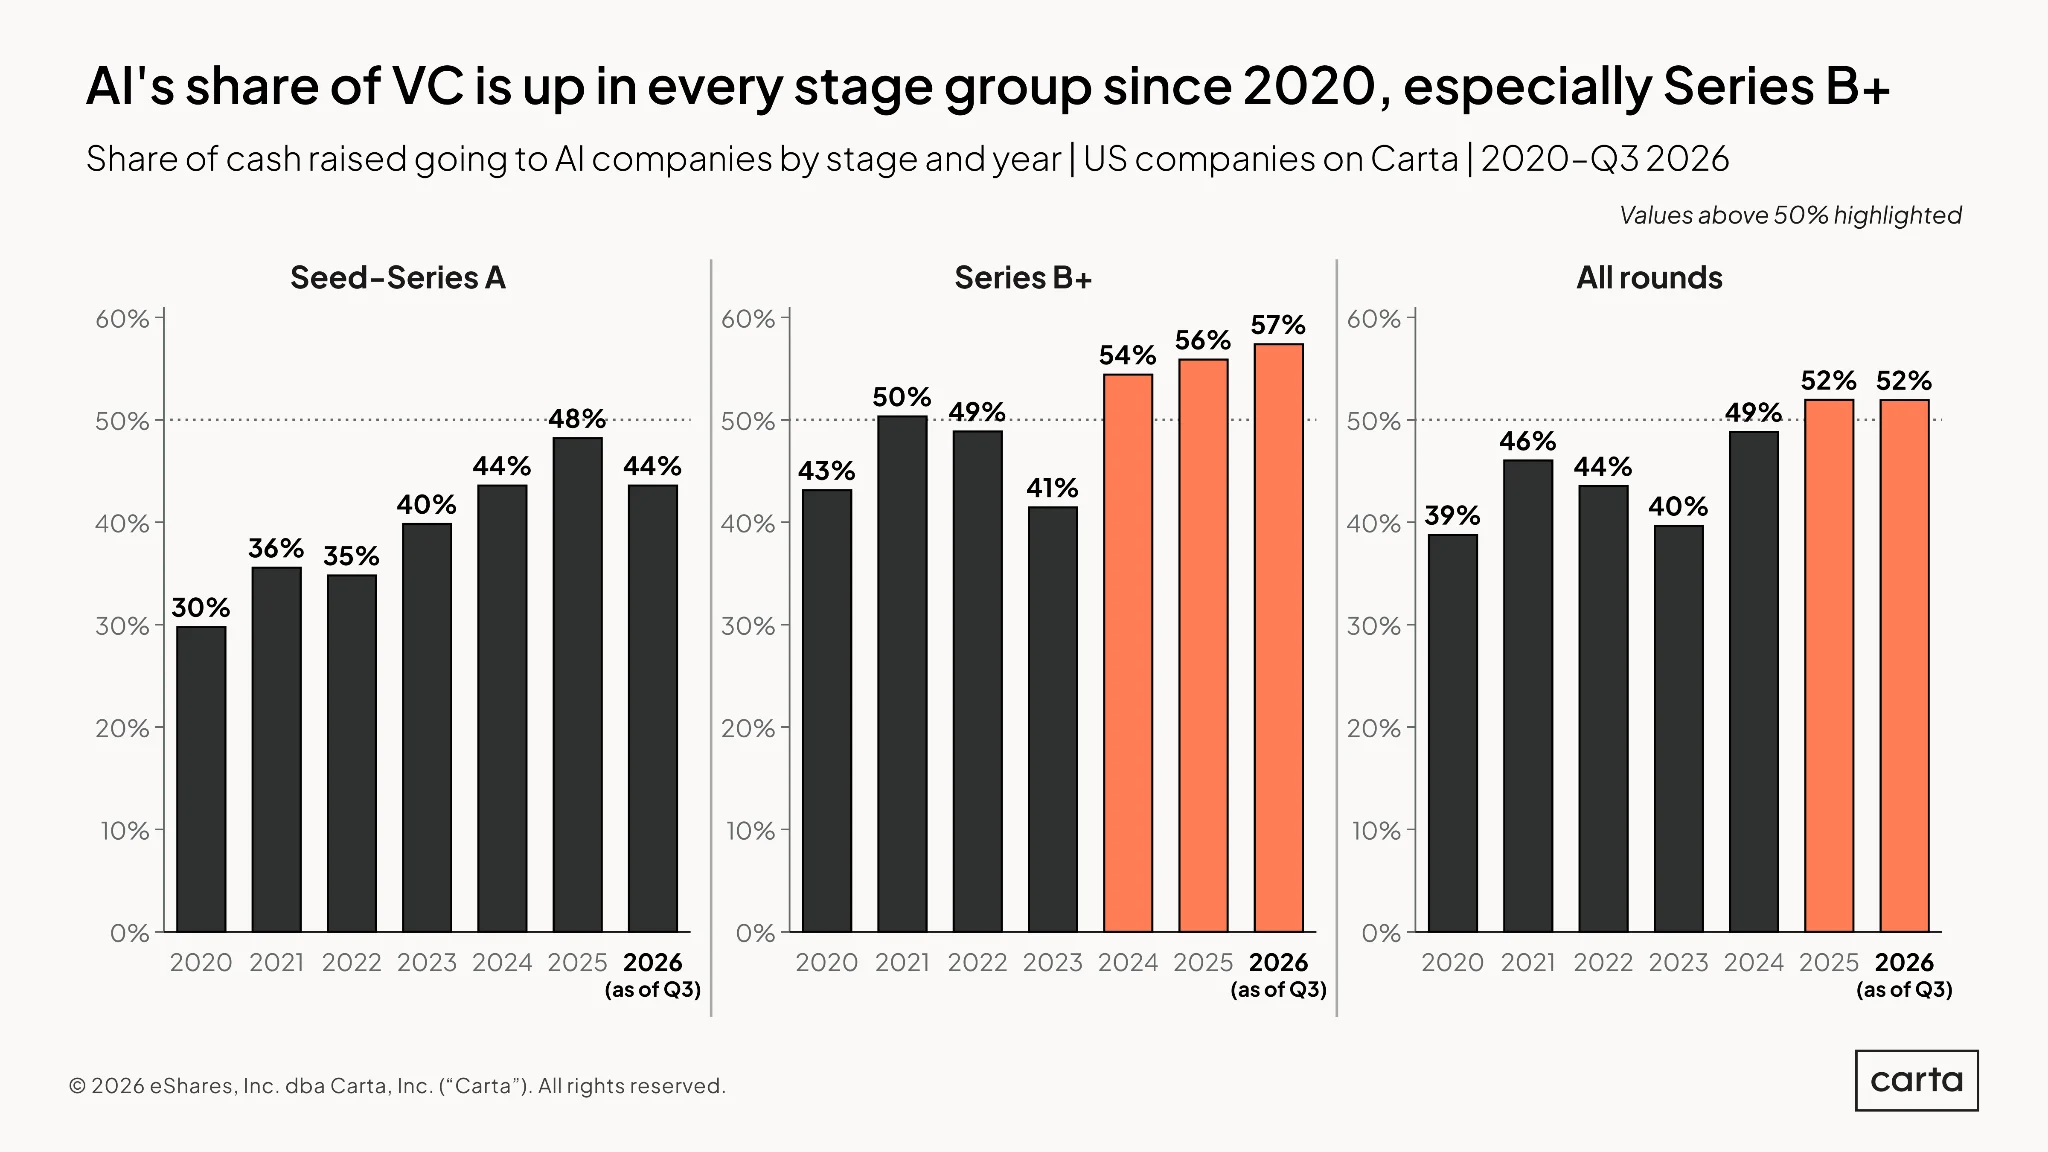
Across all rounds, AI startups were responsible for 52% of VC raised on Carta through the first three quarters of 2026, matching the overall percentage of AI fundraising from last year. Within smaller segments of the market, however, the picture has shifted.
AI startups raised 44% of all capital on Carta across seed and Series A through the end of Q3, a notable drop from the 2025 rate of 48%. This is the first time the annual rate of AI fundraising among early-stage rounds has declined since the generative AI era began in 2022. At Series B and beyond, meanwhile, the rate of AI fundraising continued to climb, reaching a new high of 57%.
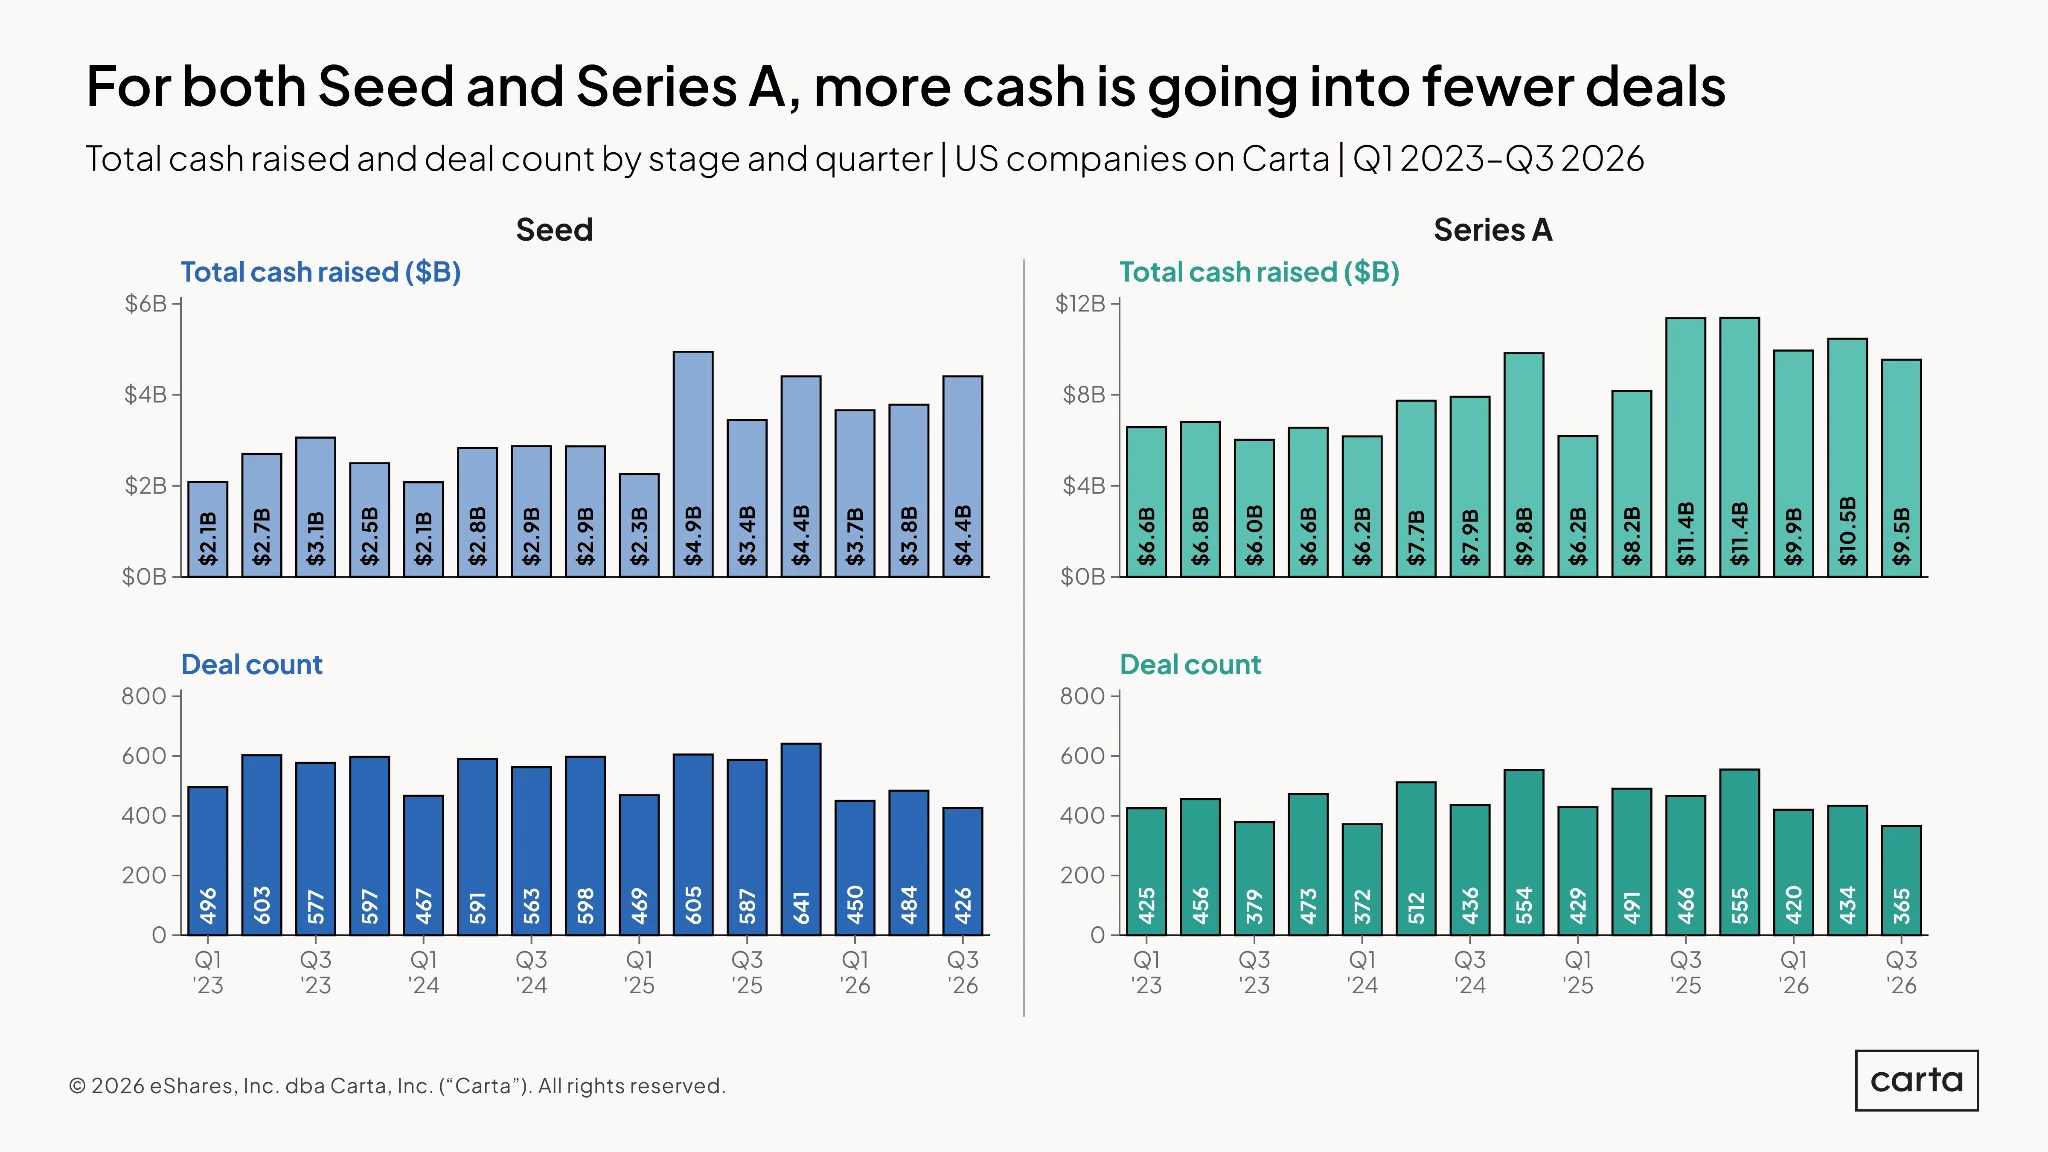
At both the seed stage and Series A, startups have raised notably more cash over the past five to six quarters than was typical during the preceding two years. But this upswing in early-stage spending has not resulted in more companies getting funded.
Investors deployed $4.1 billion at the seed stage in Q3, up 21% year over year. Yet that capital was spread across only 426 rounds, down 27% from the year prior. This number of rounds will likely continue to increase in the coming weeks as more fundraising events are logged on Carta, but for now, Q3 had the lowest seed-stage deal count since at least the start of 2023. The same is true at Series A, where Q3’s count of 365 closed rounds marked a 22% year-over-year decline.
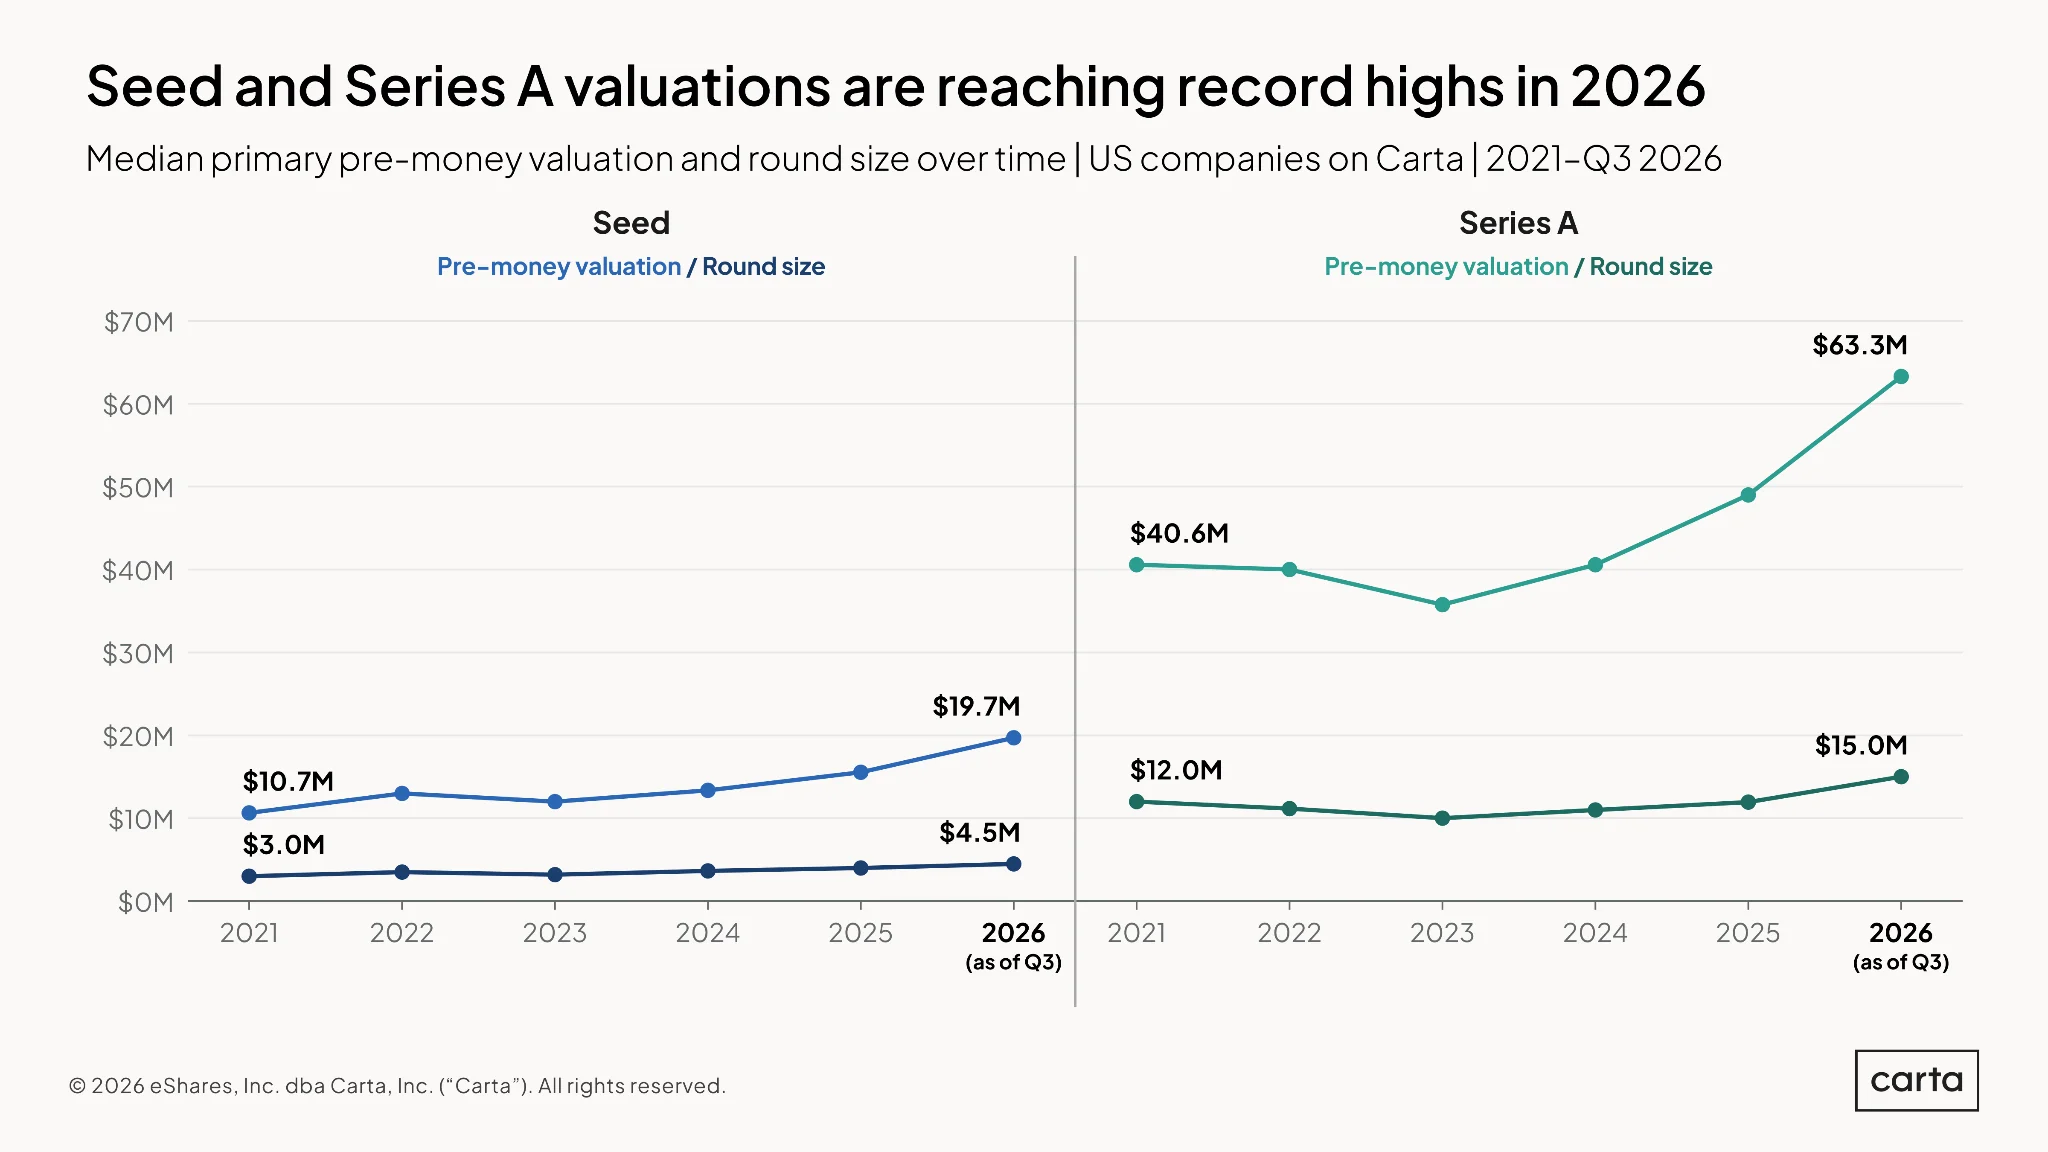
Early-stage valuations keep rising, with no apparent end in sight to a recent stretch of remarkable growth.
Through the end of Q3, the median seed valuation in 2026 is $19.7 million, up 84% from full year 2021. And the median Series A valuation is $63.3 million, a 56% increase from five years ago. In terms of pricing, early-stage investors today are navigating a different landscape.
Typical round sizes at these stages are also growing, albeit at a slower clip. Compared to that same 2021 benchmark, median round size is up 50% at the seed stage and 25% at Series A.
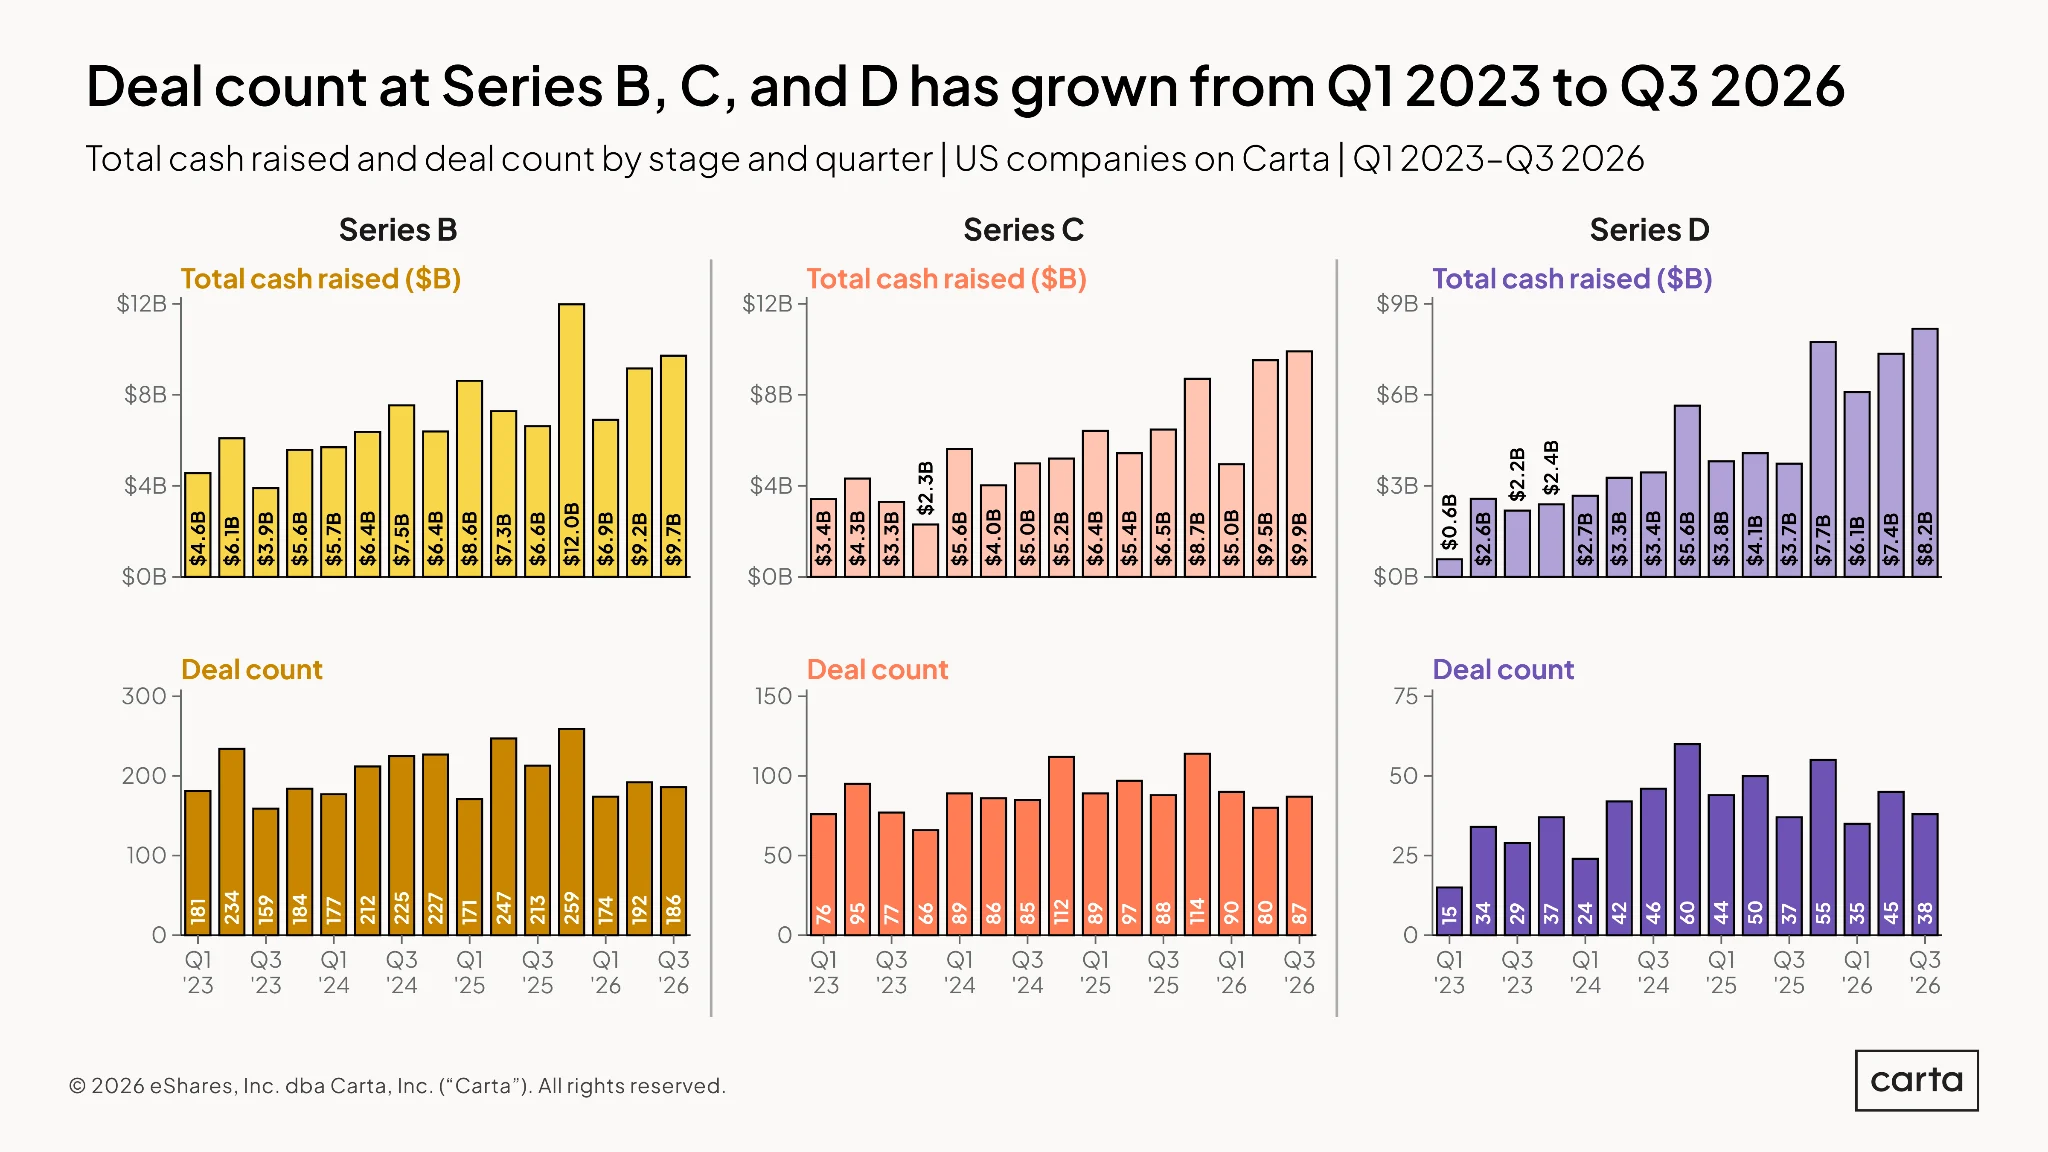
Just as at earlier stages, the fundraising markets at Series B, Series C, and Series D have all seen capital investment surge over the past year, while deal counts have ticked slightly down.
On a longer timeframe, though, the trend in activity is more promising at these later stages than at earlier junctures in the fundraising journey. Compared to Q1 2023, deal counts at Series B and beyond have either held steady or ticked up, with the Series D market seeing a particular uplift. At both seed and Series A, meanwhile, deal counts are down since the start of 2023. These later stages saw a more severe downturn in deal count after the end of the pandemic bull market, but they’re regaining that ground.
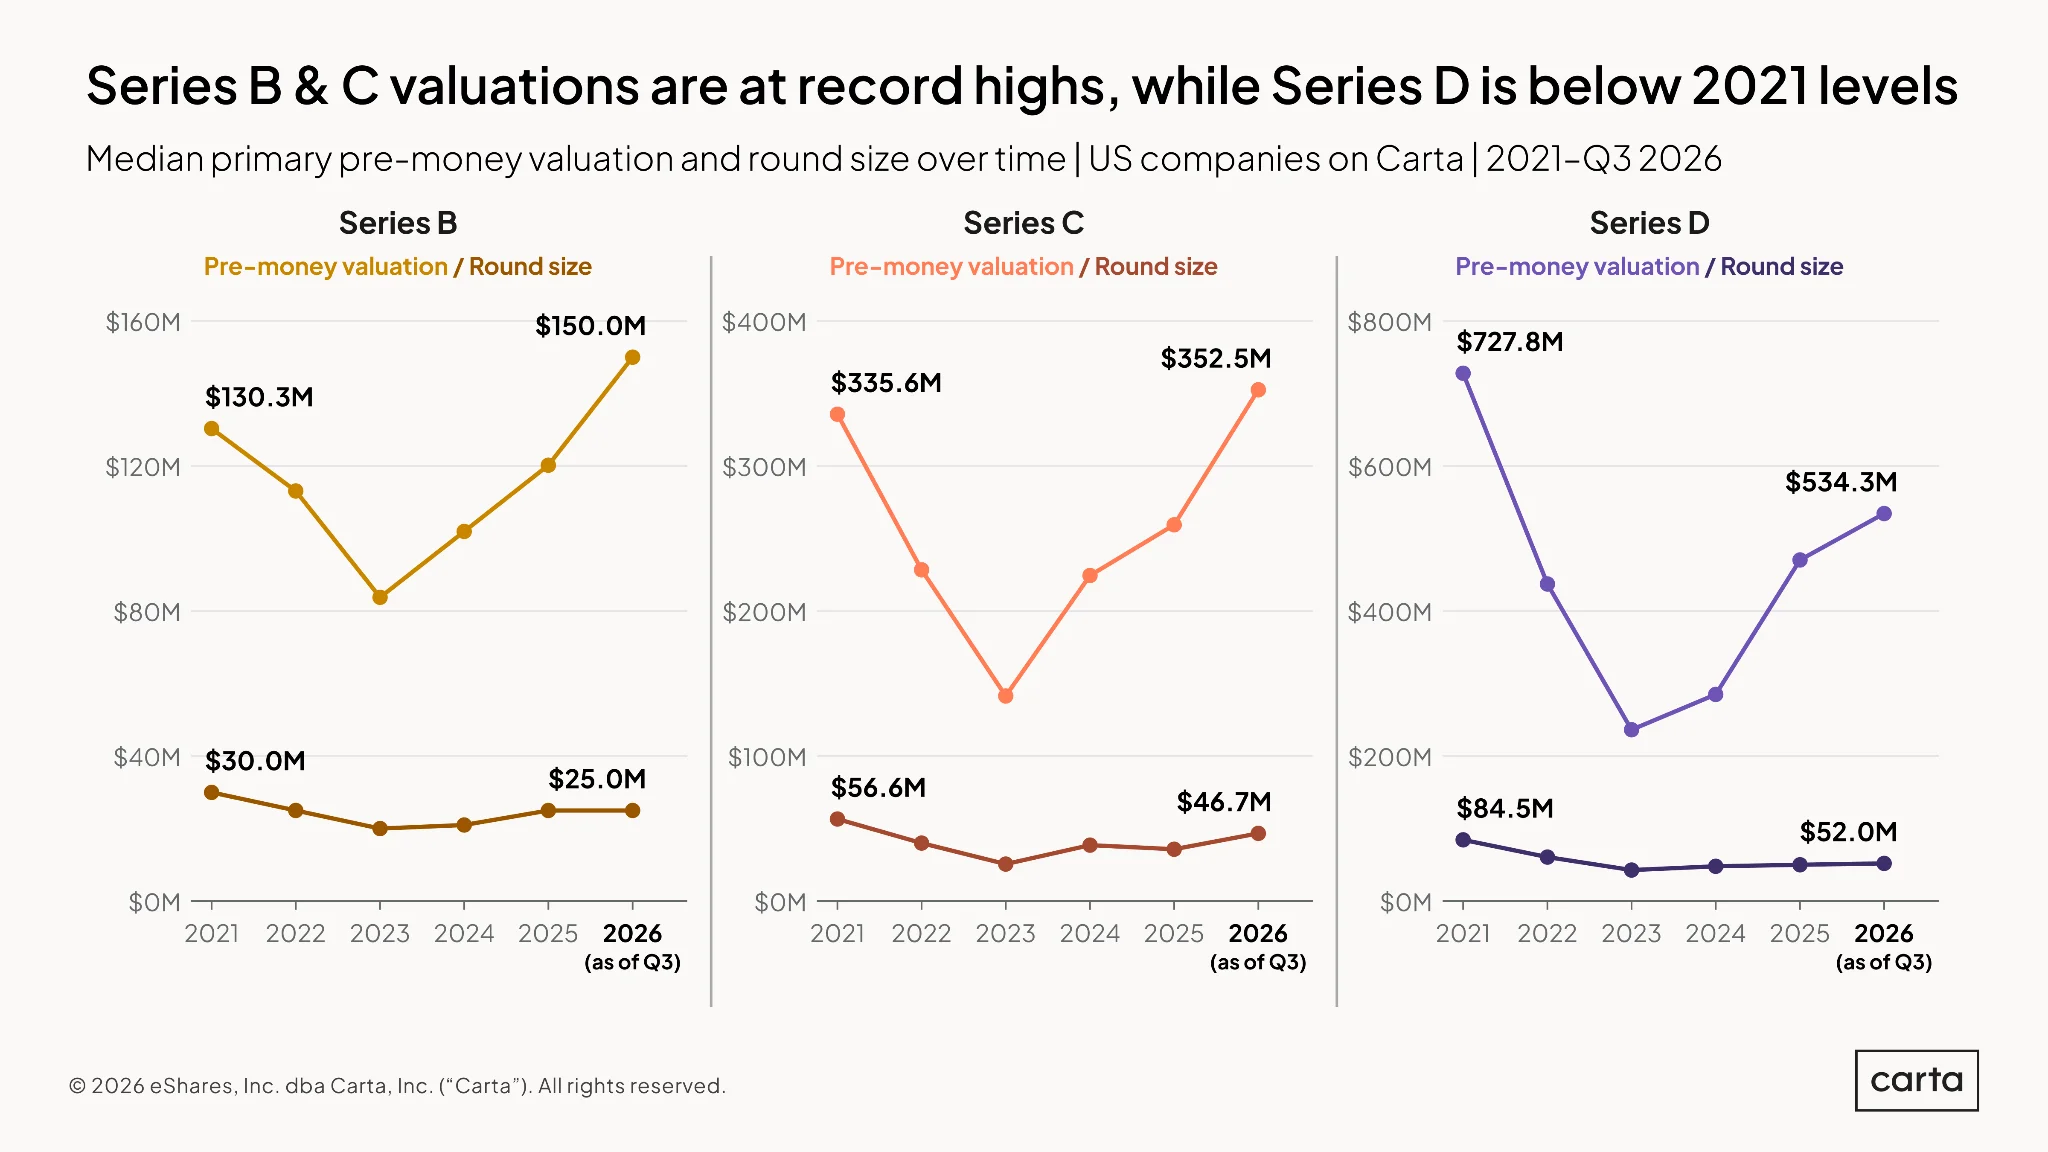
At both Series B and Series C, median valuations have reached all-time highs so far in 2026, surpassing even the high-flying market of 2021. The recovery in valuations at these fundraising stages since 2023 has been swift and steep, just as the decline in valuations was after 2021.
Recent movement in median round sizes at these stages has been less volatile than the swings in valuations. At Series B, for instance, median round size is essentially flat from 2025 to 2026, while the median pre-money valuation has risen by 25%.
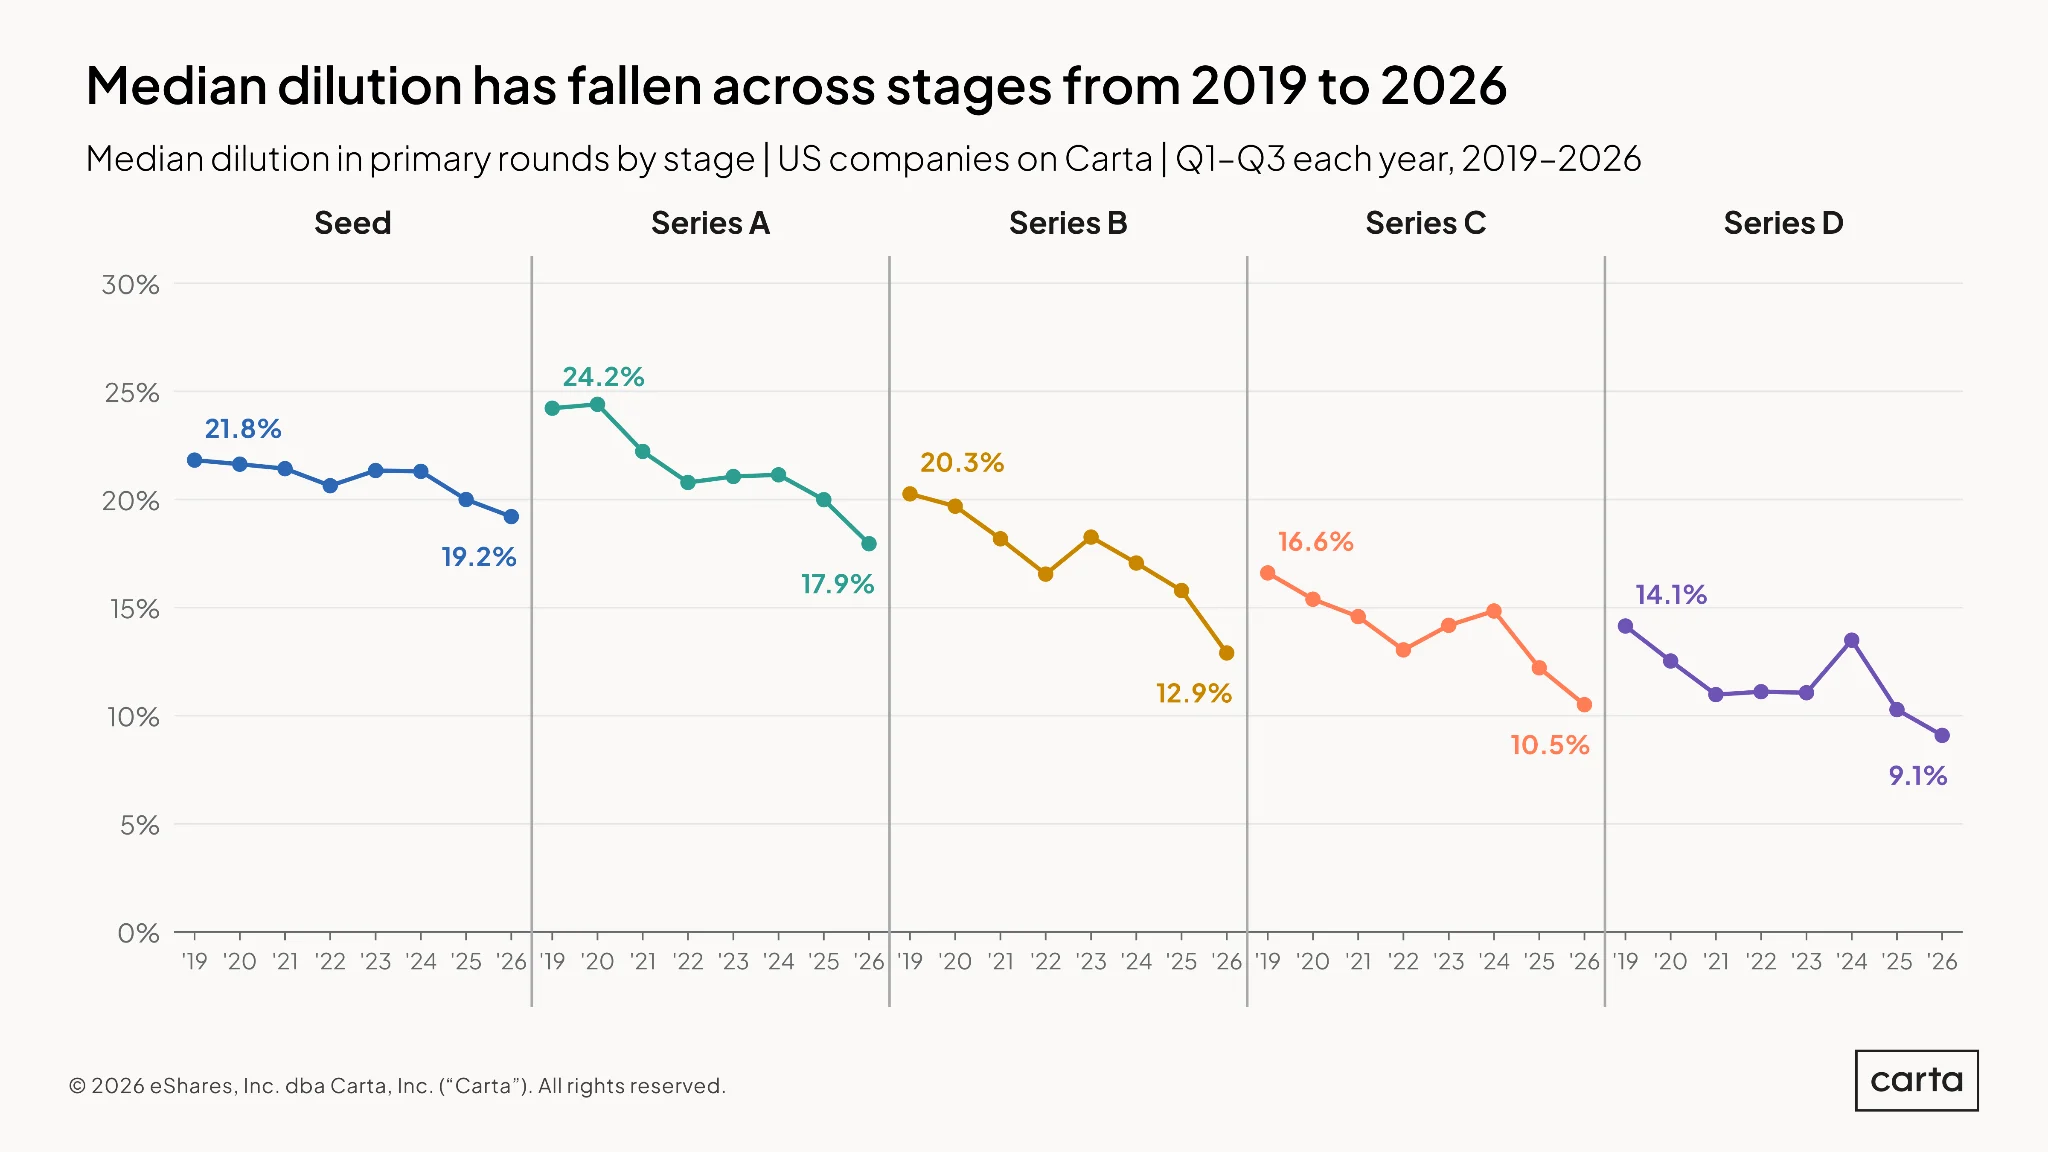
Across all fundraising stages, the median rate of dilution in new rounds has declined sharply during the 2020s. The trend hasn’t been invariable, with median dilution increasing in some years at some stages. On the whole, though, the direction of the market is clear.
When dilution in any single round is lower, founders retain a larger percentage of their company. When dilution rates decline across multiple rounds, as they have so far this decade, the benefits for founders compound. If a hypothetical company raised every round from seed through Series D at the median rates from 2019, the compounded dilution across all rounds would be about 66%. Run that same exercise at 2026 rates, and total dilution is just 53%.
Market leverage indicators
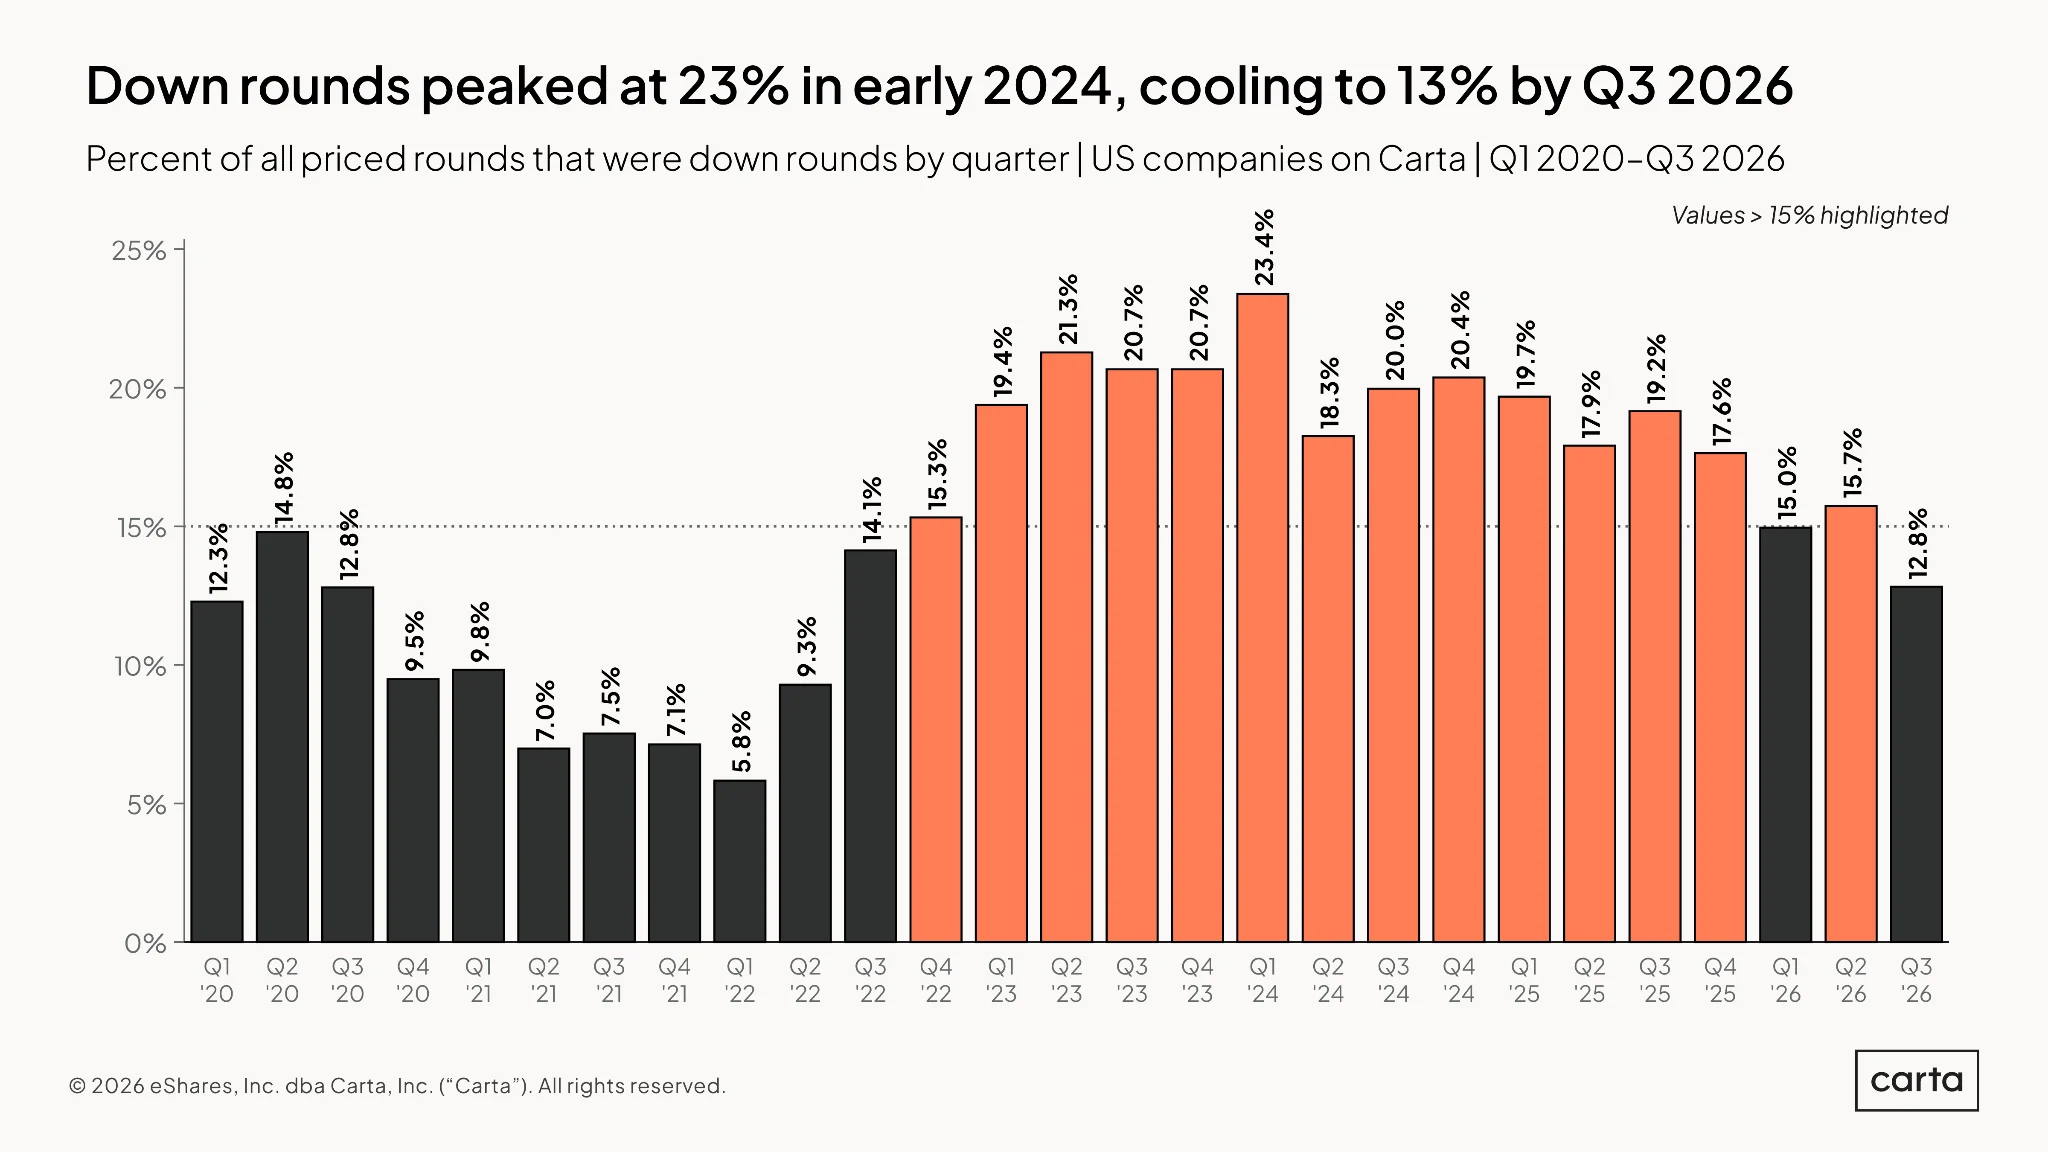
An ongoing decline in the frequency of down rounds has continued so far in 2026. In Q3, just 13% of rounds raised on Carta came in at a lower valuation than the company’s previous priced round, marking the lowest rate of down rounds in the past four years.
The correlation is not exact, but the recent trend in down-round rate is roughly inverse to recent trends in VC valuations. In a frothy valuation environment such as 2021, down rounds will inherently be less common. When the valuation environment cools, as it did in late 2022 and early 2023, more down rounds occur. Now, with these large swings in the broader market for valuations receding further into the past, the down-round rate is normalizing.
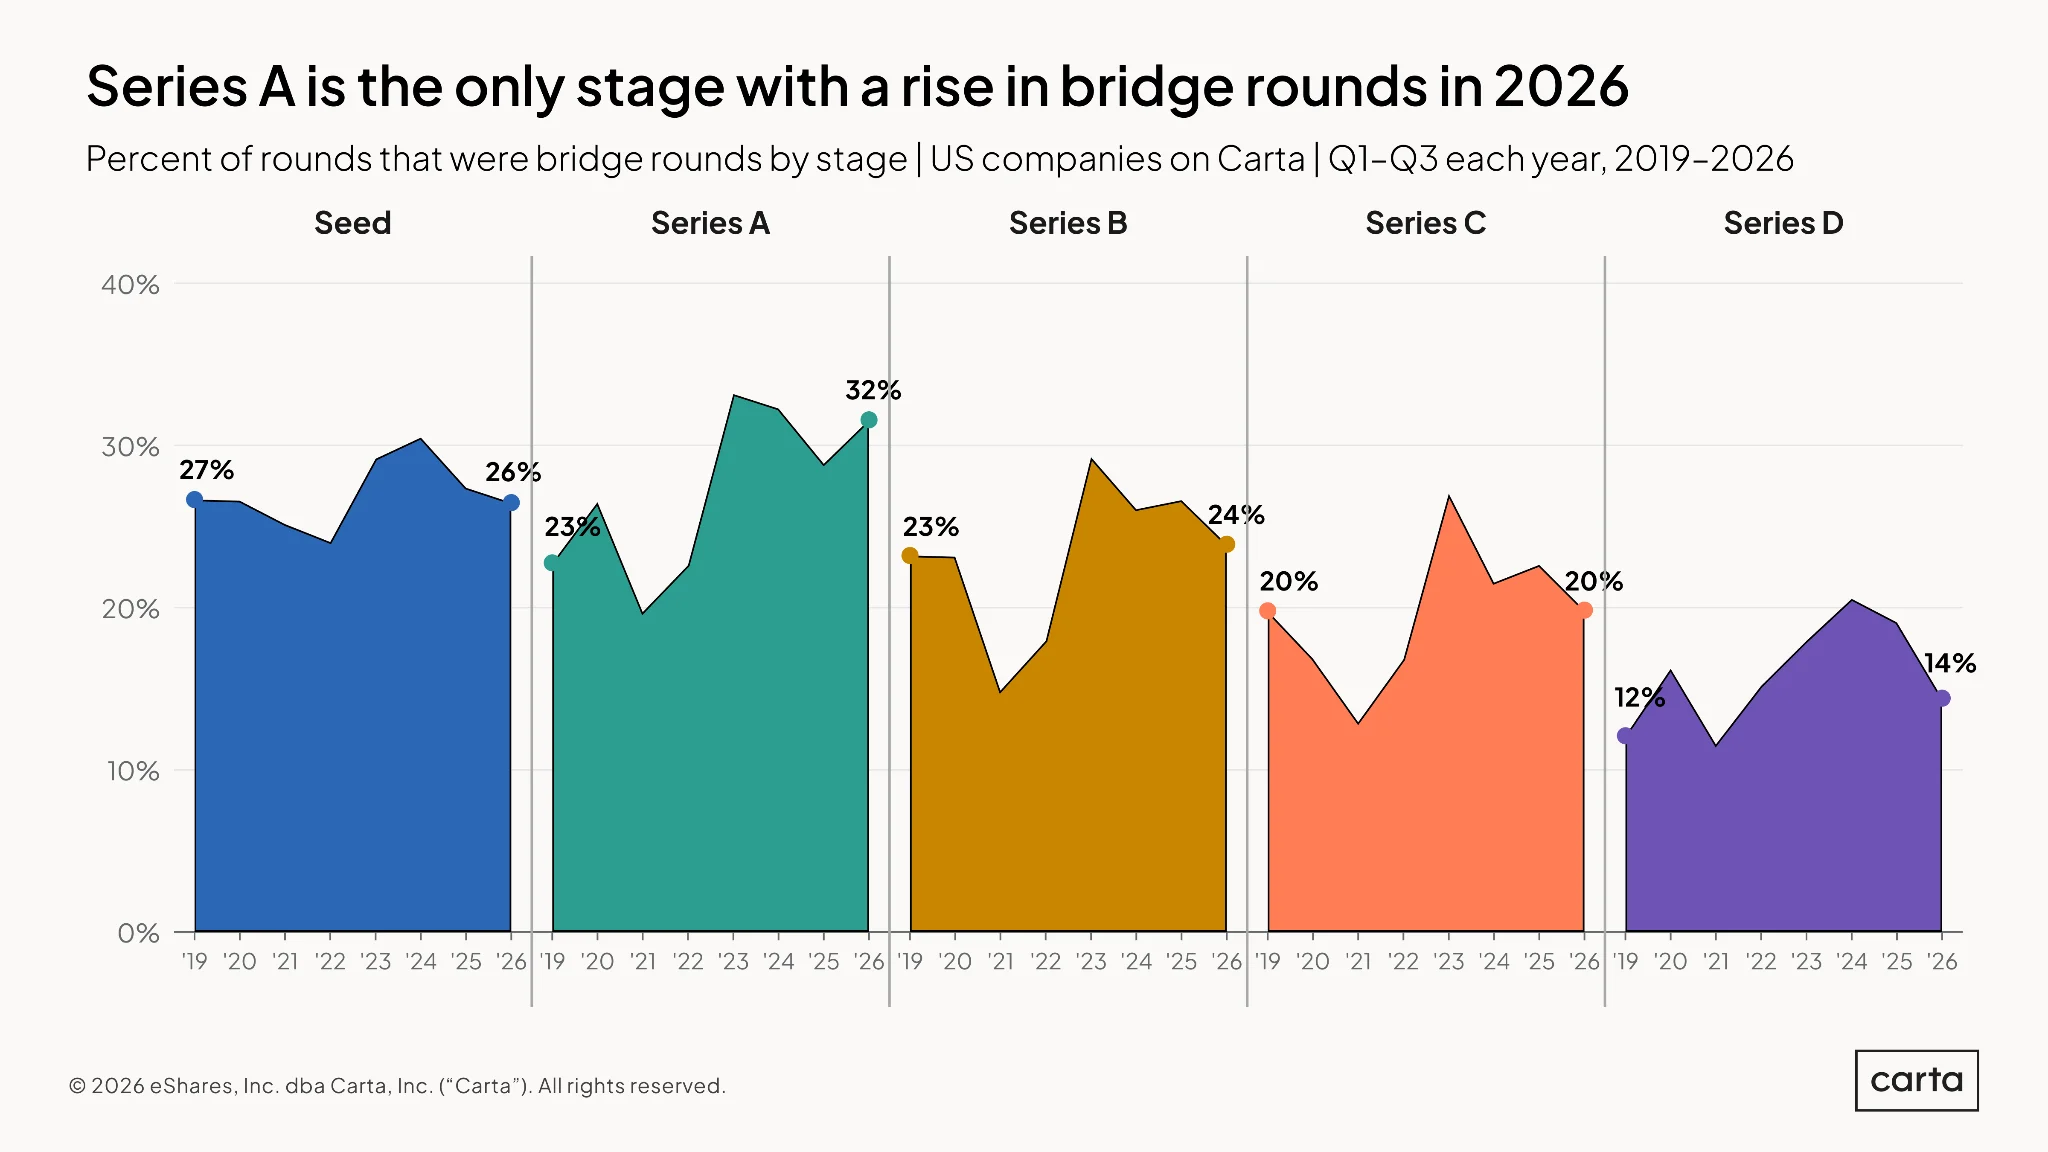
At most stages, bridge rounds have been less frequent in 2026 than they were in 2025, and this year’s rate of bridge rounds is similar to the rate from 2019. On both counts, the exception is Series A. There, the frequency of bridge rounds climbed to 32% in 2026, up from 29% last year and nine percentage points higher than in 2019.
A difference of a few percentage points in this metric can have a meaningful impact. For instance, at Series C, one out of every five rounds raised through the end of Q3 2026 was a bridge round for an existing Series C company. At seed, about one in four rounds so far this year was a bridge round. At Series A, it’s about one in three.
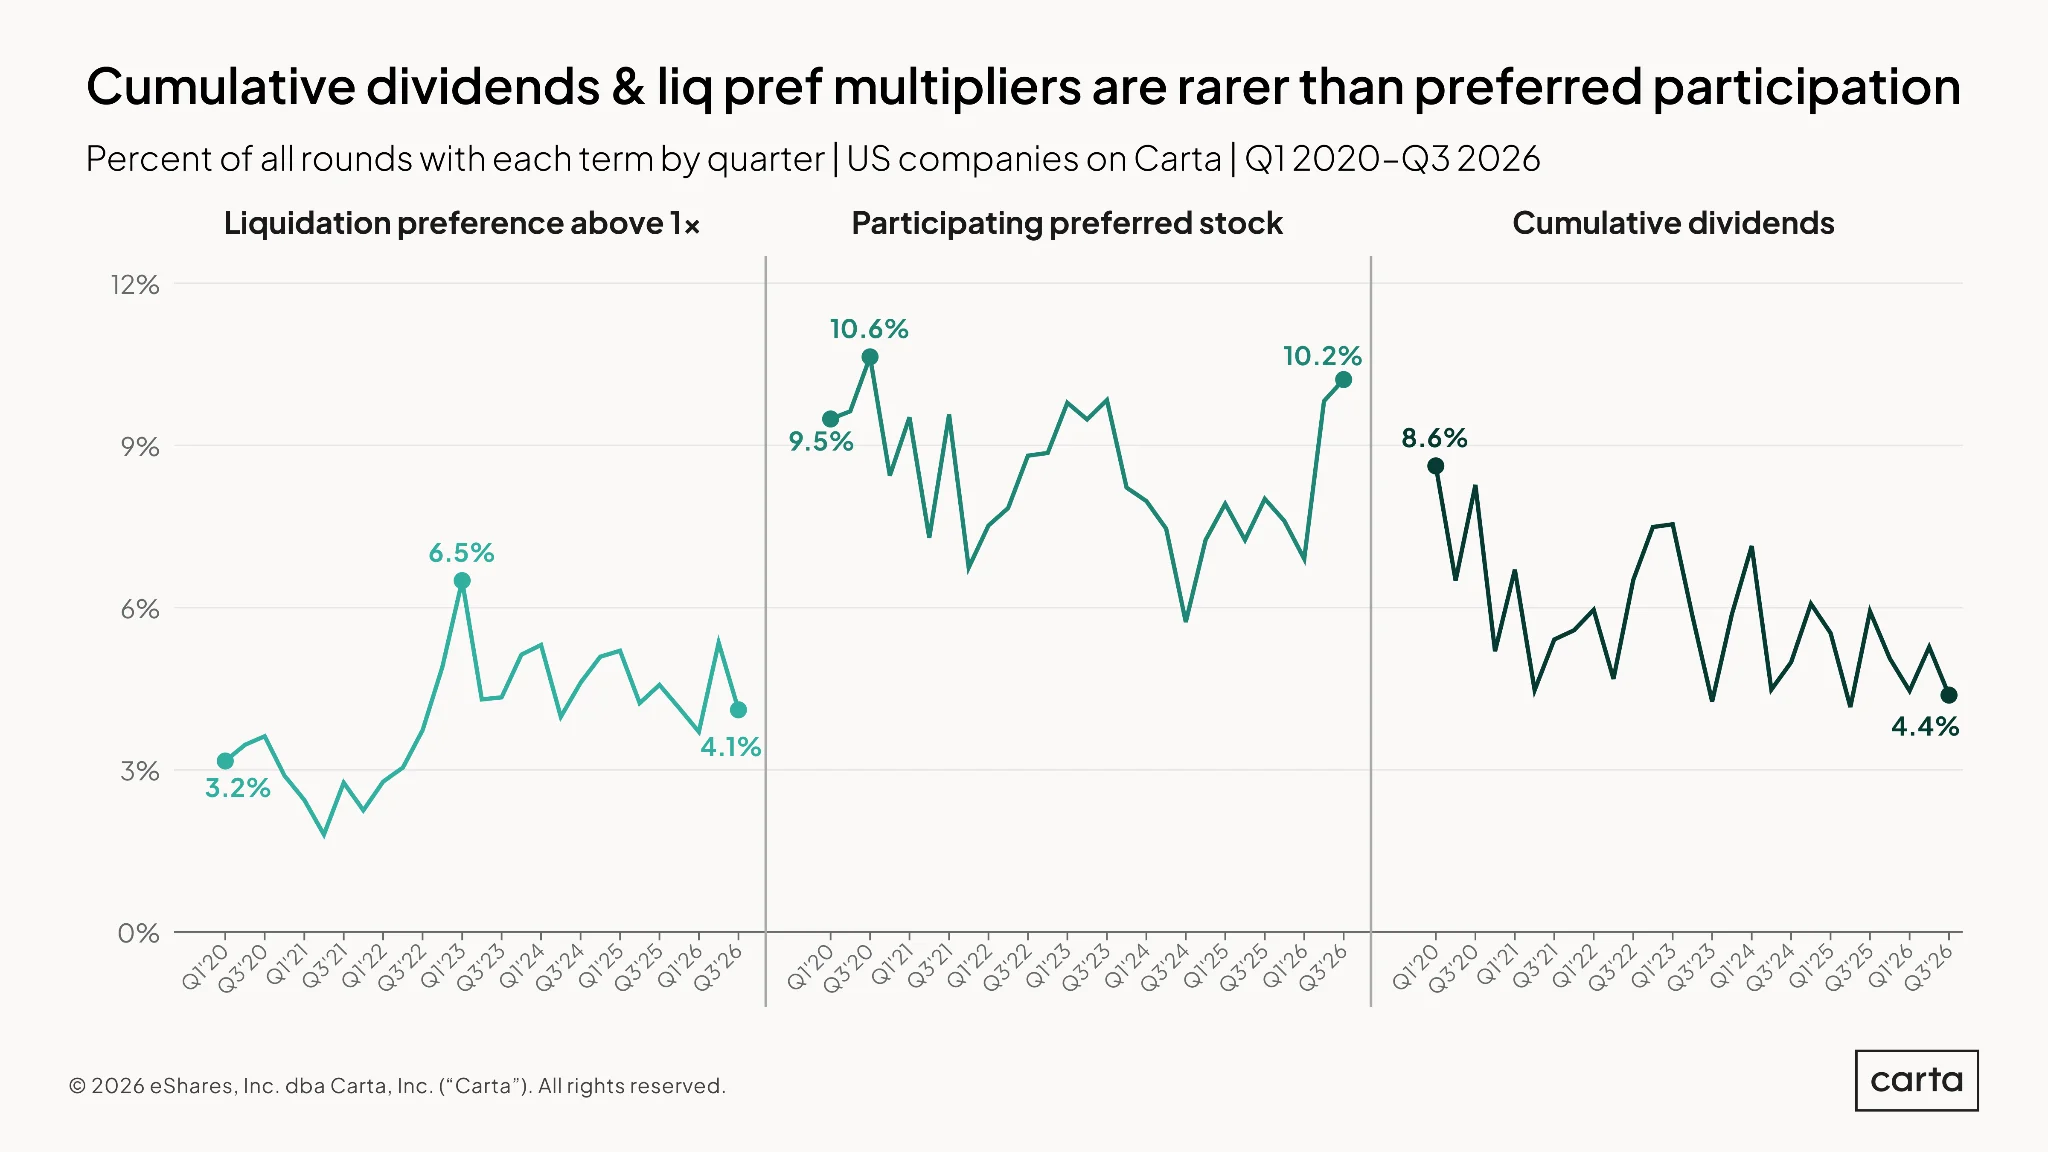
More than 10% of rounds raised on Carta in Q3 2026 across all stages involved the issuance of participating preferred stock, the highest rate in six years. Today, new funding rounds are more than twice as likely to include participating preferred shares as either cumulative dividends or a liquidation preference over 1x.
From one quarter to the next, the frequency of all three of these deal terms has been relatively spiky over the past seven years. Despite these fluctuations, all three terms remain quite rare across the startup landscape, with a large majority of all funding rounds including none of the three.
Growth trajectories
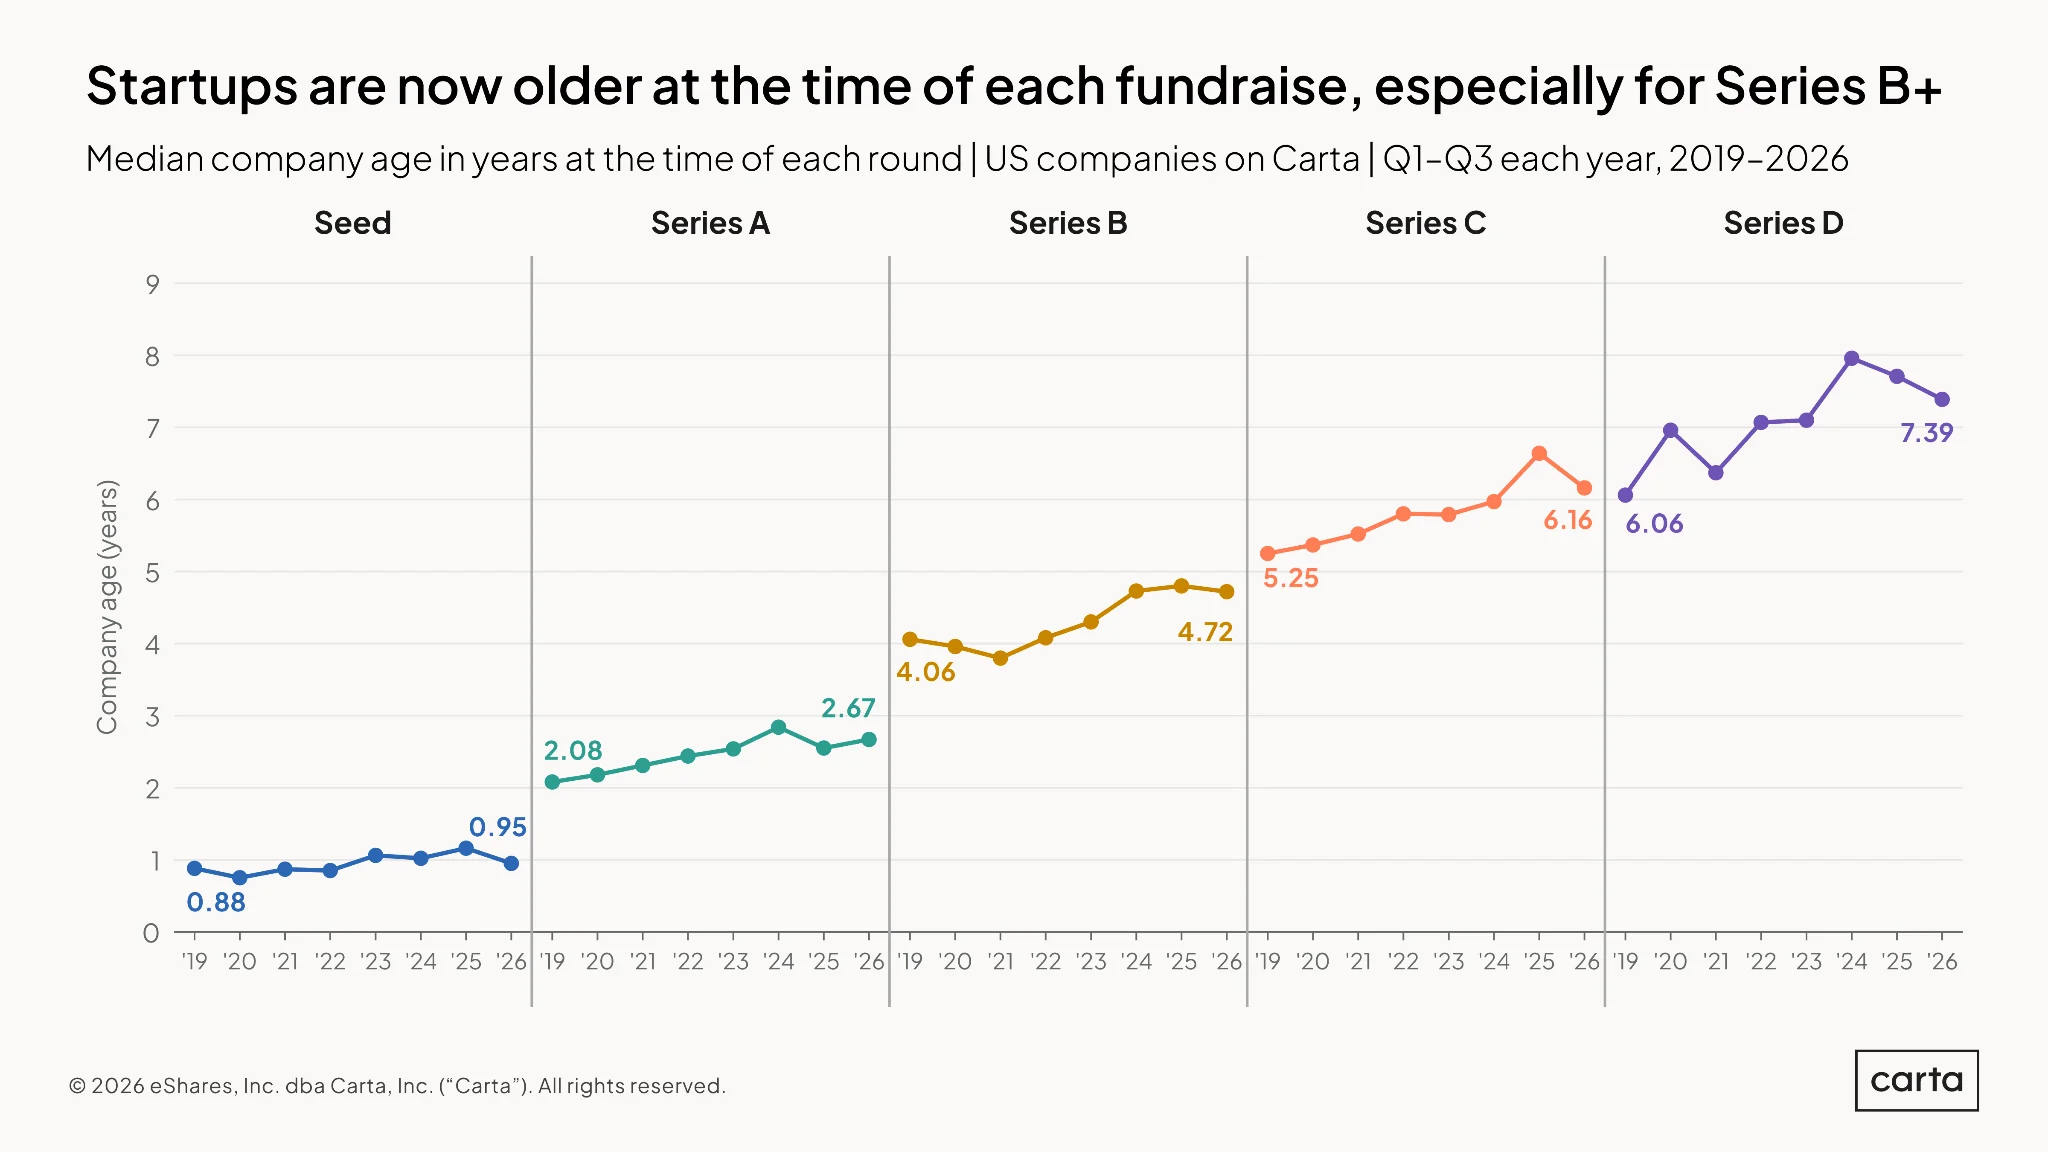
So far in 2026, companies are moving more quickly through fundraising stages than they did in 2025. The median age of a company at the time it raises a round has declined this year at every stage except one (Series A), with Series C experiencing the biggest year-over-year decline.
These quickening timelines are a shift from the recent trend, which had seen median company age increase significantly at most stages during the first half of the 2020s. It’s possible this shift represents a genuine transition point in the market: In recent years, many startups raising capital were still founded before the AI era, and some chose to delay fundraising plans as they tried to adapt legacy products and restart growth. Some AI-native startups were racing from one fundraise to the next, but they were still an exception. Now, those fast-moving AI startups may be the norm.
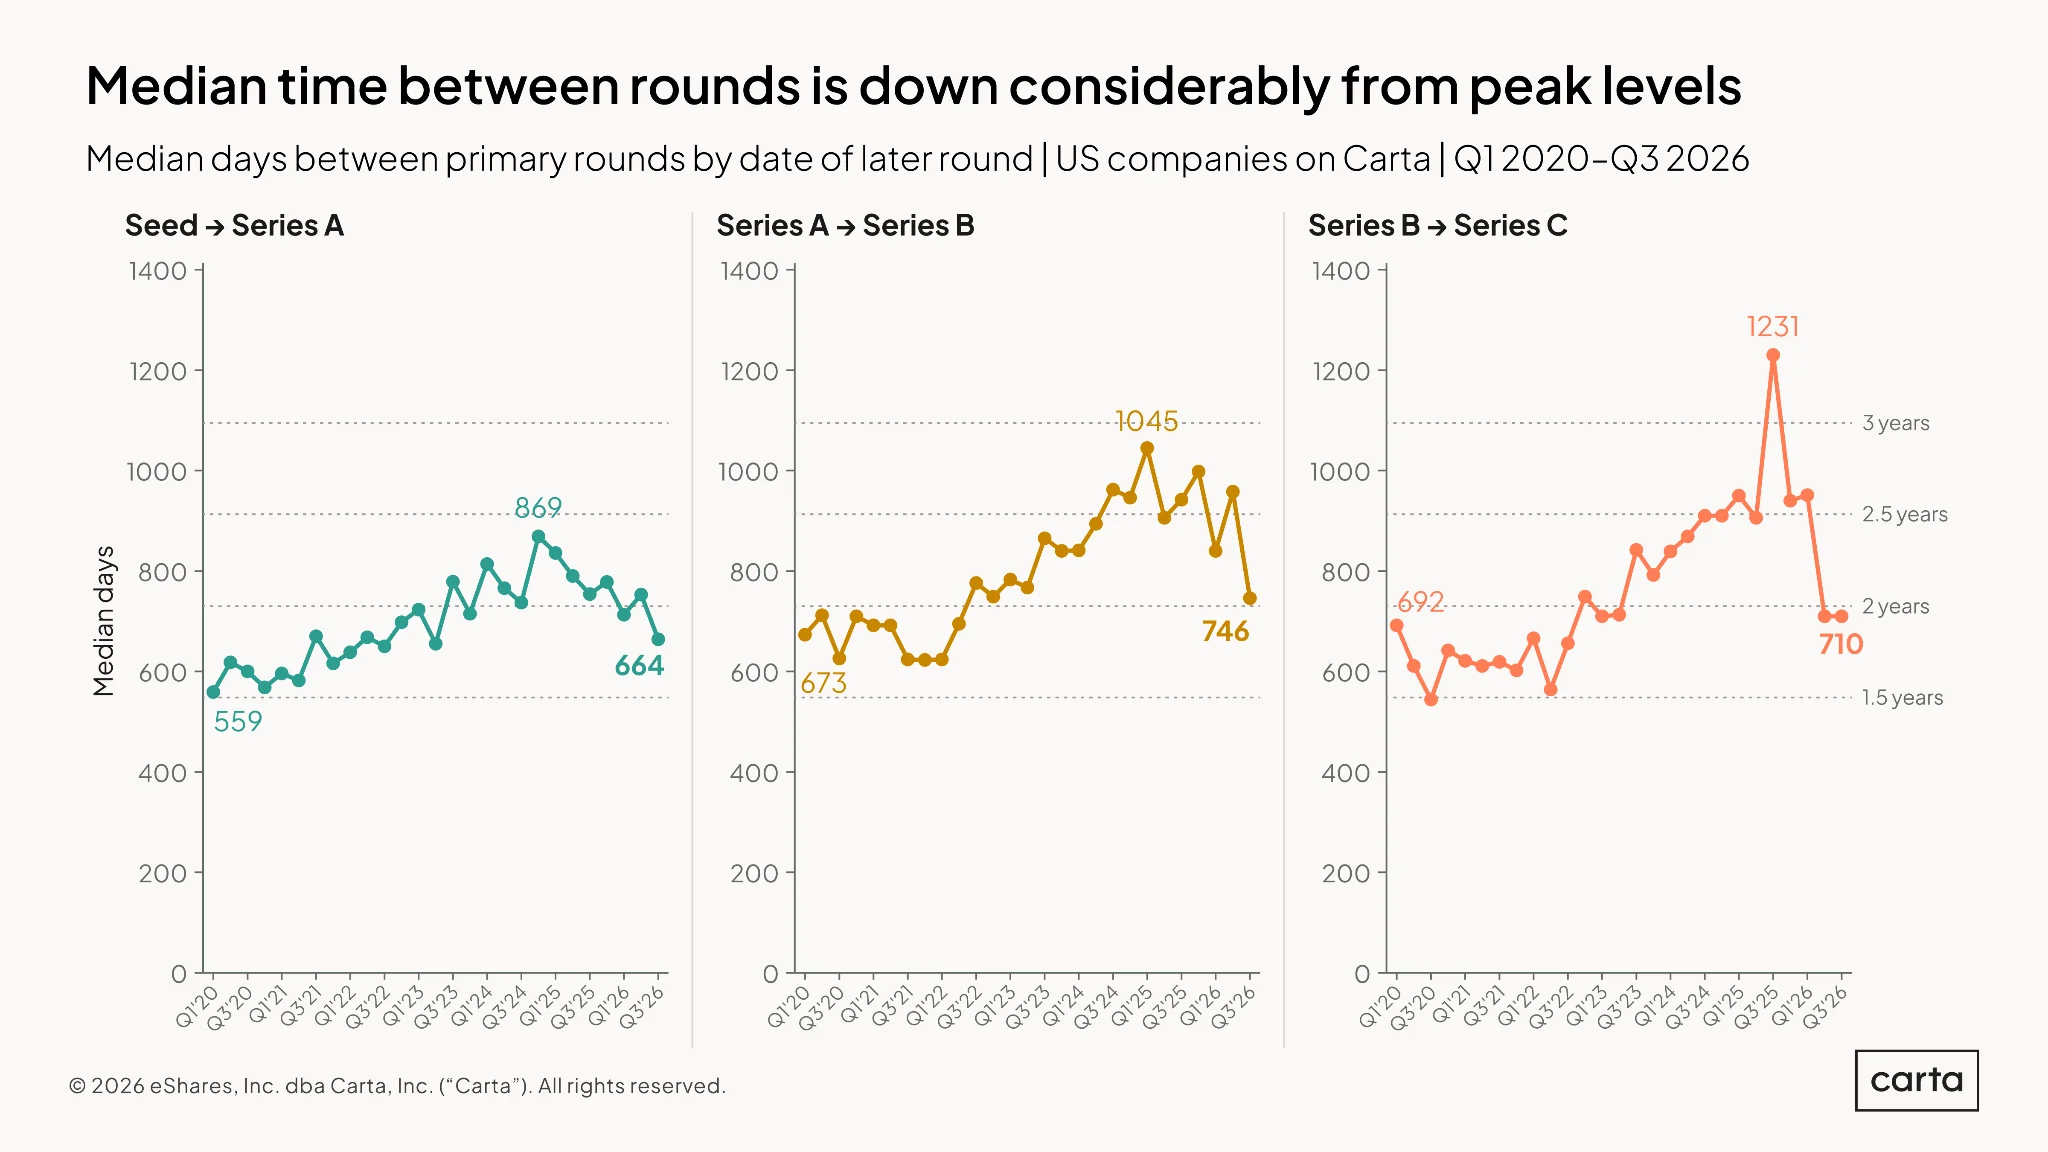
The maturity of startups at each fundraising stage is of course closely linked to the speed at which startups are moving from one stage to the next. So it makes sense that, as median company age at most stages has begun to decline, the median time between those stages has started to fall, too.
The starkest example is at Series C, where the median startup that closed a round in Q3 2026 did so 710 days after raising its Series B, or a little less than two years. That’s a 42% plunge from the median time between a Series B and a Series C one year ago. The declines from recent high points are less extreme at Series A and Series B, but still substantial.
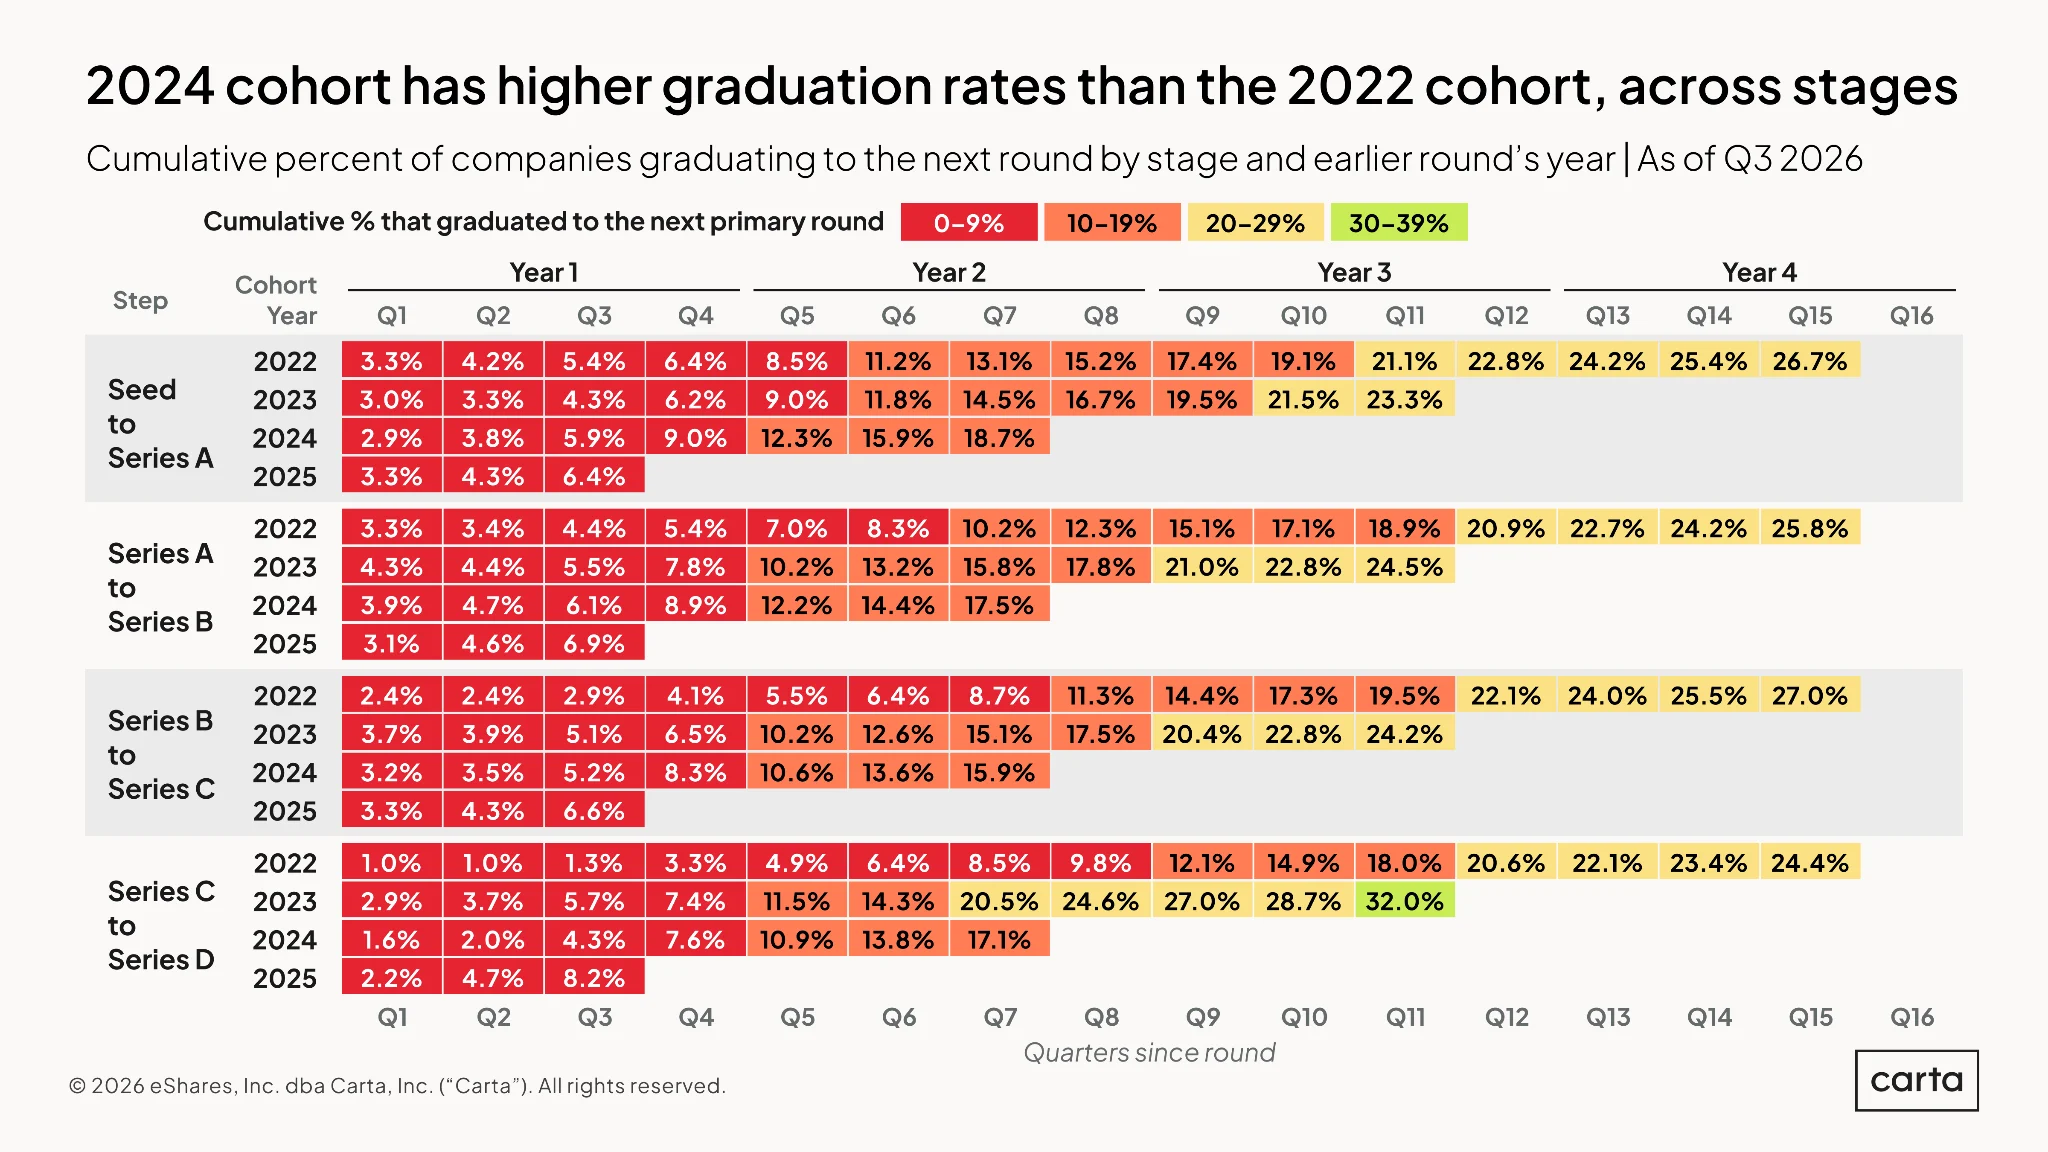
The above chart shows the percentage of startups raising a round in any given year that went on to raise their next priced round by various benchmarks in time. For instance, the cell at the top left shows that 3.3% of startups on Carta that raised a seed round in 2022 went on to raise their Series A the very next quarter. The cell at the top right shows that 26.7% of startups in this same cohort had gone on to raise a Series A after 15 quarters.
Across most of these thresholds, startups that raised rounds in 2023 and 2024 were more likely to advance quickly to the next stage than startups that raised rounds in 2022. One example: 12.2% of startups that raised a Series A in 2024 went on to raise a Series B within five quarters, compared to 7% of startups that raised a Series A in 2022. Another example: Among startups that raised a Series C in 2023, the graduation to Series D after 11 quarters was 32%. For startups that raised a Series C in 2022, the graduation rate at that same point in time was just 18%.
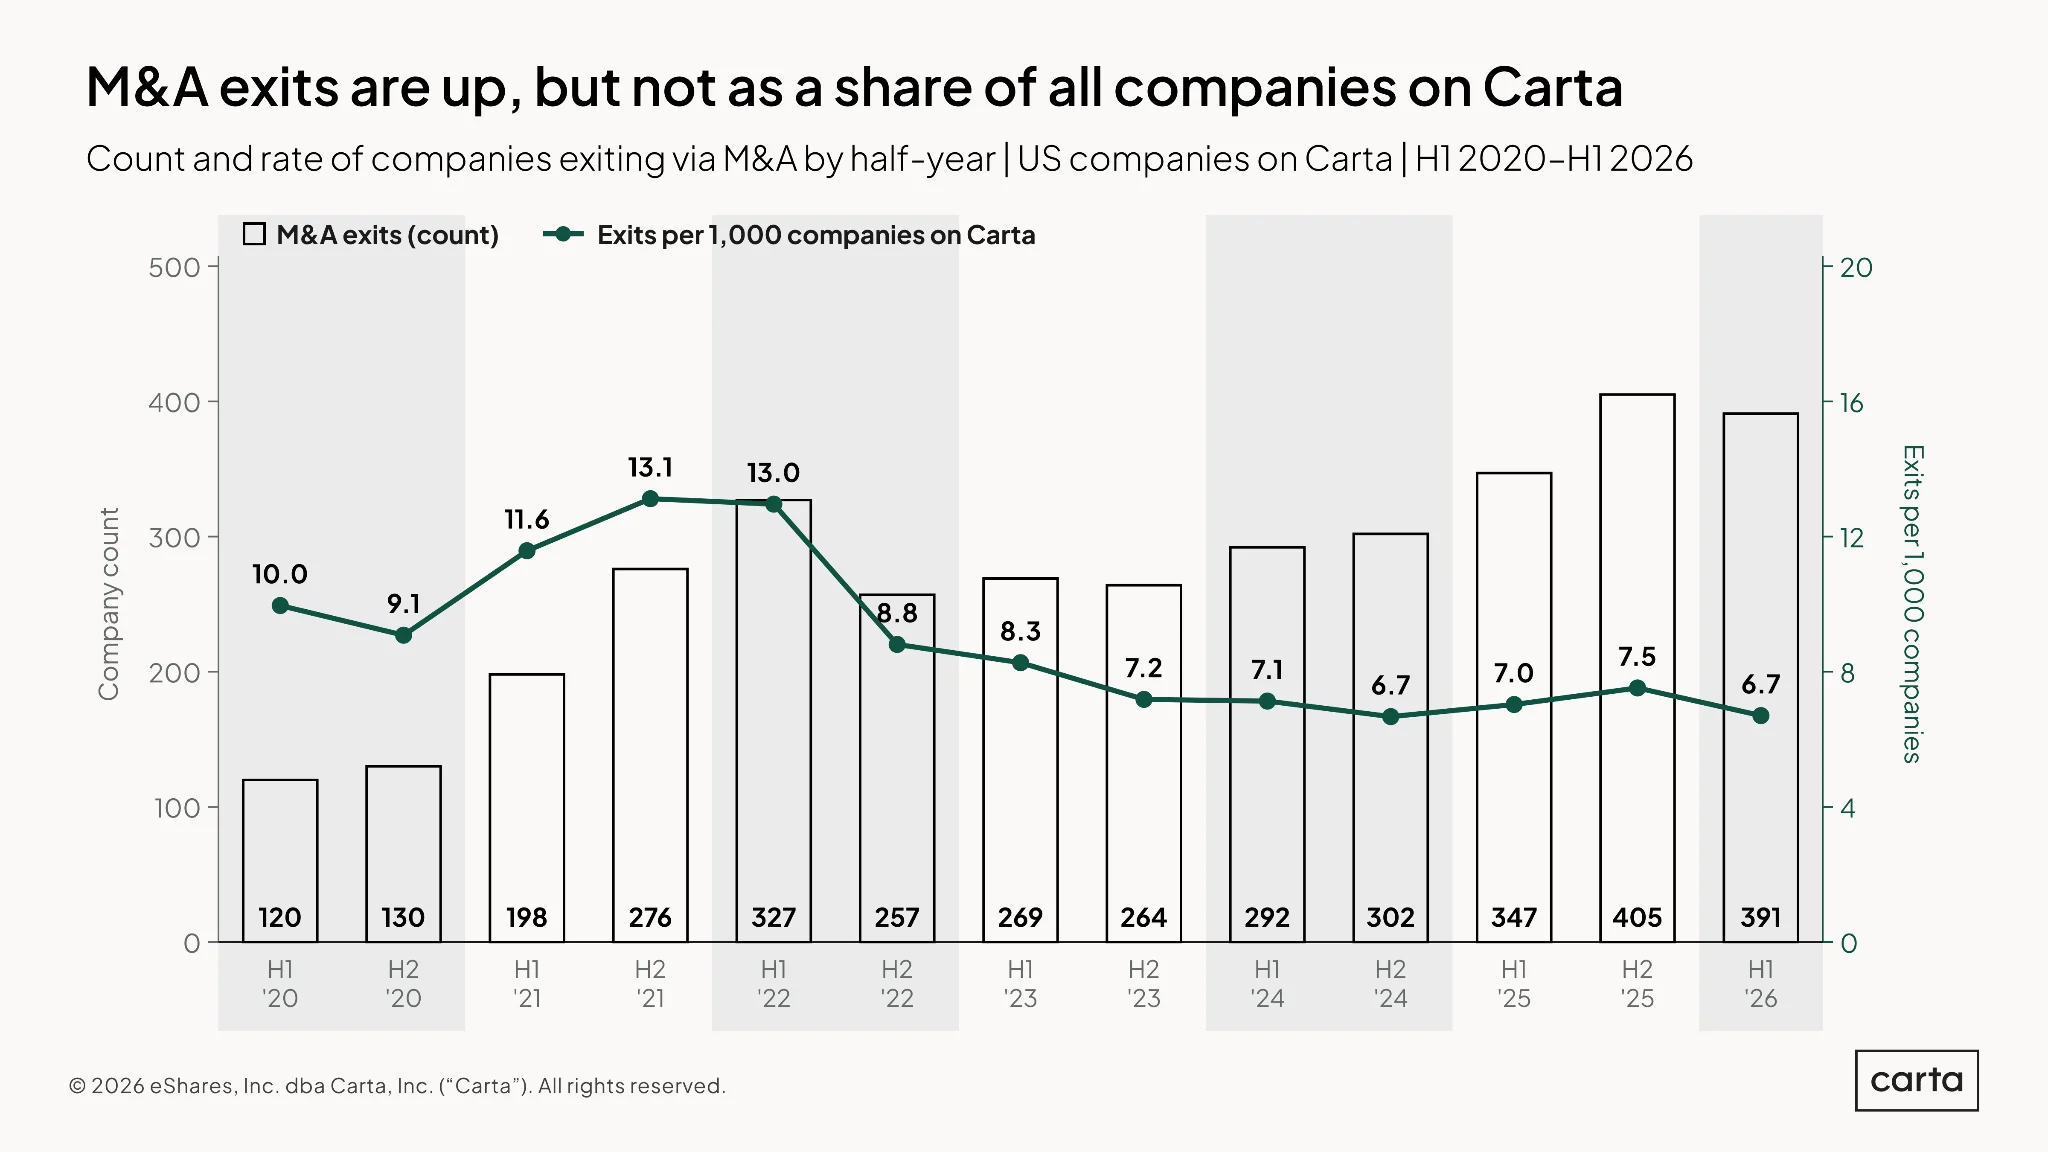
In terms of raw numbers, startup exits via M&A have grown more frequent over the past year among companies on Carta. In fact, H1 2026 and H2 2025 were the two busiest halves of the year for M&A exits so far in the 2020s, with the 405 transactions that occurred in H2 2025 setting the pace.
Relative to the total number of companies on Carta, however, the rate of exits via M&A has largely held steady the past few years, and has actually declined in 2026. In H1, there were 6.7 M&A exits for every 1,000 companies on Carta, tied for the lowest rate so far this decade. By this metric, the rate of M&A activity has nearly halved since H2 2021 and H1 2022.
Geographical trends
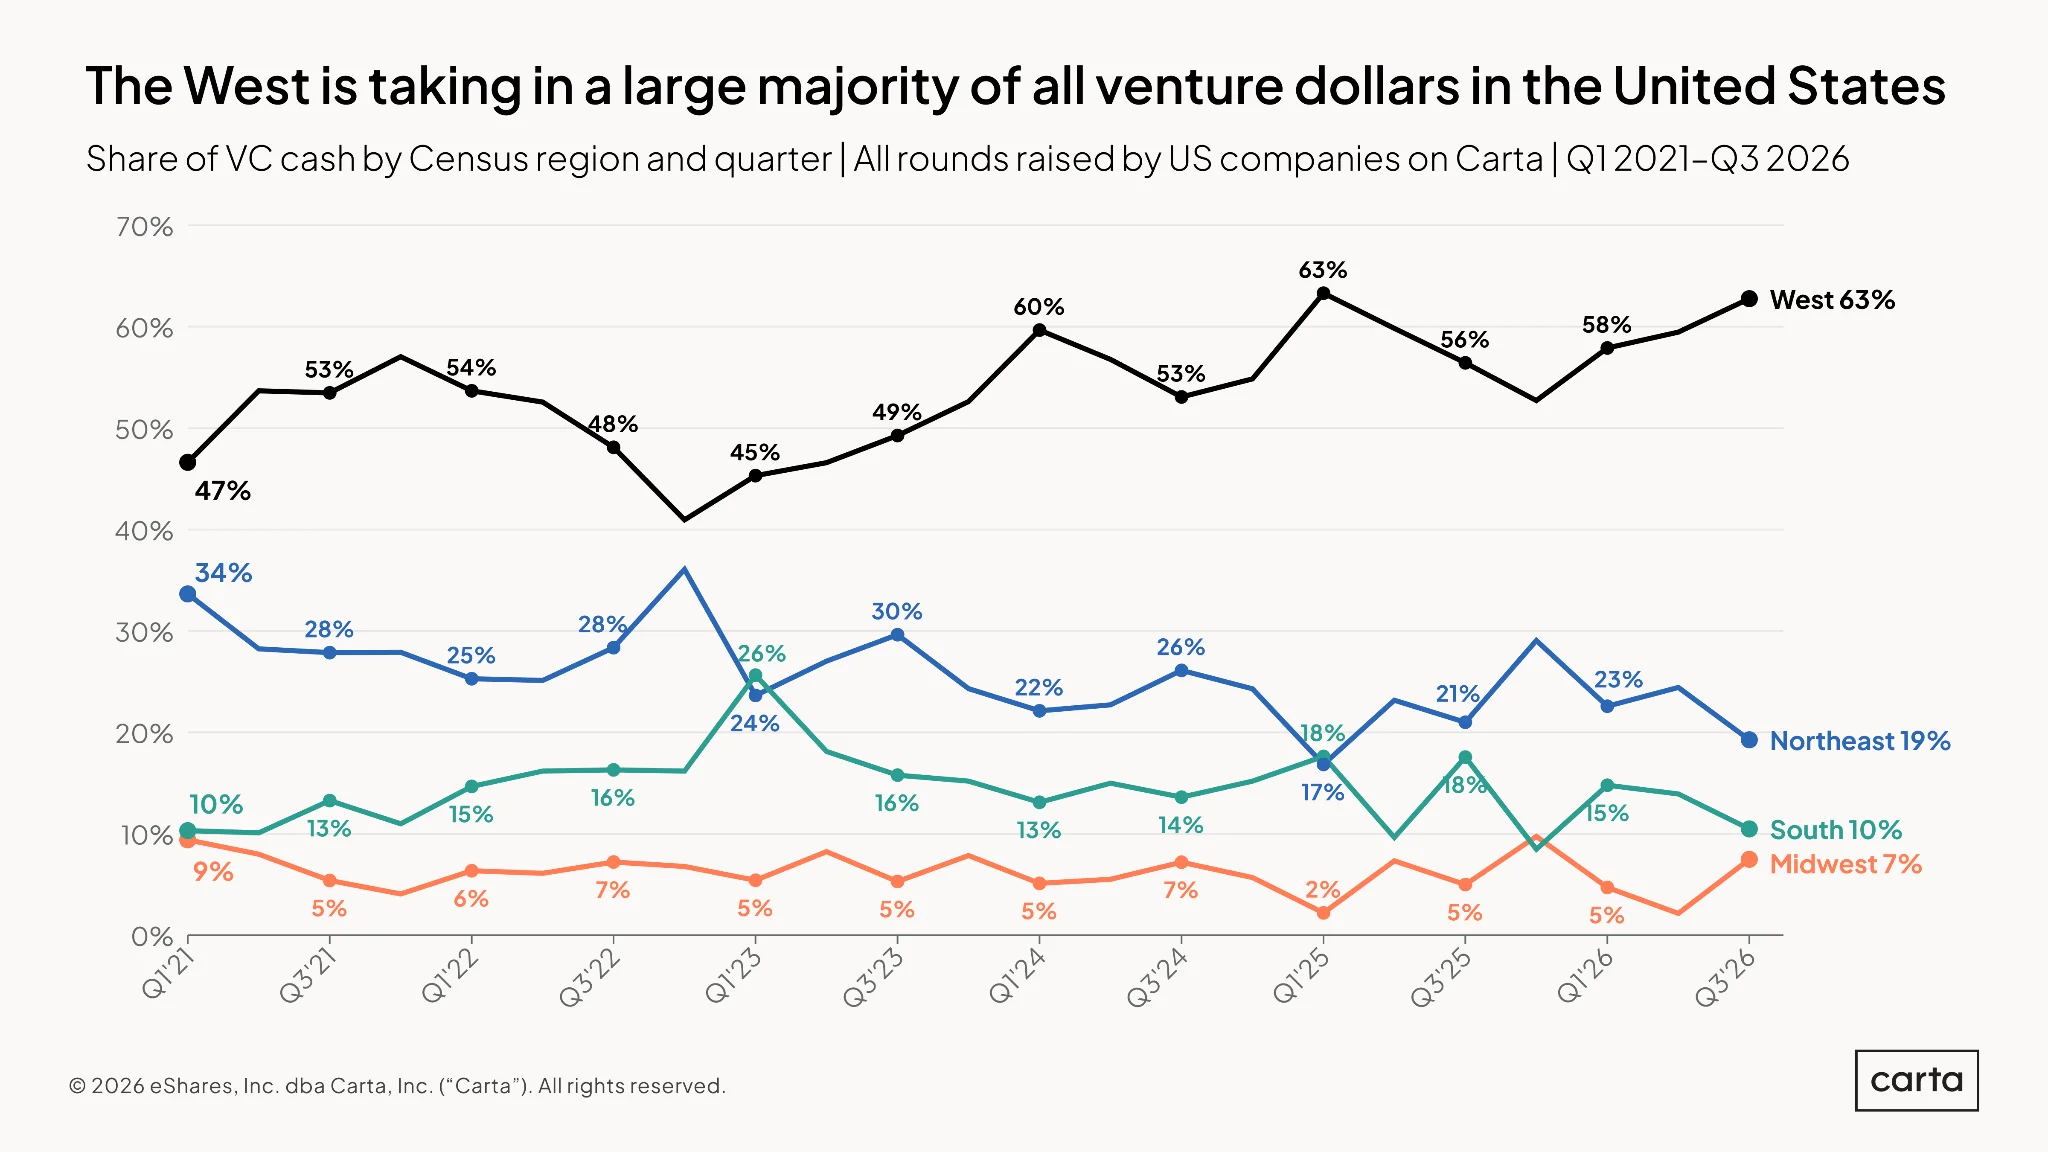
Startups based in the West census region were responsible for 63% of all capital raised on Carta in Q3 2026, matching the highest market share for the West in any quarter on record. More than three times as much cash went to startups in the West as the next best-funded census region, the Northeast, which claimed 19% of capital raised in Q3.
Compared to the start of 2021, two trends in the geographic distribution of VC funding across the U.S. stand out: The West has become even more dominant, gaining 16% market share over this span. And the Northeast has ceded ground, losing 15% market share.
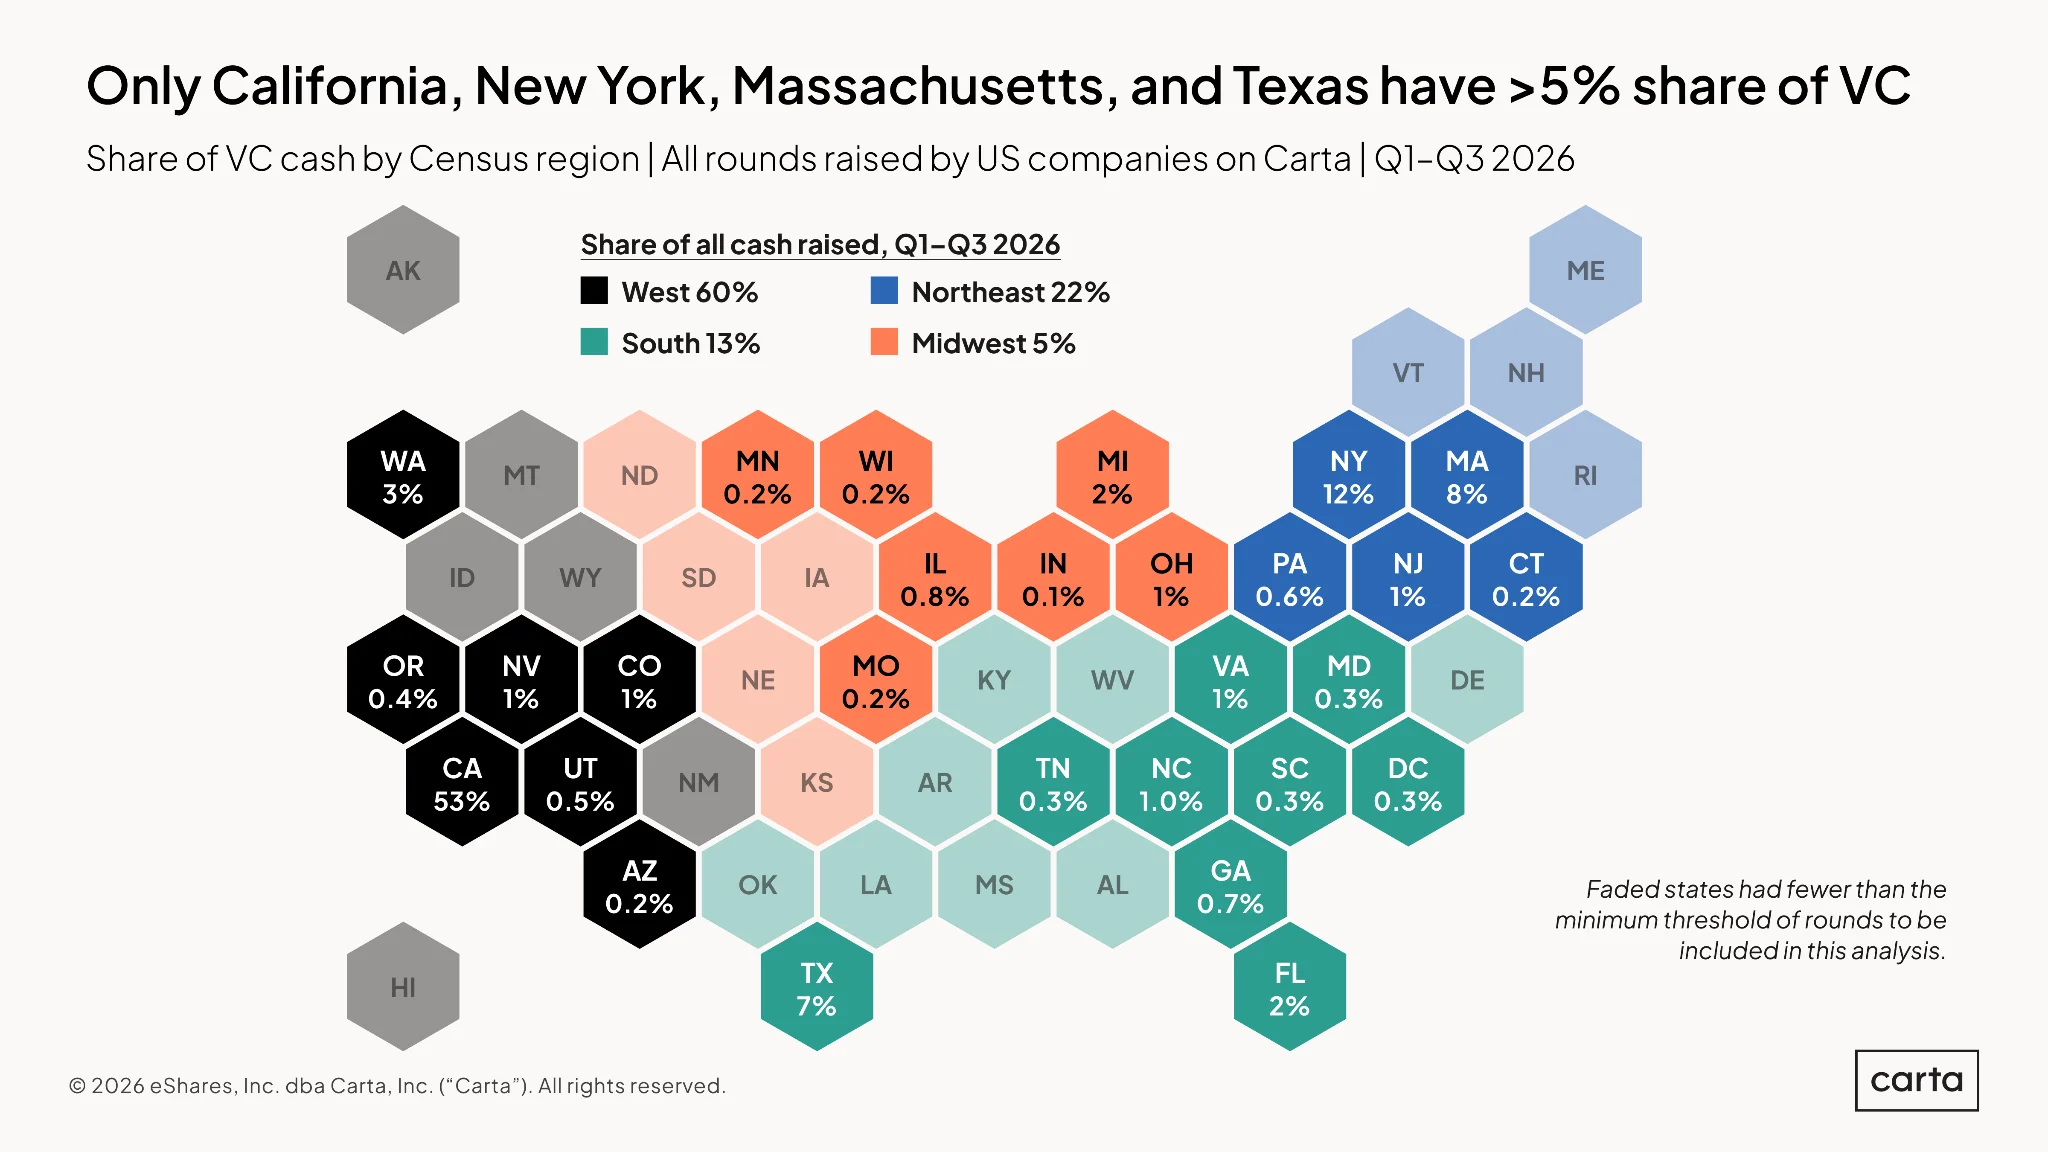
California is home to startups that raised 53% of all VC funding logged on Carta during the first three quarters of 2026, more than four times higher than the market share of New York, the next busiest state. California and New York are the only two states to top 10% of funding so far in 2026. Massachusetts and Texas are the only other two states to top 5%.
Combined, those four states account for about 80 cents of every dollar raised by startups in the U.S. this year. In terms of fundraising activity, there’s a clear divide between this quartet and the rest of the country.
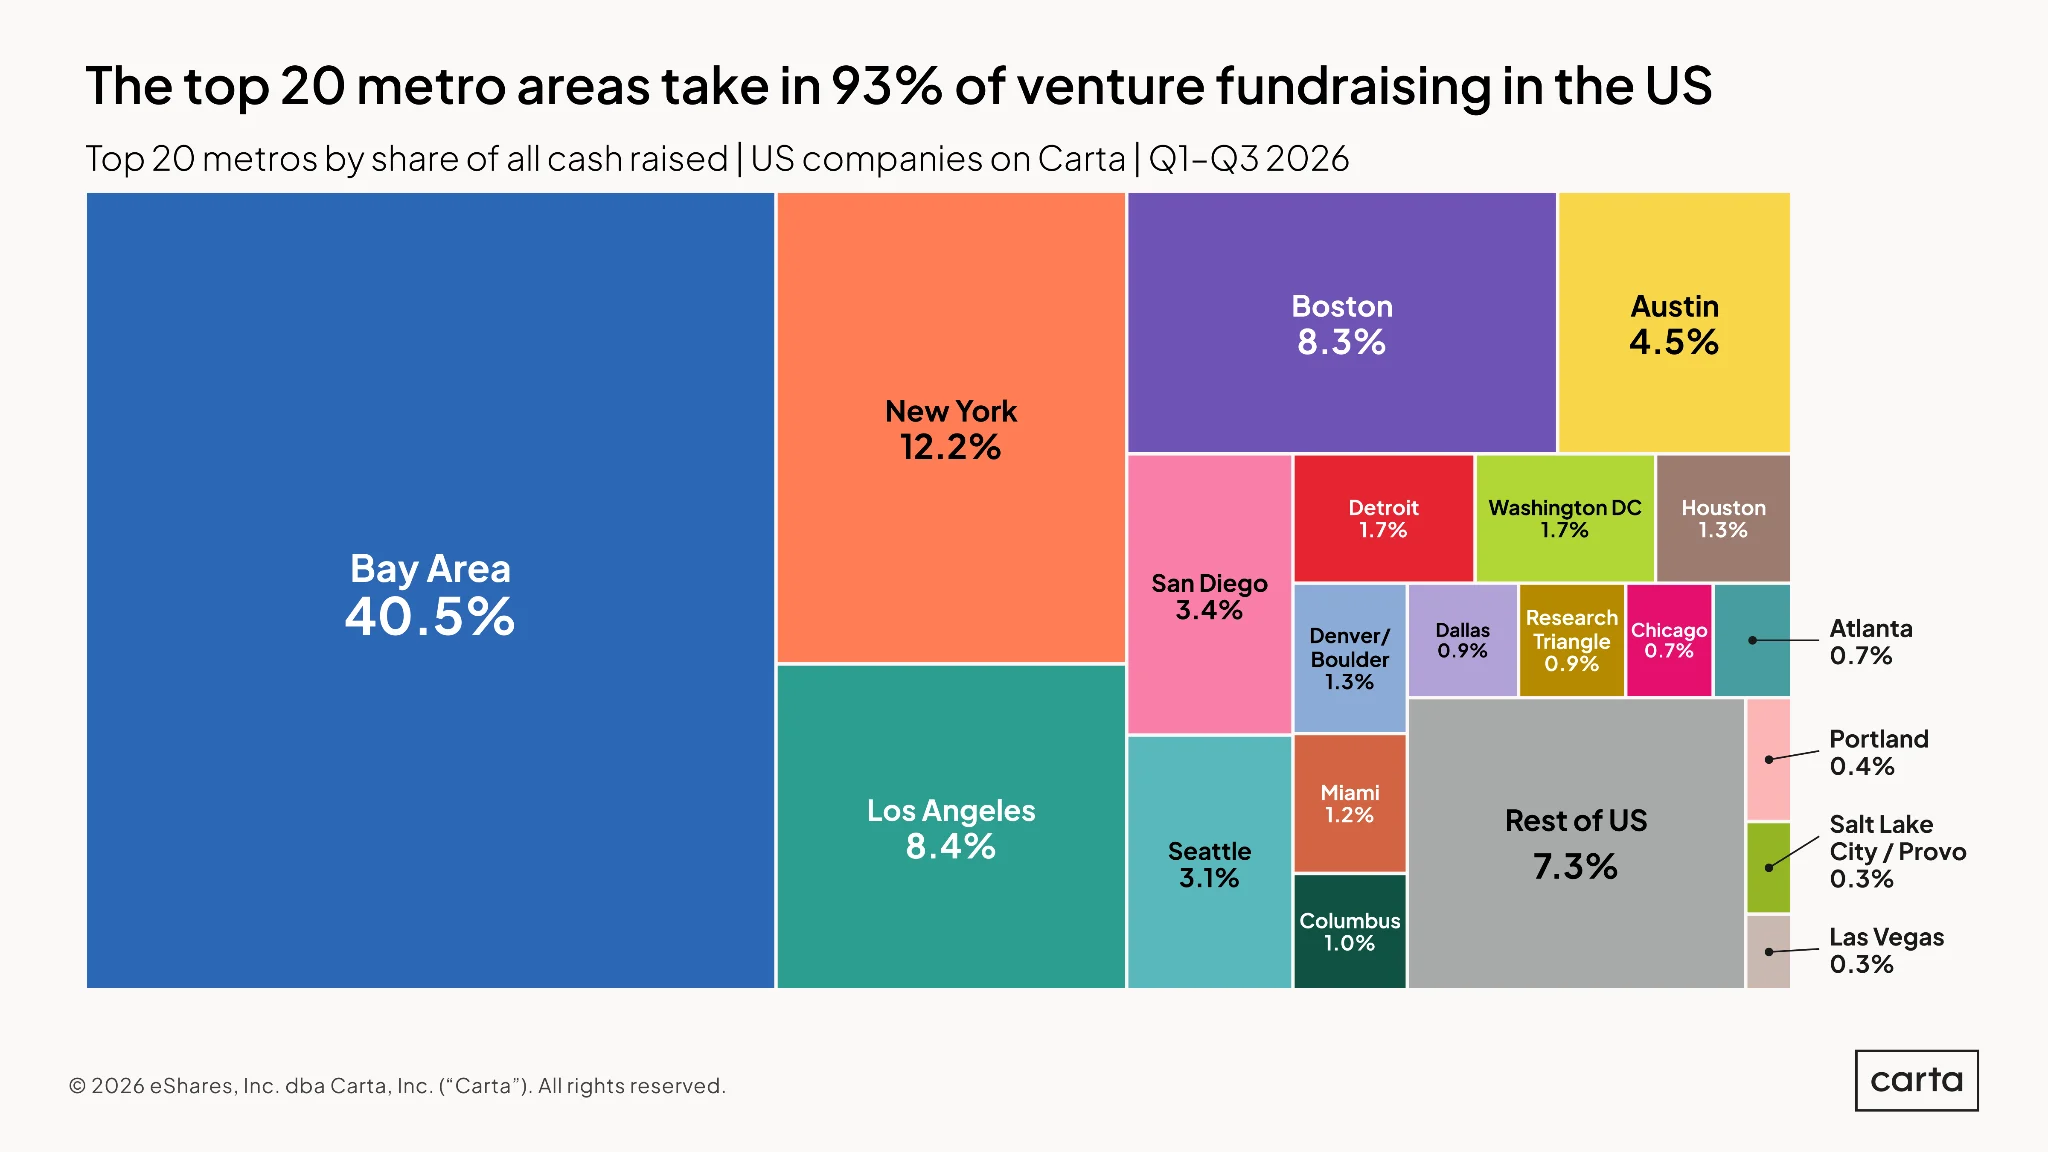
Of course, the primary reason California holds such a dominant position in the U.S. fundraising landscape is that it’s the home of Silicon Valley. Startups based in the Bay Area have claimed more than 40% of all cash raised by companies on Carta so far this year, surpassing the market share of the next six busiest metro areas combined.
Overall, 13 different metros are currently at or above 1% of total cash raised in 2026. This includes familiar startup hubs like New York, Boston, and Seattle. It also includes some more surprising names, such as Detroit and Columbus, Ohio, both of which have surpassed Chicago in the pecking order of Midwest startup ecosystems.
Industry trends
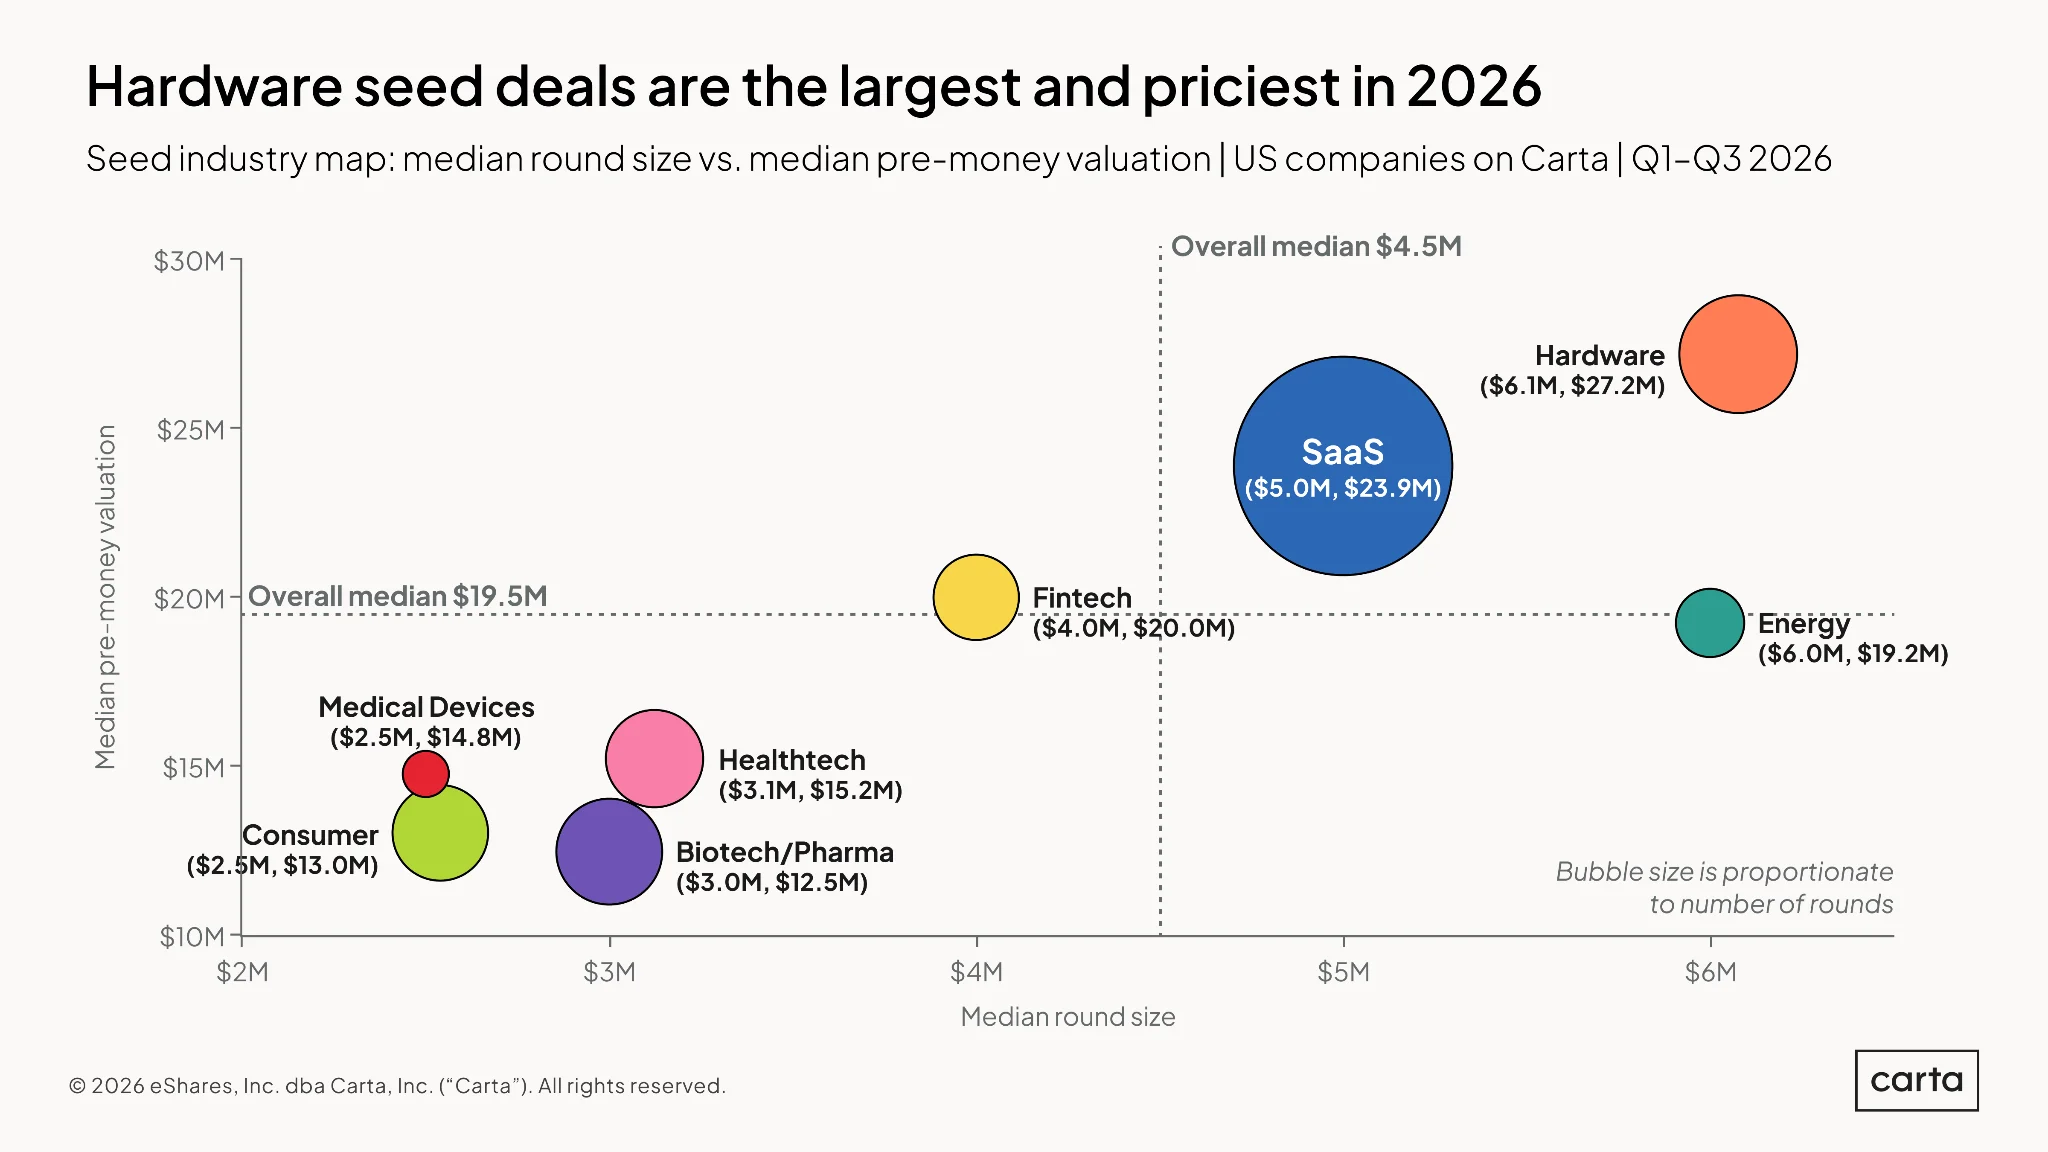
The above chart compares seed-stage deal activity in eight of the most common sectors for startup investment across three key metrics: median round size, median pre-money valuation, and deal count. The first two statistics are shown on the X-axis and Y-axis, respectively, while the size of each circle demonstrates the industry’s relative size.
So far in 2026, the hardware industry is home to both the largest median size of seed rounds ($6.1 million) and the largest median pre-money valuation at the seed stage ($27.2 million). Compared to sectors like consumer and biotech/pharma, the typical seed round in hardware is more than twice as large, and the typical pre-money valuation is more than twice as high.
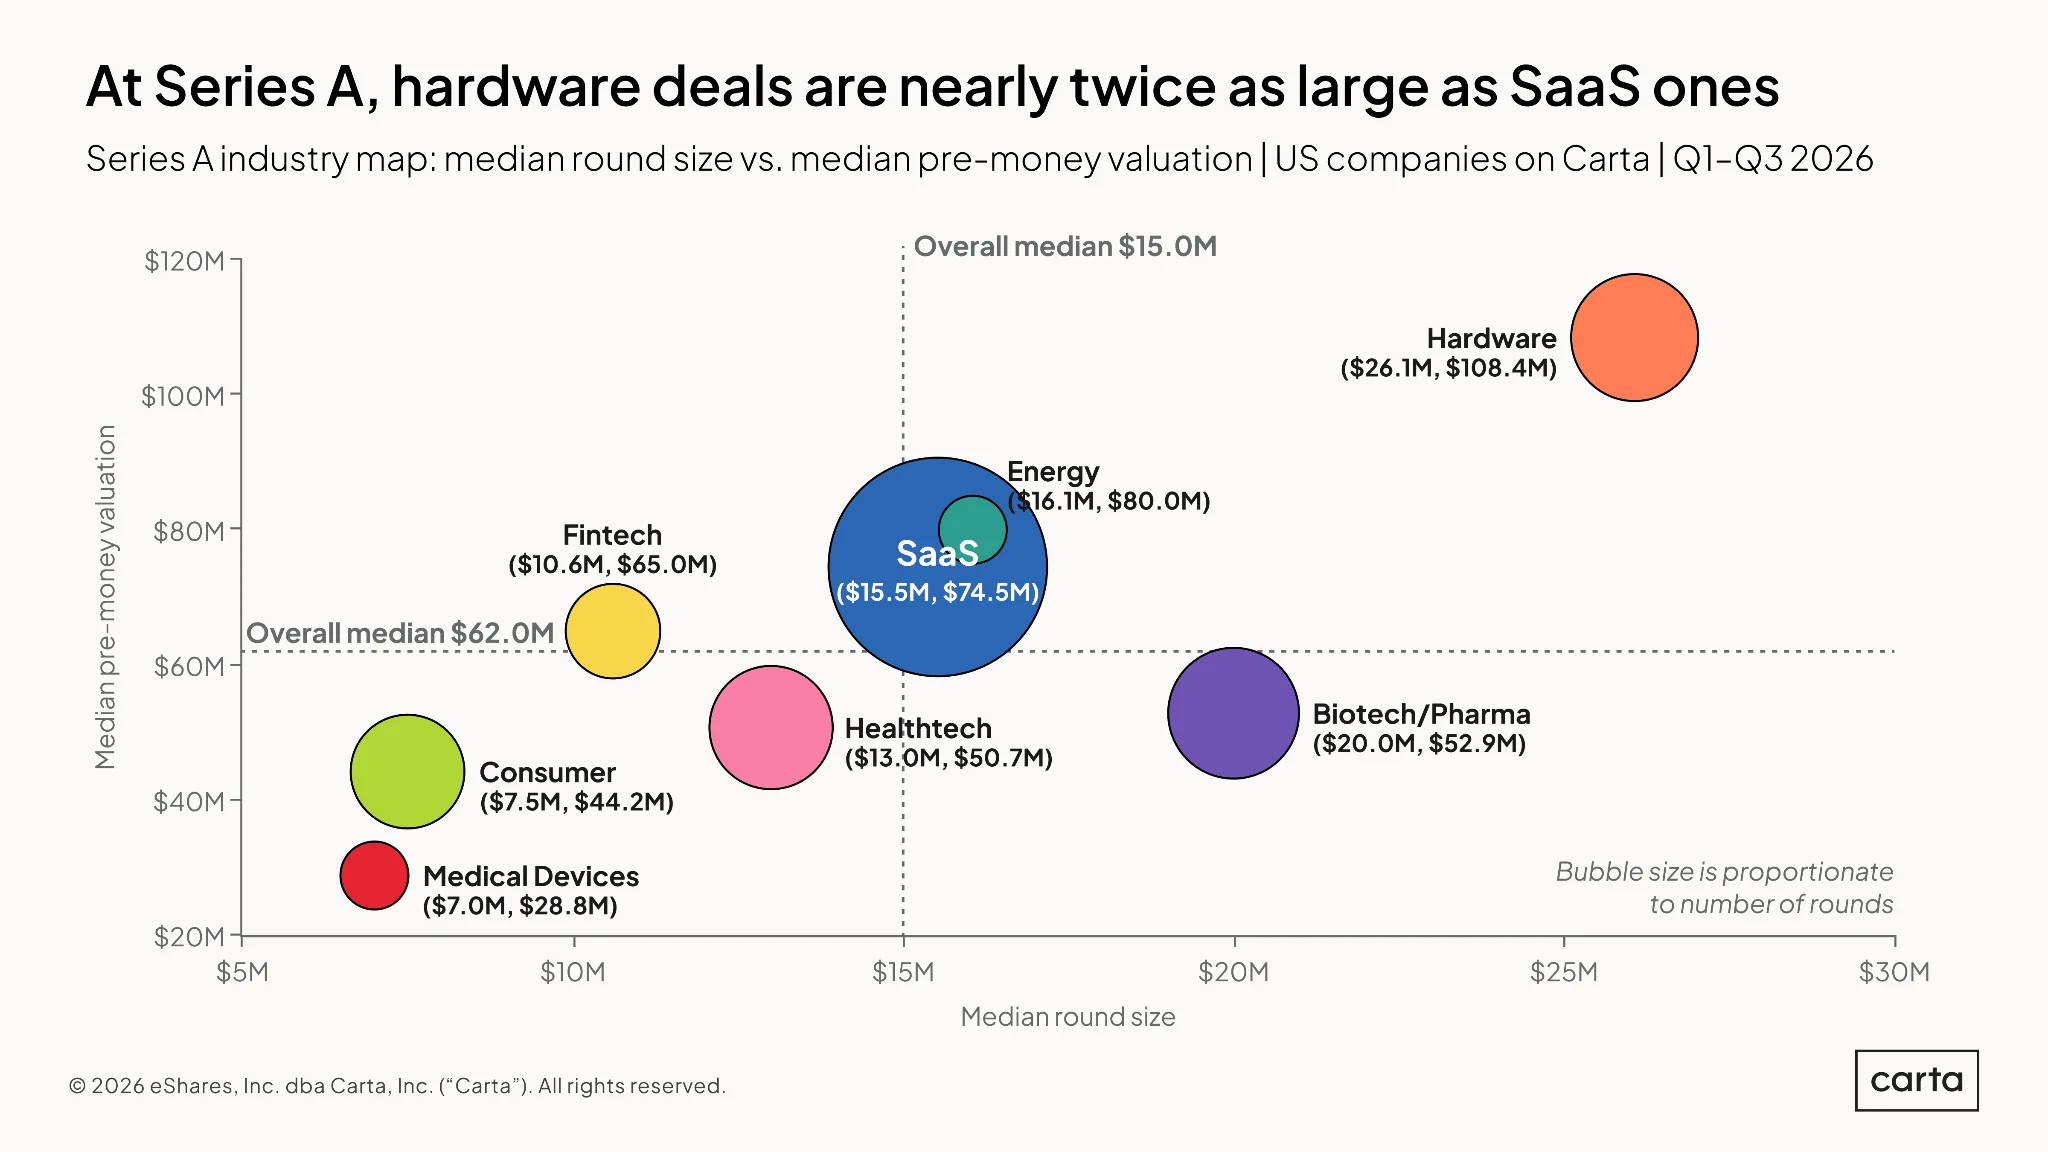
In terms of round sizes and valuations, the gap between hardware and other common startup sectors is even wider at Series A than at seed.
So far this year, the median Series A round size in the hardware space was $26.1 million, and the median pre-money valuation was $108.4 million. That’s more than $6 million larger than the next largest median round size (biotech/pharma, at $20 million), and almost $30 million higher than the next highest valuation (energy, at $80 million). As is the case at seed, the consumer and medical devices industries have the smallest median round sizes and the lowest median valuations among the sectors shown here.
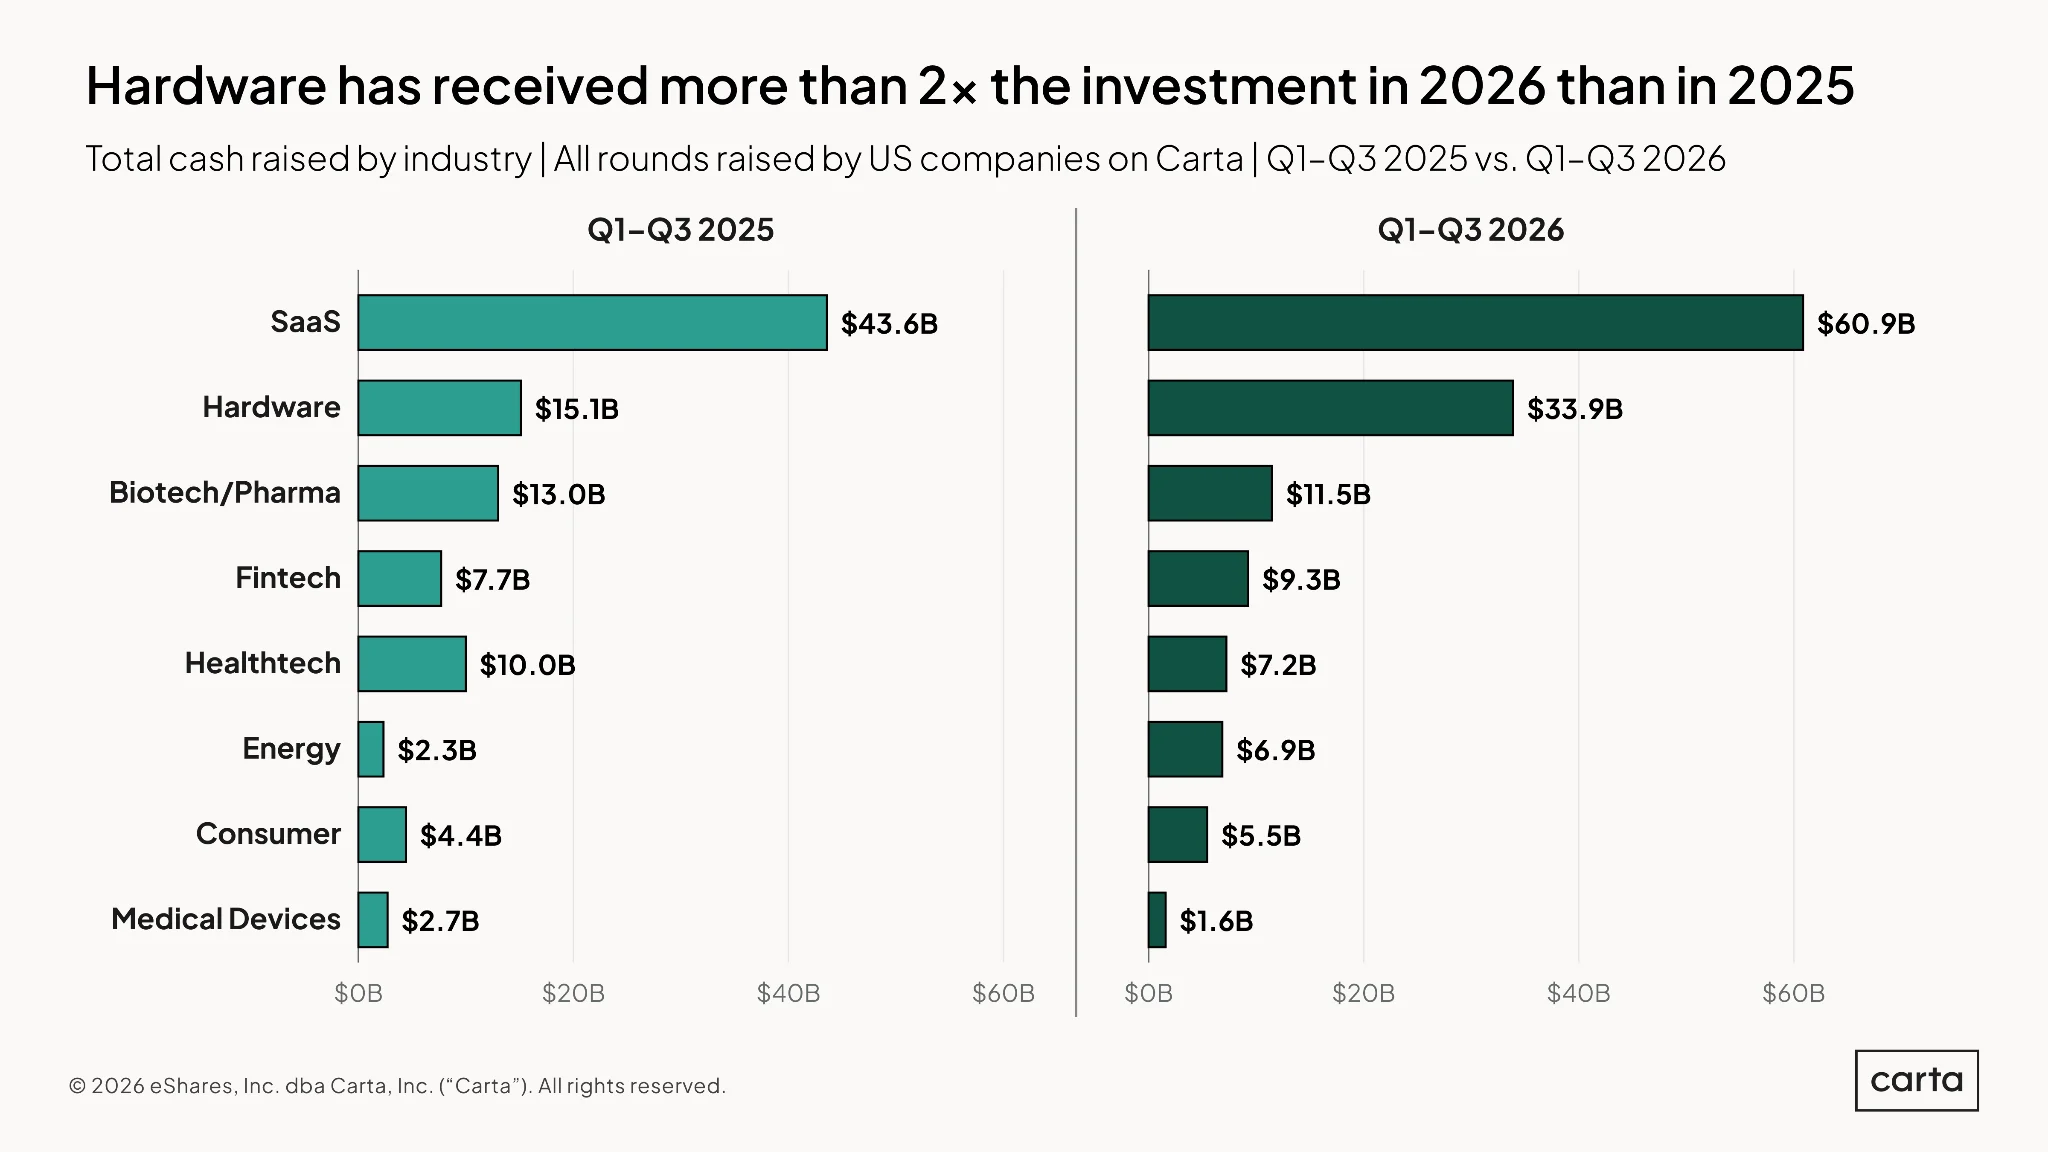
Compared to the same period one year earlier, VC investment in the hardware industry soared by 125% during the first three quarters of 2026. Hardware was already the second most common sector for VC spending, but what was previously a small advantage over the third busiest sector (biotech/pharma) has grown into a gulf.
Other industries where capital invested is on the rise in 2026 include SaaS (up 40% year over year) and energy (up 200%, with that growth coming from a much lower starting point). Meanwhile, the broader healthcare sector has seen an investment pullback: Through the first three quarters of 2026, VC spending was down in each of the biotech/pharma, healthtech, and medical devices industries.
Methodology
Carta helps more than 50,000 primarily venture-backed companies and 1.7 million security holders manage over $4.5 trillion in equity. We share insights from this unmatched dataset about the private markets and venture ecosystem to help founders, employees, and investors make informed decisions and understand market conditions.
Overview
This study uses an aggregated and anonymized sample of Carta customer data. Companies that have contractually requested we not use their data in anonymized and aggregated studies are not included in this analysis.
This report represents a snapshot as of November 1, 2026. Historical data may change in future studies because there is typically an administrative lag between the time a transaction took place and when it is recorded in Carta. In addition, new companies signing up for Carta’s services will increase historical data available for the report.
Financings
Financings include equity deals raised in USD by U.S.-based corporations. The financing “series” (for example, Series A) is taken from the share class name in the applicable certificate or articles of incorporation. Financing rounds that don’t follow this standard are not included in any data shown by series, but are included in data not shown by series. Primary rounds are defined as the first equity round within a series. Bridge rounds are defined as any round raised after the first round in a given series.
In some cases, convertible notes are raised and converted at various discounted prices within a series (for example, Series A-1, Series A-2, Series A-3). In these cases, converted securities are not included in cash raised, and only the post-money valuation of the new money is included.


DISCLOSURE: This communication is on behalf of eShares, Inc. dba Carta, Inc. ("Carta"). This communication is for informational purposes only, and contains general information only. Carta is not, by means of this communication, rendering accounting, business, financial, investment, legal, tax, or other professional advice or services. This publication is not a substitute for such professional advice or services nor should it be used as a basis for any decision or action that may affect your business or interests. Before making any decision or taking any action that may affect your business or interests, you should consult a qualified professional advisor. This communication is not intended as a recommendation, offer or solicitation for the purchase or sale of any security. Carta does not assume any liability for reliance on the information provided herein. © 2026 Carta. All rights reserved. Reproduction prohibited.