Across the U.S., startups on Carta combined to raise $3.19 billion in new funding across 11,546 transactions in Q2 2026. This continued a recent trend of rising concentration in the pre-seed market. The quarterly totals for cash raised remain similar, but that capital is now spread across a declining number of deals.
In Q2 2025, the average pre-seed round size on Carta was about $217,000, per Carta’s latest State of Pre-Seed report. By Q2 2026, that figure had climbed to about $276,000, a year-over-year increase of 27%.
Geographically speaking, where are all those dollars going? The answer has shifted over the course of the past year. From Q2 2025 to Q2 2026, some significant differences emerged in the map of the pre-seed market, with certain states, cities, and regions rising up the fundraising ranks and others falling back to the pack.
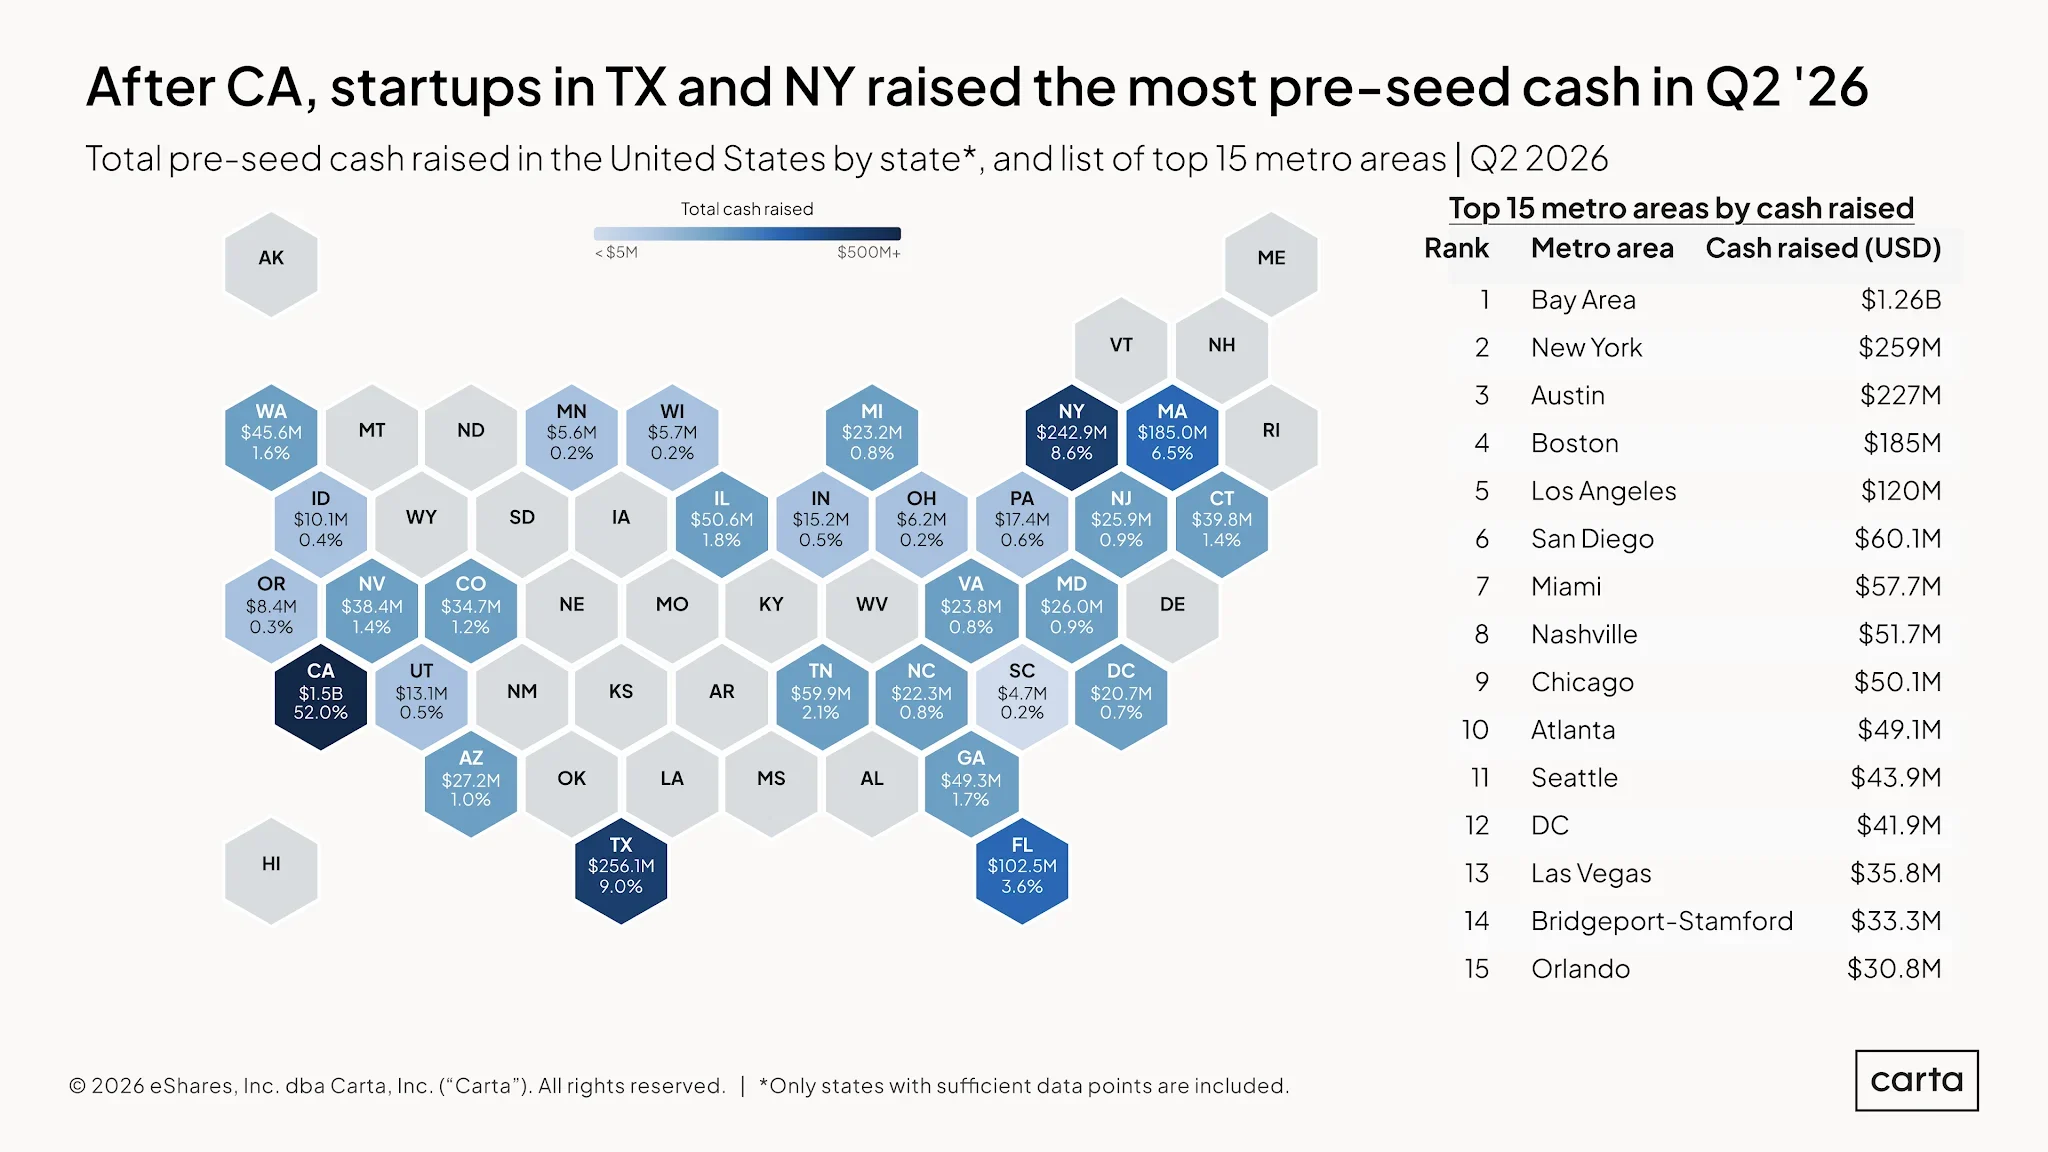
Here’s the latest version, showing how pre-seed fundraising was distributed across the U.S. during Q2 2026:
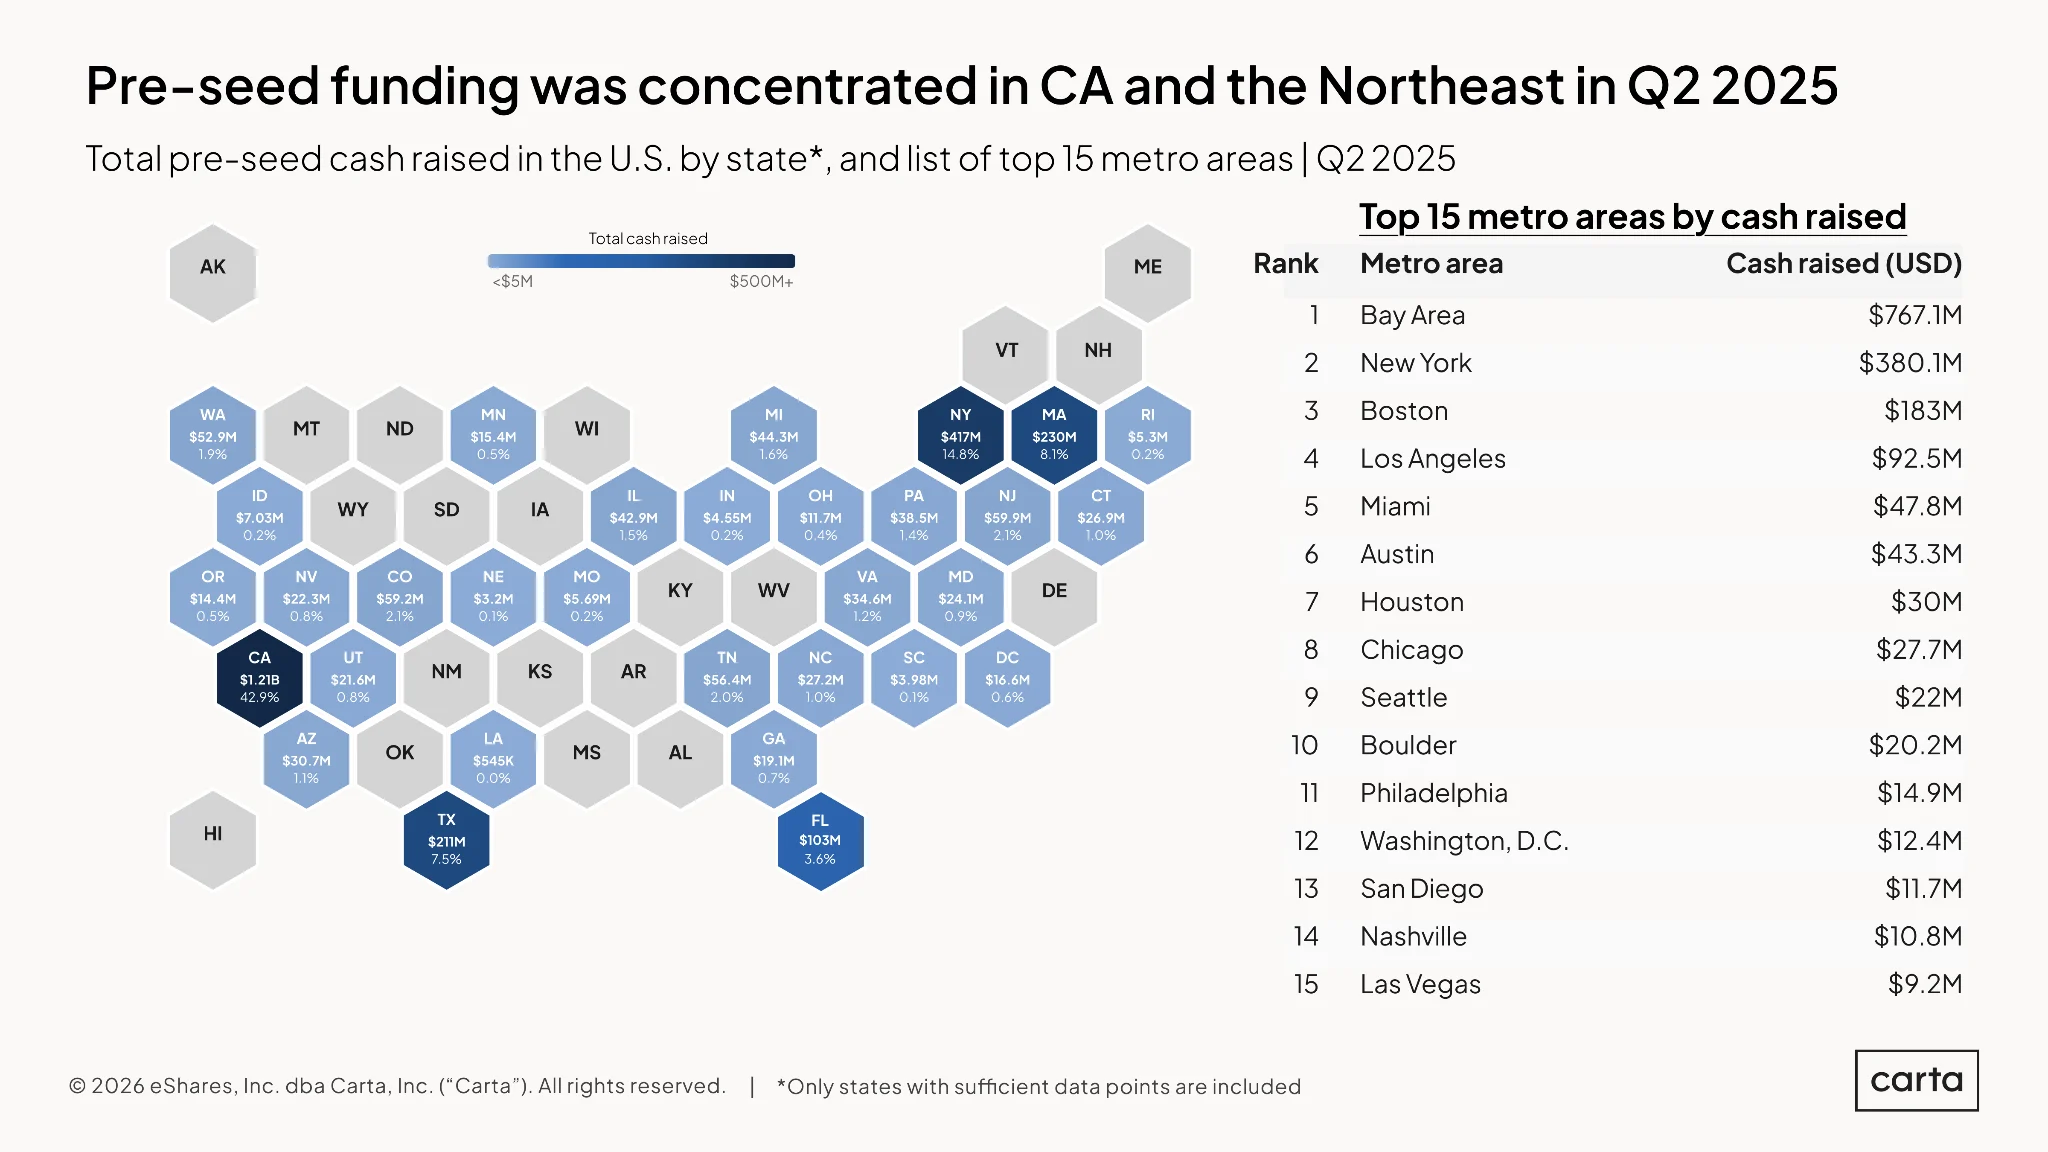
And here’s the map of pre-seed funding from one year earlier, in Q2 2025:
How has this map changed from what it looked like a year earlier? Here are six of the most notable shifts:
1. California tops 50% of funding
Startups based in California collected 52% of all pre-seed capital raised on Carta during Q2 2026, up from 42.9% during the previous Q2. California was already by far the busiest state in the U.S. for pre-seed fundraising, but it has consolidated its lead over the rest of the country.
And it isn’t just about percentages—pre-seed funding in California is climbing on a raw basis, too. Startups in the state raised $1.5 billion in pre-seed funding in Q2 2026, compared to $1.2 billion in Q2 2025.
Part of this uptick is surely due to the Bay Area’s role as the center of the U.S. AI industry, which continues to draw massive amounts of venture funding. The Bay Area alone was responsible for $1.26 billion in pre-seed funding in Q2 2026. That’s a 64% year-over-year increase, and it accounts for more than 80% of California’s total pre-seed funding in Q2 2026.
2. New York’s market share shrinks
While California experienced the biggest year-over-year increase in its share of pre-seed funding, New York saw the largest dip. New York-based startups on Carta combined to raise $242.9 million in pre-seed capital during Q2 2026, good for 8.6% of the national total. A year earlier, the Empire State accounted for $417 million in pre-seed funding, or 14.8% of total cash raised.
With this decline, New York ceded its previous position as the second-busiest state in the U.S. for pre-seed investment. That honor now resides with Texas, which claimed a 9% share of the U.S. market during Q2 2026.
3. Austin reigns in Texas
The rise of Texas as a pre-seed hub has been driven in no small part by a surge of investment in the state capital. In Austin, startups combined to raise $227 million in pre-seed funding during Q2 2026, the third-highest sum for any metro area in the U.S. over that three-month stretch.
Austin was already a busy pre-seed market, but this year represents a significant acceleration. In Q2 2025, startups in the area brought in a collective $43.3 million, good for sixth place among all metros in the U.S.—nothing to sniff at. By Q2 2026, however, that figure had risen by more than 400%.
In the process, Austin has pulled far ahead of its Lone Star competition. Back in Q2 2025, the Houston metro area ranked seventh in the nation for pre-seed fundraising, just one spot behind Austin. This year, as Austin climbed up to third place, Houston dropped out of the top 15.
4. San Diego surges to $60 million
If not for Austin, San Diego would have made the largest leap of any metro area between Q2 2025 and Q2 2026. In the former quarter, San Diego-based startups combined to raise about $11.7 million in pre-seed funding. In Q2 2026, that figure jumped to $60.1 million, good for a 414% year-over-year increase. Over the same span, the metro area jumped from 13th on the national pre-seed leaderboard to sixth.
While the Bay Area may be the leading light of California’s startup market, it’s far from the only stronghold. Between San Diego’s recent spike in activity and the steady presence of Los Angeles, California claimed three of the top six metro areas in the U.S. for pre-seed funding in Q2 2026.
5. Southern strength continues
The fastest-growing region in the U.S. in terms of population is also making gains in the pre-seed market. The states of Florida, Georgia, North Carolina, Tennessee, Texas, and Virginia combined to raise about 16% of all pre-seed funding in the U.S. during Q2 2025. A year later, that market share climbed to 18%, led by the aforementioned increase of activity in Texas.
But each of the other states named here play a role, too, with all six claiming at least $20 million in pre-seed cash raised in Q2 2026. Florida ranked fifth among all states in pre-seed fundraising during the quarter, three spots behind Texas, while Tennessee landed in eighth place.
6. The Northeast recedes
California and the Southeast have both seen their share of pre-seed funding grow. So, where did the corresponding declines in market share occur? The most notable answer is the Northeast.
The states of Connecticut, Massachusetts, New Jersey, New York, and Pennsylvania saw their combined share of pre-seed funding drop from 27.4% in Q2 2025 to just 18% in Q2 2026, easily the largest dropoff among the four U.S. census regions (the West, Midwest, South, and Northeast). The decline in activity in New York (see No. 2 on this list) is one major reason for this reduction in market share, but it’s not the only one. Massachusetts also saw its proportion of pre-seed funding decline year over year, going from 8.1% to 6.5%. And so did Pennsylvania, which went from 1.4% of pre-seed funding in Q2 2025 to just 0.6% in Q2 2026.
Subscribe to the Data Minute newsletter

DISCLOSURE: This communication is on behalf of eShares, Inc. dba Carta, Inc. ("Carta"). This communication is for informational purposes only, and contains general information only. Carta is not, by means of this communication, rendering accounting, business, financial, investment, legal, tax, or other professional advice or services. This publication is not a substitute for such professional advice or services nor should it be used as a basis for any decision or action that may affect your business or interests. Before making any decision or taking any action that may affect your business or interests, you should consult a qualified professional advisor. This communication is not intended as a recommendation, offer or solicitation for the purchase or sale of any security. Carta does not assume any liability for reliance on the information provided herein. © 2026 Carta. All rights reserved. Reproduction prohibited.