Executive summary
In terms of pure dollars and cents, the venture fundraising landscape of 2024 was a tale of two markets.
In the early-stage market, fundraising activity pulled back slightly from the year before, even as median valuations ticked up. Seed-stage startups on Carta raised 12.5% less capital in 2024 than they did in 2023. At Series A, capital raised decreased by 6.7%.
In the middle- and late-stage markets, on the other hand, 2024 was a year of recovery. Capital invested at Series B rose by 17.3% last year. Series C startups raised 41.8% more capital than the year before, while Series D saw a 78.8% spike.
Back in 2022 and 2023, these more-mature companies felt the sharpest pains from the post-pandemic slowdown in fundraising activity. In 2024, they experienced what could be the beginnings of a resurgence.
And if we take the market as a whole, the impact of this resurgence is clear. Across all stages, startups on Carta combined to raise $89 billion in new funding in 2024, an 18.4% increase from 2023.
Q4 highlights
Seed valuations rose to new highs: The median pre-money valuation across both primary and bridge rounds at the seed stage climbed to $16 million in Q4, the highest quarterly figure dating back to at least 2016. Competition among investors to gain access to the most appealing early-stage investments remains fierce.
Dilution declined at most stages: The median dilution level on new funding rounds decreased in Q4 at every major fundraising stage except for seed, where it held steady. At some stages, the landscape has changed considerably: Median dilution on Series B rounds was 15% in Q4, compared to 18.6% a year earlier.
Startup M&A became more common: Startups on Carta were the target in 642 M&A transactions during 2024, the highest annual total of the past six years. Amid a slower exit environment, some companies are still finding ways to generate liquidity for their shareholders.
Note: If you’re looking for all the charts in PDF form, download the report here.
Key trends
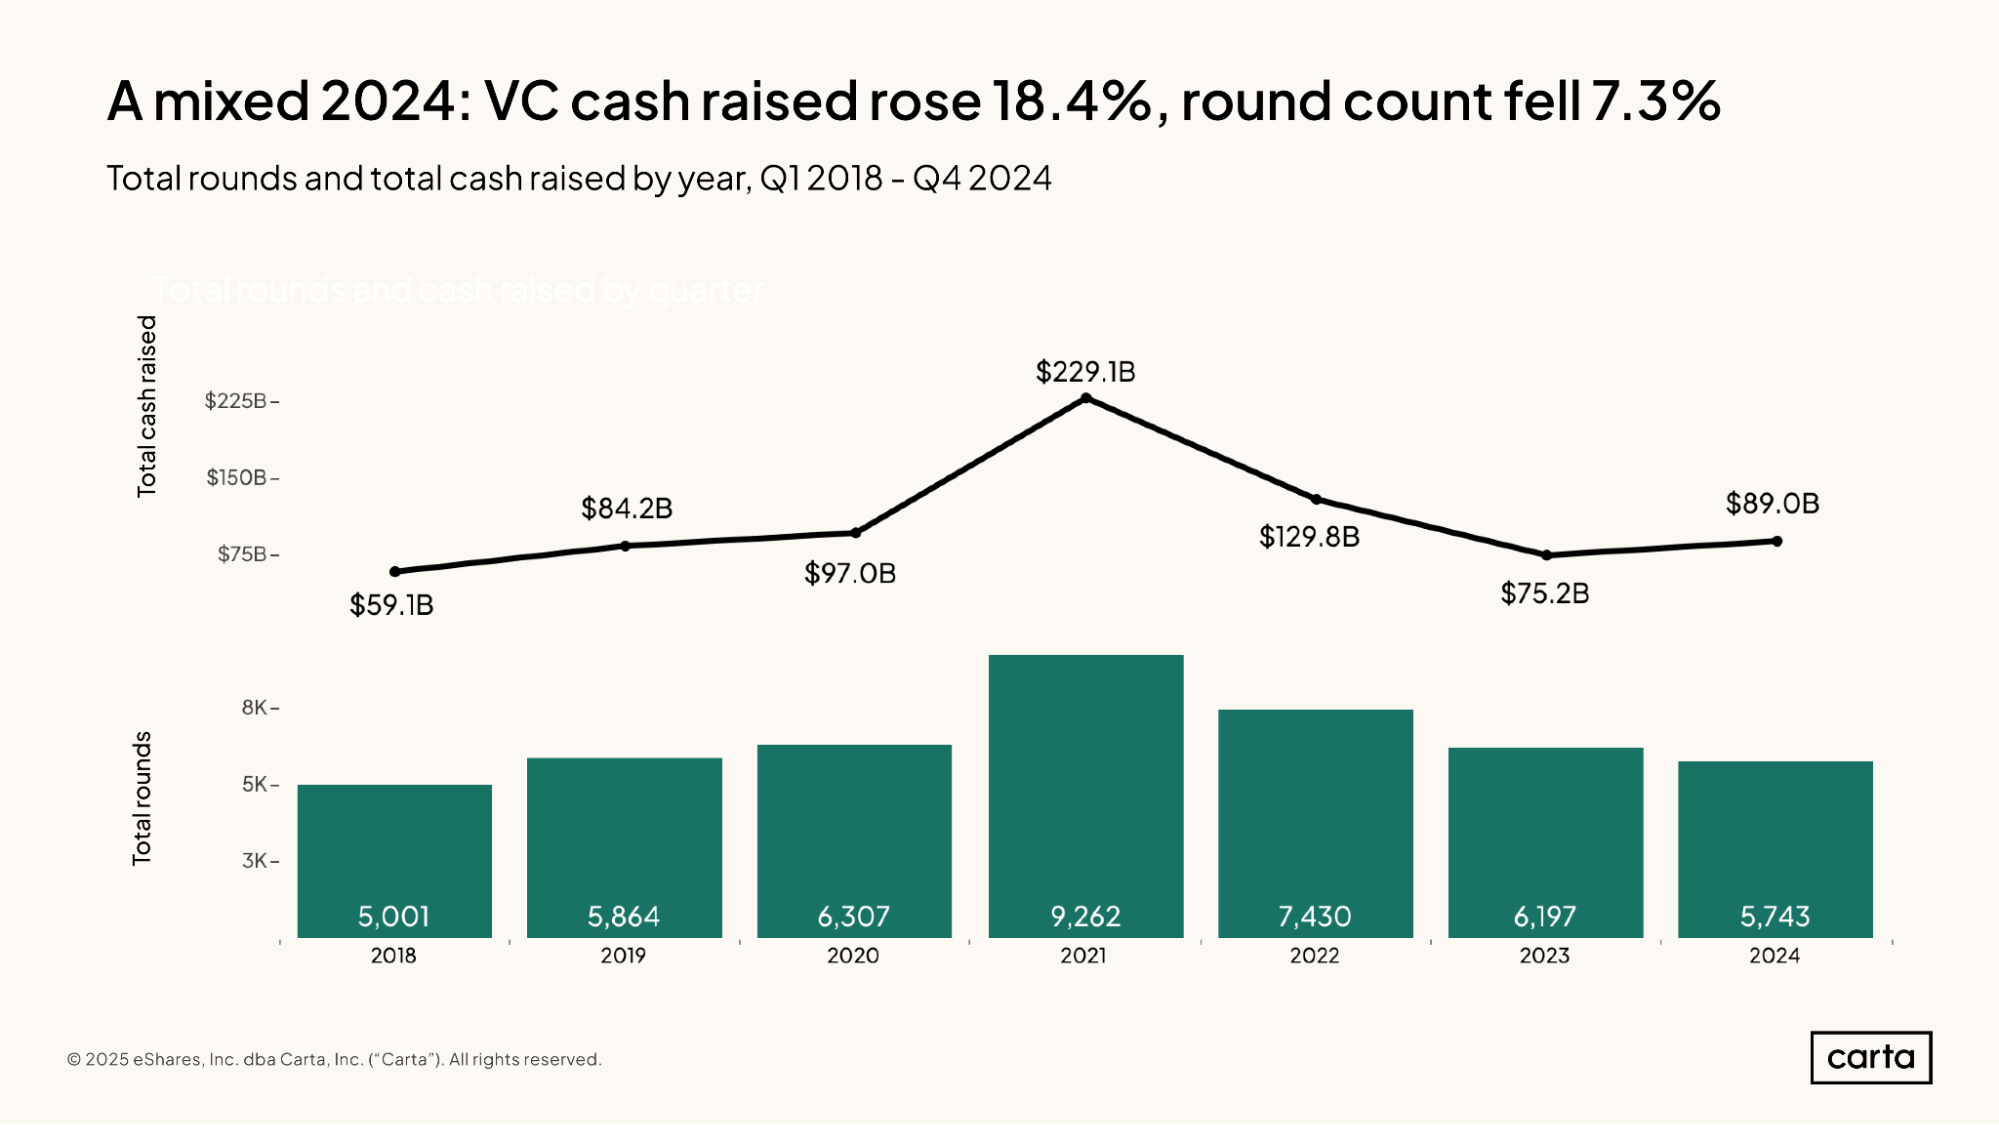
Startups on Carta raised 18.4% more capital in 2024 than in 2023, and they did so on 7.3% fewer total rounds. This combination of more cash on fewer transactions means that the average venture round size got bigger: $15.5 million last year, compared to $12.1 million the year prior.
While this average isn’t indicative of a typical round size at any one stage, it does demonstrate that larger funding events are once again growing more common across VC as a whole. This is particularly true in AI, where startups continue to raise tens or sometimes hundreds of millions of dollars to invest into building their bespoke models and other cutting-edge technologies.
Total round count and dollars raised will likely increase in the weeks to come, as startups continue to log recent transactions on Carta. For now, however, fundraising totals from 2024 look quite similar to the final numbers from 2019, in terms of both deal count and cash raised.
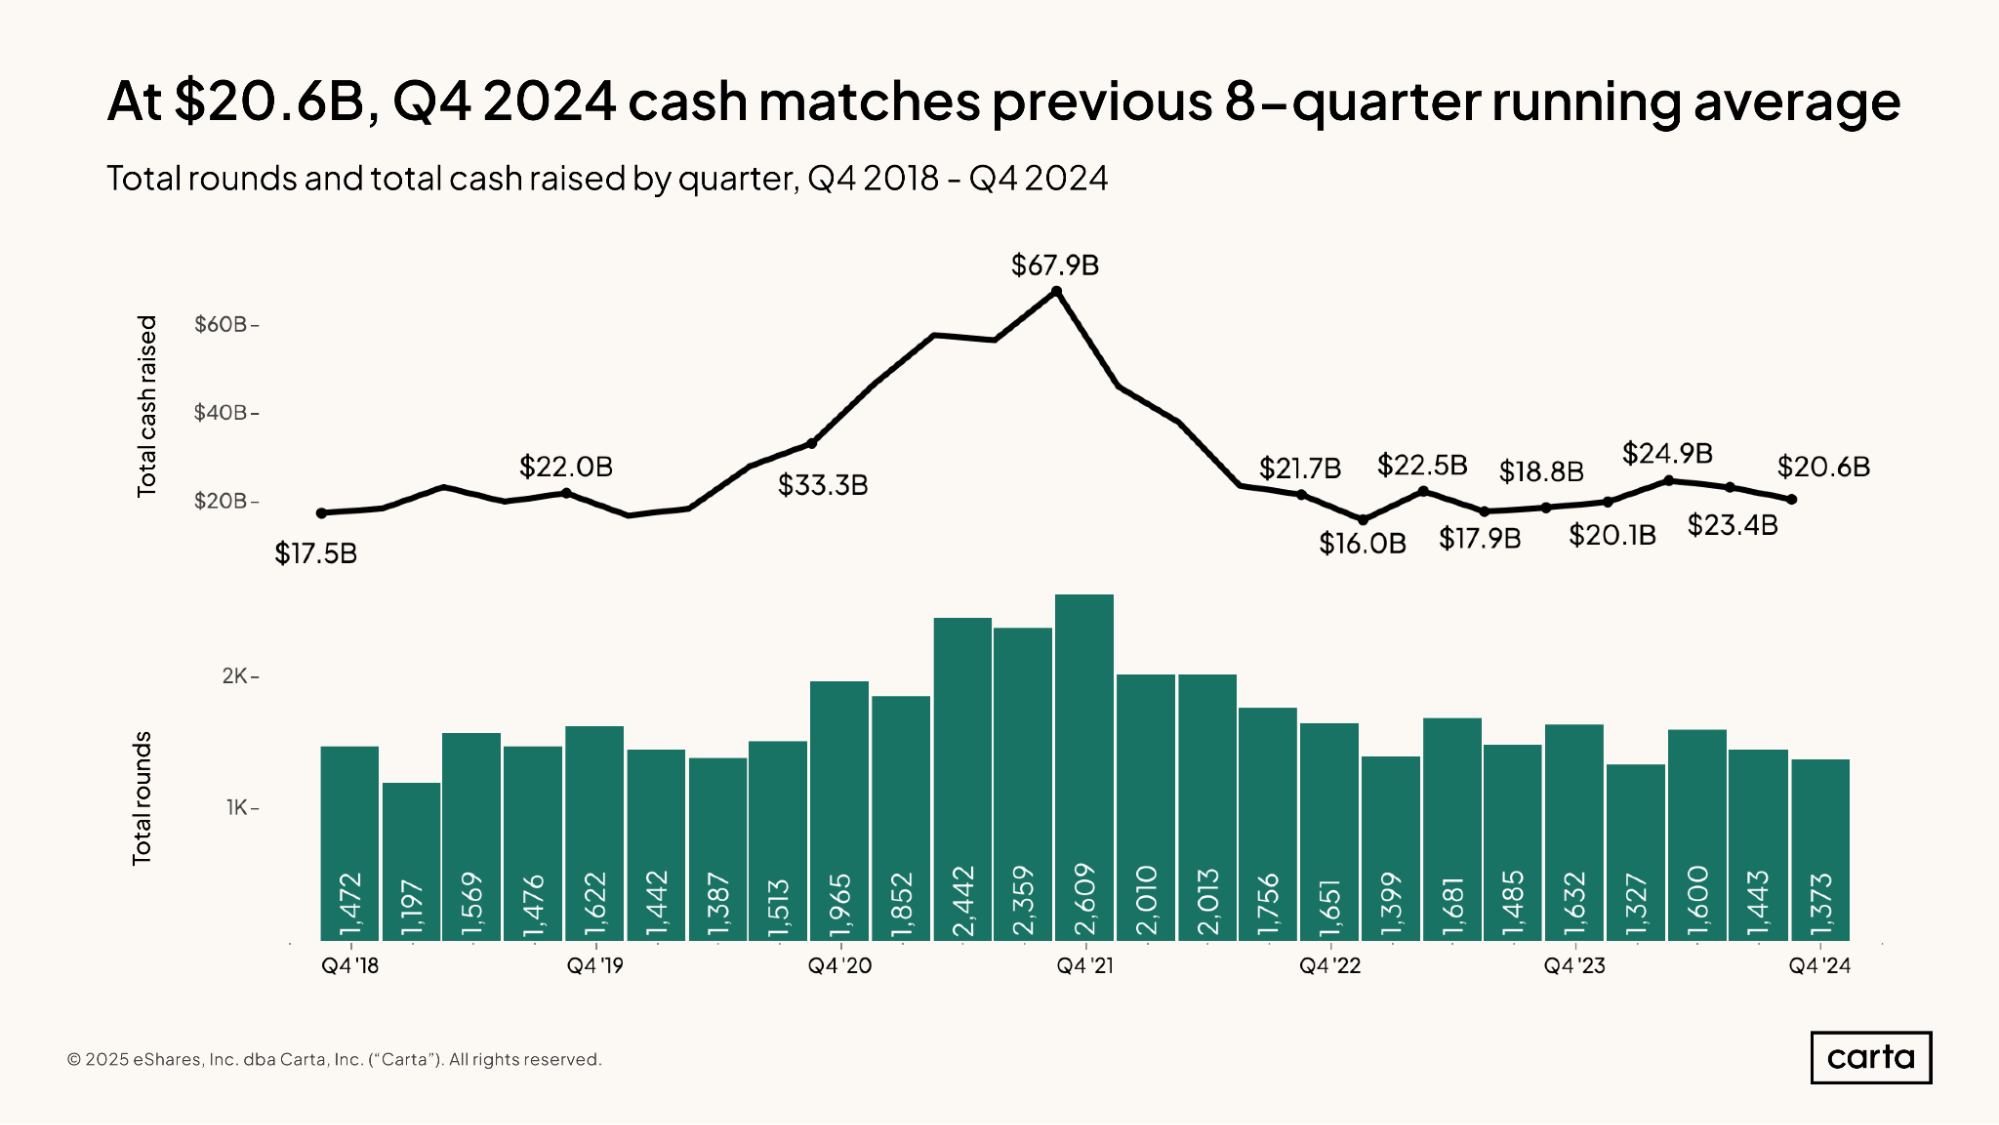
New capital raised by startups on Carta declined slightly in Q4 compared to Q3 and Q2. Yet last quarter remained well in line with recent history. The combined quarterly total for dollars raised on Carta has now landed somewhere between $16 billion and $24.9 billion in nine consecutive quarters, with Q4’s sum of $20.6 billion falling almost exactly in the middle.
Last quarter’s total round count of 1,373 was also down slightly from the previous two quarters, but again, it was not far off historical norms. From Q4 2020 through Q3 2022, there were more than 1,700 venture rounds on Carta in seven straight quarters. Aside from that pandemic bull run, the quarterly round count has landed somewhere between 1,300 and 1,700 new rounds in 16 of the past 17 quarters.
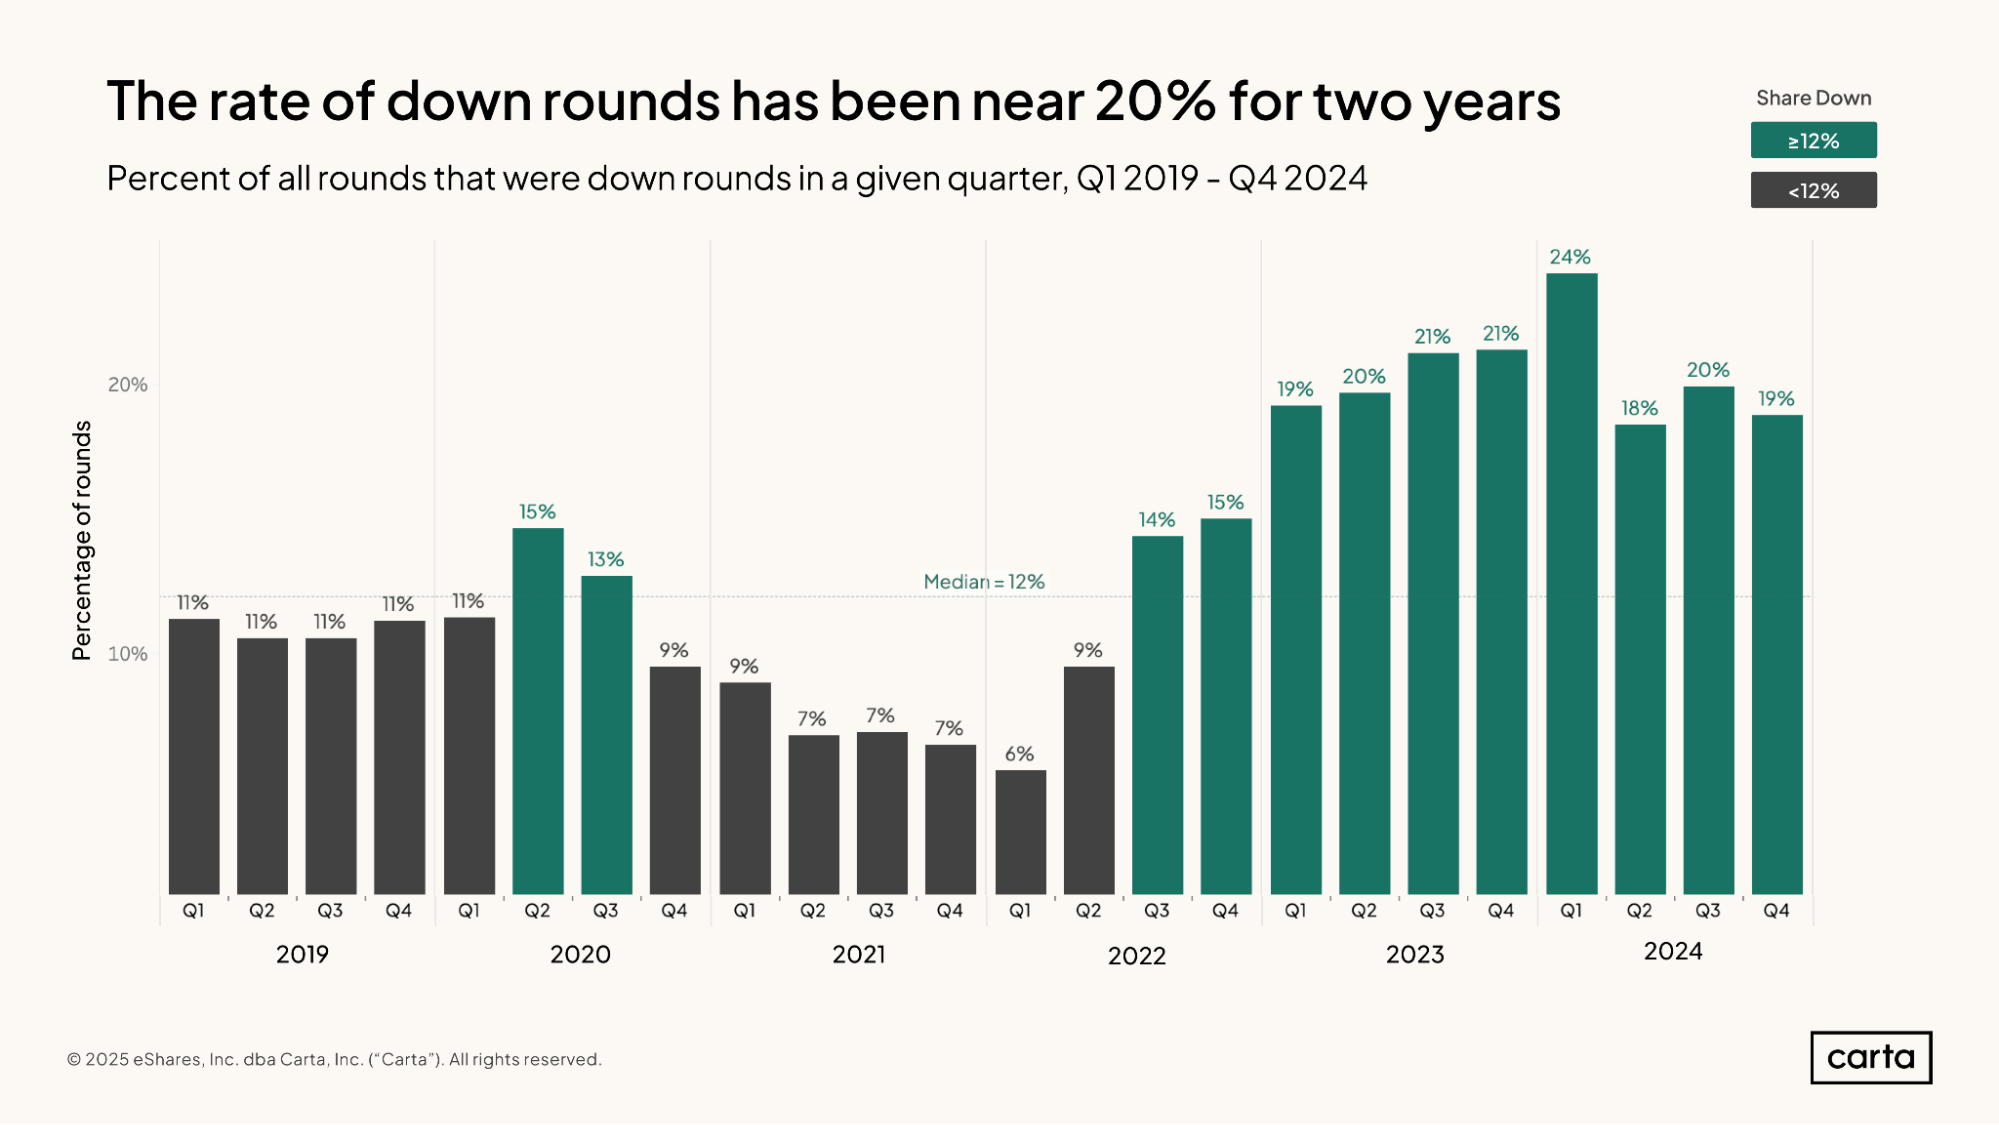
In most cases, when a startup raises a new round of venture funding, its valuation goes up. Over the past two years, however, raising capital at a decreased valuation—what’s known as a down round—has become more common. In Q4, 19% of all new investments on Carta were down rounds, roughly in line with figures over the past two years.
This increase in the proportion of down rounds is largely a function of the reset in venture-backed valuations that began in 2022. Many of the companies that raised capital in 2024 had raised their previous round in a pre-2022 environment, when VCs tended to be more optimistic in determining startup valuations. Faced with a more skeptical fundraising environment, some of these companies have had little choice but to accept a reduced valuation if they want to bring in new capital.
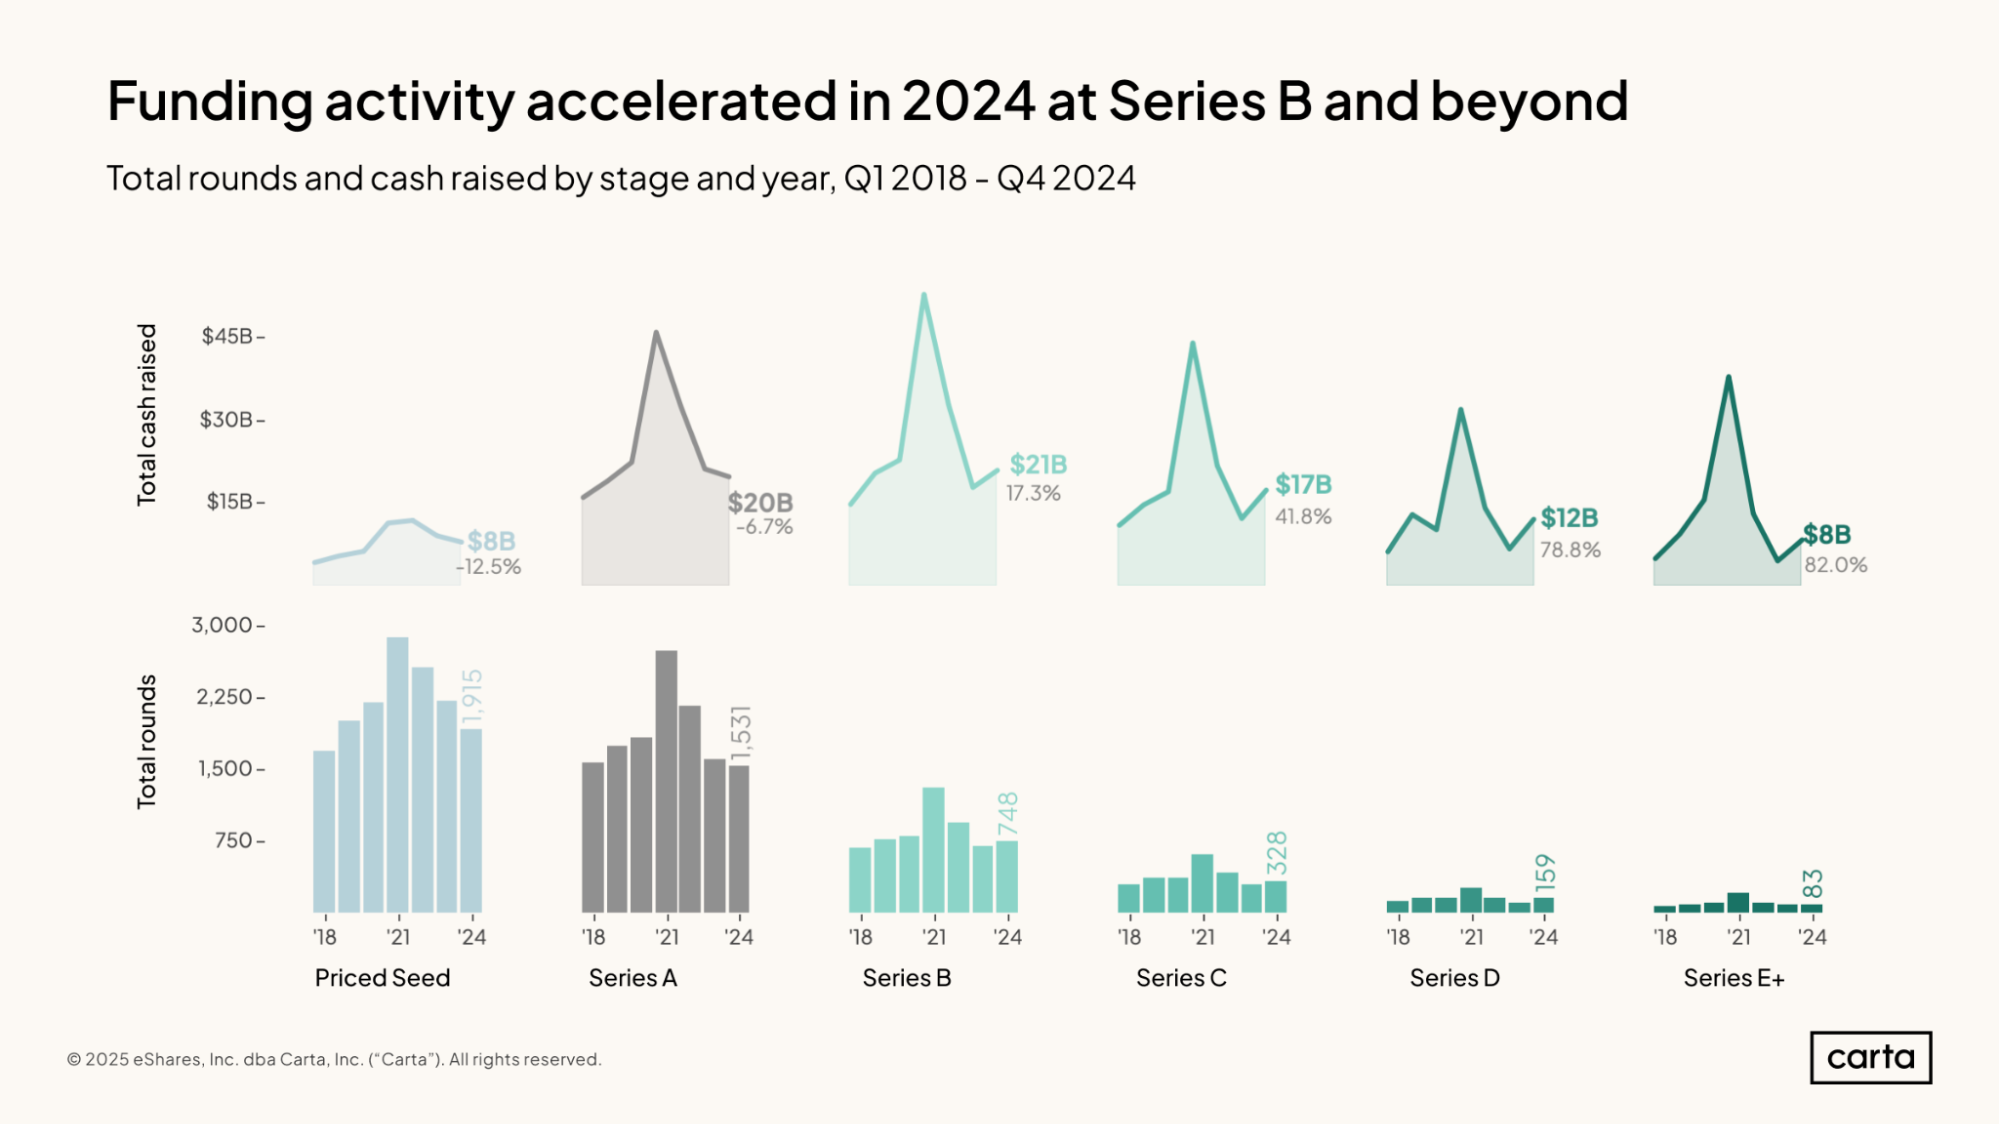
At the seed stage and Series A, venture fundraising activity declined last year in terms of both dollars raised and total rounds. At Series B, Series C, Series D, and Series E+ the opposite is true: At each stage, startups closed more rounds and raised more capital in 2024 than they did in 2023.
In some cases, the increases were steep. Annual cash raised rose last year by 41.8% at Series C and by 78.8% at Series D. The biggest increase came at Series E and beyond, where annual cash raised rose by 82%. This trend is likely influenced, at least in part, by market exit conditions, as more late-stage companies choose to remain private and secure additional funding—whereas in previous years, many would have already gone public through an IPO.
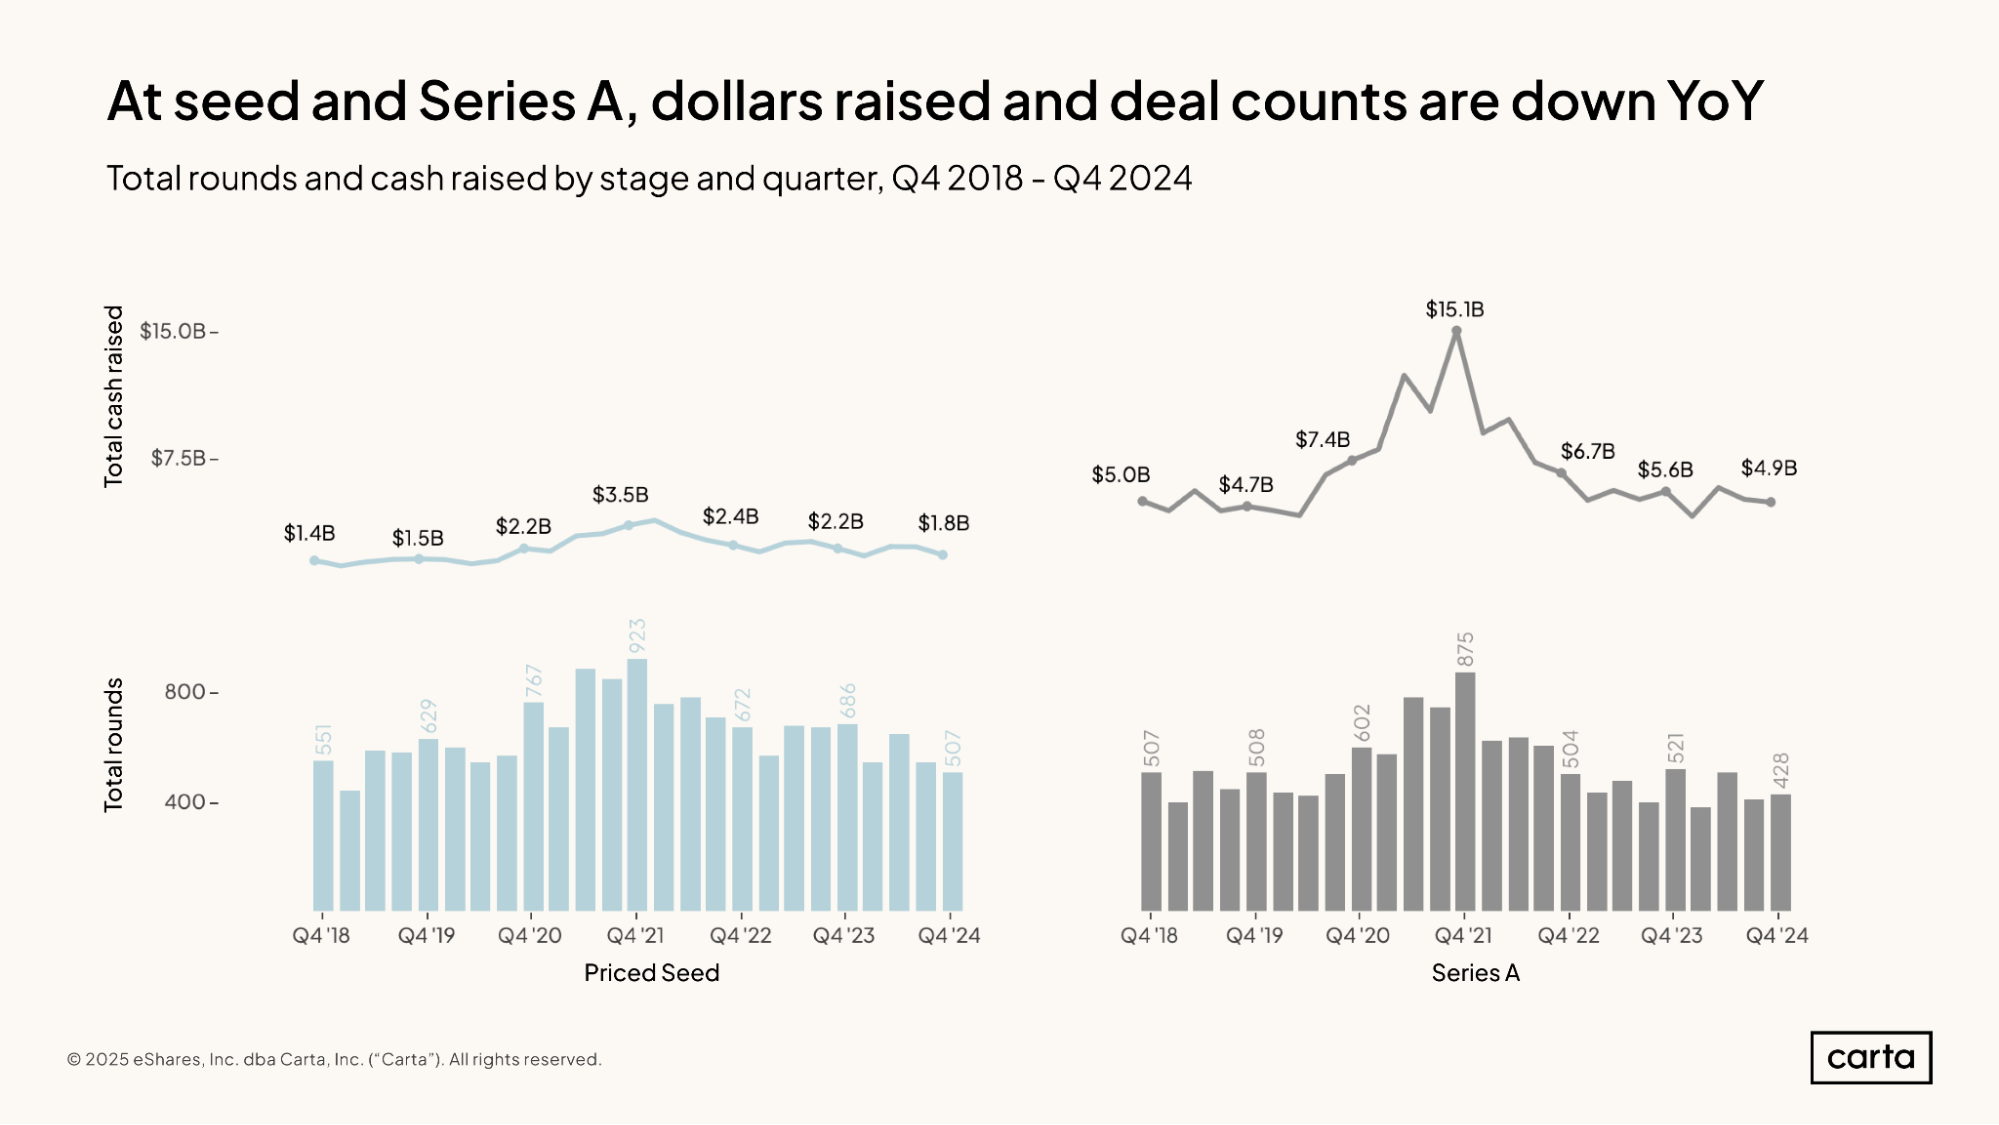
Seed startups on Carta combined to raise $1.8 billion in new funding during Q4 2024 across 507 total rounds. The first number represents an 18% decline compared to Q4 2023, and the second a 26% year-over-year drop. By both metrics, the market for seed funding seems to have slowed in 2024.
The same trends are unfolding at Series A. There, total cash raised fell 13% in Q4 2024 compared to the same period a year earlier, while deal count was down 18%. For now, Q4 2024 looks like the slowest Q4 for Series A activity dating back to at least 2018.
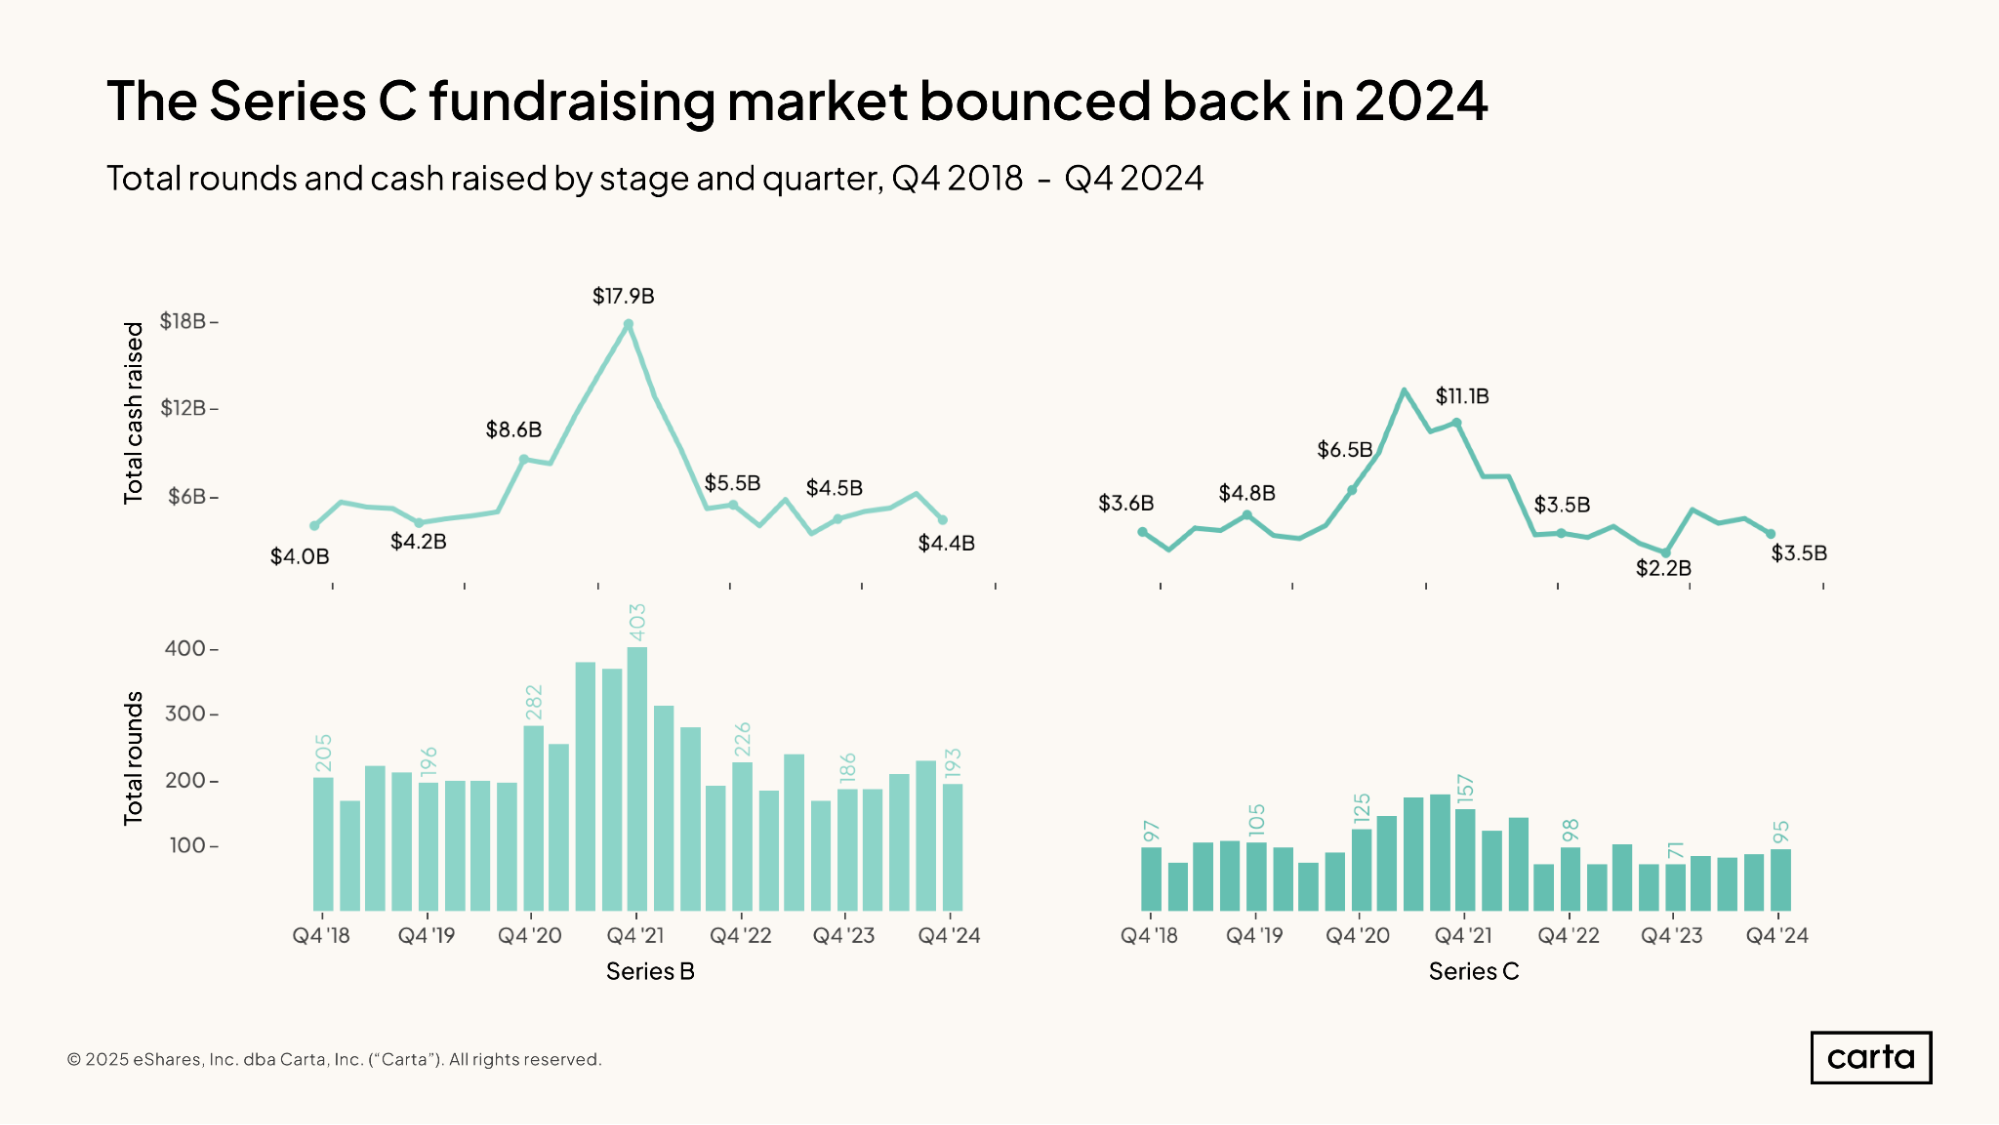
After falling to a recent lowpoint at the end of last year, Series C fundraising showed signs of recovery in 2024. Startups on Carta raised $3.5 billion in total Series C funding during Q4 2024, up 59% year over year, while deal count was up 34% over the same span.
While deal activity has been on the rise at Series C, it’s been holding steady at Series B. In Q4, Series B startups on Carta raised $4.4 billion in combined funding, down 2% year over year, and they closed 193 total rounds, a year-over-year increase of 4%.
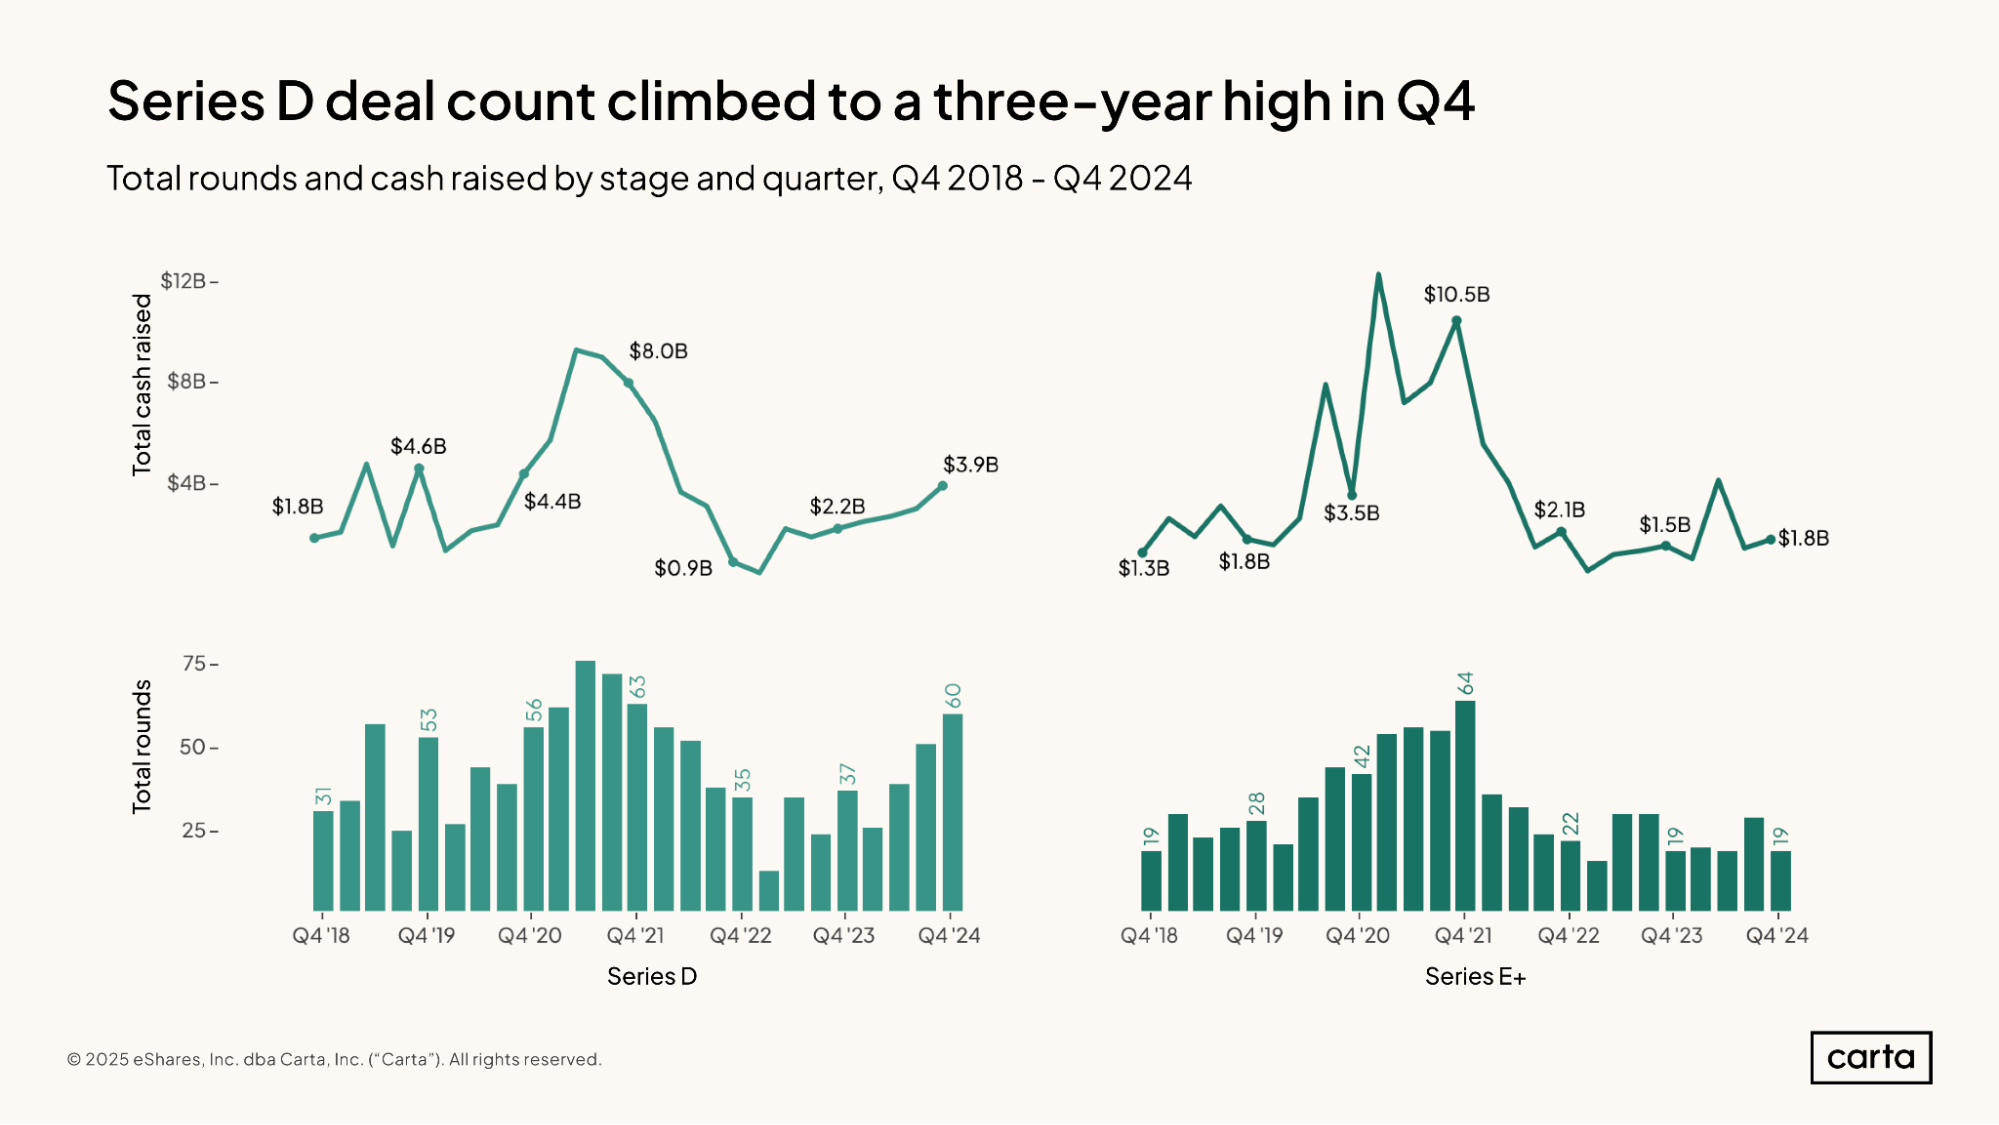
Startups closed 60 new Series D rounds on Carta during Q4, the highest quarterly figure since Q4 2021. And those 60 rounds combined to raise $3.9 billion, the highest quarterly cash total since Q1 2022. Series D deal count was up 62% compared to the prior Q4, and cash raised was up 77%. By either measure, the Series D market is surging.
At the latest stages of fundraising, activity remains tepid. Total cash raised at Series E and beyond has landed below $2 billion in seven of the past eight quarters, a drop of more than 80% from Q4 2021, when the late-stage funding market was near its recent peak.
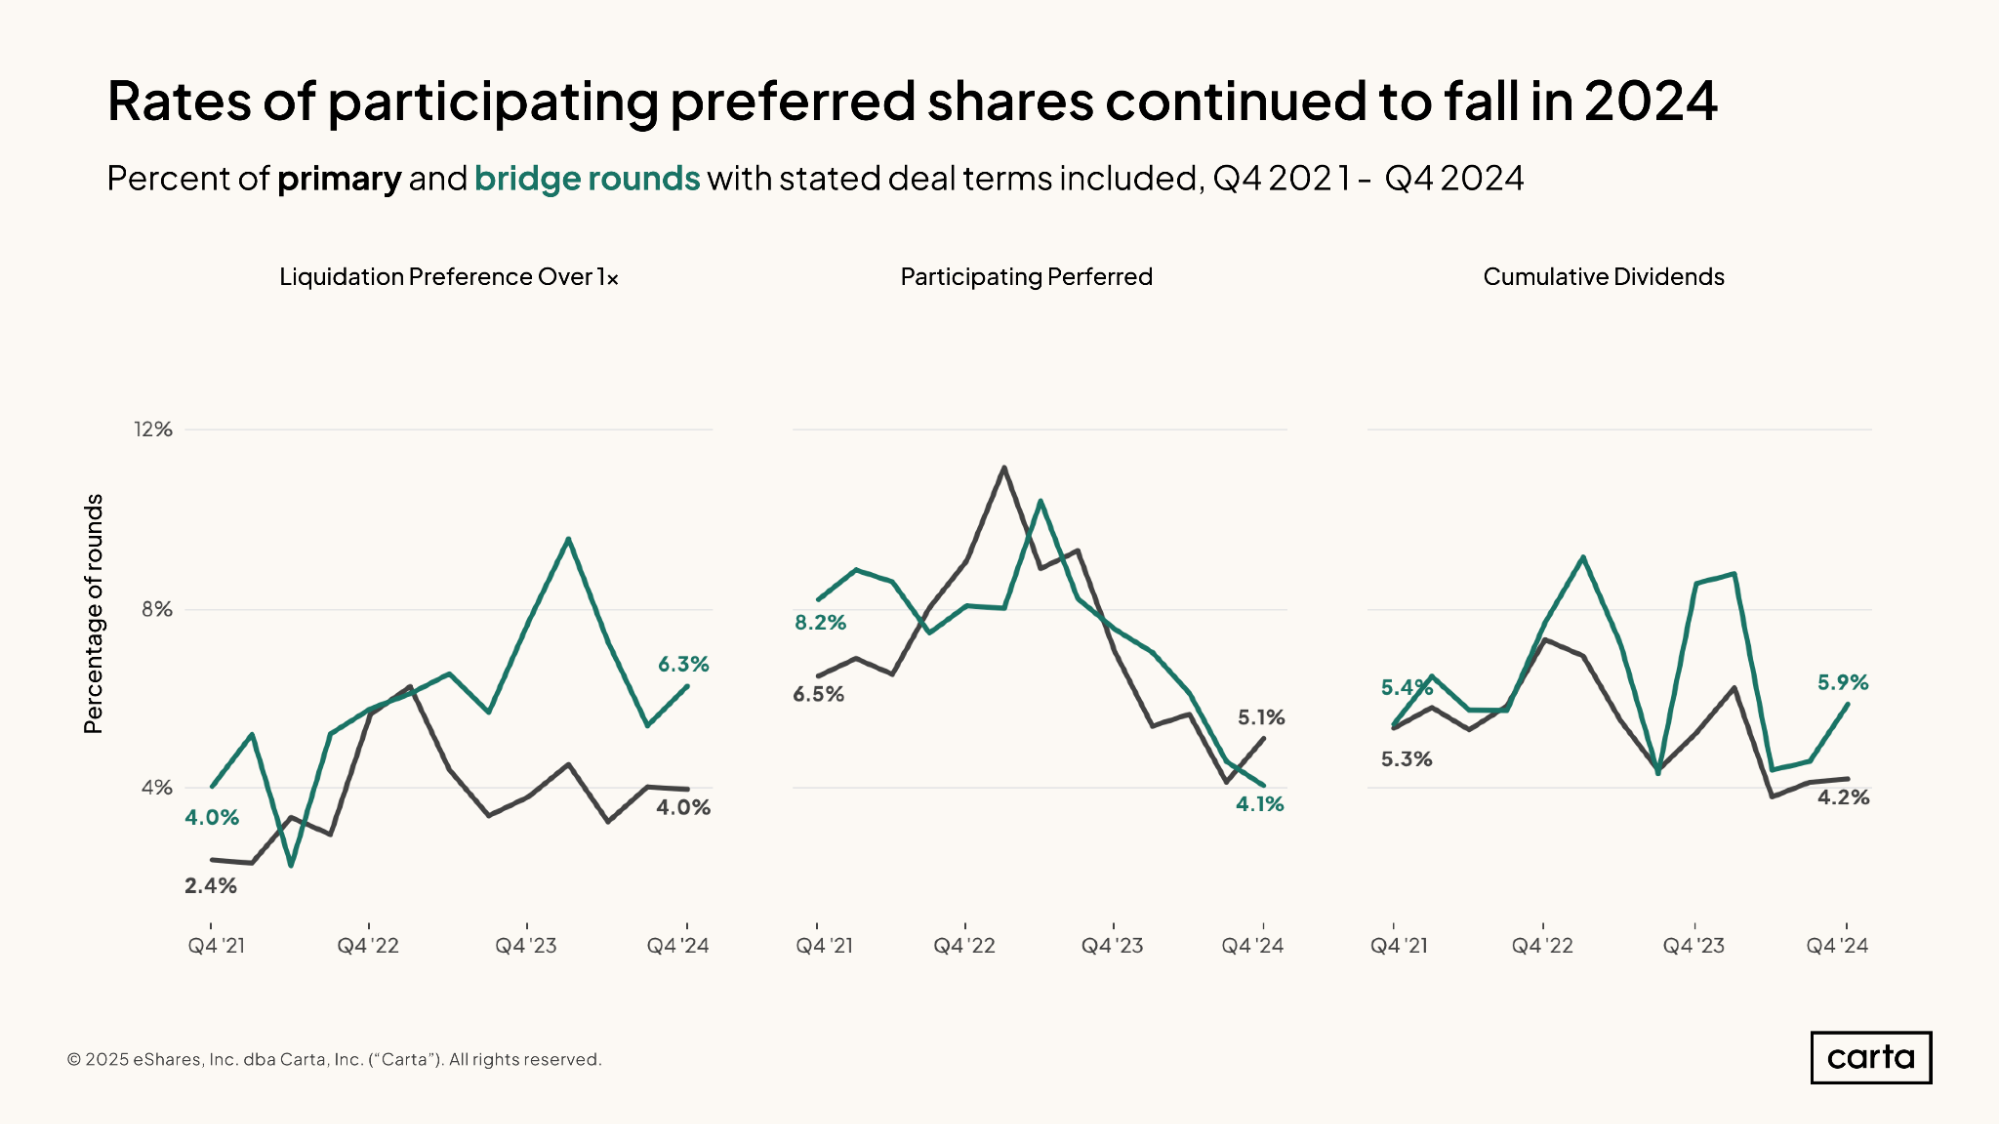
On primary funding rounds, it’s less common today than it was two years ago to see term sheets that include either liquidation preferences higher than 1x, participating preferred shares, or cumulative dividends. The change is particularly stark for participating preferred stock. In Q1 2023, an investor received participating preferred shares in more than 10% of all new primary rounds on Carta. By Q4 2024, that rate had declined by more than half.
For the past few quarters, bridge rounds have been a bit more likely than primary rounds to include a liquidation preference over 1x or a cumulative dividend. However, the differences are slight—the vast majority of new funding rounds in Q4 included none of these three deal terms, all of which are typically seen as ways for investors to protect against downside risk.
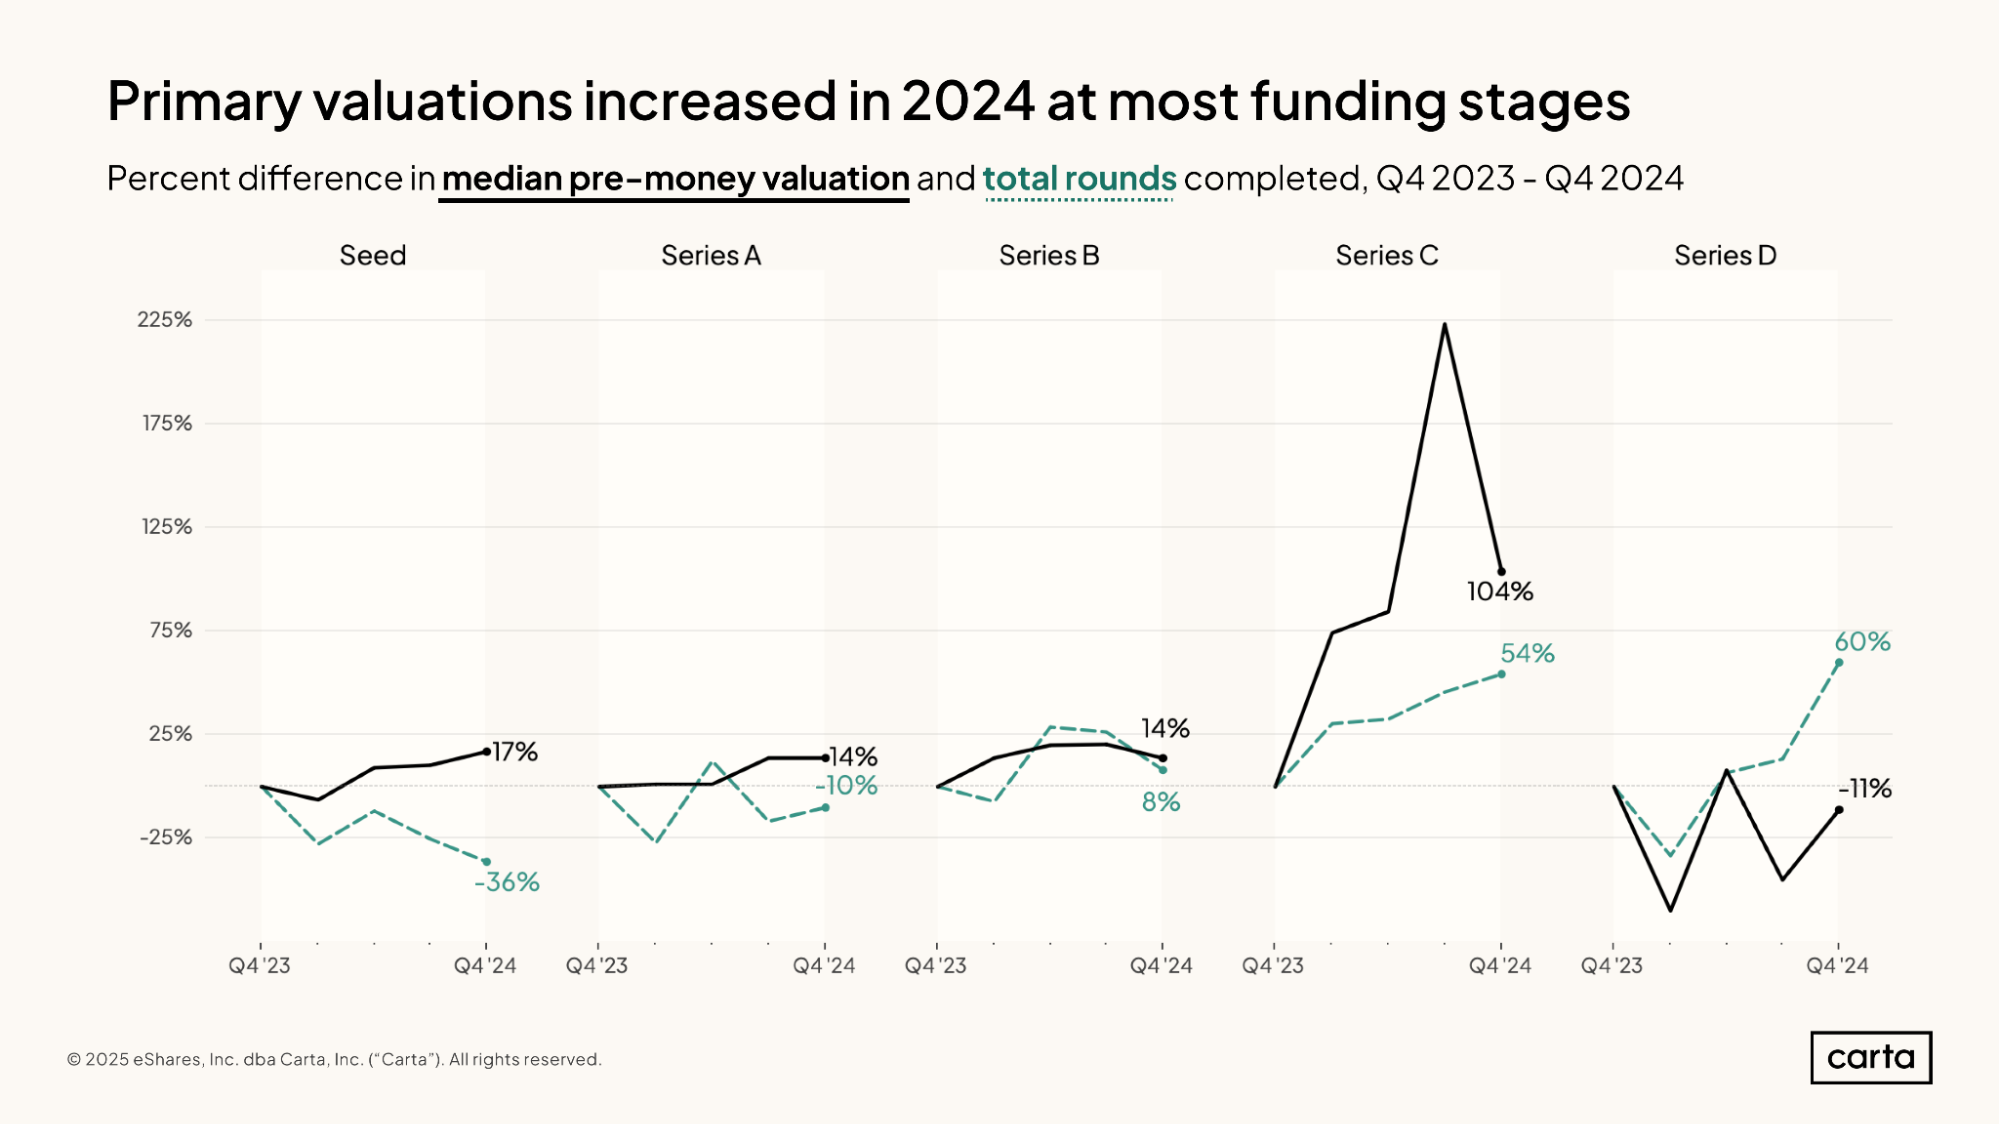
The median pre-money valuation on primary funding rounds increased over the course of 2024 at every stage from seed through Series C. The lone exception to this upward trend occurred at Series D, where the median pre-money valuation on primary rounds fell 11% from Q4 2023 to Q4 2024.
The number of new primary rounds decreased over this span at both seed and Series A, including a 36% drop-off in activity at seed. At later stages, however, deal counts have increased since the end of 2023—the later the stage, the larger the increase. There were 60% more primary rounds at Series D in Q4 2024 than there were in Q4 2023.
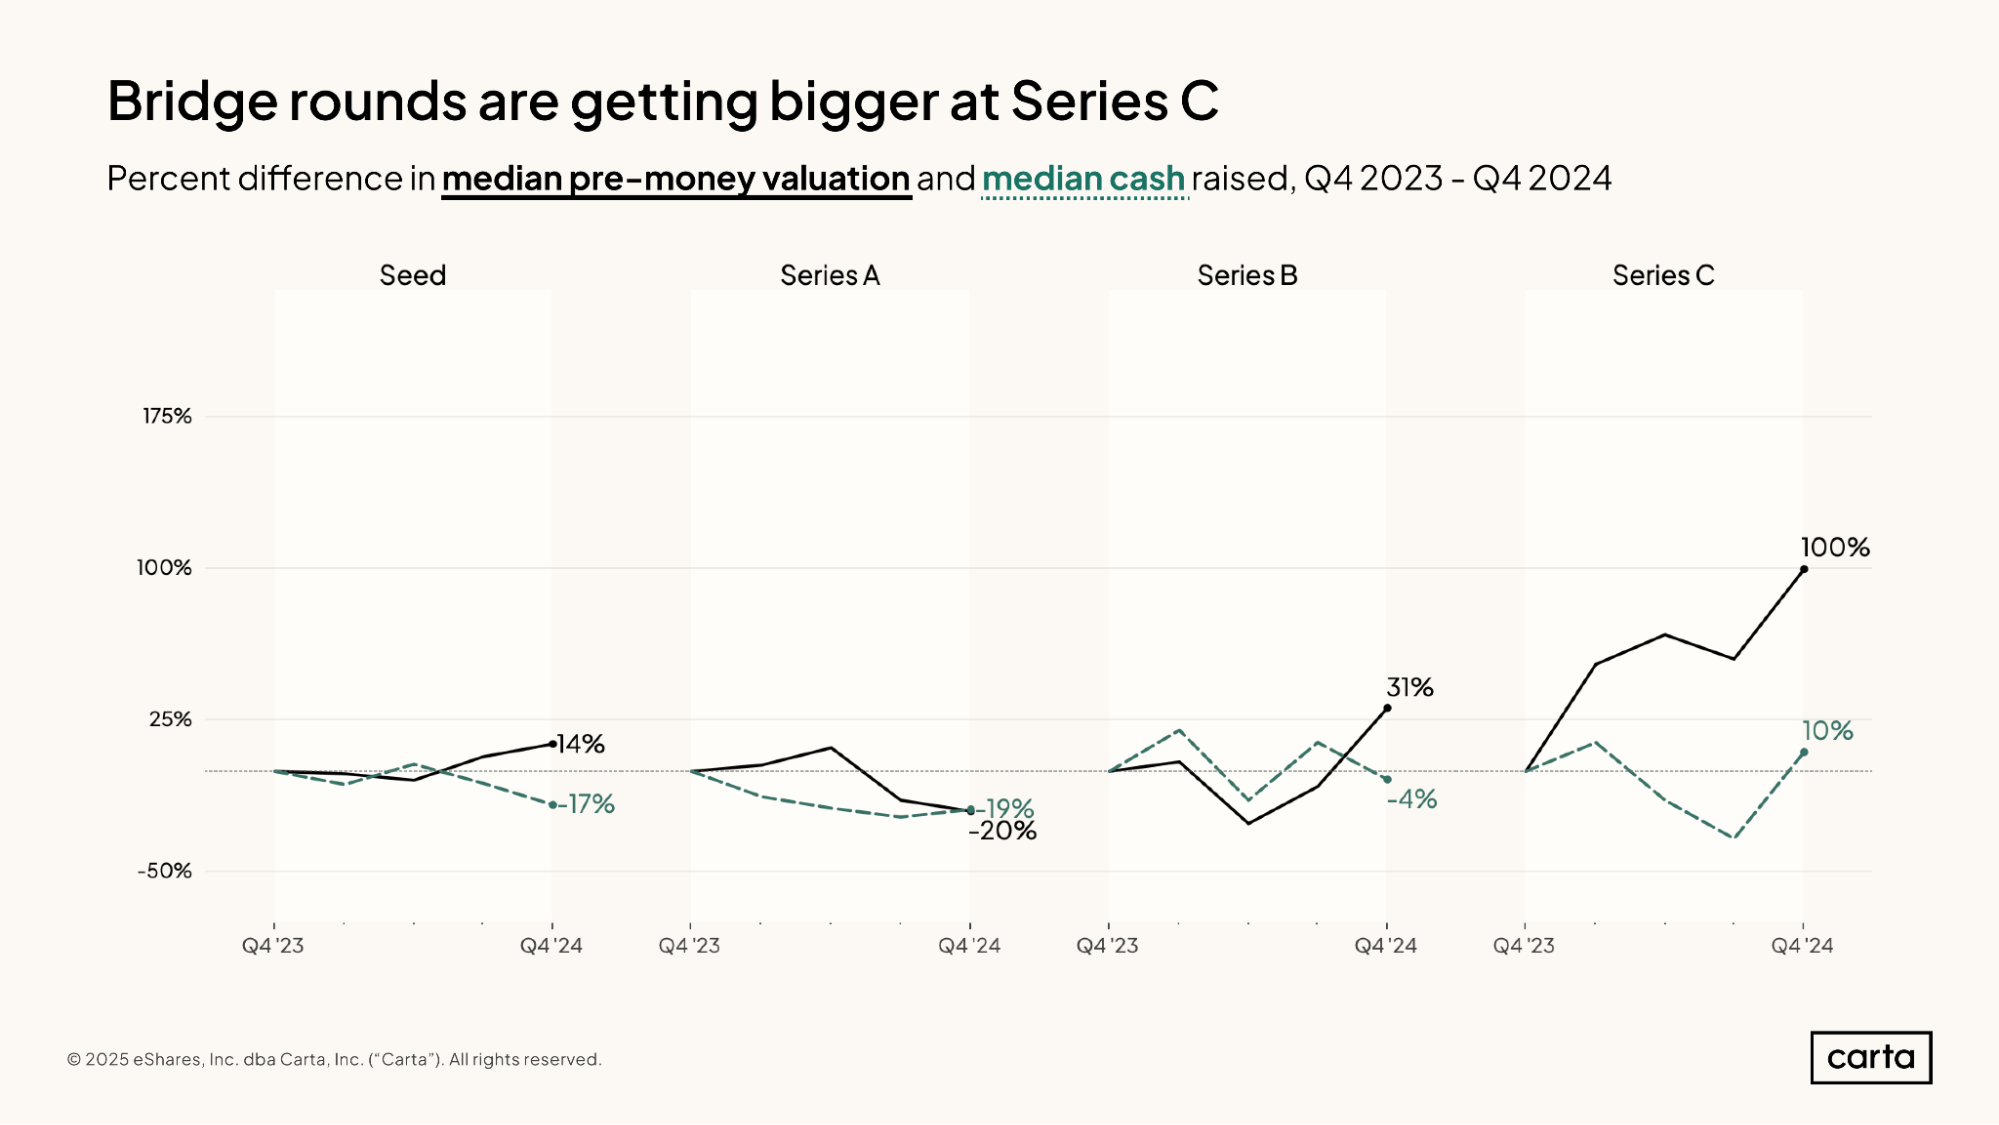
The median amount of cash raised in new bridge rounds declined between Q4 2023 and Q4 2024 among startups at seed, Series A, and Series B. The size of bridge rounds ticked up, however, at Series C, with a 10% year-over-year increase.
Series C was also responsible for the most significant annual growth in bridge valuations, with the median pre-money valuation up 100%. Seed and Series B startups have also seen year-over-year upticks in bridge valuations.
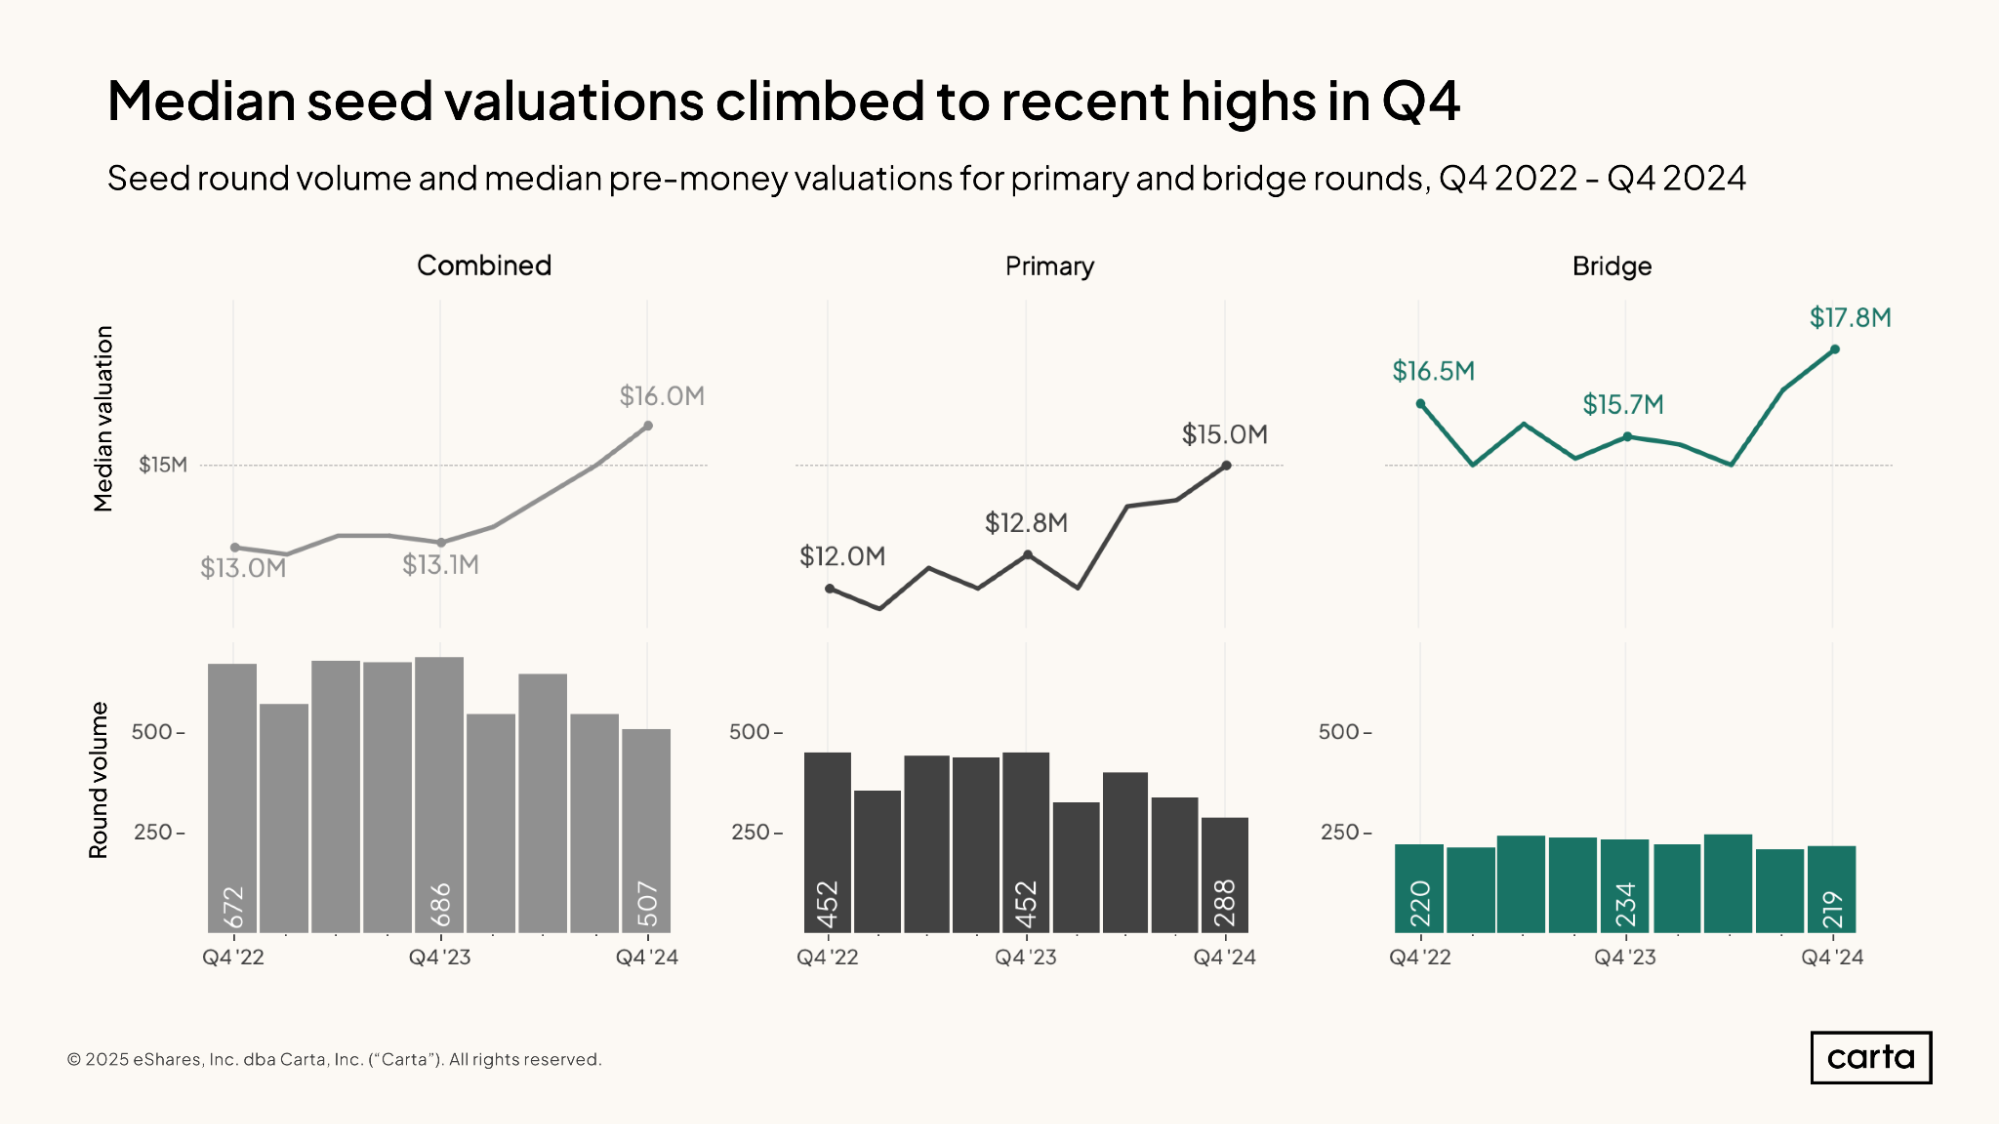
The median pre-money valuation increased throughout 2024 on both primary seed rounds and bridge rounds raised by seed-stage companies. Across both transaction types combined, the median valuation hit $16 million in Q4, a 22% increase year over year.
On the other hand, Q4 brought a 26% year-over-year decline in seed-stage deal count, with 507 transactions taking place during the last three months of 2024. The bulk of this decline came in primary rounds, rather than bridge rounds: Primary deal count on its own was down 36% year over year in Q4, compared to a more modest 6% decline in bridge deal count.
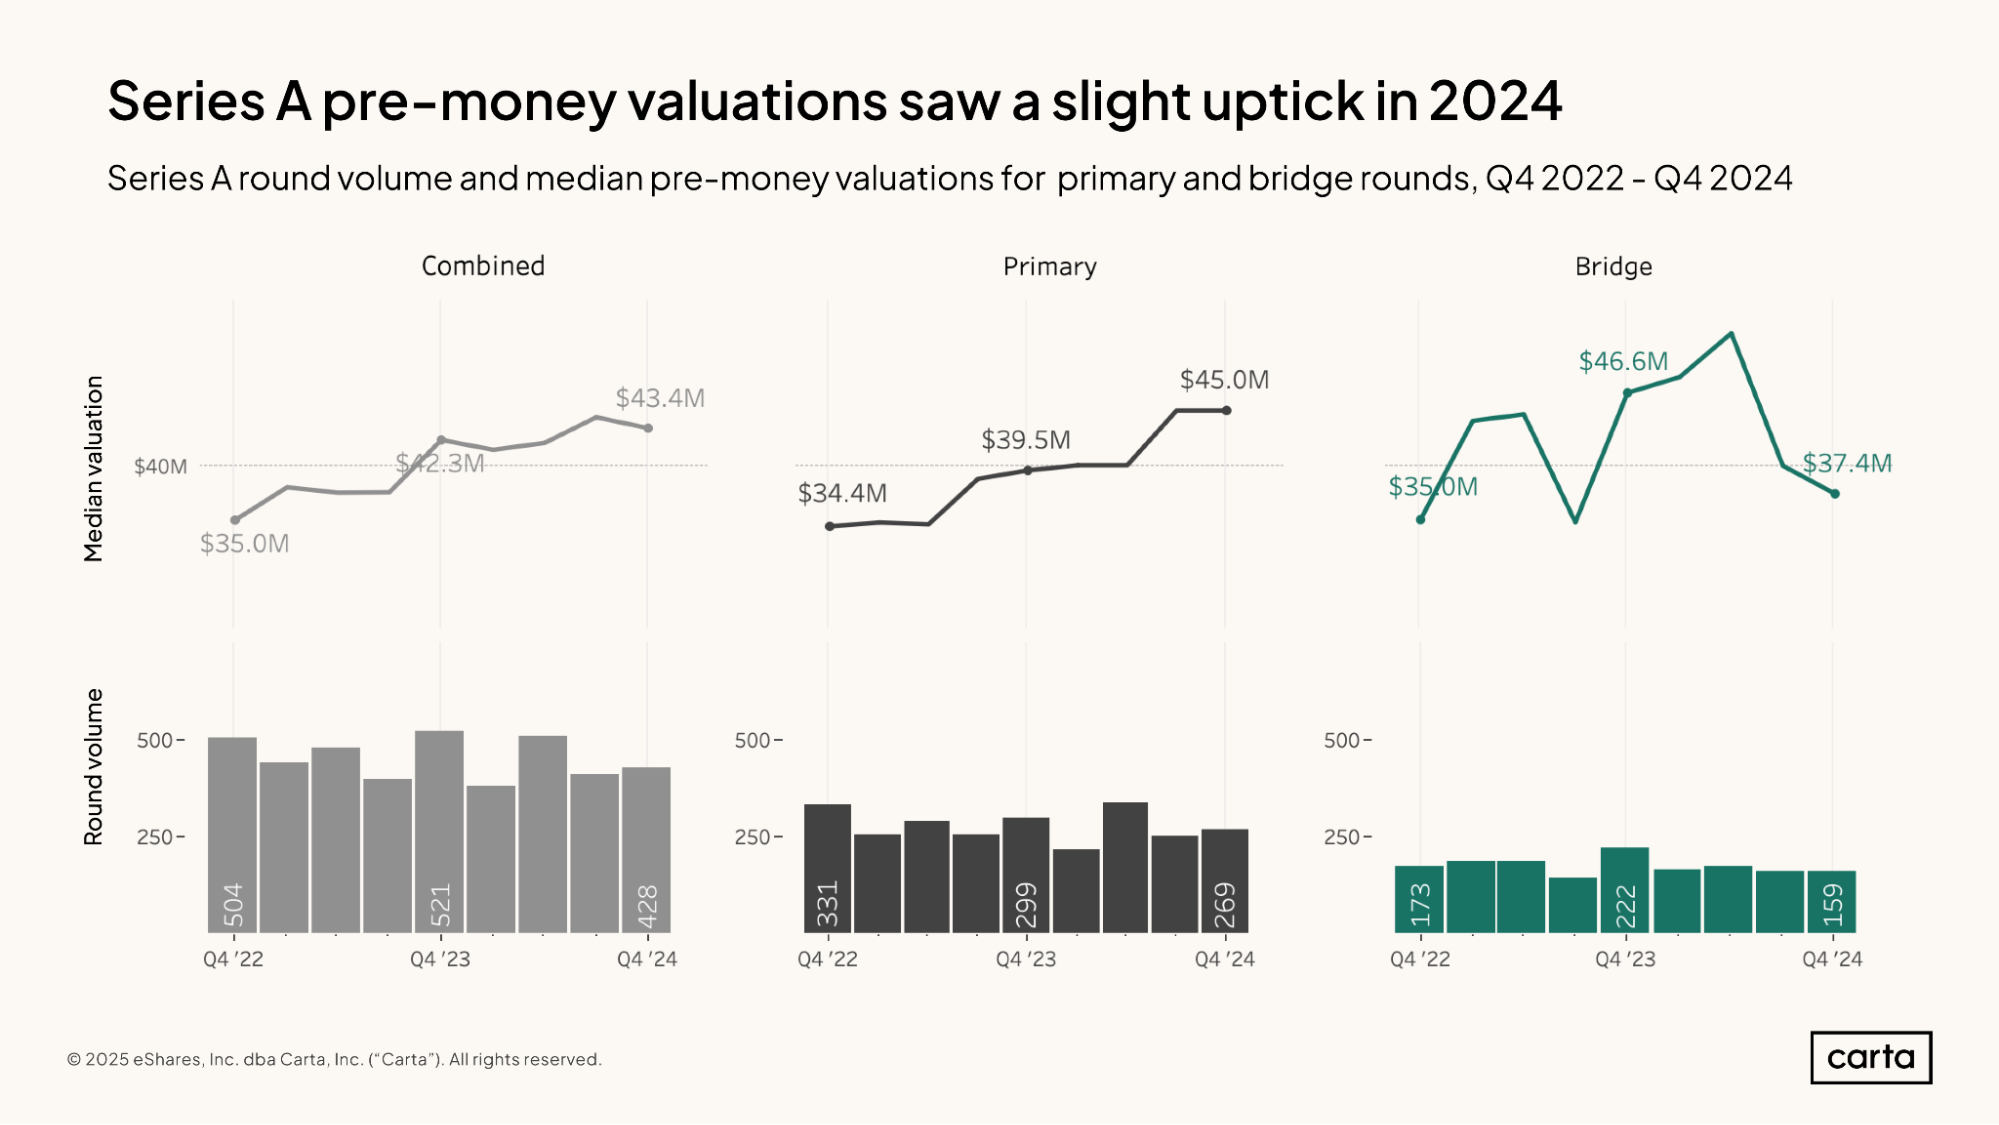
In primary rounds, the median pre-money valuation at Series A was $45 million in Q4, up 14% over the same period last year. In bridge rounds, conversely, the median pre-money valuation is down 20% year over year. In terms of valuations, the recent fundraising climate has been friendlier to startups raising Series A funding for the first time than to those Series A startups looking to raise follow-on capital before moving on to a Series B.
Across both primary and bridge rounds, combined Series A deal count was down 18% year over year in Q4. At both the seed stage and Series A, deal numbers fell by double-digit margins between Q4 2023 and Q4 2024 after a slight increase over the previous 12-month span.
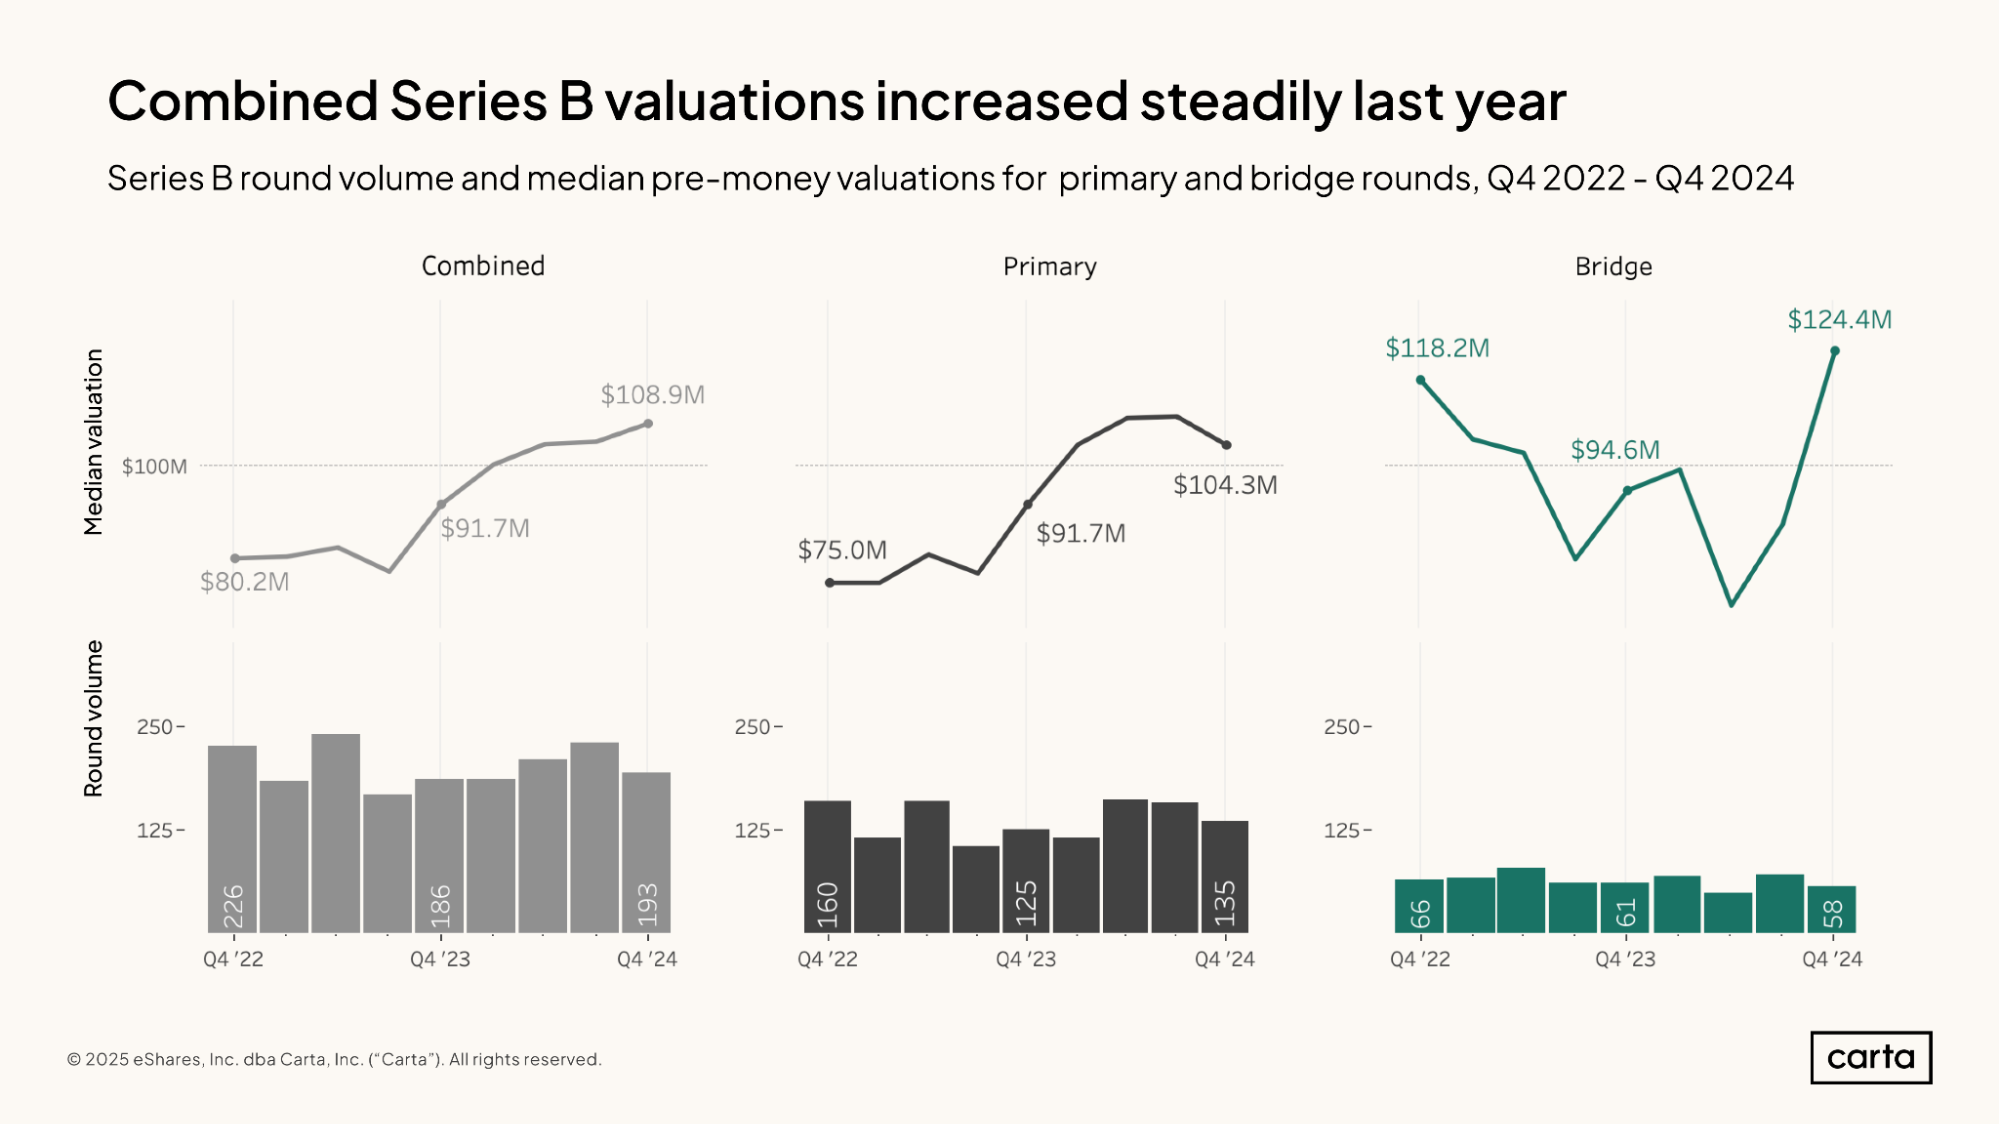
Unlike at seed and Series A, deal count at Series B has trended up over the past year—even with a slight drop-off in activity during Q4. There were a combined 193 transactions on Carta at Series B in Q4, up 4% year over year.
Median pre-money valuations at Series B are up even more significantly, with a 14% increase on primary deals and a 19% upswing on primary and bridge rounds combined. The median combined valuation reached $108.9 million in Q4, its highest point since Q2 2022.
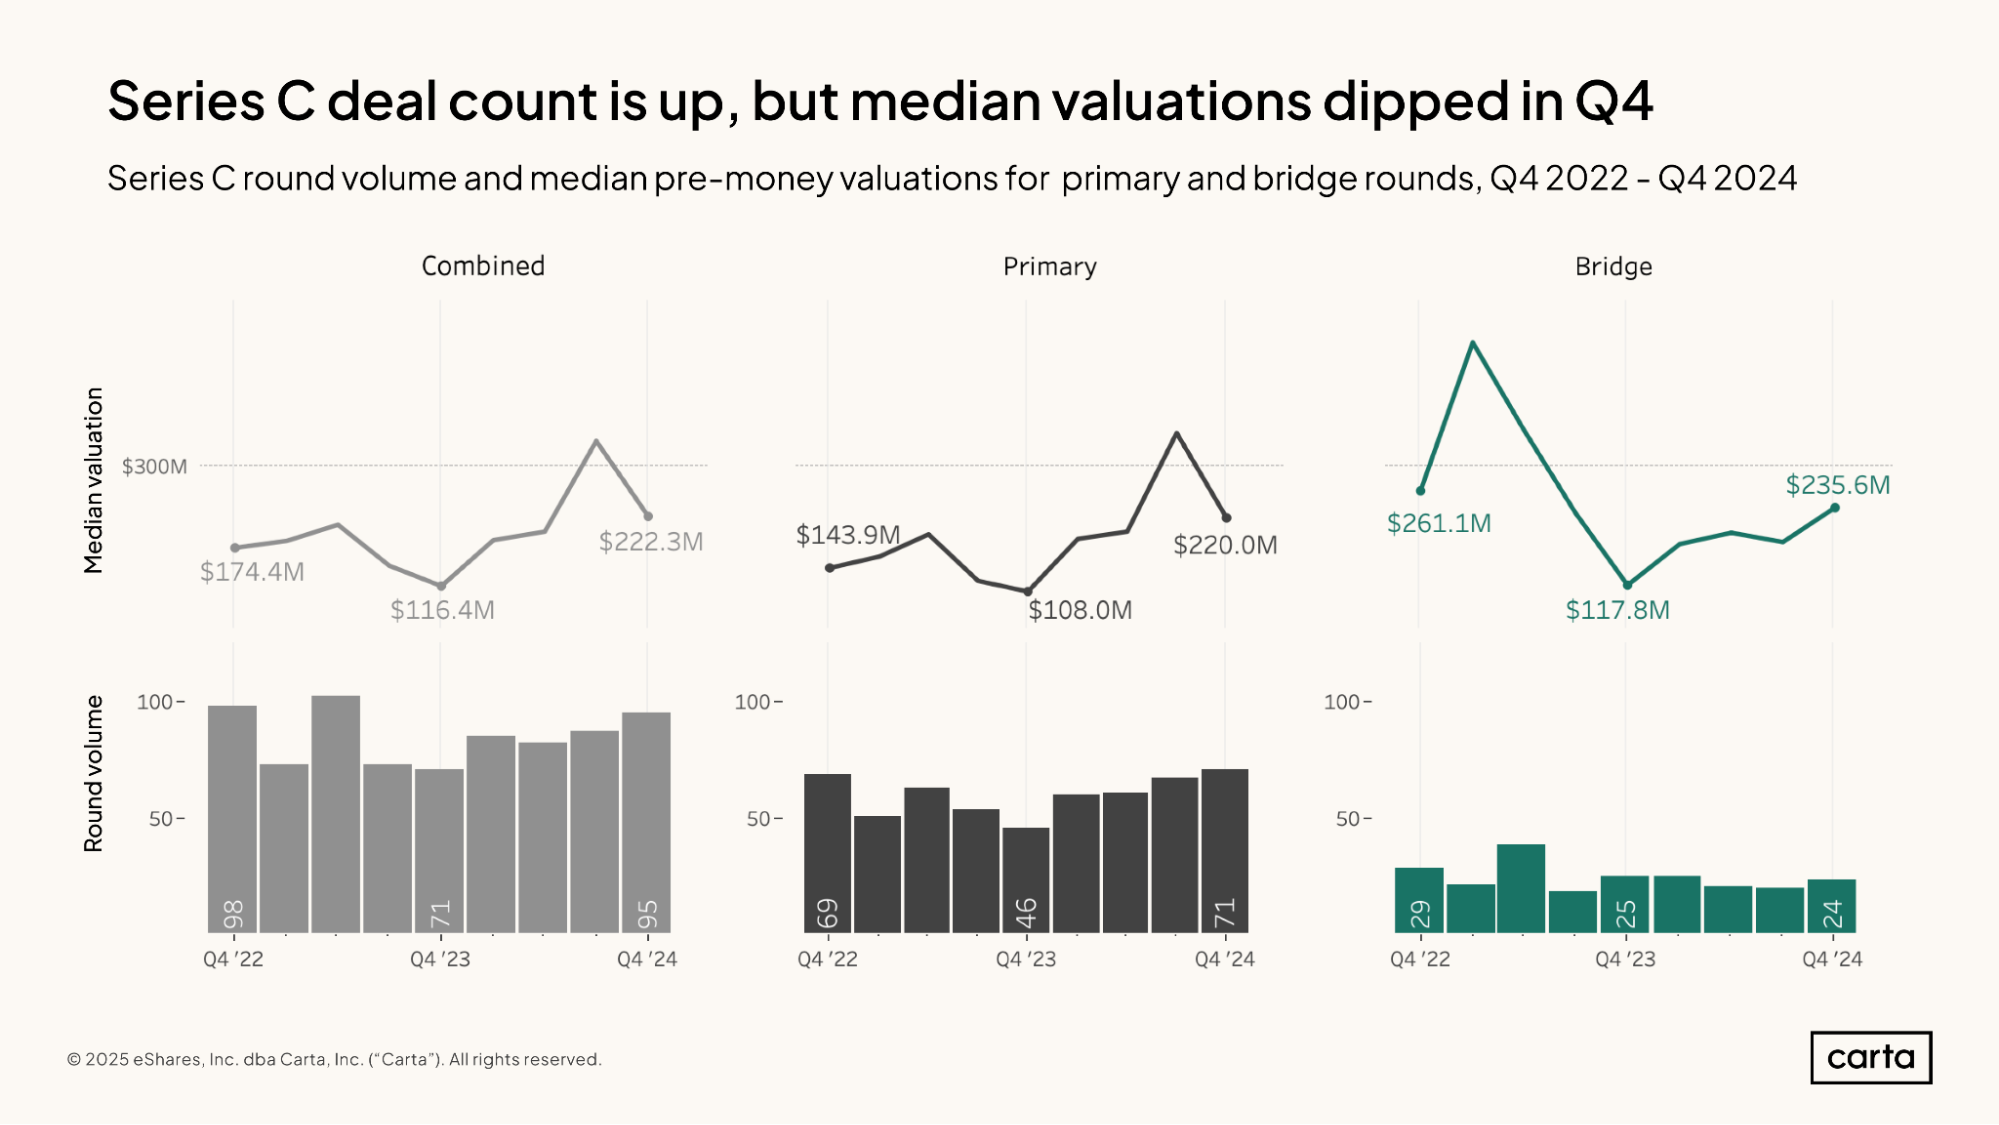
The Series C market showed strong signals over the past 12 months, with combined Q4 deal count rising 34% year over year and median pre-money valuation up 91% in the same span. Trends in venture can shift quickly, but for now, it’s looking increasingly likely that the post-pandemic slide in Series C activity reached its lowpoint in late 2023.
While the frequency of bridge rounds among Series C startups has remained relatively steady over the past several quarters, the median pre-money valuation on these transactions doubled between Q4 2023 and Q4 2024. For those Series C companies that succeeded in raising bridge capital, the valuation climate grew more appealing in 2024.
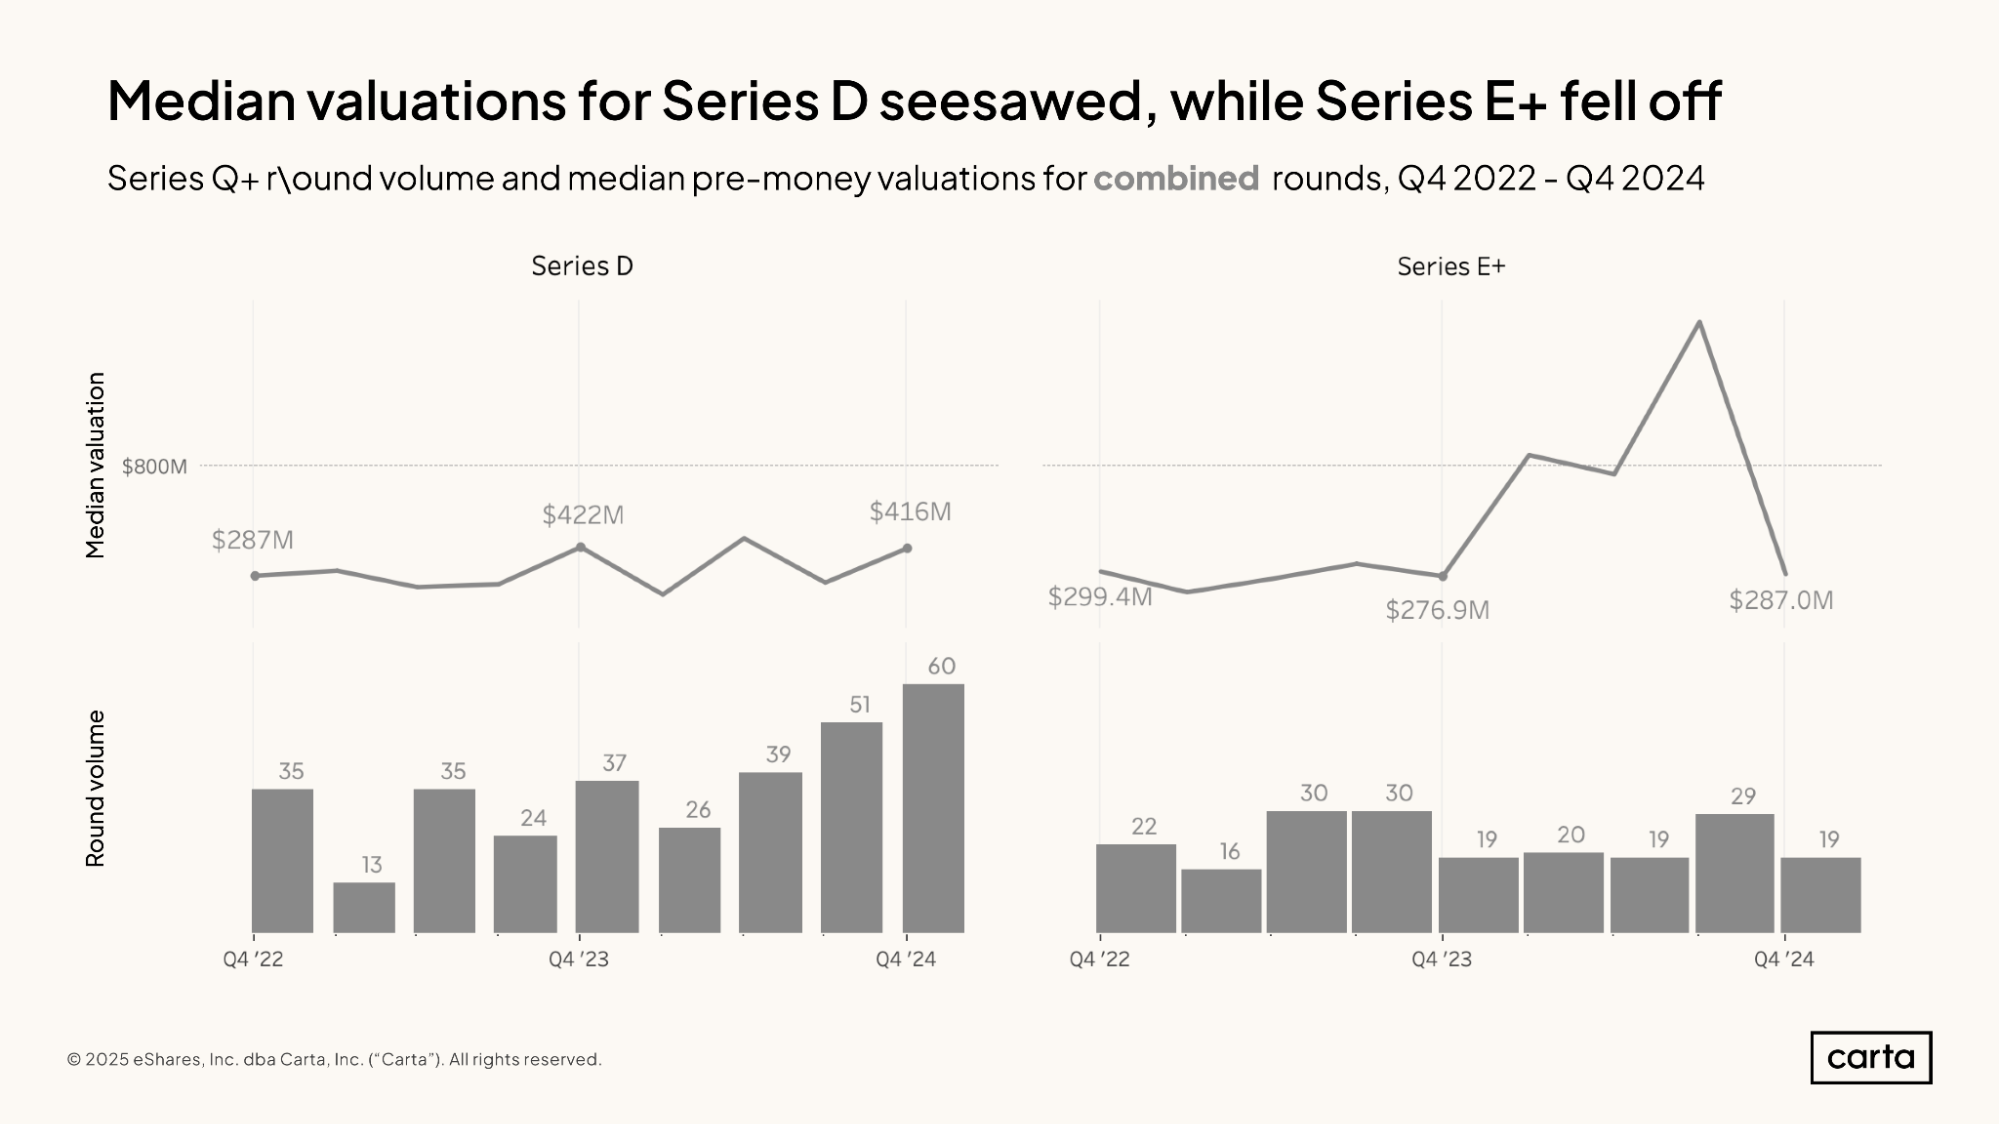
Median pre-money valuations at Series D have been alternately rising and falling for the past several quarters, with minimal net effect: Between Q4 2023 and Q4 2024, the median valuation across primary and bridge rounds combined decreased by just 1%.
Recent changes to deal activity at Series D have been more substantial. The number of transactions occurring at this stage has now increased in three straight quarters, with the 60 Series D rounds that took place on Carta in Q4 representing the highest quarterly count since Q4 2021, during the height of the pandemic bull market.
Late-stage venture fundings at Series E and beyond remain scarce. Startups on Carta closed just 19 such transactions during Q4 2024, the same number as a year ago. Deal count at Series E+ had experienced a notable bump in Q3, but that surge proved short lived.
It’s been a similar story for valuations at Series E+. The median pre-money valuation on these deals shot up in Q2, climbing to more than $1.5 billion. But that median figure plunged in Q3, and it fell again in Q4. On a year-over-year basis, combined valuations at Series E+ are down 18%.
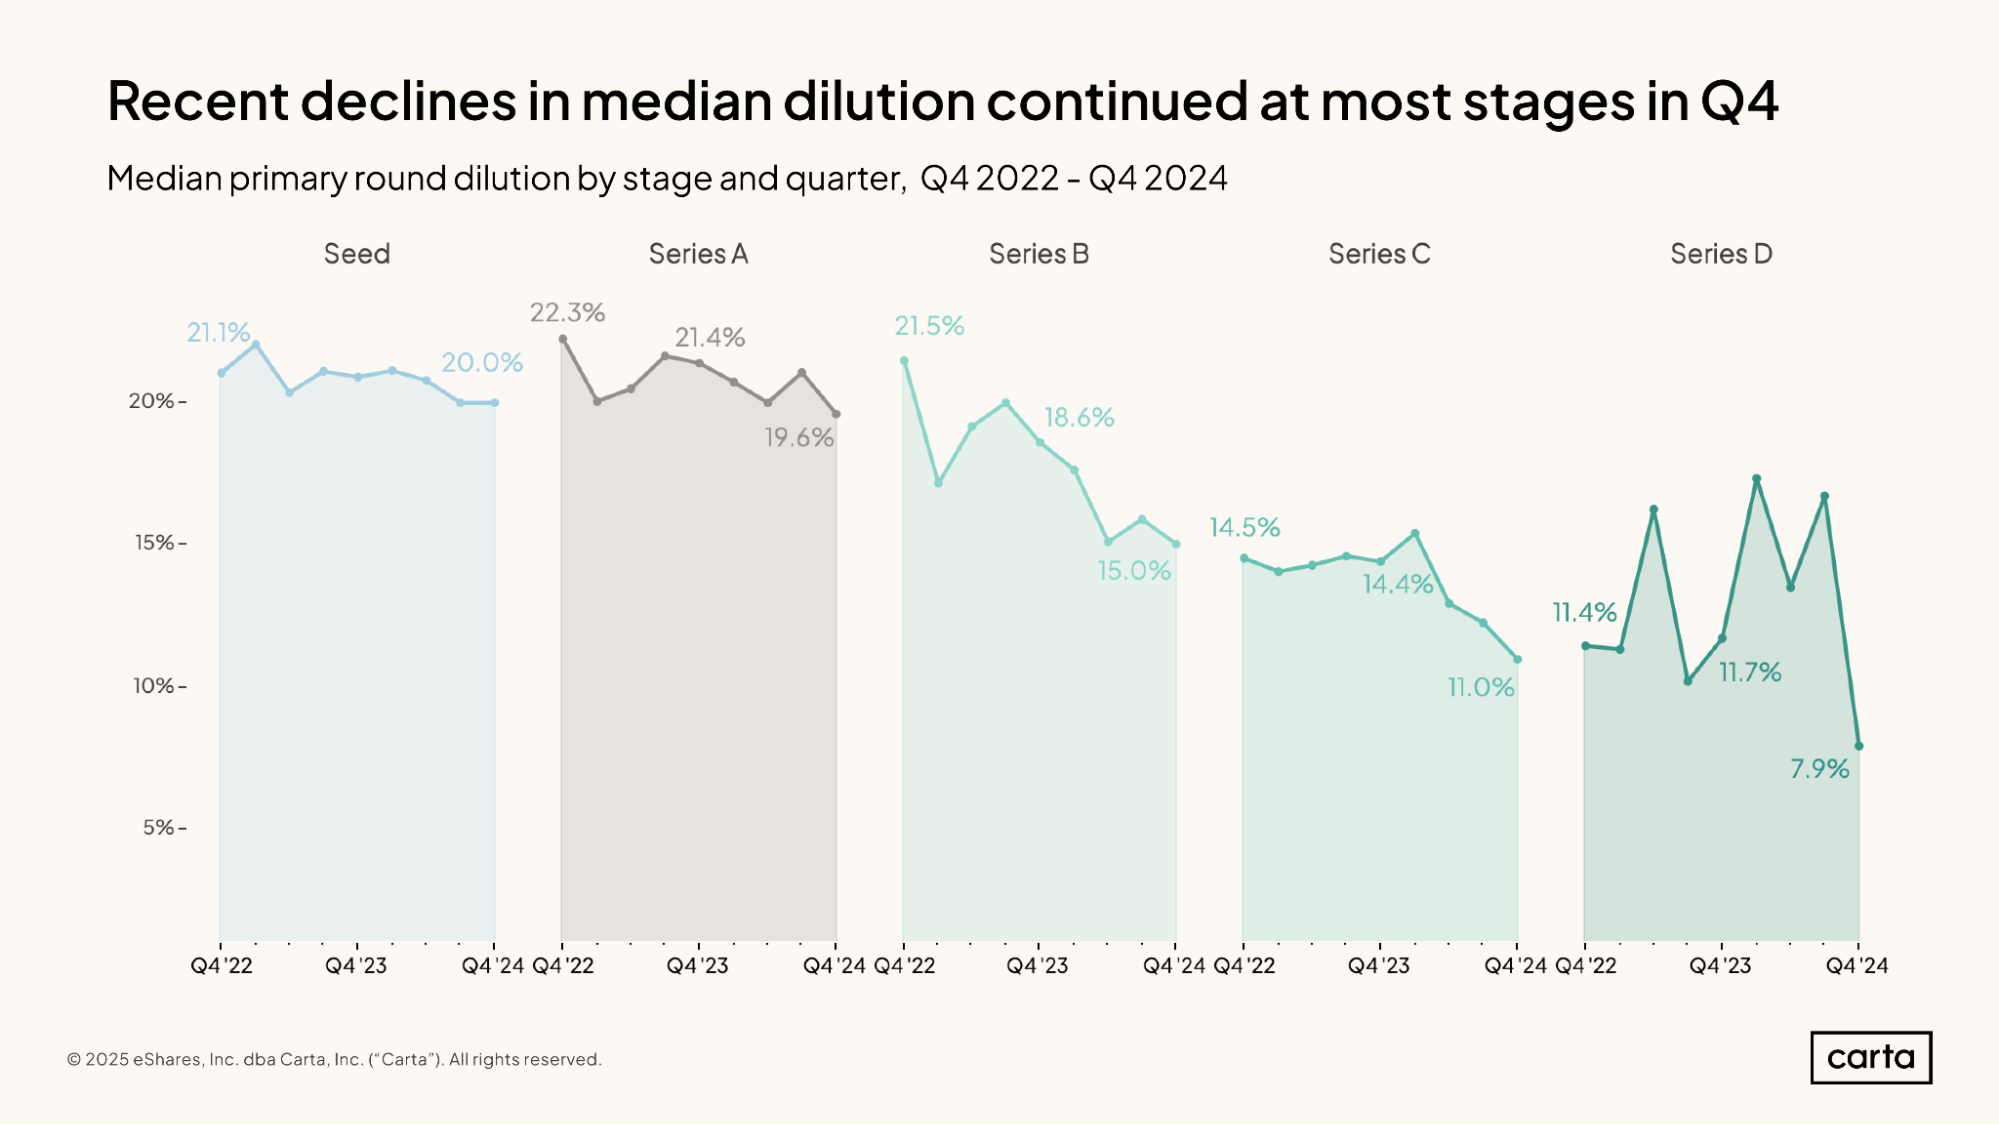
Median dilution decreased at every stage from Series A to Series D in Q4, with the later stages experiencing the largest declines. In each case, these declines were a continuation of recent trends. Over the past two years, it’s become the norm for startups of all stages to sell slightly smaller portions of their equity to investors when they raise new primary funding.
The market has been least volatile at seed, where there was a slight increase in dilution in Q4 2024. But even at seed, the median is down by more than one full percentage point since Q4 2022, dropping from 21.1% to 20% over that span. At every other stage, median dilution has declined by at least two percentage points.
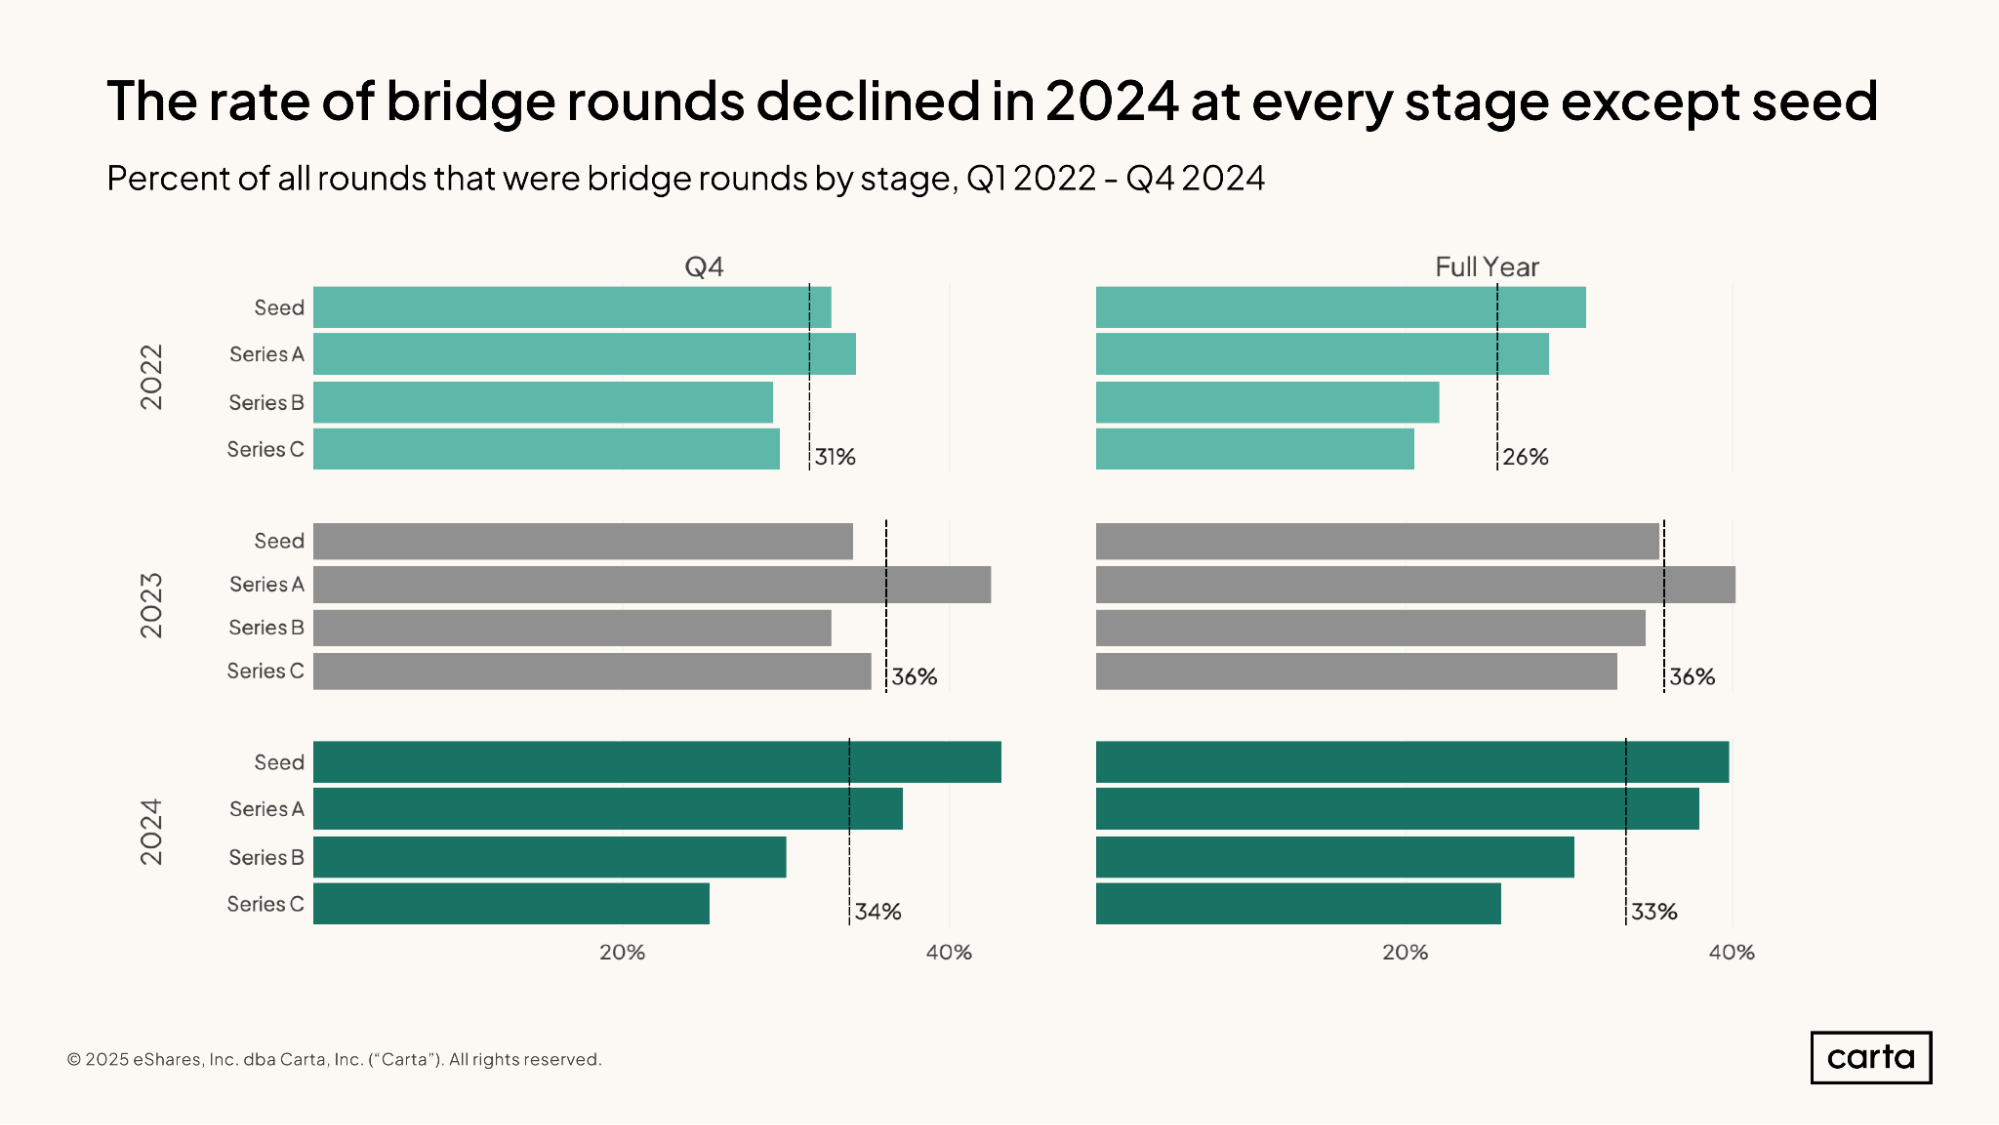
For the full year 2024, about 40% of all venture rounds raised by seed-stage companies were categorized as bridge rounds. That was an increase from 2023, when 36% of investments at the seed stage were bridge rounds.
At later stages of startup life, however, bridge rounds grew less common in 2024 compared to 2023. At Series A, the rate of bridge fell from 40% to 38%. At Series B, the rate dipped from 35% to 30%. And at Series C, it declined from 33% to 26%.
At every stage, bridge rounds started to make up a larger percentage of activity when the pandemic bull run came to an end in 2022, as startups looked for ways to bring in new capital without raising a new priced round.
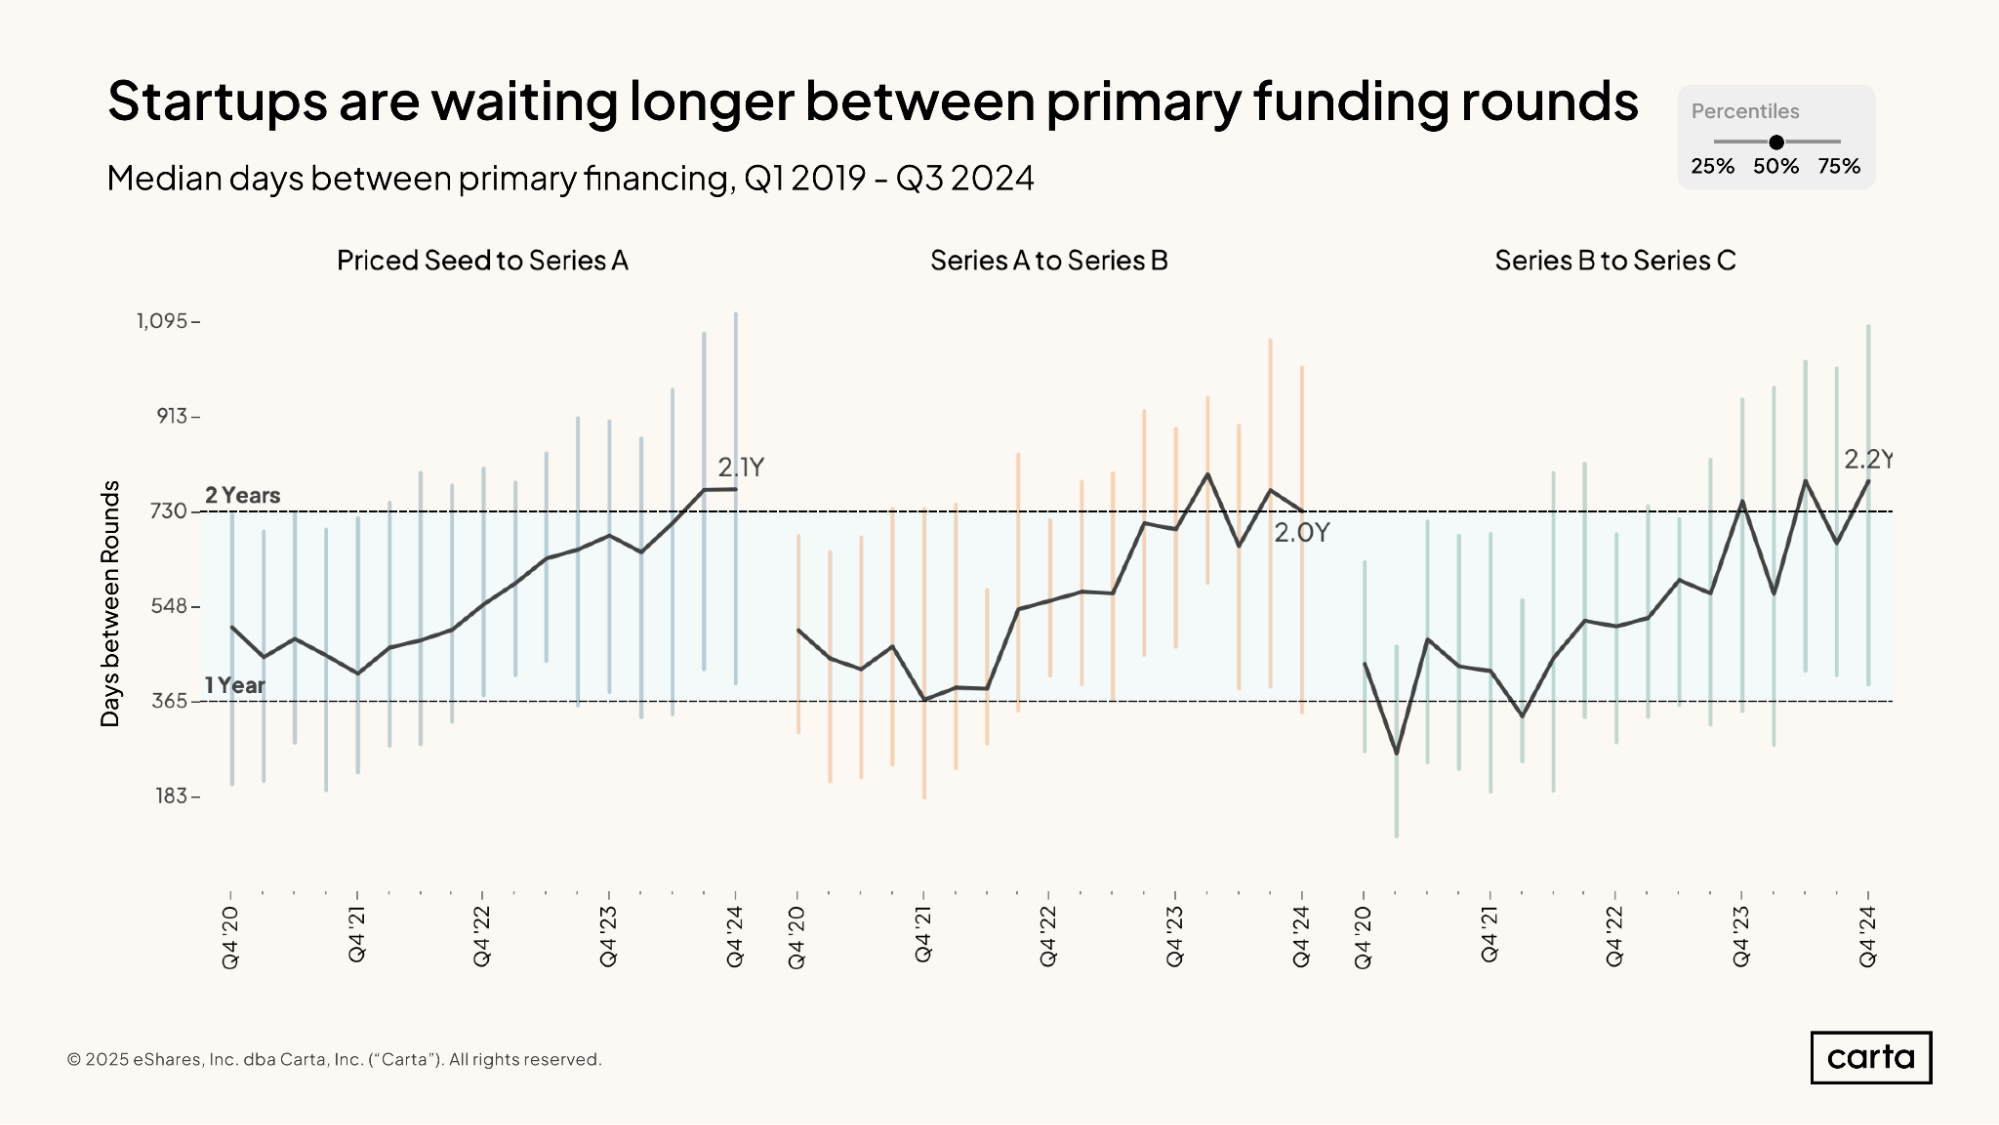
The median startup that raised a Series A round on Carta during Q4 had waited 774 days between primary funding rounds—the equivalent of about 2.1 years. The median startup that raised a Series C last quarter had waited 790 days since their previous round—about 2.2 years.
For both stages, these are the longest intervals between funding events that we’ve seen so far this decade.
Some startups are waiting much longer. For startups moving from seed to Series A in Q4, the 75th percentile for time between rounds was more than three years. And the 75th percentile wait times for startups raising a Series B or a Series aren’t far off. At each of these three stages, the median interval between rounds in Q4 2024 was roughly equivalent to where the 75th percentile interval sat as of two years ago.
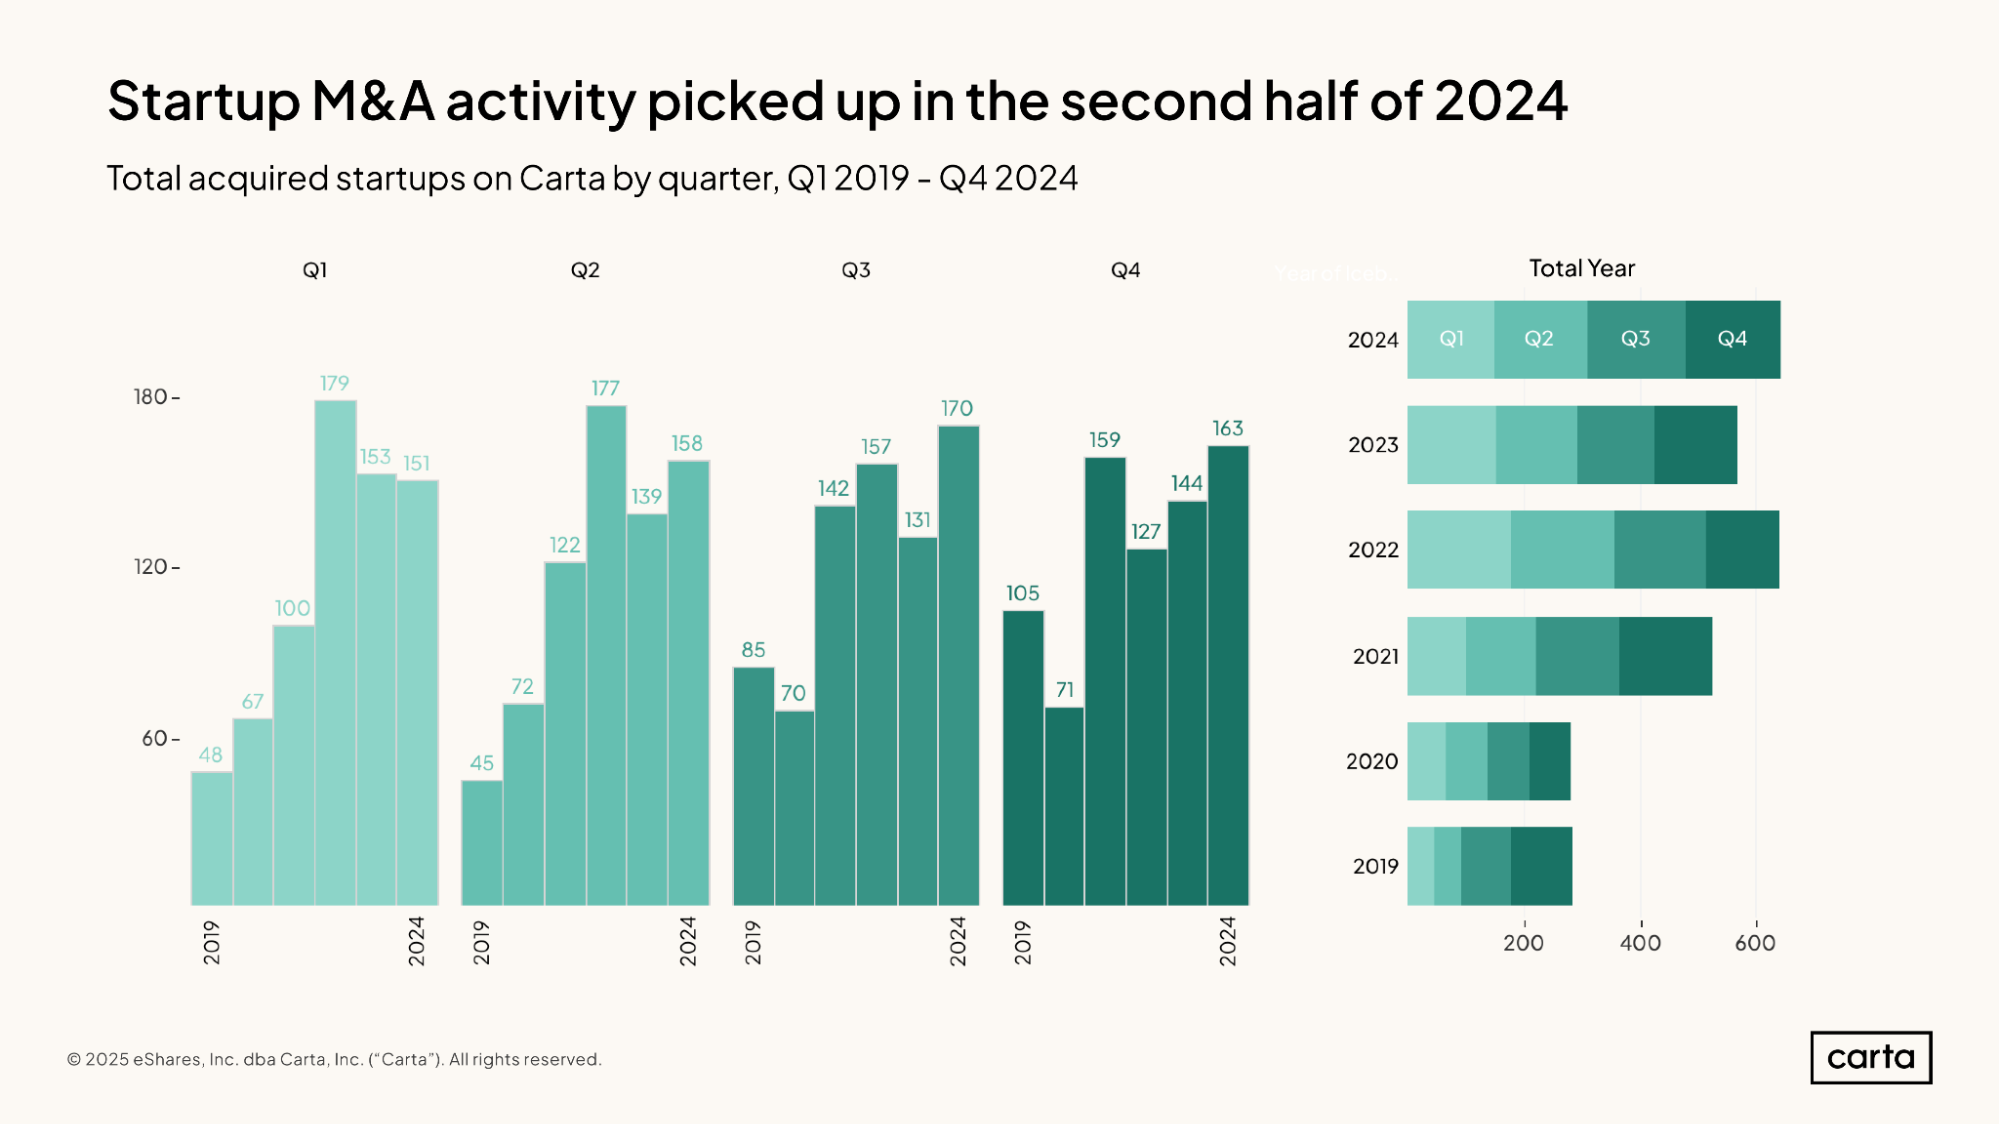
Startup M&A activity ended 2024 on a high note. Companies on Carta were the target in 170 M&A transactions during Q3, and 163 more in Q4. With a combined 333 deals, it was the busiest second half of a year in the startup M&A market dating back to at least 2019.
For the year, there were 642 M&A transactions targeting startups on Carta in 2024. Again, that’s the highest annual total since at least 2019, edging out the 640 M&A deals that took place in 2022.
The past three years have been a fallow time for IPOs, one of the most common exit pathways for mature private companies. Last year’s increase in M&A activity could be a welcome sign for investors who have grown eager for liquidity among this recent exit chill.
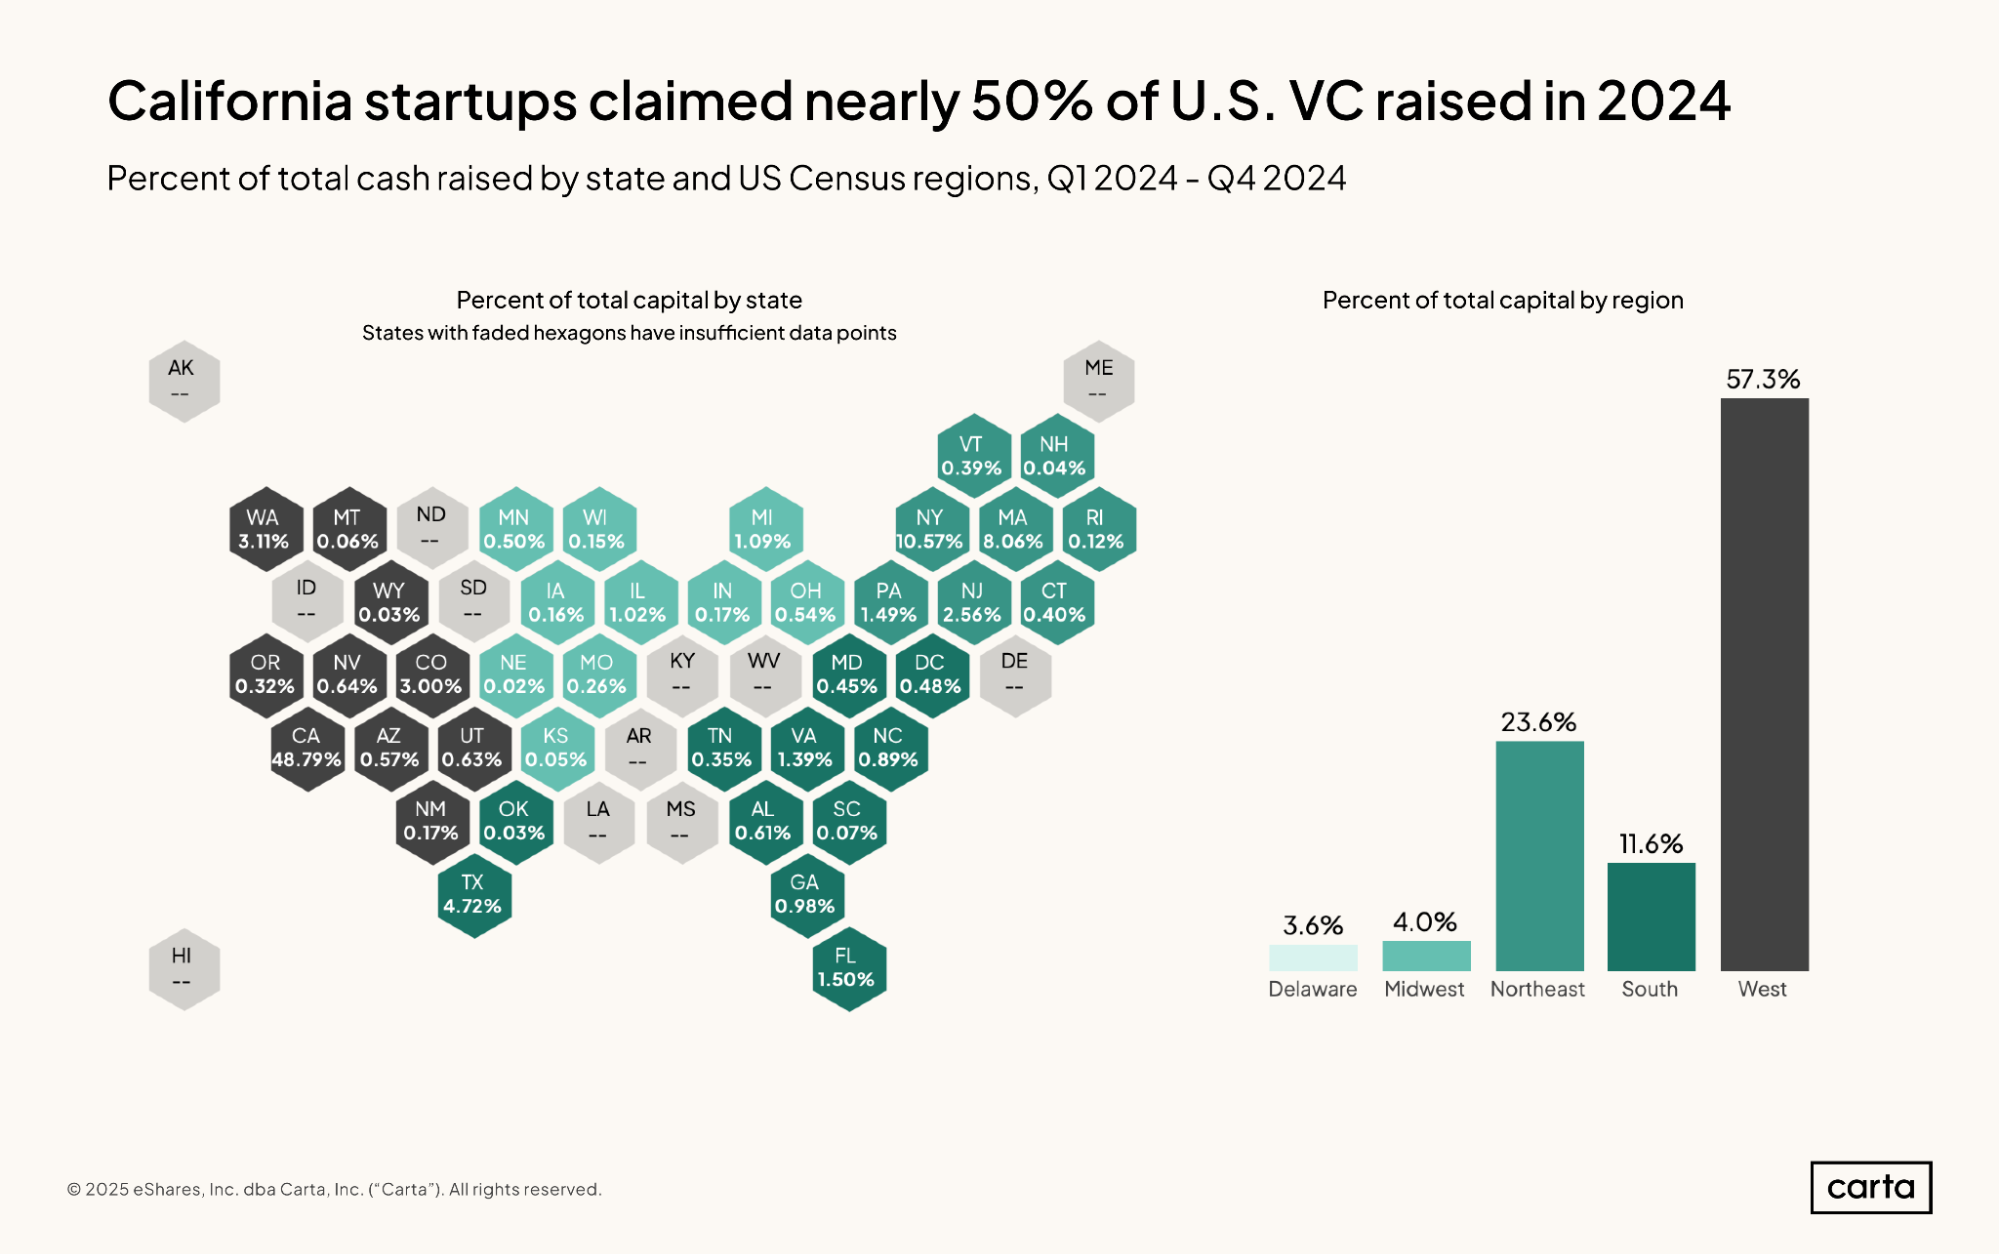
California retained its usual perch atop the venture roost in 2024. Startups based in the state were responsible for nearly 49% of all cash raised in the U.S. last year, excluding data from those states where fewer than 10 rounds occurred. California claimed nearly 5x more capital raised last year than New York, which ranked second among all states with a 10.57% share of cash raised. Massachusetts sits in third place on the state leaderboard, with Texas in fourth.
The West region as a whole was home to 57.3% of cash raised in 2024. California was responsible for the bulk of this fundraising, of course. But Washington (3.11%) and Colorado (3%) also play sizable roles, ranking fifth and sixth among all states in fundraising share, respectively.
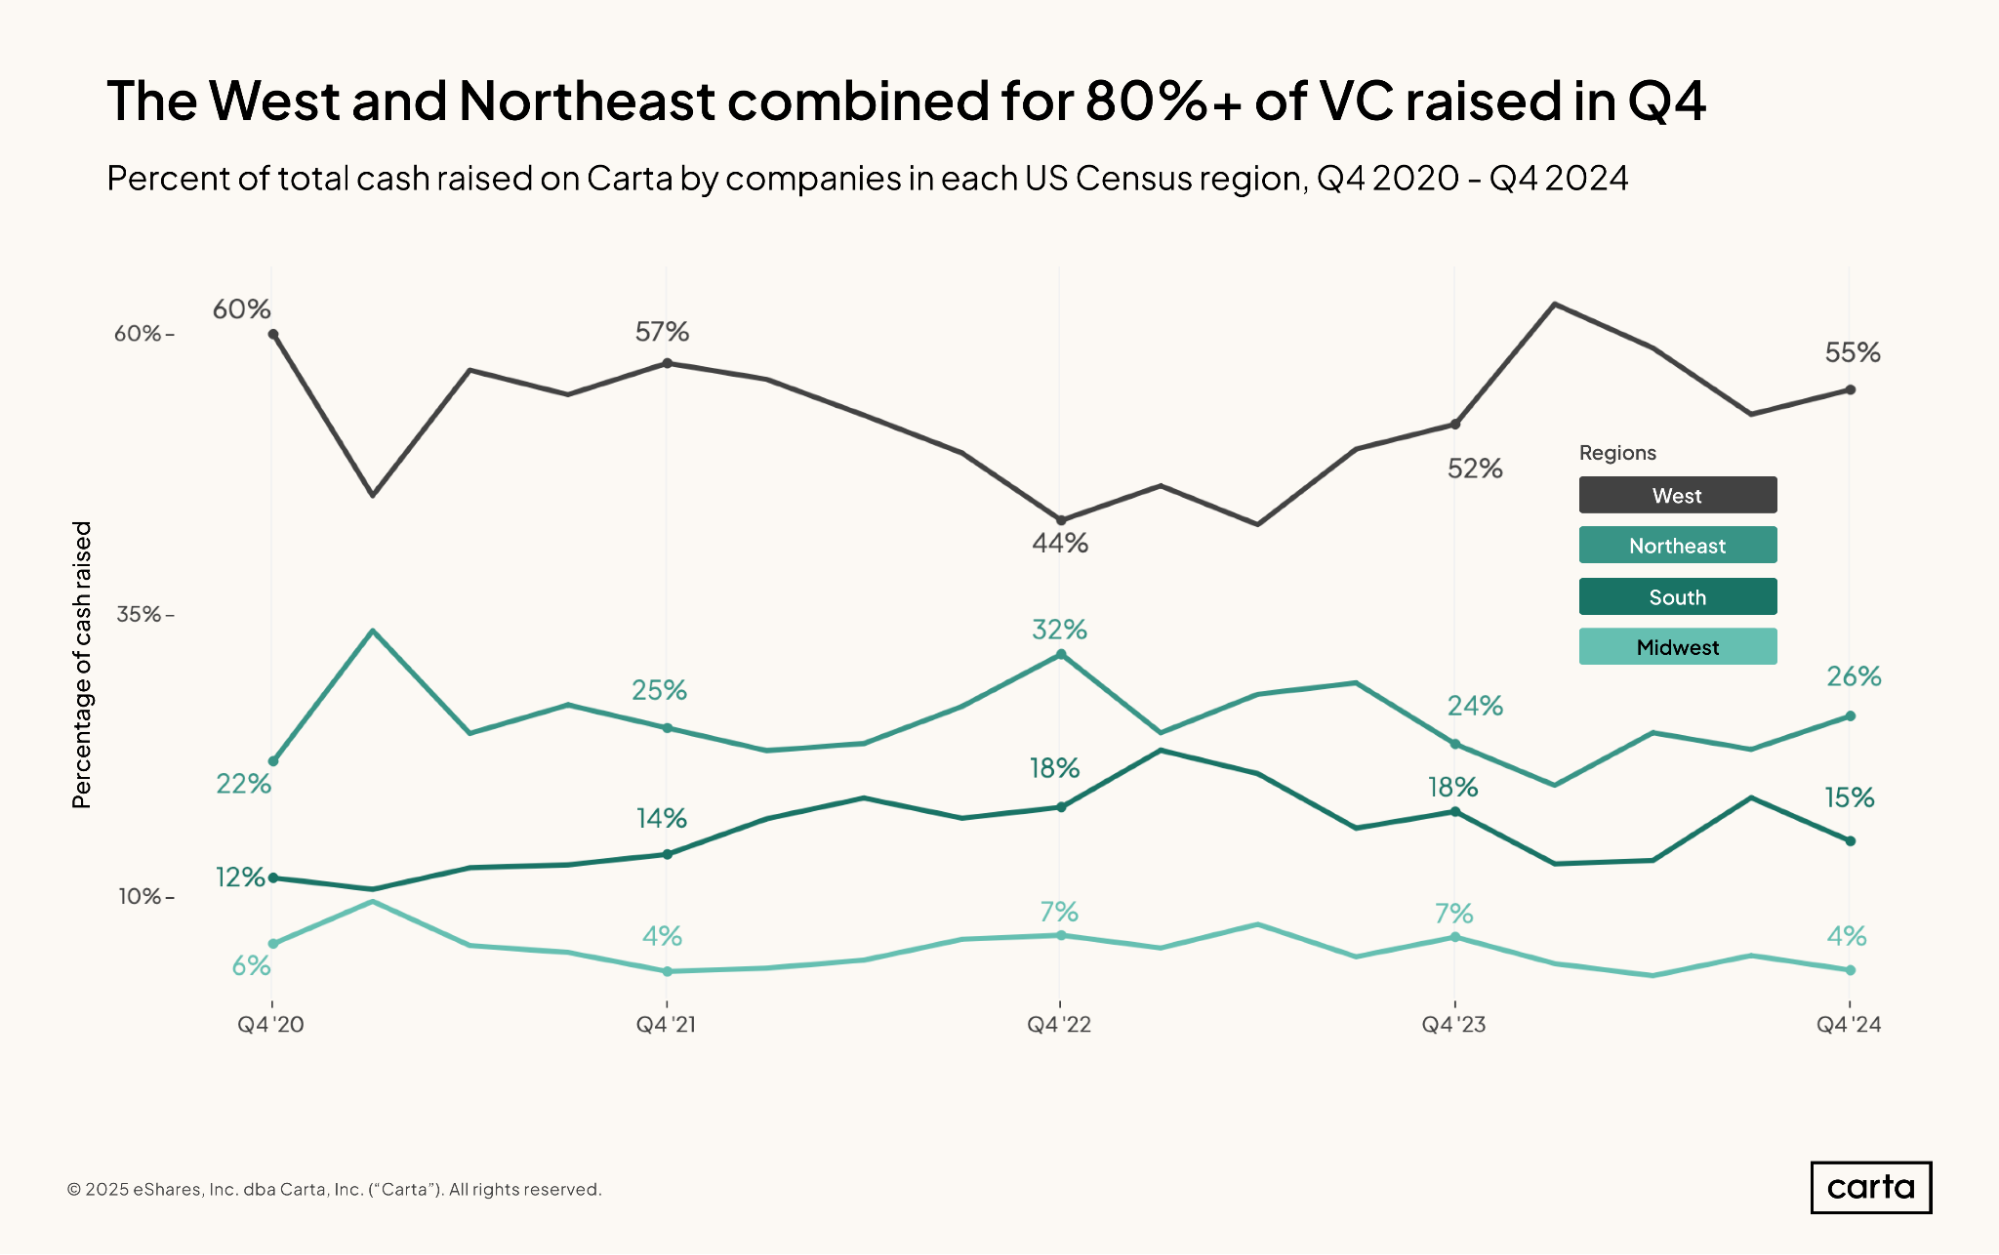
In terms of their share of all venture capital raised, the pecking order among the four U.S. census regions has remained unchanged over the past four years. Startups from the West raise more capital than the rest, followed in descending order by the Northeast, the South, and the Midwest.
In Q4, the West’s share of the market sat at 55%, in line with its typical range so far during the 2020s. The Midwest, meanwhile, sank to 4% of all VC raised, tying its lowest point of the past four years.
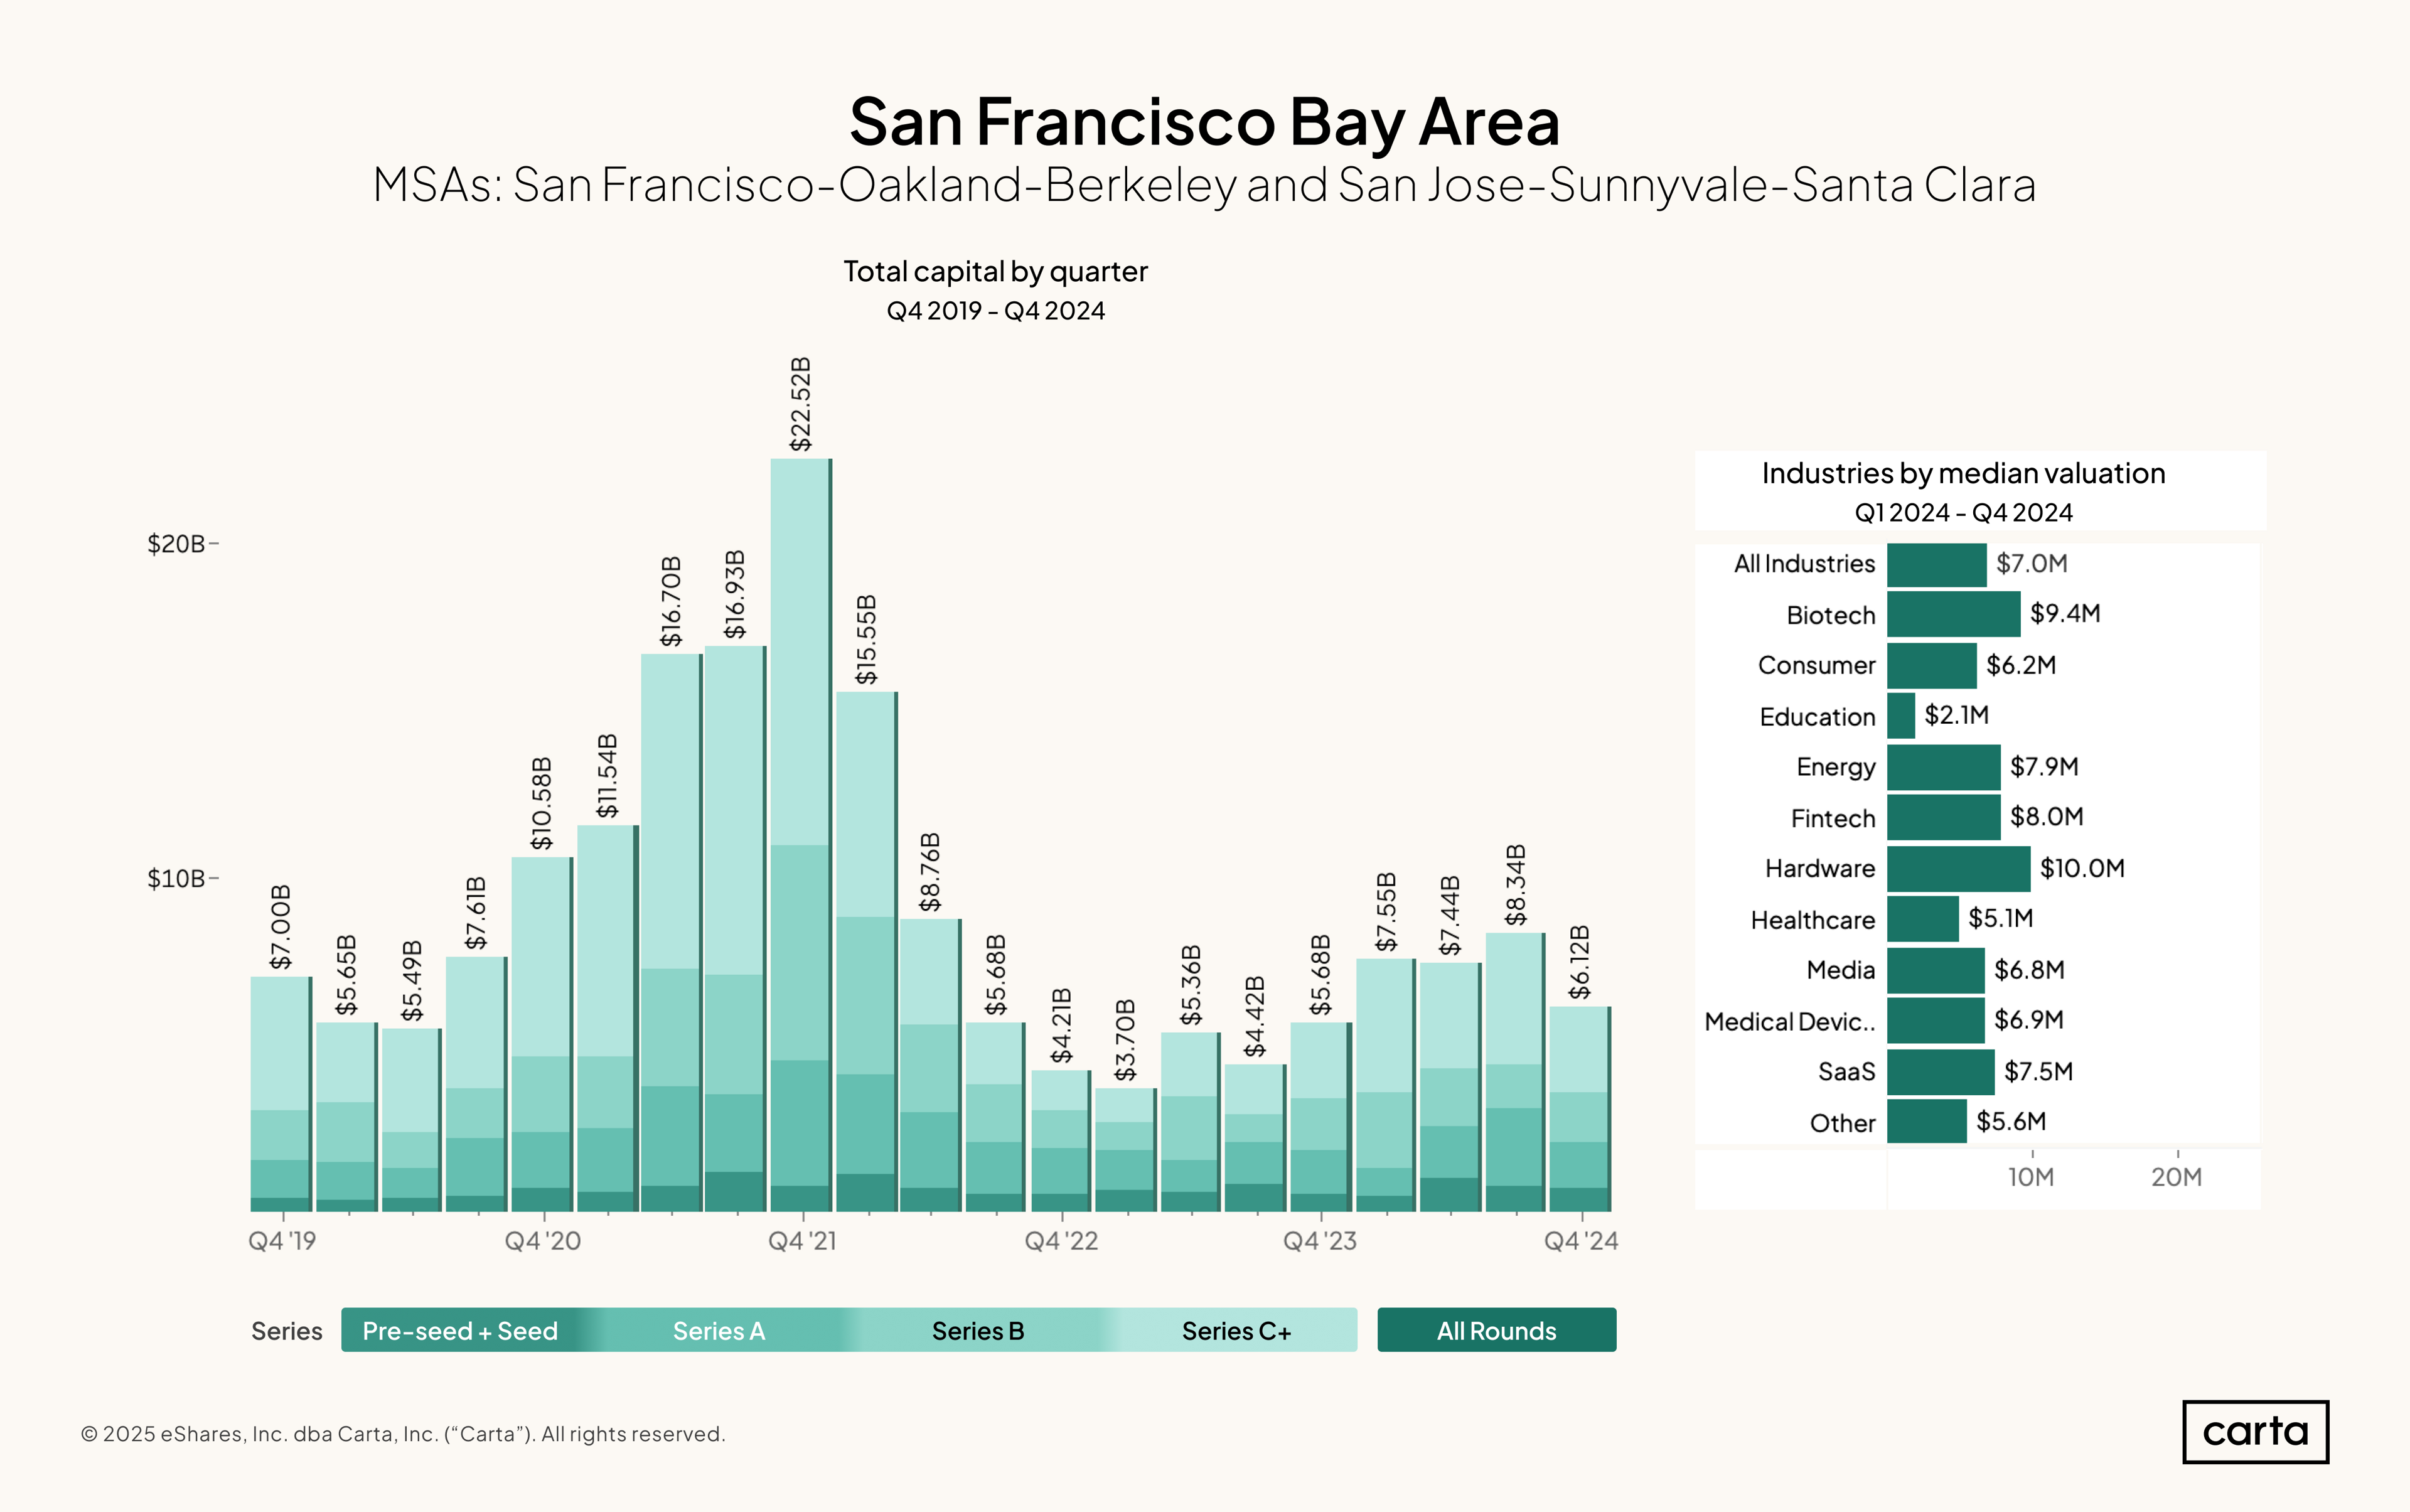
Startups based in the San Francisco Bay Area combined to raise $29.45 billion in new funding over the course of 2024. That’s a 54% increase over the total cash raised in 2023, which was the weakest year on record. Last year’s uptick was led by a strong Q3, when Bay Area startups combined to raise $8.34 billion.
Across all stages and all sectors, the median valuation on new funding rounds in the Bay Area in 2024 was $7 million. This is higher than any of the other major metro areas included in this report; second place goes to Boston, where the median valuation in 2024 was $6 million.
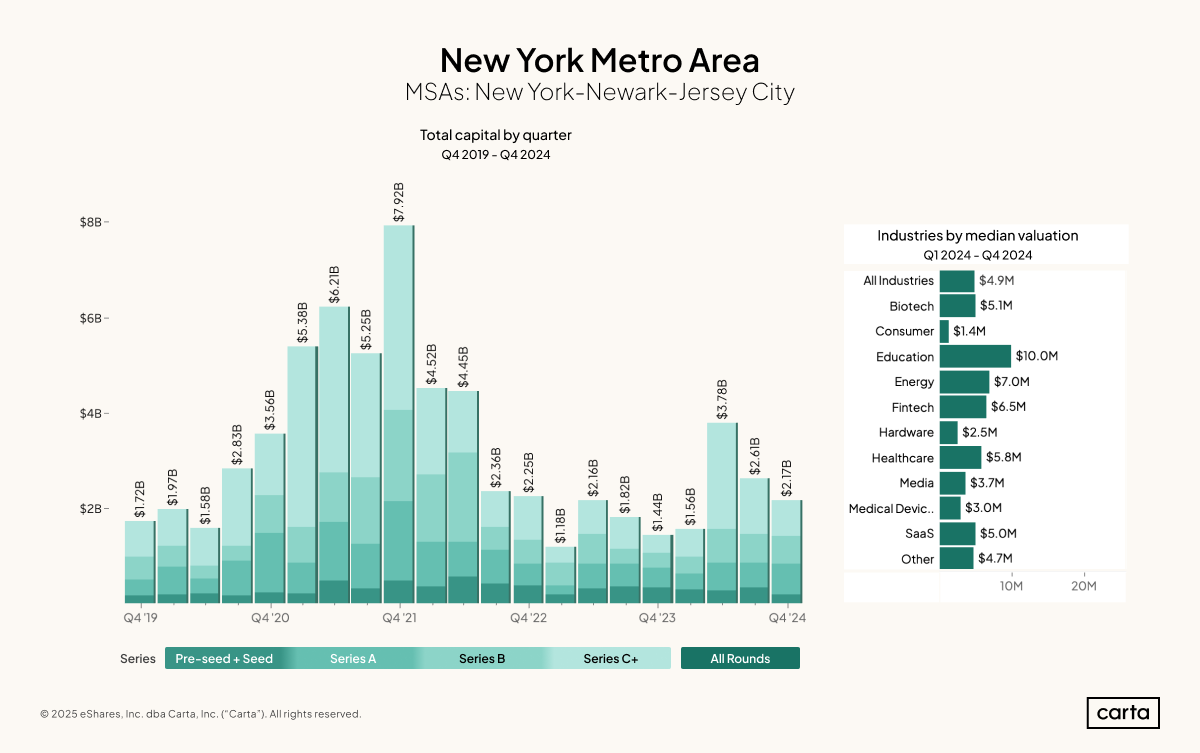
It was a healthy year for venture fundraising in and around New York: Startups in the New York metro area combined to raise over $10.1 billion in 2024, up 53% year over year. That figure is quite similar to the 54% year-over-year increase in cash raised we saw in the Bay Area.
For comparison’s sake, the annual increase in cash raised in 2024 across all geographies was 18.4%. Relative to the rest of the country, the Bay Area and New York both had a stronger bounce-back in 2024.
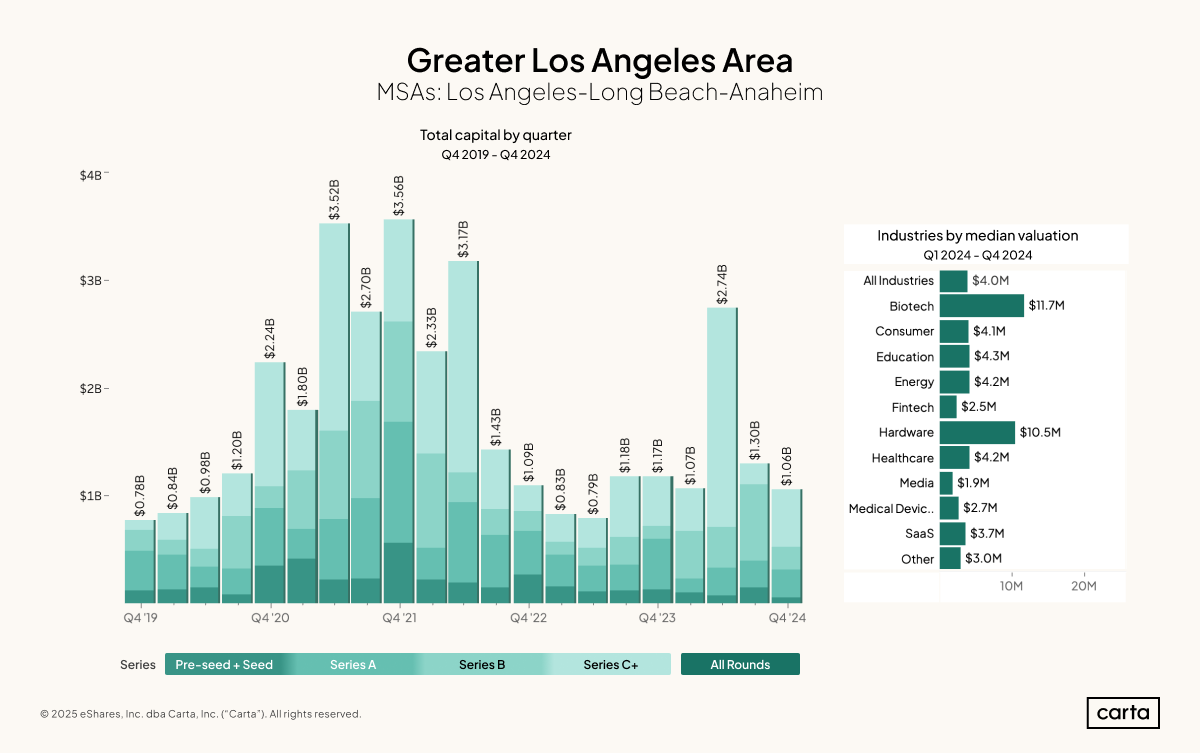
Startups in the greater Los Angeles area raised between $1 billion and $1.3 billion in three of last year’s four quarters. The exception came in Q2, when Los Angeles startups brought in $2.74 billion—the fourth highest quarterly sum of the past five years. More than $2 billion of that Q3 capital was invested at Series C or later.
Across all stages and all sectors, the median valuation for startups that raised venture funding in the Los Angeles metro during 2024 was $4 million. In most specific sectors, median valuations aren’t too far away from that figure. But there are two clear exceptions: biotech, where the median valuation was $11.7 million, and hardware, where it was $10.5 million.
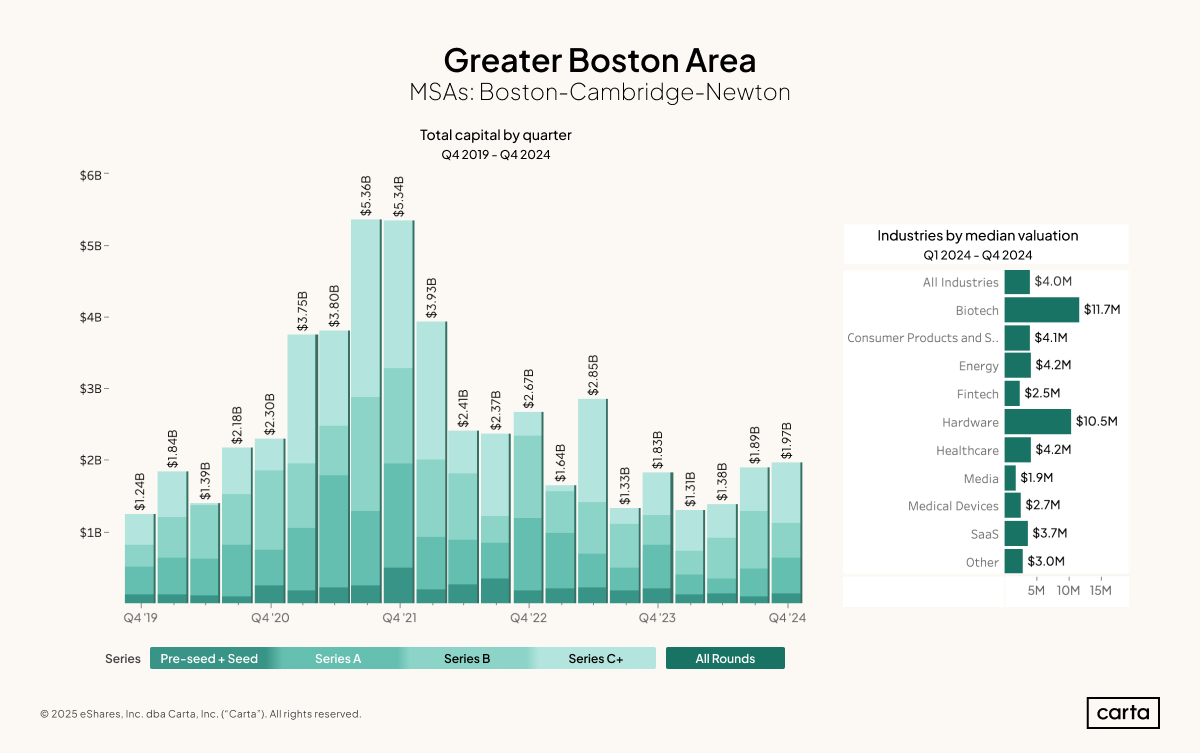
It was a year of gradual growth for venture fundraising in Boston. The metro area’s combined total for cash raised has now increased in three straight quarters, most recently jumping to $1.97 billion during Q4—the highest quarterly sum since Q2 2023.
Boston is a hotspot for startup activity in the healthcare space. So it makes sense that the median valuation for biotech startups in 2024 was higher in Boston than any of the other metros included in this report, at $13.4 million. Boston also claims the highest median valuation for energy startups out of any metro in this report, at $8.5 million.
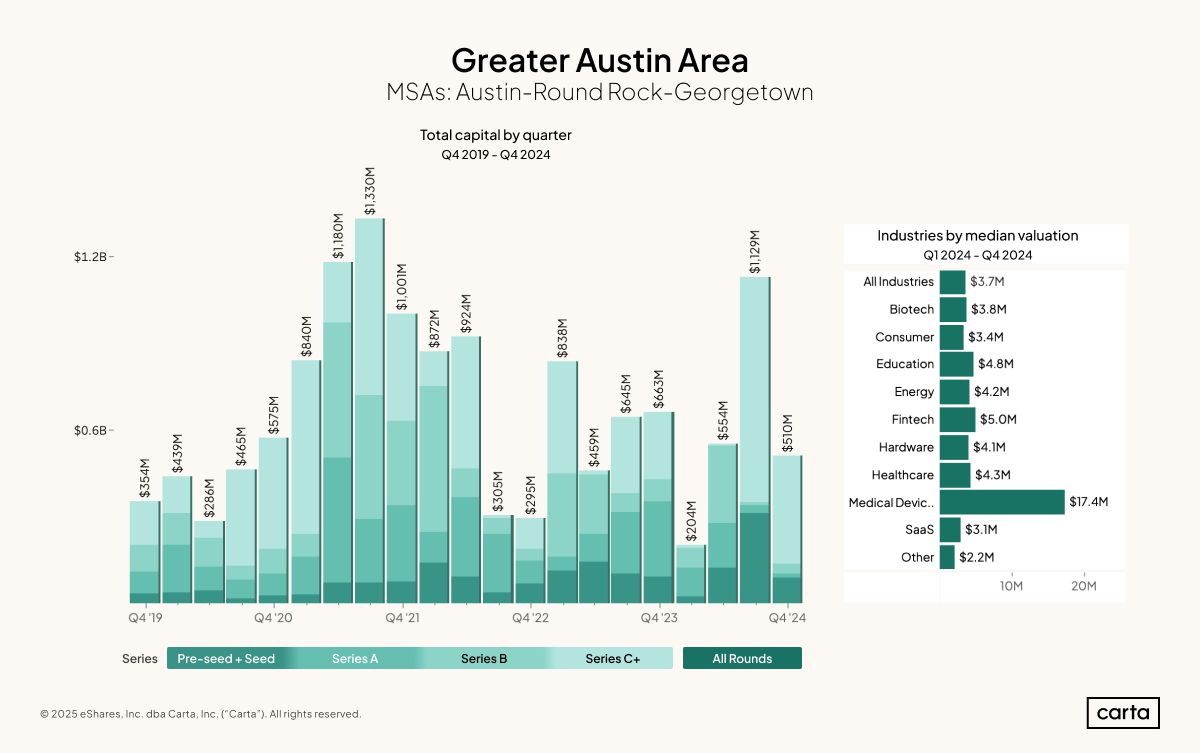
More so than some of the other major metros in this report, the fundraising environment in Austin can vary from one quarter to the next. In Q3 2024, startups in the Austin metro area combined to bring in more than $1.1 billion. The next quarter, that figure declined by more than half.
This volatility in fundraising totals seems to apply across all stages of startup life in Austin. In Q3, for instance, pre-seed startups in the region combined to raise $311 million. In Q4, that pre-seed funding figure fell to $88 million, a quarter-over-quarter dropoff of 72%.
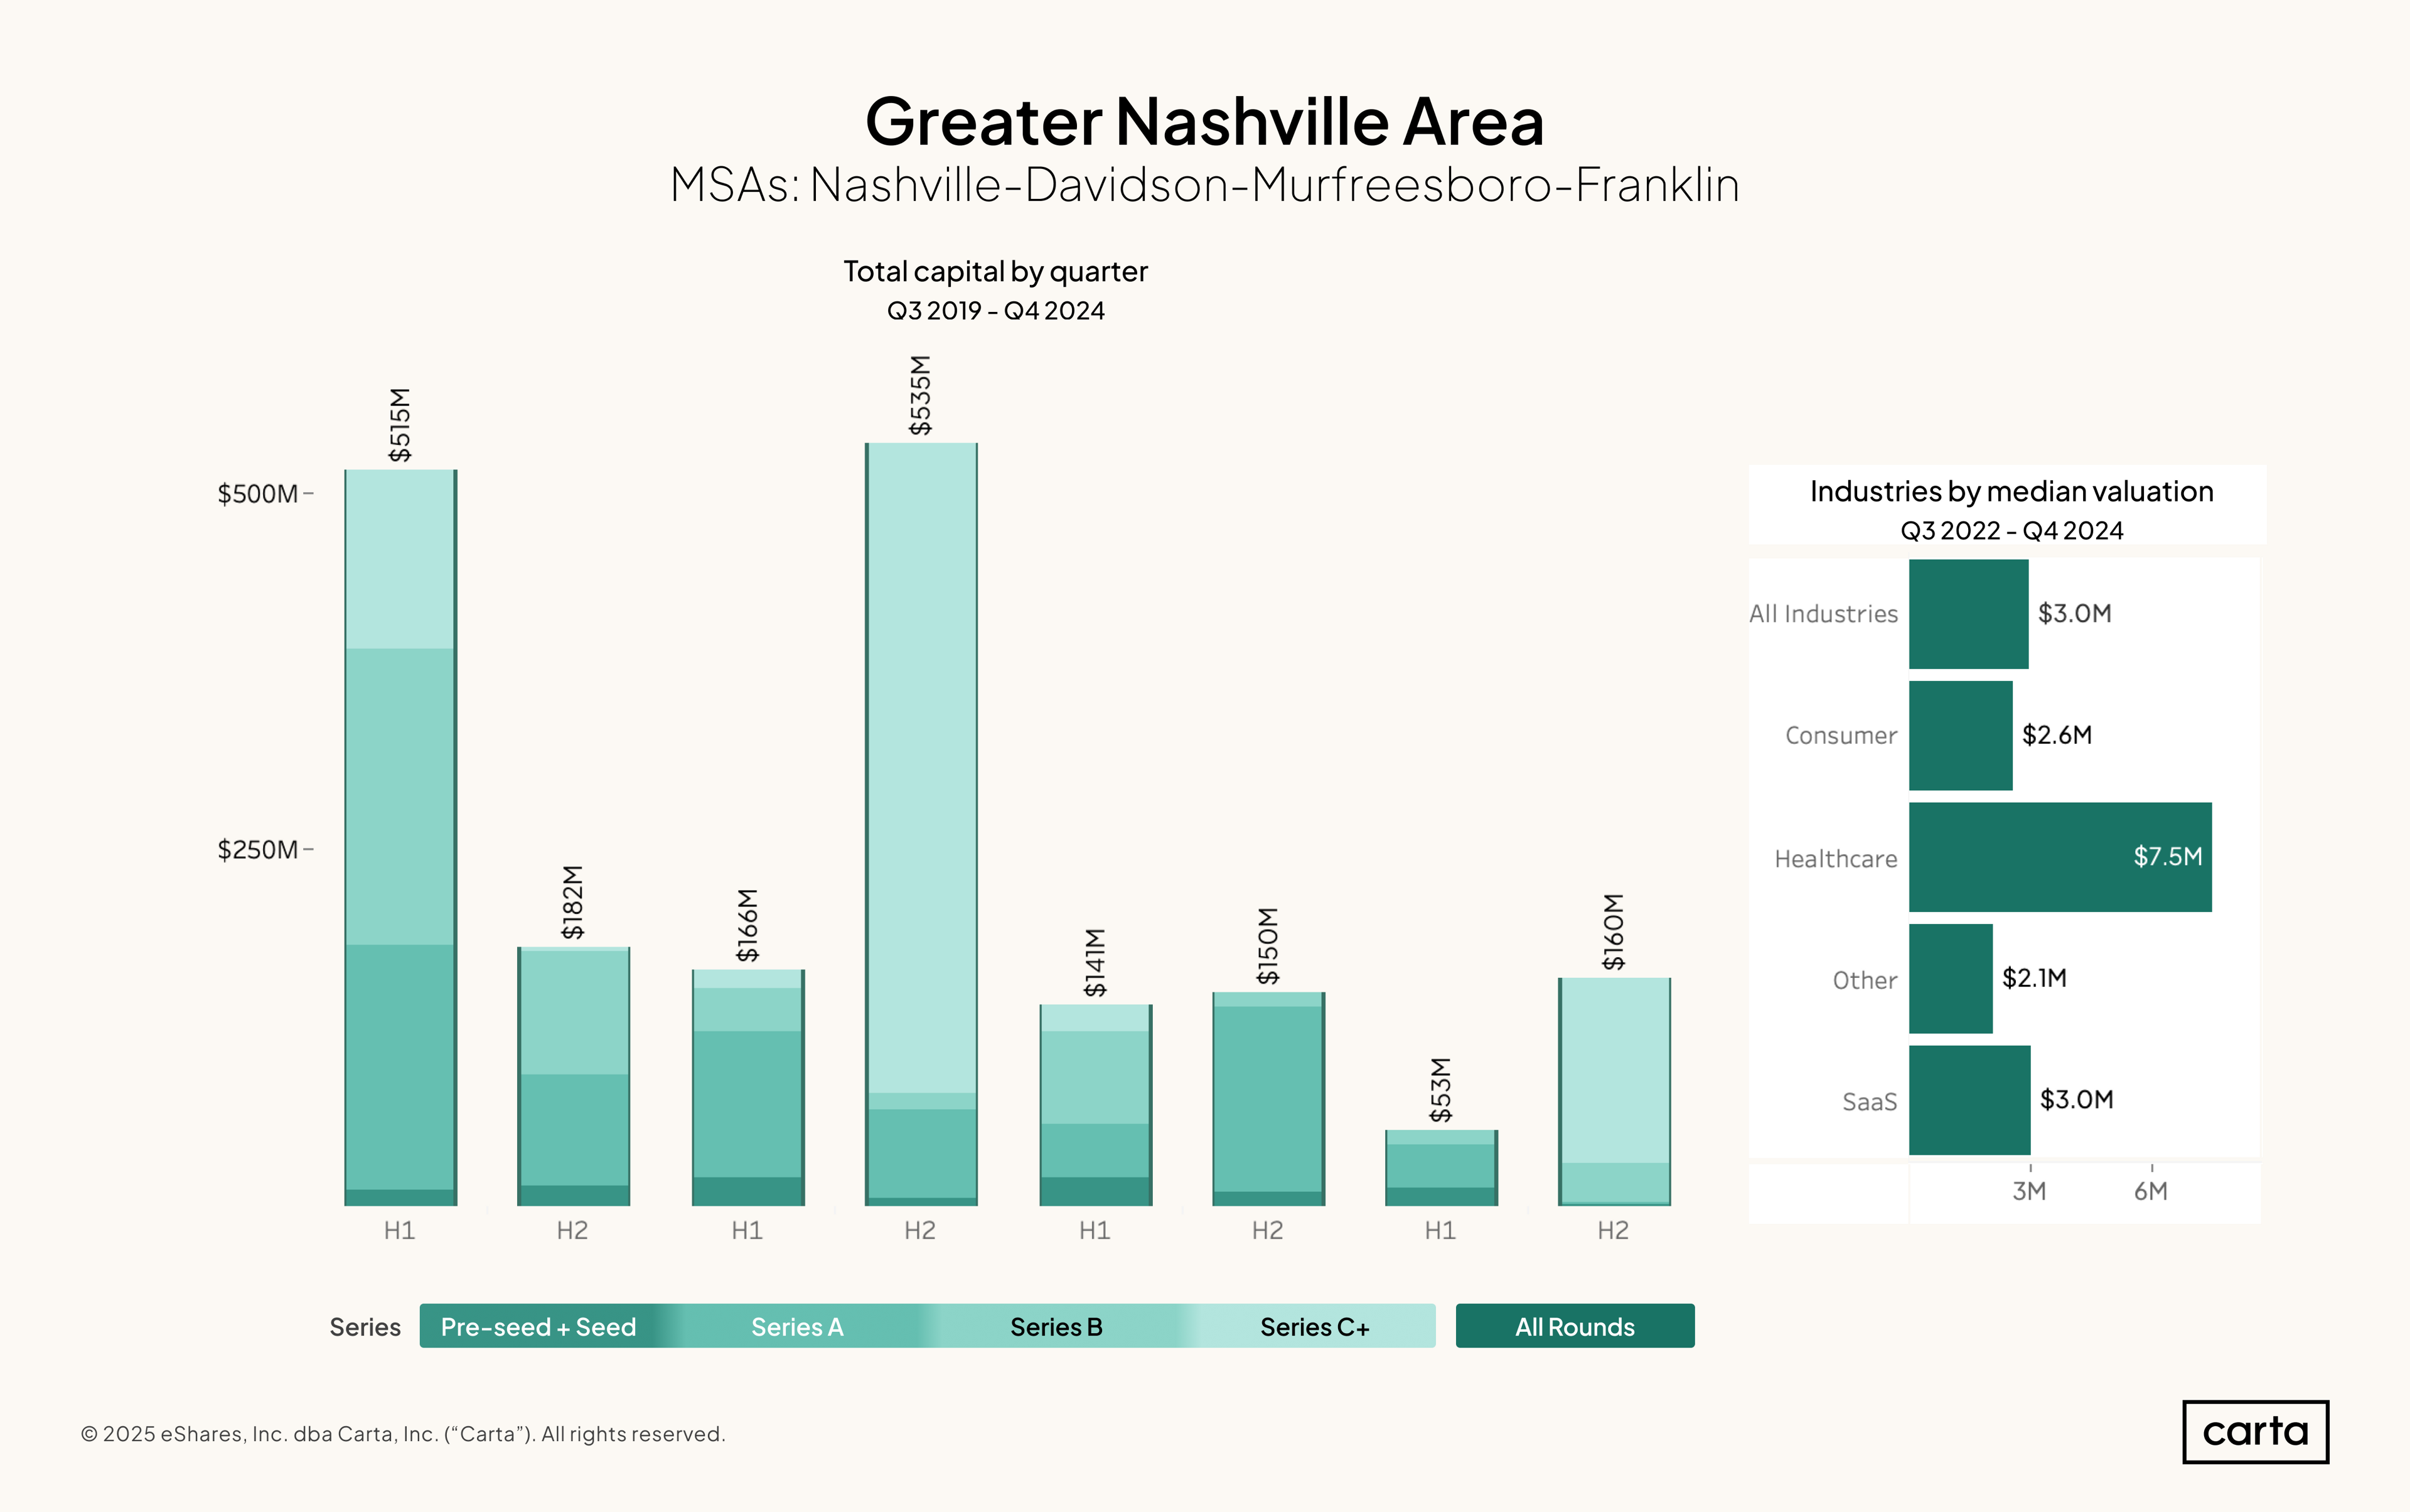
Nashville is one of a few metro areas across the South that has emerged in recent years as a growing hub for venture activity. The past 12 months, however, were a relatively slow stretch. Startups in the area totaled $213 million in new venture funding raised in 2024, a 27% decline from the previous year.
Across all stages, the median valuation for Nashville startups that closed a round last year was $3 million. That’s lower than more-established venture hubs such as Boston, Los Angeles, and the Bay Area. Within the healthcare industry, however, the median Nashville startup attained a $7.5 million valuation last year, which is higher than any other metro included in this report.
Download all the charts
Download this quarter's report in PDF form:
Methodology
Carta helps more than 45,000 primarily venture-backed companies and 2.4 million security holders manage over $3.0 trillion in equity. We share insights from this unmatched dataset about the private markets and venture ecosystem to help founders, employees, and investors make informed decisions and understand market conditions.
Overview
This study uses an aggregated and anonymized sample of Carta customer data. Companies that have contractually requested that we not use their data in anonymized and aggregated studies are not included in this analysis.
The data presented in this private markets report represents a snapshot as of December 31, 2024. Historical data may change in future studies because there is typically an administrative lag between the time a transaction took place and when it is recorded in Carta. In addition, new companies signing up for Carta’s services will increase historical data available for the report.
Financings
Financings include equity deals raised in USD by U.S.-based corporations. The financing “series” (e.g. Series A) is taken from the share class name in their applicable certificate or articles of incorporation. Financing rounds that don’t follow this standard are not included in any data shown by series but are included in data not shown by series. Primary rounds are defined as the first equity round within a series. Bridge rounds are defined as any round raised after the first round in a given series.
In some cases, convertible notes are raised and converted at various discounted prices within a series (e.g. Series A-1, Series A-2, Series A-3). In these cases, converted securities are not included in cash raised, and only the post-money valuation of the new money is included.