Back in 2022, the median venture fund with between $100 million and $250 million in assets under management had raised that capital from 83 different LPs, the highest number in recent history.
It seemed like allocators of all kinds were eager to gain access to an asset class in the middle of an unprecedented boom.
But that boom has since come to an end. For some LPs, this was cause to pull back. By 2024, the median number of LPs for VC funds between $100 million and $250 million had fallen to 47, a reduction of nearly 50%.
To make up for this downsizing of the typical investor base, some of the LPs that are still investing in new venture funds are writing significantly larger checks. In 2022, the median size of the biggest check written for funds with between $100 million and $250 million in AUM was $23.1 million. In 2024, it was more than 50% higher, at $35 million.
Over the past three years, venture fund managers and their LPs have had to adapt to a long list of new realities in the venture capital market—including shifts in the makeup of VC funds, the way that VC funds raise capital, and the typical fund performance that LPs might expect.
This report relies on data from more than 2,000 venture funds that currently use Carta Fund Administration to paint a picture of this new reality and examine its implications for VCs and LPs alike. Only U.S. funds are included in this analysis, and all included funds are direct venture investors, as opposed to funds of funds. Funds must have been in vintage years 2017 through 2024. More detail on our methodology can be found at the end of this report.
Highlights
The venture slowdown is leaving a mark: For every fund vintage from 2017 through 2020, the past two to three years have brought significant declines in median IRR. For the 2017 vintage, for instance, median IRR fell from 16.8% as of Q4 2021 to 12.0% at the end of Q4 2024.
Top decile TVPI is highest in smaller funds: In the upper tiers of performance, the smallest venture funds often post the best returns. In the 2018 vintage, the 90th percentile for TVPI among funds with $1 million to $10 million in assets is 4.03x. For funds in the same vintage with $100 million or more in assets, the 90th percentile for TVPI is 1.67x.
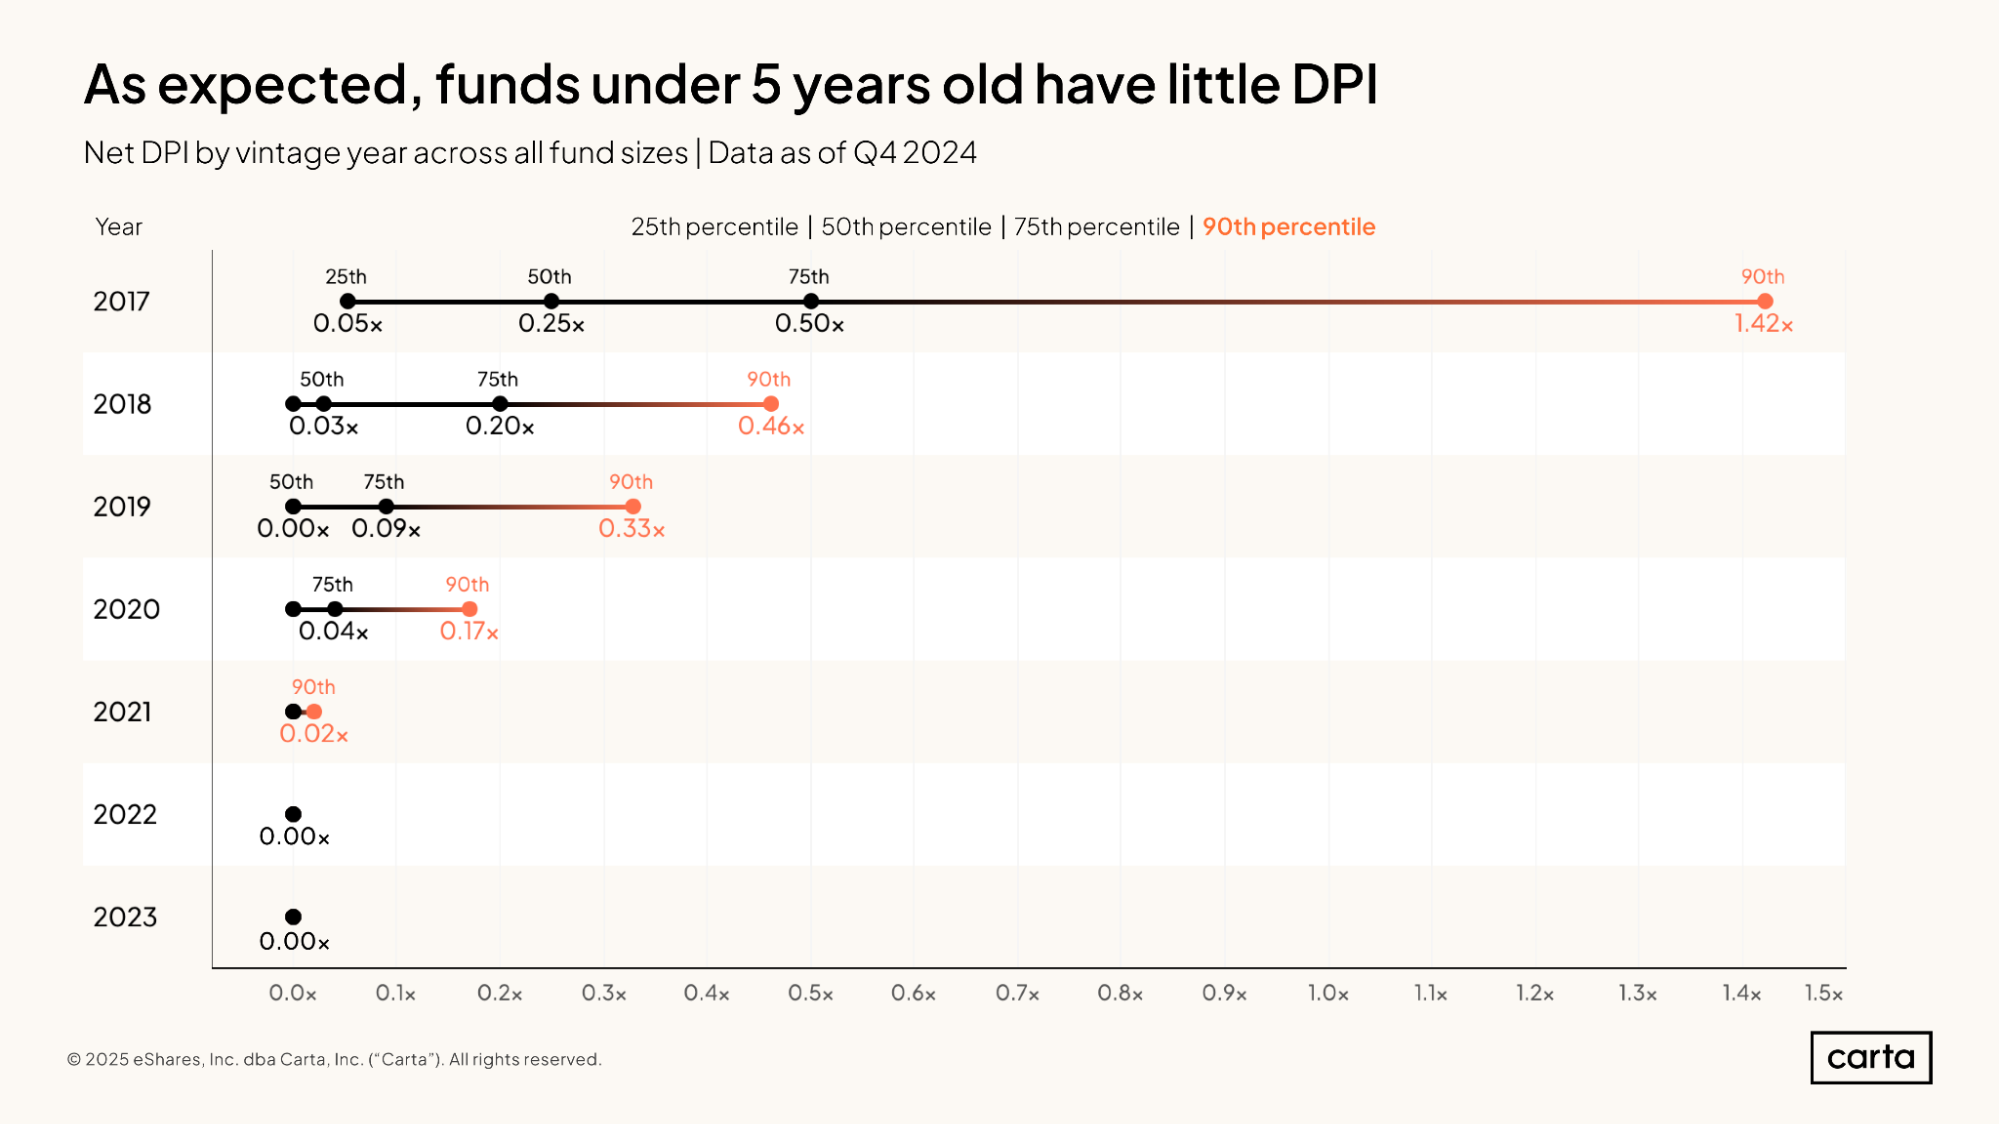
Most newer funds are still waiting for DPI: Half of all funds from the 2018 vintage have still not distributed any capital back to their LPs. For more recent vintages, distributions are even harder to find: Just 26% of funds from the 2020 vintage and 12% of funds from 2021 have begun to record DPI.
Fund details & deployment
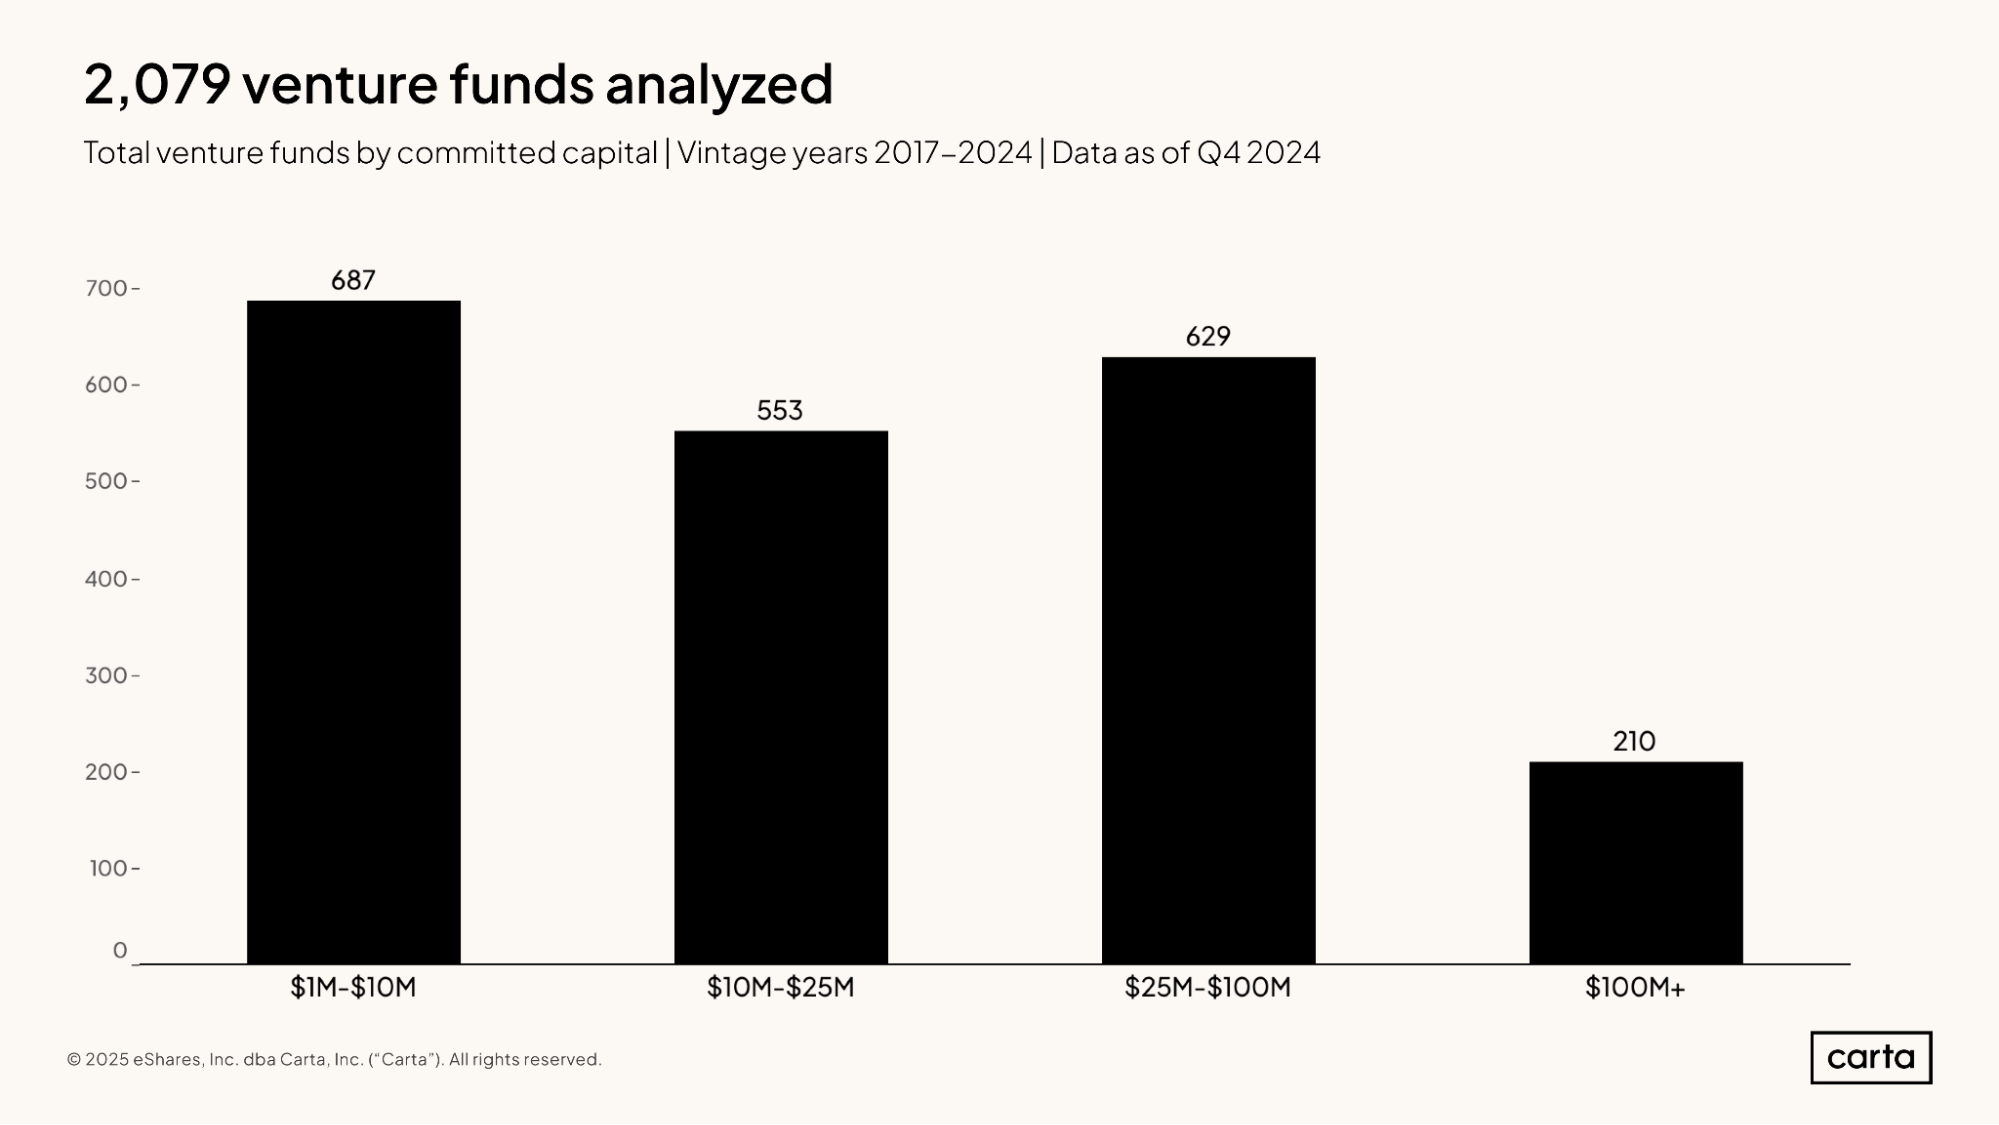
This report features data from 2,079 venture funds from across the full span of the U.S. ecosystem. About 33% of these funds have between $1 million and $10 million in assets under management. Another 27% manage between $10 million and $25 million in assets, and 30% are between $25 million and $100 million in AUM. The upper echelon of venture funds—those larger than $100 million—comprise just over 10% of the sample.
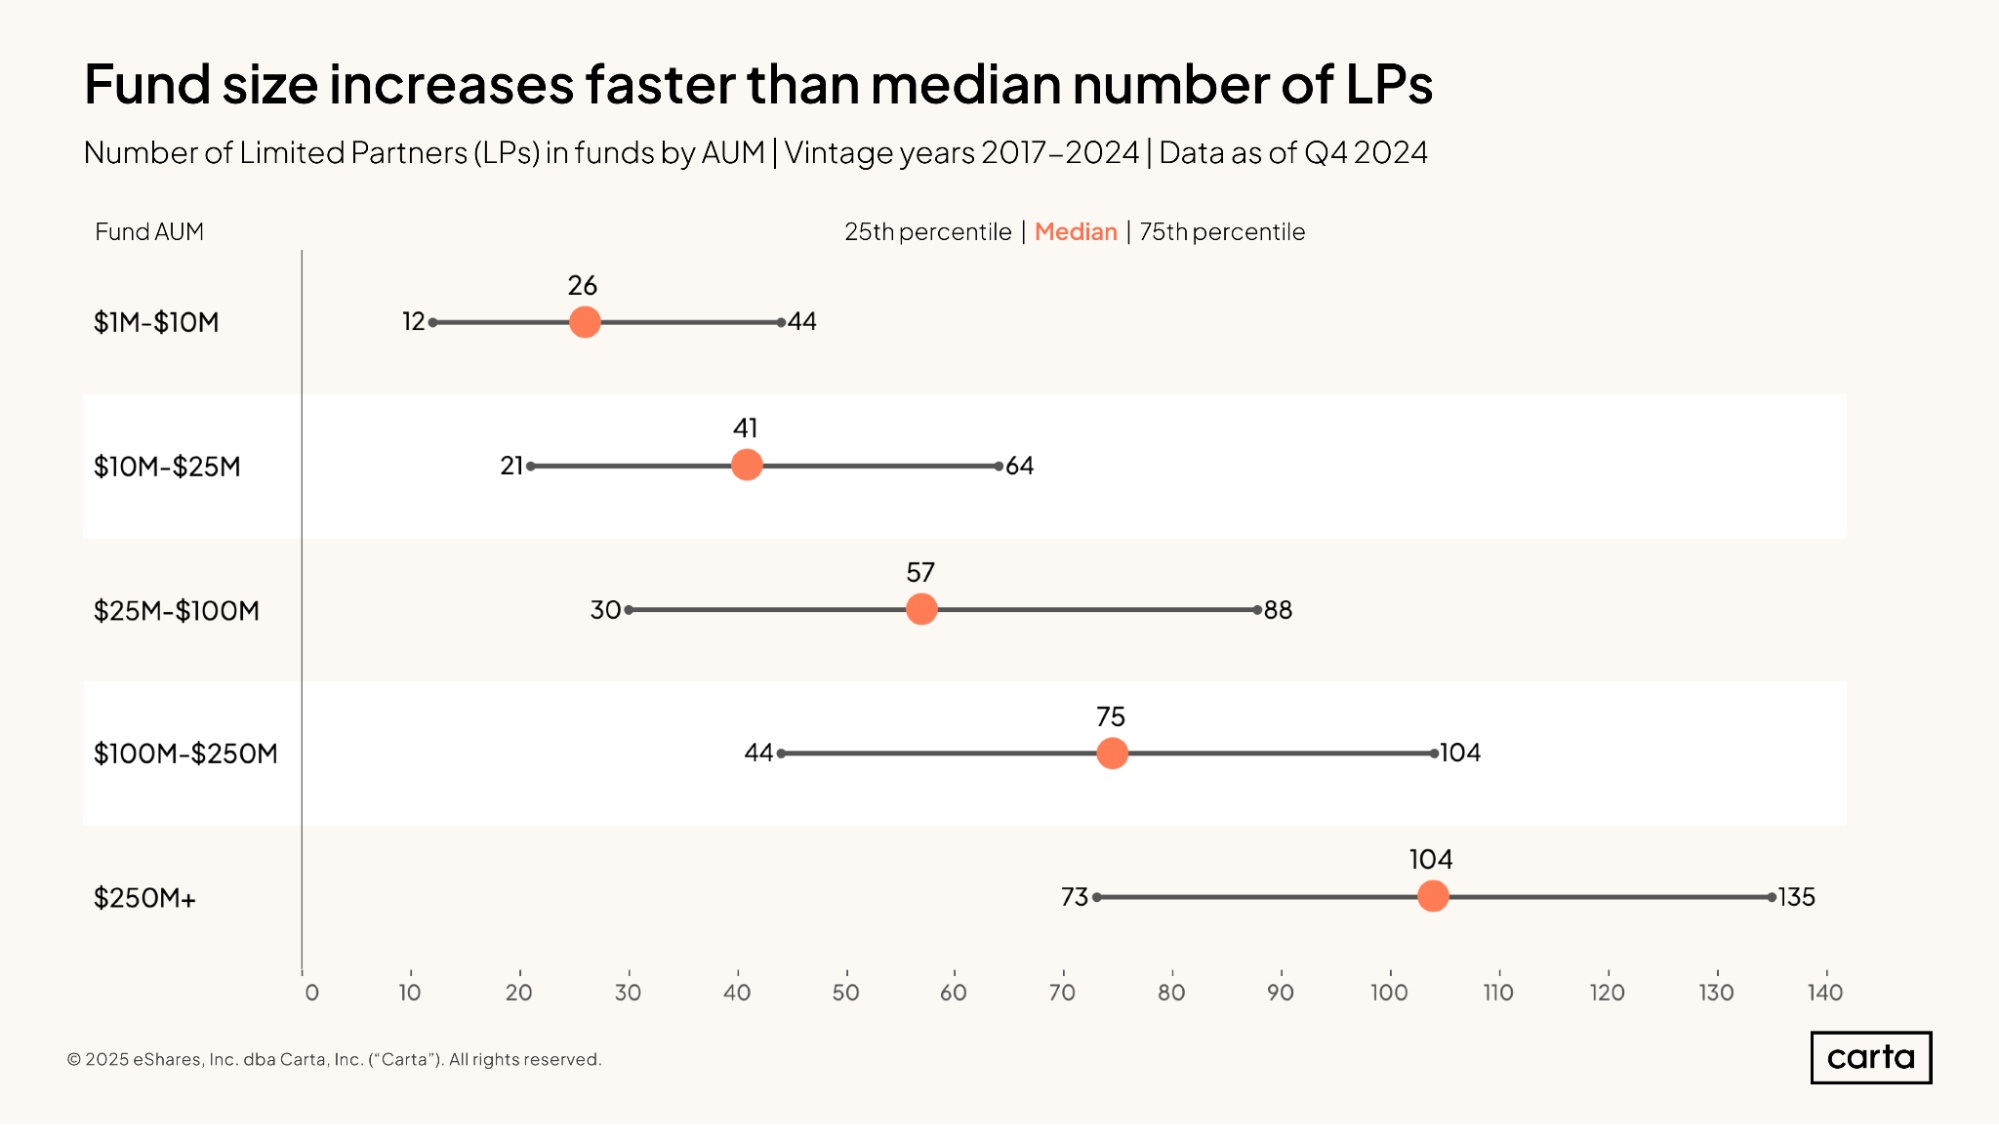
Venture funds with more assets under management also tend to have more LPs. The median fund with between $1 million and $10 million in AUM raises that capital from 26 different LPs, while the median fund with more than $250 million in AUM has 104 LPs.
While this trend of larger funds having more LPs tends to hold true across all venture fund sizes, there are also plenty of exceptions. In each of these fund size intervals, there’s a wide range between the 25th percentile for LP count and the 75th percentile. It’s possible for a $25 million fund to have more LPs than a $250 million vehicle.
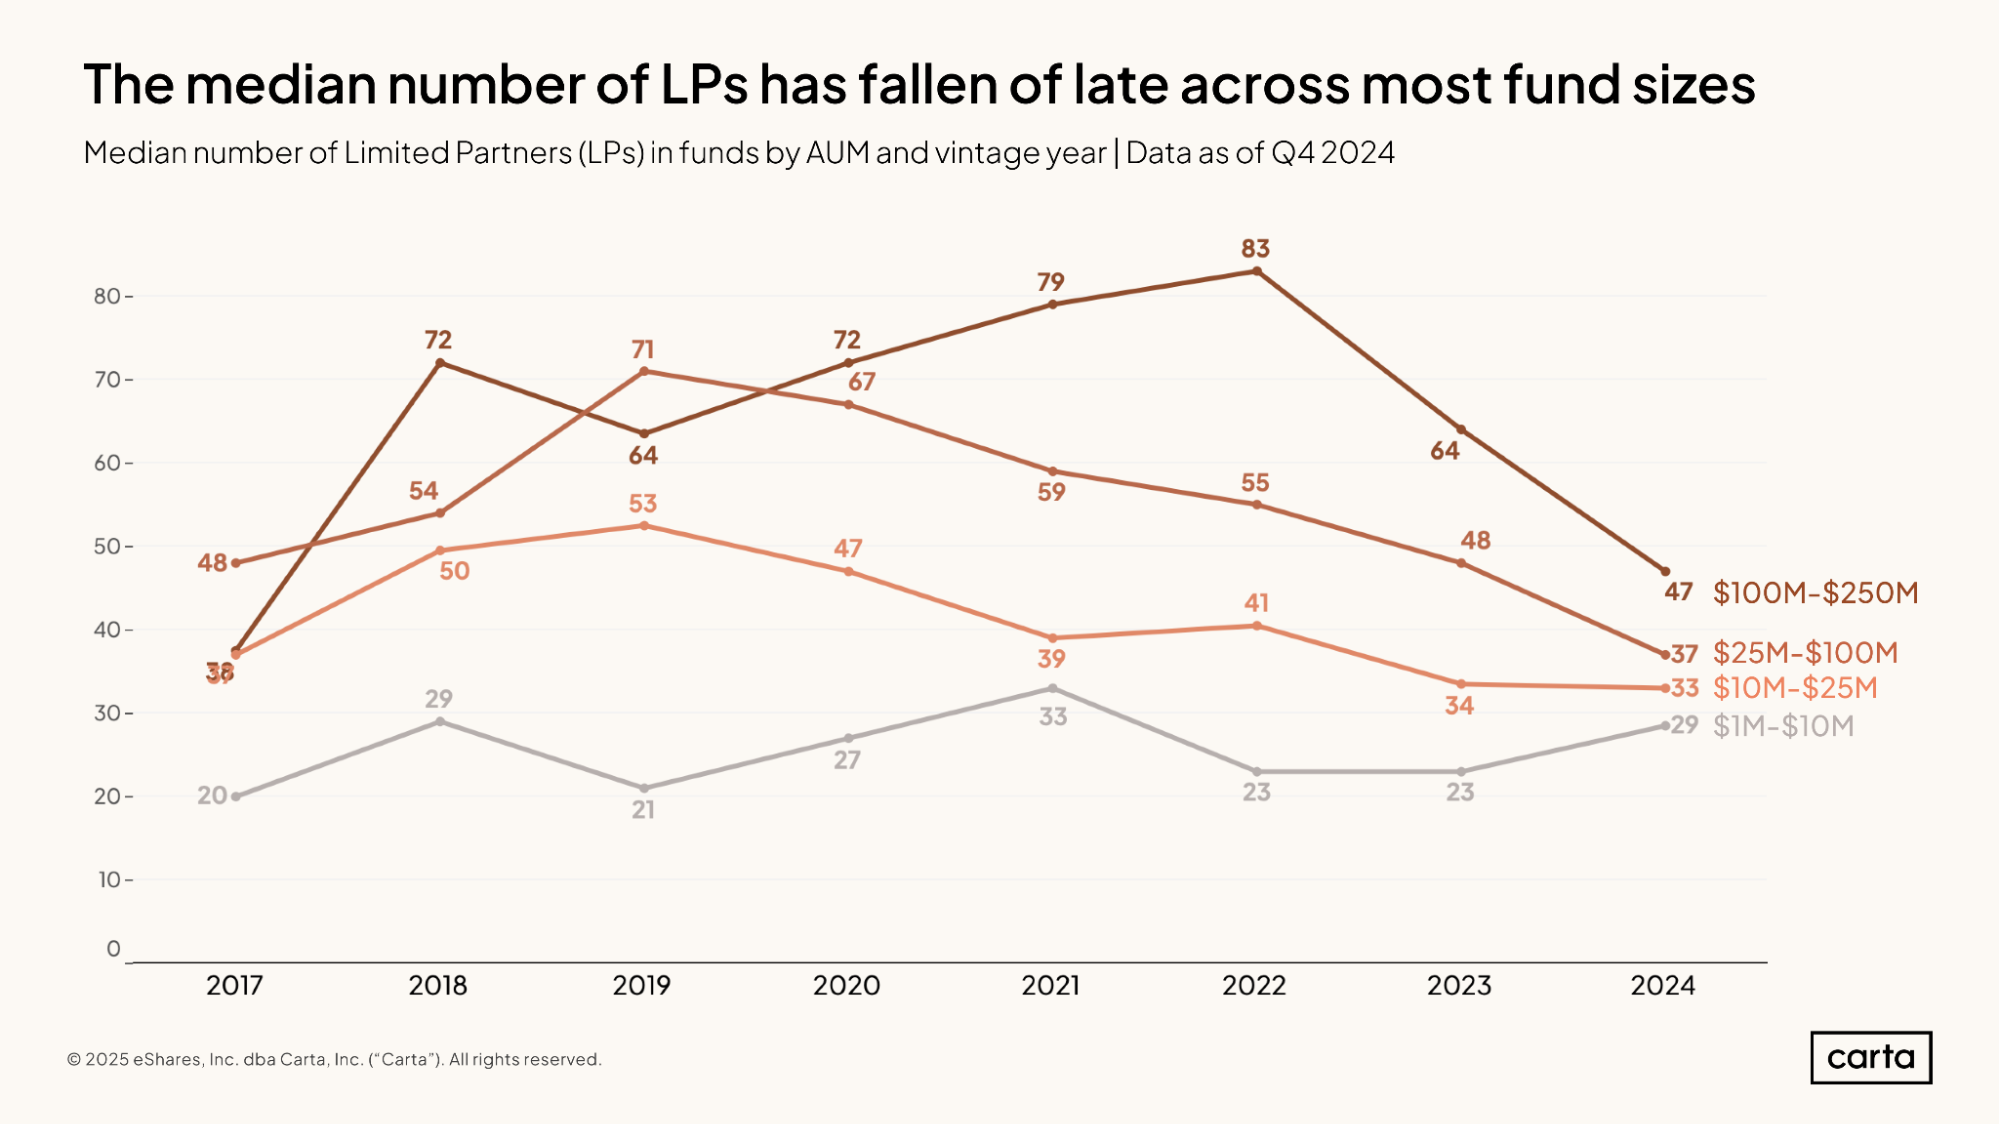
Median LP count fell by 43% between 2022 and 2024 for funds with between $100 million and $250 million and by 33% for funds with between $25 million and $100 million in assets.
Compared to the highs of the venture market in 2021 and 2022, there are fewer LPs in the market today actively looking to commit cash to new funds. As a result, fund managers are having to concentrate their fundraising among fewer capital sources.
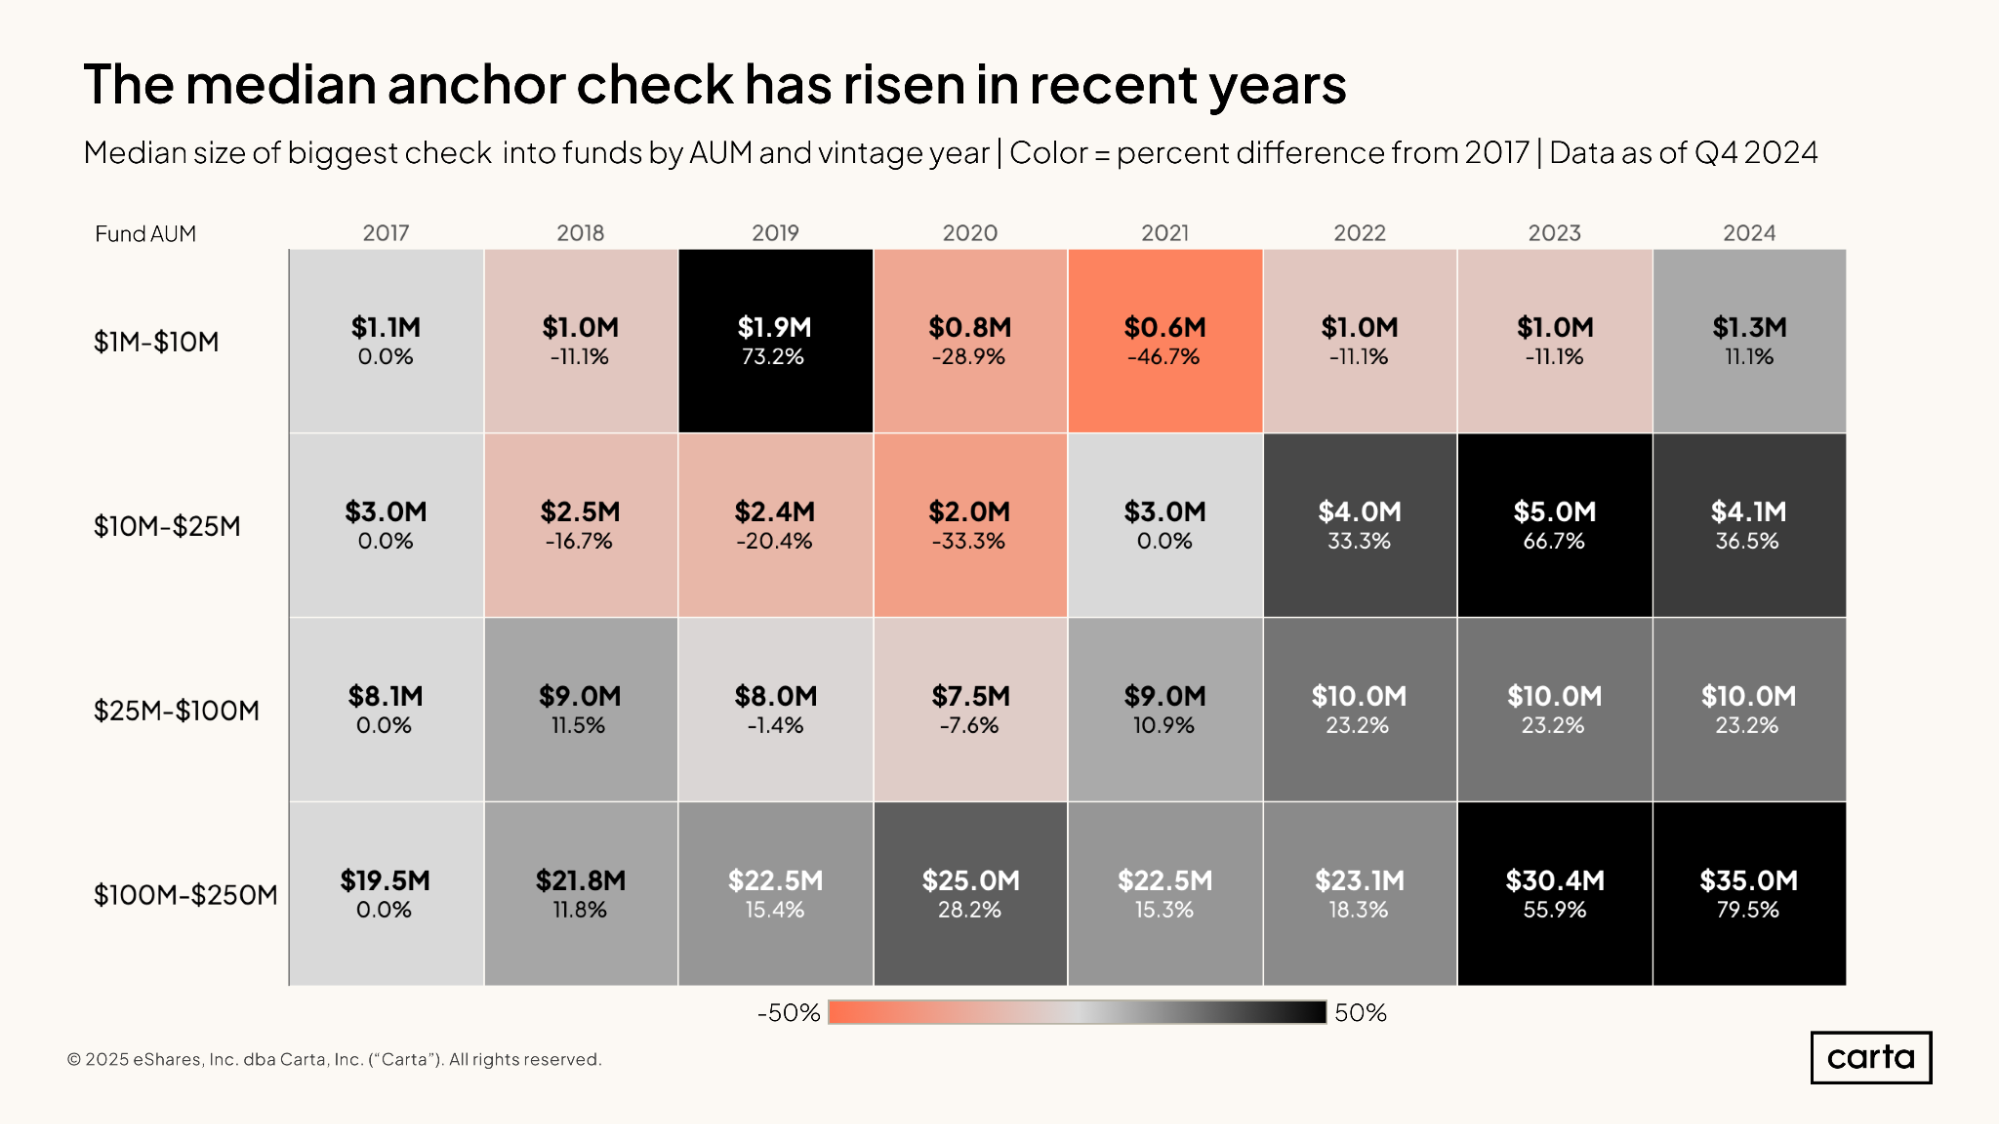
The largest contribution to a venture fund by any one LP is referred to as the anchor check. Across all fund sizes, the median size of this anchor check is rising in both the short term and the long term.
For funds with between $100 million and $250 million in assets, the median anchor check rose from $19.5 million in 2017 to $25 million in 2020. Since then, it’s continued to climb, reaching $35 million in 2024.
This trend is likely related to a “flight to quality” phenomenon, where LPs deploy capital into fewer funds, thereby increasing the median check size.
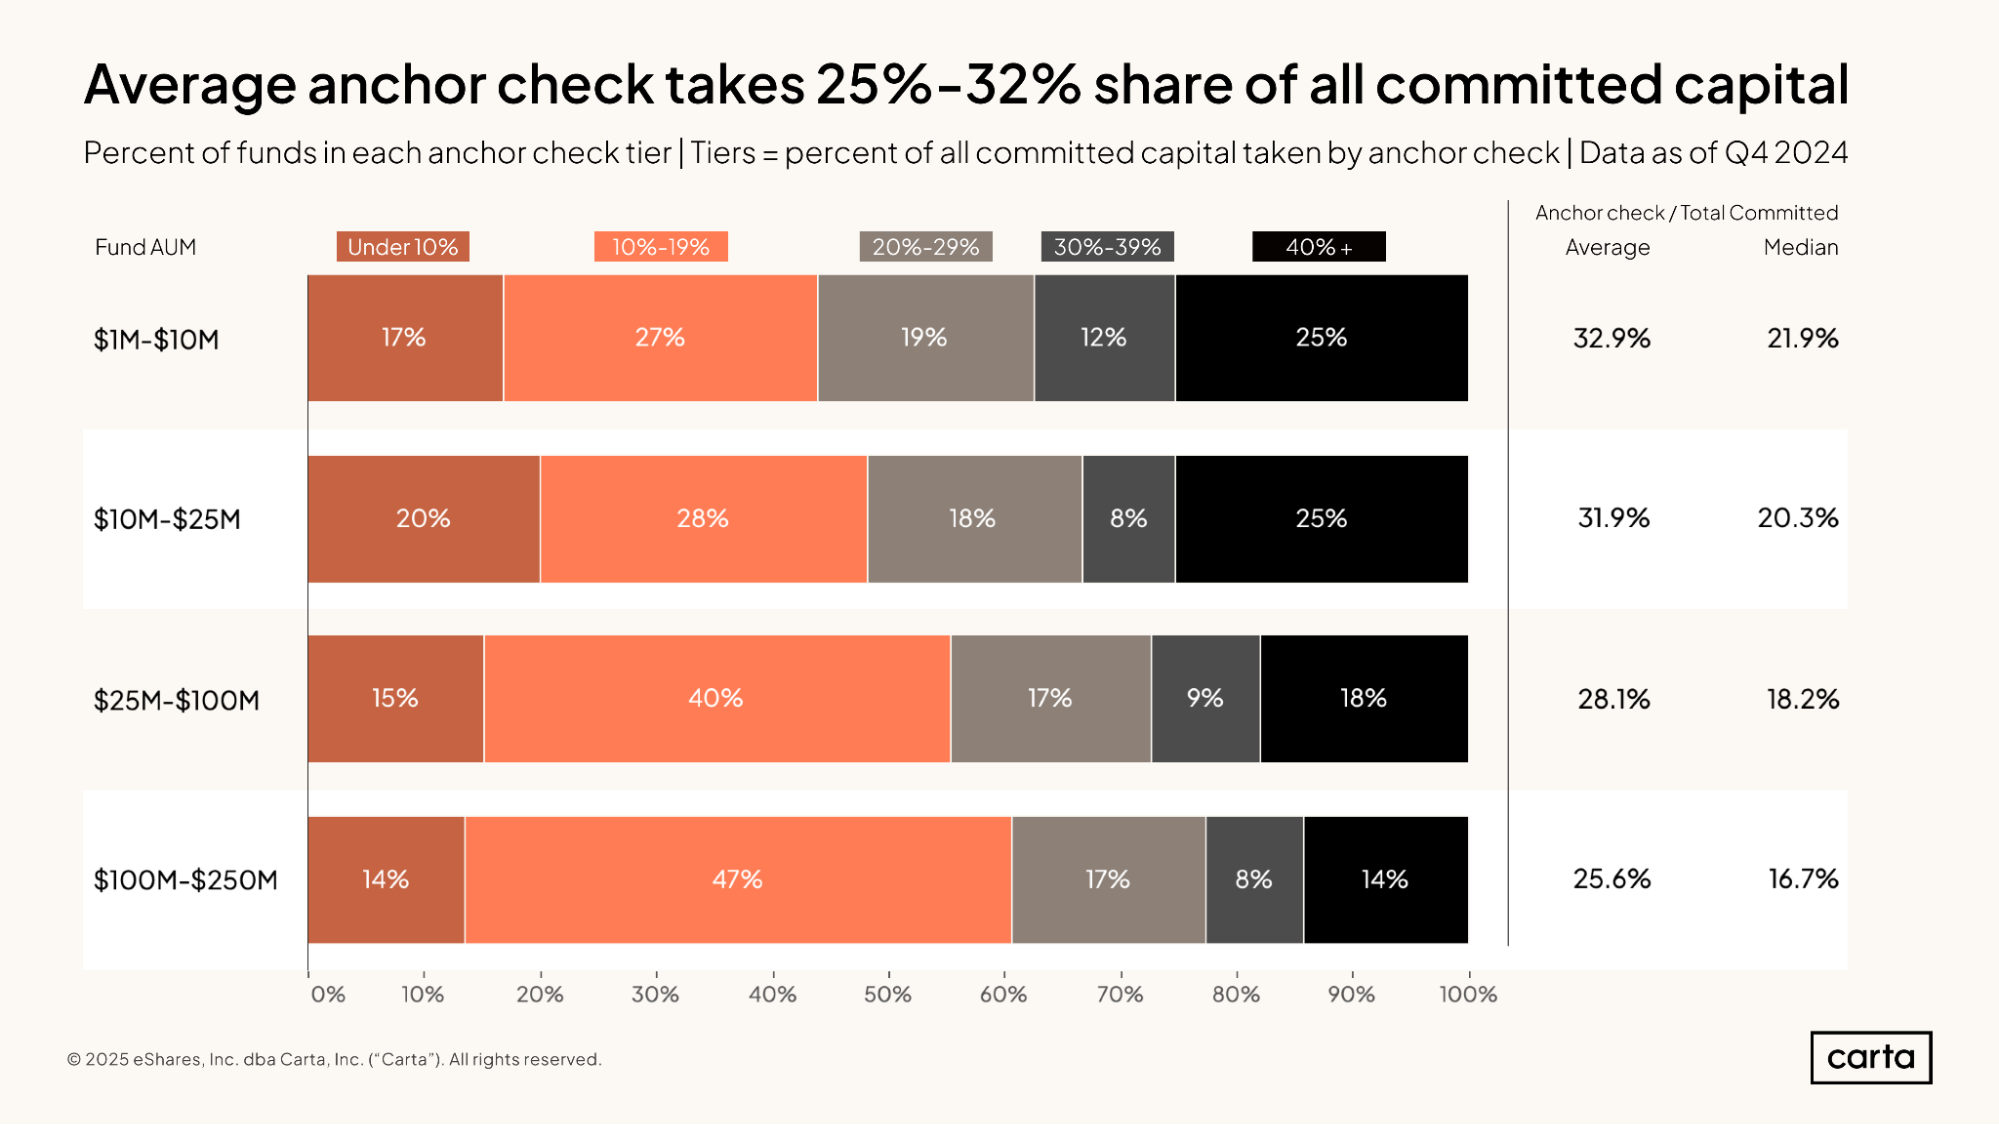
For funds with between $1 million and $10 million in AUM, the average anchor check accounts for 32.9% of the total capital committed to the fund. About 17% of the time, the anchor check accounts for less than 10% of total committed capital for funds in this smallest size interval. About 25% of the time, the anchor check makes up more than 40% of committed capital.
As venture funds get larger, the anchor check tends to make up a smaller proportion of the vehicle’s total firepower. For funds with between $100 million and $250 million in AUM, the average anchor check accounts for 25.6% of the total capital committed to the fund.
IRR
Where C(t) = net cash flow at a given time t
And C(0) = total initial cost of investments
And NPV = net present value of the fund’s future cash distribution (set to 0 to numerically solve for IRR)
As expected, older vintages have higher median IRRs, and more recent vintages have lower median IRRs.
The formula for IRR accounts for the time value of money, which means older funds have had more time to help their portfolio companies grow. But part of the picture is also due to underlying shifts in the venture market. The valuation reset that occurred in 2022 made it challenging for some recent funds to achieve the sorts of returns they might have once expected.
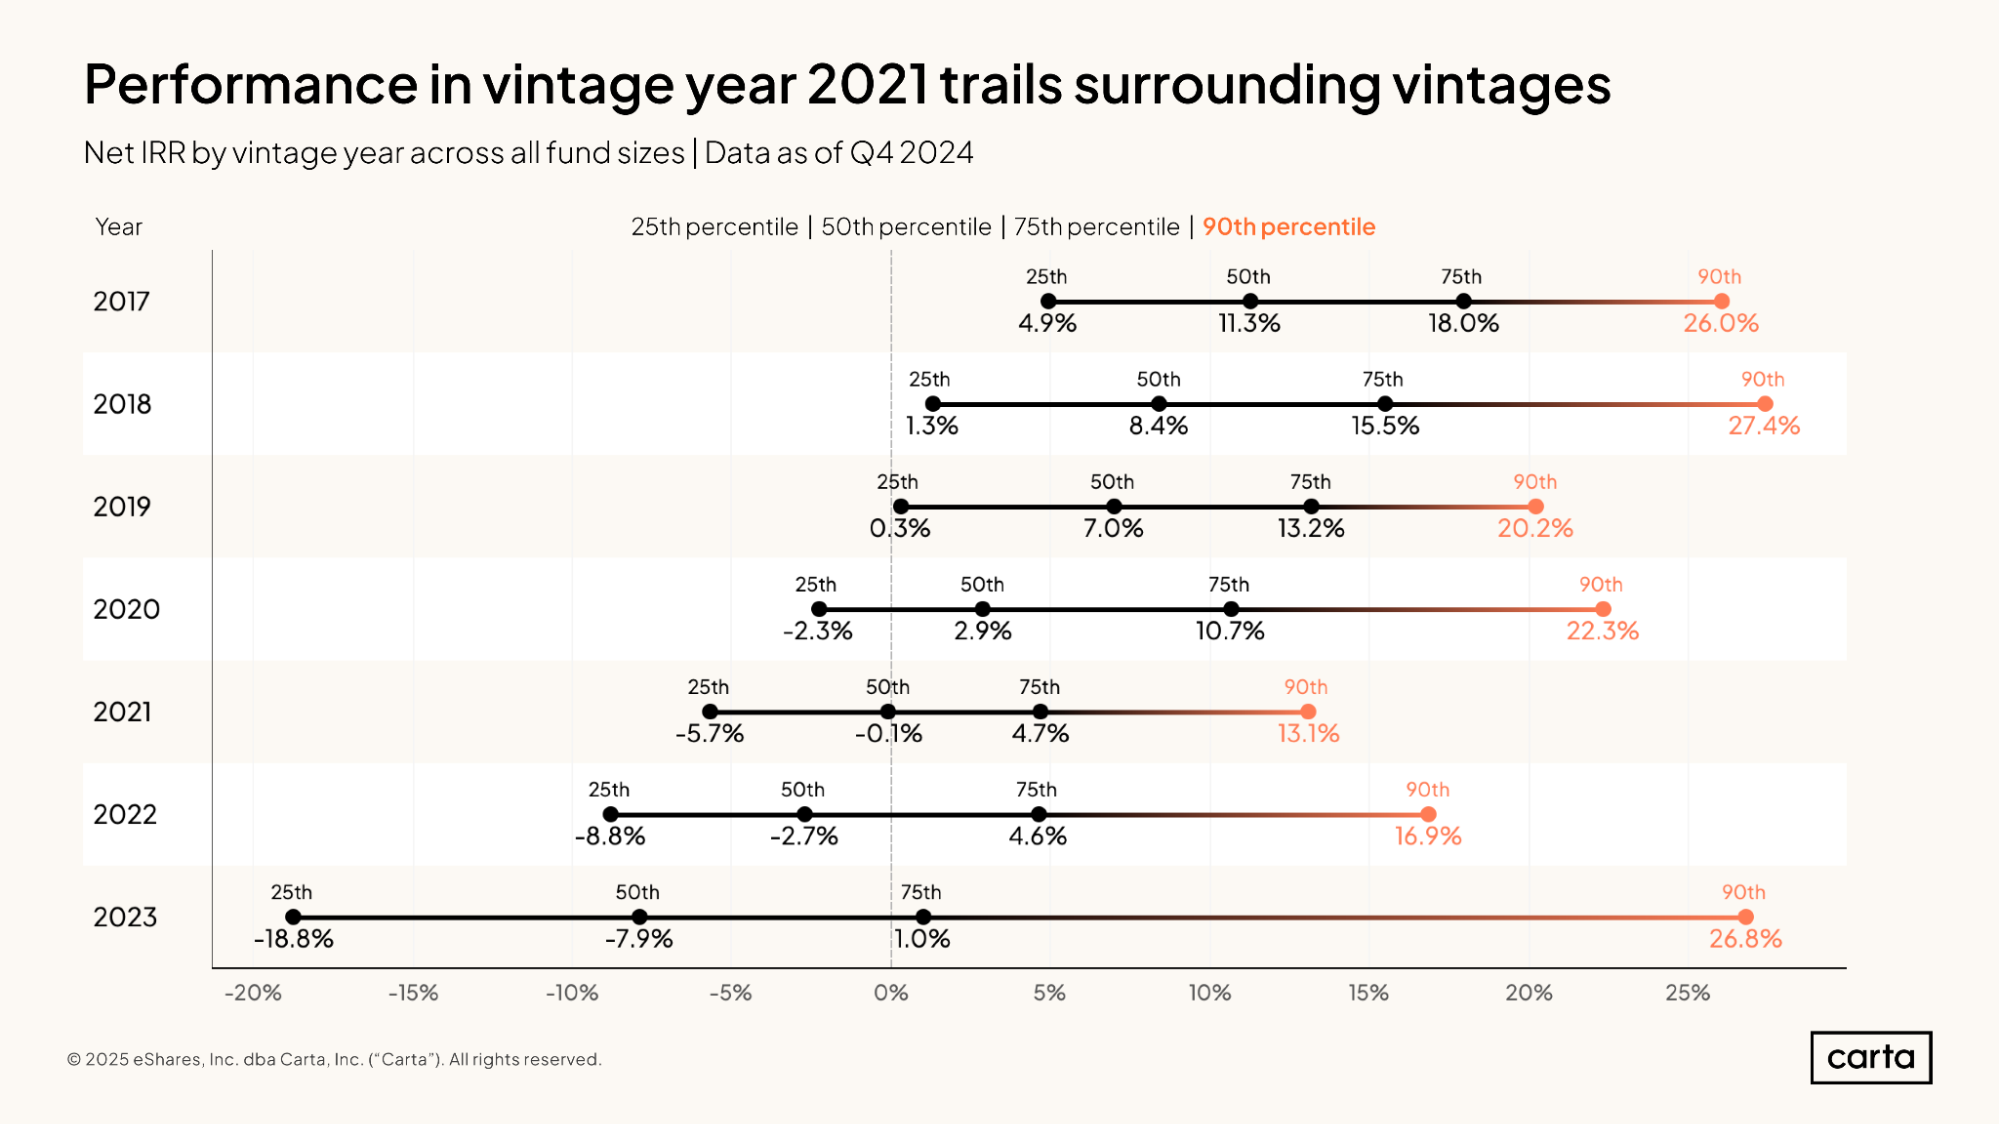
Funds in the 2021 vintage—many of which started writing checks at the height of the pandemic bull market—seem to be feeling a particular crunch. The 90th percentile IRR among the 2021 vintage is only 13.1%, the lowest of any vintage in this sample, suggesting that even the year’s best-performing funds are lagging behind top funds from other vintages.
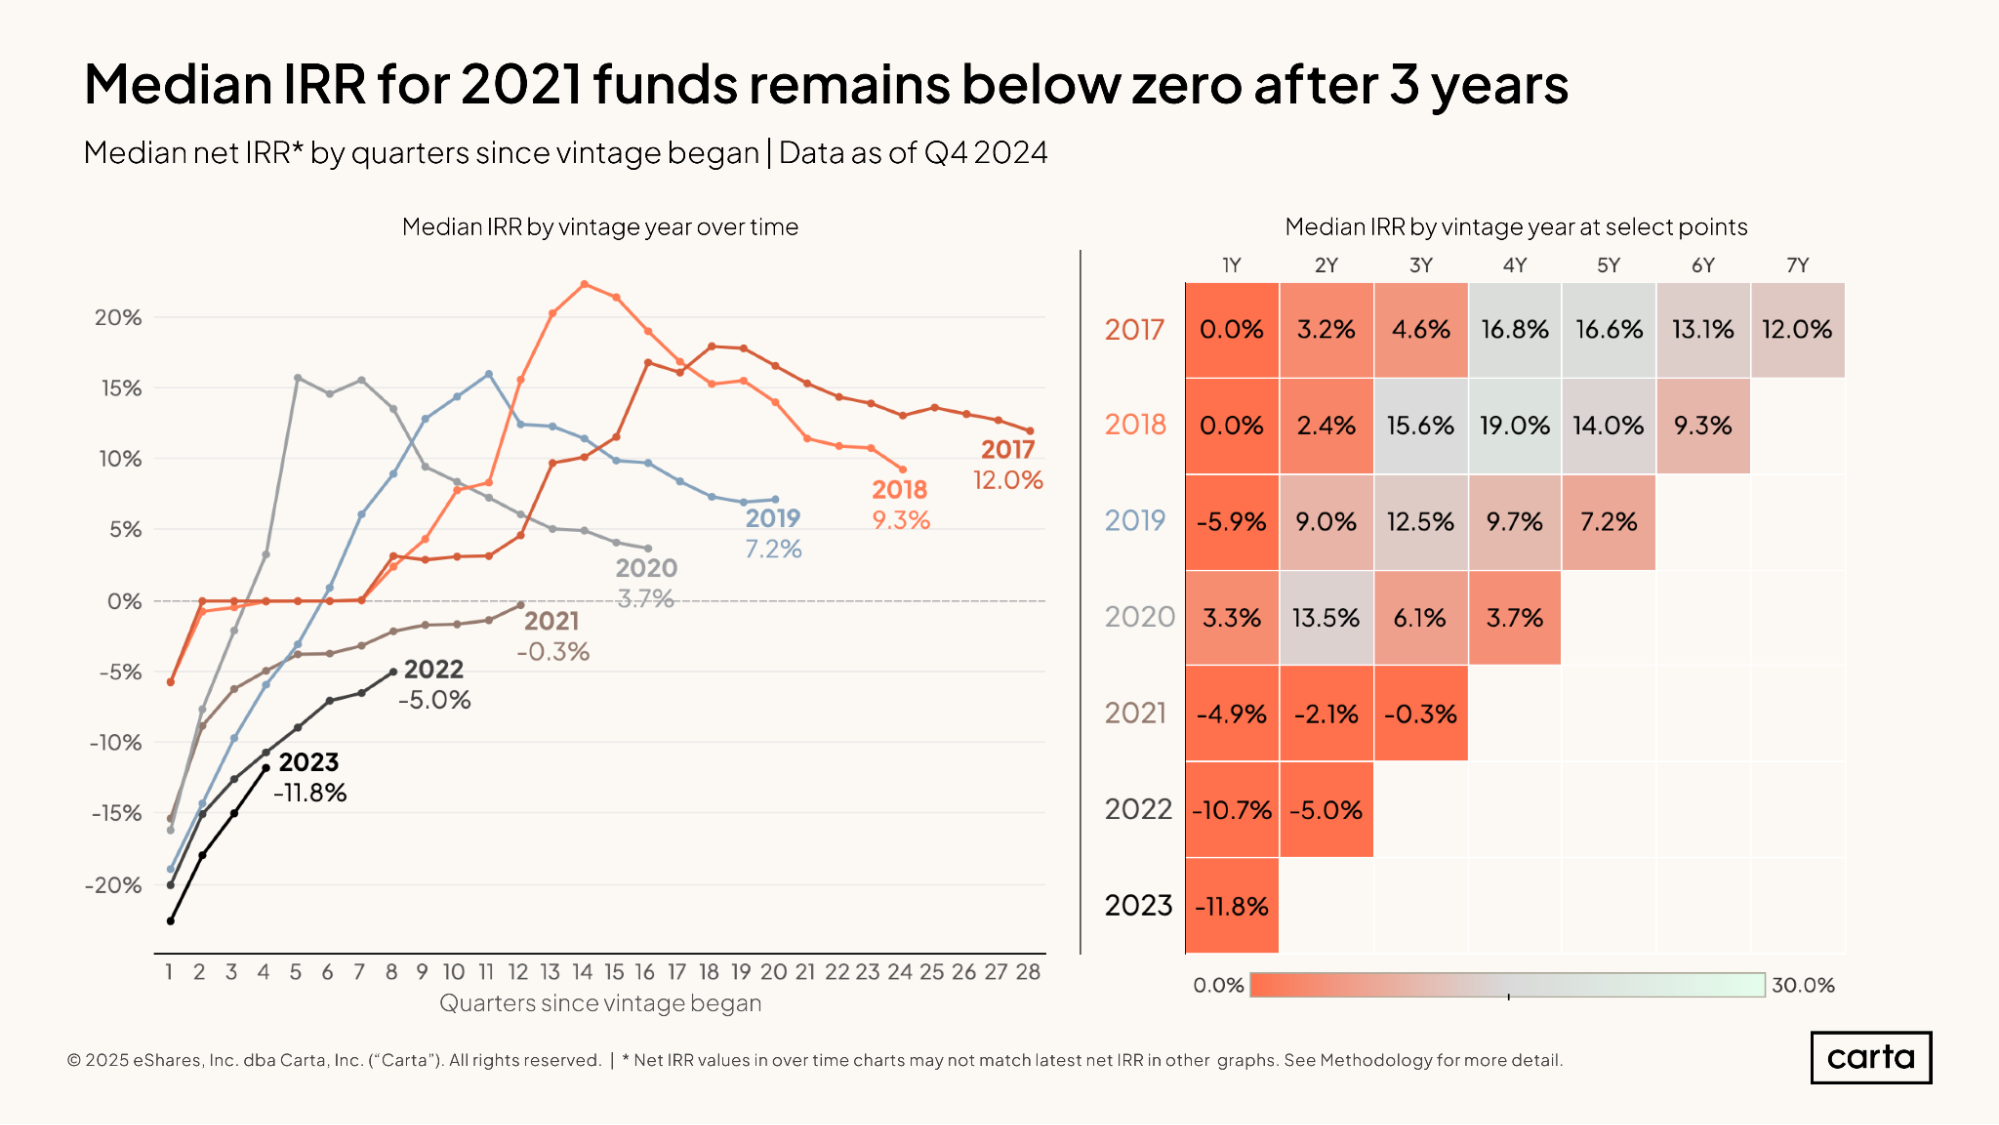
To adjust for the fact that more mature VC funds tend to have generated more returns, we can assess the performance of these recent fund vintages by comparing where median IRR stood for each vintage at standard milestones in time.
The early signs for recent fund vintages don’t look too promising. After three years, the median IRR for the 2021 vintage is at -0.3%, well below the IRRs after three years for preceding vintages. Likewise, the median IRR for the 2022 vintage after two years of activity is the lowest of any recent vintage.
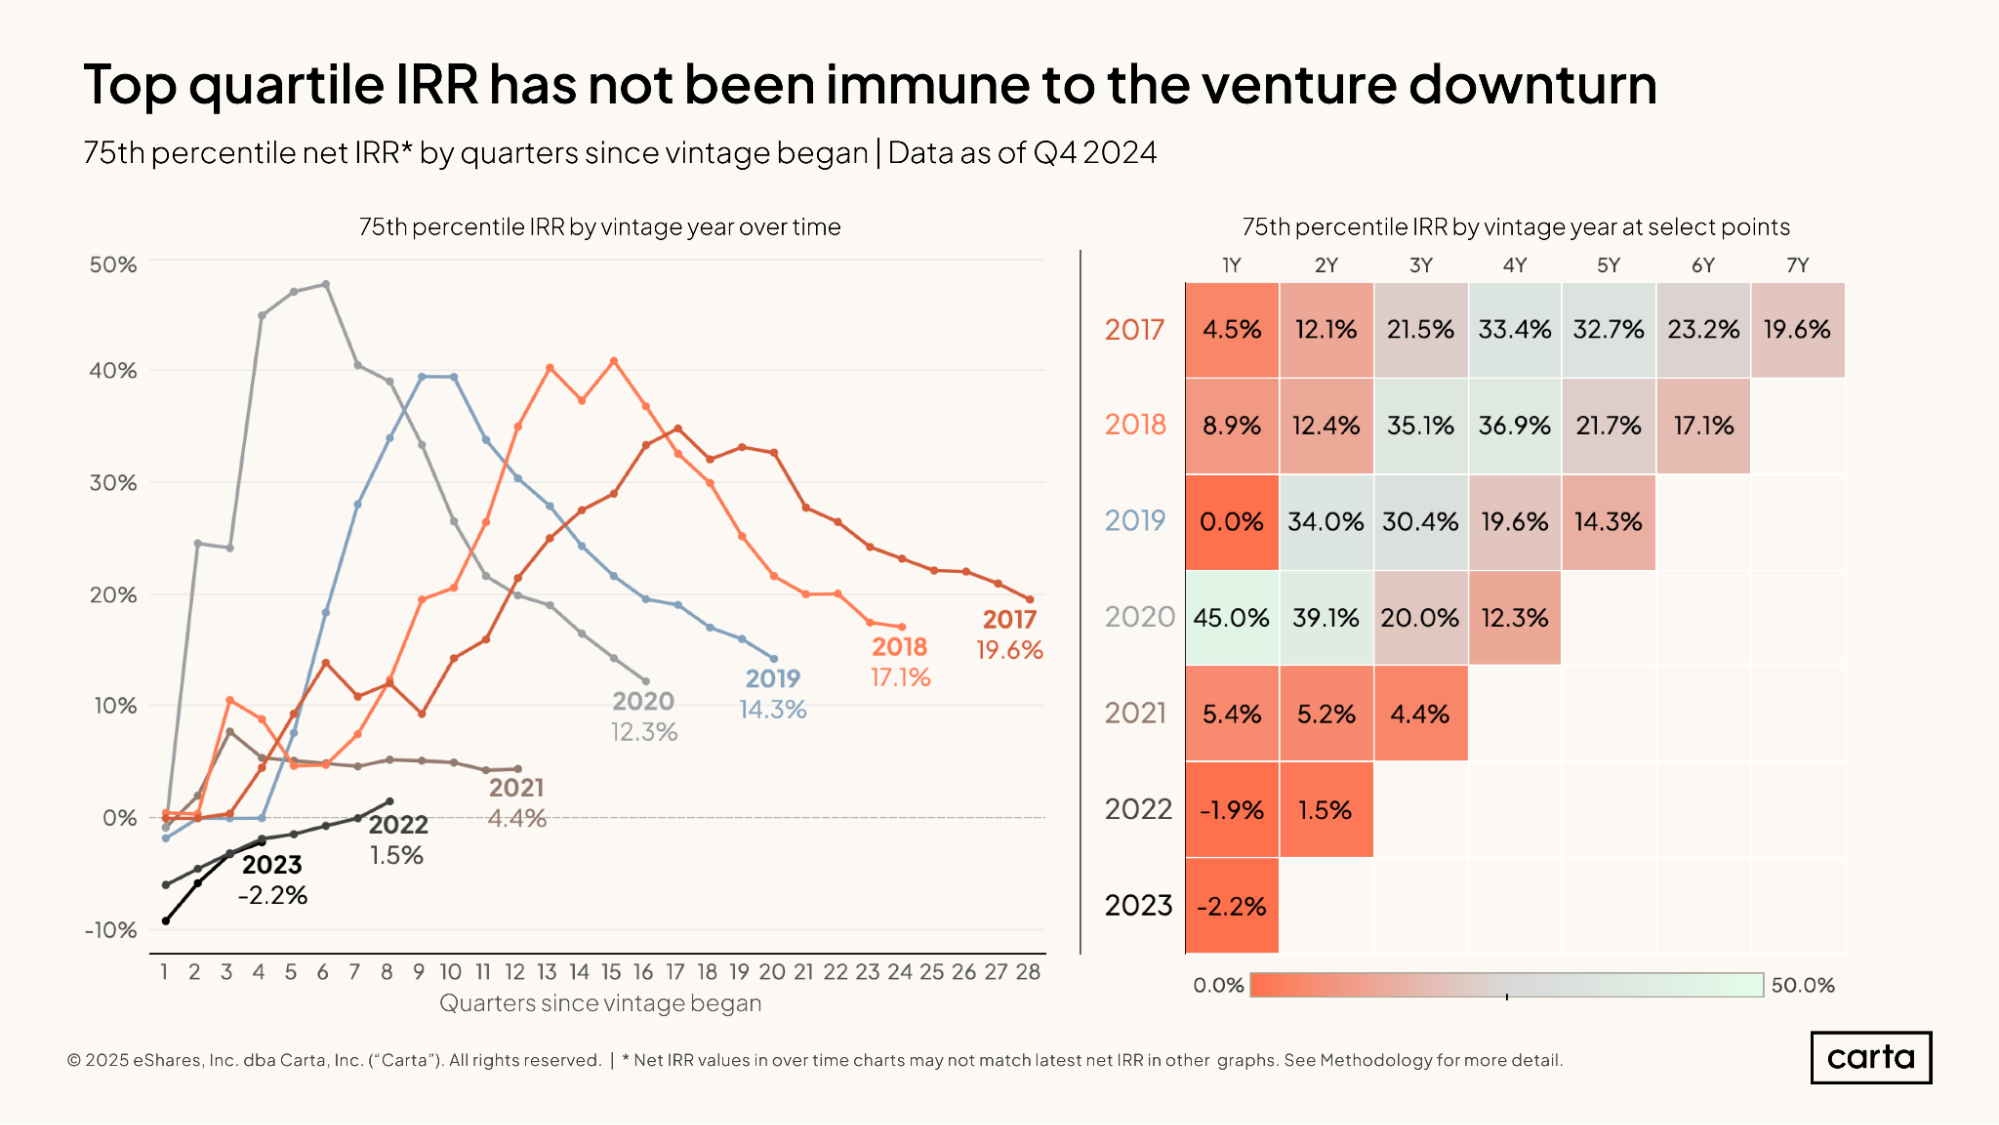
At the 75th percentile of performance, fund vintages from 2021 onward still lag well behind slightly earlier cohorts.
For instance, for every vintage from 2017 through 2020, the 75th percentile IRR after three years of investing was at least 20%. For the 2021 vintage, the 75th percentile IRR after three years was just 4.4%.
In general, the past two years haven’t been kind to IRR performance. The most recent vintages have struggled to get off the ground, while earlier vintages (2017-2020) have seen their 75th percentile IRRs fall by significant margins over the past eight or so quarters.
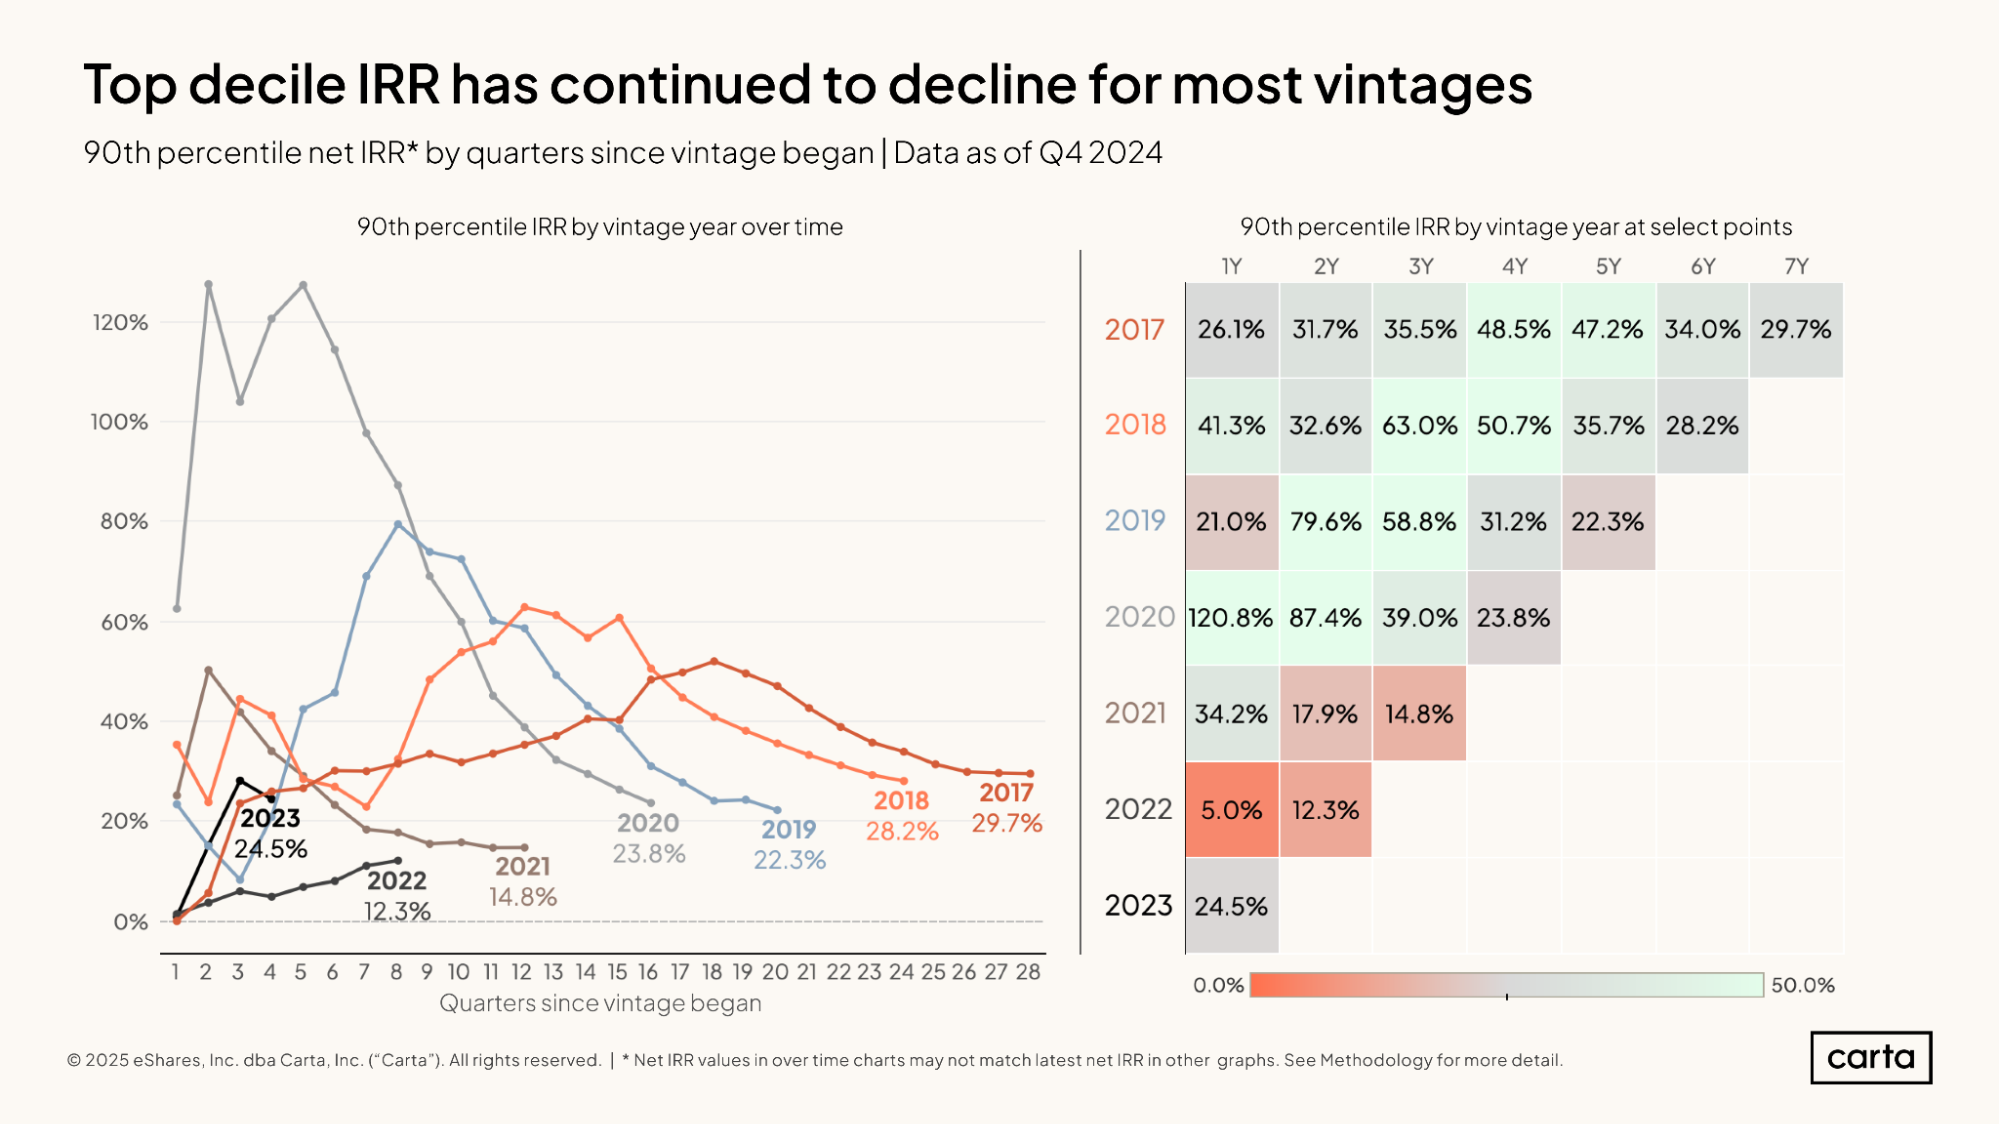
Even the top decile funds have struggled to escape this venture downturn. Vintages from 2017 through 2020 got off to much better starts than vintages from 2021 onward, and IRRs have trended down over the past two years.
The 2023 vintage, however, is showing some early signs of promise. After one year, the 90th percentile for IRR among 2023 funds was 24.5%, much higher than the 2022 vintage and roughly in line with figures from the final years of the 2010s.
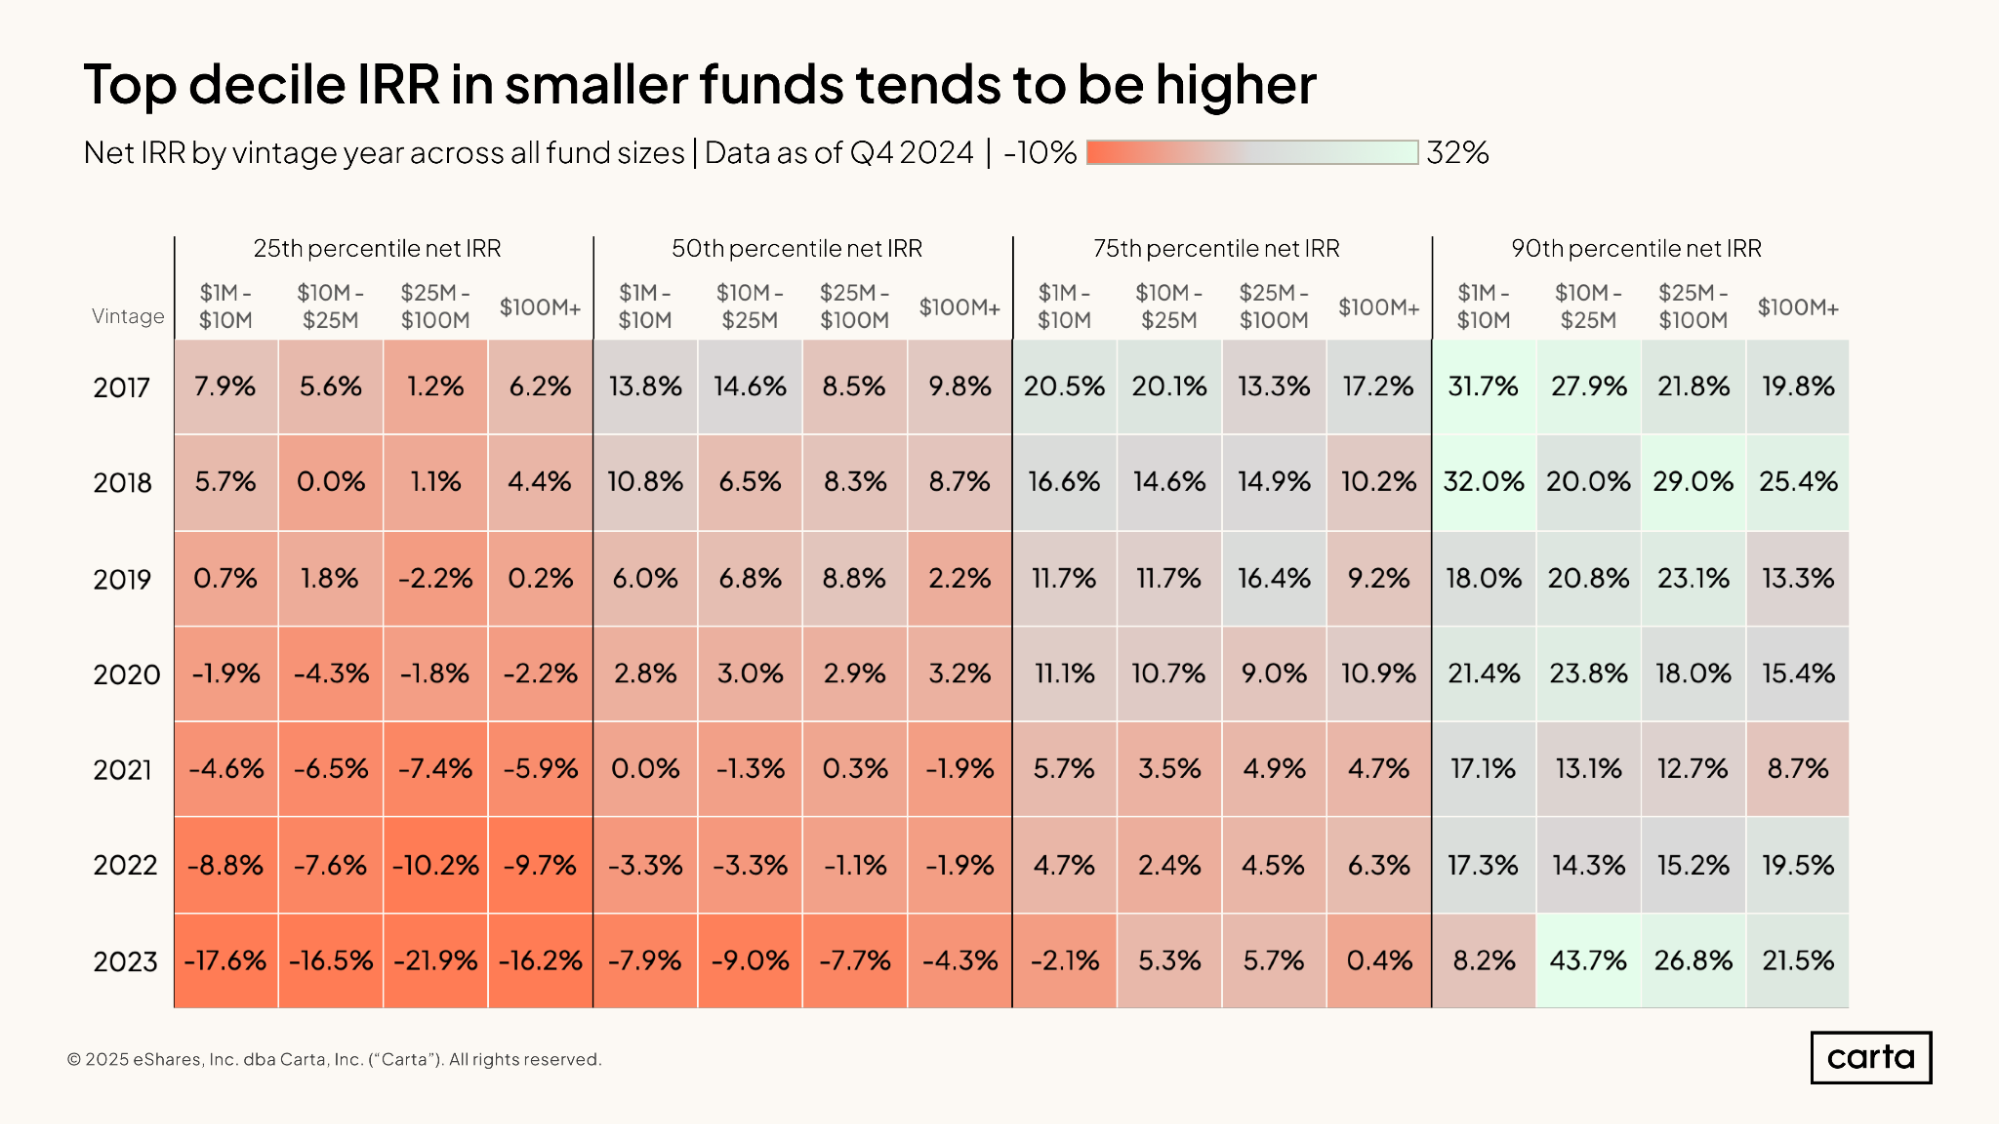
At the highest tier of fund performance, the smallest venture funds tend to produce higher IRRs than larger ones. For each vintage from 2017 through 2021, the 90th percentile IRR for funds with between $1 million and $10 million in assets was higher than the 90th percentile IRR for funds with more than $100 million in assets—in some cases, significantly higher.
For the most part, this superior performance in smaller funds is due to simple math. Smaller funds need to generate fewer returns than larger funds (in terms of pure dollars) to produce the same multiple. For instance, a 2x return on a $10 million fund requires only $10 million in profit, while a 2x return on a $100 million fund requires $100 million in profit. In smaller vehicles, it’s easier for one or two successful investments to lift the return profile of the entire fund.
TVPI
Unlike IRR, the formula for TVPI does not account for the time value of money. It is purely an expression of how the present value of a fund (including both realized and unrealized gains) compares to the value of the paid-in capital.
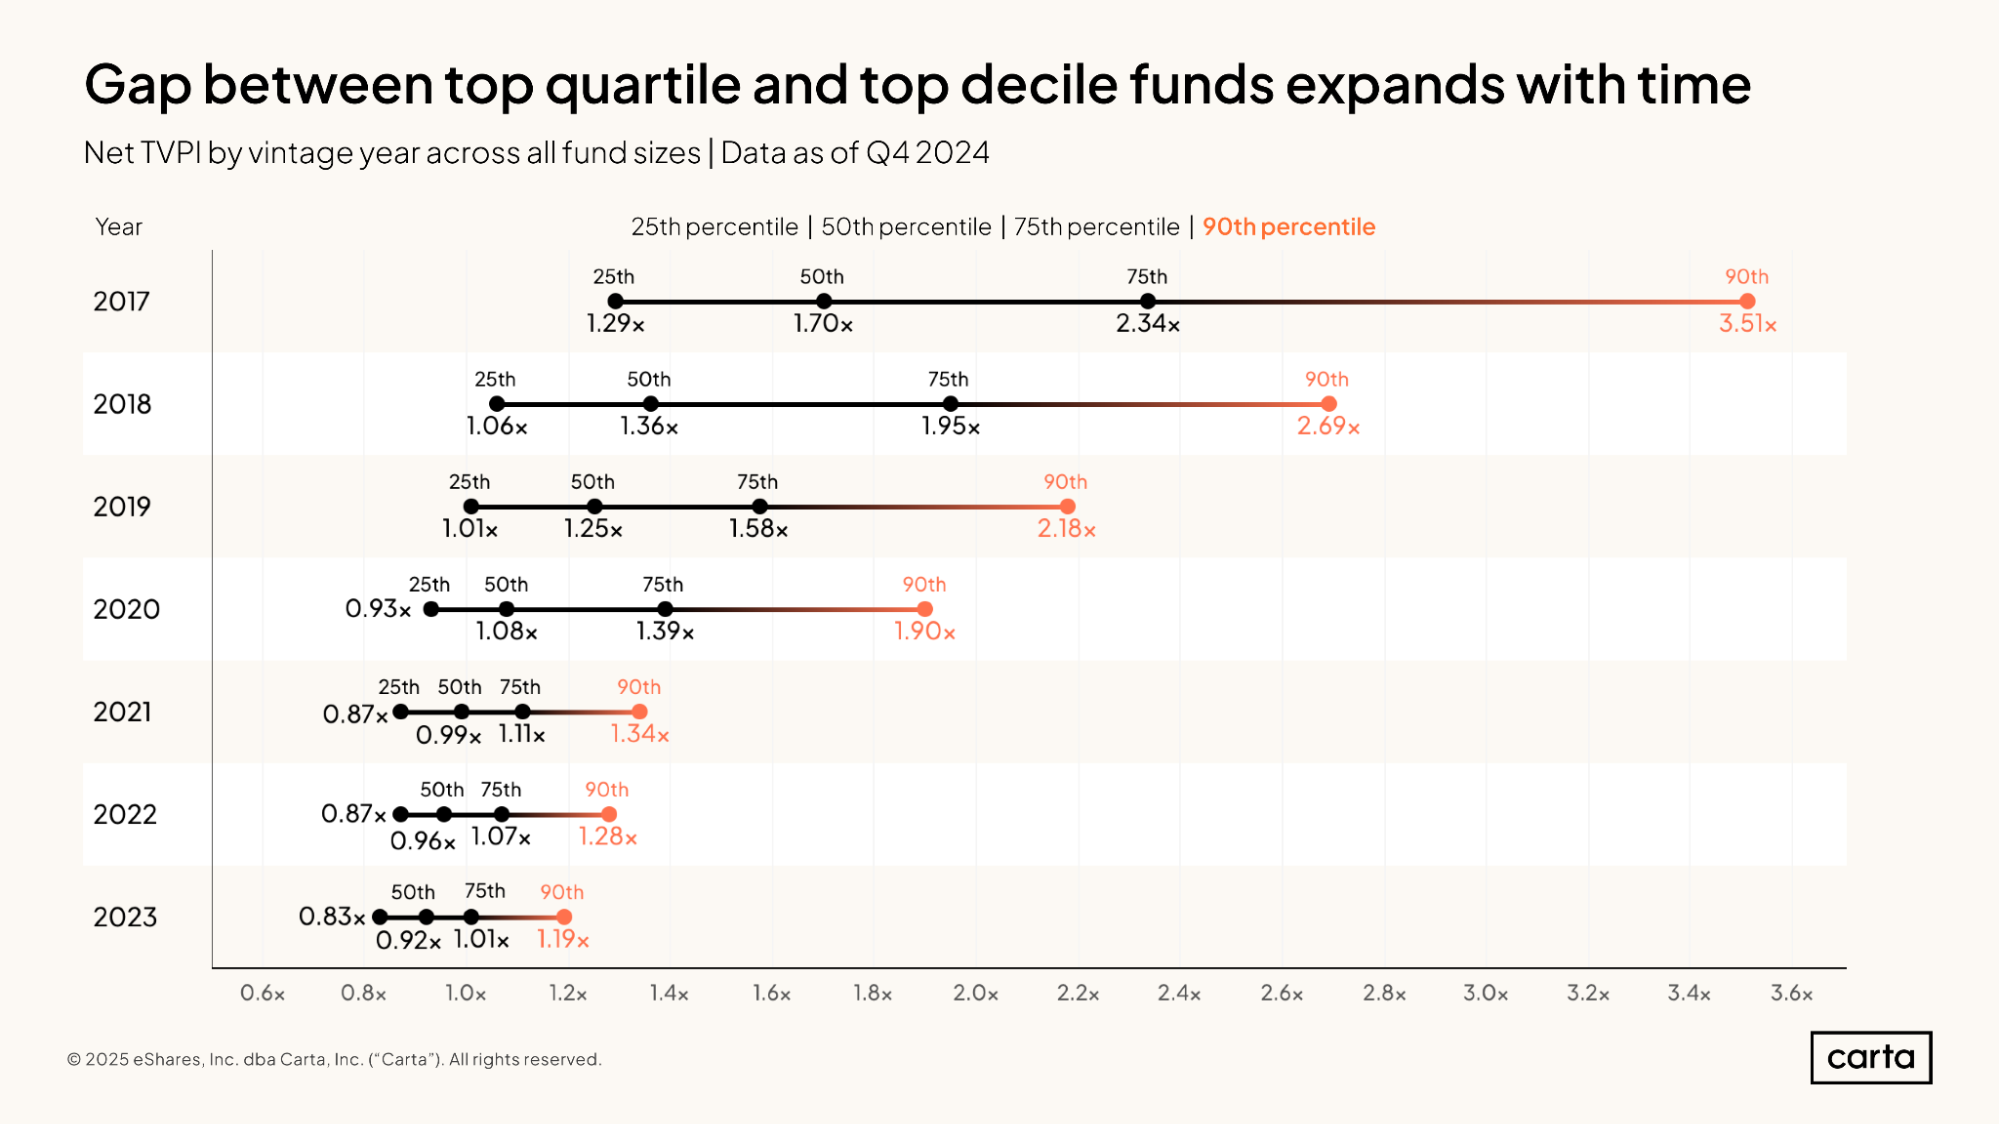
Among these recent fund vintages, TVPIs are clearly highest in the 2017 cohort, with a median of 1.7x and a 90th percentile figure of 3.51x. In general, more recent funds have lower TVPIs. But there’s minimal difference between the 2021, 2022, and 2023 vintages, with the median TVPI for all three falling somewhere between 0.92x and 0.99x.
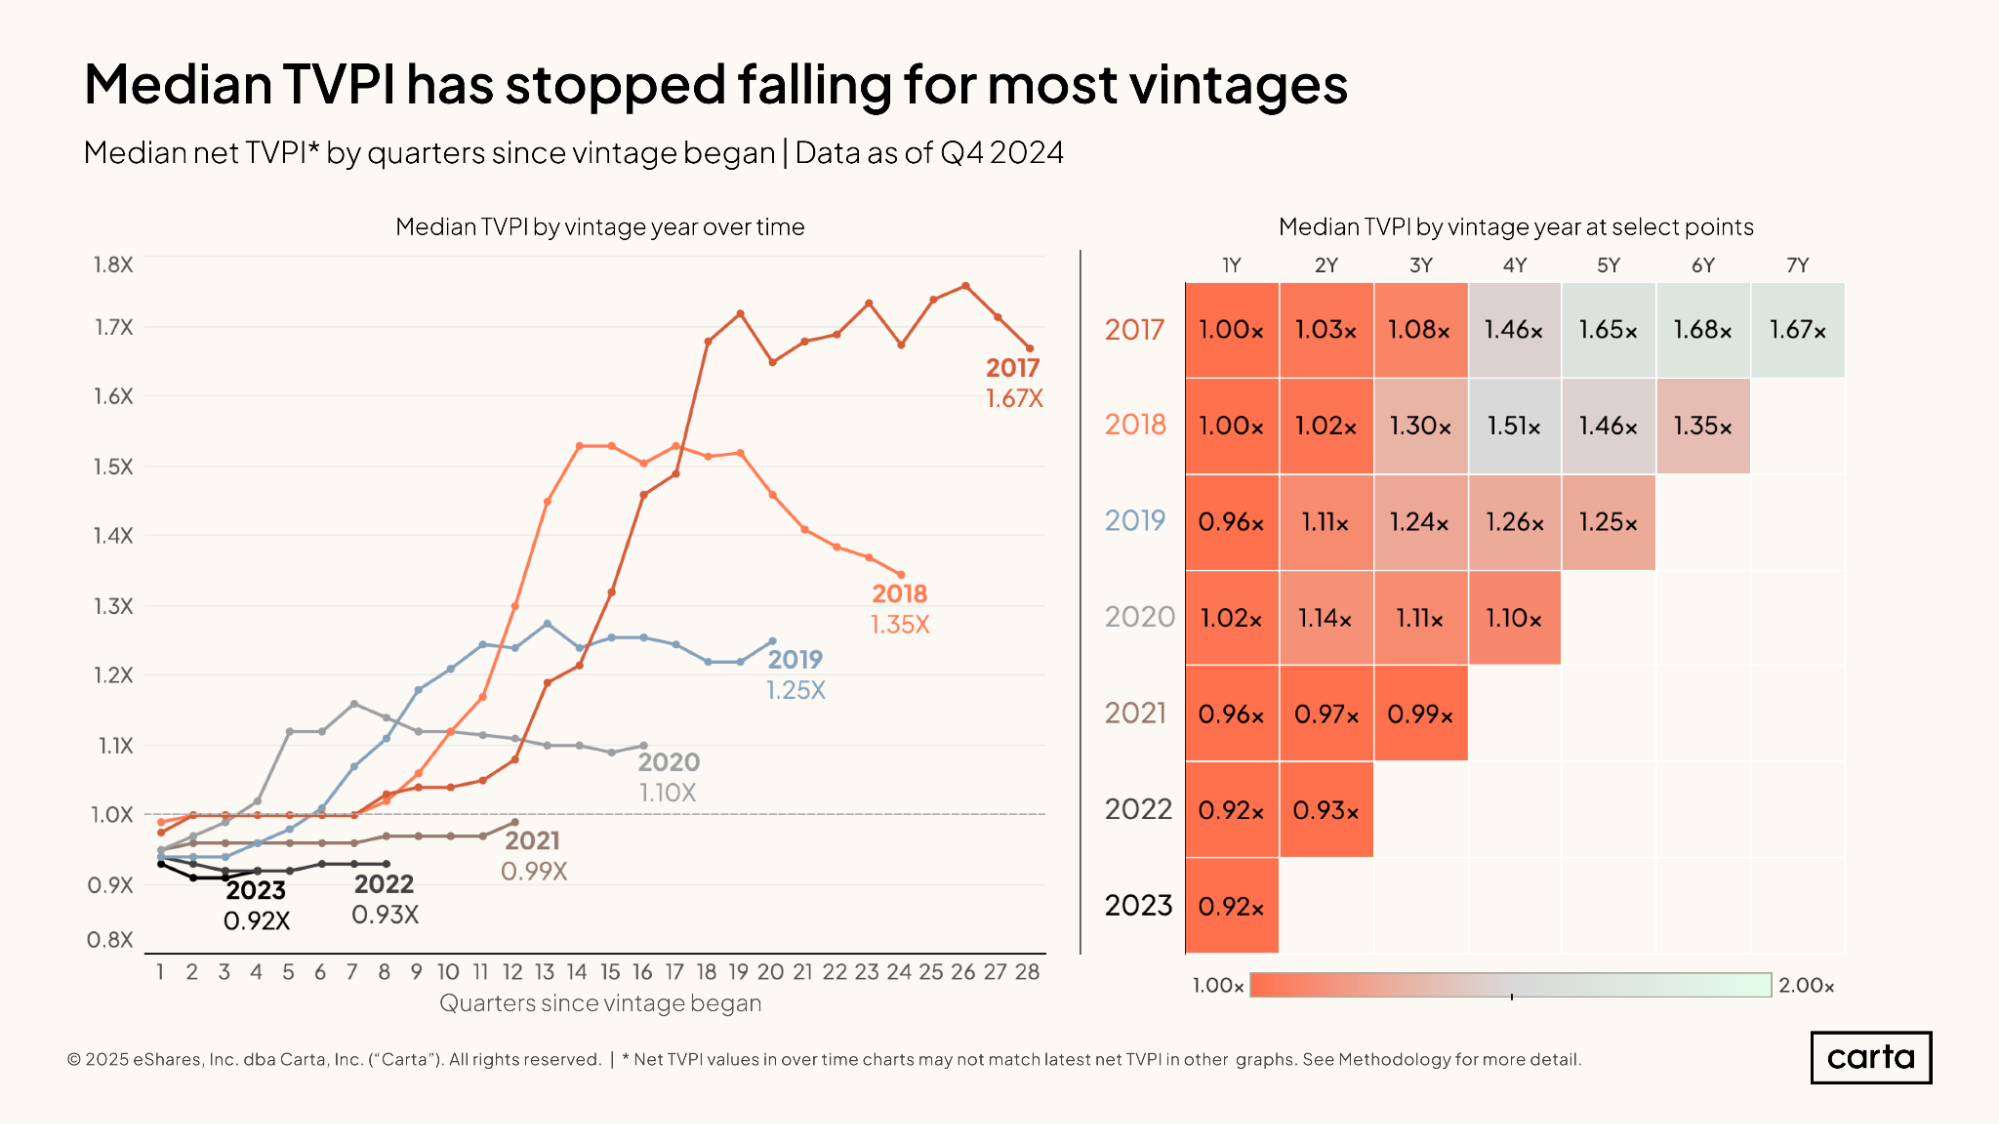
In the 2017 and 2018 fund vintages, median TVPIs were in decline during the back half of 2024. In the 2019 and 2020 vintages, meanwhile, median TVPIs ticked up in Q4.
At their respective one year, two year, and three year mileposts, TVPIs from the 2023, 2022, and 2021 fund vintages are still lagging behind performance from slightly earlier vintages.
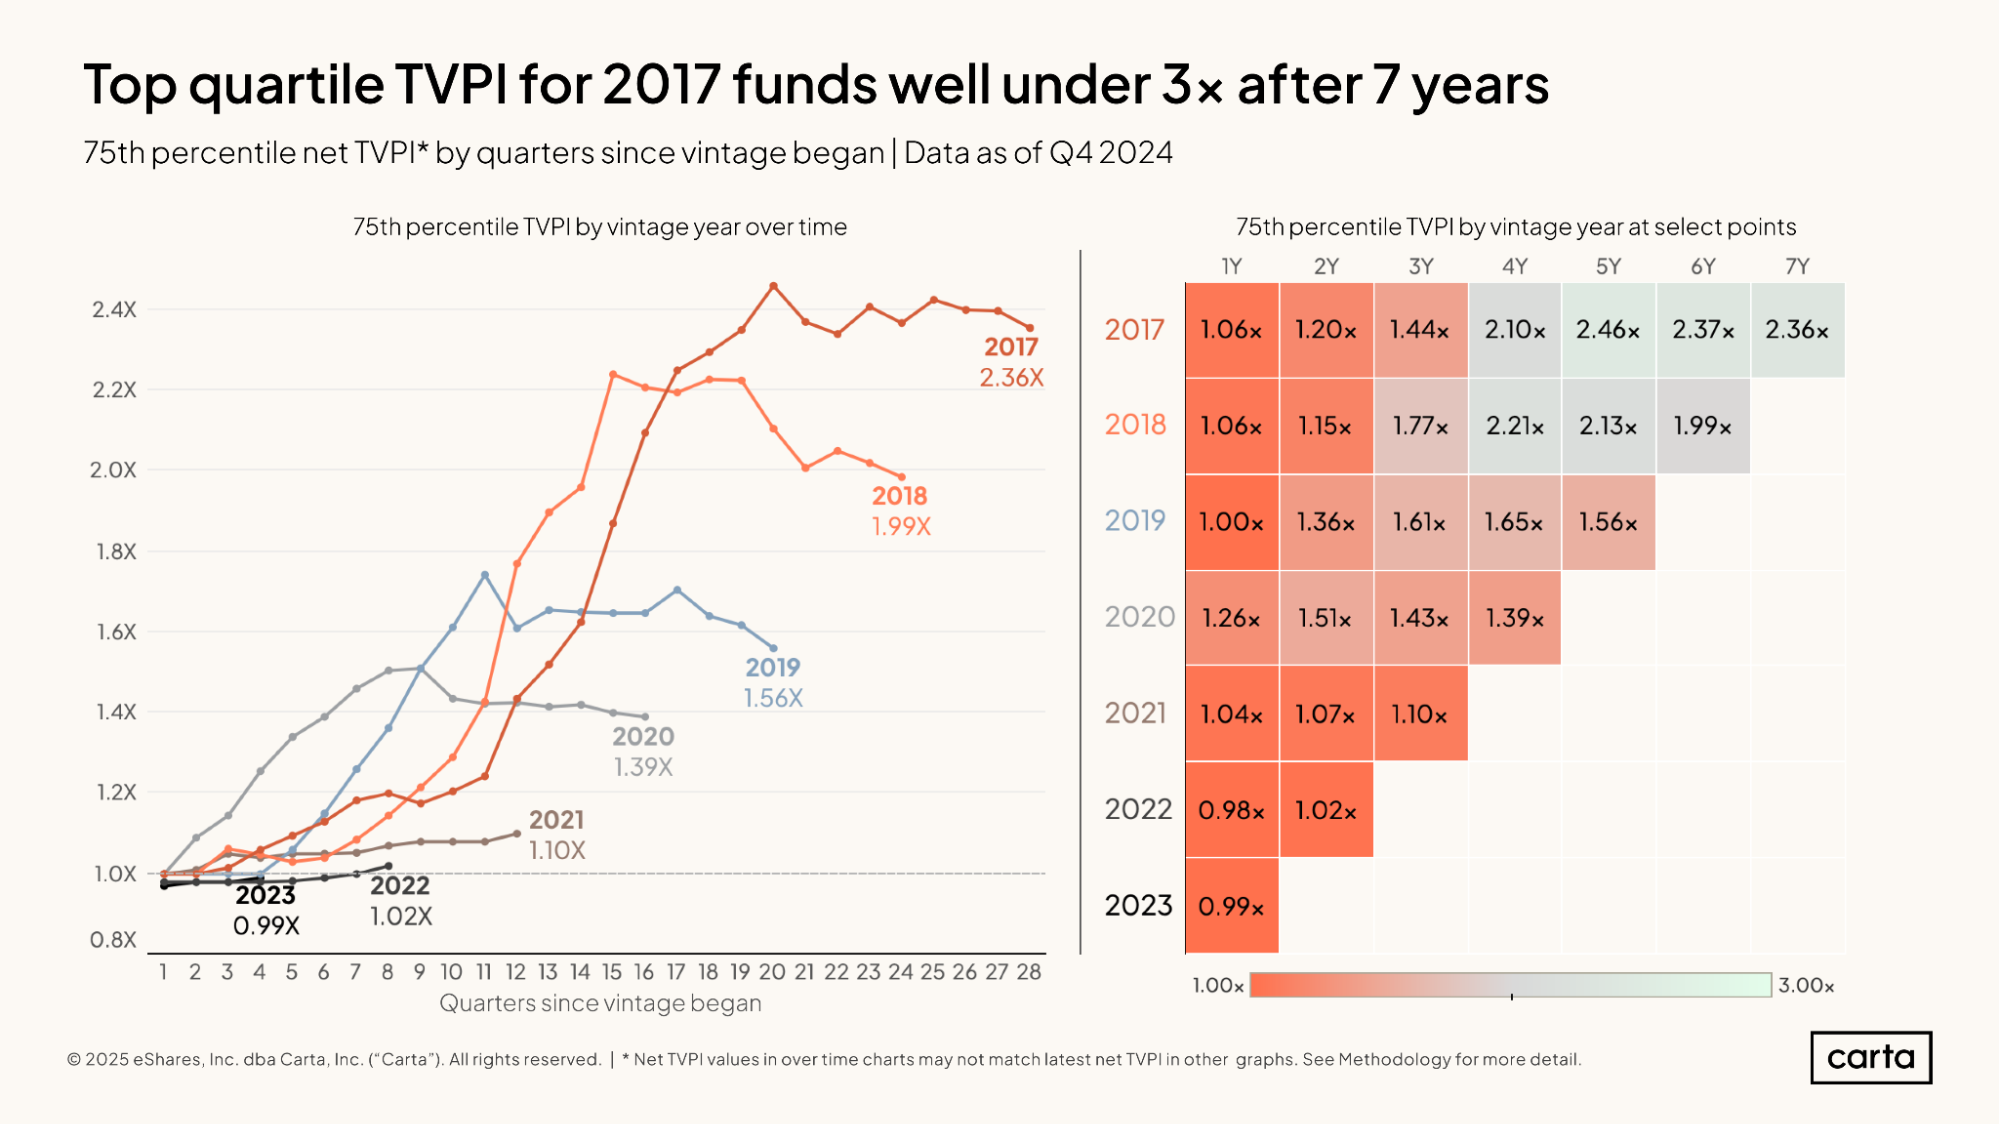
For both the 2017 and 2018 fund vintages, the top quartile of venture funds boast TVPIs near or above 2x, indicating that they’re on track to roughly double their investors’ money.
It’s still early of course, but performance for more recent vintages isn’t quite so rosy. After three years, the 75th percentile TVPI for funds from the 2021 vintage is 1.1x, much lower than 75th percentile figures of 1.43x for the 2020 vintage and 1.61x for the 2019 vintage at the same milepost.
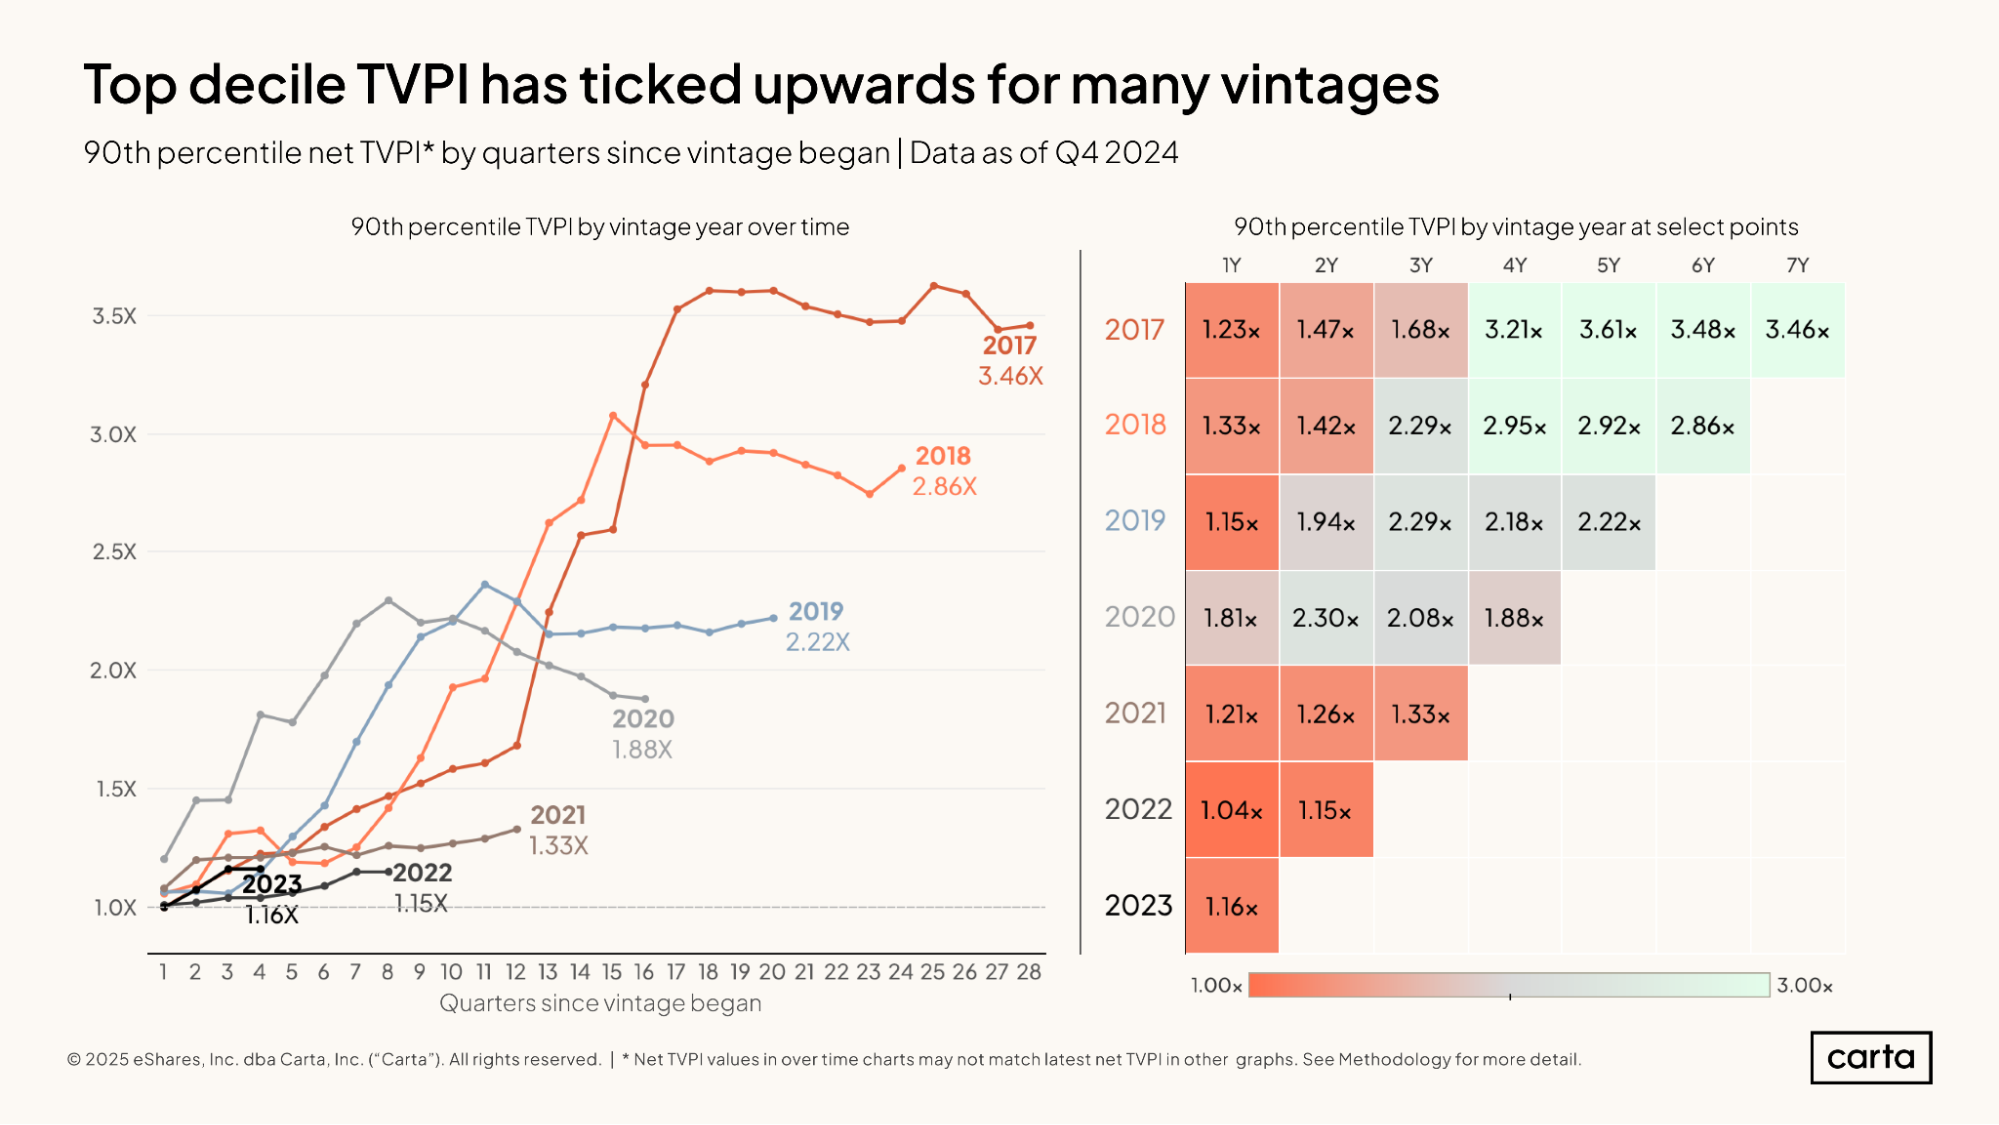
The top 10% of venture funds from the 2017 vintage are producing standout returns of 3.46x or higher. The top decile performance for 2017 has been hovering around 3.5x for most of the past three years.
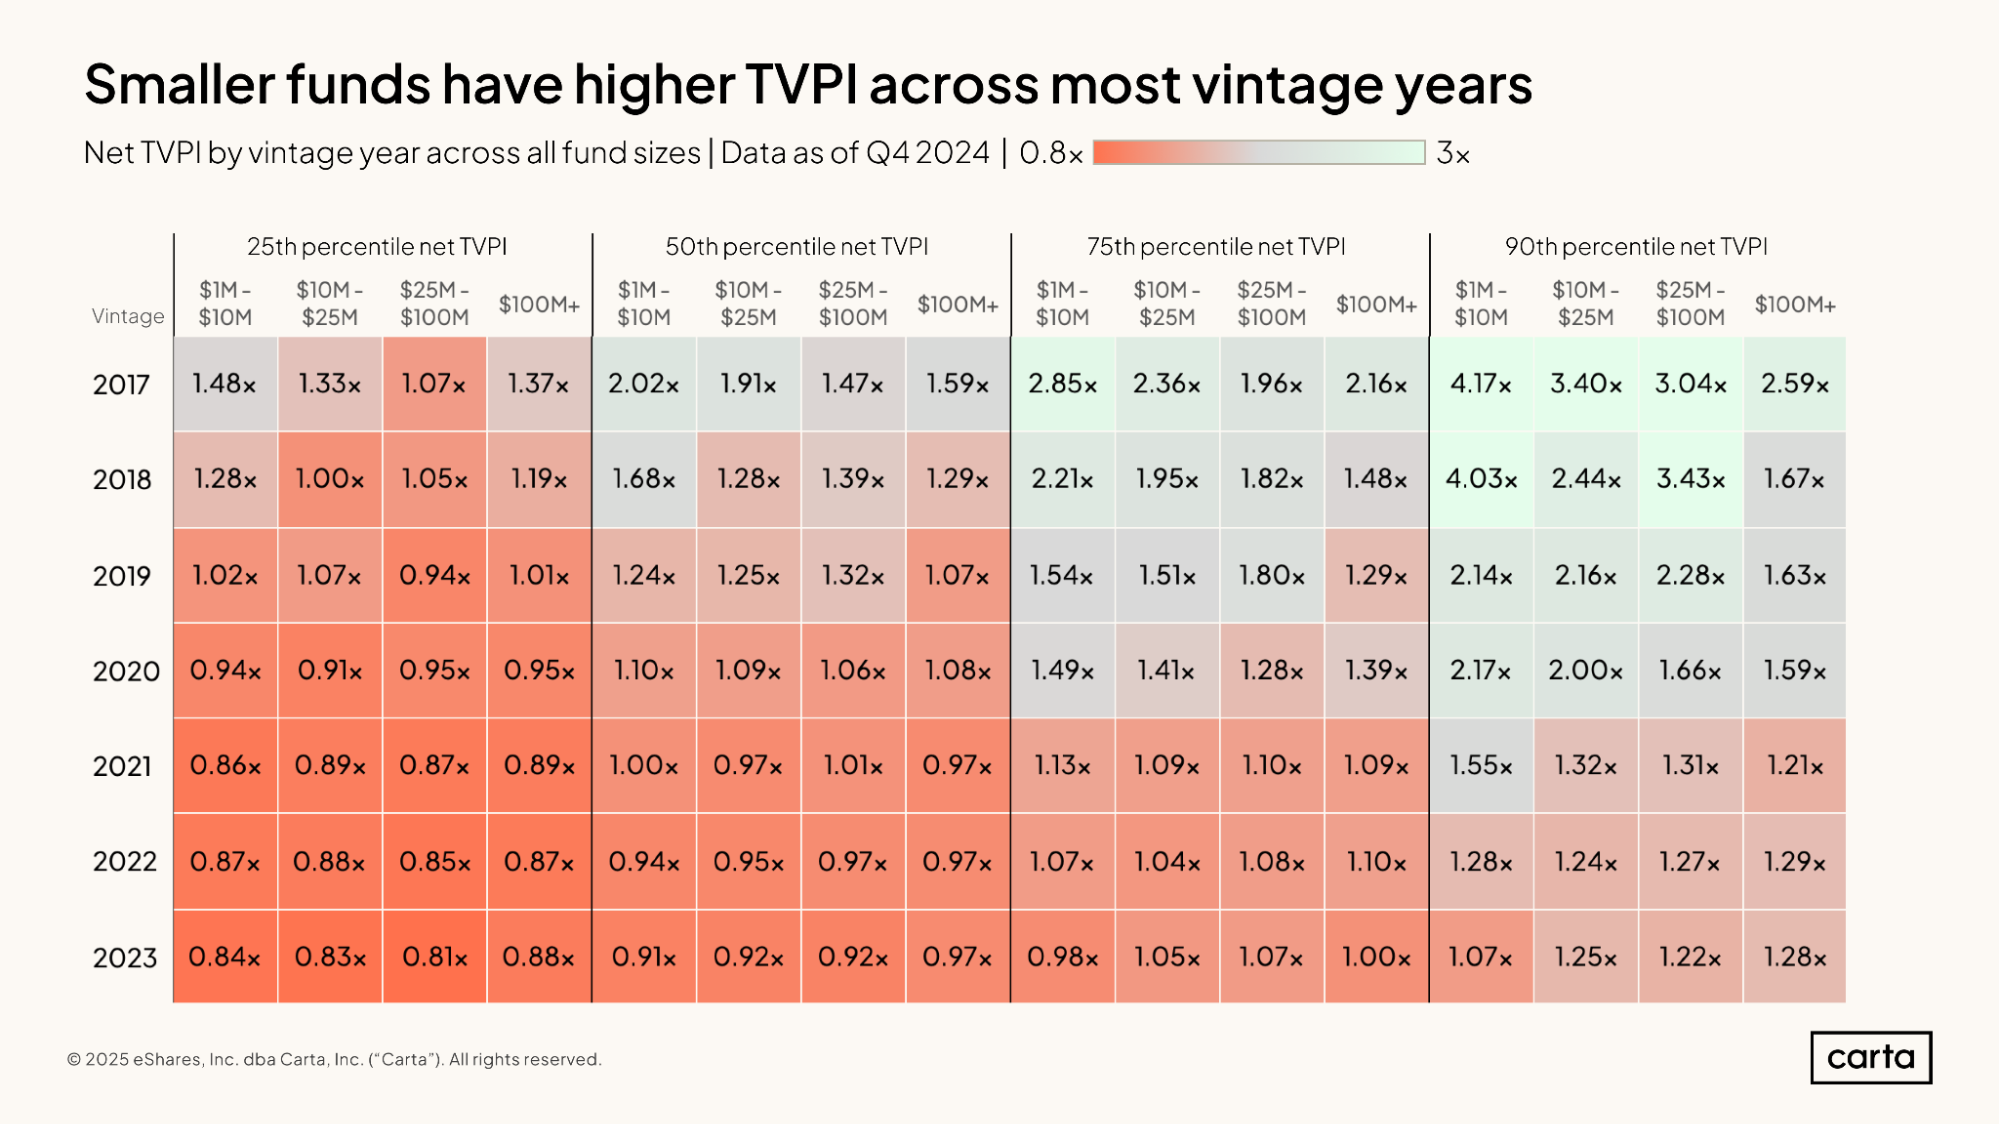
As is the case with IRR, the top-performing small venture funds tend to post higher TVPIs than the top-performing large venture funds. In the 2018 vintage, for example, the 90th percentile TVPI for funds with between $1 million and $10 million in assets is 4.03x, compared to 1.67x for funds larger than $100 million.
Across lower tiers of fund performance—and among more recent fund vintages—there tends to be less correlation between fund size and TVPI.
DPI
DPI is a ratio that expresses the amount of capital that a fund has returned to its investors in relation to the amount of capital that investors paid in. It measures only realized returns to LPs, in contrast to TVPI, which also considers unrealized gains.
Since DPI is only concerned with realized returns—and since it typically takes several years before a venture fund starts to exit its investments and return capital to LPs—it makes sense that most funds from the past several years have relatively little DPI. For vintages from 2019 onward, the median fund has recorded no DPI.
It’s always been rare for venture funds to post significant DPI during their first few years of investing. In more recent vintages, however, distributions are becoming even more difficult to find.
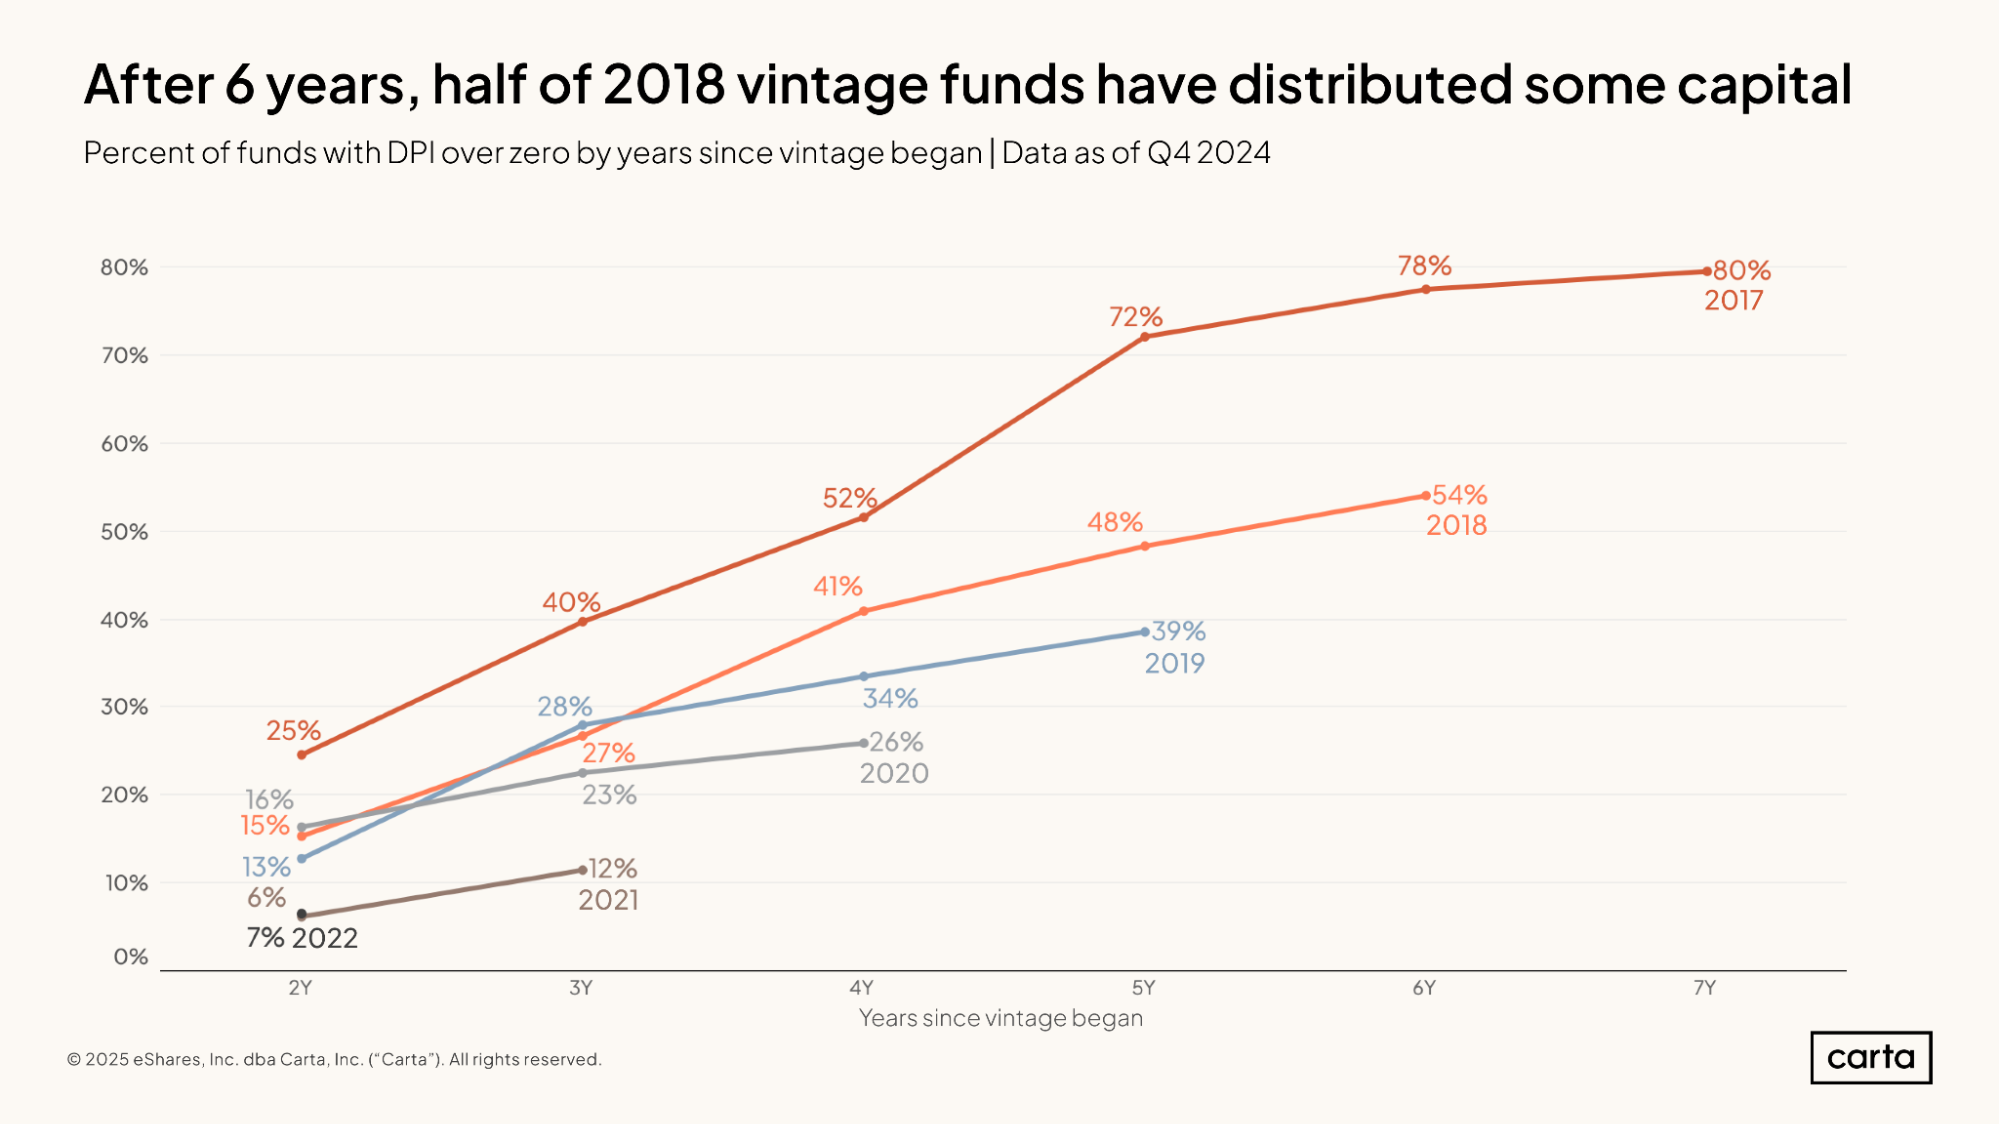
After three years of existence, 40% of venture funds from the 2017 vintage had a DPI over zero, signifying that they had distributed some amount of capital back to LPs. In the 2021 vintage, just 12% of funds had distributed capital after three years. At the five-year point, 72% of funds from 2017 had a DPI over zero. In the 2019 vintage, meanwhile, just 39% of funds had recorded any DPI after five years.
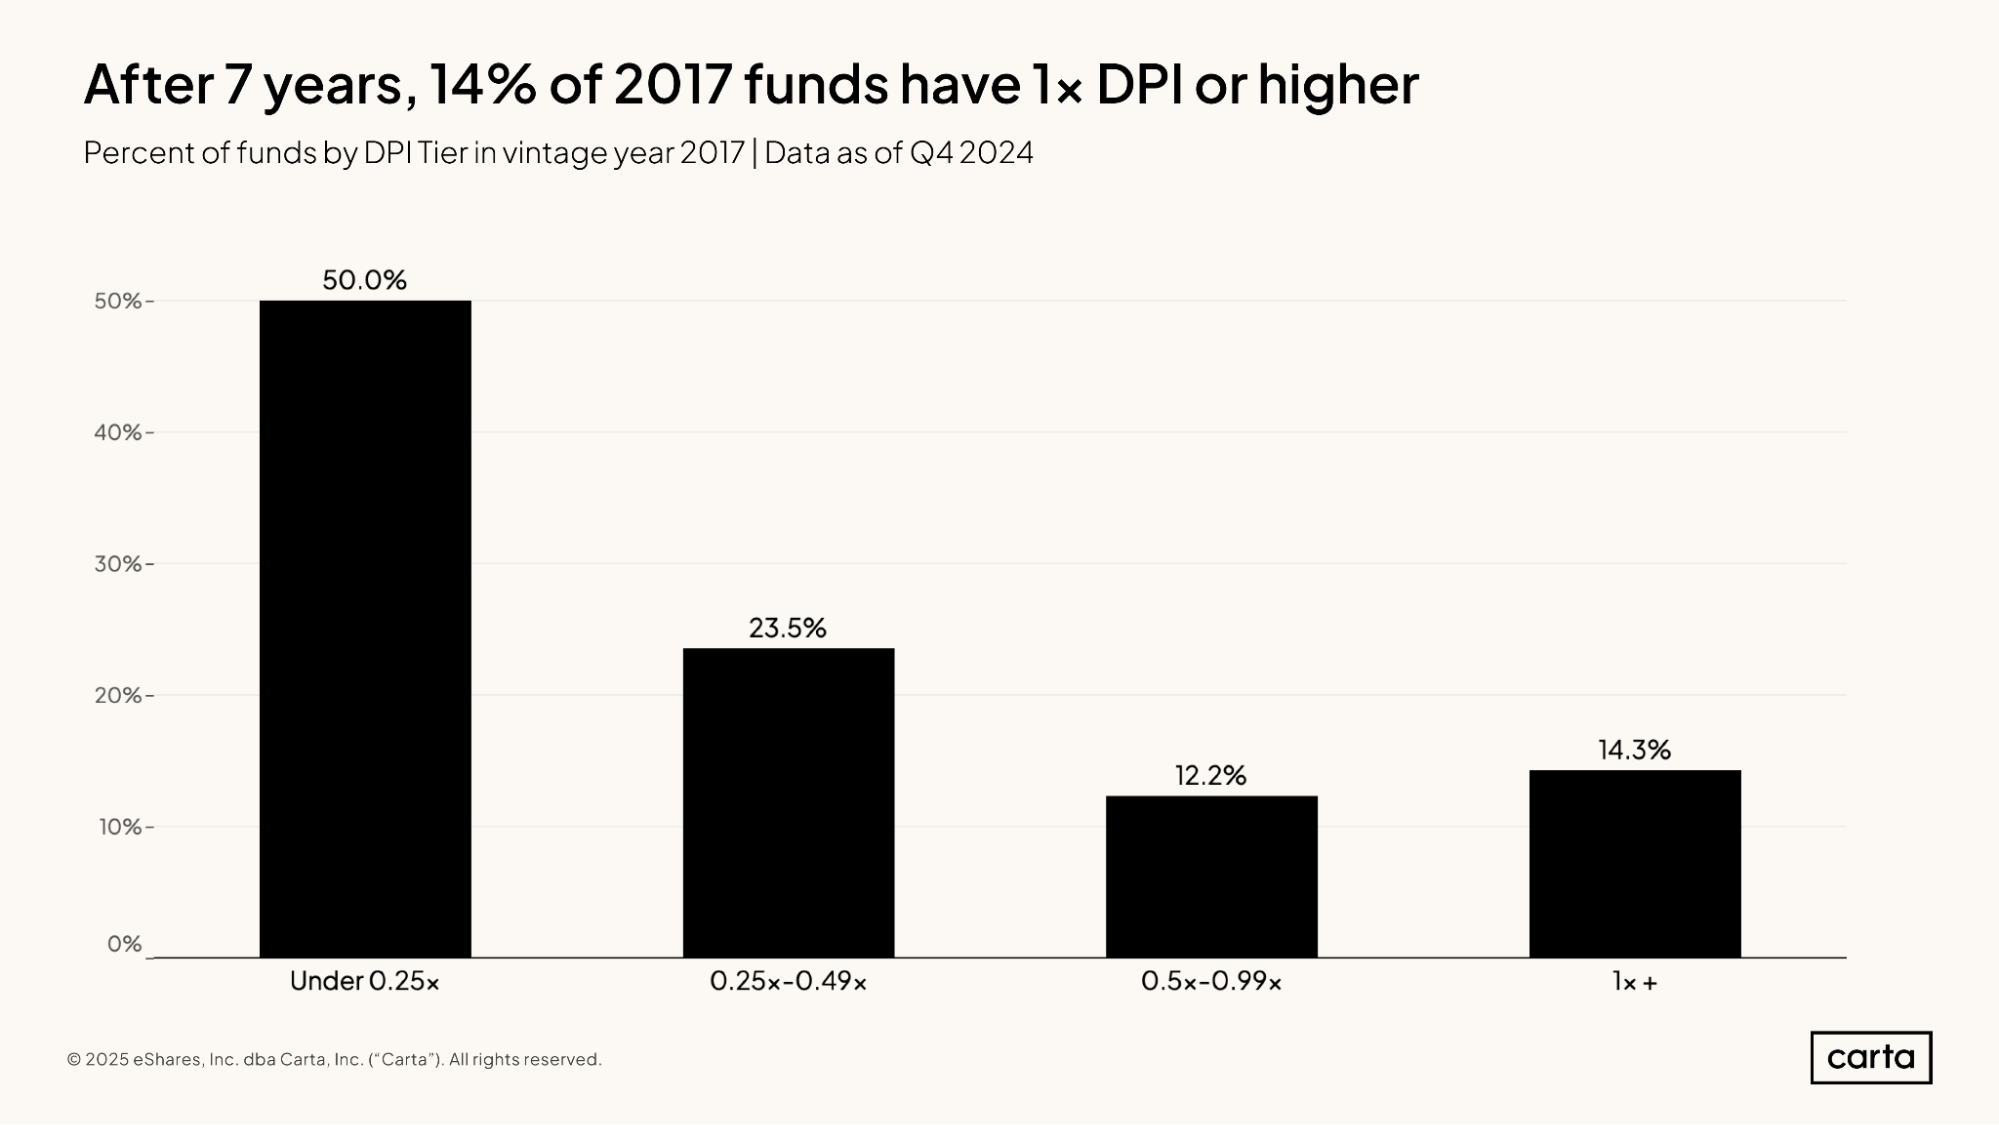
A DPI greater than 1x means that a fund’s distributions have exceeded its contributions. In layman’s terms, funds with a DPI over 1x are funds that are turning a profit.
In the 2017 fund vintage, shown here, just 14.3% of funds have a DPI greater than 1x. Across all vintages from 2018 through 2023, less than 1% of funds have hit that same 1x mark so far (15 out of 1,597).
Market context
Fund performance benchmarks must take into account the prevailing trends across startups as a whole—Carta’s cap table database of over 45,000 startups allows us to give crucial fundraising and exit context to the fund performance metrics above.
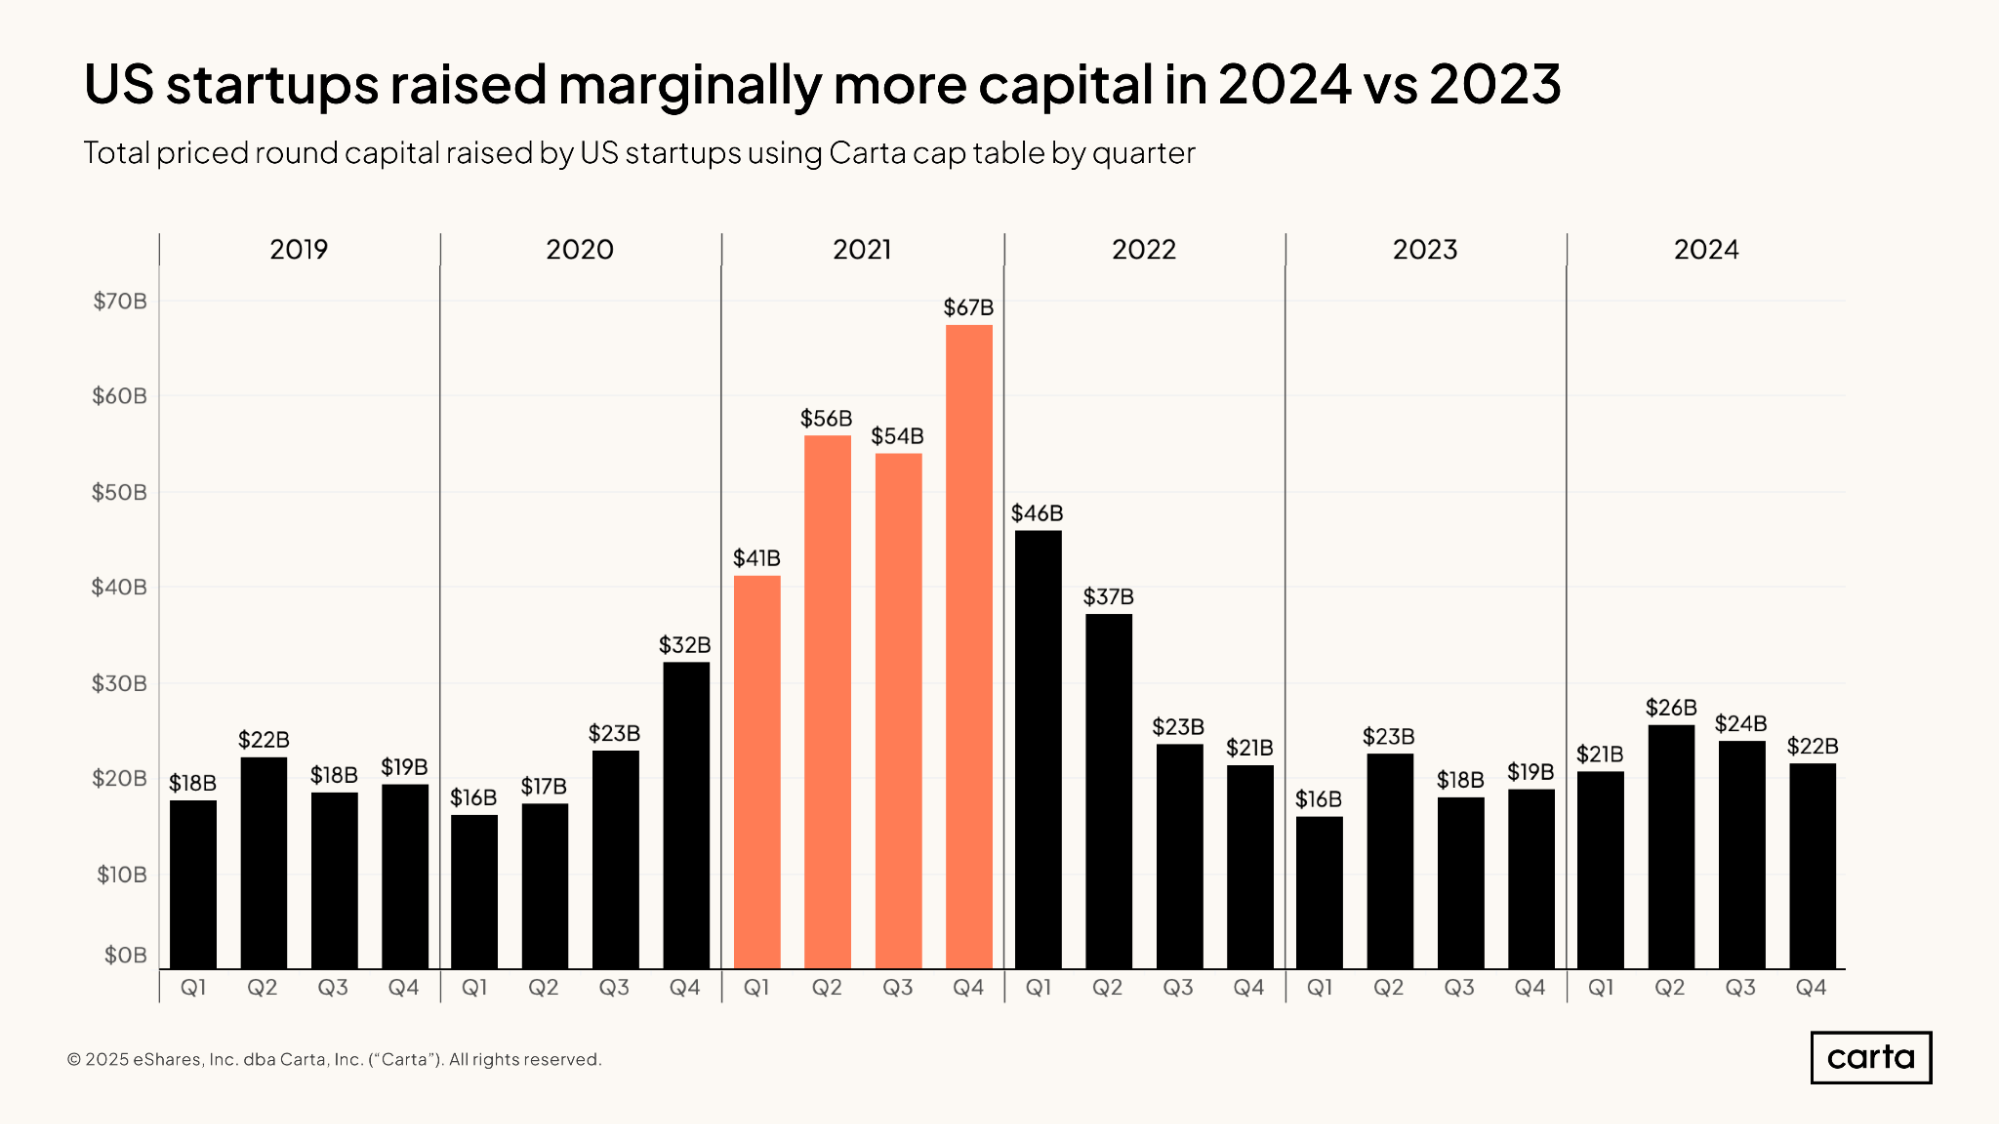
Startups in the U.S. on Carta combined to raise about $93 billion in total funding over the course of 2024, up 22% from 2023. Even with that uptick, however, it’s clear that venture activity has slowed down considerably from 2021, when venture-backed valuations were at or near recent highs across most fundraising stages.
Across several fund performance metrics, this boom year of 2021 is something of an inflection point. In general, venture funds from the 2021 vintage and later are off to significantly slower starts than funds from earlier vintages.
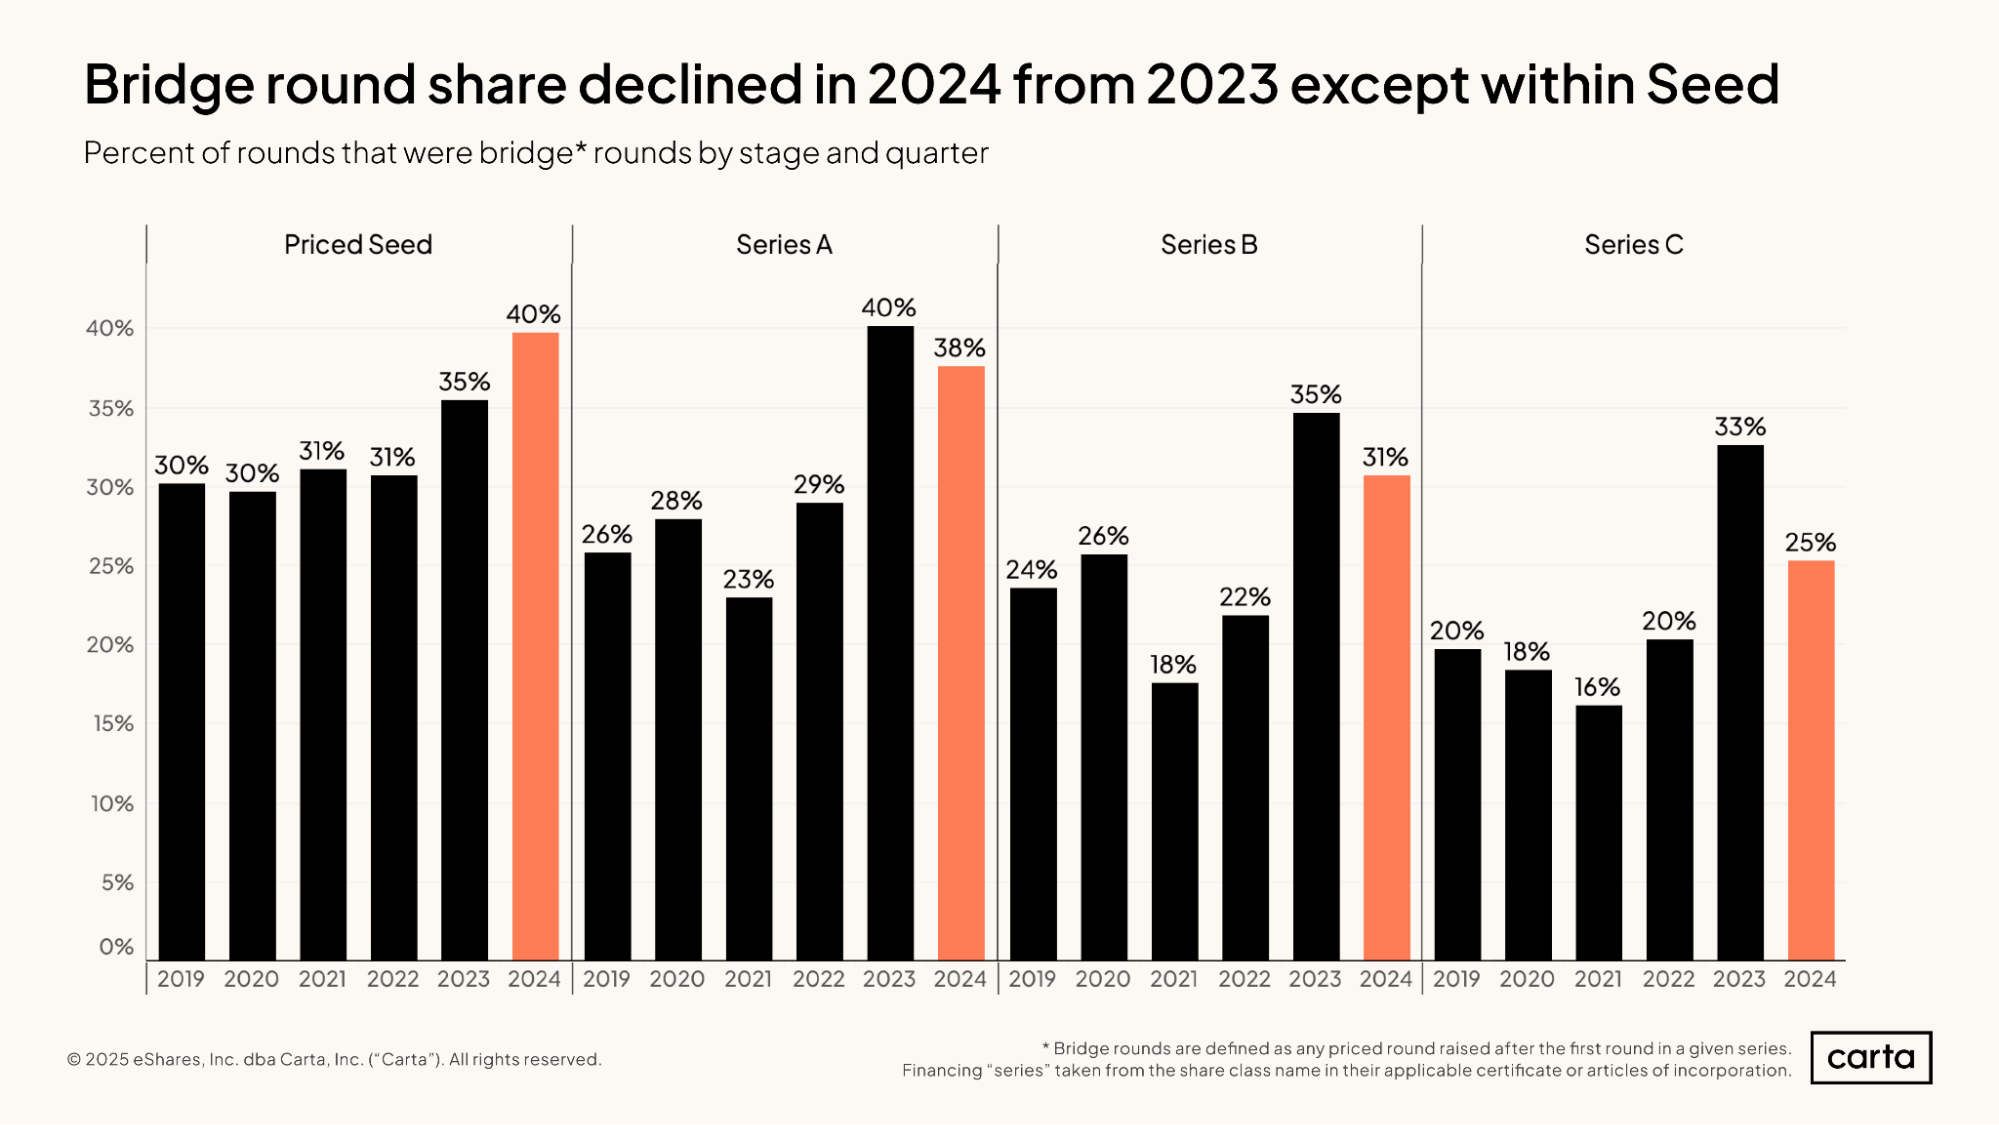
In 2023 and 2024, bridge rounds became a more common sight on the VC scene. At the seed stage, the frequency of bridge rounds continued to rise in 2024, reaching a recent high of 40%. At Series A, Series B, and Series C, however, the bridge-round rate began to decline in 2024. At Series C, the drop-off was significant.
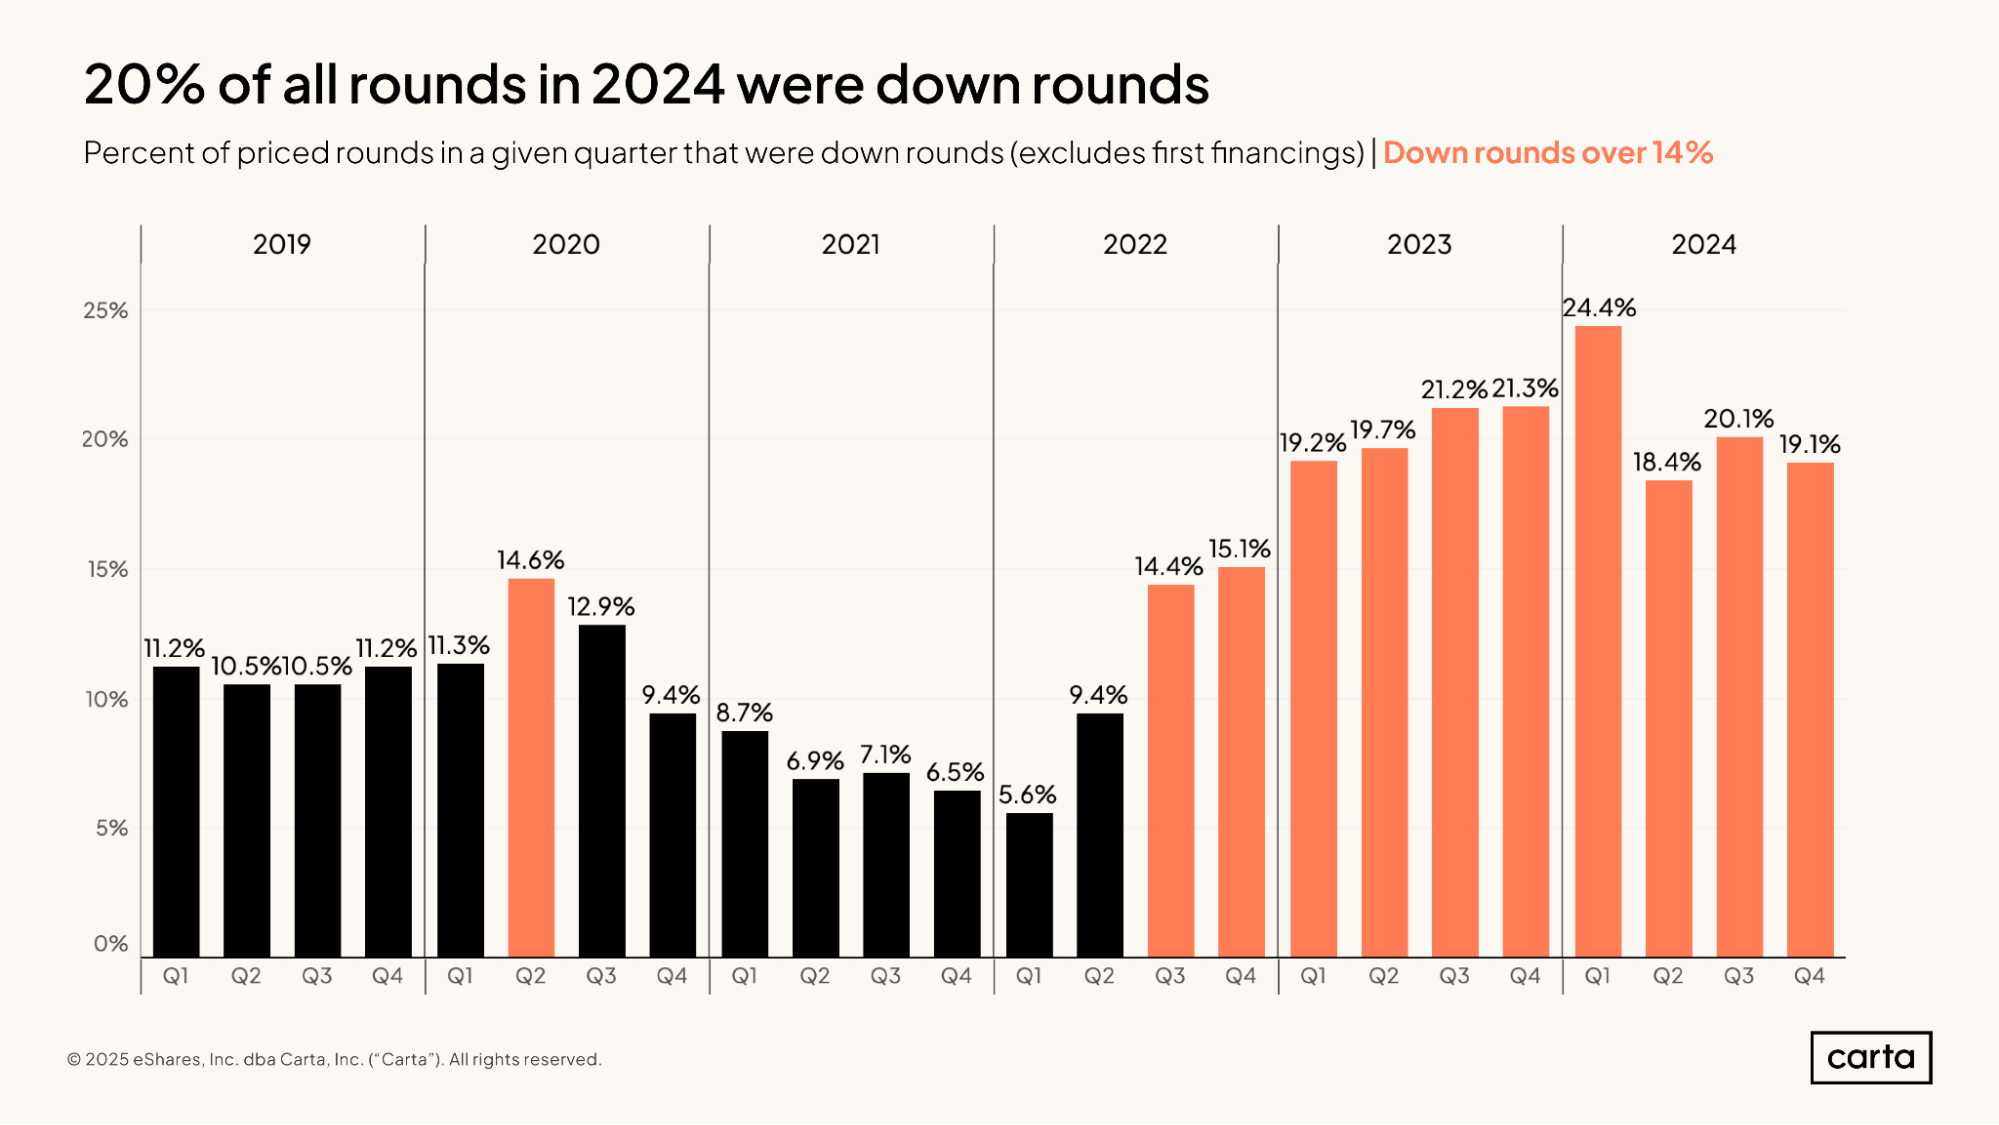
Three years ago, In Q4 2021, about one in every 15 priced funding rounds came at a lower valuation than the company’s previous priced round. In Q4 2024, that number was closer to one in five. In the big picture, down rounds are still uncommon in venture capital, but they’re far more common than they used to be.
Down rounds have a negative impact on fund performance metrics like IRR and TVPI that measure unrealized returns. If the on-paper value of an investment is declining over time, then the IRR or TVPI related to that particular investment will also decline.
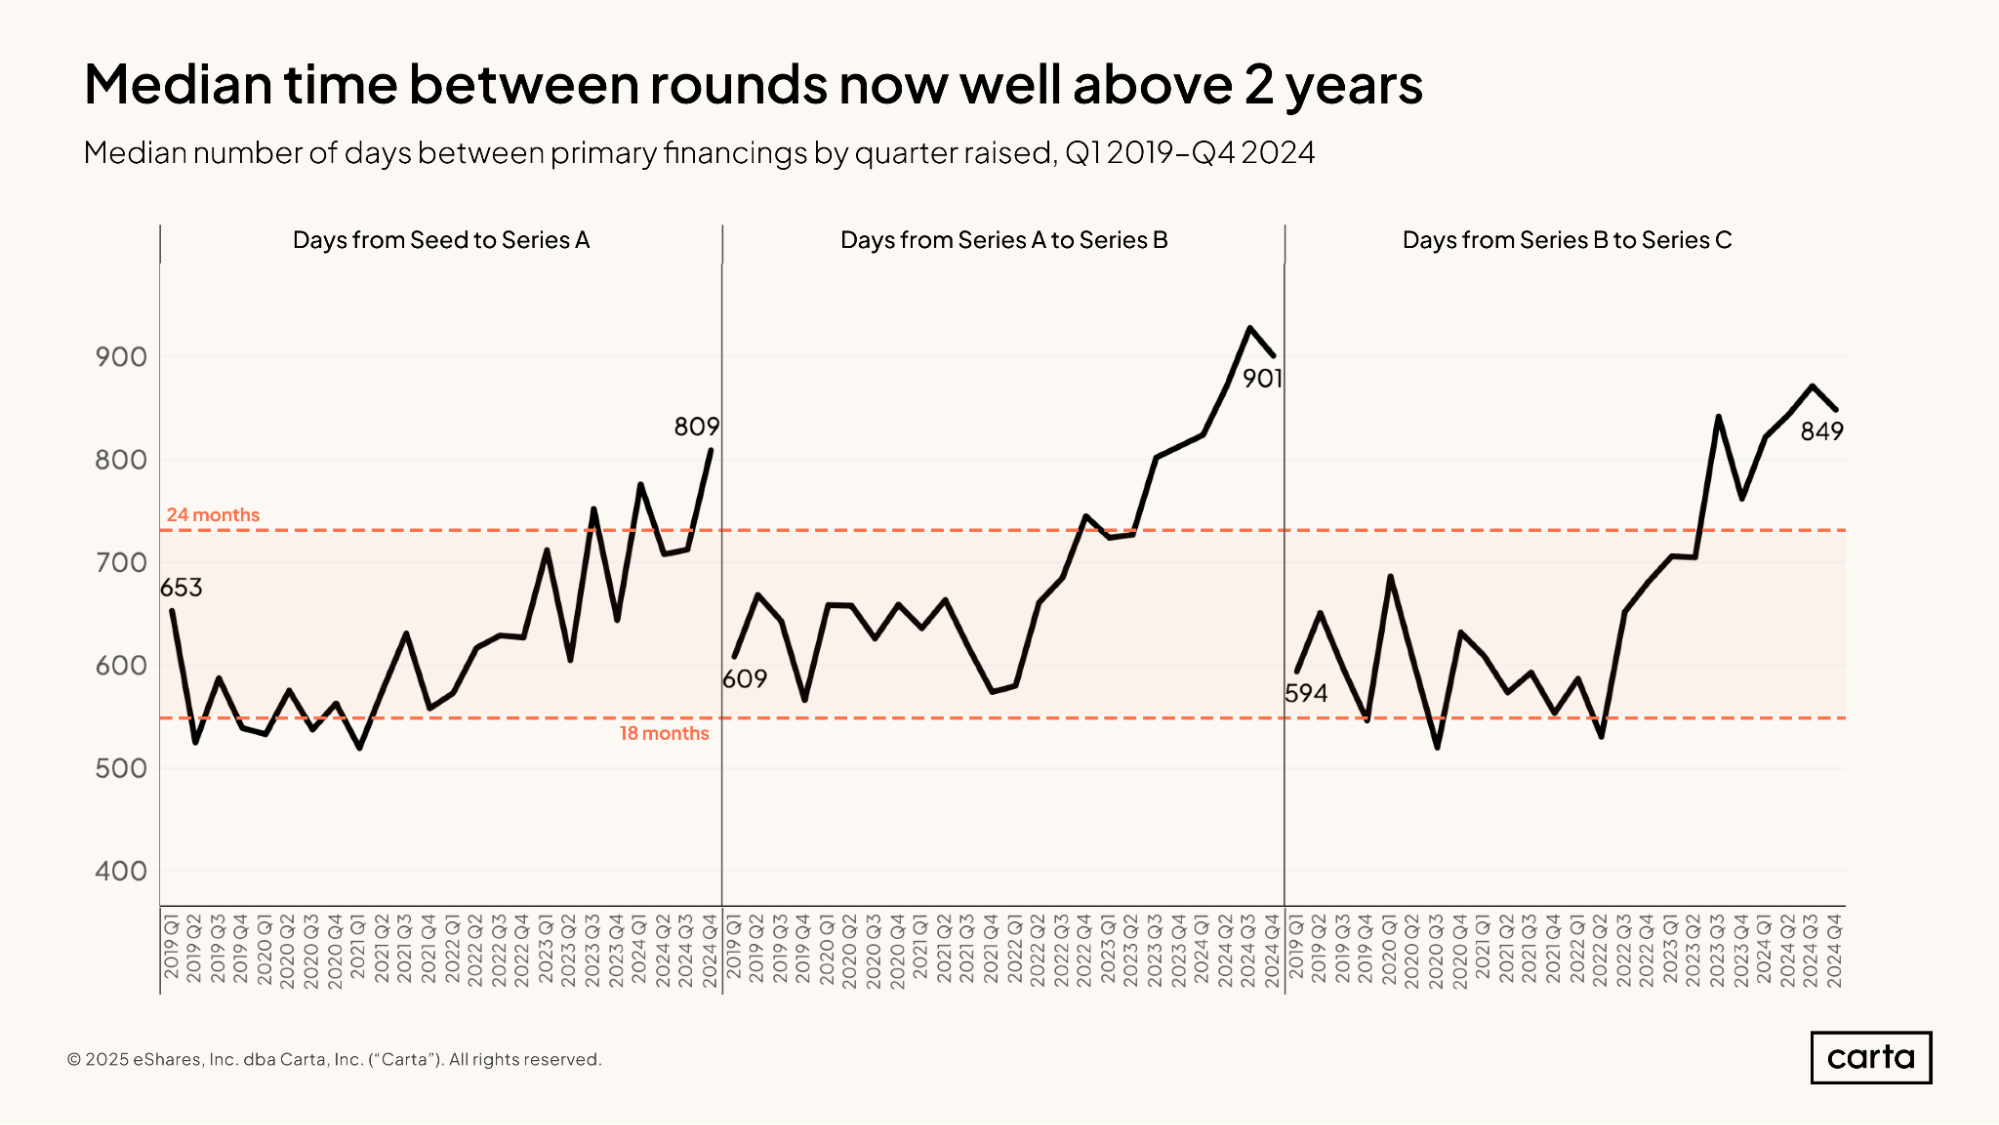
In addition to raising more bridge rounds and down rounds, startups in recent quarters are also waiting longer periods of time in between priced rounds than they used to. For instance, the median Series A round raised in Q4 2024 came 809 days after a company’s seed round, compared to a median interval of 653 days back in Q1 2019.
That’s a difference of 156 days, or about five months. This means five more months of runway that a startup might need to have on hand if it hopes to successfully move from one fundraising stage to the next.
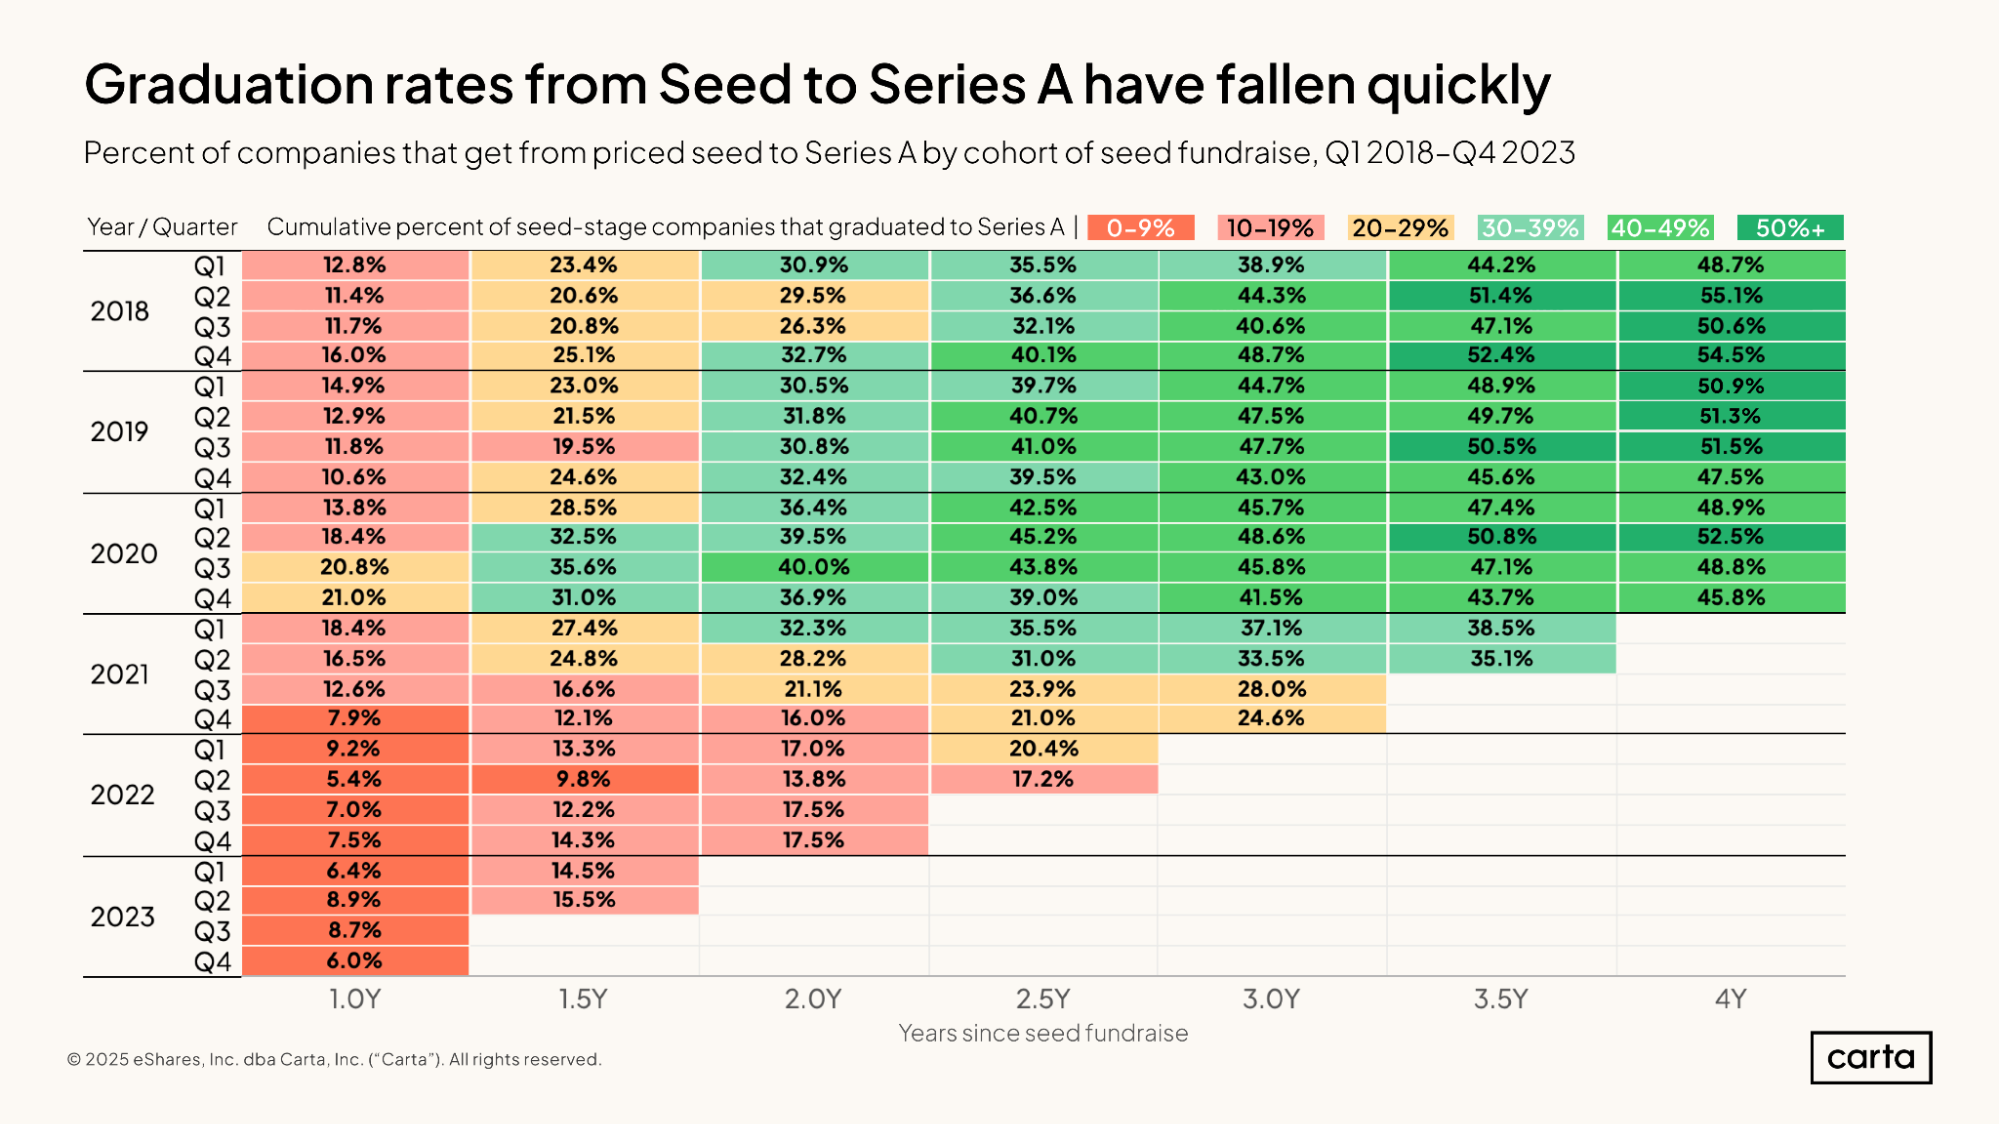
About 12.8% of the companies on Carta that raised a seed round in Q1 2018 successfully raised a Series A over the next 12 months. At the two-year point, 30.9% of startups that raised a seed round in Q1 2018 had moved on to a Series A. At three years past a seed round, the graduation rate climbed to 38.9%.
For more recent companies, these figures are significantly lower, reflecting how the typical time between rounds has grown longer in recent years. Among companies that raised a seed round in Q4 2021, some 7.9% had raised a Series A within one year, 16% within two years, and just 24.6% within three years.
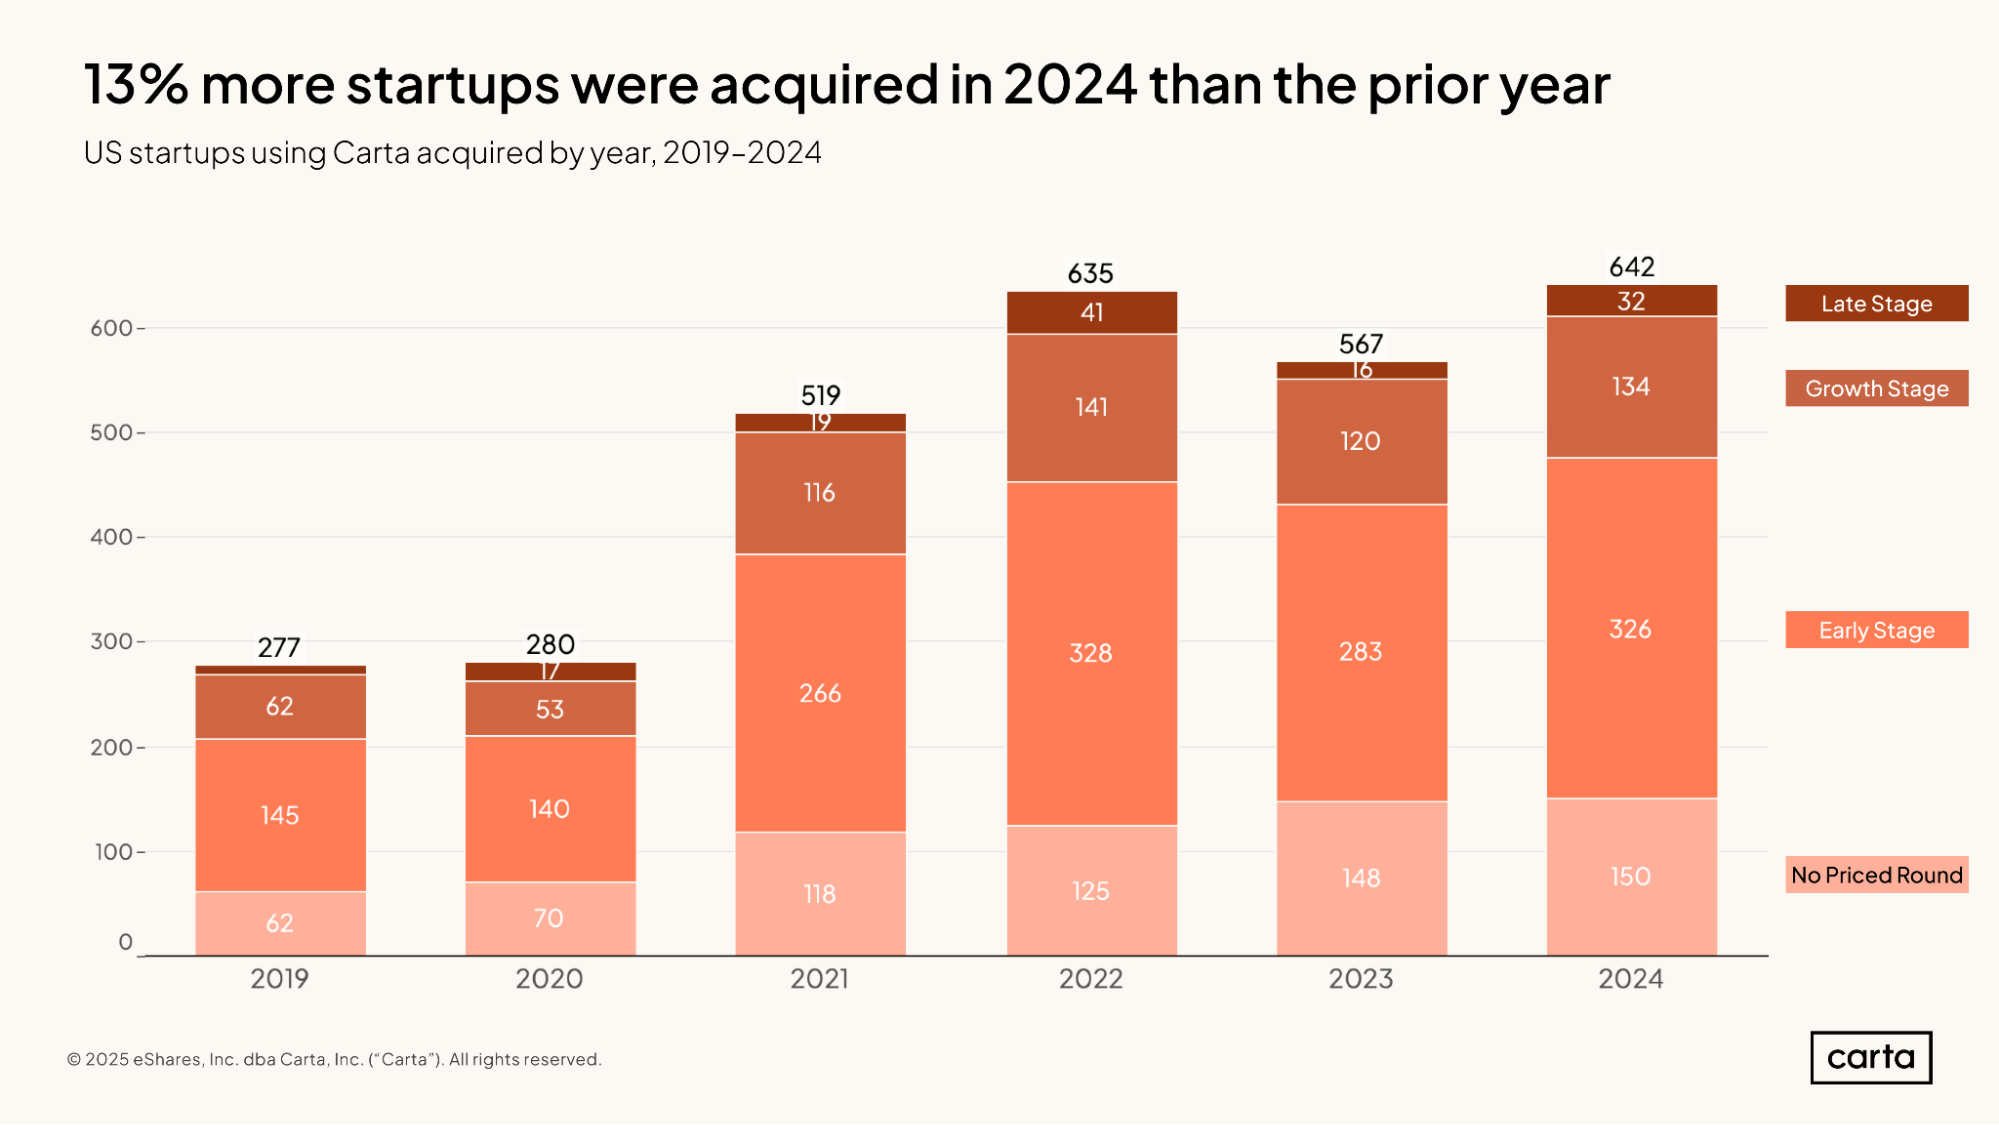
More startups on Carta were the target of acquisitions during 2024 than in any other year on record. Just about half of these targets were early-stage startups, meaning their most recent priced round was either a seed or Series A. About 21% of these startups were at the growth stage, defined here as Series B or Series C, and another 23% had never raised any priced funding at all.
Data Explorer
If you’re a Carta Fund Admin customer, you can get early access to Carta’s Data Explorer for VC Firms. Get rapid answers to questions related to your portfolio holdings, partner positions, and fund and firm performance contextualized against benchmarks such as those presented above—sign up today.
Methodology
Carta helps over 2,500 venture firms administer more than $150 billion in capital. We're setting a new standard in fund administration by sharing insights from our unmatched dataset about the private markets and venture ecosystem to help investors and limited partners make informed decisions and understand market conditions.
Overview
This study uses an aggregated and anonymized sample of Carta fund customer data. Funds that have contractually requested that we not use their data in anonymized and aggregated studies are not included in this analysis.
We use data through the end of Q4 2024. Historical data may change in future studies because there is typically an administrative lag between the time an event took place and when it is recorded in Carta. In addition, new funds signing up for Carta’s services will increase historical data available for the report.
Fund details
This report only includes funds domiciled in the United States. All funds must have reliable performance data dating back to fund inception and/or when they joined the Carta platform. Included funds are direct investors into startups and do not pursue fund of funds or other strategies. Only funds in vintage years between 2017 and 2023 were included. Funds must have at least $1M in AUM to be included.
We define vintage year as the year in which the first cost basis (either conversion or new investment) for a fund occurred.
Performance over time
In charts that use the quarters since vintage began framing, we limited the analysis to the most recent quarter in which all funds in a given vintage year had valid performance data. As such, these figures may not match exactly to the performance data displayed in charts without a similar time series framing.
Financings
Financings include equity deals raised in USD by U.S.-based corporations. The financing “series” (e.g. Series A) is taken from the share class name in their applicable certificate or articles of incorporation. Financing rounds that don’t follow this standard are not included in any data shown by series but are included in data not shown by series. Primary rounds are defined as the first equity round within a series. Bridge rounds are defined as any round raised after the first round in a given series.


DISCLOSURE: This communication is on behalf of eShares, Inc. dba Carta, Inc. ("Carta"). This communication is for informational purposes only, and contains general information only. Carta is not, by means of this communication, rendering accounting, business, financial, investment, legal, tax, or other professional advice or services. This publication is not a substitute for such professional advice or services nor should it be used as a basis for any decision or action that may affect your business or interests. Before making any decision or taking any action that may affect your business or interests, you should consult a qualified professional advisor. This communication is not intended as a recommendation, offer or solicitation for the purchase or sale of any security. Carta does not assume any liability for reliance on the information provided herein. © 2026 Carta. All rights reserved. Reproduction prohibited.