
- State of Private Markets: Q1 2022
- Shifts in the venture landscape
- Venture capital rounds and cash raised
- Venture capital cash raised by industry
- Venture capital deals by state
- Venture capital deals and cash for top states
- Venture capital cash raised by stage
- Percentage of venture capital cash raised by stage
- Rounds and valuations by stage
- Early-stage valuations and raises
- Early-stage dilution
- SAFEs and convertible notes
- Late-stage valuations and raises
- Late-stage dilution
- Employees and liquidity
- Start-up employee departures
- Employee options exercised
- Tender offers
- Mergers and acquisitions
- Methodology
- Overview
- Financings
- Industry groupings
- Terminations
Our customers place ongoing trust in Carta to manage data across over 28,000 companies and $2.5 trillion in equity. We see it as our responsibility to share the insights that come from that unmatched amount of data about the private market to help investors, founders, and employees make informed decisions and understand market conditions.
In Q1 2022, those market conditions changed—significantly.
Venture capital deployment significantly decreased. Total deals dropped by 38% and cash raised by 46% from a high point in Q4 2021. The steepest declines were at Series E and beyond, where there were 54% fewer deals and 56% less cash.
The Great Resignation is shifting as startups let go of employees. Overall terminations increased and the percentage of departures that were involuntary spiked from 20% in February to 34% in March.
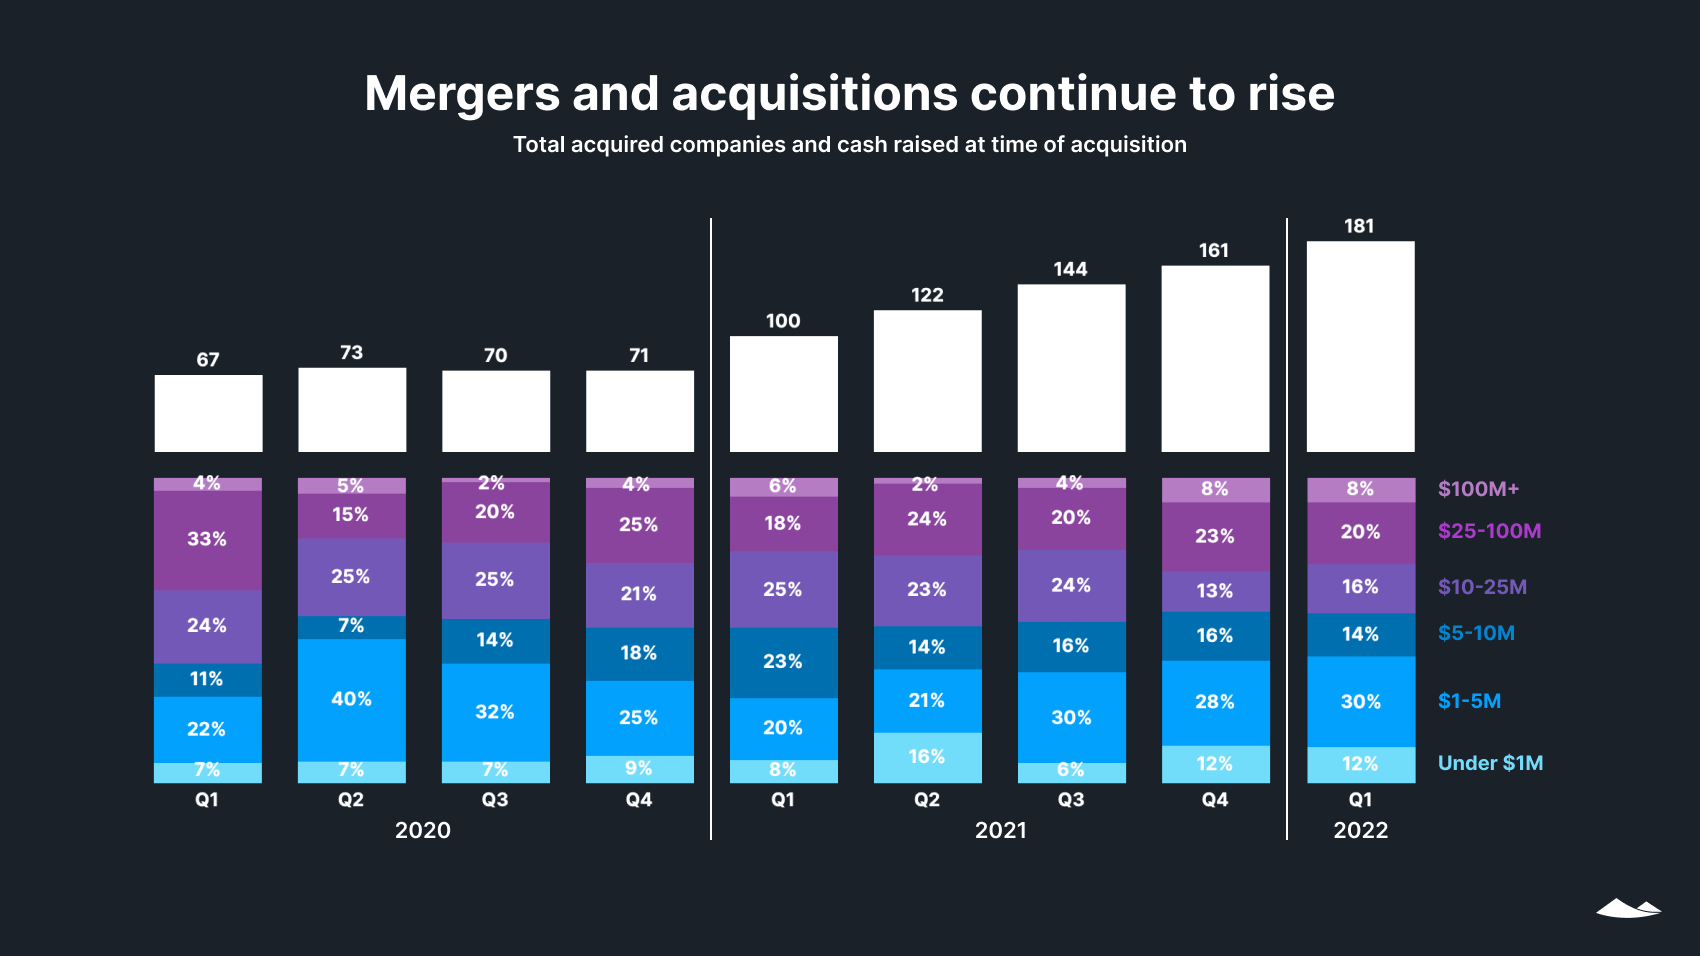
Merger and acquisition activity continued to rise. The number of mergers and acquisitions per month increased throughout the quarter, and early signs suggest that this trend may continue in early Q2.
What’s behind the slowdown in venture capital deployment? The highs of 2021, buoyed by investments deferred in 2020, could not be sustained indefinitely. Public markets have been declining, particularly technology stocks, and Q1 saw the fewest IPOs per quarter in years. Two additional factors may have come into play: First, with high global uncertainty over Russia’s war in Ukraine, many investors slowed down their dealmaking pace, perhaps in hopes of waiting out the volatility. Also, the venture ecosystem was reacting to anticipated Federal Reserve interest rate hikes, which began in March.
What can we expect for the rest of the year? It remains to be seen whether these drops mark an adjustment from 2021’s record-breaking venture activity or the beginning of a more sustained downturn. Economic and geopolitical uncertainty due to the pandemic, supply-chain problems, inflation, and the war in Ukraine may continue to impact late-stage venture capital along with public markets. On the other hand, record-setting amounts of dry powder have been amassed by funds in 2021 and Q1 2022 and may continue to be deployed as the dust settles, particularly to early-stage companies and those with solid fundamentals.
Shifts in the venture landscape
Venture capital rounds and cash raised
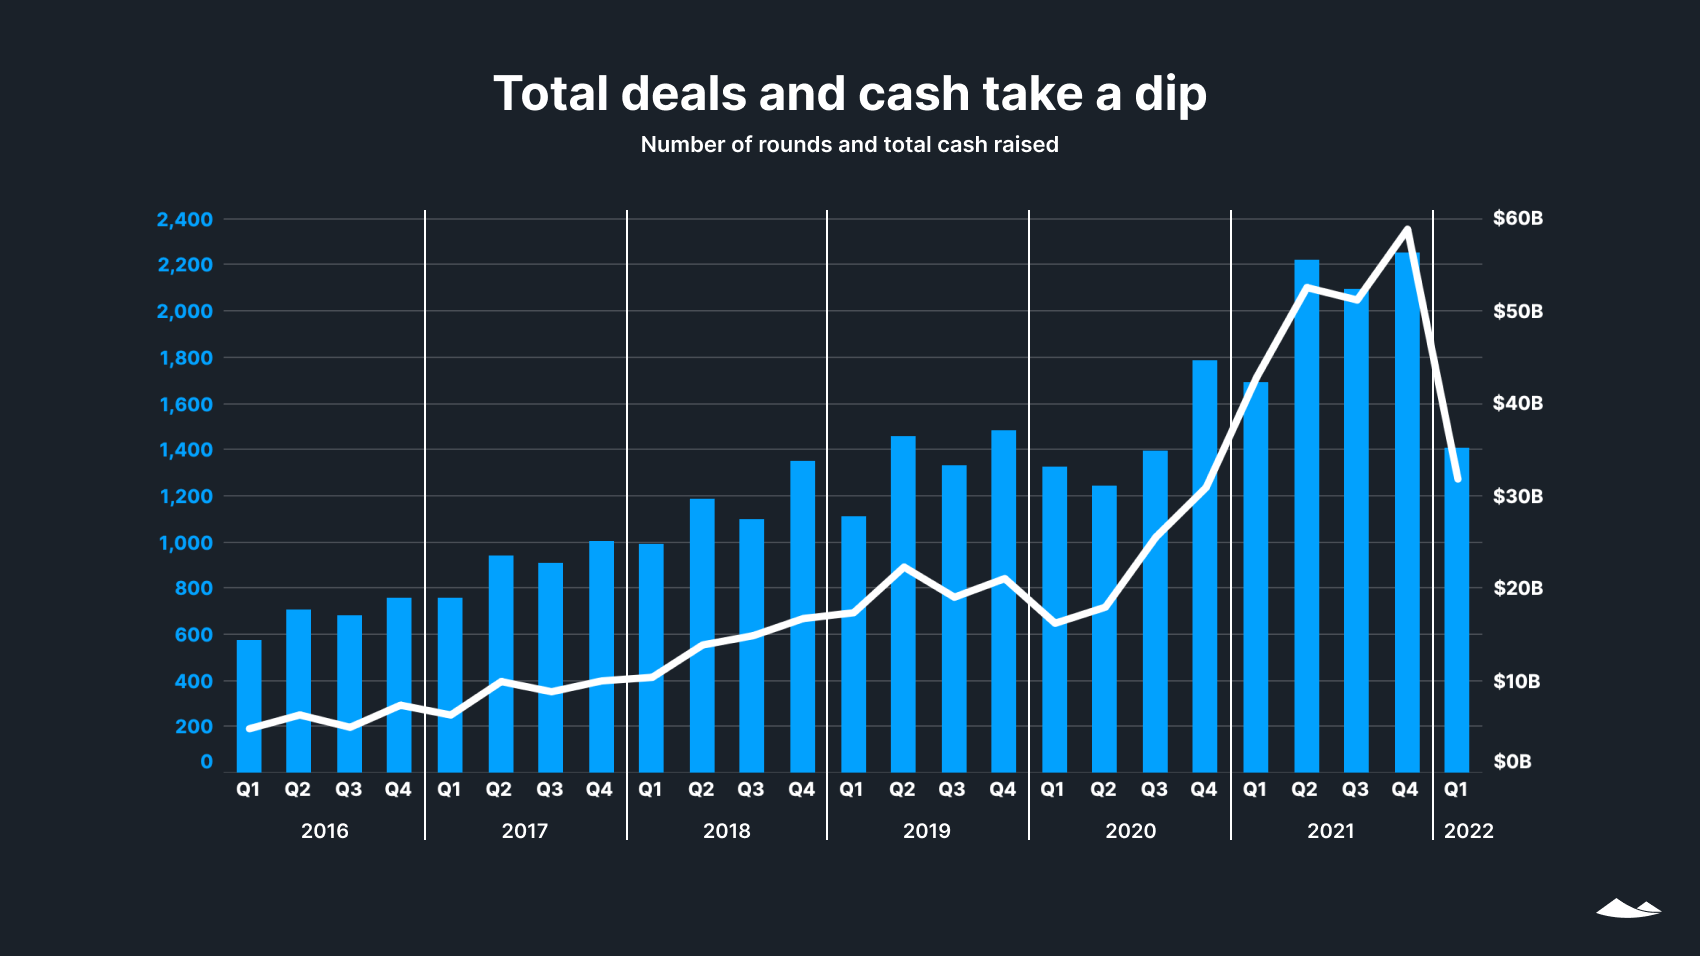
There was a significant drop in both the number of U.S. venture investment deals and total cash raised on the Carta platform in Q1 2022, though those totals will tick up slightly as reported deals continue to trickle in.¹ While much of the decline in total cash is due to fewer deals, some of it is due to smaller deal sizes, especially at later stages. Still, we expect the number of rounds in Q1 to finalize at a significantly higher number than any previous quarter before Q4 2020.
Venture capital cash raised by industry
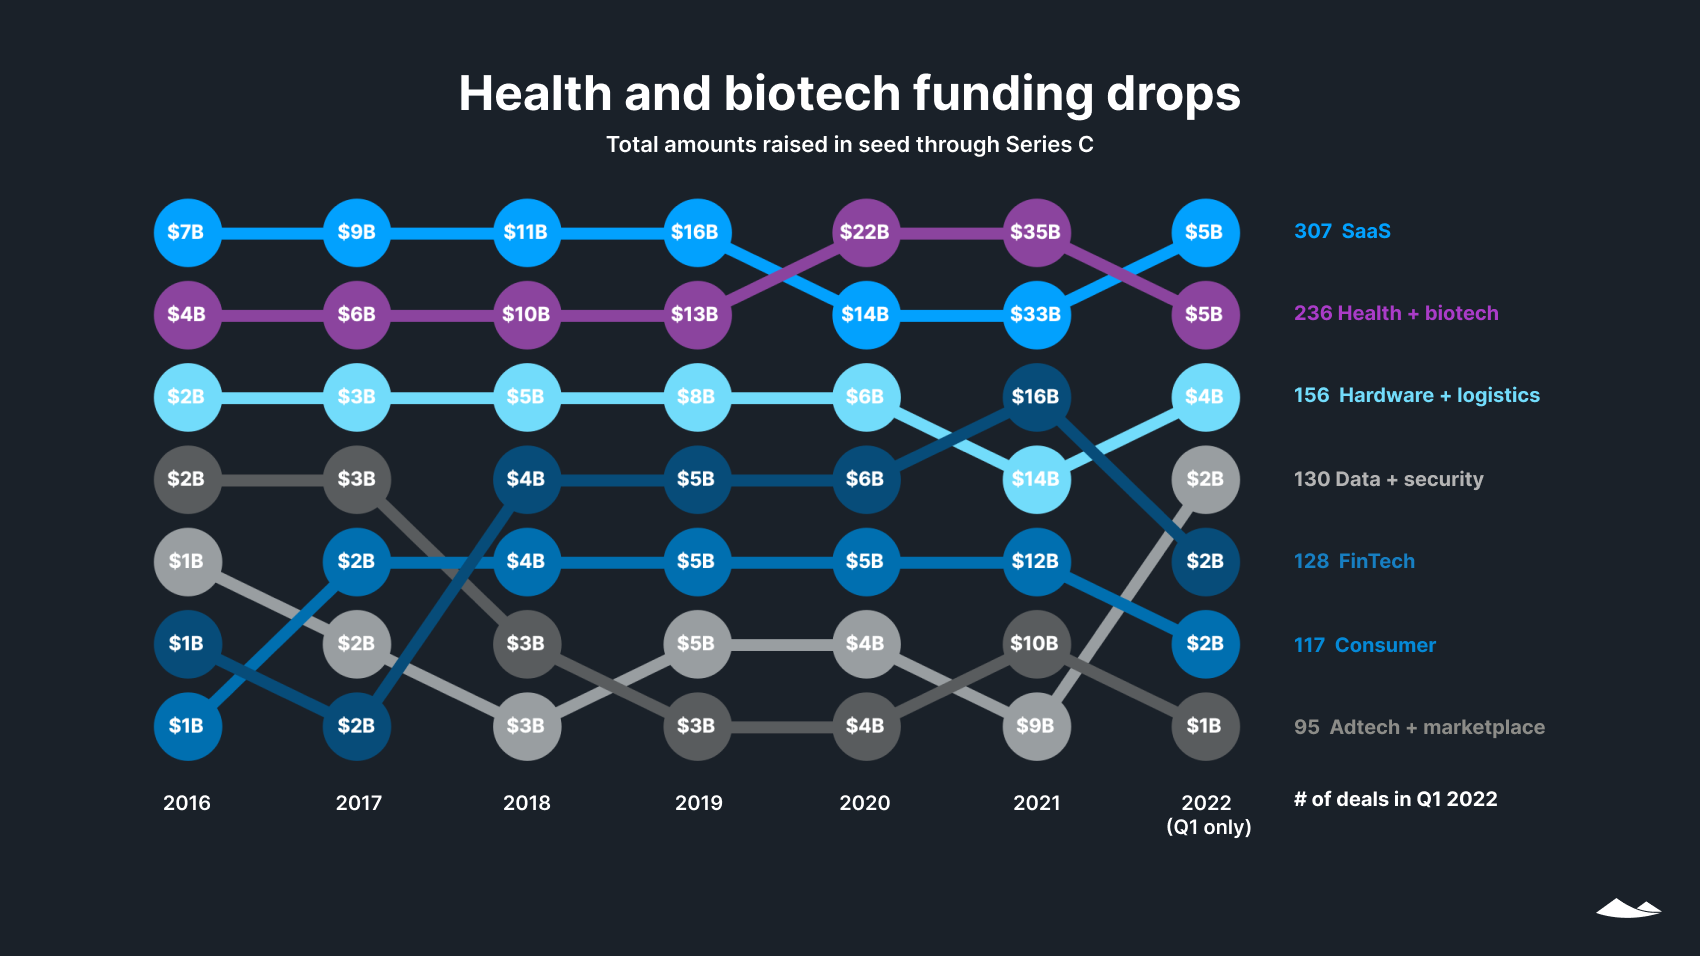
The rate of seed through Series C funding for most sectors was lower than the quarterly average for 2021, but higher than that of 2020.
The exception was health and biotech. Buoyed by pandemic-time interest, that sector saw higher funding in most of both 2020 and 2021 as compared with Q1 2022. Health and biotech also received the most overall funding in 2020 and 2021. By the last quarter of 2021, though, software as a service (SaaS) had returned to the top spot. It remained there in Q1 2022, with $5.5B in total funding vs. $4.6B for health and biotech. This may mark a return to pre-pandemic levels of relative funding for healthcare startups.
Over the last quarter, the amount of funding going to fintech (-51%), adtech (-48%), and health/biotech (-47%) dropped by about half. Hardware and logistics was basically flat, with a 1% quarter-over-quarter drop, and data and security had a small drop of 6%.
Venture capital deals by state
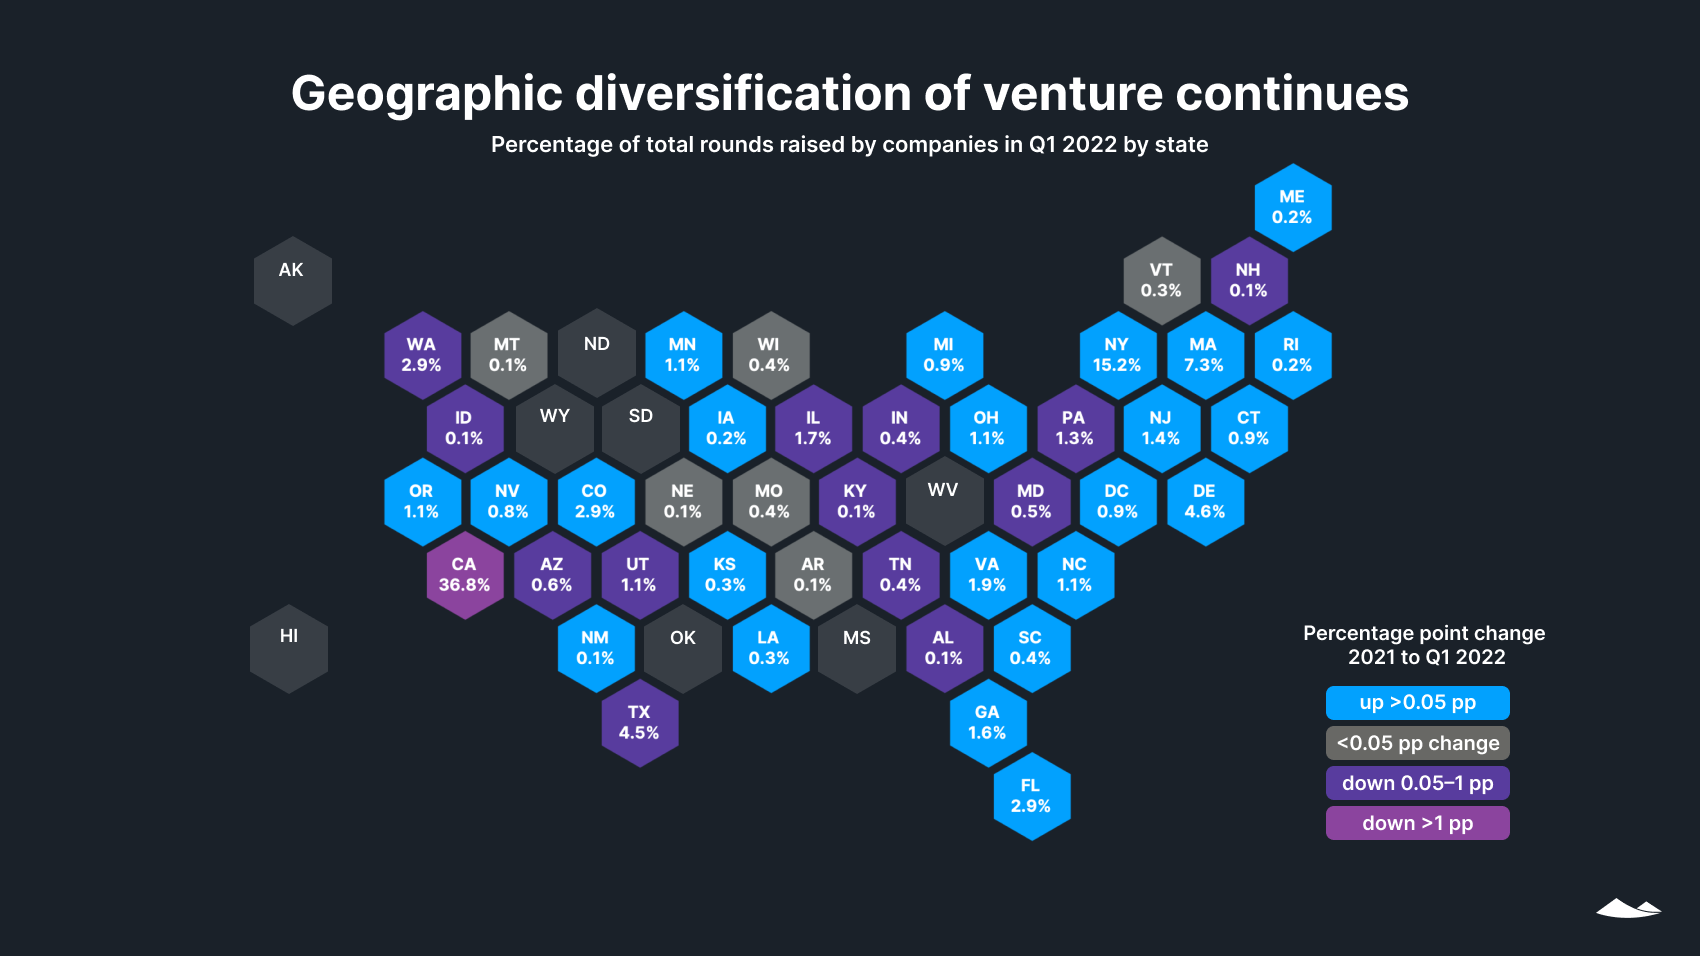
As deal volumes sharply dropped across the board, contractions in venture funding were widespread and not concentrated in any specific region. Overall, the venture ecosystem continued its years-long trend toward geographic diversity.
California companies still raised the lion’s share of venture capital deals, but that share is getting smaller: 37% of all deals took place in California in Q1, compared to 40% in 2021 and 45% in 2016. Nearly half (23) of all states saw their percentage of deals increase from 2021 to Q1 2022. Notably, Delaware nearly tripled its percentage of deals over the past five years, from 1.5% in 2016 to 4.4% in Q1 2022. The percentage of deals in Florida also more than doubled in this time, from 1.3% in 2016 to 2.9% in Q1 2022.
Venture capital deals and cash for top states
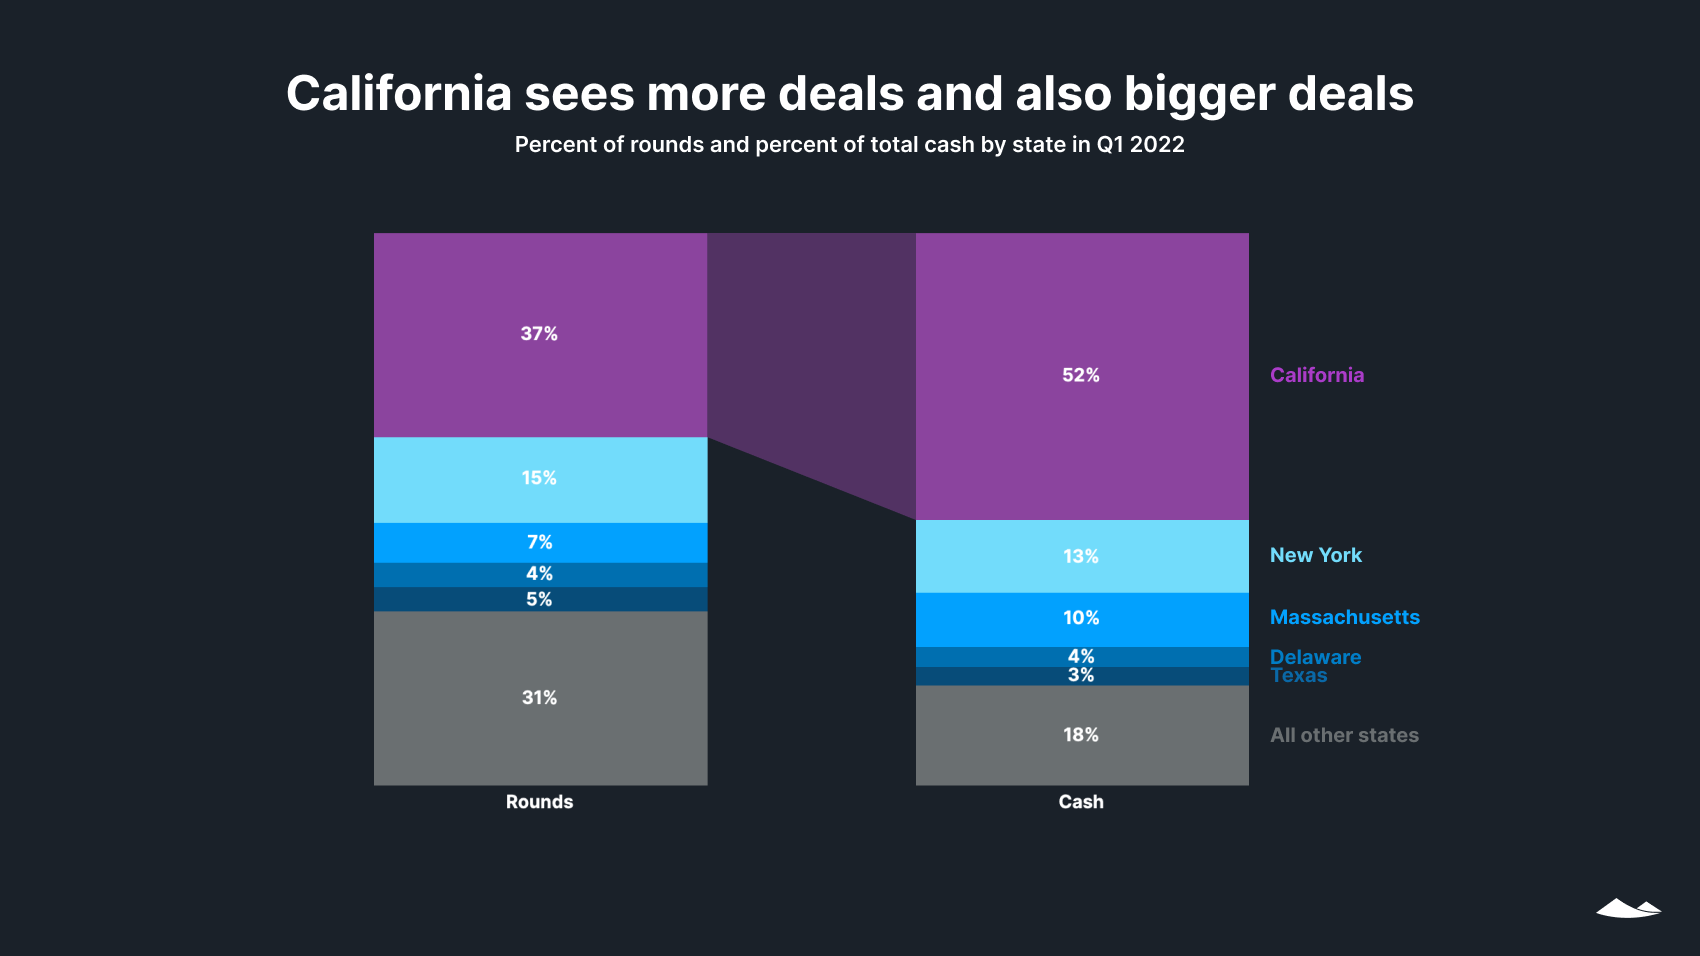
California, which had more than twice as many deals as any other state, saw an even larger percentage of total cash. This pattern has been relatively stable over time. In Q1, California was home to 37% of deals and 52% of cash, as compared with 45% of deals and 50% of cash in 2016.
As venture ecosystems outside California continue to mature, more firms in other states may shift to include later-stage investment strategies, reducing the size of the cash gap.
Venture capital cash raised by stage
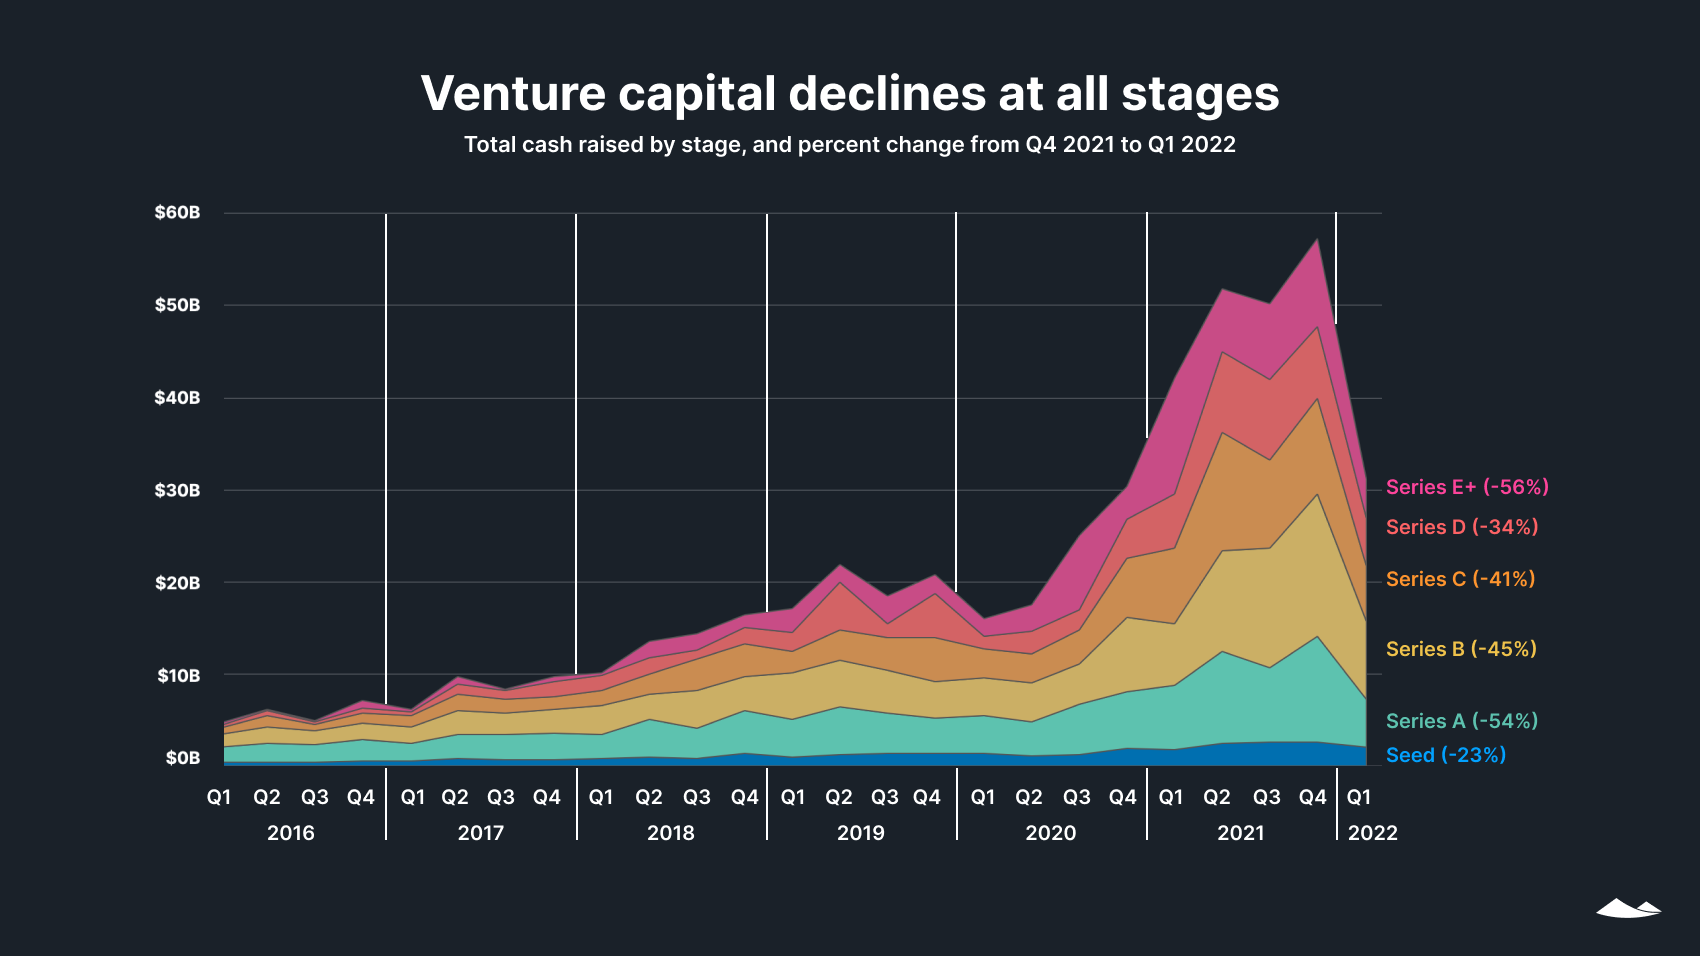
Cash declined across all stages in Q1 2022. Two stages saw less than half of the previous quarter’s volumes: Series E and beyond (down 56% from Q4 2021) and Series A (-54%).²
Seed deals saw the smallest drop in cash at 23%, indicating that smaller, high-risk, high-reward venture deals were insulated to an extent from the quarter’s sharp downward trend.
In terms of the number of deals, Series E and beyond saw the biggest drop (-46%) from Q4 2021 to Q1 2022, followed by series A (-44%). Series D (-20%) and C (-27%) saw the smallest decreases in number of deals.
Percentage of venture capital cash raised by stage
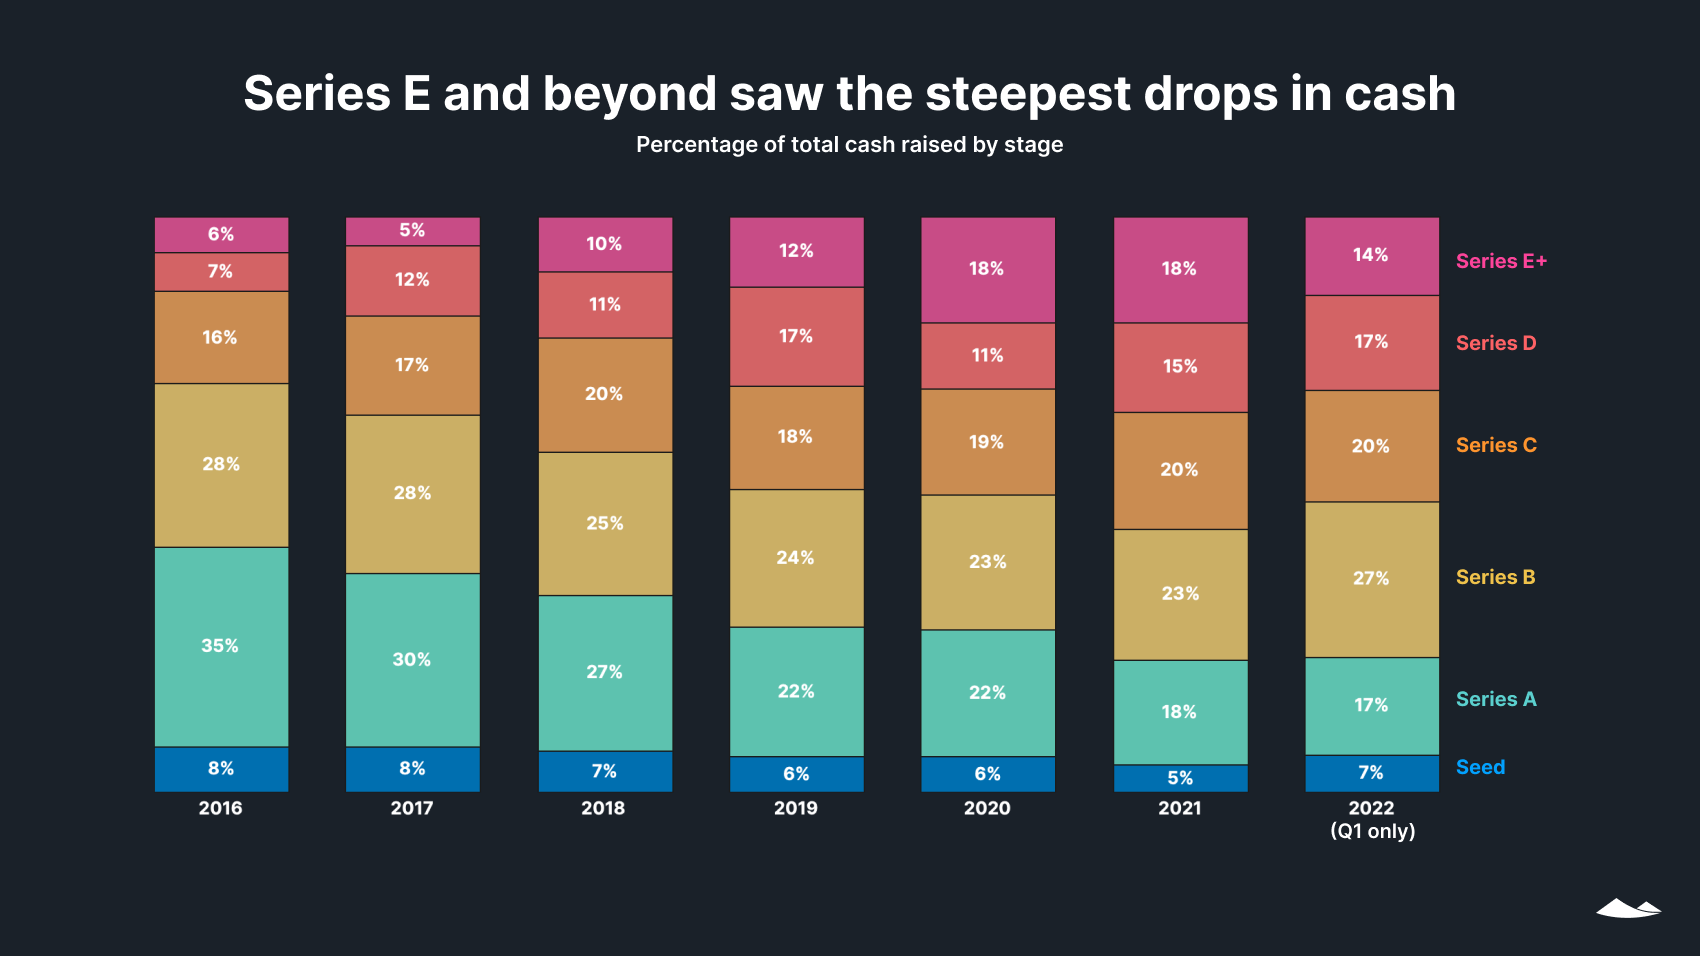
The first quarter of 2022 saw a pullback from a years-long shift in cash toward the latest-stage rounds: Just 14% of all cash went to Series E and above. This could be due to the same macroeconomic challenges weighing down the public markets, such as inflation, rising interest rates, and supply chain disruptions.
At the other end of the spectrum, the amount of cash going to seed rounds decreased by 23%, but larger decreases across other stages means that the seed stage now has a slightly larger slice of a smaller pie. As such, the five-year trend of seed rounds taking a decreasing percentage of all cash was reversed in Q1.
The percentage of cash going to Series A has declined each year since 2016. However, while the number of dollars going to Series A rounds increased in all but one quarter since Q3 2020, widespread declines mean that both the number and percentage of dollars going to Series A declined in Q1.
Rounds and valuations by stage
Early-stage valuations and raises
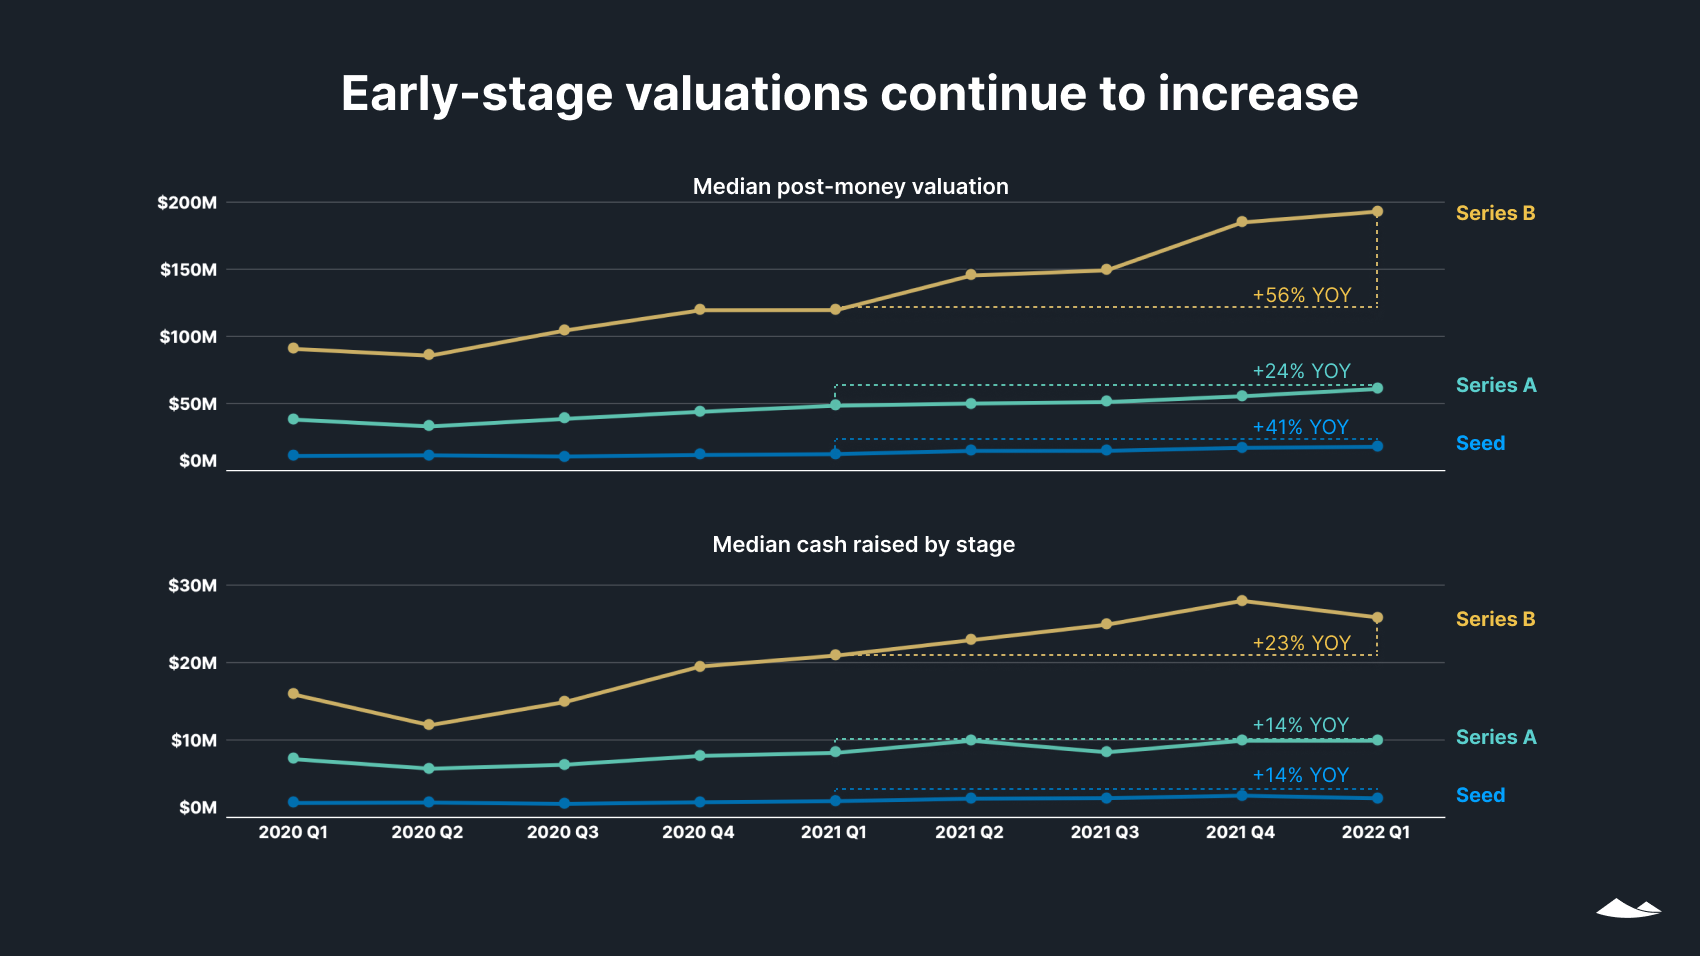
Median post-money valuations were up for all early-stage companies, both year over year and quarter over quarter. Series B saw the biggest yearly increase (56%), with a quarterly increase of 4%. Seed and Series A saw slightly larger quarterly increases, of 5% and 6%, respectively.
Median round sizes were up at all early stages year over year, but down or flat quarter over quarter. The median seed round size in Q1 saw a quarterly decrease of 12%, compared with an 11% decrease for Series B, and no change for Series A.
A plurality (47%) of seed rounds were in the $2M to $5M range, while 47% of Series A rounds were between $10M and $25M. Series B saw a wider range of deal sizes, with the plurality (31%) in the $25 to $50M range.
Early-stage dilution
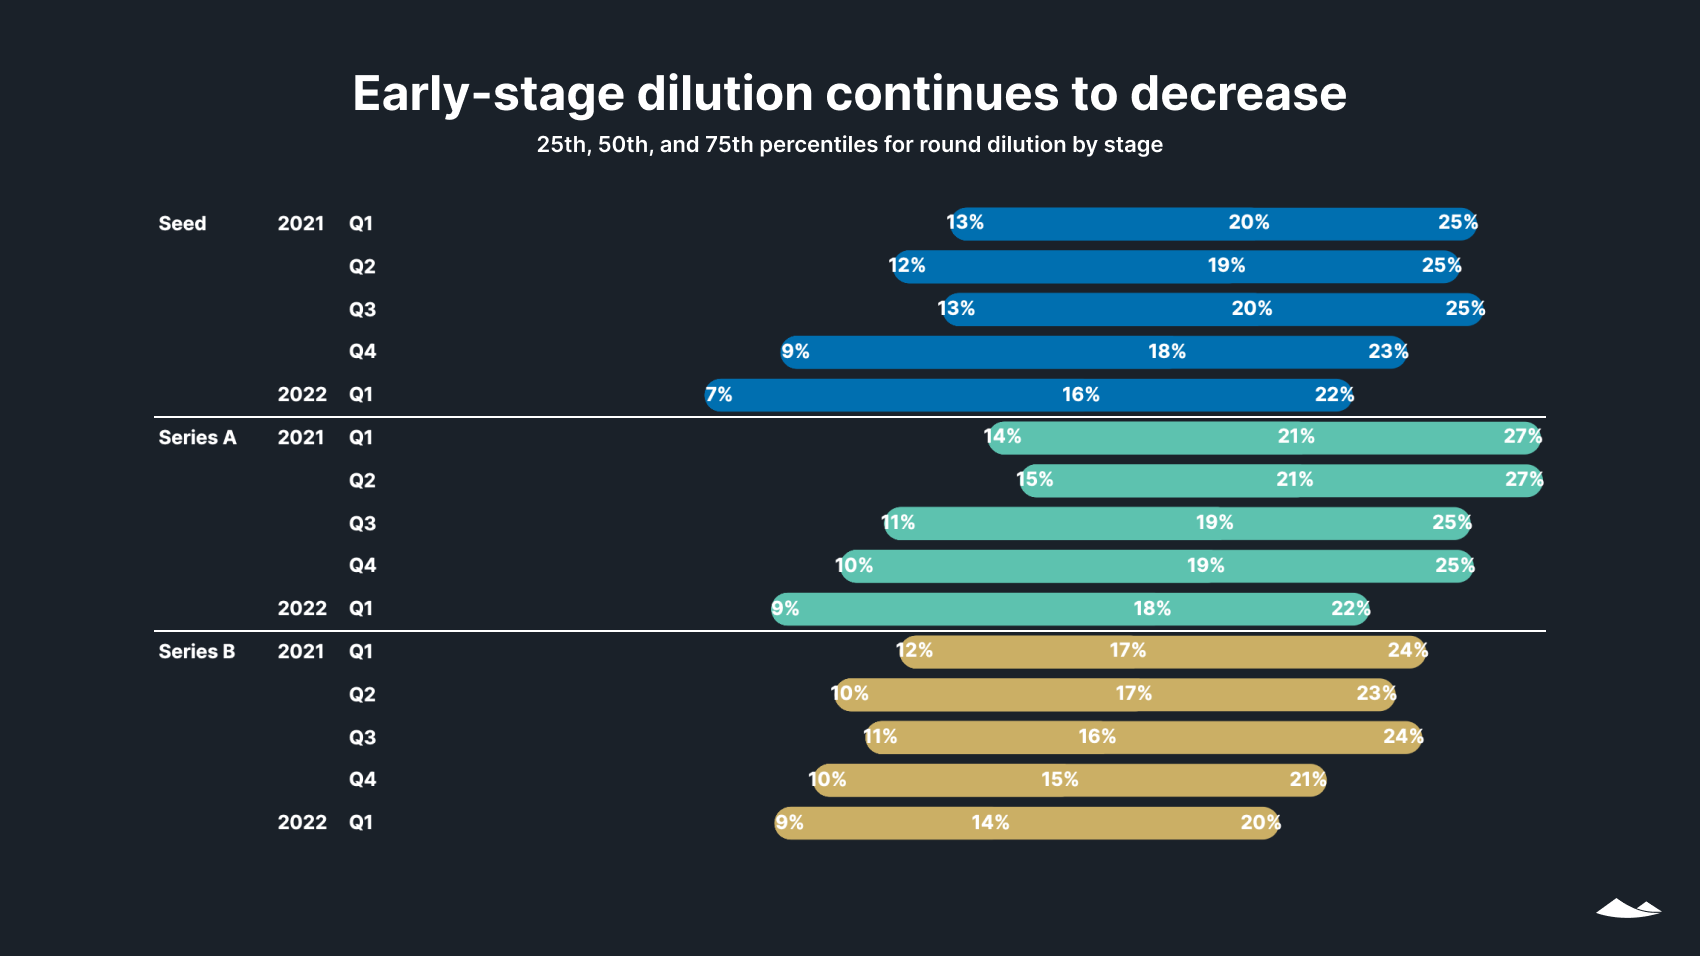
Dilutions for seed, Series A, and Series B rounds were lower in Q1 2022 than at any point since 2016, continuing a trend of founders holding on to more ownership in each round than their counterparts did in the past. Median round sizes were flat or down quarter over quarter at all early stages, while post-money valuations were up—both of which pushed dilutions lower.
Should venture capital continue to tighten in 2022, this trend in dilutions may reverse if investors demand larger percentages of the companies they invest in.
SAFEs and convertible notes
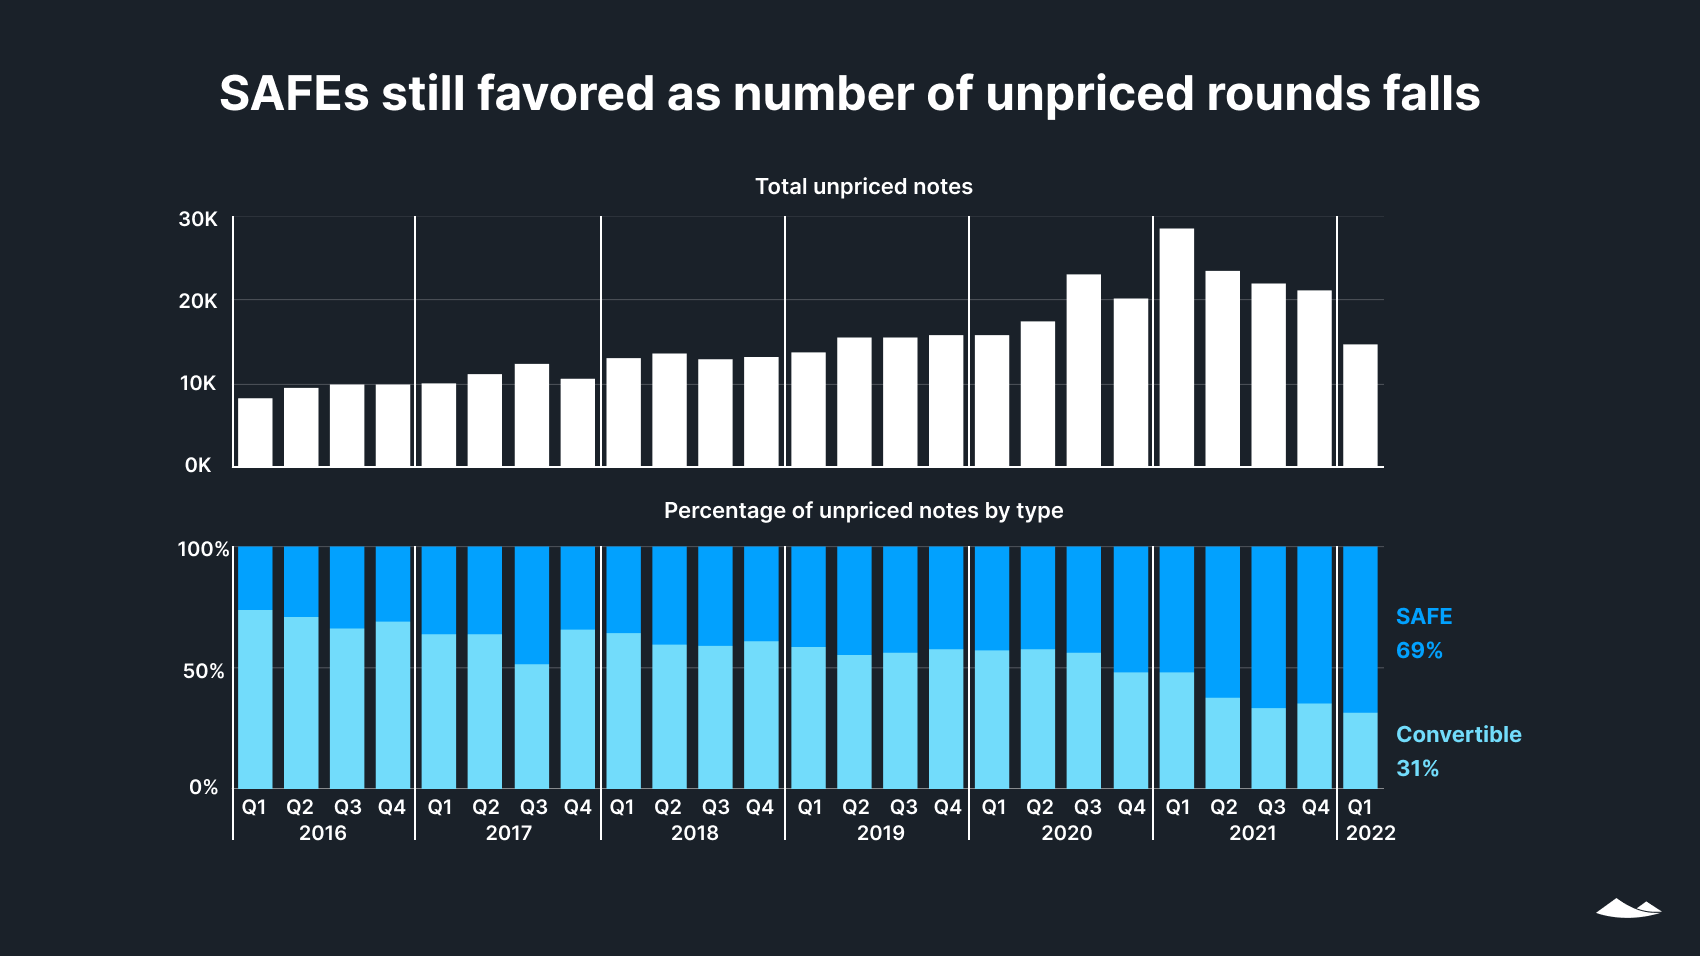
Fewer unpriced rounds closed in Q1 2022 than in any month since Q1 2019—a 30% drop from the previous quarter continued a downward trend that began in Q2 2021. Last year, a surfeit of venture capital reduced the use of these simple agreements for future equity (SAFEs) and convertible notes. But if the venture capital market continues to tighten, we may see renewed interest in unpriced rounds as early-stage founders seek cash.
The shift from convertible notes (which have fixed interest rates and maturity dates) toward SAFEs (which don’t) continued; SAFEs made up 69% of unpriced rounds. Whatever the market does, we expect that founders pursuing unpriced rounds will continue to choose SAFEs to quickly and flexibly access capital in 2022.
Late-stage valuations and raises
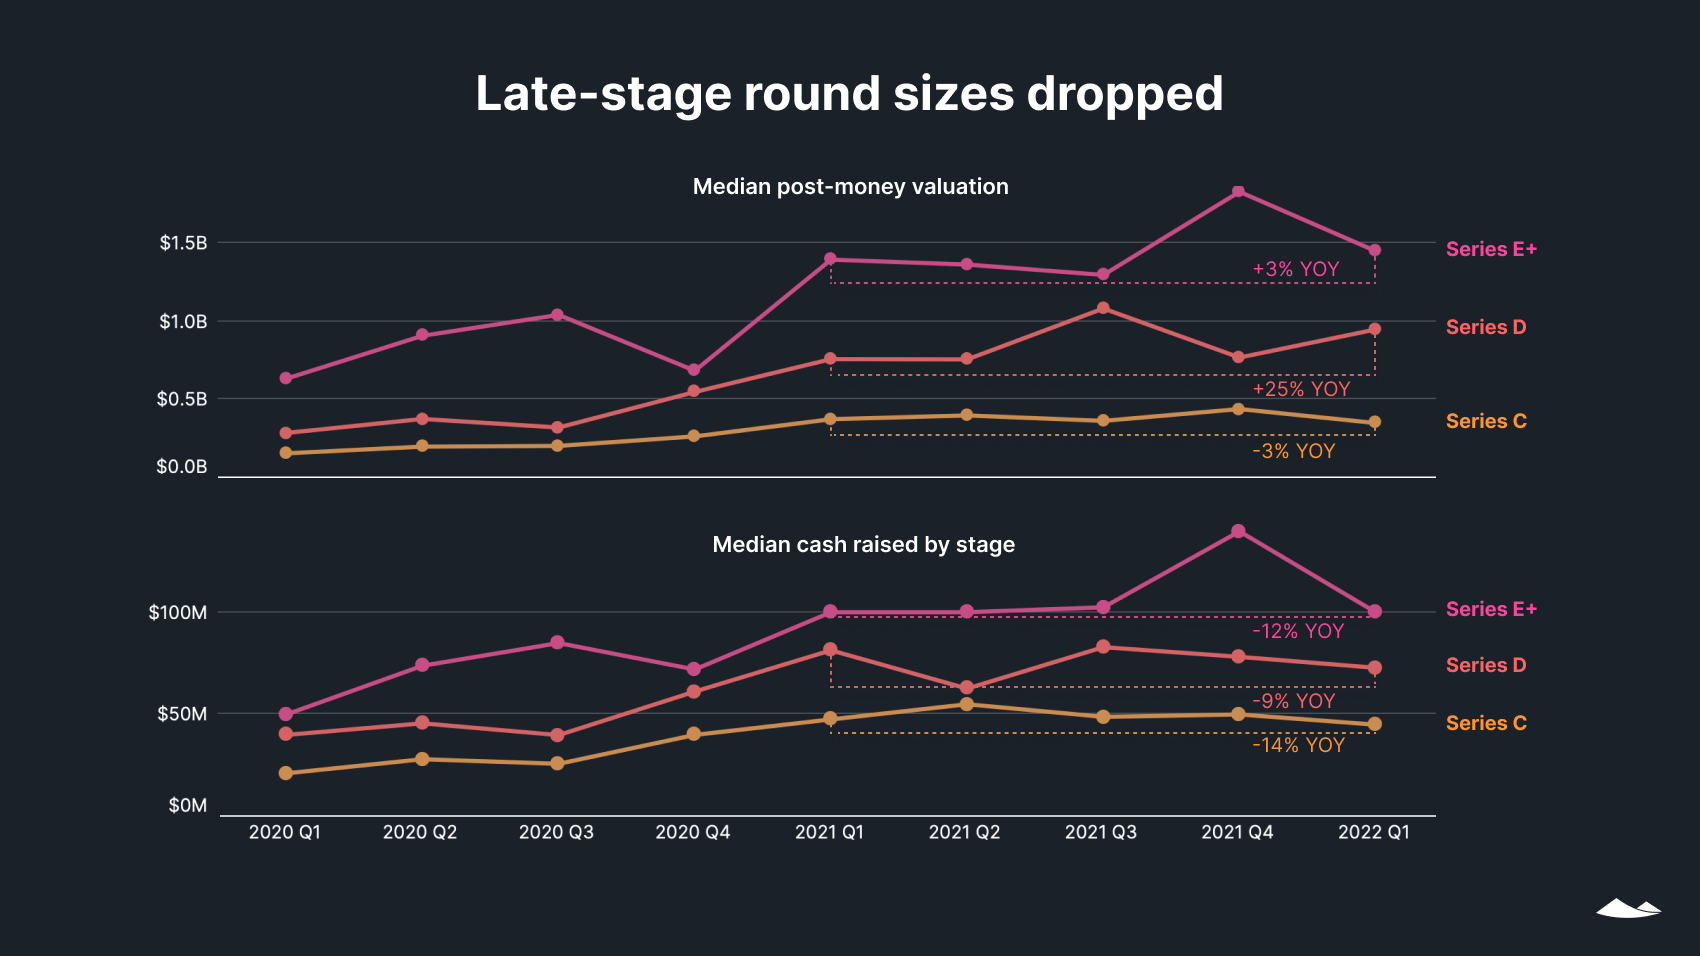
Post-money valuations of late-stage companies have fluctuated in recent quarters. Quarter over quarter, the median valuation for Series C companies was down by 18%, and the valuation for Series E and beyond was down 25%. For Series D, though, the median valuation was up 23%.
Median round sizes were down for all late stages, both on a year-over-year and quarter-over-quarter basis. The steepest quarterly decline was for Series E and beyond, which saw a 24% dip in median cash; Series C saw the largest annual drop (14%).
A plurality (33%) of Series C rounds were between $25M to $50M, while Series D and E and beyond each saw 45% of their deals in the $100M to $125M range.
Late-stage dilution
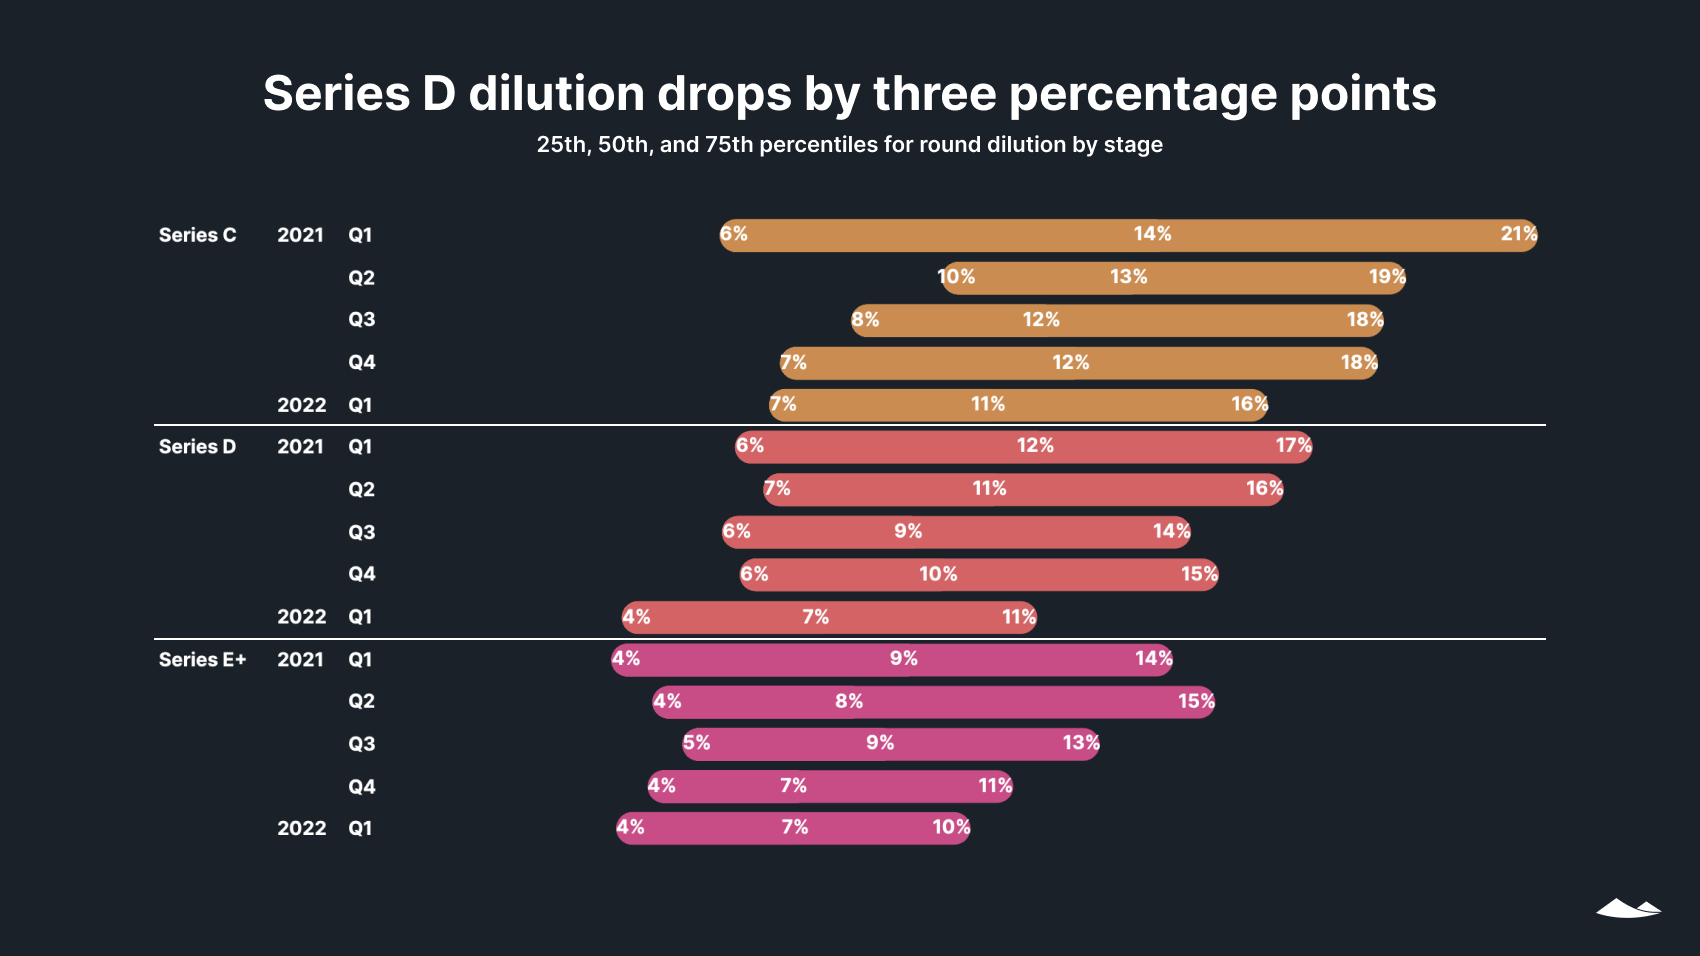
Late-stage dilution dropped in Q1 as median round sizes at all stages decreased on a quarterly basis.
Employees and liquidity
Start-up employee departures
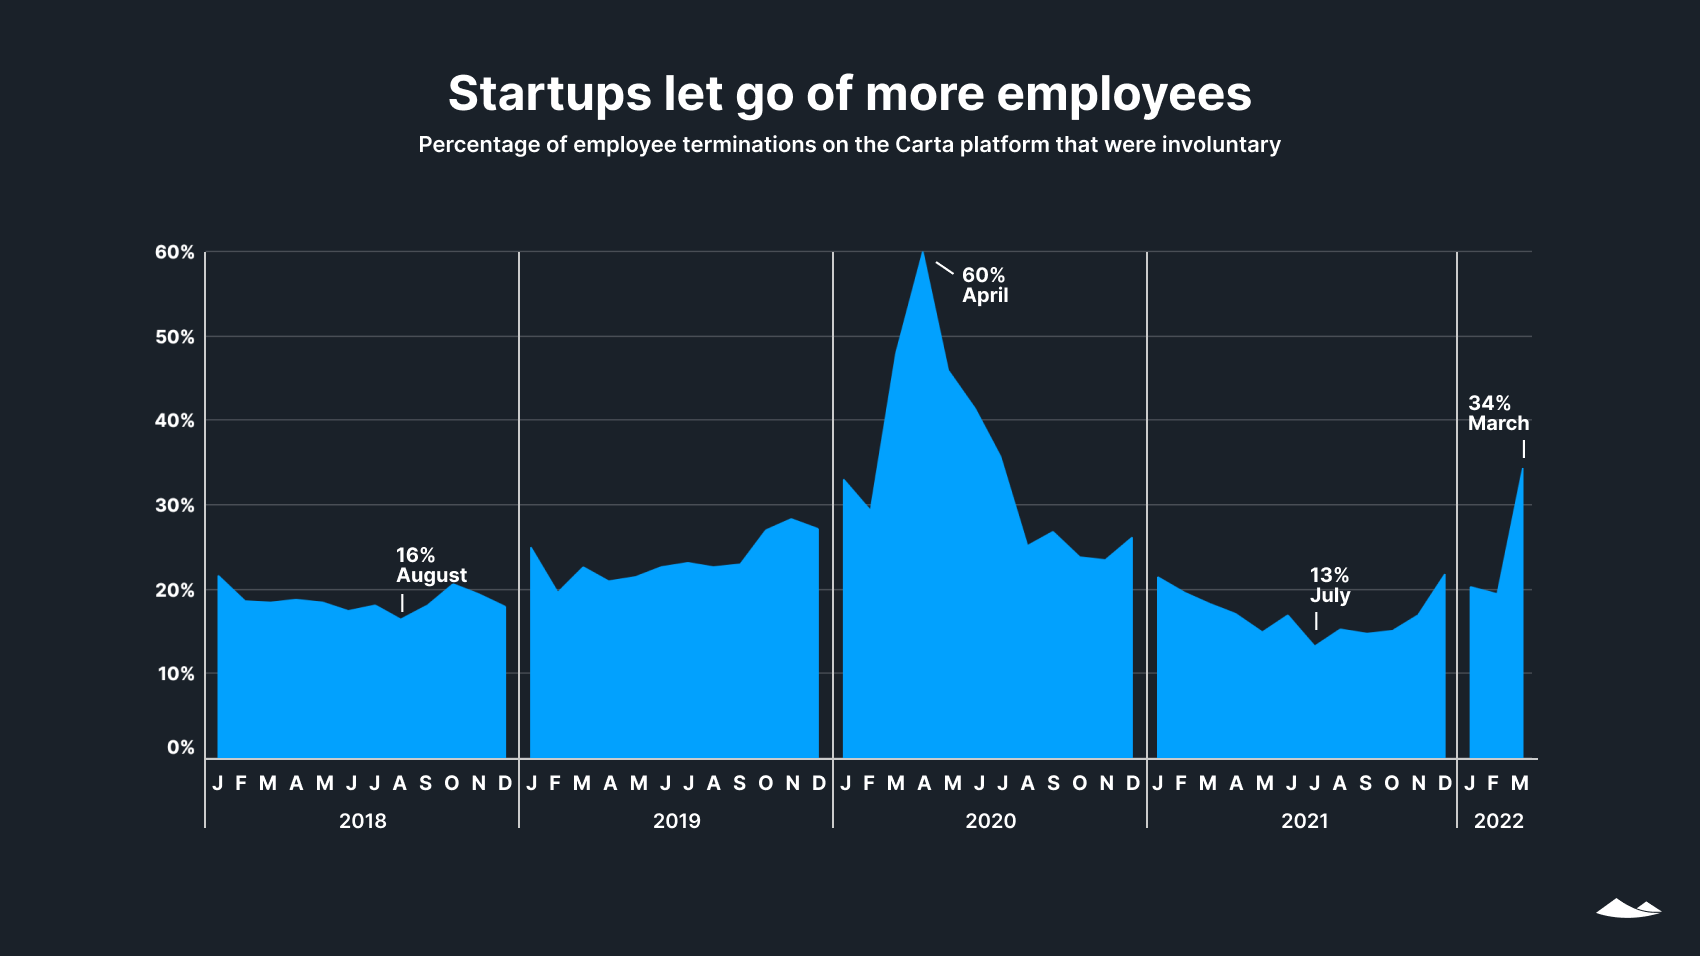
Q1 marked a significant shift in the startup labor market. In a single month, the percentage of departures that were involuntary rose sharply—to 34% in March, up from 20% in February. The number of employees on the Carta platform who lost their jobs in March was more than double that of February.
Employee options exercised
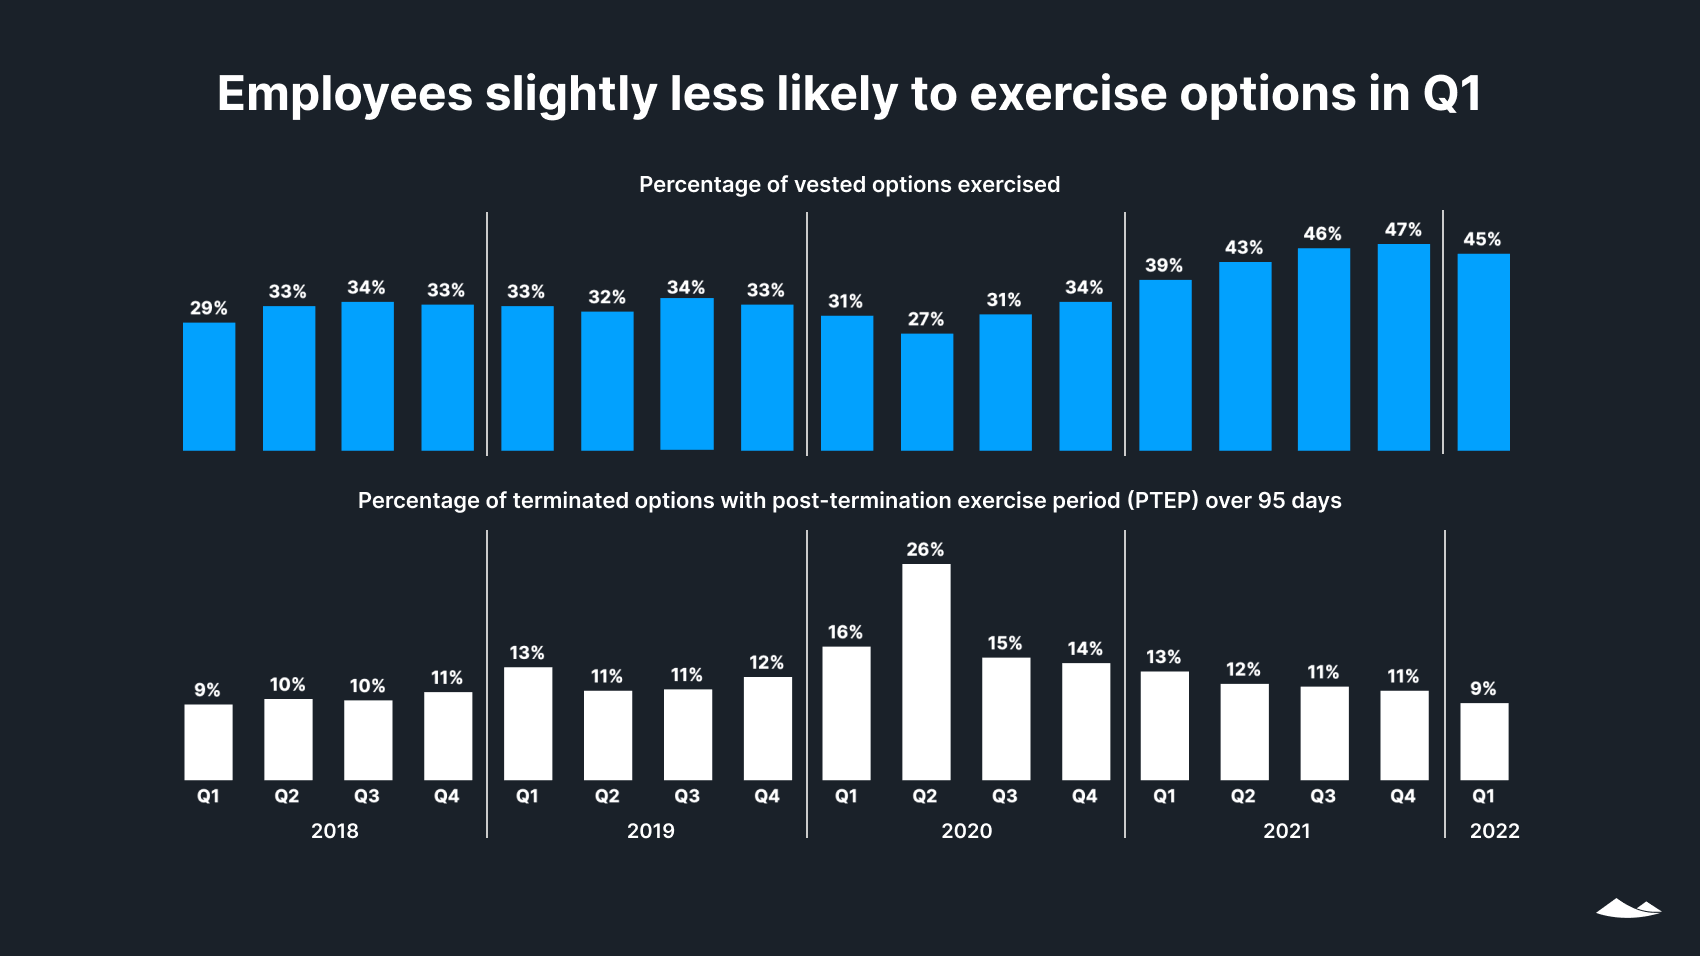
For the first time since Q2 2020, employees in Q1 were less likely to exercise vested options than in the quarter before. This could reflect a decrease in employees’ confidence in their companies’ prospects for growth or tightening household budgets due in part to inflation.
The percentage of terminated options with a post-termination exercise period longer than 95 days also dropped in Q1, reaching a low not seen since Q1 2018.
Tender offers
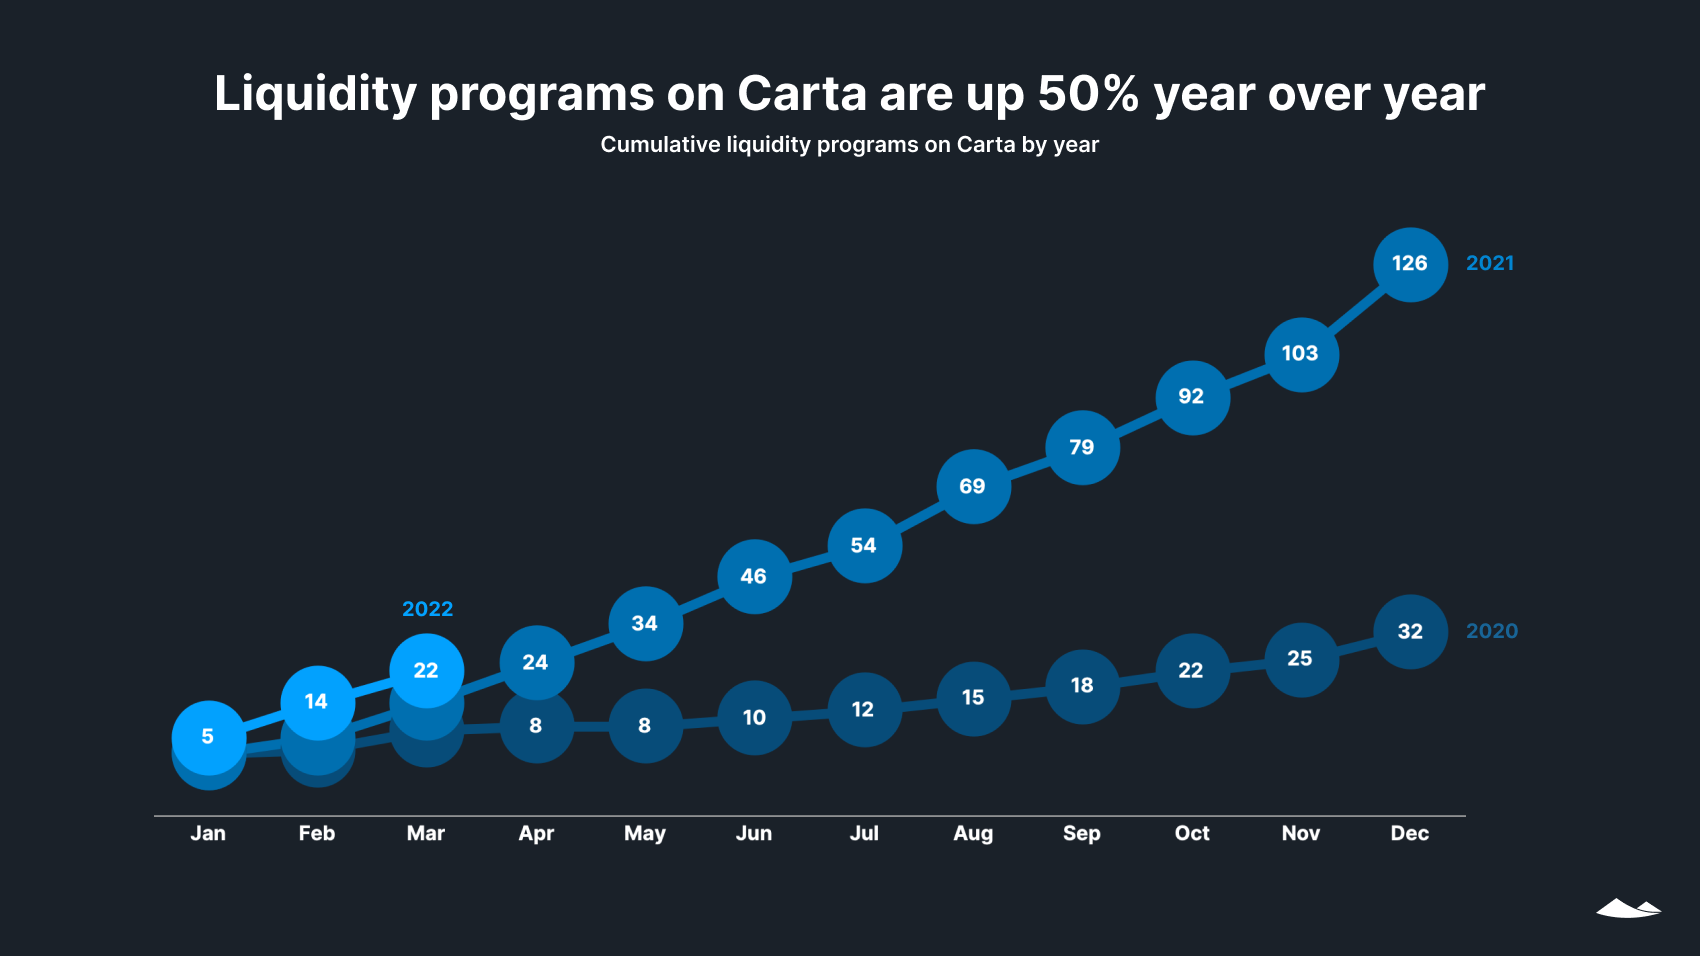
Demand for liquidity was strong, with a 50% increase in secondary transactions conducted on the Carta platform over Q1 of 2021, the majority of which were tender offers. While this past quarter saw lower deal and dollar volumes than the previous three quarters, secondary transactions are a seasonal market, with most historically occurring in the latter half of the year.
Overall, 47% of eligible sellers participated in their companies’ secondary transactions in Q1 2022, a rate in between the participation rates of 2020 (50%) and 2021 (43%).
Mergers and acquisitions
Download a PDF of this State of Private Markets: Q1 2022 report.
Methodology
Carta’s State of Private Markets report examines trends across venture-backed companies and security holders in private companies to promote transparency between employers and employees, prompting fair equity management across private markets. Carta uses its quarterly data, including the aggregated and anonymized data of more than 28,000 companies, which represents over $2.5 trillion in post-money valuation.
Overview
Carta helps more than 28,000 primarily venture-backed companies and 1,800,000 security holders manage equity. This study uses an aggregated and anonymized sample of Carta’s data. Companies that have contractually requested that we not use their data in anonymized and aggregated studies are not included in this analysis.
The data presented in this private markets report represents a snapshot as of April 28, 2022. Historical data may change in future studies because there is typically an administrative lag between the time a transaction took place and when it is recorded in Carta. In addition, new companies signing up for Carta’s services will increase historical data available for the report.
Financings
Financings include equity deals raised in USD. The financing “series” (e.g. Series A) is taken from the legal share class name. Financing rounds that don’t follow this standard are not included in any data shown by series but are included in data not shown by series. Primary rounds are defined as the first equity round within a series. Bridge rounds are defined as any round raised after the first round in a given series. If there is no indication that a round is a Primary or Bridge round, both are included.
In some cases, convertible notes are raised and converted into multiple share classes within a series at various discounted prices (e.g. Series A-1, Series A-2, Series A-3). In these cases, converted securities are not included in cash raised, and only the post-money valuation of the new money is included.
Industry groupings
We grouped industries as follows: “SaaS” includes CRM software, edtech, and HR software in addition to other software as a service companies; “health + biotech” also includes healthcare devices and healthcare tech; “consumer” includes consumer products and services, such as food, cannabis, and video games; “hardware + logistics” also includes renewable energy, semiconductors, telecom, and transportation; “fintech” includes financial exchanges; “data + security” includes cloud distribution, analytics, and cybersecurity; and “adtech + marketplace” also includes ecommerce and social media.
Terminations
Terminations entered into Carta must include a reason. Involuntary terminations include both terminations for performance and company layoffs. Voluntary terminations are employees who decided to leave of their own accord. Other termination reasons, including for cause, death, disability, and retirement were not included in the data and make up less than 1% of all terminations combined.
¹The number of deals reported will continue to increase as companies document deals and, to a lesser extent, as Carta’s historical dataset grows. Whereas current uncorrected data shows the number of venture investments going down by 38% and total cash raised down 46% in Q1 2022 as compared with Q4 2021, by next quarter we might expect to see those values finalize closer to a 25-30% drop in deals and 35-40% drop in cash.
²This is based on current and unadjusted data. As more deals continue to be reported on the Carta platform, the amount of cash per stage will increase.

DISCLOSURE: This communication is on behalf of eShares Inc., d/b/a Carta Inc. (“Carta”). This communication is for informational purposes only, and contains general information only. Carta is not, by means of this communication, rendering accounting, business, financial, investment, legal, tax, or other professional advice or services. This publication is not a substitute for such professional advice or services nor should it be used as a basis for any decision or action that may affect your business or interests. Before making any decision or taking any action that may affect your business or interests, you should consult a qualified professional advisor. This communication is not intended as a recommendation, offer or solicitation for the purchase or sale of any security. Carta does not assume any liability for reliance on the information provided herein. ©2022 eShares Inc., d/b/a Carta Inc. (“Carta”). All rights reserved. Reproduction prohibited.