Over the past three years, many venture-backed startups have transitioned away from a strategy of growth at all costs. Today, many young companies are more focused than ever on things like efficiency, profitability, and making the most of available resources.
These new priorities have impacted just about every aspect of startup life. Hiring is no exception.
Between January 2022 and January 2024, the number of new monthly hires made by companies on Carta declined by more than 50%. Over the full course of 2022, companies made 1.75 new hires for every one worker who departed their role; by 2024, that ratio fell to 1.06 hires for every departure.
The employment market of 2024 was leaner. It shifted in other ways, too. The number of new hires may have dwindled, but average salaries ticked up in 2024 across most industries and job functions. Fewer layoffs are taking place. Fewer employees are choosing to leave jobs on their own, too. And the compensation equation has settled into a new normal: Compared to three years ago, equity is now a much smaller component of the typical startup compensation package.
The data in this report comes from thousands of CTC customers and over 800,000 current salary and equity data points used by Carta Total Compensation. Other metrics derive from the aggregate pool of more than 1.3 million employees who currently work for the 53,000 startups that use Carta to manage their cap table.
H2 2024 key takeaways
Hiring is accelerating in sales: In 2024, employees in sales accounted for 19.9% of all new hires, up from 14.8% in 2020. Sales is the second most common job function for startup hiring, behind engineering.
Employees still aren’t exercising vested options: Employees exercised just 32.2% of vested, in-the-money stock options during Q4, compared to 54.2% three years ago. Employee exercise rates remain near recent lows.
The rate of in-state hires is on the rise: Until recently, in-state hiring was growing less and less common every year. In 2023 and 2024, however, in-state hiring is ticking back up: For startups valued between $25 million and $50 million, the rate of in-state hires has risen from 37% in 2022 to 49% in 2024.
Hiring & headcount
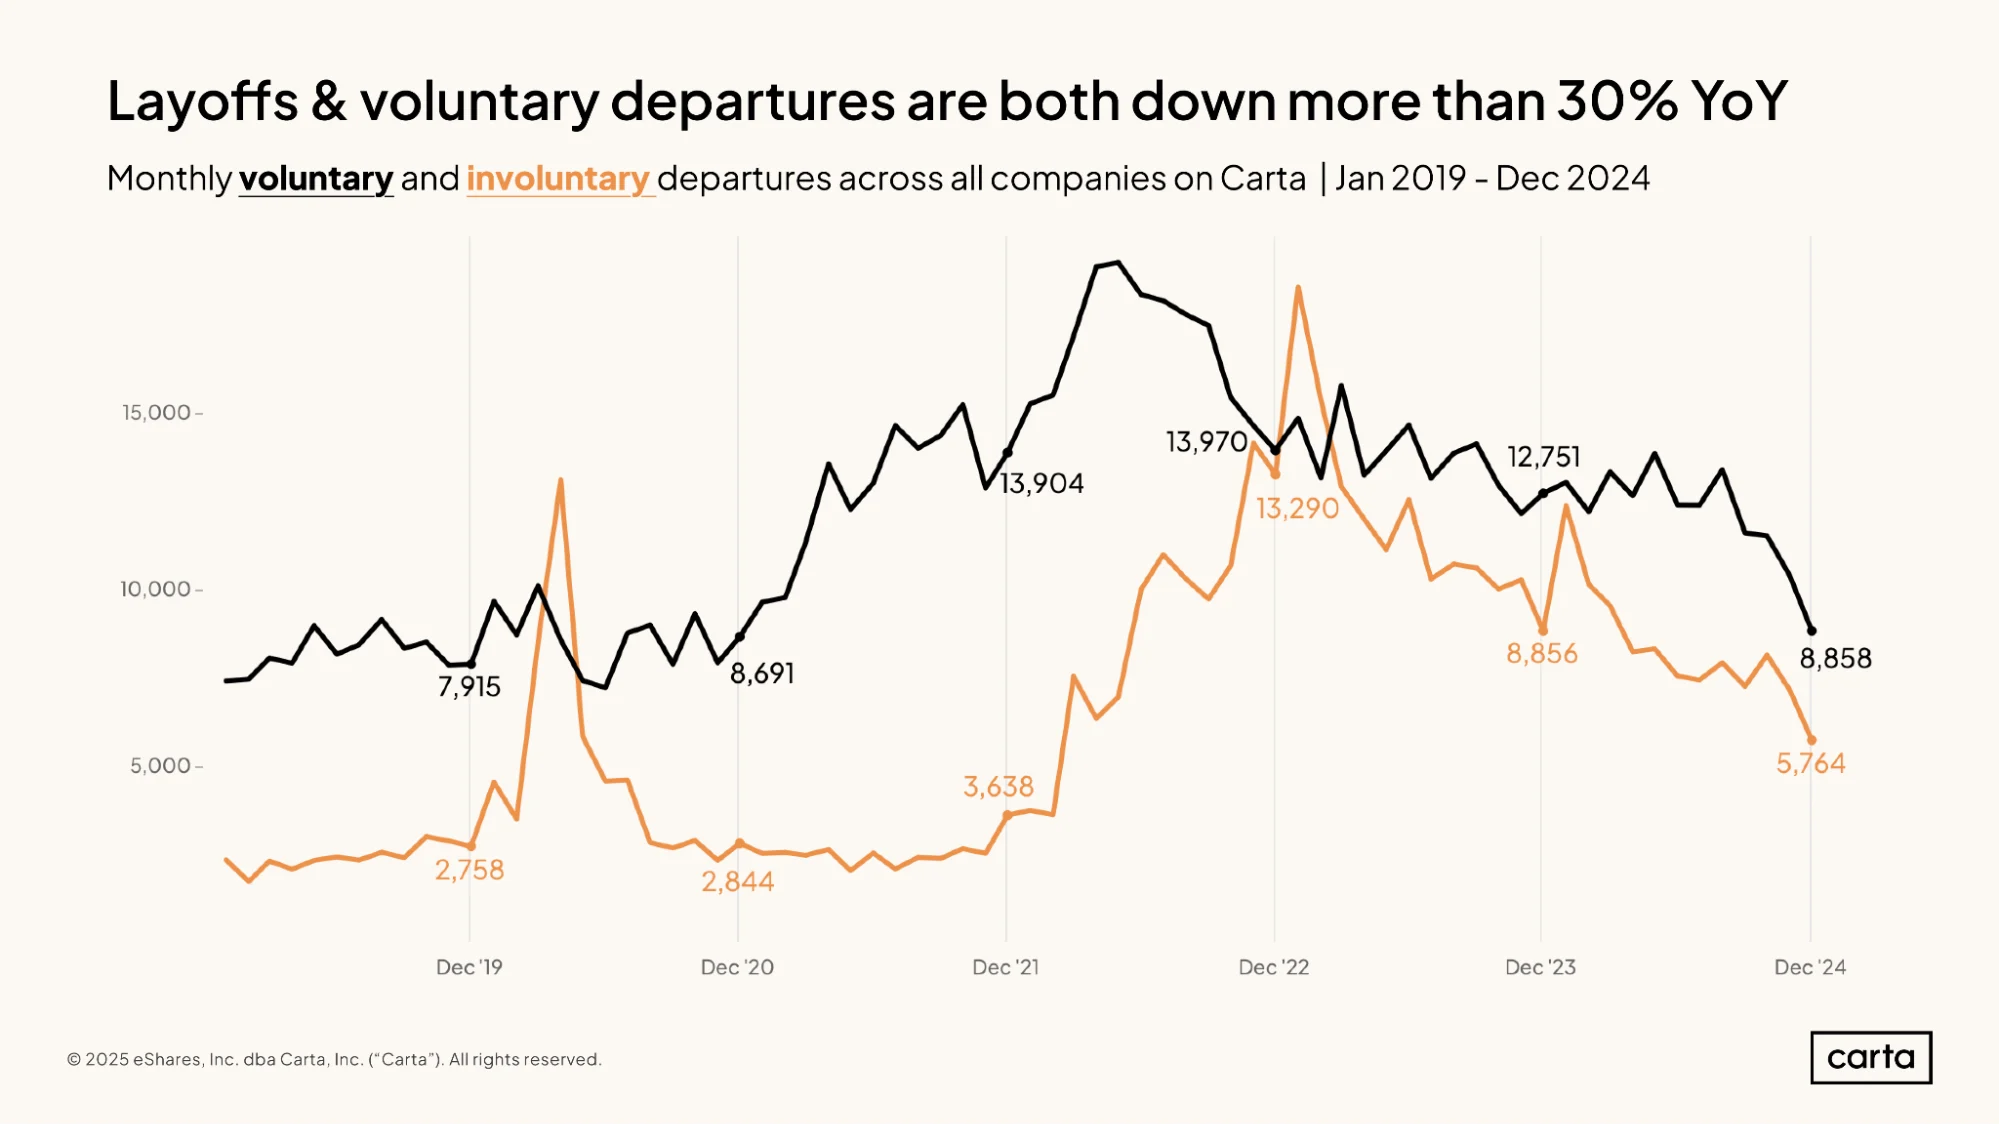
A frenzy of job movement that began amid the pandemic bull market of 2021 is gradually petering out. There were 8,858 voluntary job departures on Carta in December, a 31% decline compared to the same period a year prior. And there were 5,764 involuntary departures, down 35% year over year.
This means that fewer employees are choosing to leave their current companies to take new jobs. It also means fewer employees are being subjected to layoffs. Employee turnover of all kinds became less common over the course of 2024, with combined job departures in December falling to the lowest level since May 2021.
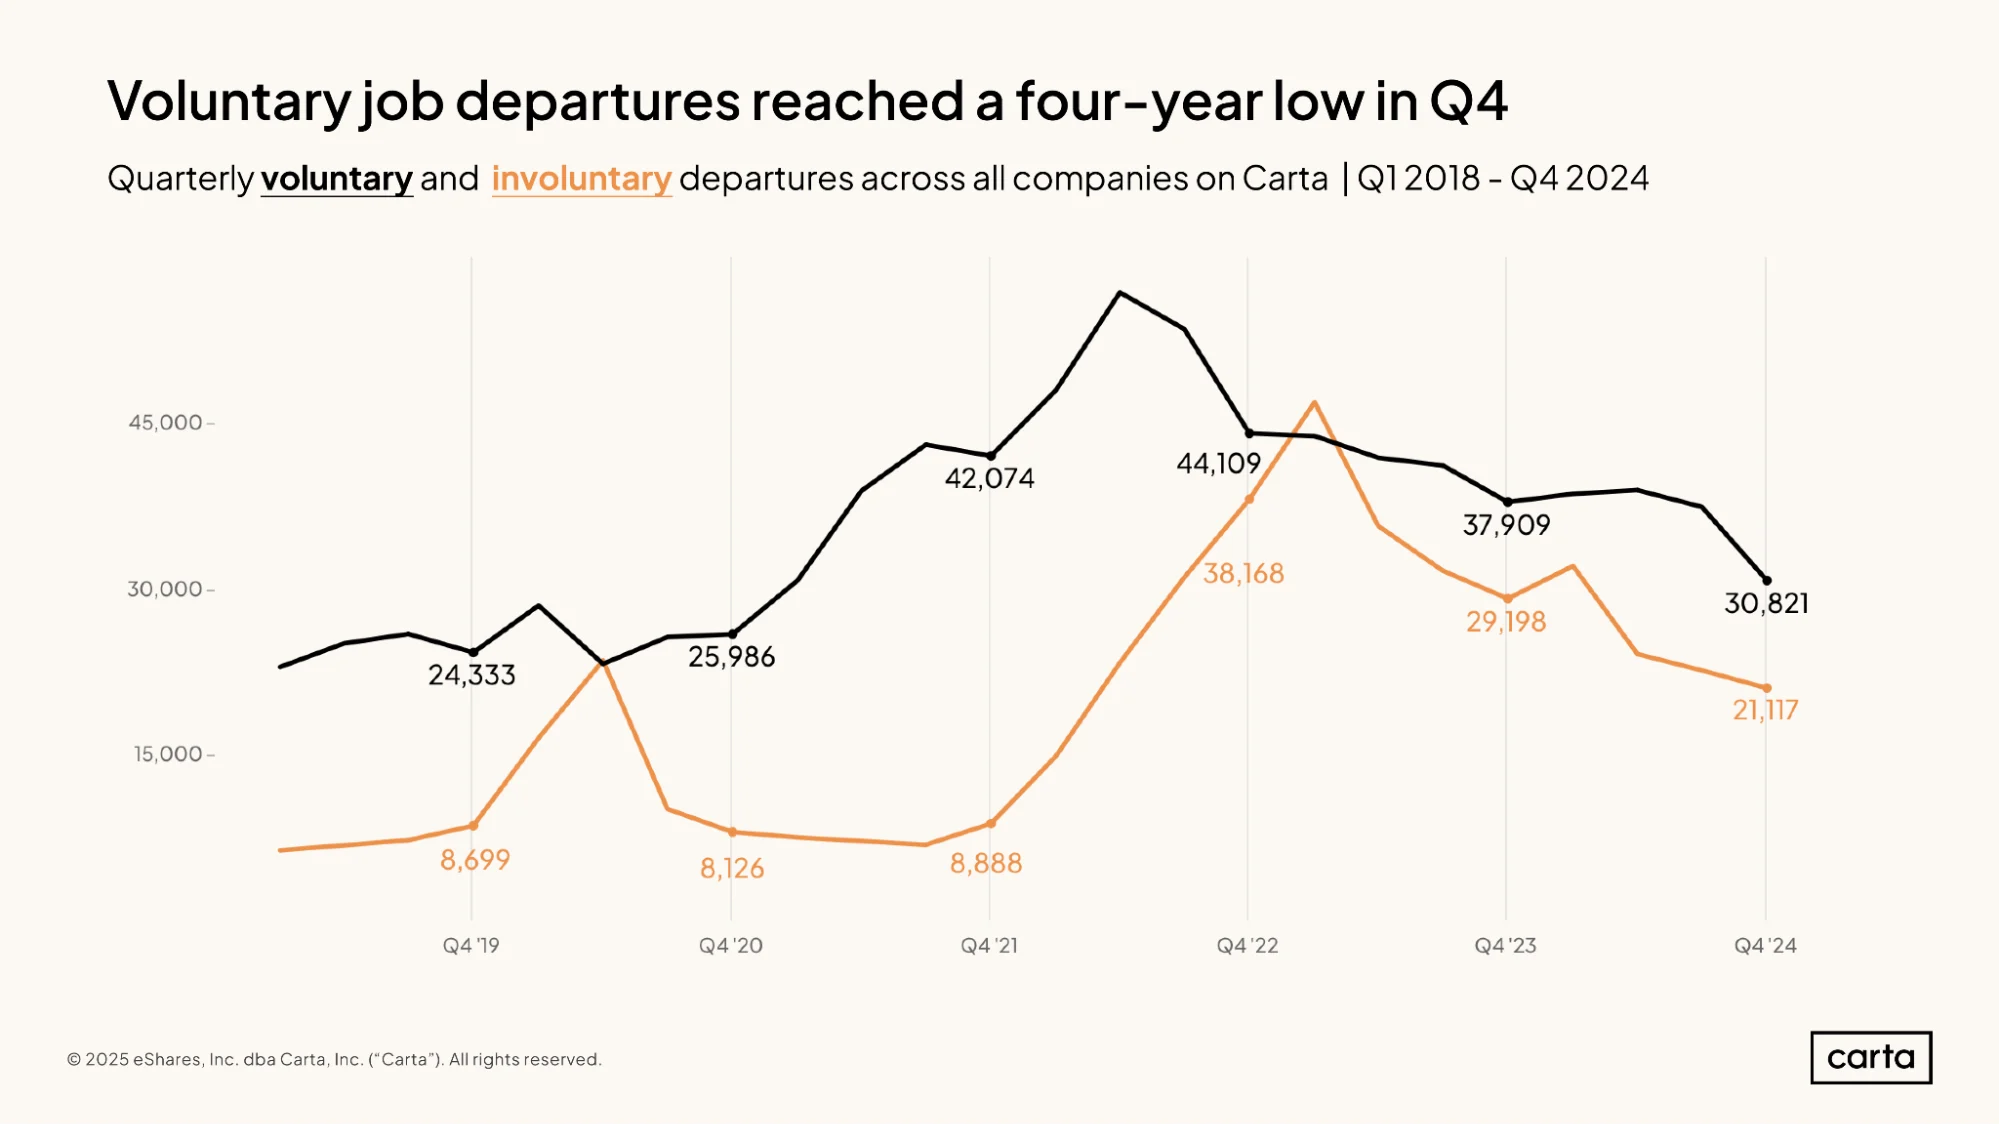
On a quarterly basis, there were 30,821 voluntary job departures during the final three months of 2024, the lowest total since Q4 2020. Involuntary departures, meanwhile, sunk to their lowest point since Q1 2022.
In both cases, however, these figures remain stubbornly high compared to where they were prior to 2020—particularly the number of involuntary departures. The Q4 count of involuntary departures is more than twice as high as it was in the respective Q4s of 2019, 2020, and 2021. Layoffs have been a persistent feature of the startup landscape over the past few years, and that remains true in the early weeks of 2025.
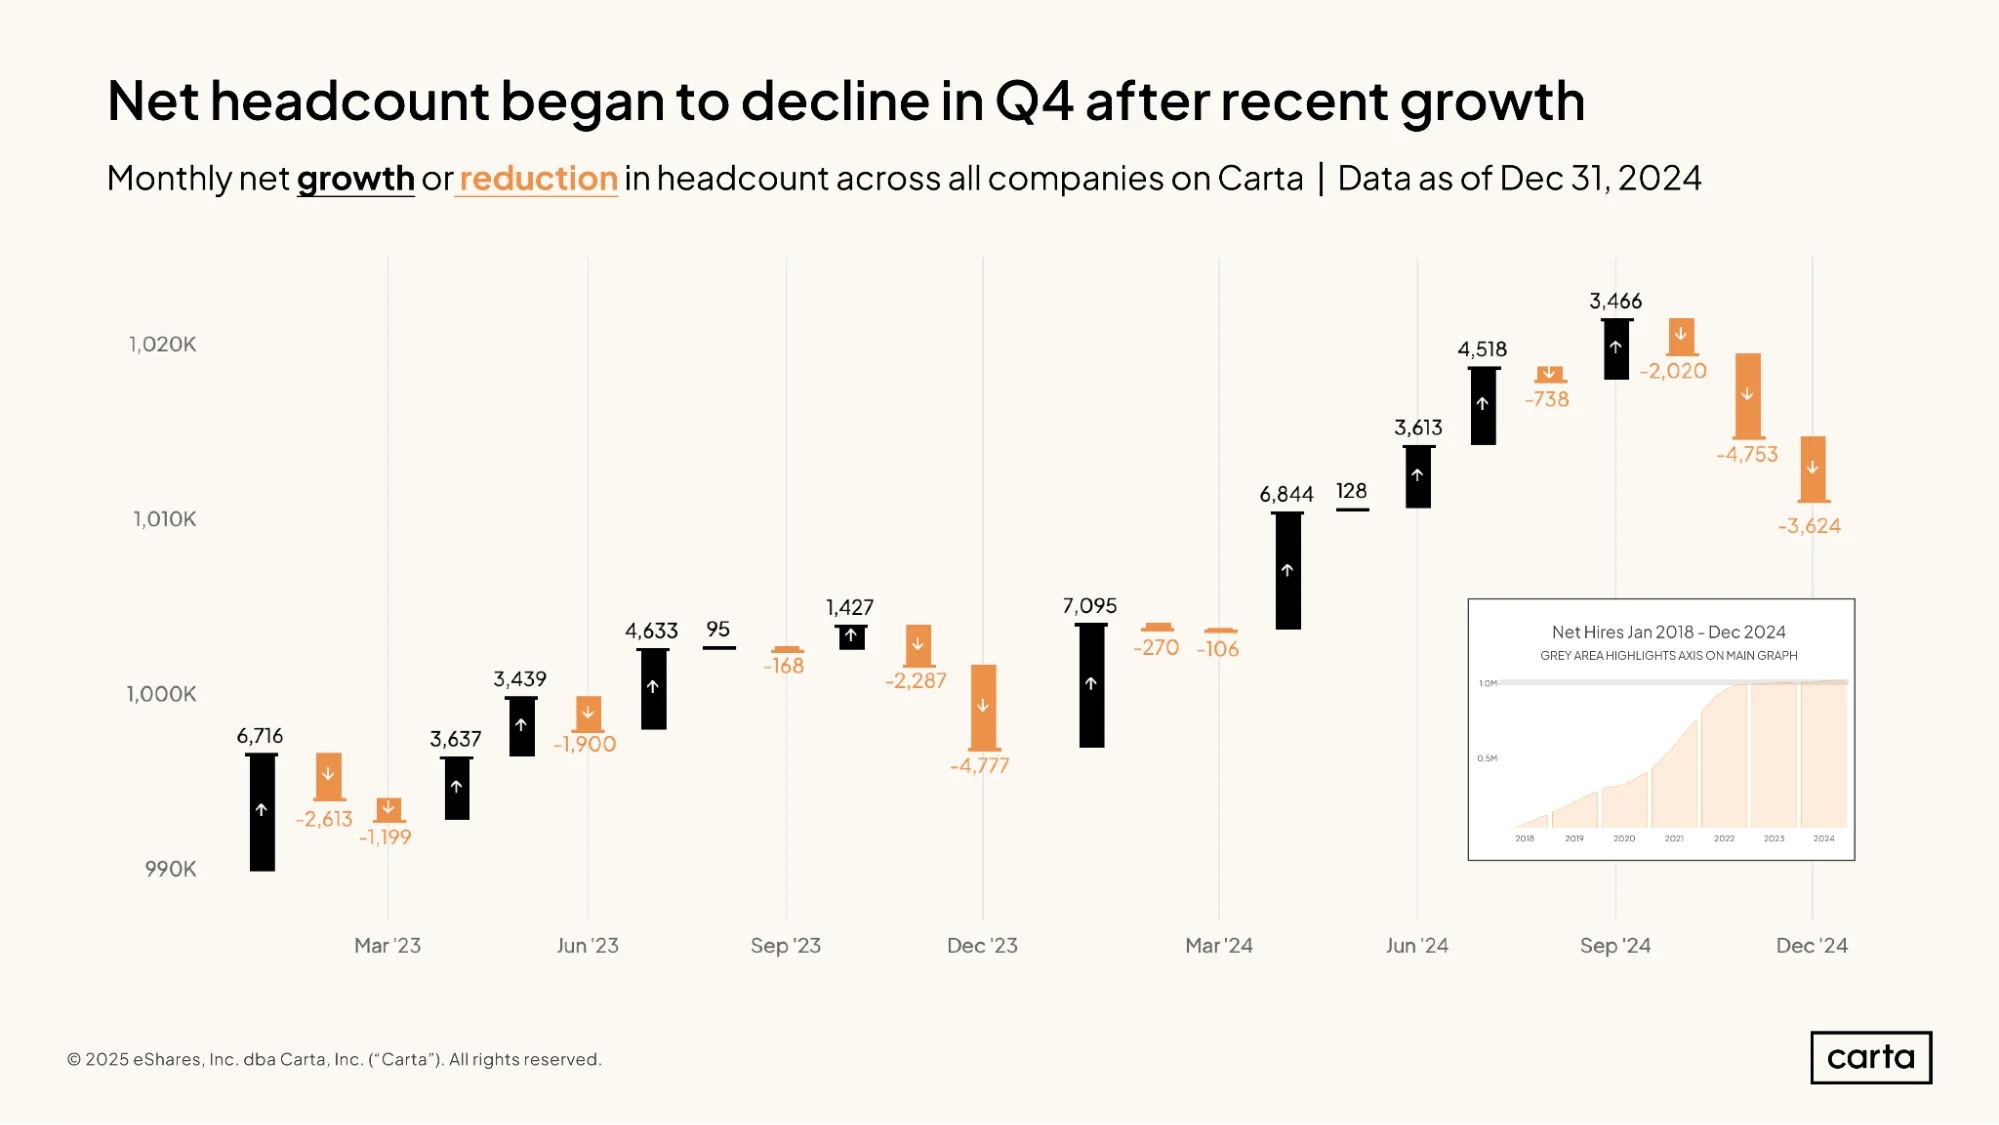
Net headcount across all companies on Carta increased by 24,450 people during the first nine months of 2024. That equates to a roughly 2% increase in total employee count across the startup landscape. During the final three months of the year, this trend reversed course, and net headcount dropped by 10,397 individuals. By the end of 2024 total headcount had returned to the same level as May 2024.
Overall, it was a year of positive headcount growth for startups. But some of the year’s gains were clawed back in Q4.
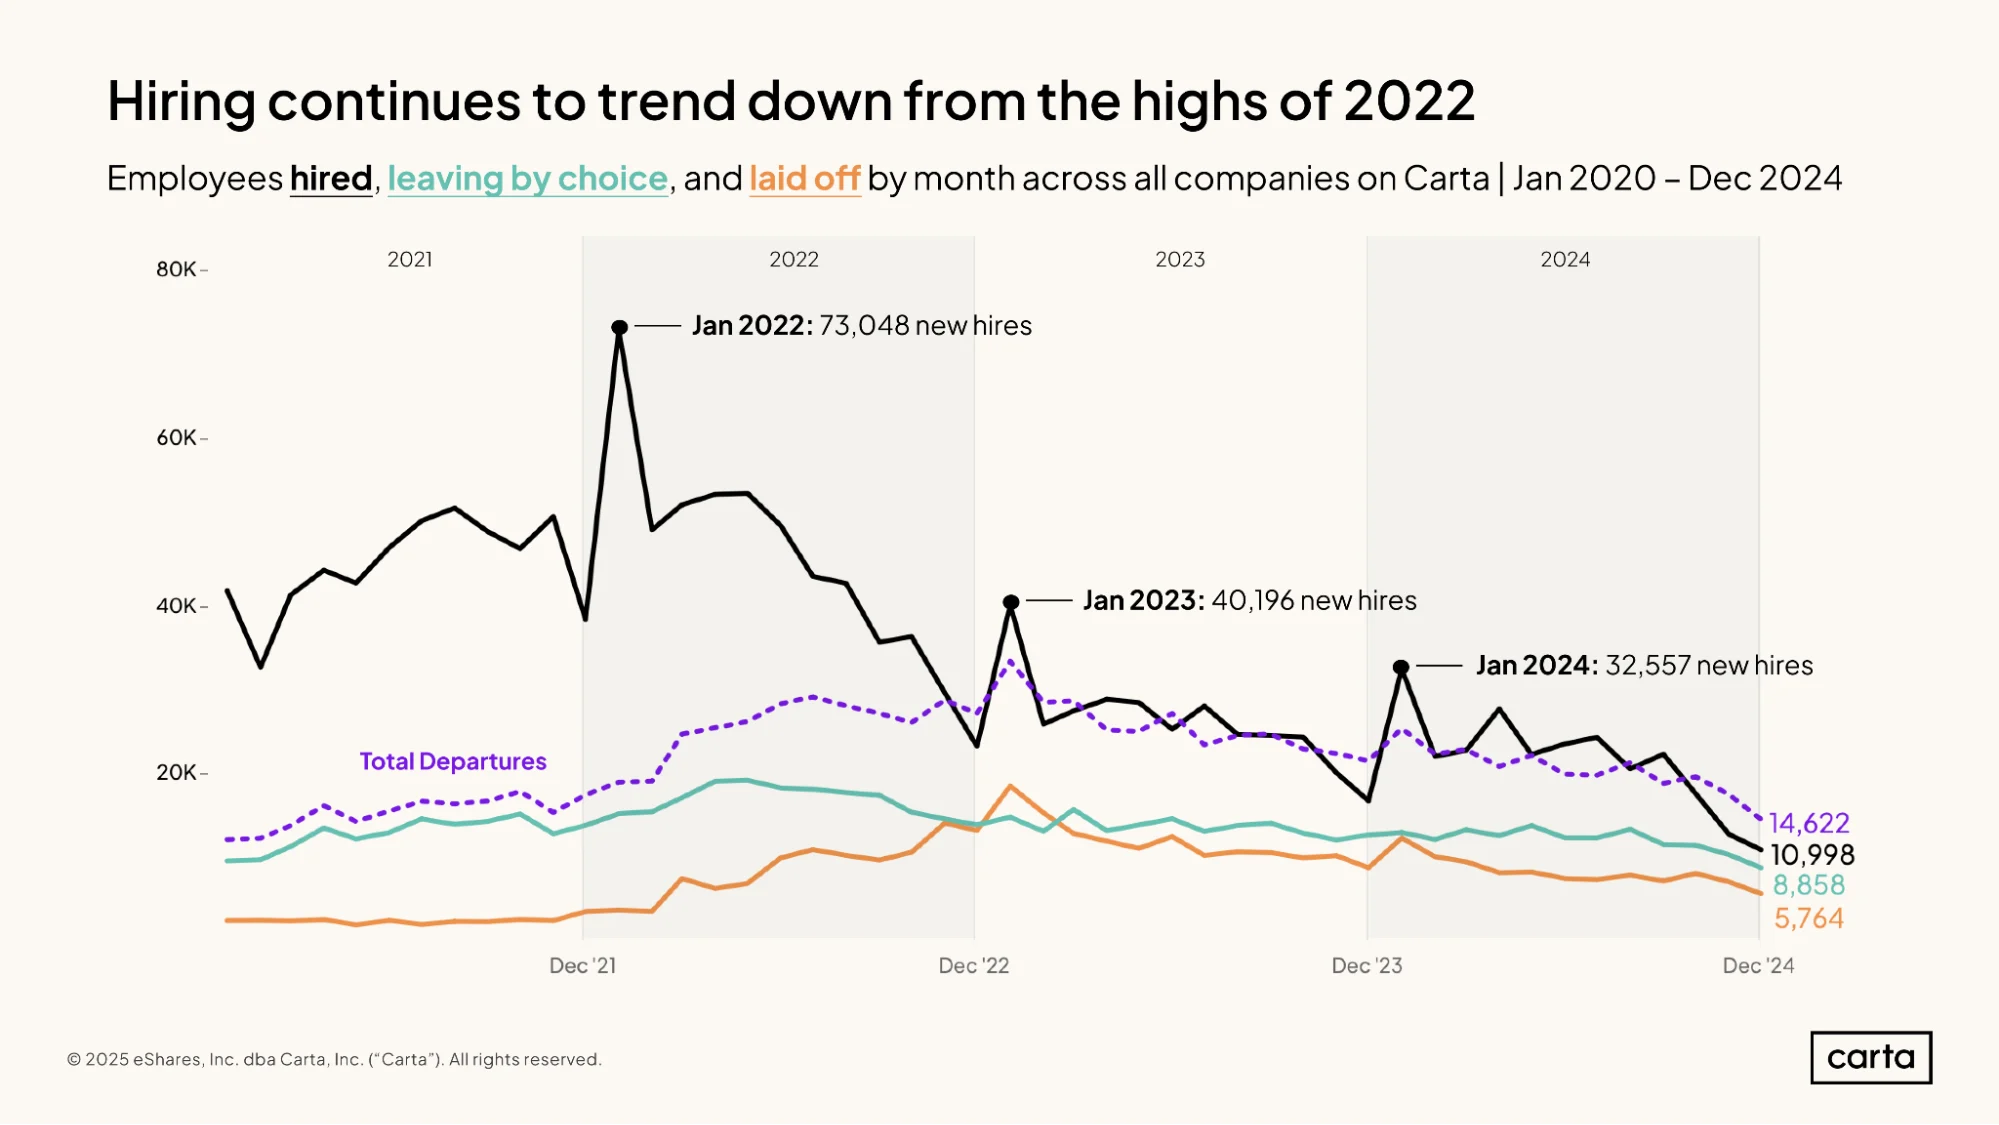
The number of monthly new hires on Carta soared to a recent high in January 2022, with a total of 73,048 new employees added to company cap tables. Since then, hiring activity has been tailing off for the most of the past three years.
These numbers will continue to rise in the coming weeks, as companies continue to log new hires on Carta from late in the year. At current count, though, monthly hiring in December 2024 was down 53% year over year and down 85% from that January 2022 peak.
Beyond the borders of VC, the U.S. job market ended the year on something of a high note. Across the full economy, companies added 256,000 new jobs in the U.S. in December 2024, the most since March 2024, while the unemployment rate declined from 4.2% to 4.1%.
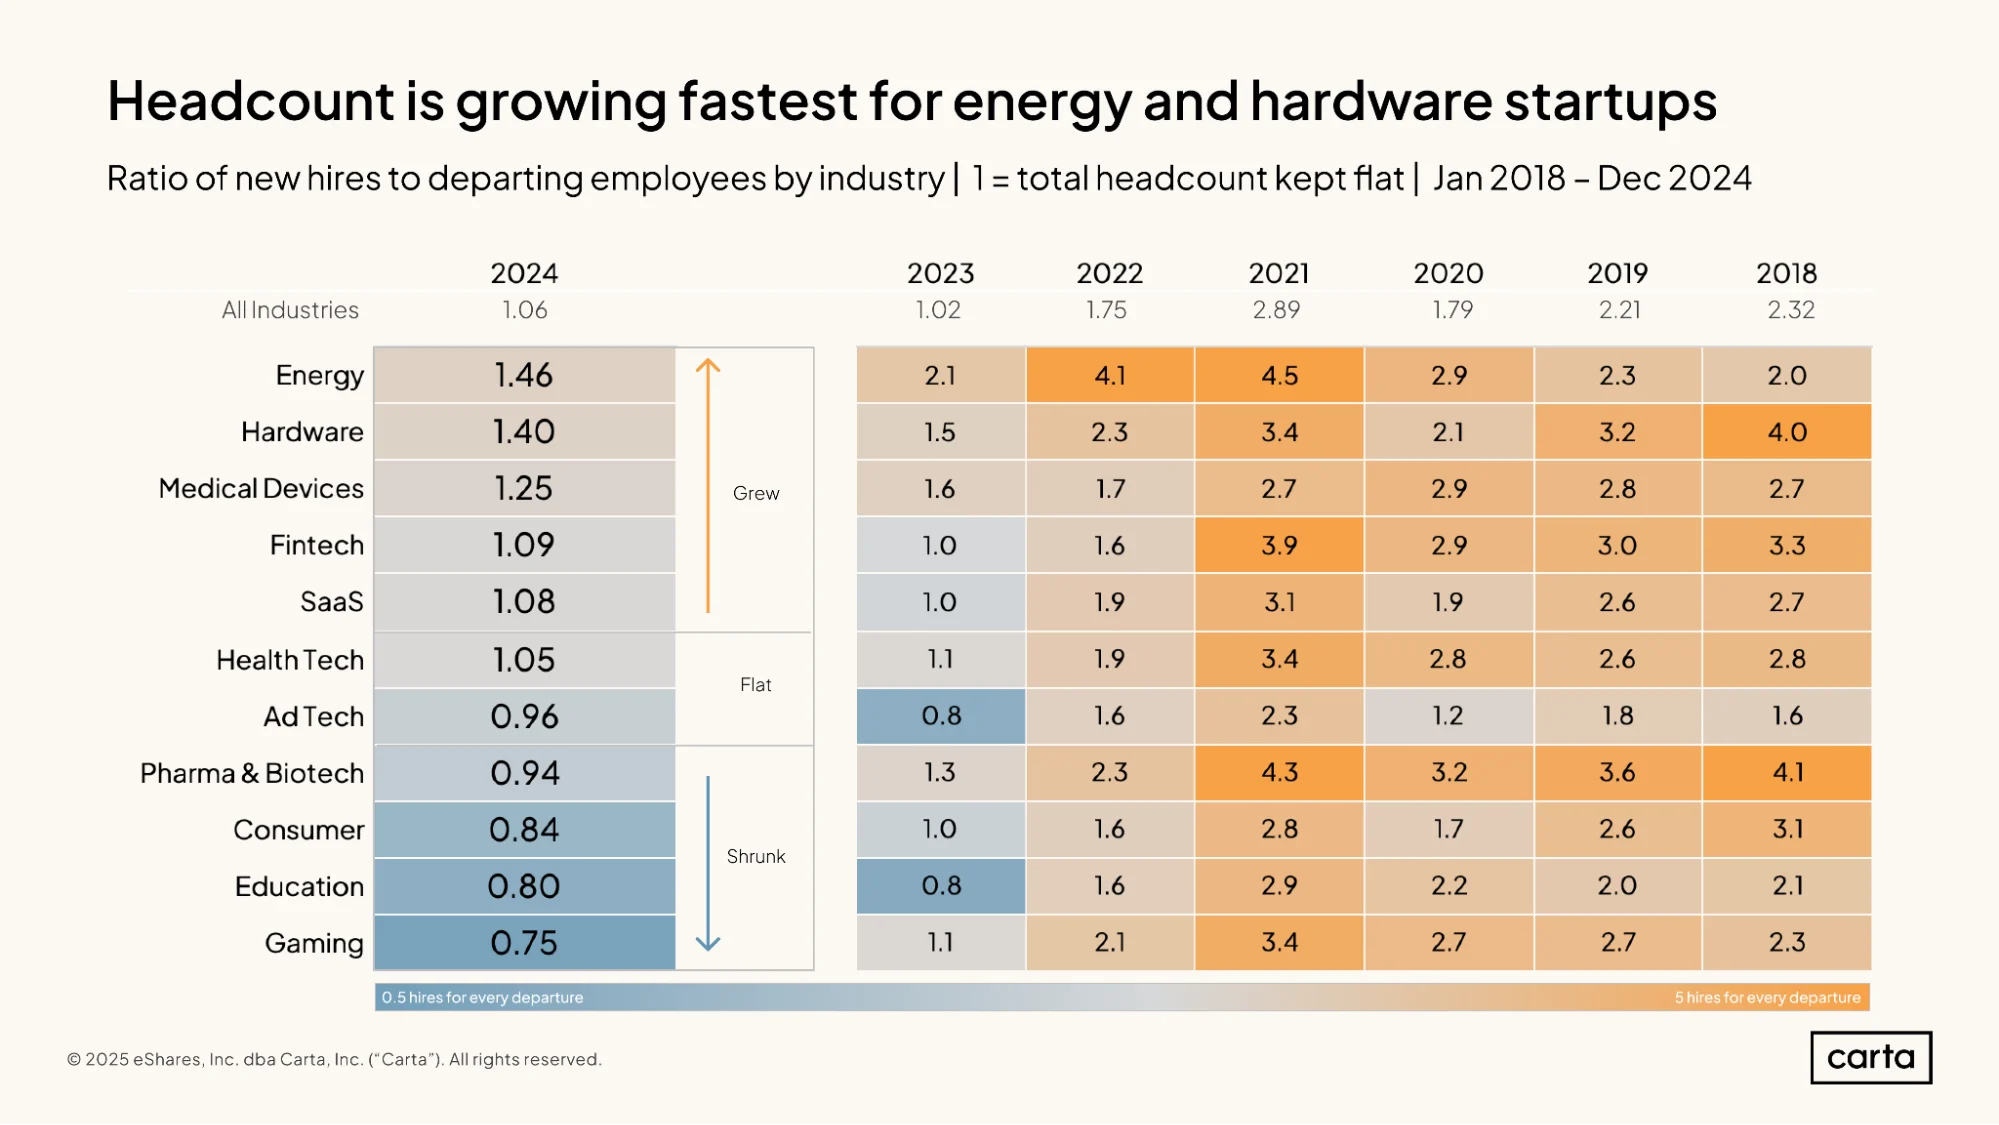
Across all industries, the ratio of new hires to job departures in 2024 was 1.06. In other words, for every 100 job departures, there were 106 new hires. This is a touch higher than a 1.02 hire-to-departure ratio from 2023, but well below the ratios from the five years before that.
It’s clear the startup job market has cooled over the past two years.
This ratio tilted higher in physical industries that are more reliant on research and manufacturing, such as energy, hardware, and medical devices. It dipped below 1.0 in several digital industries that are more reliant on software, including consumer, education, and gaming.
The rise of AI may be one factor contributing to this divide: For now, at least, algorithms and LLMs are more likely to be deployed as labor-saving tools at software-focused companies than at companies producing tangible objects in the physical world.
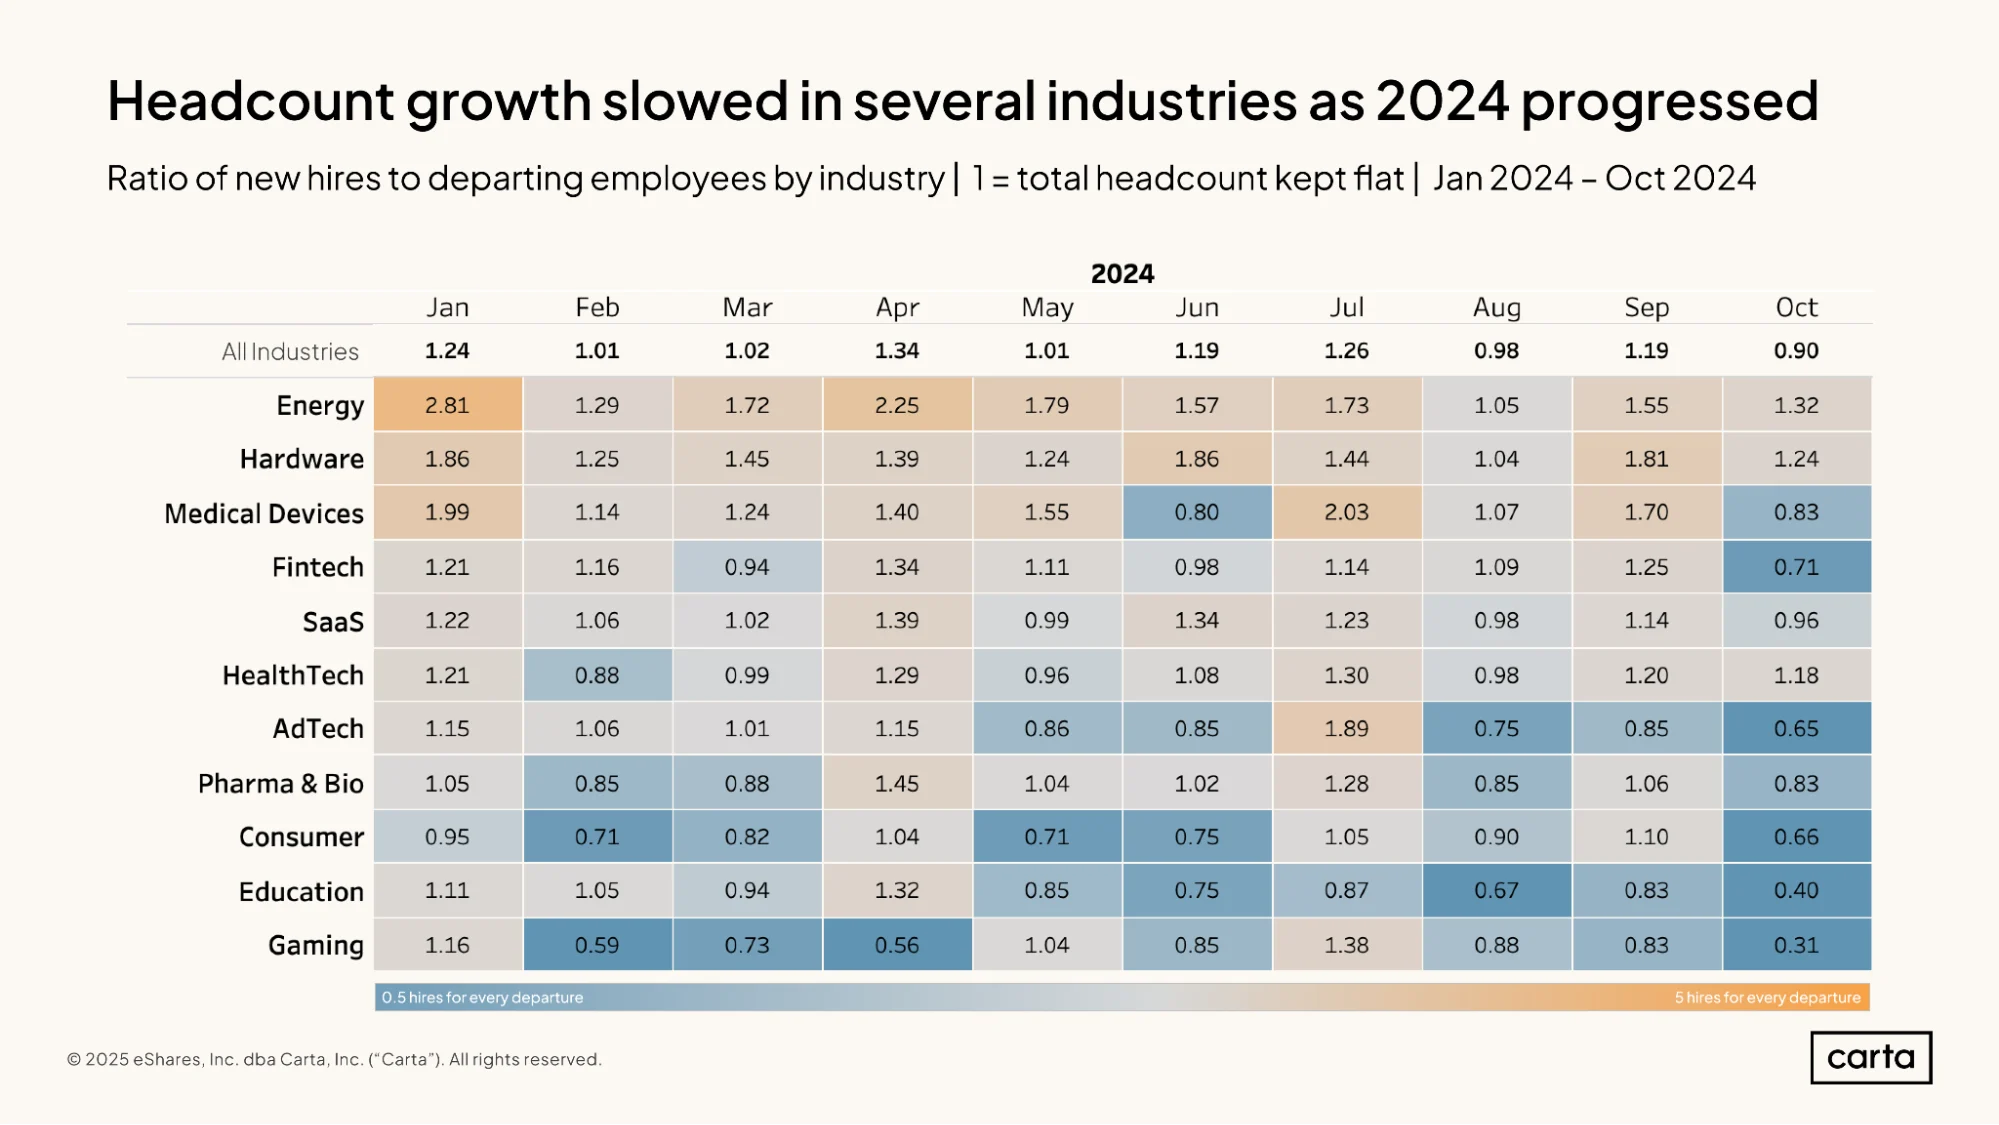
The three months that saw the most headcount growth in 2024 were January, April, and July—the first months of Q1, Q2, and Q3, respectively. But this trend came to an end with October and the start of Q4, when headcount growth dipped to its lowest point of the year to date.
Headcount numbers for October may still increase slightly as companies continue to report new hires from the final quarter of the year. Barring a significant shift, though, it seems clear that the shrinking of headcounts accelerated during the back half of last year in at least a handful of sectors, including advertising tech and education.
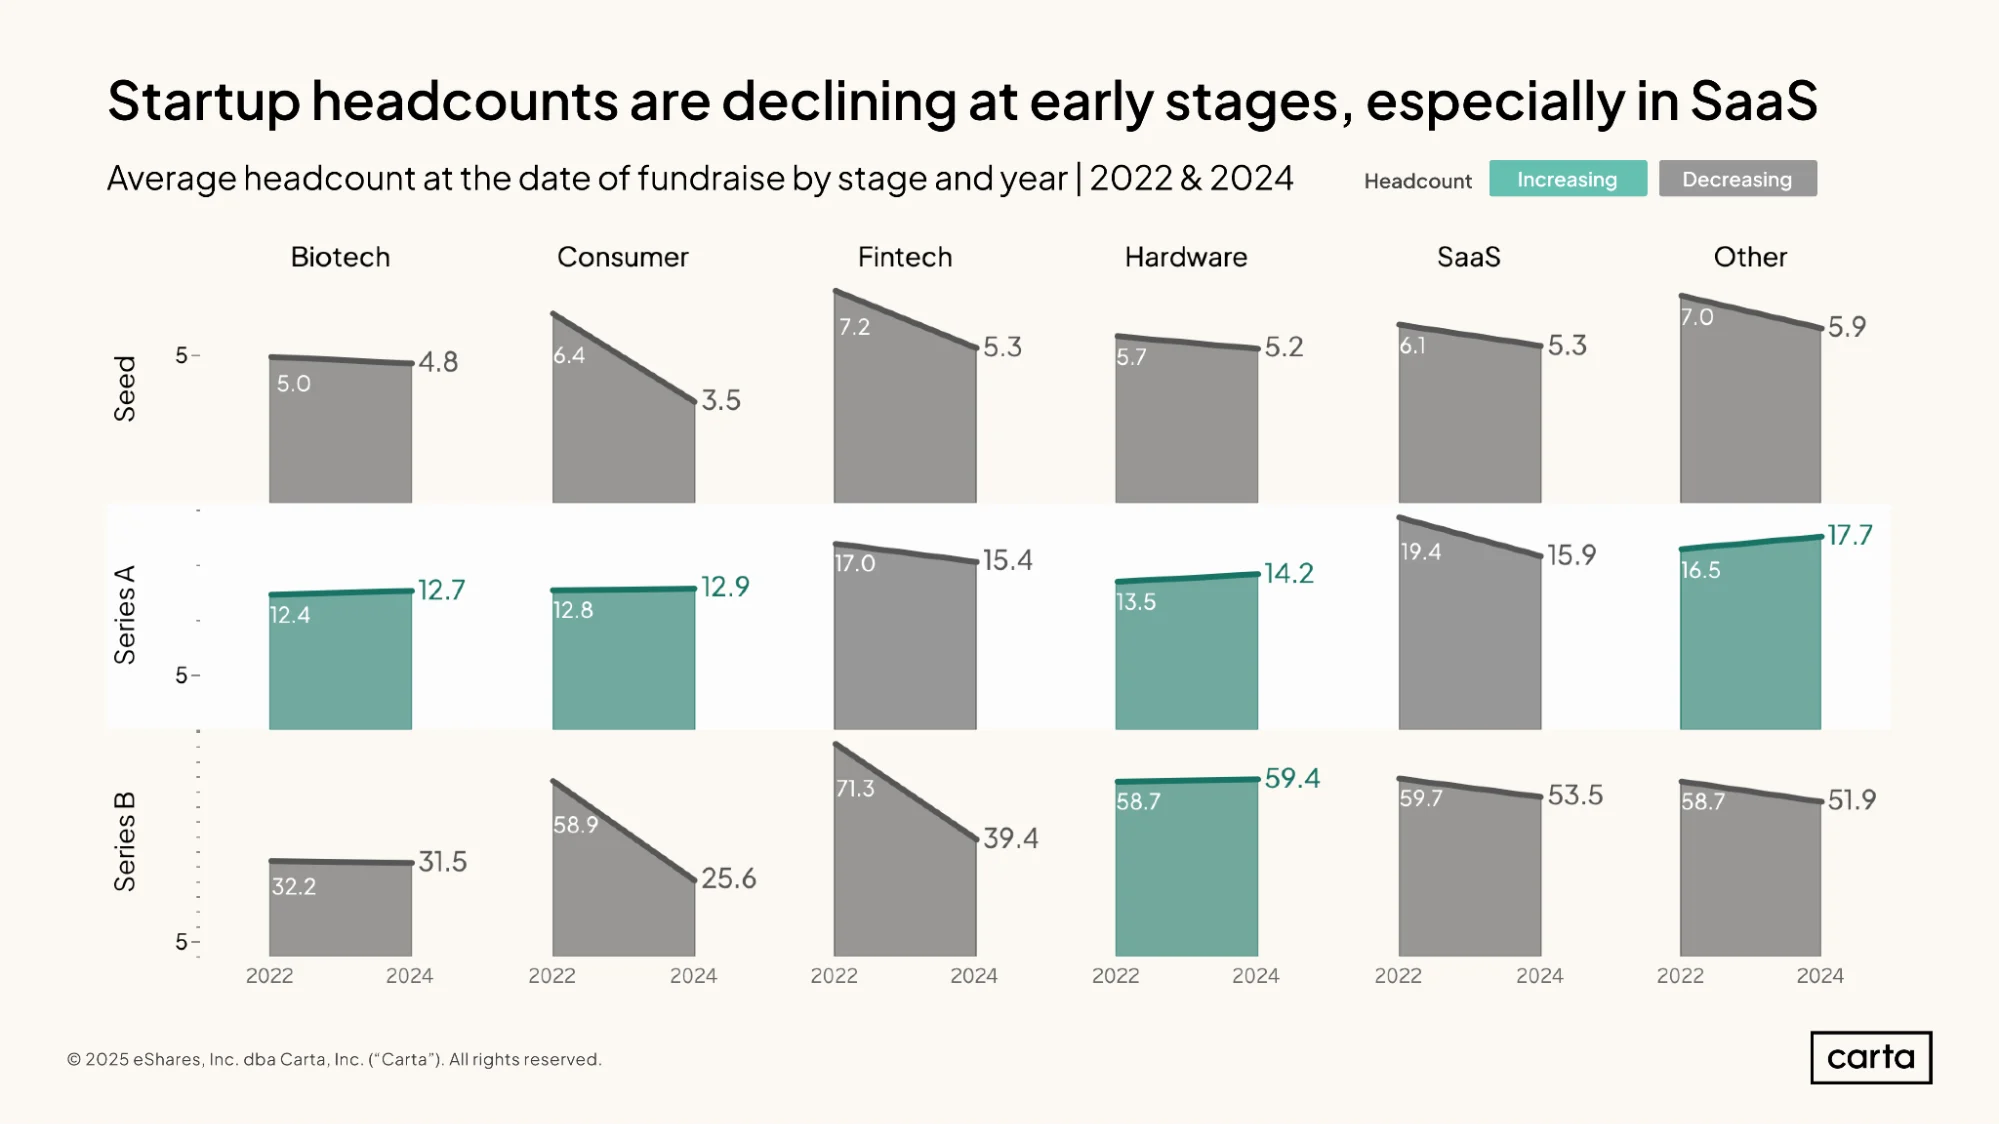
At the seed stage, the average number of employees at startups that successfully raised funding was smaller in 2024 than it was in 2022 in every sector. The same is true at Series B, with the exception of hardware.
The trend is a bit different at Series A, where average headcount is trending up in four of the six sectors shown here. In general, however, early-stage startups are doing more with less when it comes to headcount. This is due in part to a shift in strategic emphasis: Instead of hiring quickly in the early days to accelerate growth, some startups are now more focused on efficiency. It’s also due in part to the rise of AI: New tools for automation have made achieving it easier than ever to build and launch exciting products with small teams.
Some of the biggest declines are in the SaaS industry, which has been one of the primary beneficiaries of the recent AI boom. Compared to two years ago, average headcount among SaaS startups was 13% lower at seed, 18% lower at Series A and 10% lower at Series B.
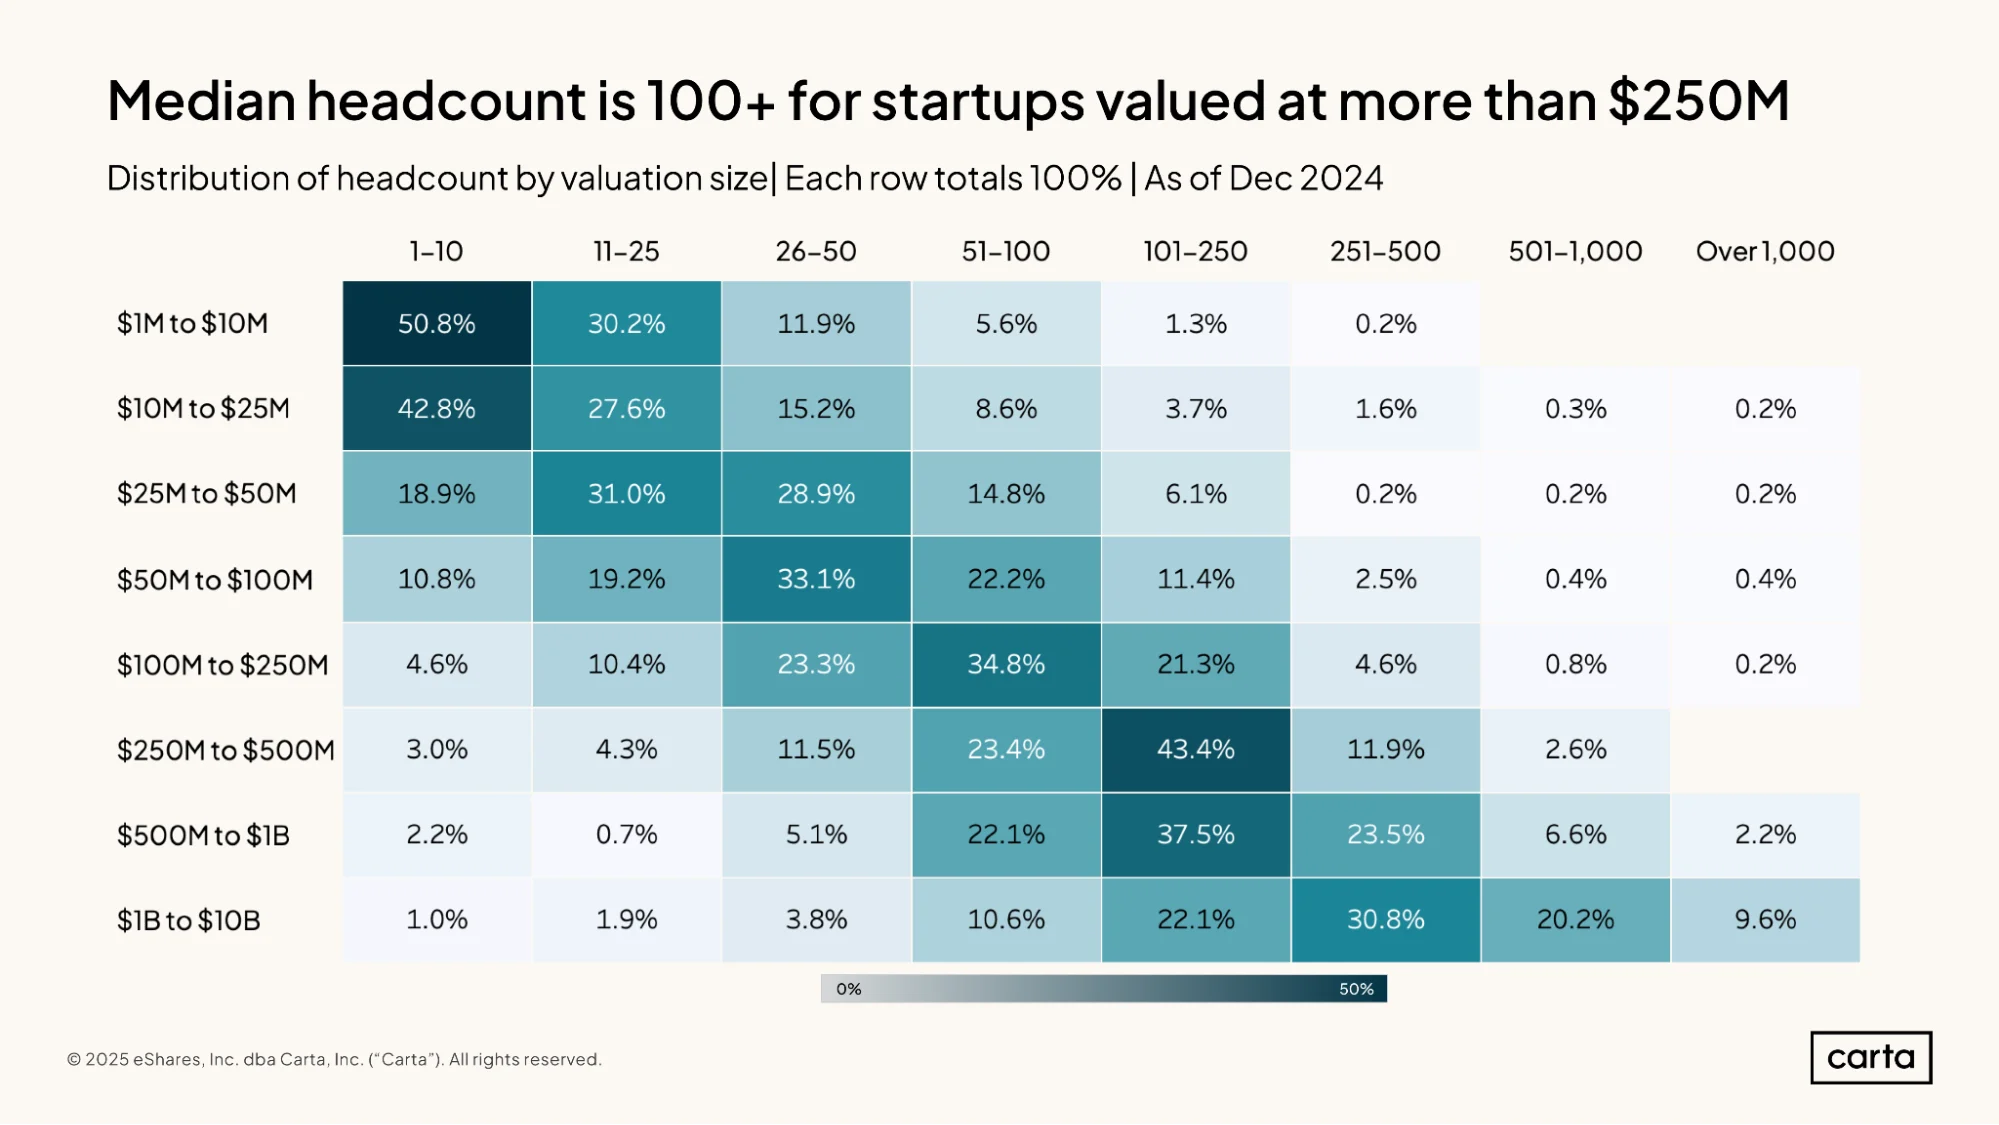
In general, there’s a clear correlation between a company’s valuation and the size of its employee base. A little over 50% of all startups valued between $1 million and $10 million as of December 2024 had fewer than 10 employees, while just 1.5% had more than 100 employees. Among unicorn startups valued between $1 billion and $10 billion, just 1% have fewer than 10 employees, and more than 80% have over 100 employees.
Having fewer than 100 employees is most common for startups up until they reach a $250 million valuation, at which point triple-digit employee counts become the norm. For instance, in the $250 million to $500 million valuation interval, about 58% of all startups have at least 100 employees, and 14.5% have more than 250 employees.
Company composition
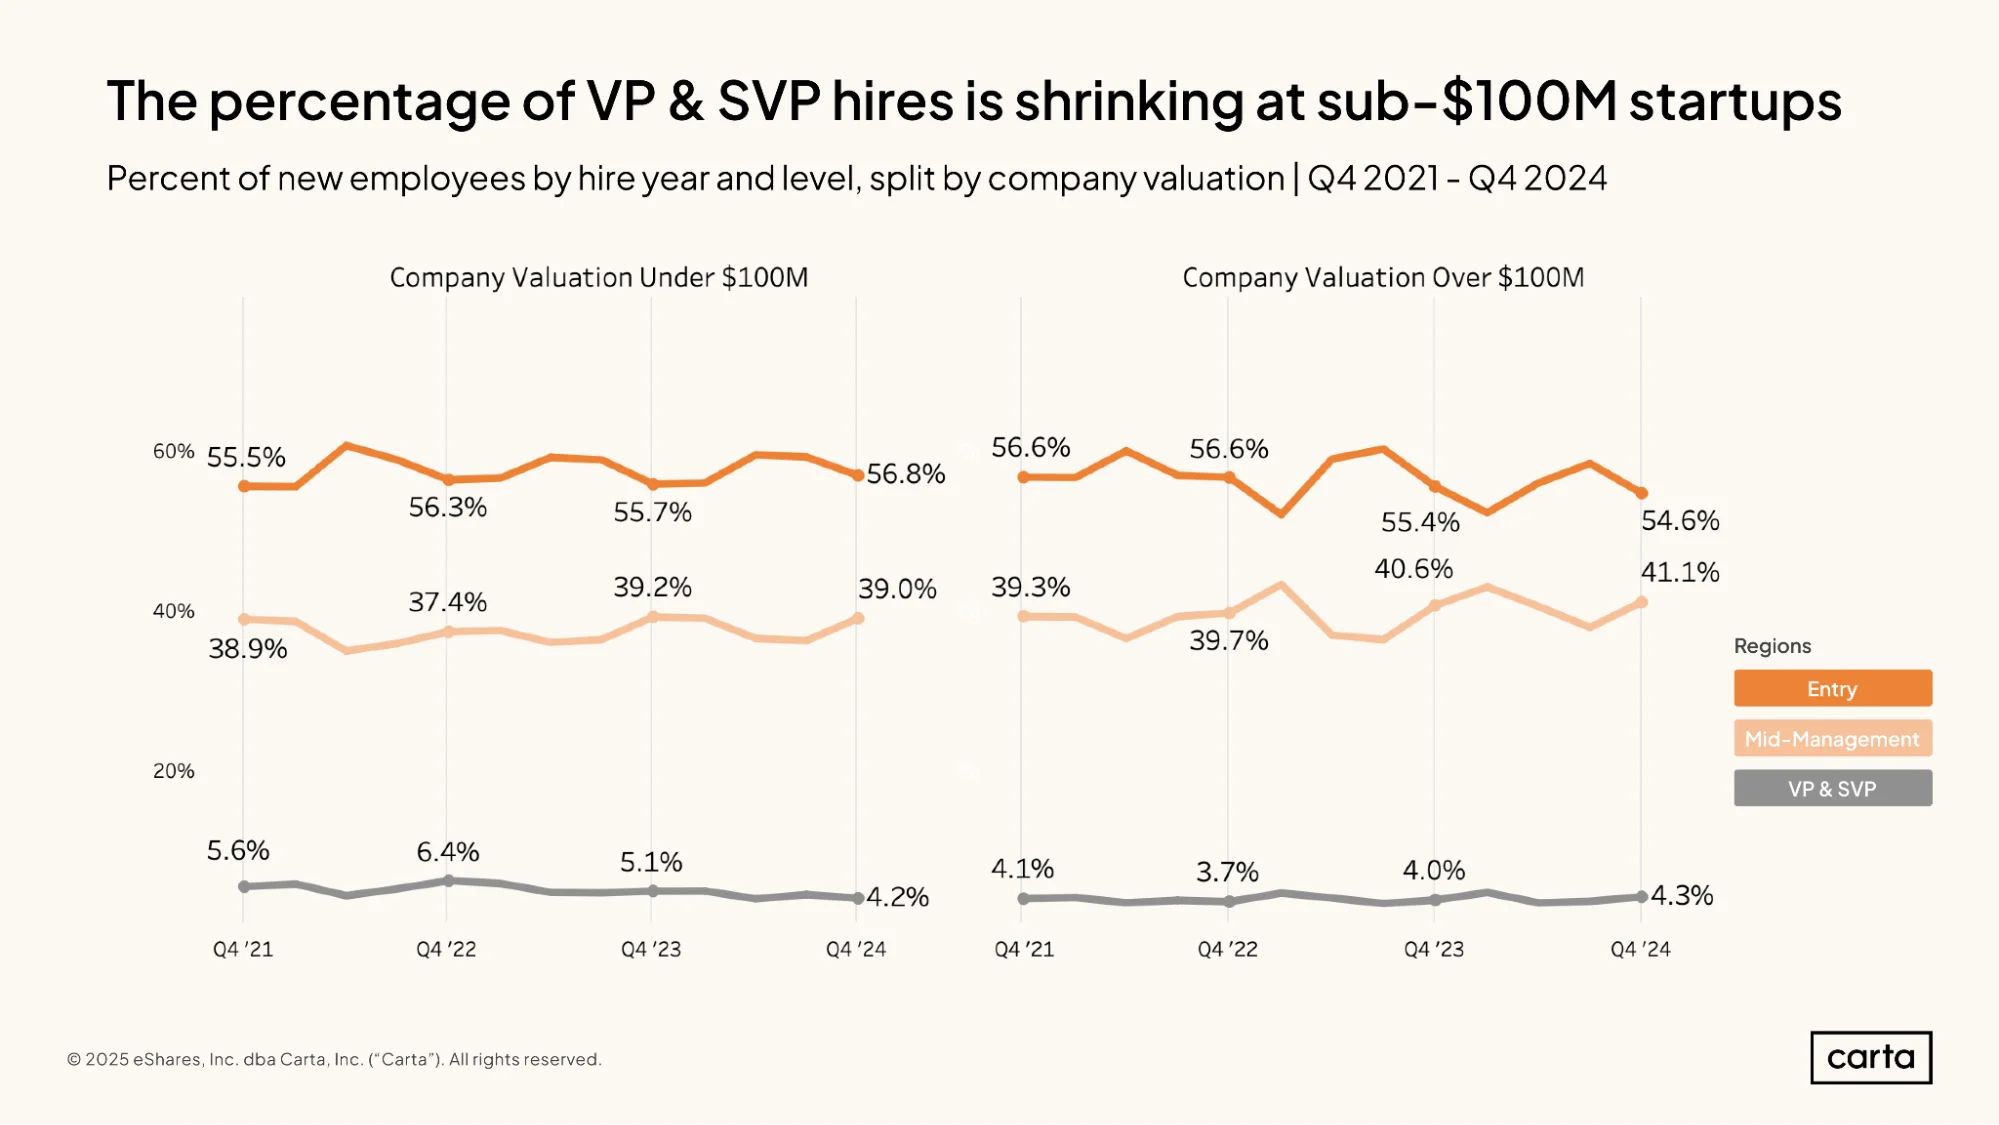
VPs and SVPs have always made up a small proportion of all hires at venture-backed companies. Among startups valued at less than $100 million, however, this small proportion is getting even smaller: In Q4 2024, just 4.2% of all new hires at sub-$100 million startups were VPs or SVPs, down from a 5.1% rate a year earlier and 6.4% two years ago. Fewer VP and SVP hires could point toward a trend of flatter organizational models.
At larger startups—those valued at more than $100 million—entry-level employees have made up a slightly smaller percentage of new hires over the past three years, while the percentage of hires in middle management has been increasing. These have been relatively small-scale shifts, however, with typical year-over-year changes of only a few tenths of a percentage point.
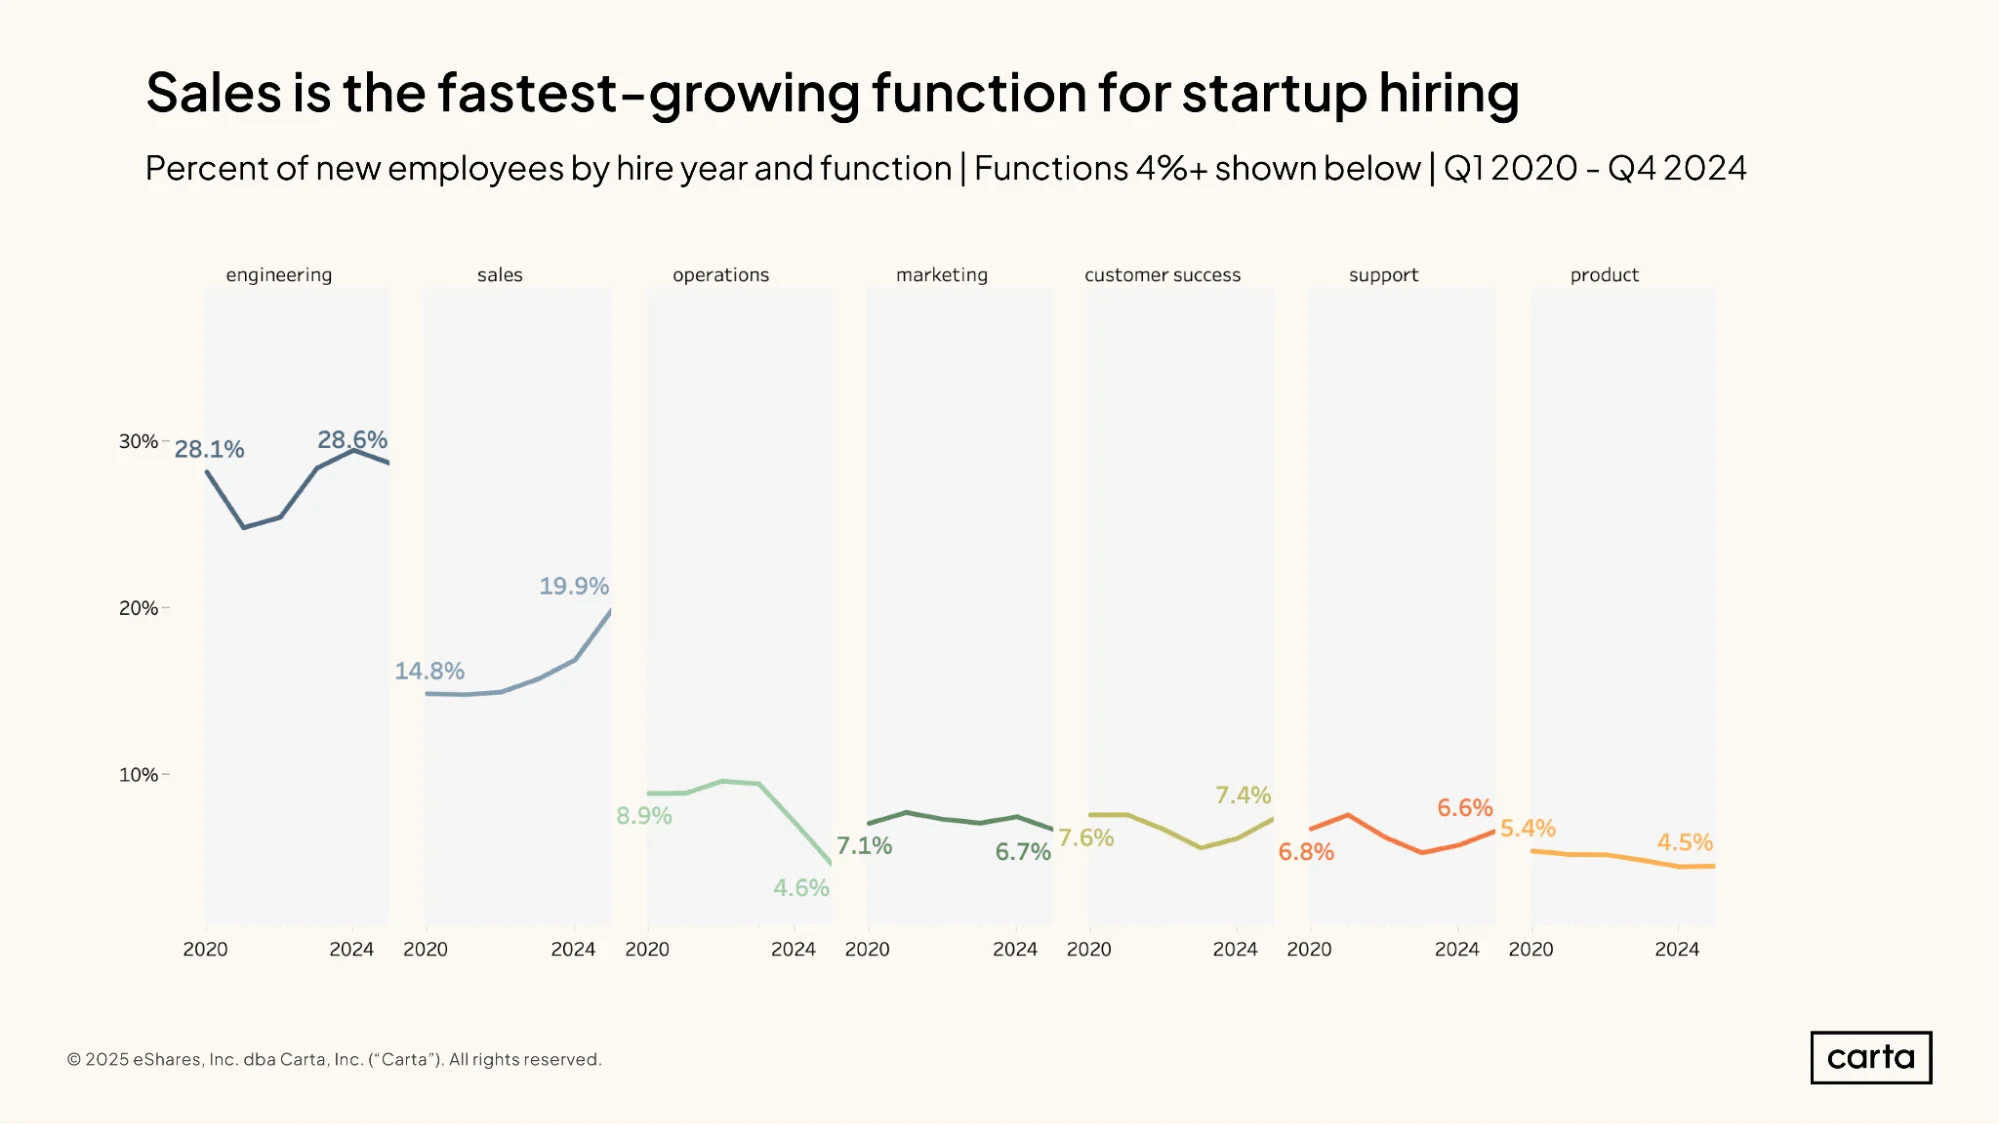
Over the past few years, startups have ramped up their hiring in sales job functions. Sales accounted for 19.9% of all new hires in 2024, compared to 14.8% back in 2020. Over the same span, employers have been deemphasizing operations. Just 4.6% of new hires last year were in operations roles, down from 8.9% in 2020.
The percentage of hires coming from most other job functions was roughly the same in 2024 as it was four years earlier. But in some cases, this long-term equanimity masks some shorter-term turbulence: In engineering, the rate of hiring dropped by multiple percentage points in 2021, only to regain that ground (and then some) in the ensuing years.
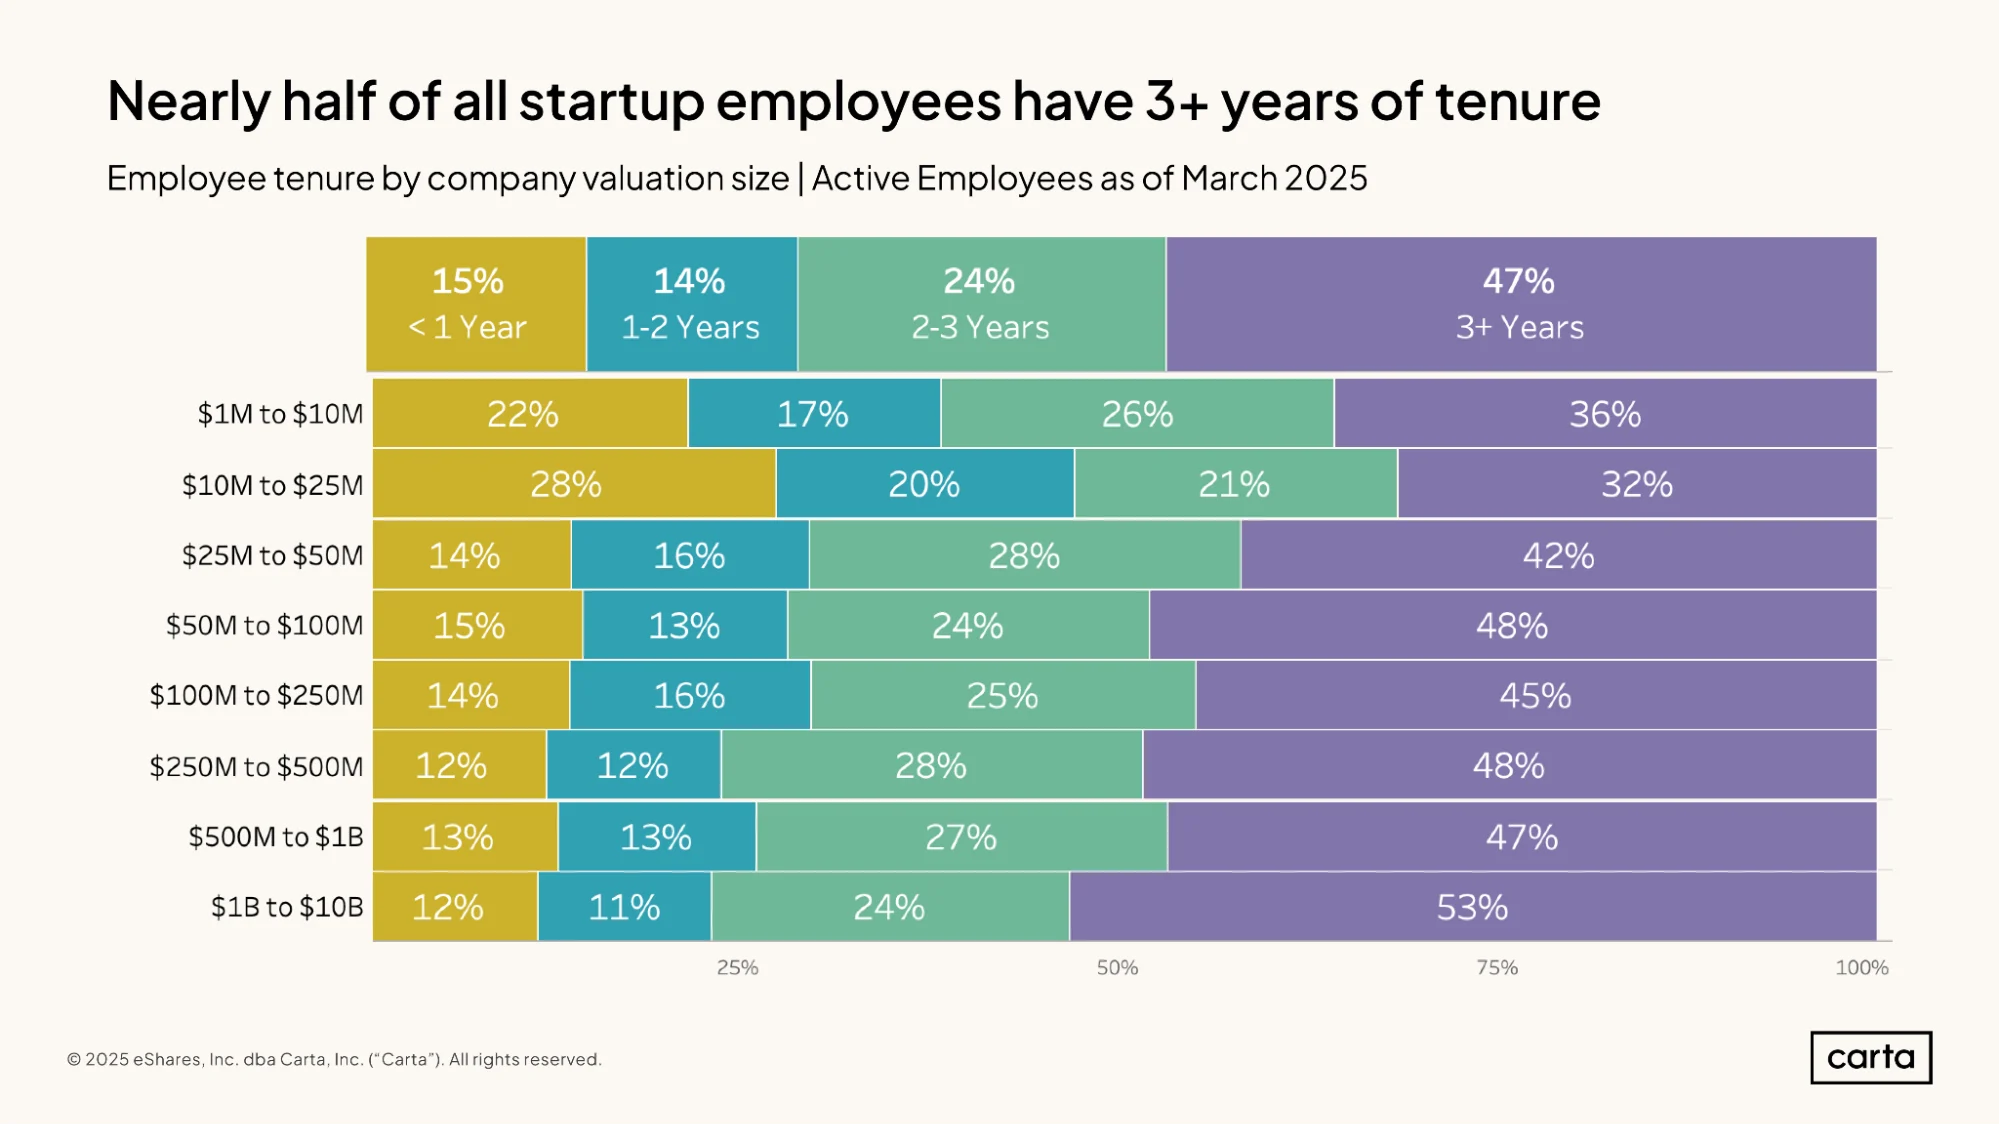
Across startups of all sizes, the divide between employees that have been in their roles for either more or less than three years is nearly equal: 47% of employees have more than three years of tenure, while 53% have less. Longer-tenured employees tend to be more common at startups with higher valuations, while shorter-tenured employees are more likely to be found at less valuable (and often younger) startups
At startups valued between $1 million and $10 million, about 39% of employees have been in their roles for two years or less, and 36% have been in their roles for three years or more. If we move up a few orders of magnitude, to startups valued between $1 billion and $10 billion, the split looks different: Just 23% of employees at these more valuable startups have two years or less of tenure, and 53% have three years or more.
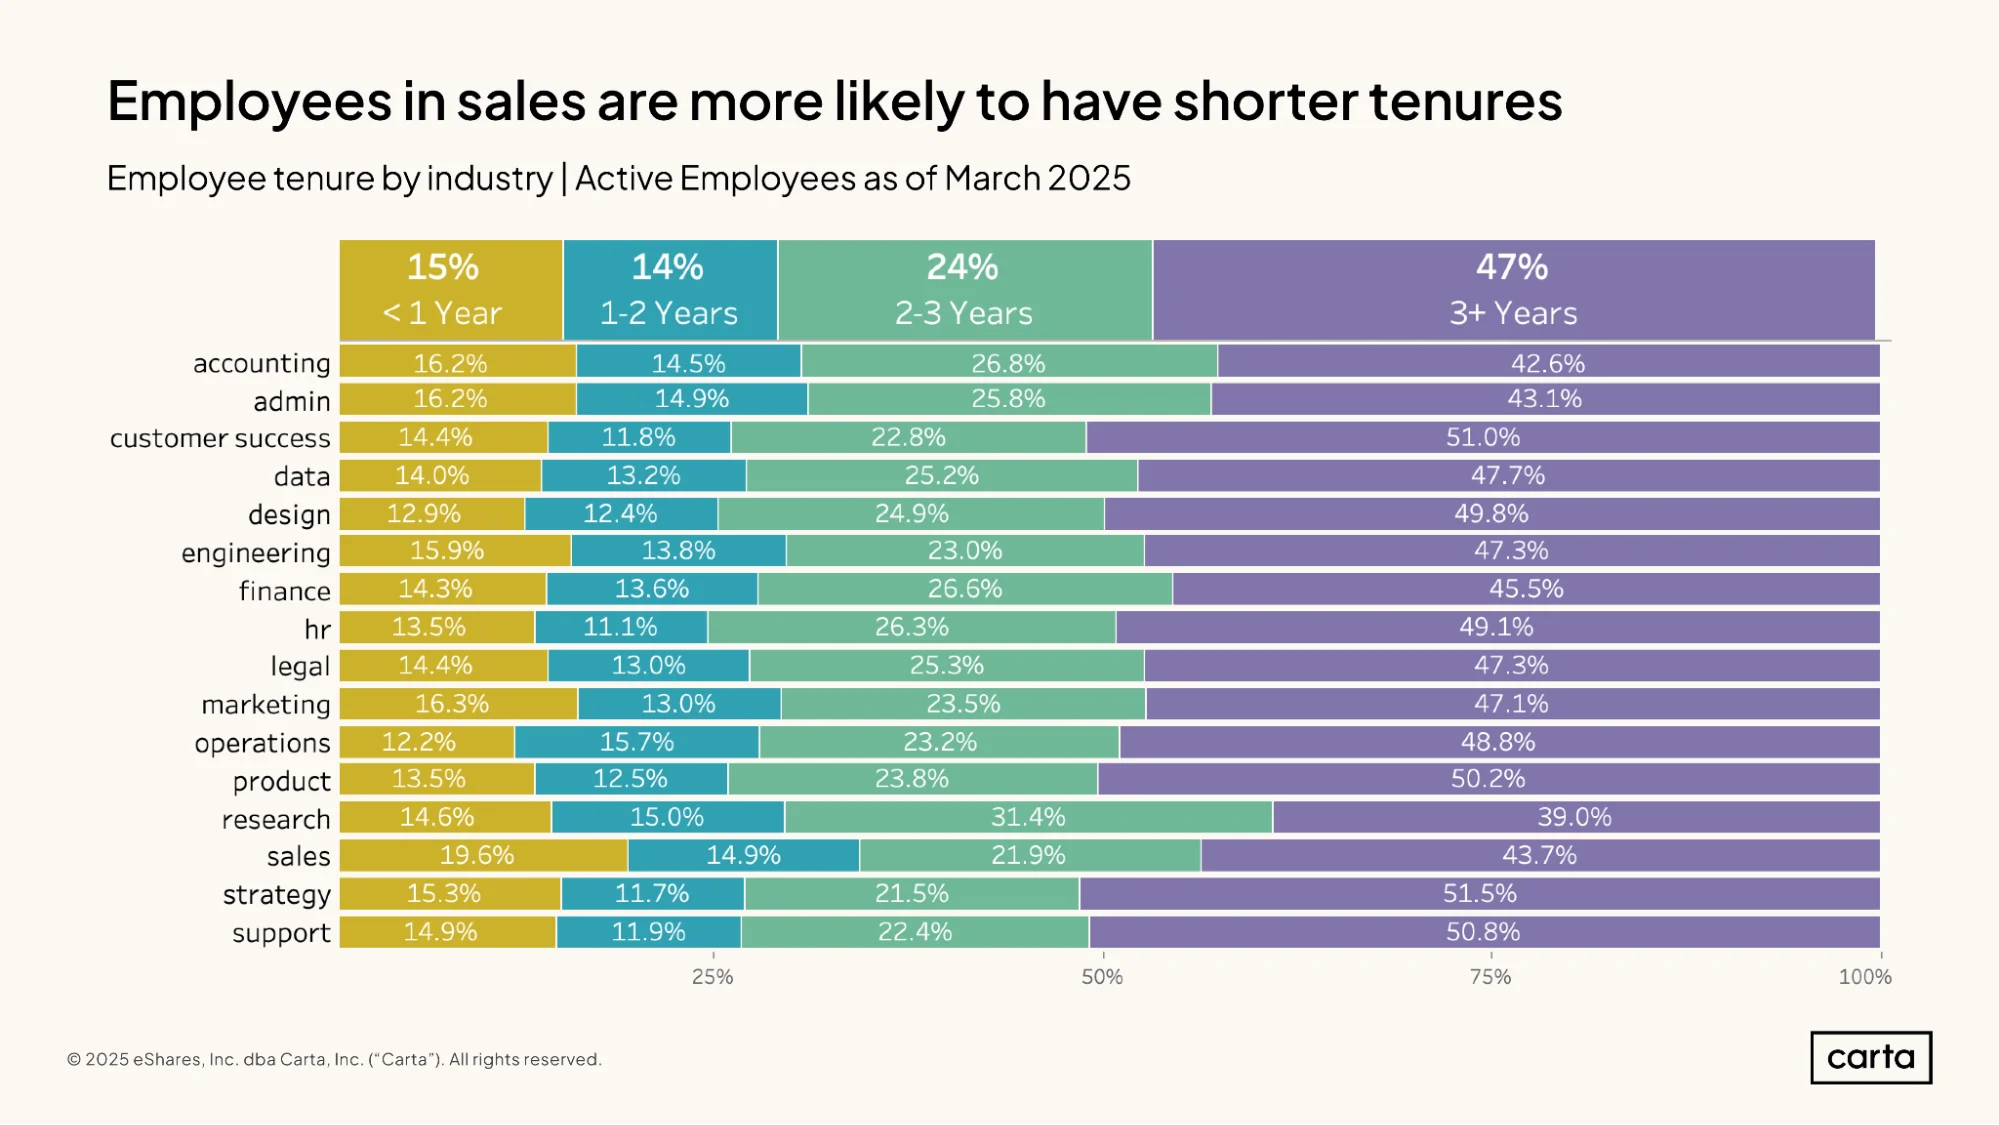
In the sales job function, 19.6% of employees have been in their roles for less than a year, and 34.5% have less than two years in tenure. For both timeframes, those numbers are higher in sales than in any other function. Perhaps due to the pressurized and performance-based nature of many sales positions, the employees who fill these roles are a little less likely to be around for the long term.
On the other end of the spectrum, there are four job functions where more than 50% of employees have been in their roles for three years or more: strategy, customer success, support, and product. These functions are in many ways very different, but they are all areas where deep familiarity with a company’s existing customers and systems can be beneficial.
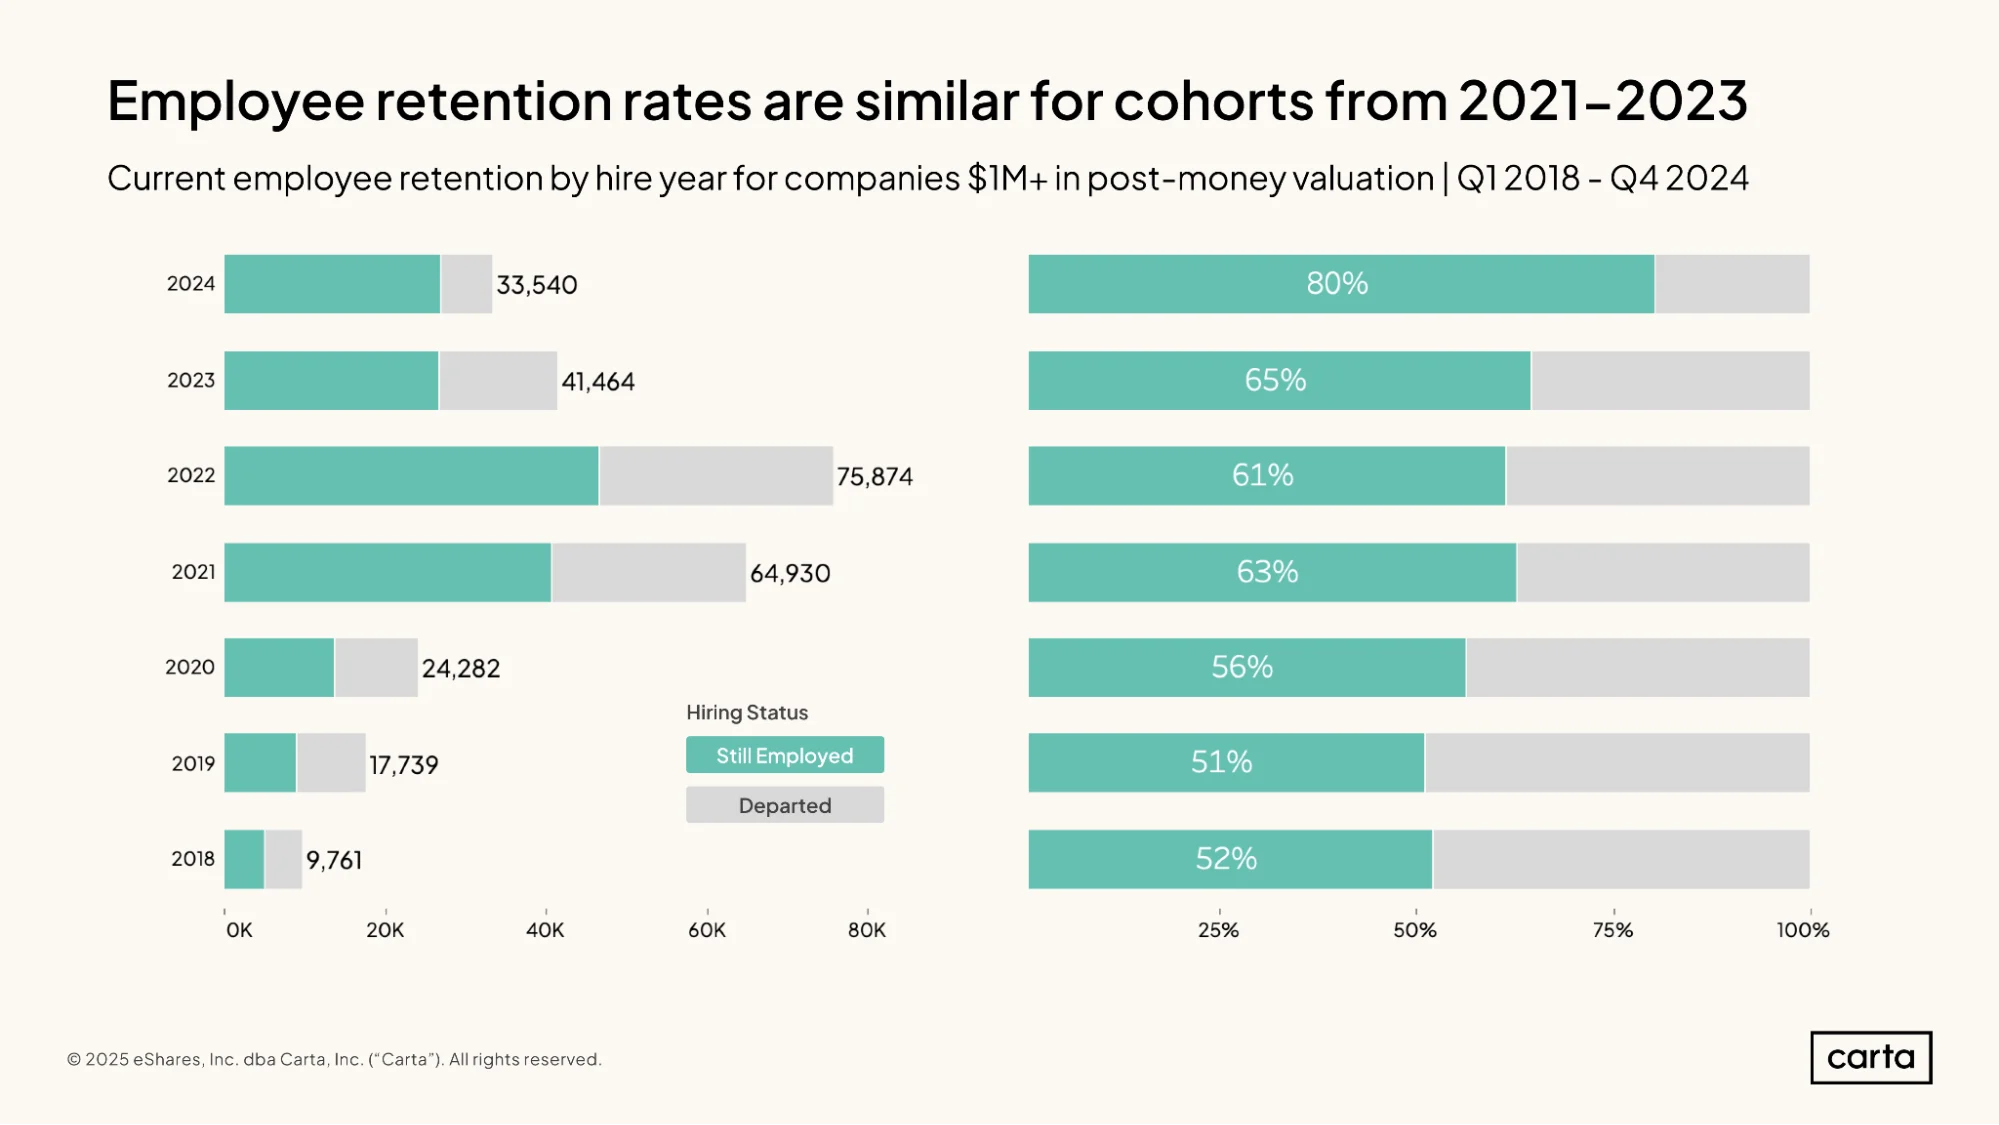
About 80% of employees hired in 2024 by companies on Carta are still in their positions as of March 2025. For employees hired in 2023, that rate drops to 65%. In general, the farther back in time you look, the lower the percentage of employees hired that year who remain in their roles.
There are exceptions to this trend, however: For instance, the percentage of employees hired in 2021 who are still in their roles is higher than the retention rate from 2022, and the retention rate from 2018 is higher than the rate from 2019. From one year to the next, employee retention rates tend to be more consistent than the volume of new hires.
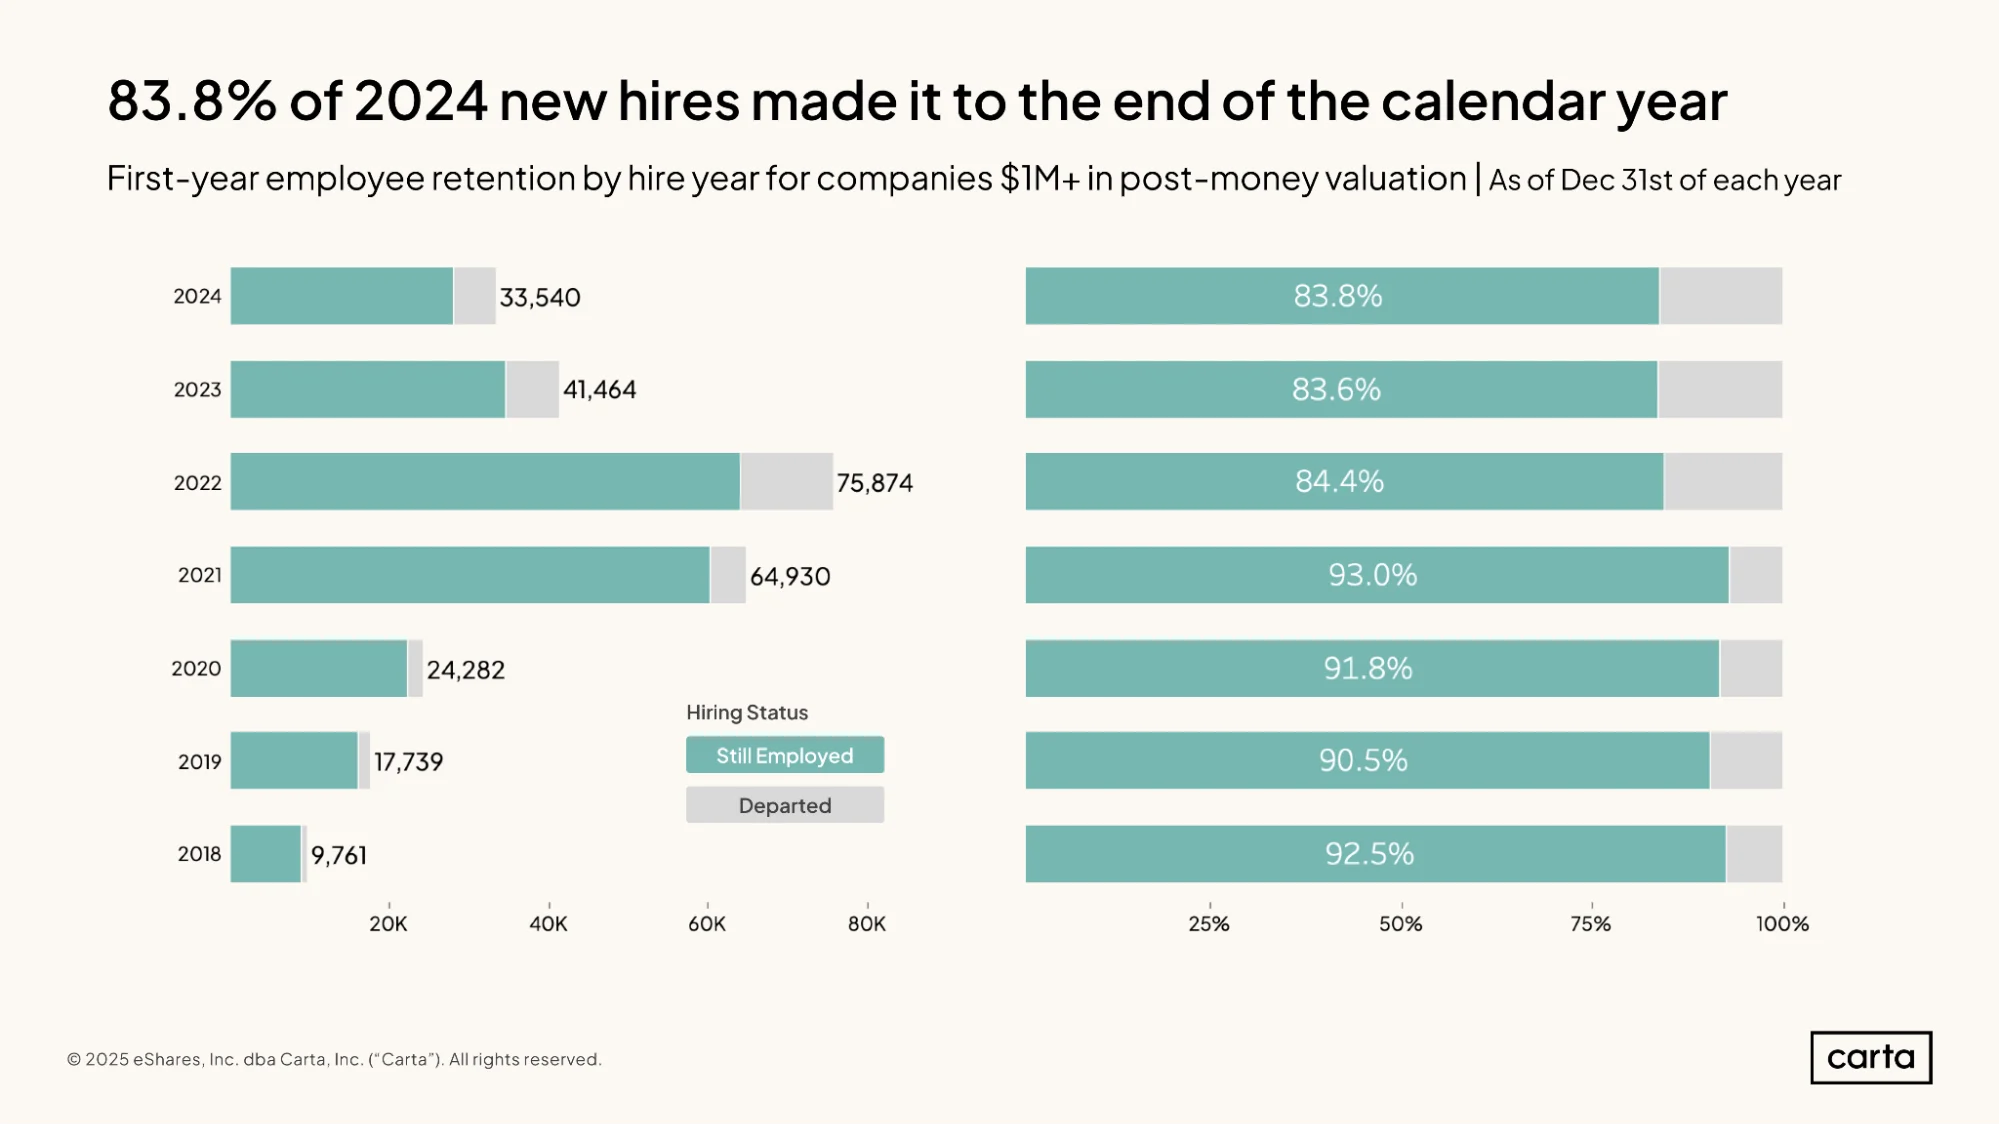
The vast majority of new hires remain in their positions for more than a year. But in the past three years, this rate of first-year employee retention has sunk a little lower.
Last year, about 83.8% of new hires were still in their roles at the end of the year, almost equaling the 83.6% first-year retention rate from 2023. From 2018 through 2021, the first-year retention rate was above 90% for four straight years.
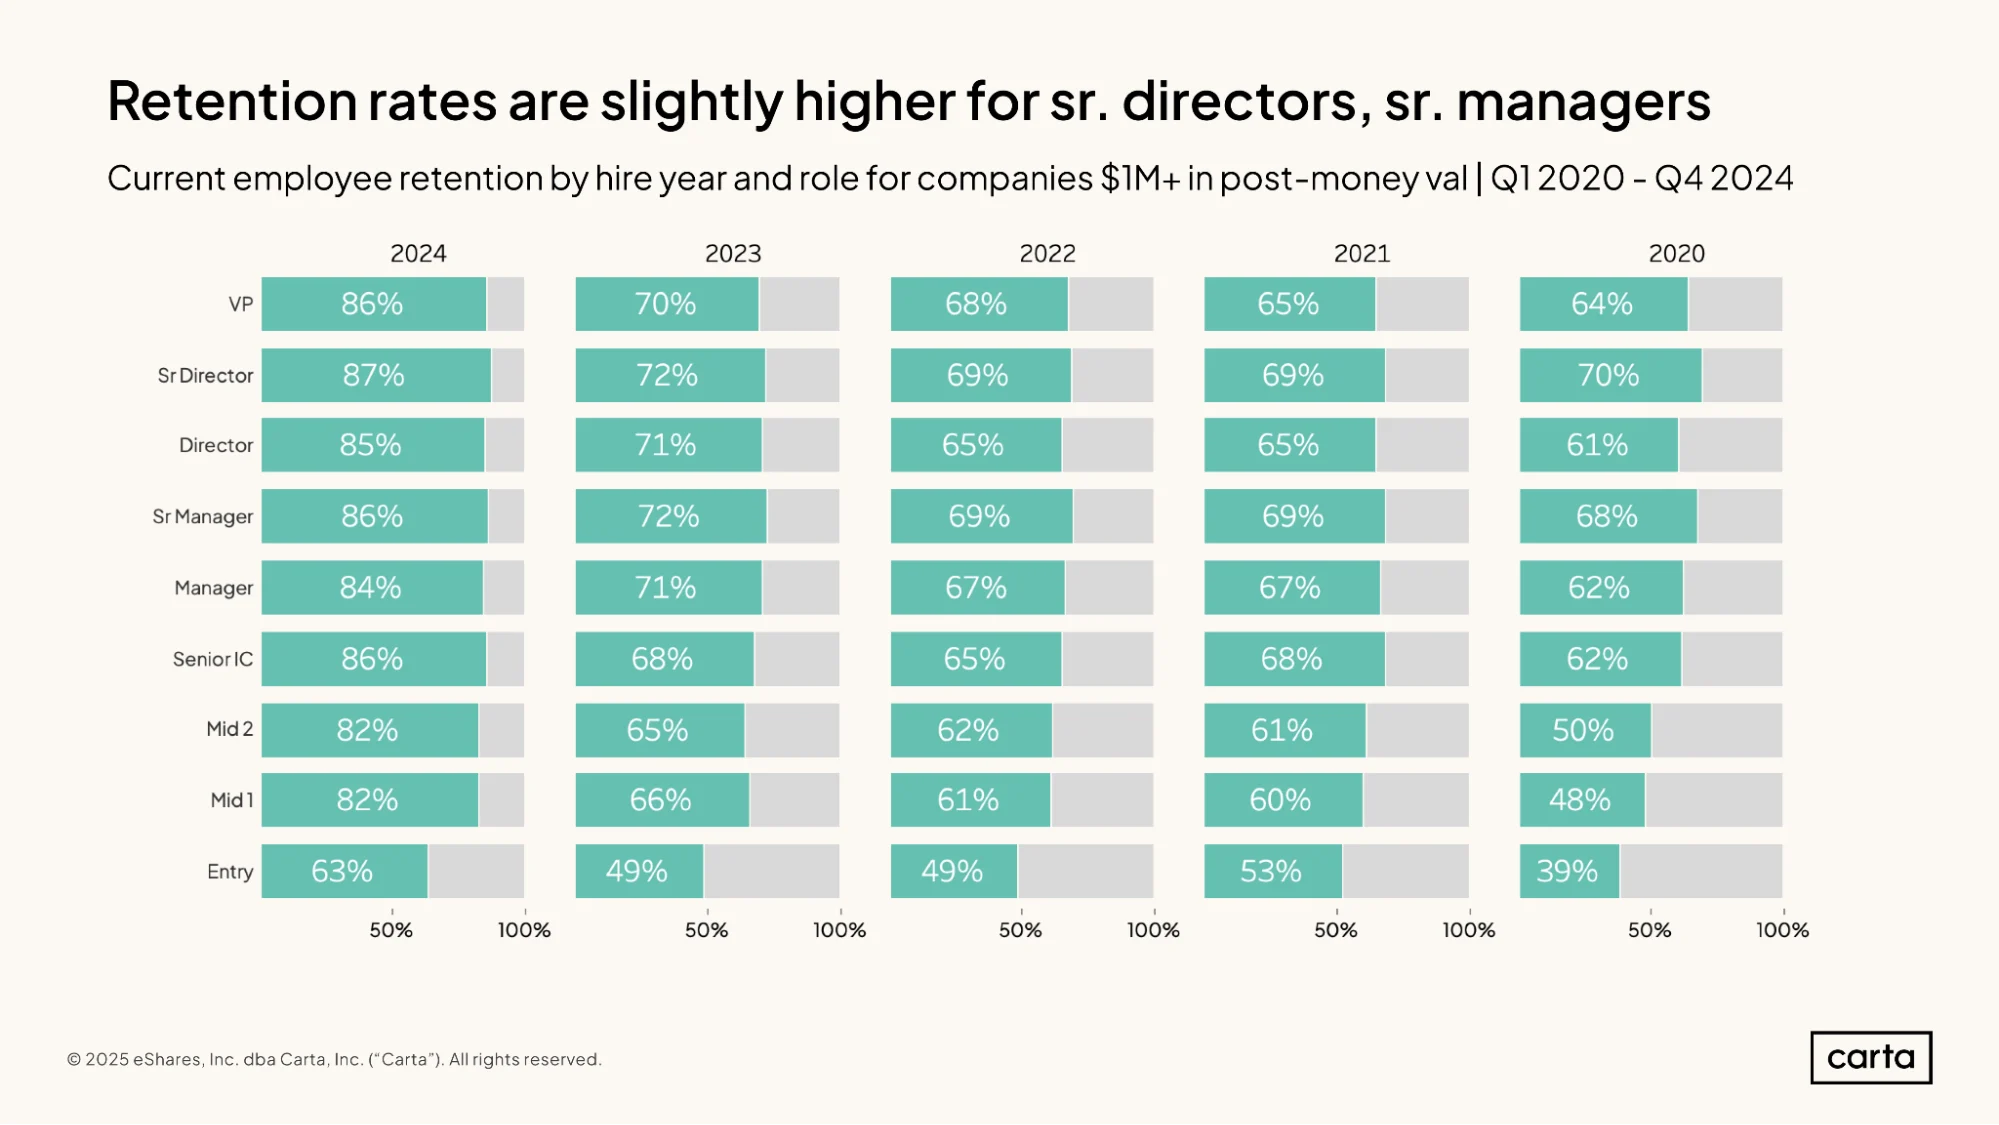
For employees hired in 2024 and 2023, there are minimal differences in employee retention rate across different job levels. Go further back in time, however, and wider gaps emerge: The retention rate for senior directors hired in 2020 is at 70%, compared to 48% for mid-level employees hired the same year.
Across each of the past five years, entry-level employees have much lower retention rates than hires further up the org chart. With less equity to vest, entry employees may be more willing to depart their current company for a higher-ranking role somewhere else. Less than 50% of entry-level employees hired in each of 2023, 2022, and 2020 remain in those roles.
Geographical trends
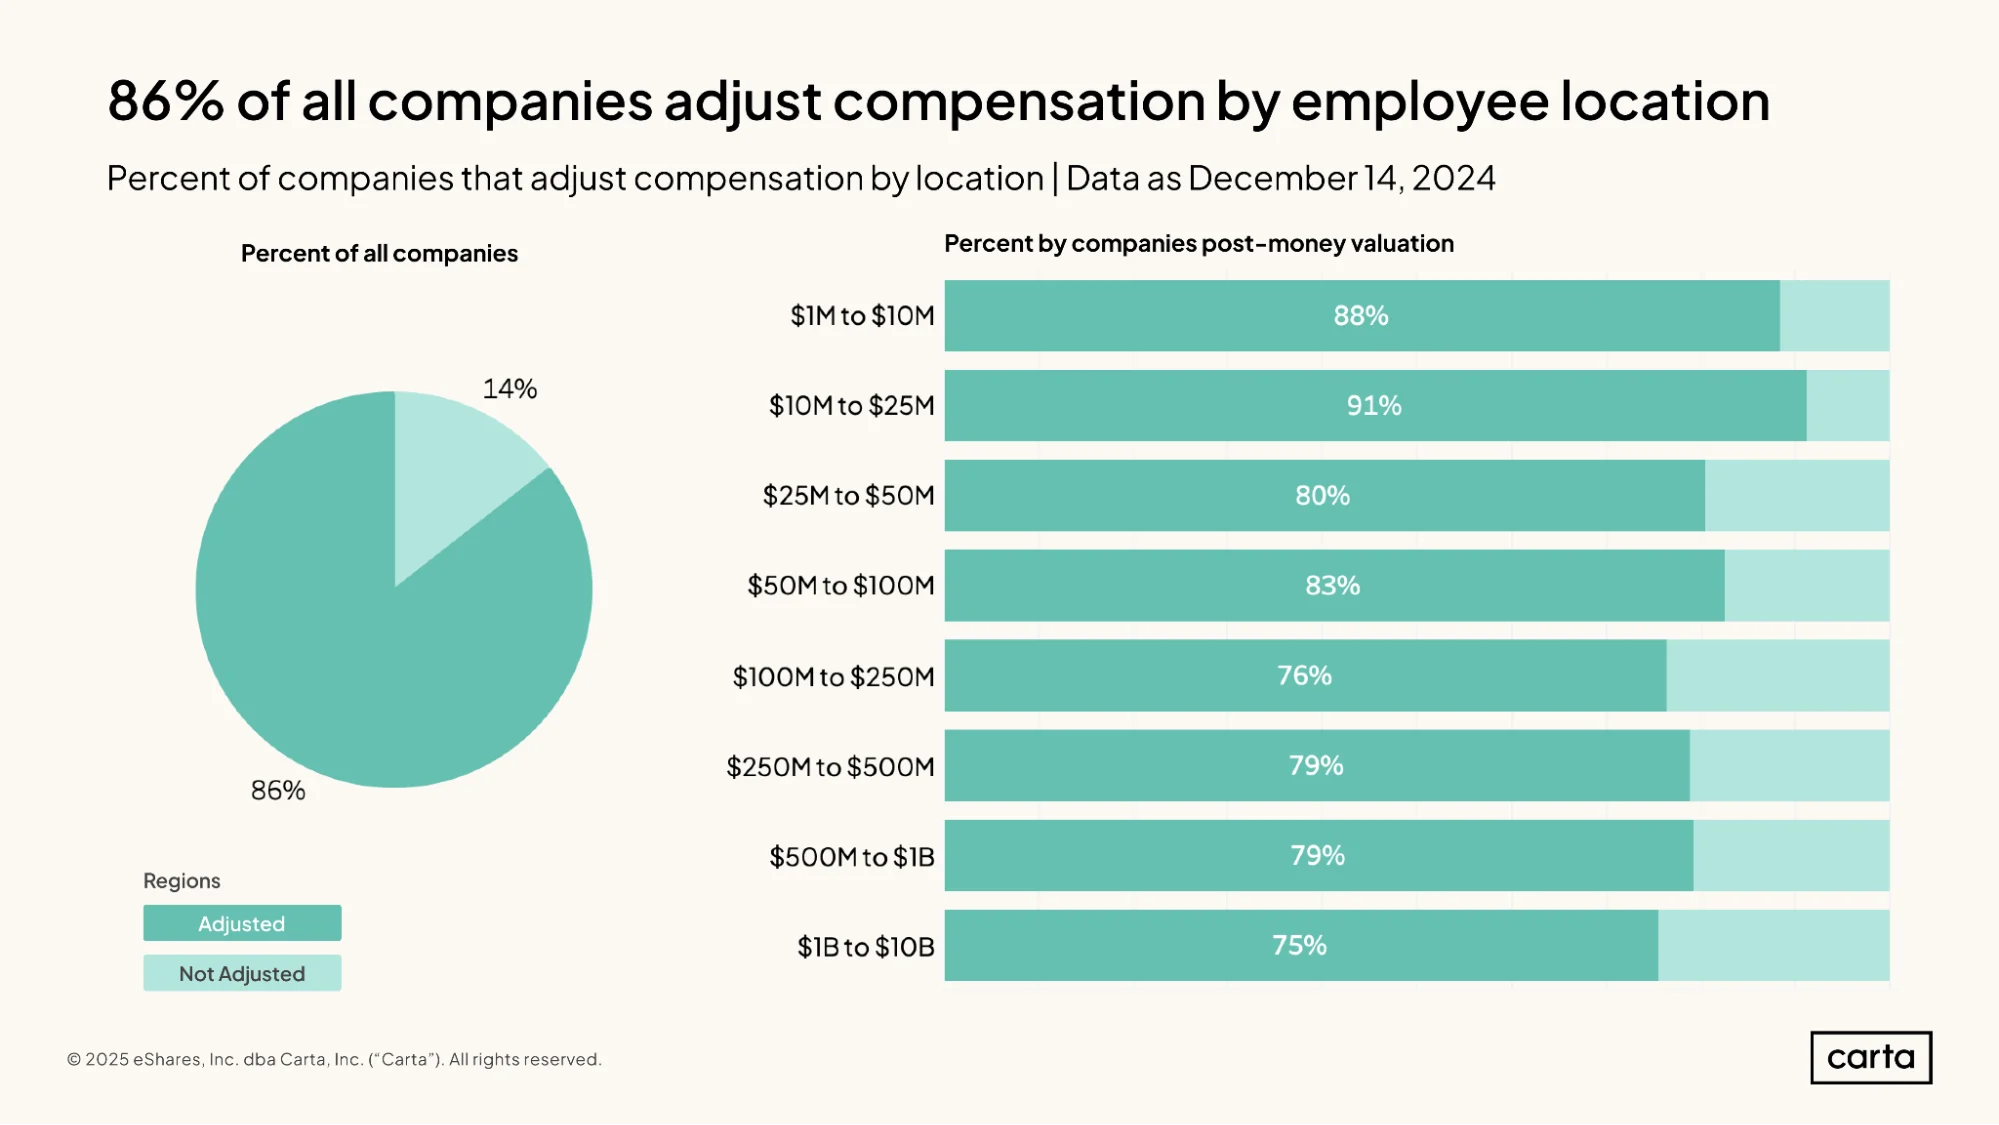
No matter their valuation, a large majority of companies on Carta adjust the compensation they offer depending on where new hires live. Many employers pay higher salaries to employees who live in higher cost-of-living areas, with the goal of affording different employees similar levels of spending power, regardless of where they live.
These geographical adjustments to compensation are a little more common at smaller companies than they are at larger ones. About 91% of companies valued between $10 million and $25 million adjust compensation based on location, compared to 75% of companies valued between $1 billion and $10 billion.
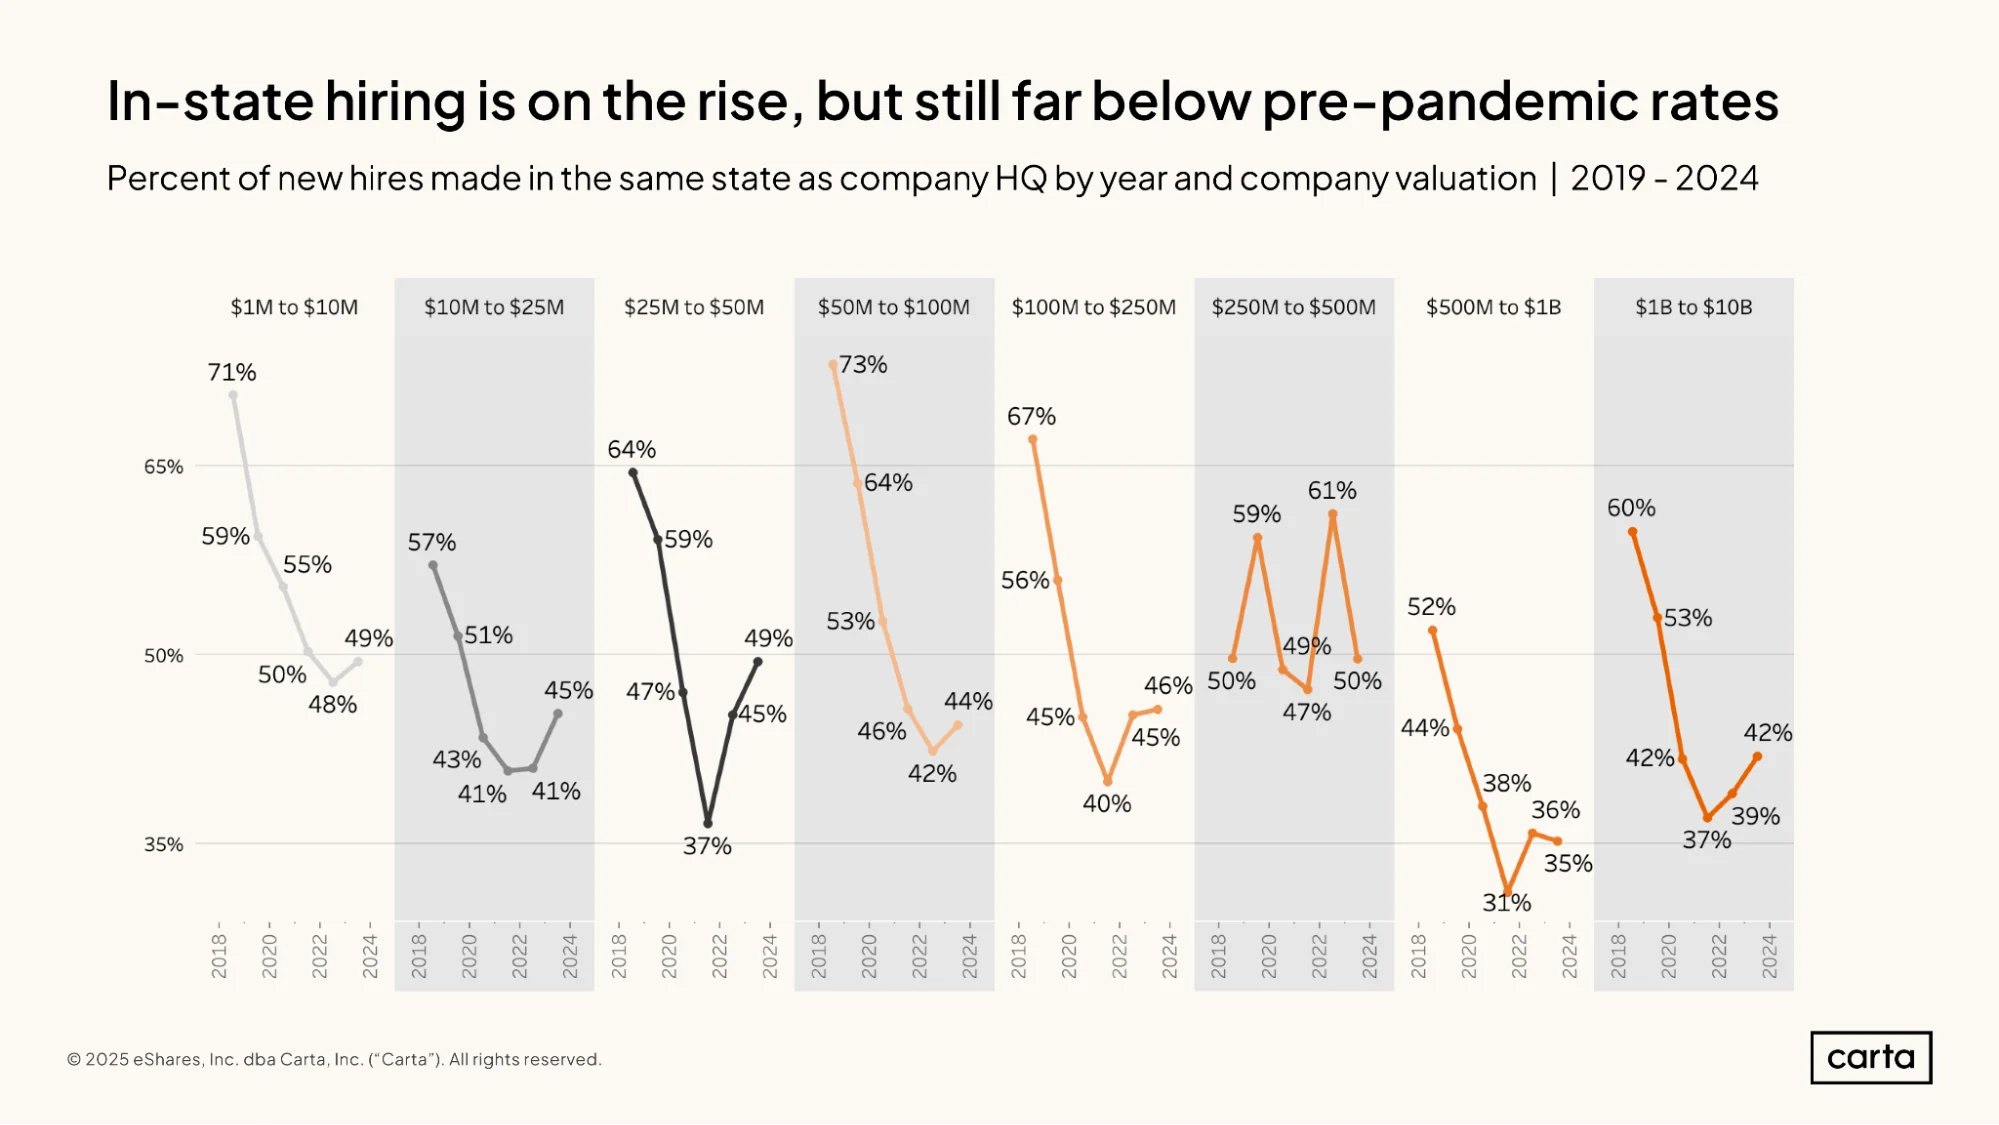
Prior to 2020, in-state hiring was the norm for startups. Among companies in every valuation interval ranging from $1 million all the way up to $10 billion, at least 50% of all new hires in 2019 were based in the same state as their new employer.
With the onset of the pandemic, however, startups embraced remote hiring like never before. In every valuation interval except for $250 million to $500 million, the percentage of in-state hires plummeted during the early 2020s, in some cases dipping below 40%.
Now, in-state hiring seems again to be on the rise. The rate of in-state hires ticked up last year for five of the seven valuation intervals included in the above chart, with the biggest increases coming among startups valued from $10 million to $50 million.
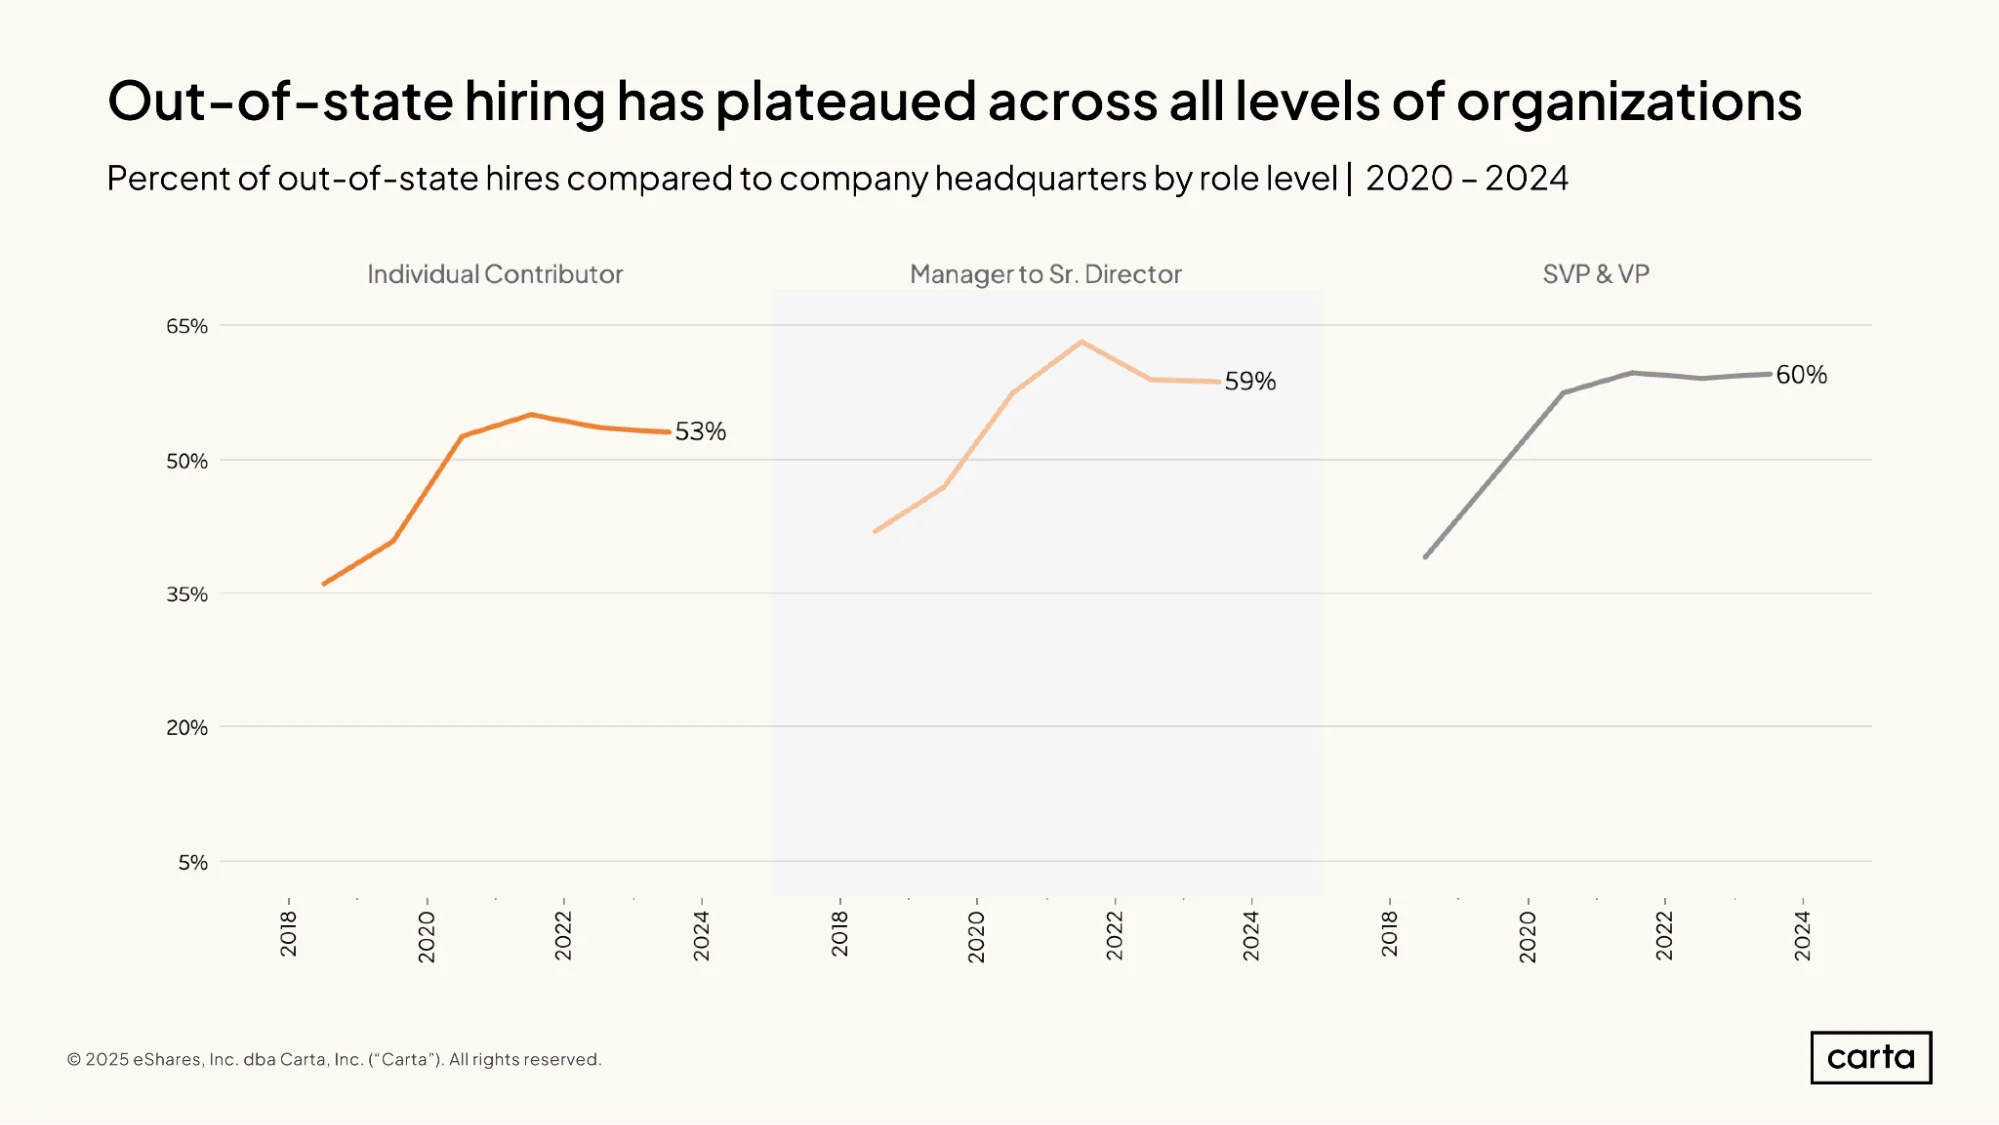
From 2018 to 2021, out-of-state hiring grew steadily more popular for employees at every level of the org chart, from individual contributors up to SVPs and VPs.
Now, in the past two years, the percentage of hires who live in different states has leveled off for every job level, with out-of-state hiring most common for senior roles. At every job level, out-of-state hiring was more common than in-state hiring in 2024, a significant shift from the norms back in 2018.
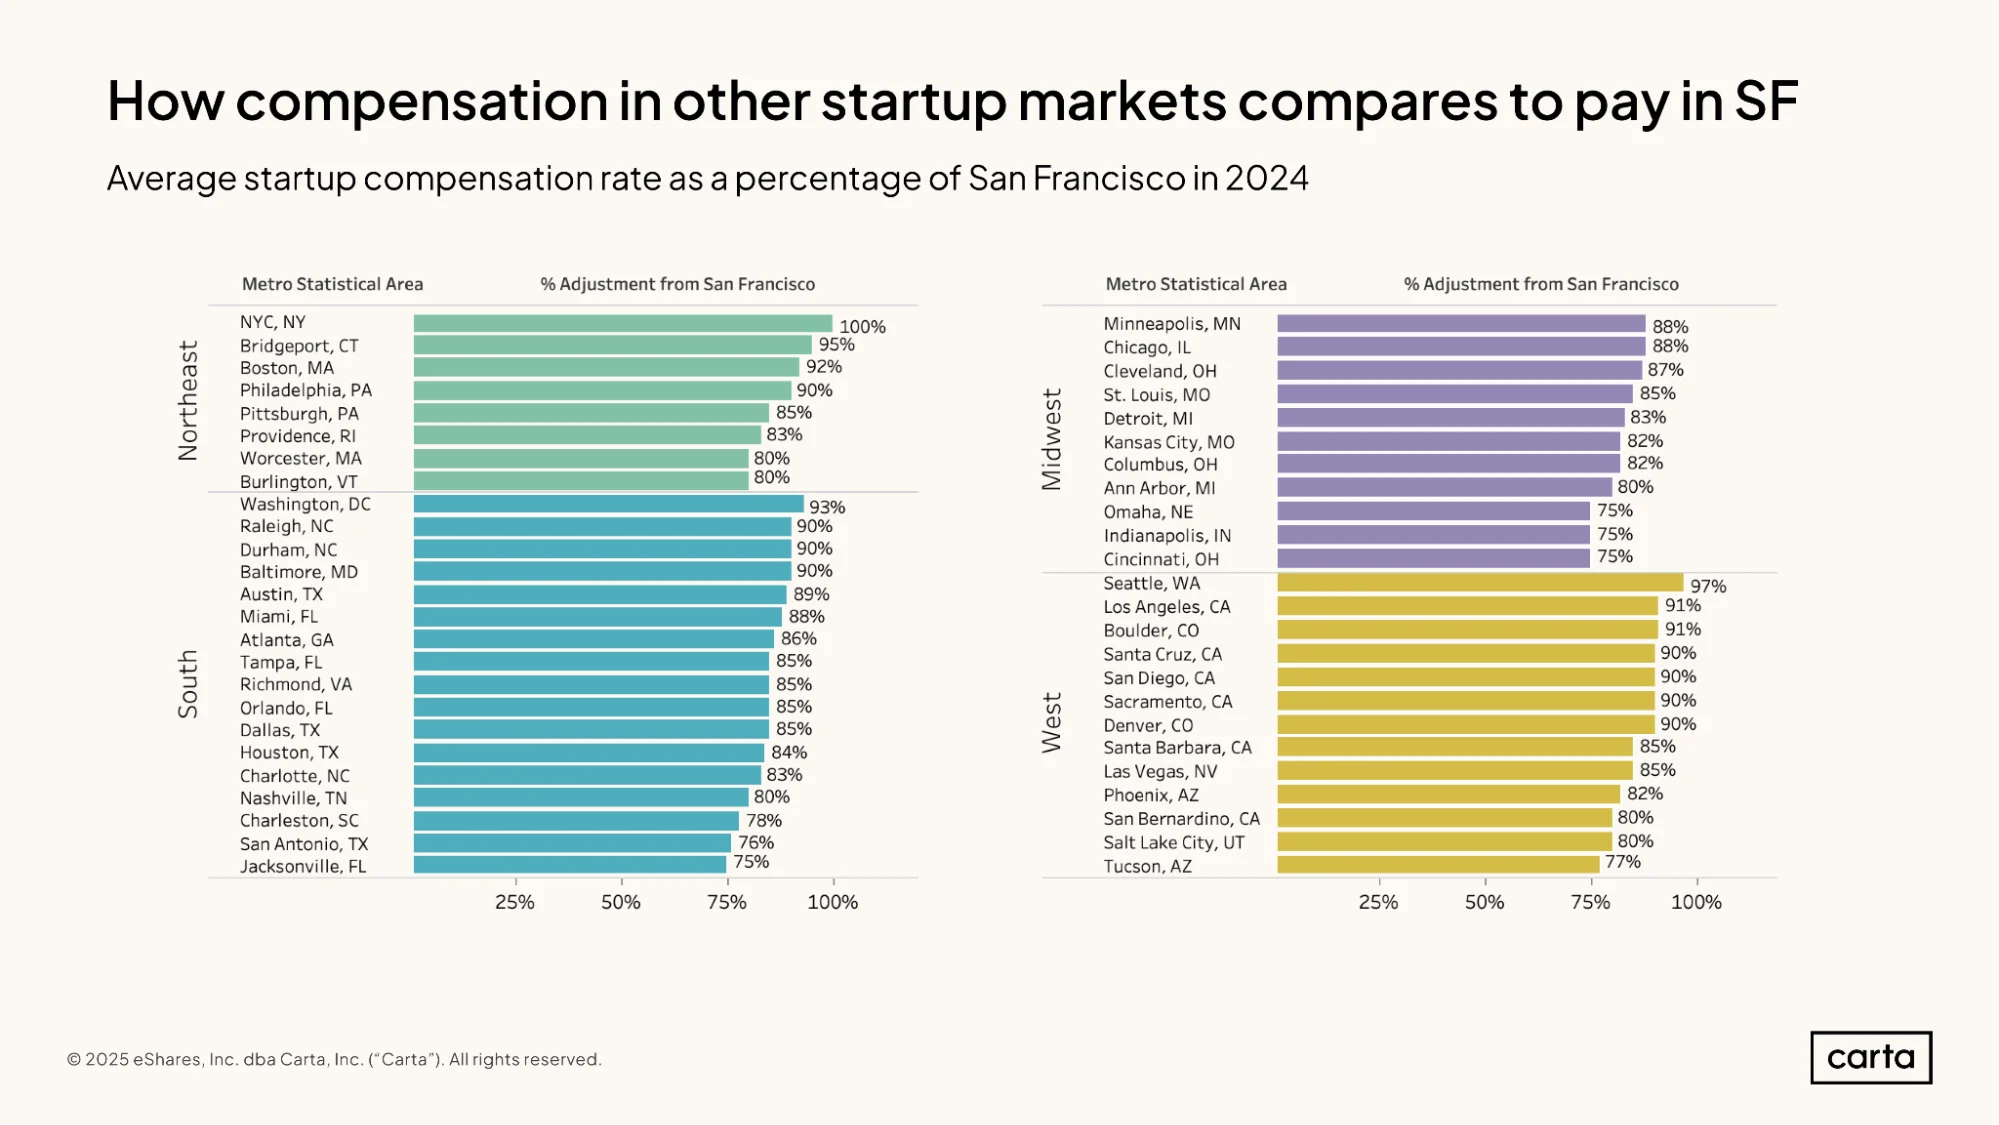
When comparing how startups adjust compensation based on where employees live, San Francisco can serve as a useful baseline, since the Bay Area market is home to the highest salaries. In 2024, however, the New York City metro equaled San Francisco in average compensation, and the Seattle metro area isn’t far behind: Average startup compensation there is at 97% of the level it is in the Bay Area.
Average compensation in most other major and mid-sized metro areas is somewhere between 75% and 95% of what it is in the Bay Area. Some of the highest average compensation rates can be found in other California metros, including Los Angeles and San Diego, and in major East Coast cities like Boston, Philadelphia, and Washington, D.C.
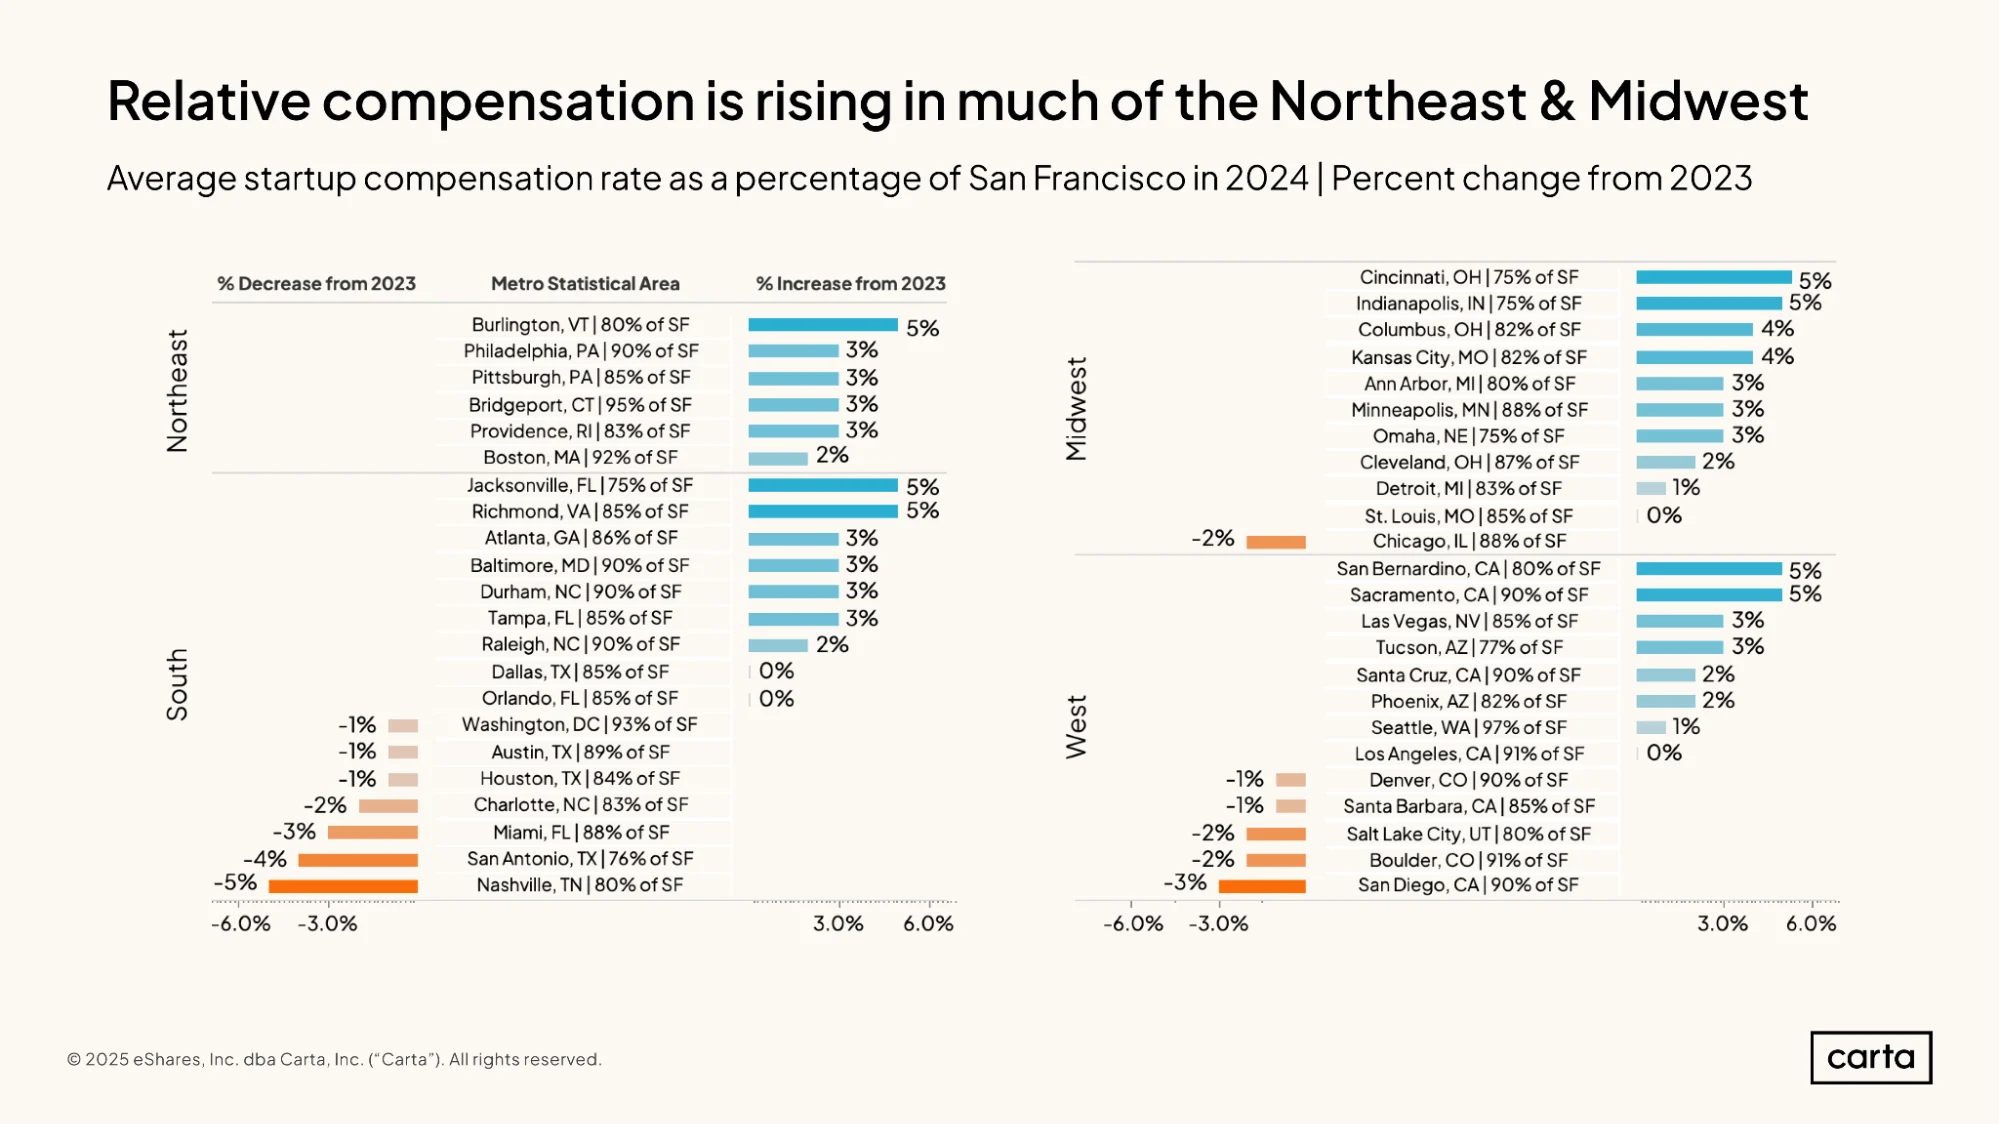
In most cases, the gap in compensation between San Francisco and the rest of the U.S. is narrowing. Out of the 46 metro areas included in the above graphic, 29 saw average startup compensation relative to San Francisco increase in 2024 compared to 2023. Relative compensation decreased in another 13 cities and stayed the same in four.
Many of the cities that saw the biggest relative gains in 2024 are smaller markets where average pay still lags well behind other larger metros. Jacksonville, Cincinnati, and Indianapolis all saw a 5% increase in their relative compensation in 2024, but all three are still at just 75% of average compensation in San Francisco.
Salary
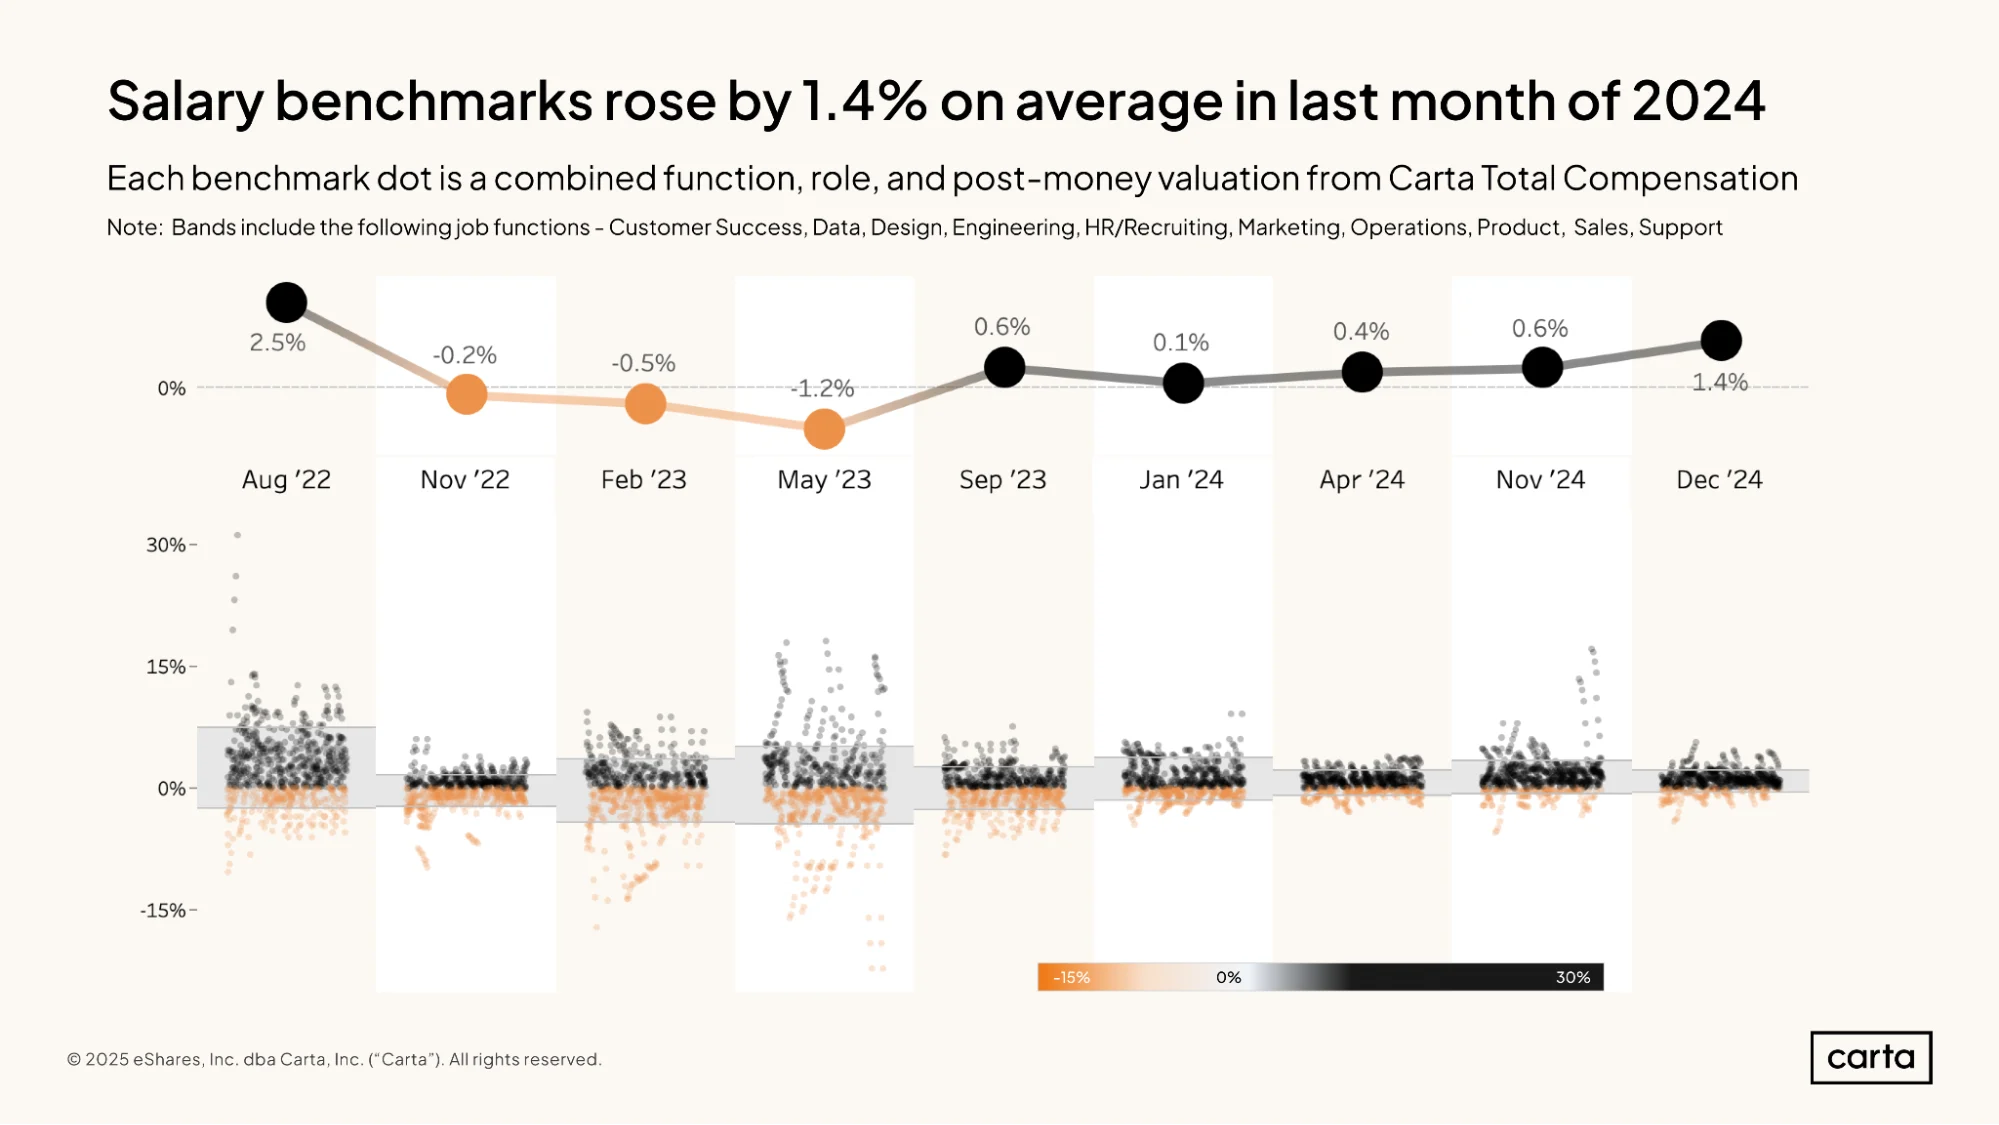
The average salary benchmark across a broad selection of job functions and roles increased by 1.4% in December 2024 compared to November. Average salary benchmarks have now been trending up for well over a year.
As average salary benchmarks have steadily increased in recent months, the distribution of benchmarks has also grown more compact, compared to late 2022 and early 2023. Statistically speaking, recent increases in the average benchmark have been driven by broad-based changes across a large number of salary benchmarks, rather than a handful of high-end outliers.
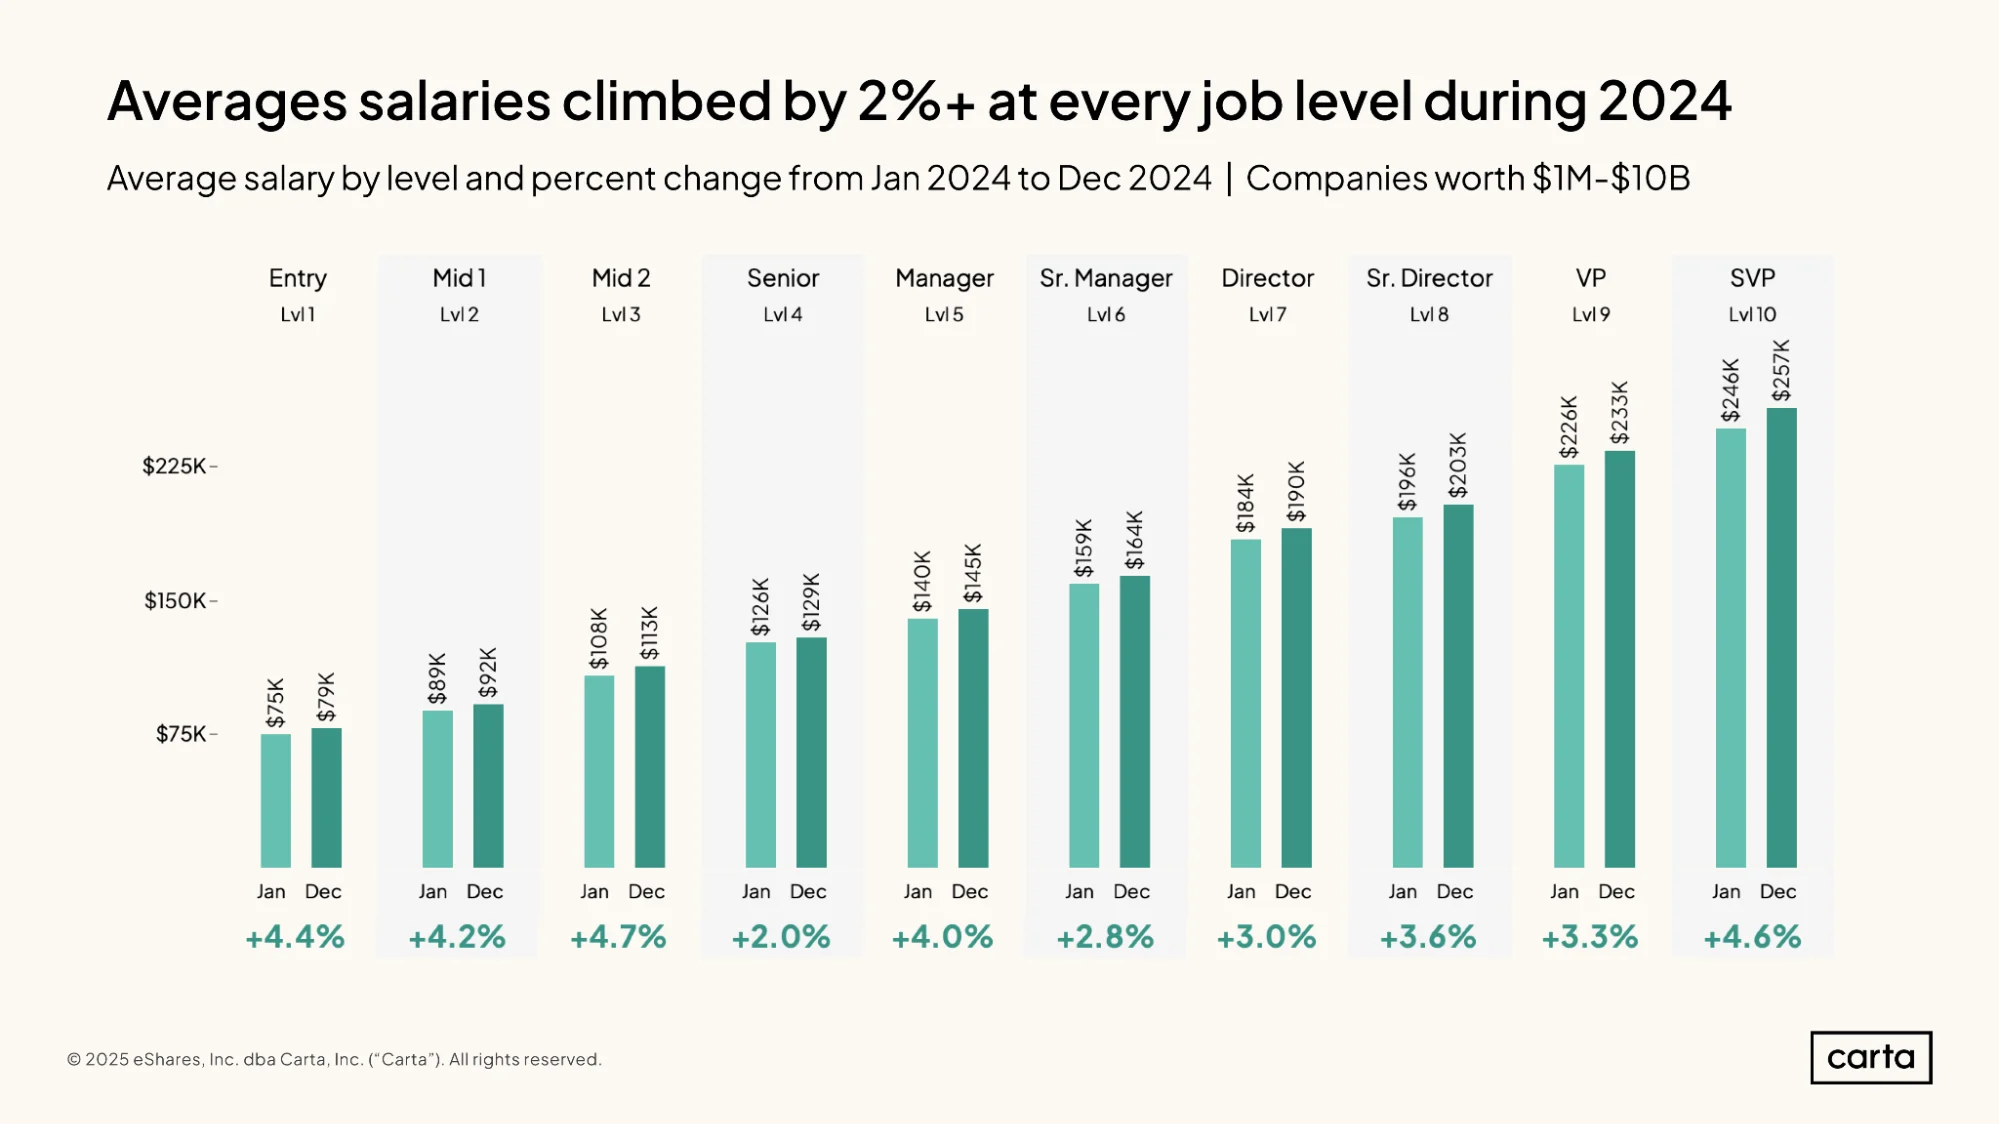
Across all job levels and across companies of all sizes, the average salary among new hires was higher in 2024 than it was in 2023.
Most job levels saw an increase of between 3% and 5%. In terms of percentage change, the biggest year-over-year increase came among the more experienced tier of mid-level employees, at 4.7%. In terms of dollars, the largest increase was with SVPs, where the average salary climbed from $246,000 to $257,000.
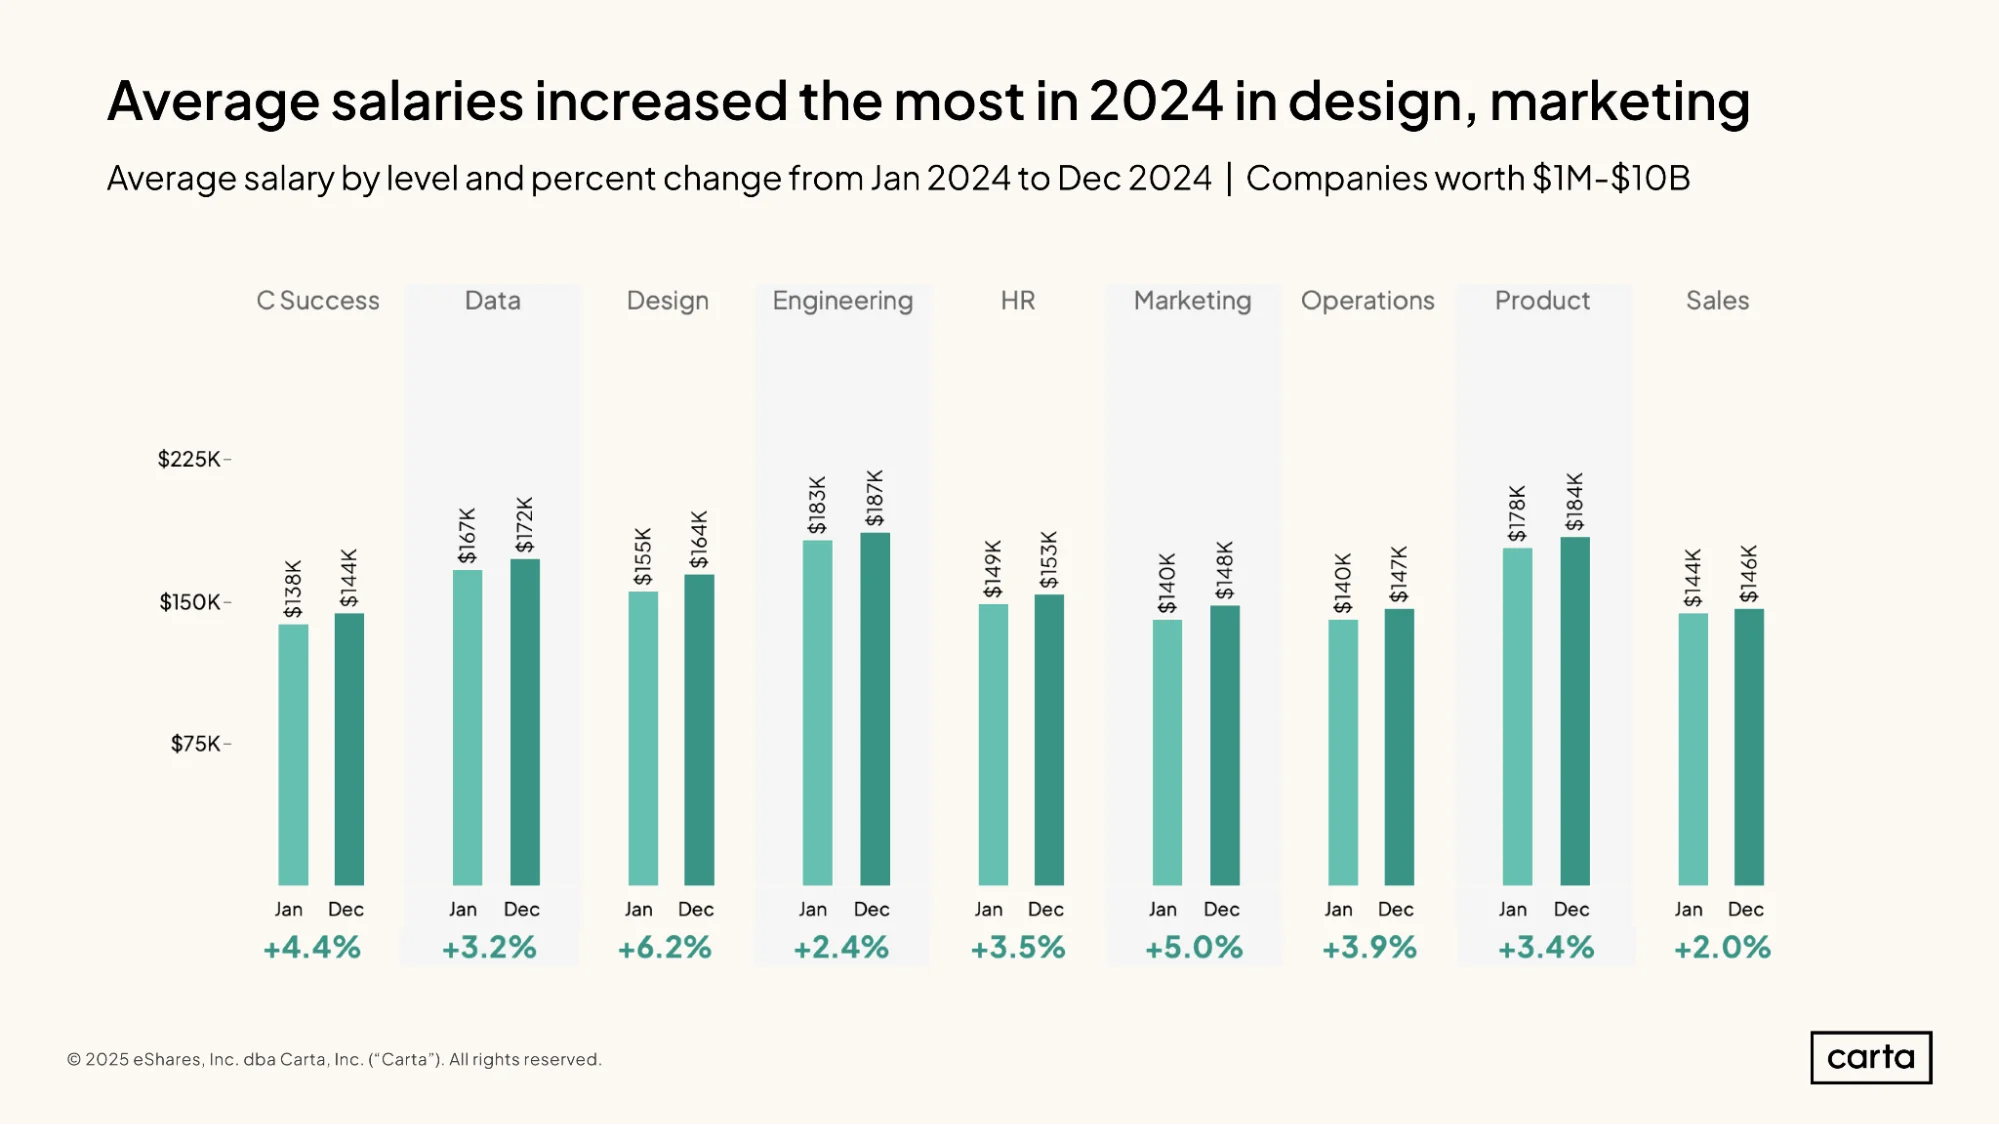
As is the case with different job levels, the average salary among new hires also increased last year across all job functions. The design function saw the biggest gains, with a 6.2% year-over-year increase, and marketing was next in line, at 5%.
The engineering function had the highest average salary last year of any function included above, at $187,000, followed by product, at $184,000. Customer success, marketing, operations, and sales all have average salaries below $150,000 in 2024. For sales roles, this figure (and all other salary figures in this report) refer to base salary only, not including commissions or any related bonuses.
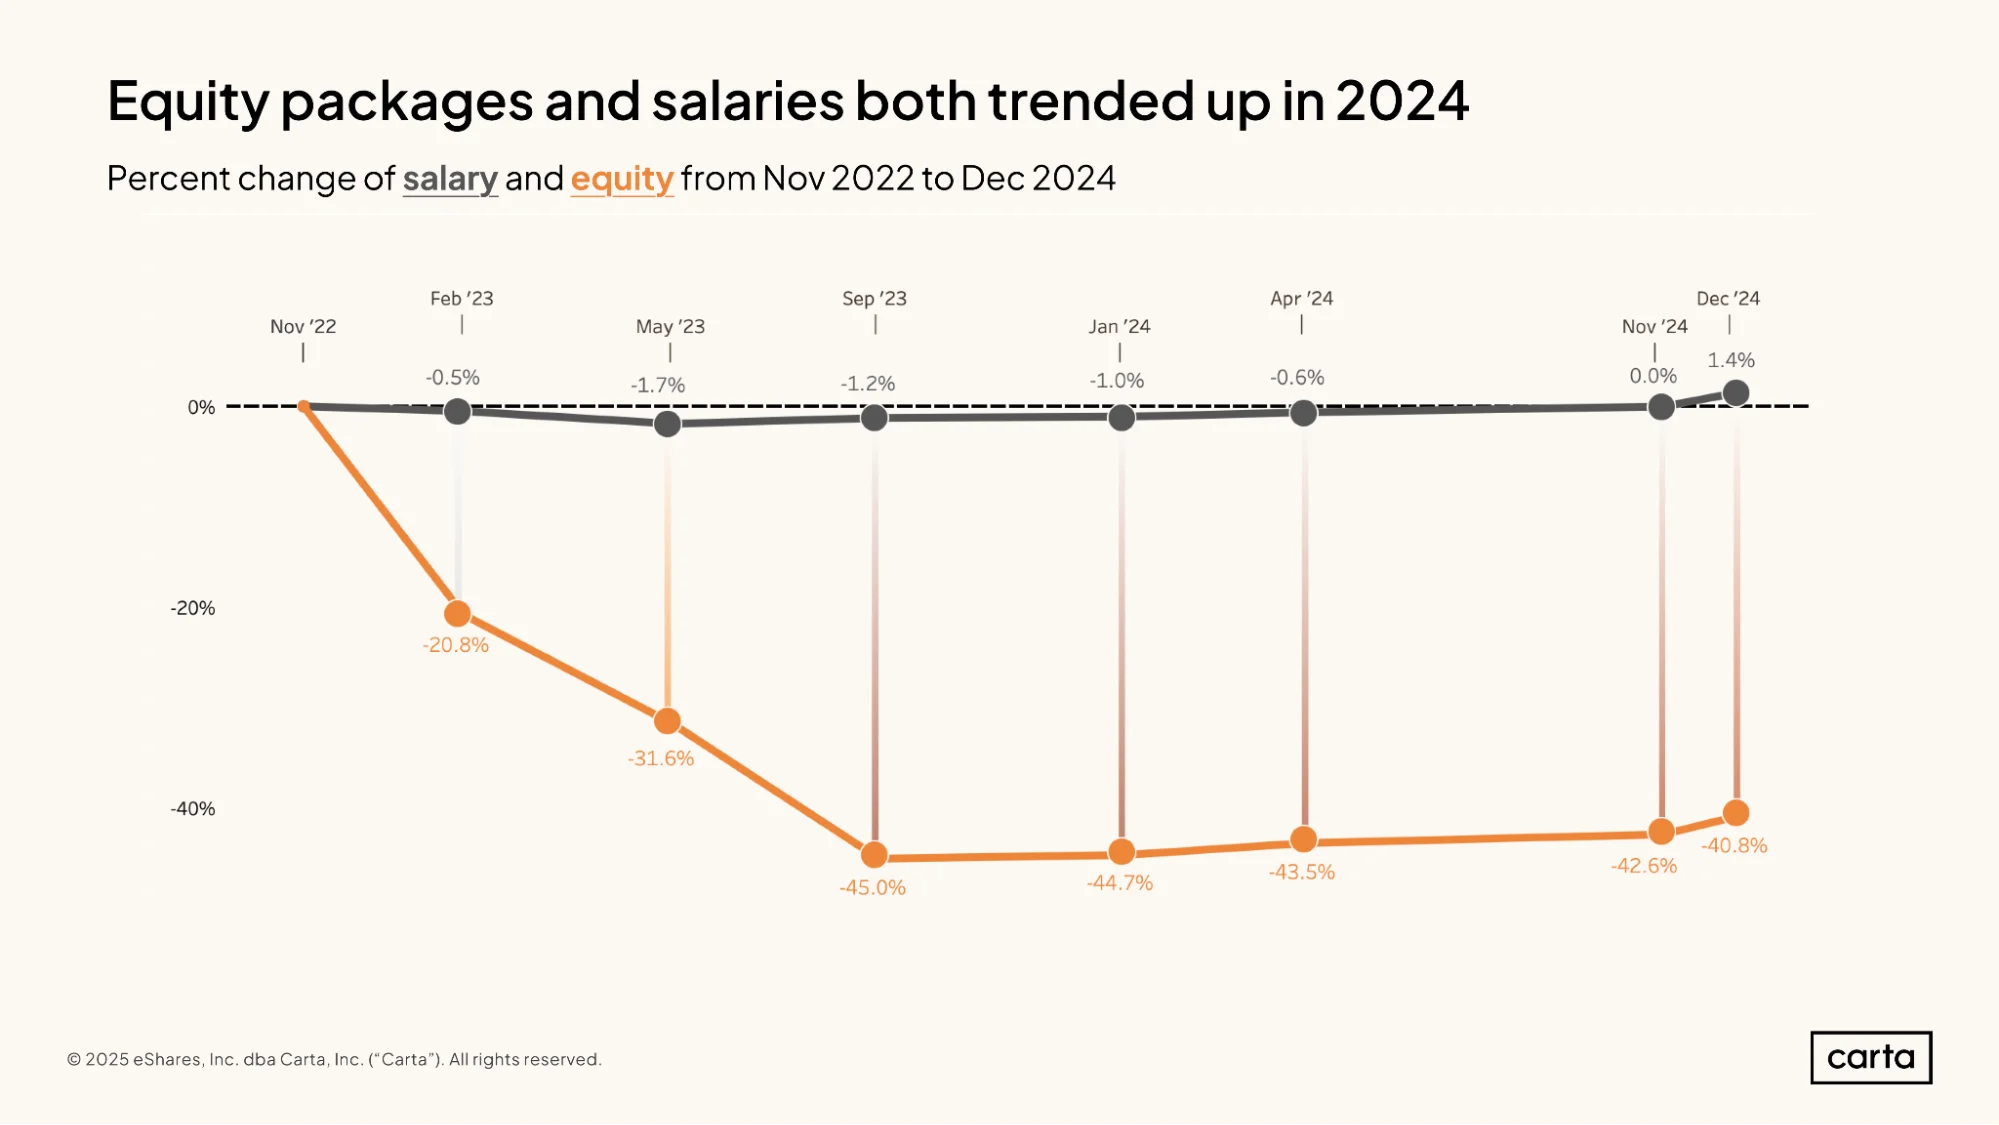
The size of the median equity package issued to new hires declined by 45% between November 2022 and September 2023, marking a sea change in the way startups compensate their employees.
Since then, the median equity package has once again started to grow, but not by much: The median equity package issued in December 2024 was still 40.8% smaller than it was back in November 2022. Ever since valuations began to sink with the market reset that occurred in 2022, equity has been a smaller part of the compensation equation for venture-backed startups.
While the median size of equity issuances plunged, median salaries have mostly held steady in recent years. Like with equity, though, a slight uptick occurred in December. As of year end, the median salary for new hires was 1.4% higher than it was back in November 2022.
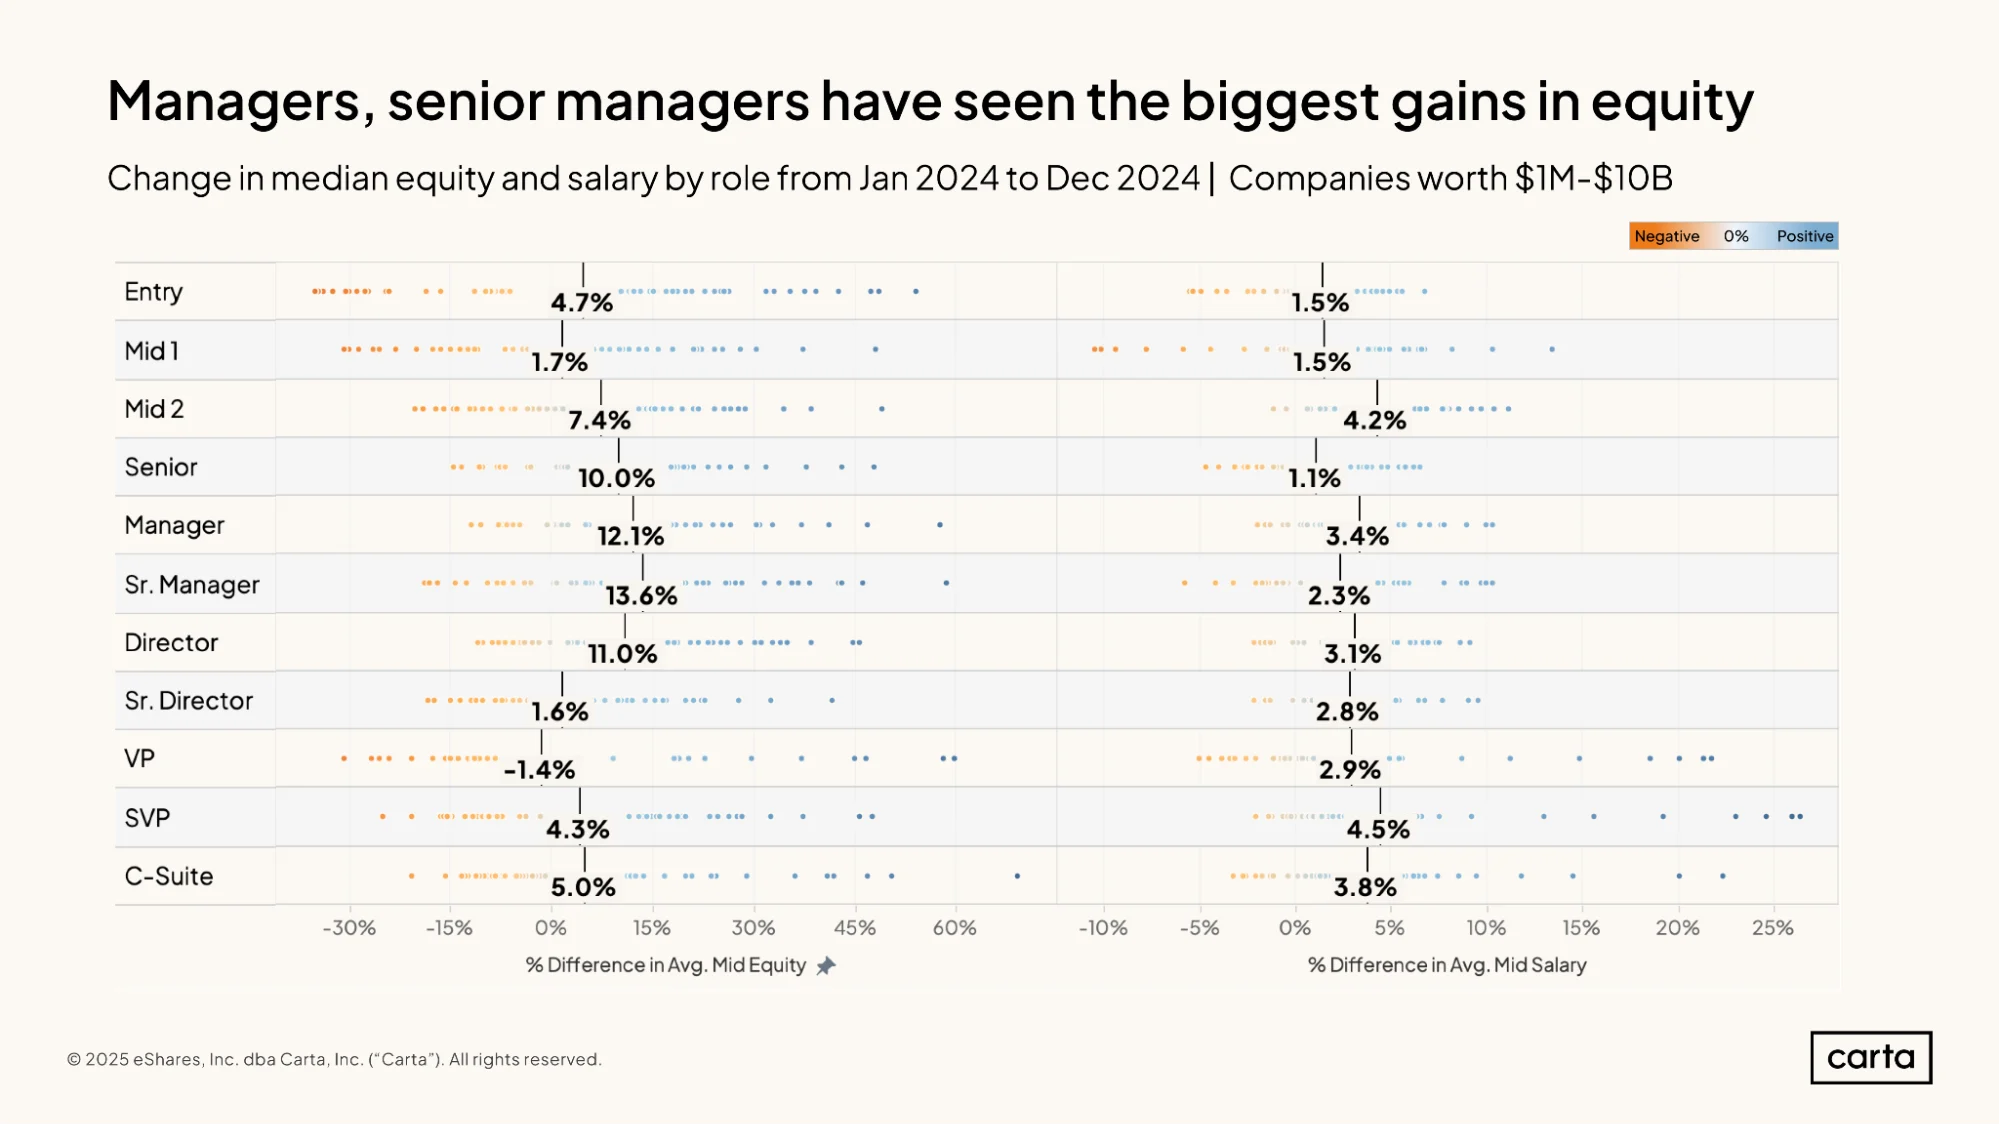
Over the course of 2024, median salaries increased across every job level. The biggest increase came among SVPs, where the median equity package for new hires was 4.5% larger in December 2024 than it was in January. The smallest increase was among senior-level individual contributors, who saw a 1.1% gain.
There was much more variety across job levels in how the size of median equity packages changed throughout the year. Some job levels—including senior-level ICs, managers, and senior managers—saw median equity packages increase by 10% or more. For VPs, on the other hand, the median equity package shrunk by 1.4% between January and December.
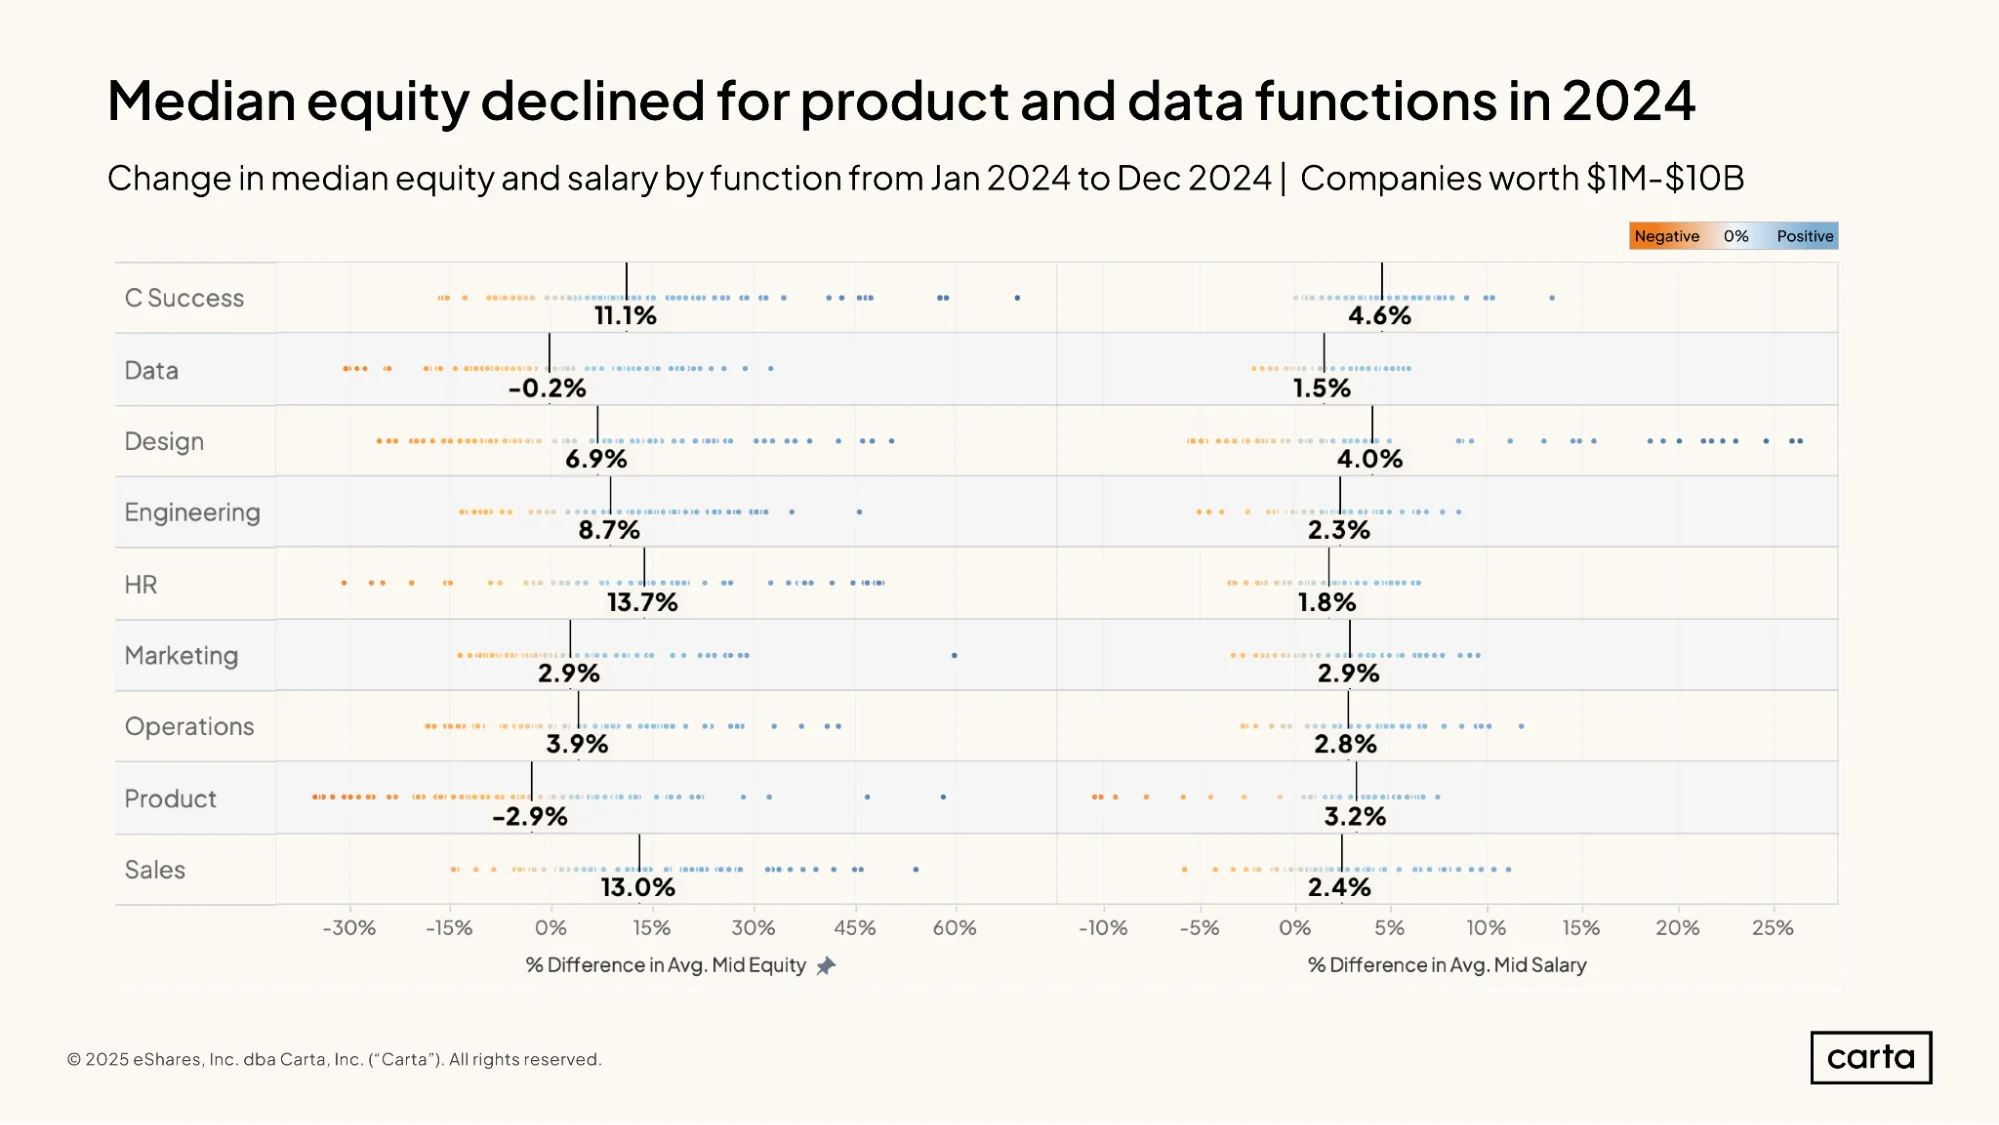
In terms of job function, the biggest increases in equity compensation for new hires over the course of 2024 took place in HR, sales, and customer success, all of which saw the median equity package increase by at least 10%. Conversely, median equity packages declined last year for new hires in data and product.
The customer success function also experienced the largest gains last year in terms of salary, with the median increasing by 4.6%. The job functions with the next-biggest increases in median salary were design, product, and marketing.
The following 4 slides were updated on June 24, 2025 to reflect 4-year equity grants.
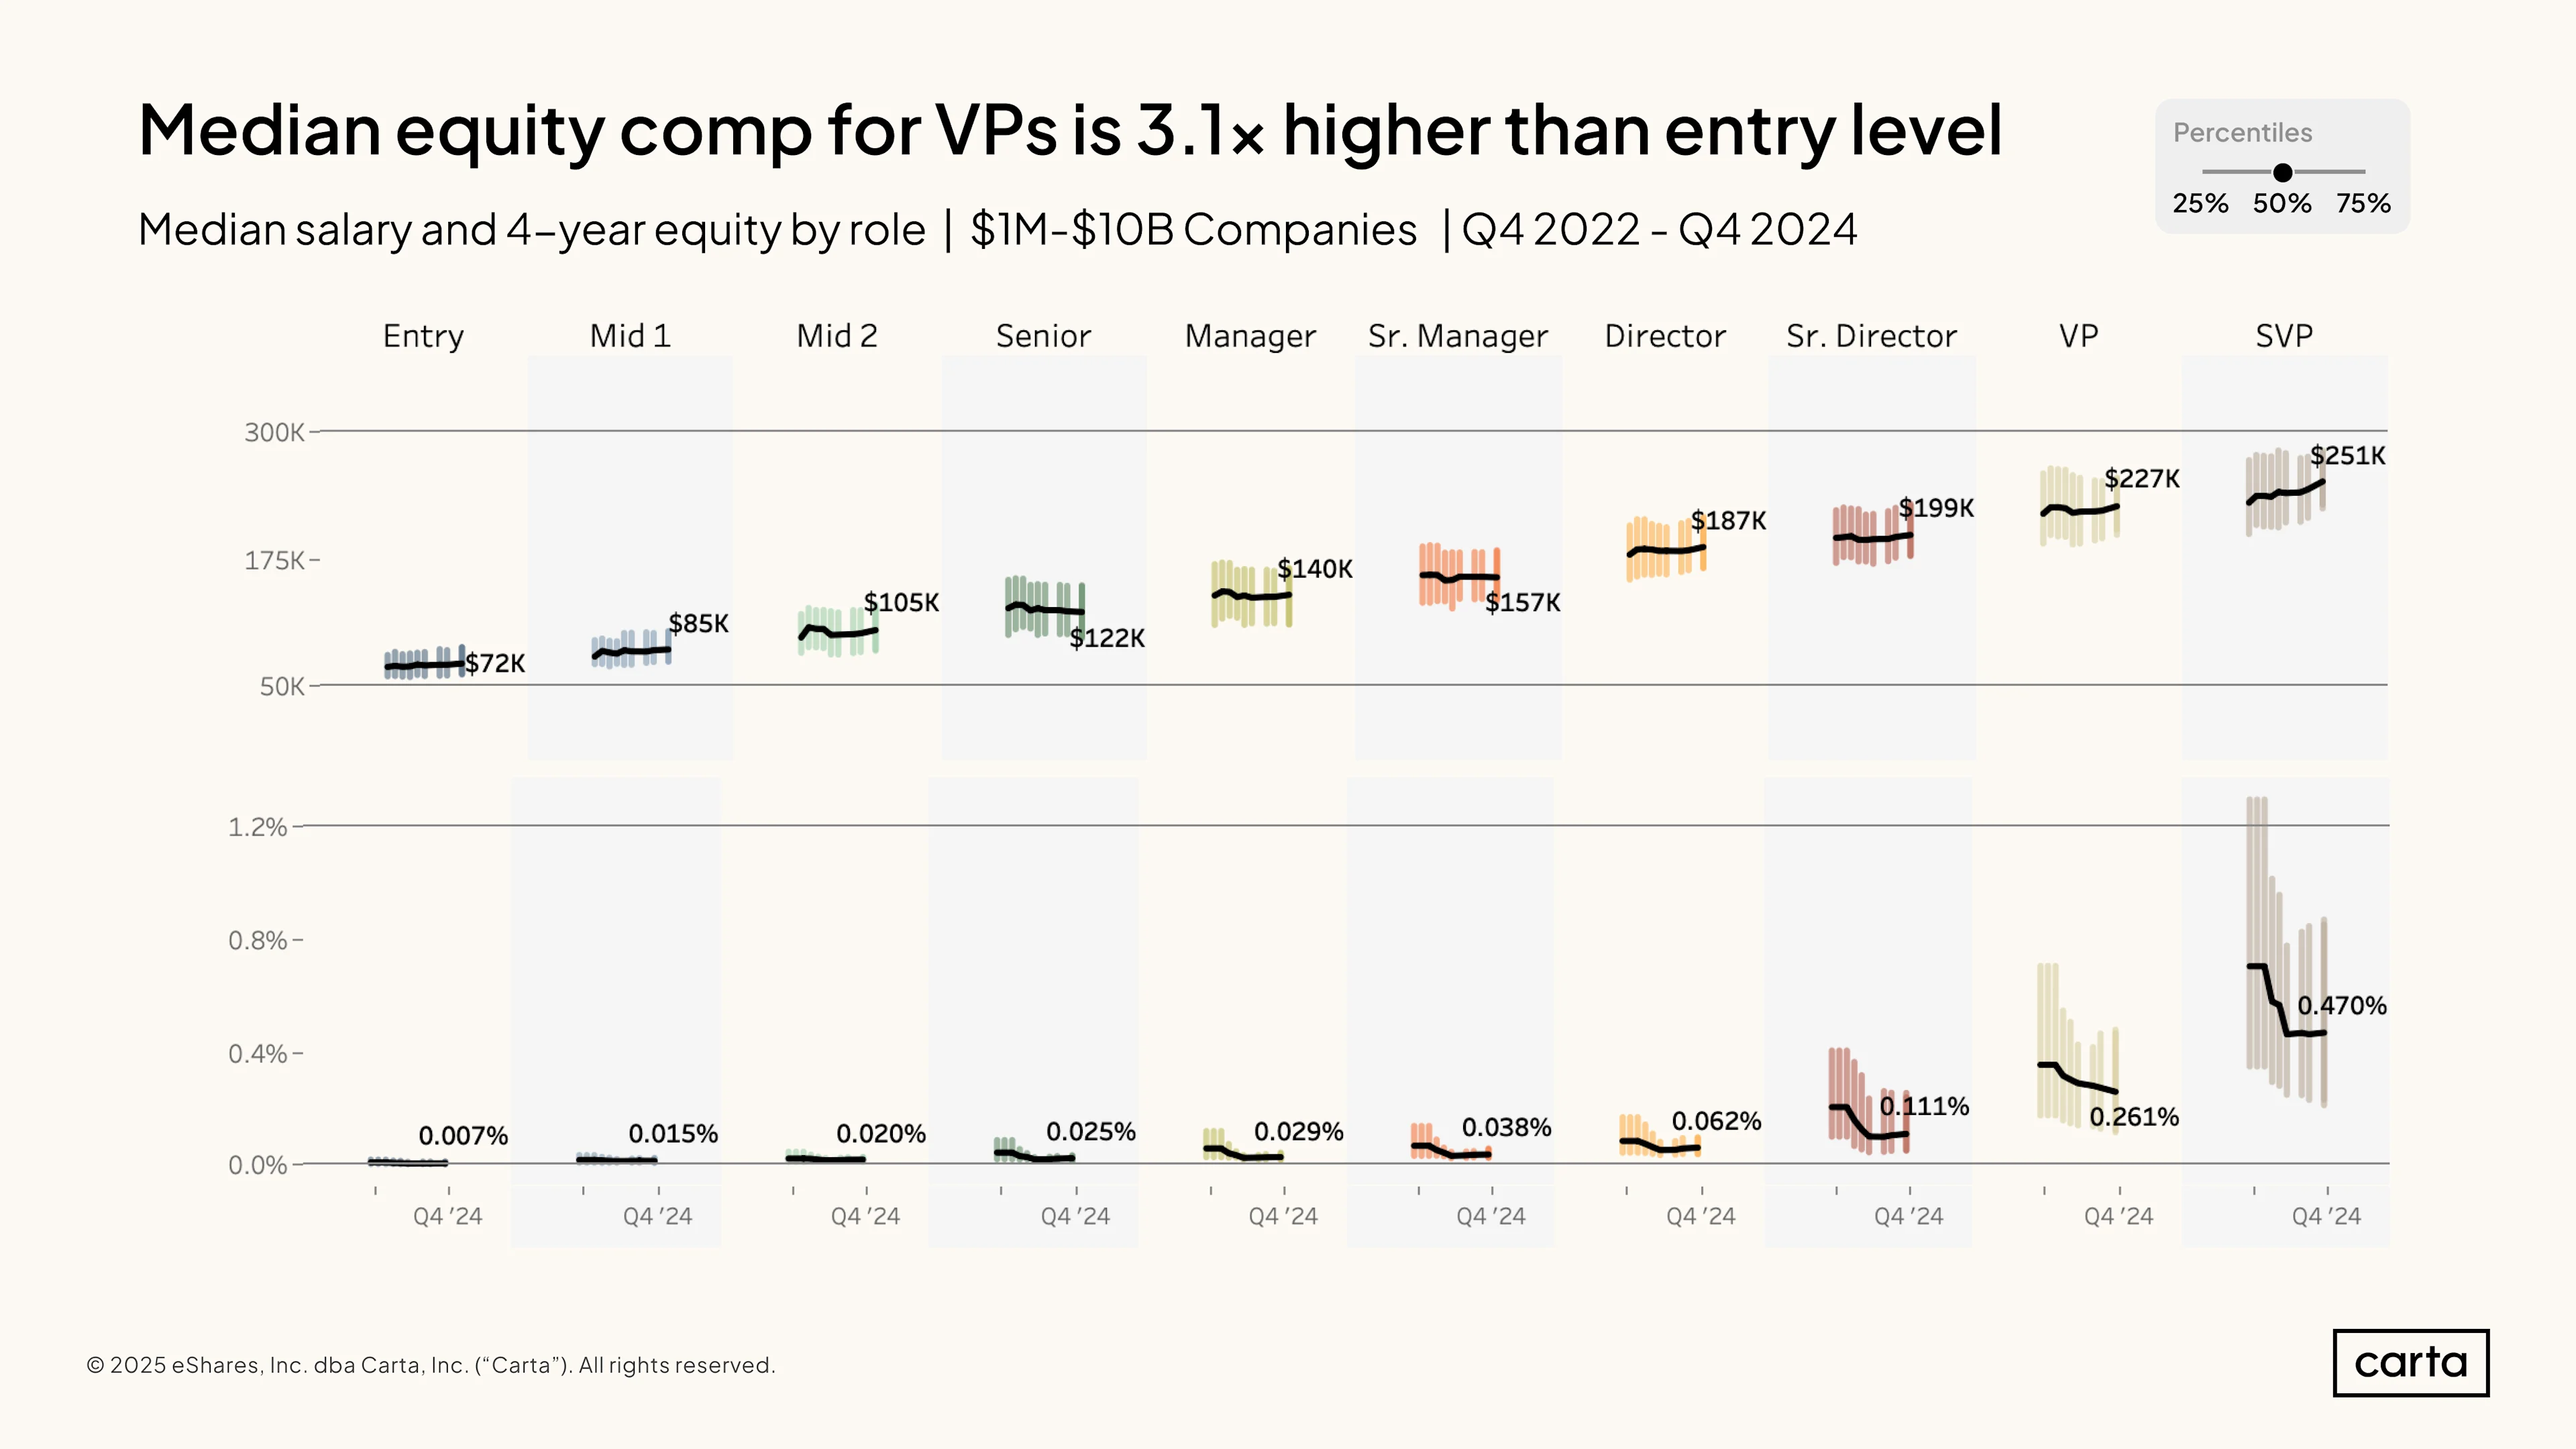
It’s typical for startup employees of all kinds to be compensated with some combination of salary and equity. Depending on the role, however, the combination can look quite different.
At the entry level, the median salary for new hires in Q4 2024 was about $72,000, and the median equity package comprised 0.007% of their employer’s issued shares. At the manager level, median salary was $140,000 in Q4, and median equity was 0.72%. For SVPs, the median package is $251,000 in salary and 0.470% of the company’s equity.
There’s far more variation in equity compensation across different job levels than there is in salary. For instance, the median salary for SVPs is about 3.5x larger than the median salary for entry-level employees, while the median equity package is about 70x larger among SVPs than in entry-level roles.
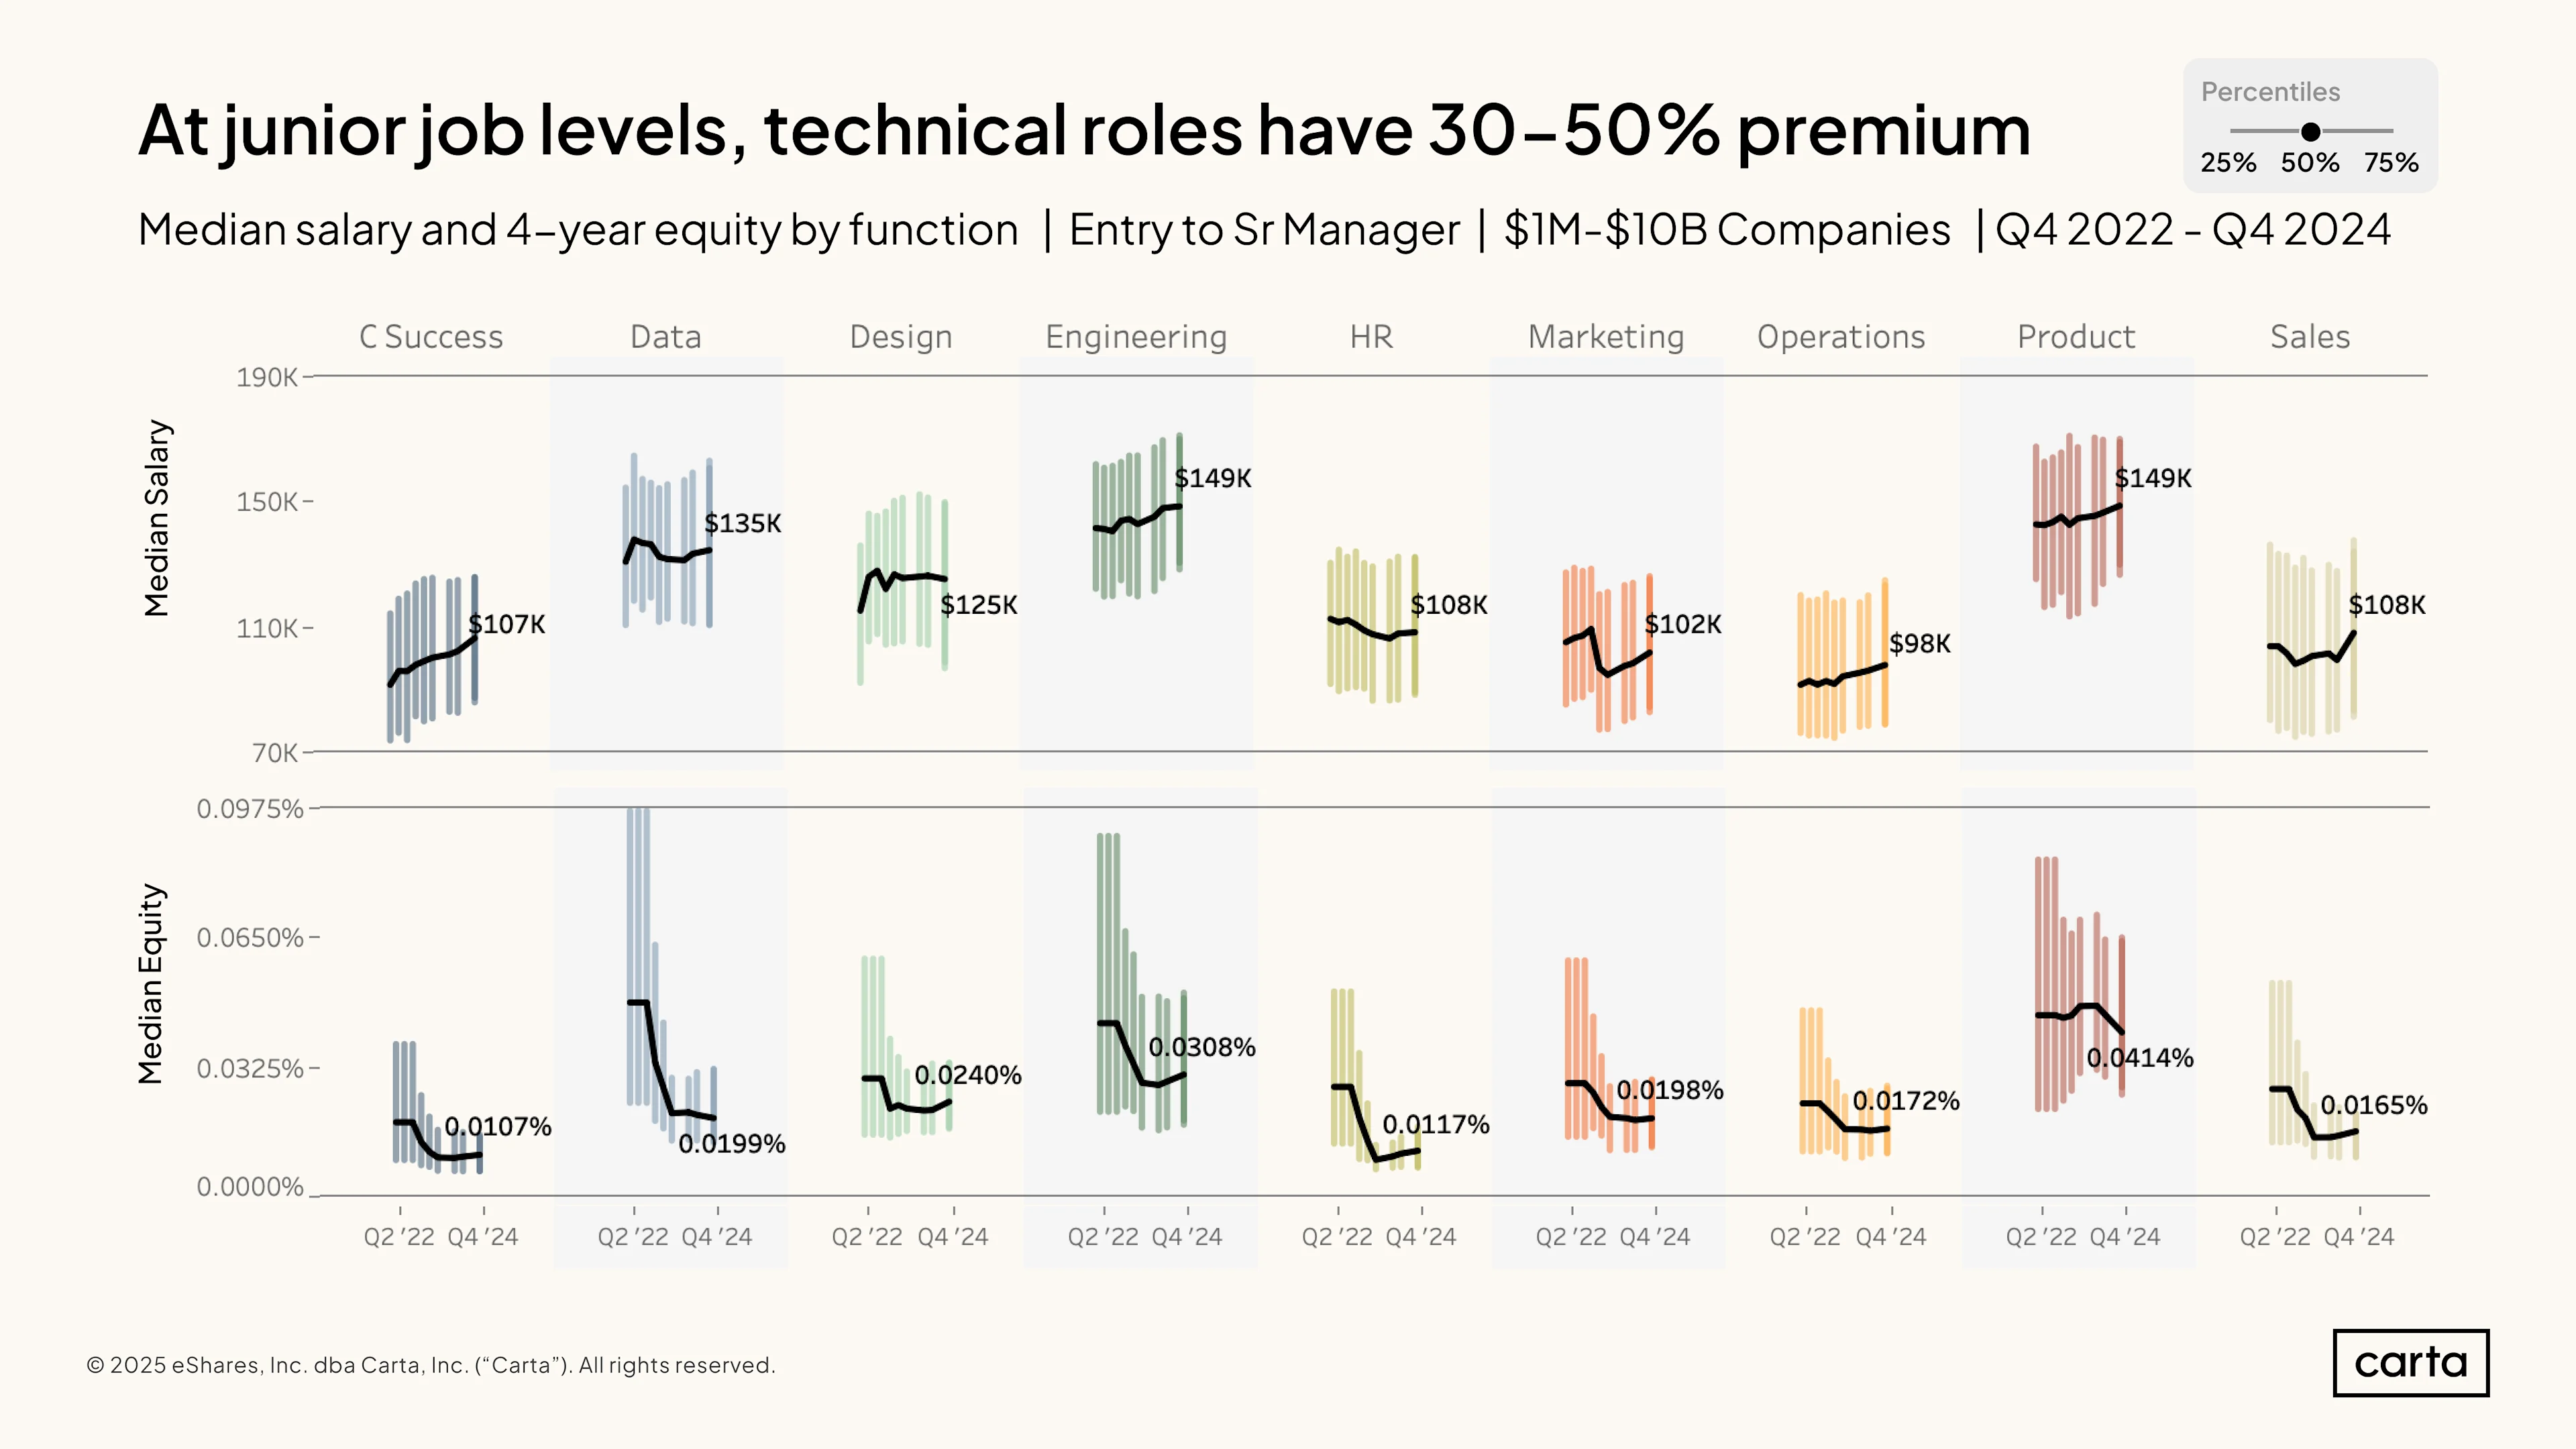
Across job levels ranging from entry-level roles to senior managers, product and engineering are tied for the highest median salary at $149,000. In some other job functions, salaries at these lower levels of the org chart are much lower. The median salary in this sample in operations, for instance, is $98,000.
Equity grants at these job levels can also vary significantly by function: The median equity grant is more than 3x larger in product than it is in sales or customer success. Over the past two years, equity grants have declined significantly in many job functions, particularly at the 75th percentile. Engineering and data have experienced some of the steepest drops.
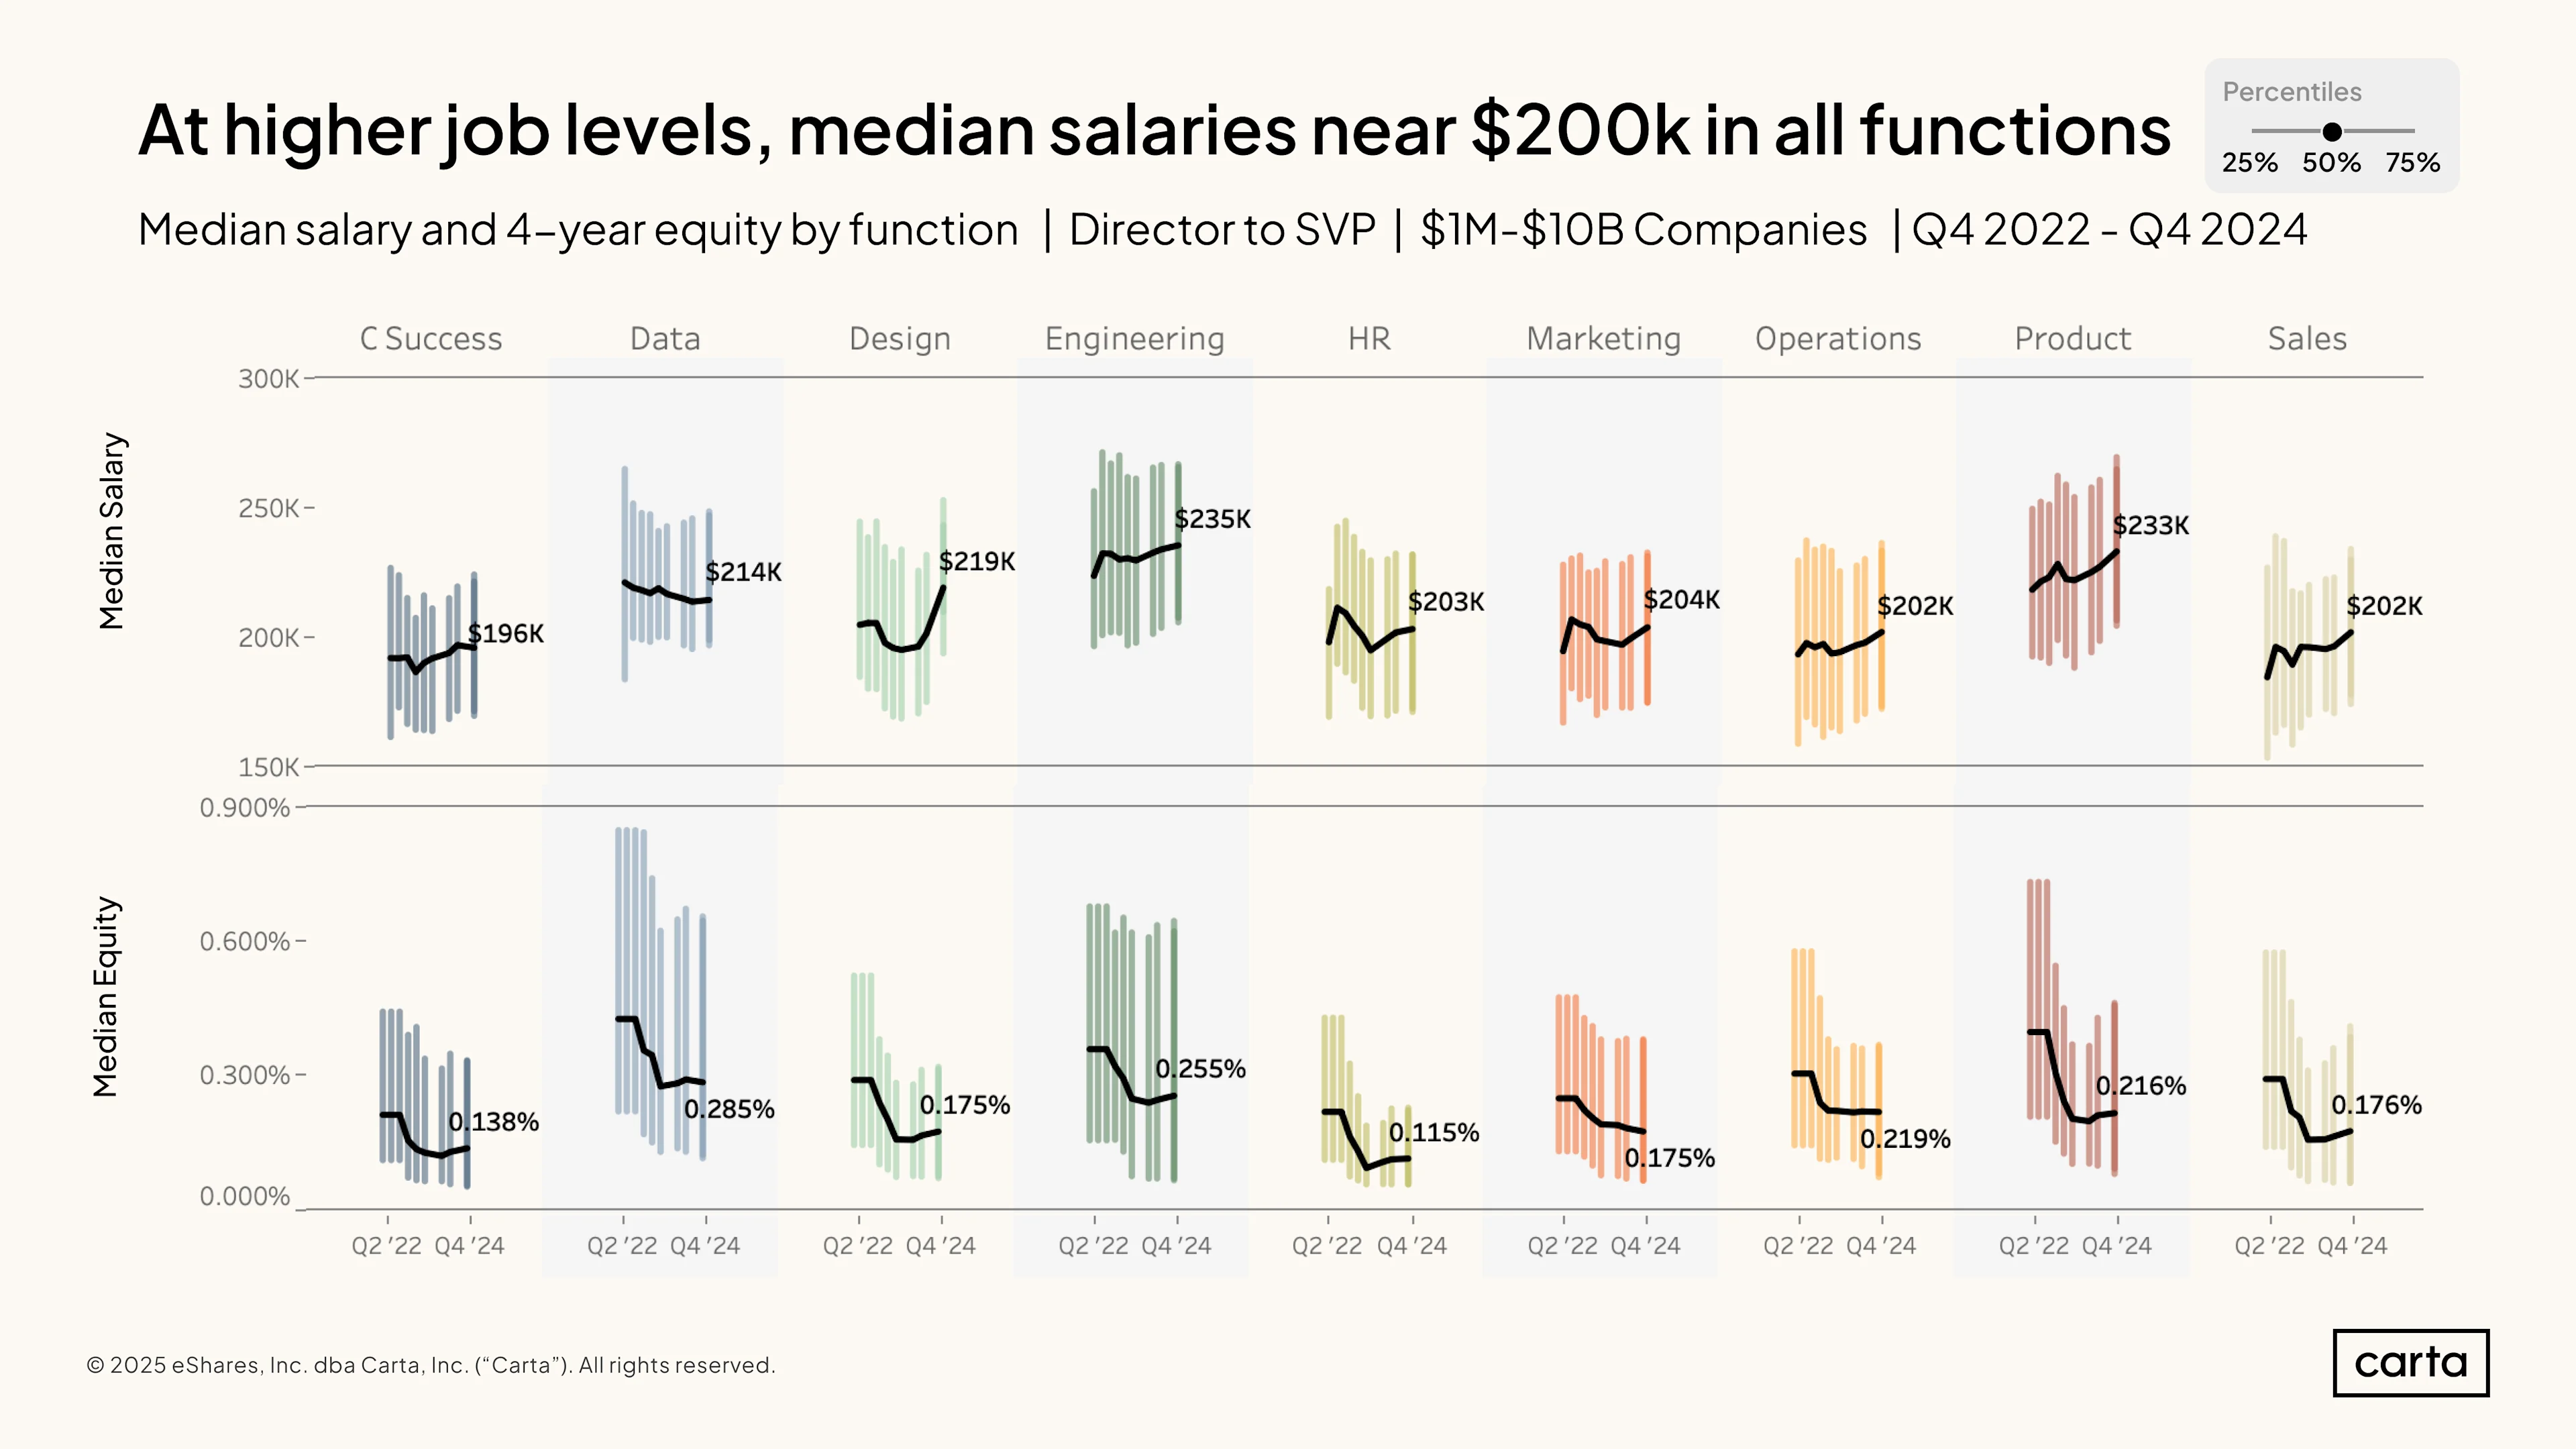
At higher-ranking job levels—ranging from directors to SVPs—median salaries and median equity grants tend to be a little more similar across job functions. With the exception of customer success, median salaries range from $202,000 to $235,000, and there are no 3x differences in the size of median equity grants, like there are in lower job levels.
High-ranking employees in engineering and product tend to command the highest salaries, as is the case among lower-ranking employees. In terms of equity, median grants are the largest in data and engineering. At the top end, high-ranking employees in data receive the largest grants: The 75th percentile for equity grants in data is more than 20%, higher than any other sector.
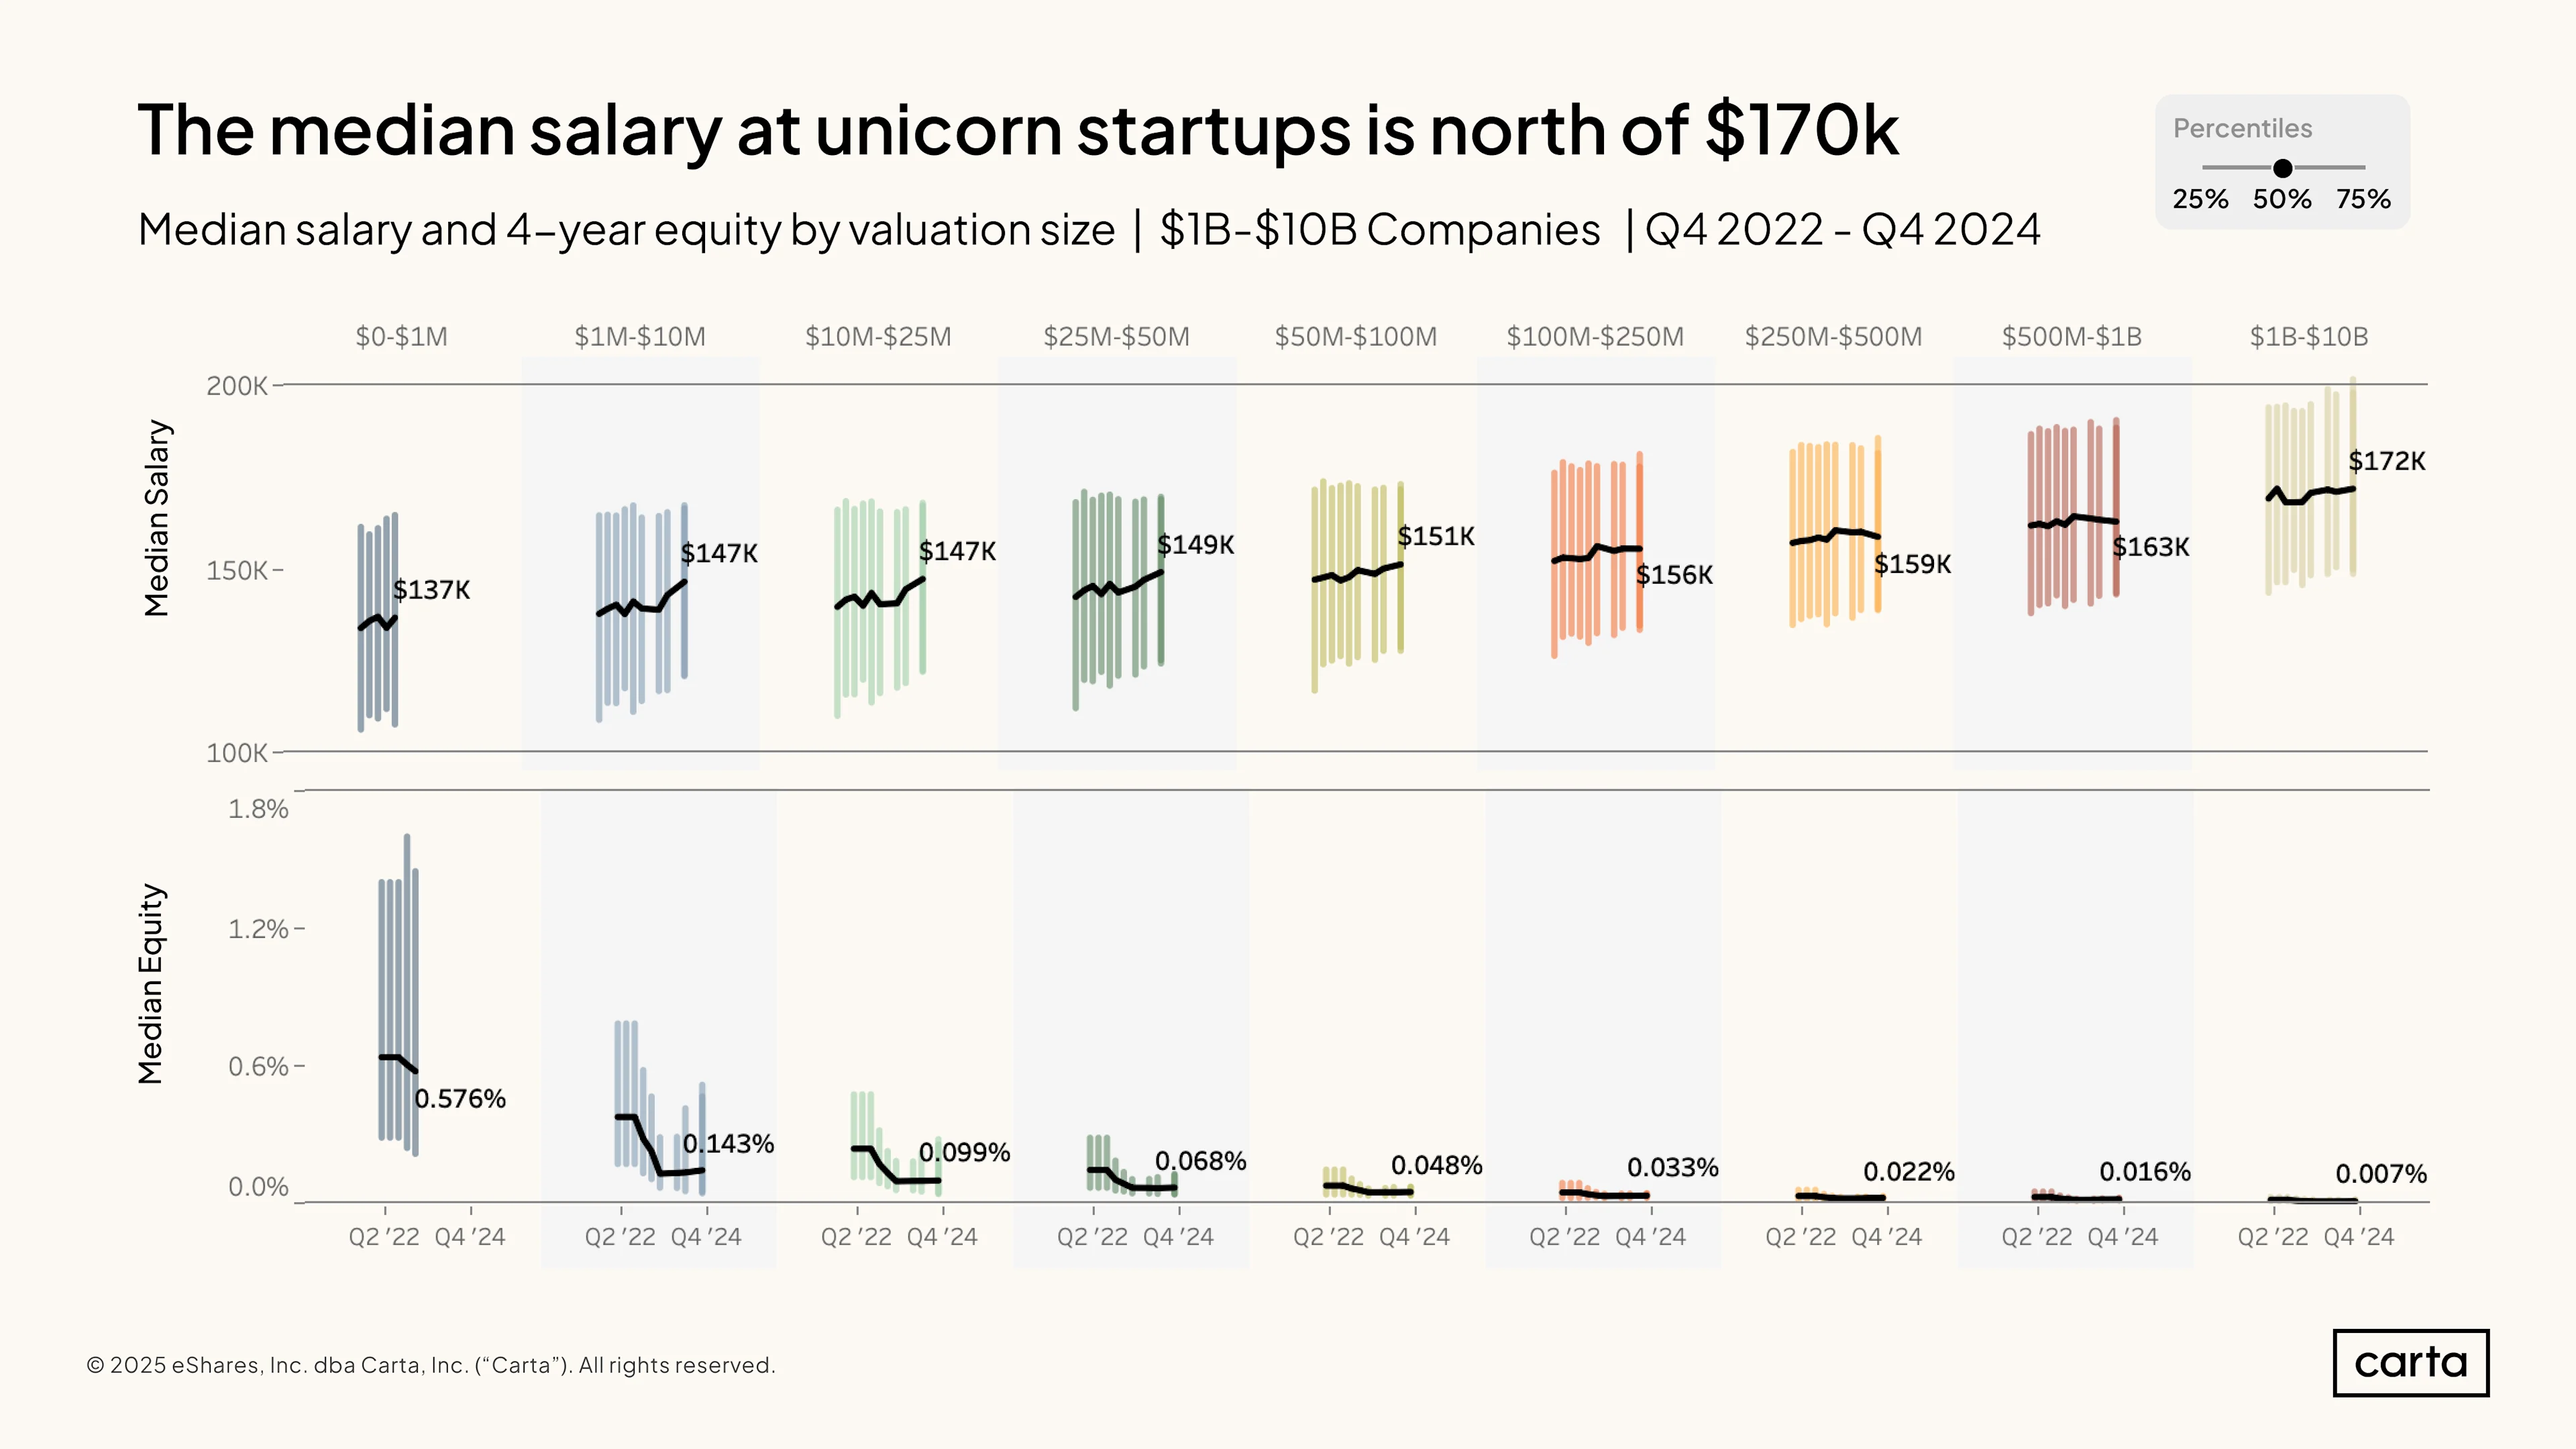
As startups get more valuable, the salaries of their employees tend to rise. Across all functions and job levels, the median salary paid by startups with a valuation of $1 million to $10 million is $147,000, compared to a median of $172,000 for startups valued between $1 billion and $10 billion.
Measured as a percentage of the startup’s total equity, the median equity package also declines as startups get more valuable. However, this is a case of employees getting a smaller piece of a much, much bigger pie.
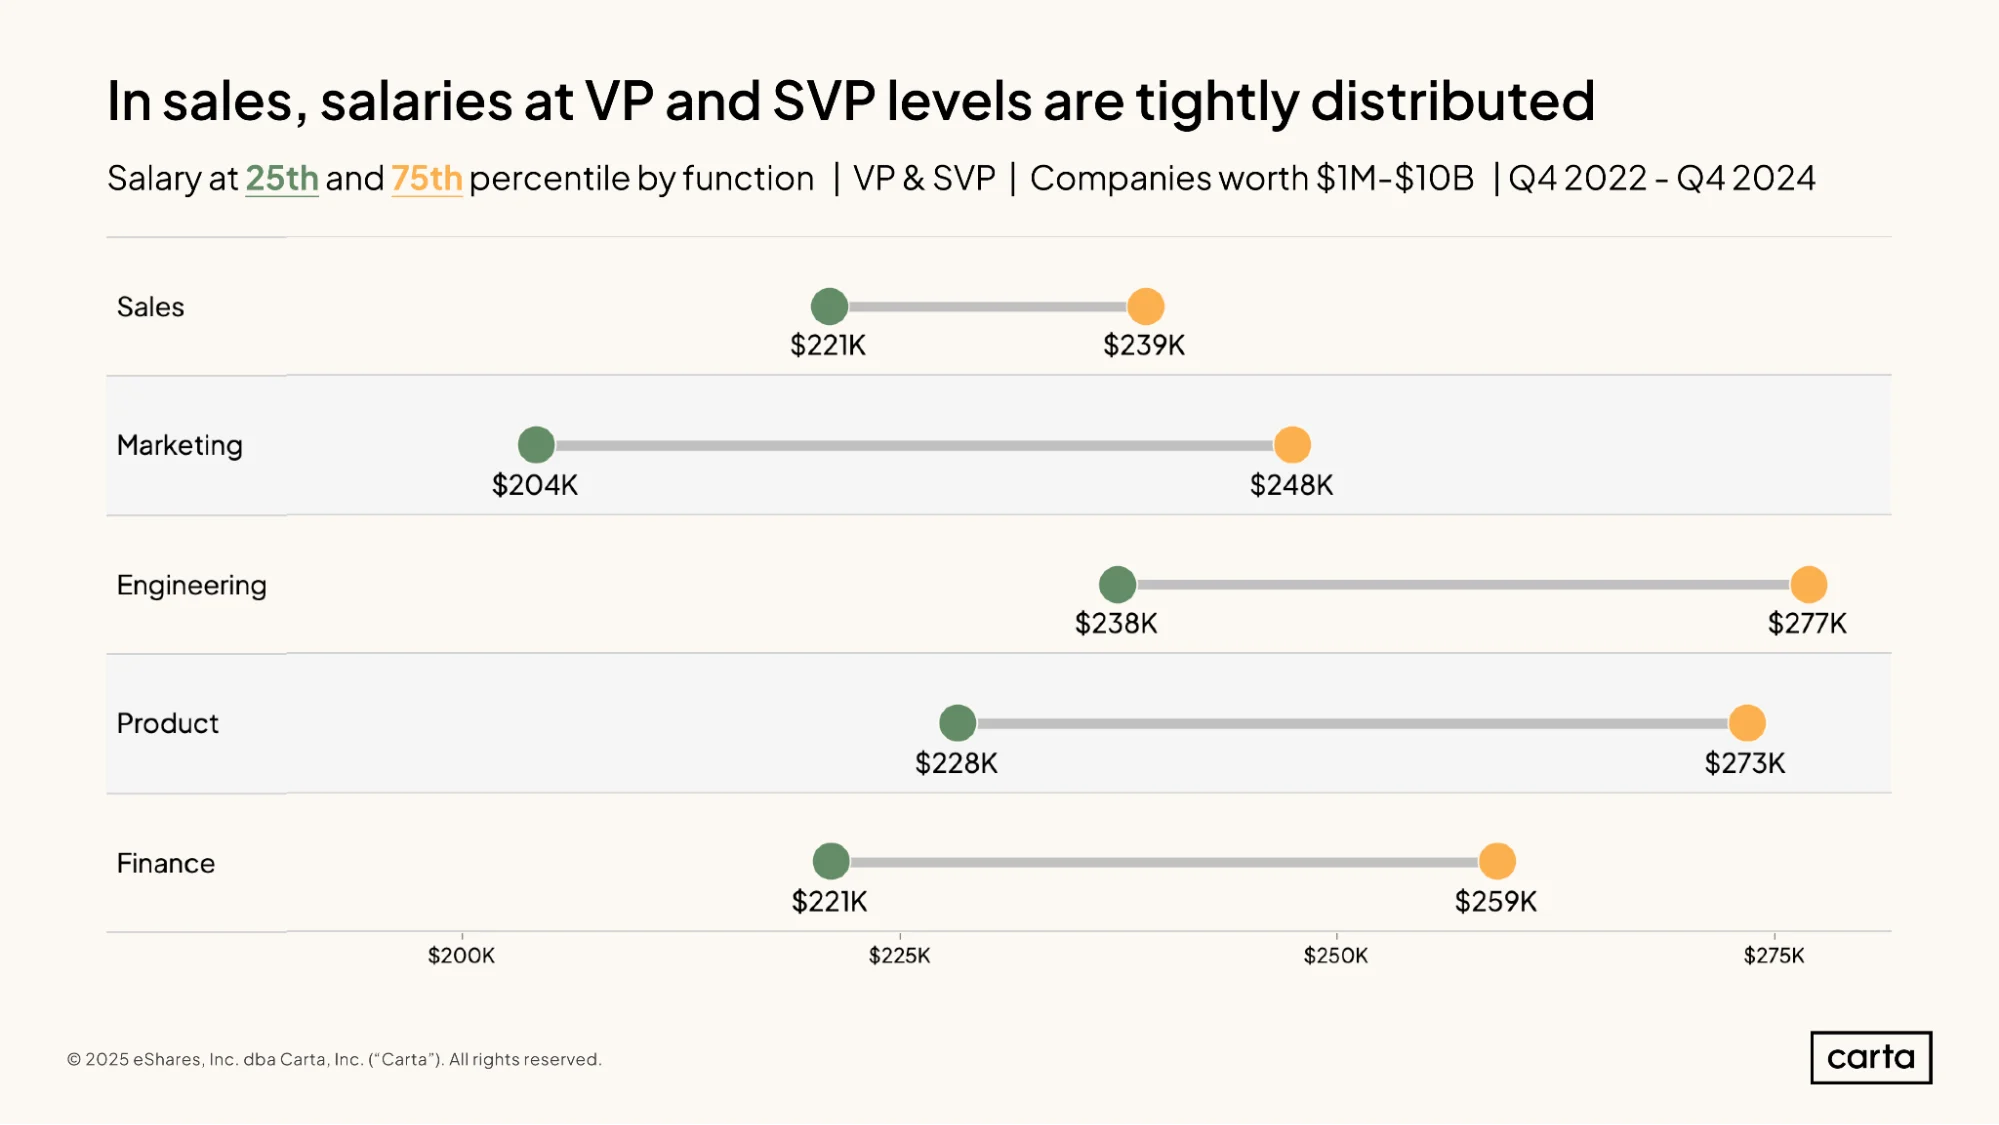
In the sales job function, the 25th percentile salary for employees at the VP and SVP job levels is $221,000, and the 75th percentile salary is $239,000. Half of all salaries for sales VPs and SVPs fall within this range.
In other common job functions, this middle 50 percent of salaries is disbursed over a broader range, indicating more variability in salaries among VPs and SVPs. In marketing, the gap between the 25th and 75th percentile salaries is about $44,000, compared to $18,000 in sales.
VPs and SVPs tend to earn the highest salaries in engineering, with product close behind. The 25th percentile of salaries in engineering ($238,000) is almost equal to the 75th percentile of salaries in sales ($239,000).
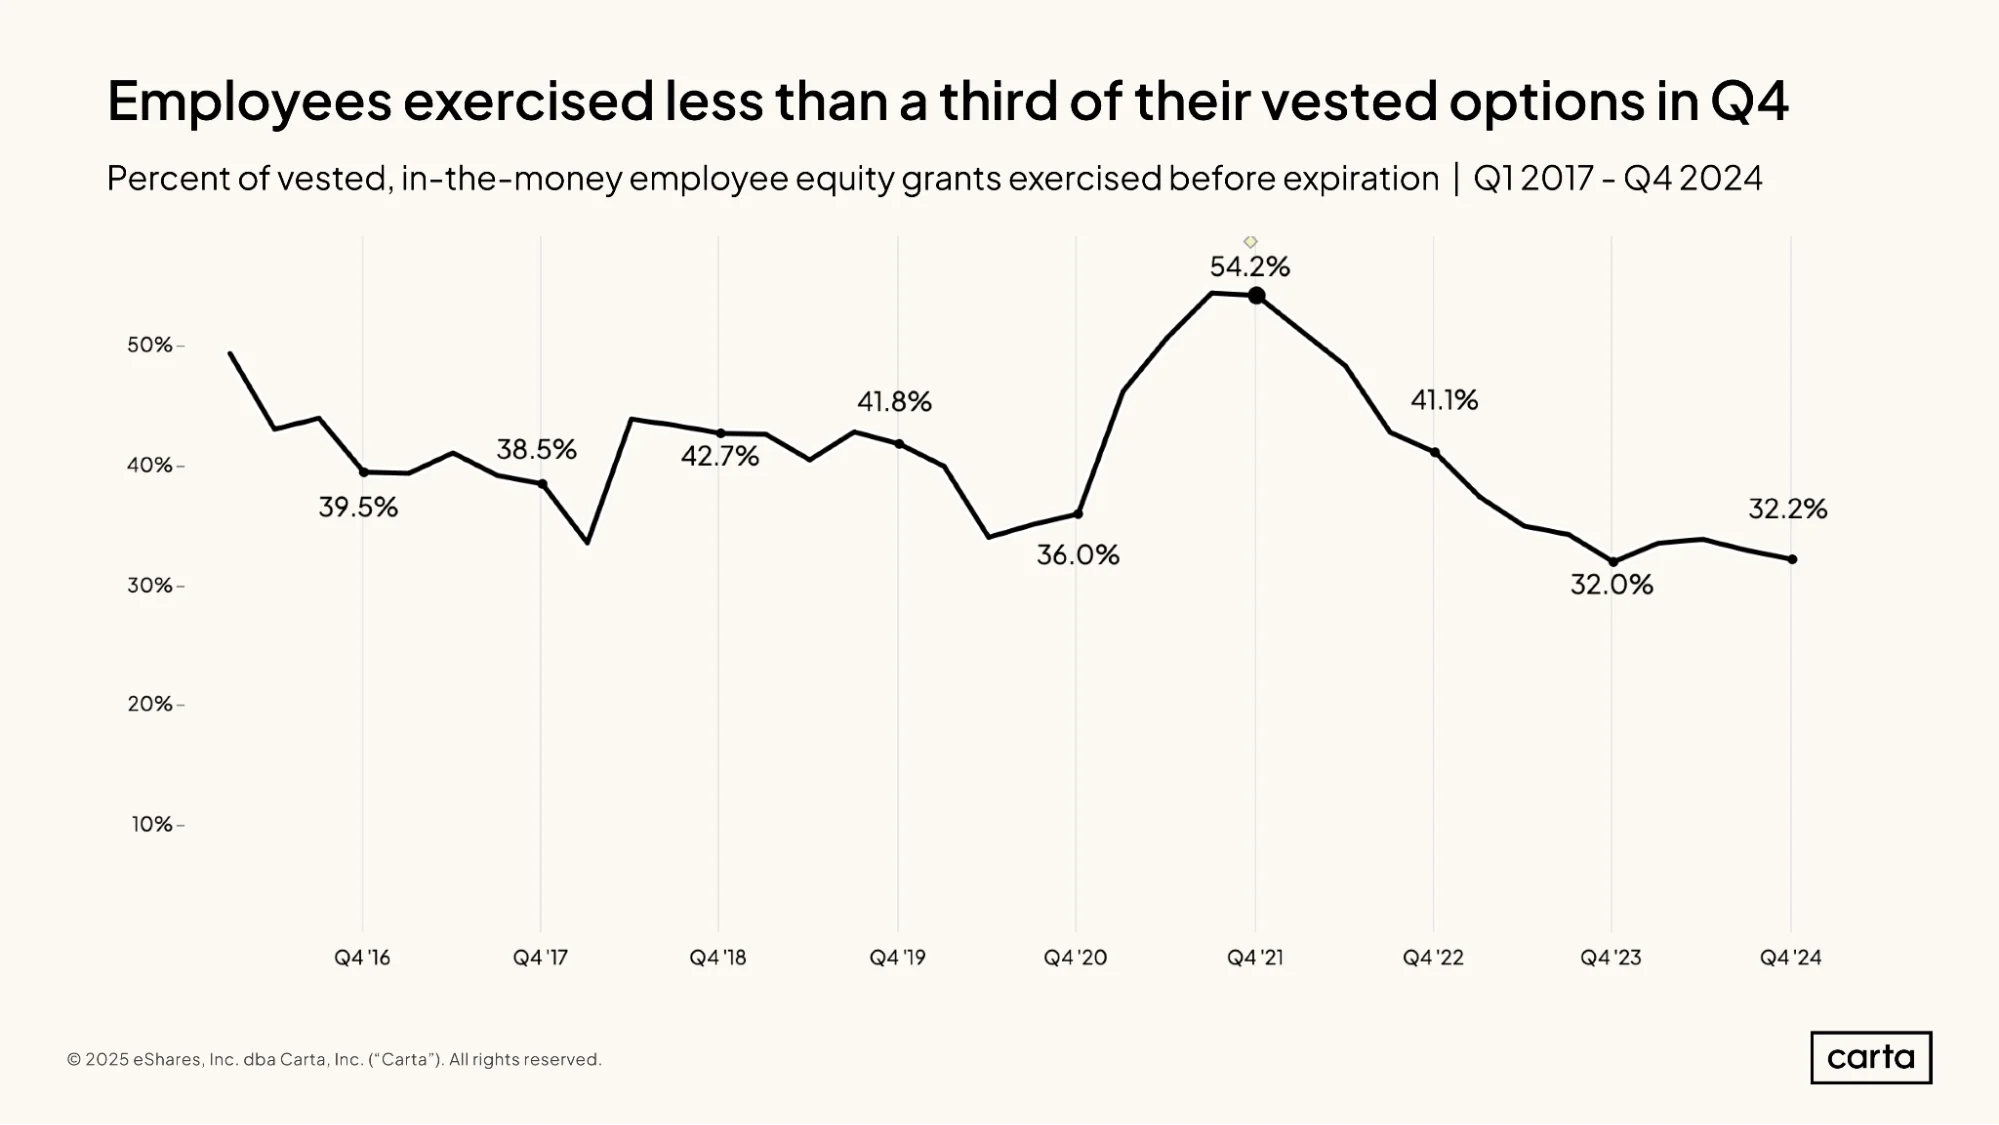
Between Q4 2021 and Q4 2023, the percentage of vested, in-the-money stock options that startup employees chose to exercise dipped from 54.2% to 32%. With valuations falling across much of the venture-backed economy, many employees decided that acquiring these vested shares (and paying the associated taxes) was no longer a wise financial decision.
The exercise rate rose slightly during the first half of 2024, but it again declined in Q3 and Q4, finishing the year flat. These lower exercise rates are likely one of the reasons that the typical size of equity packages has declined in recent years: If employees are less interested in exercising options, then those options start to look less appealing as potential compensation.
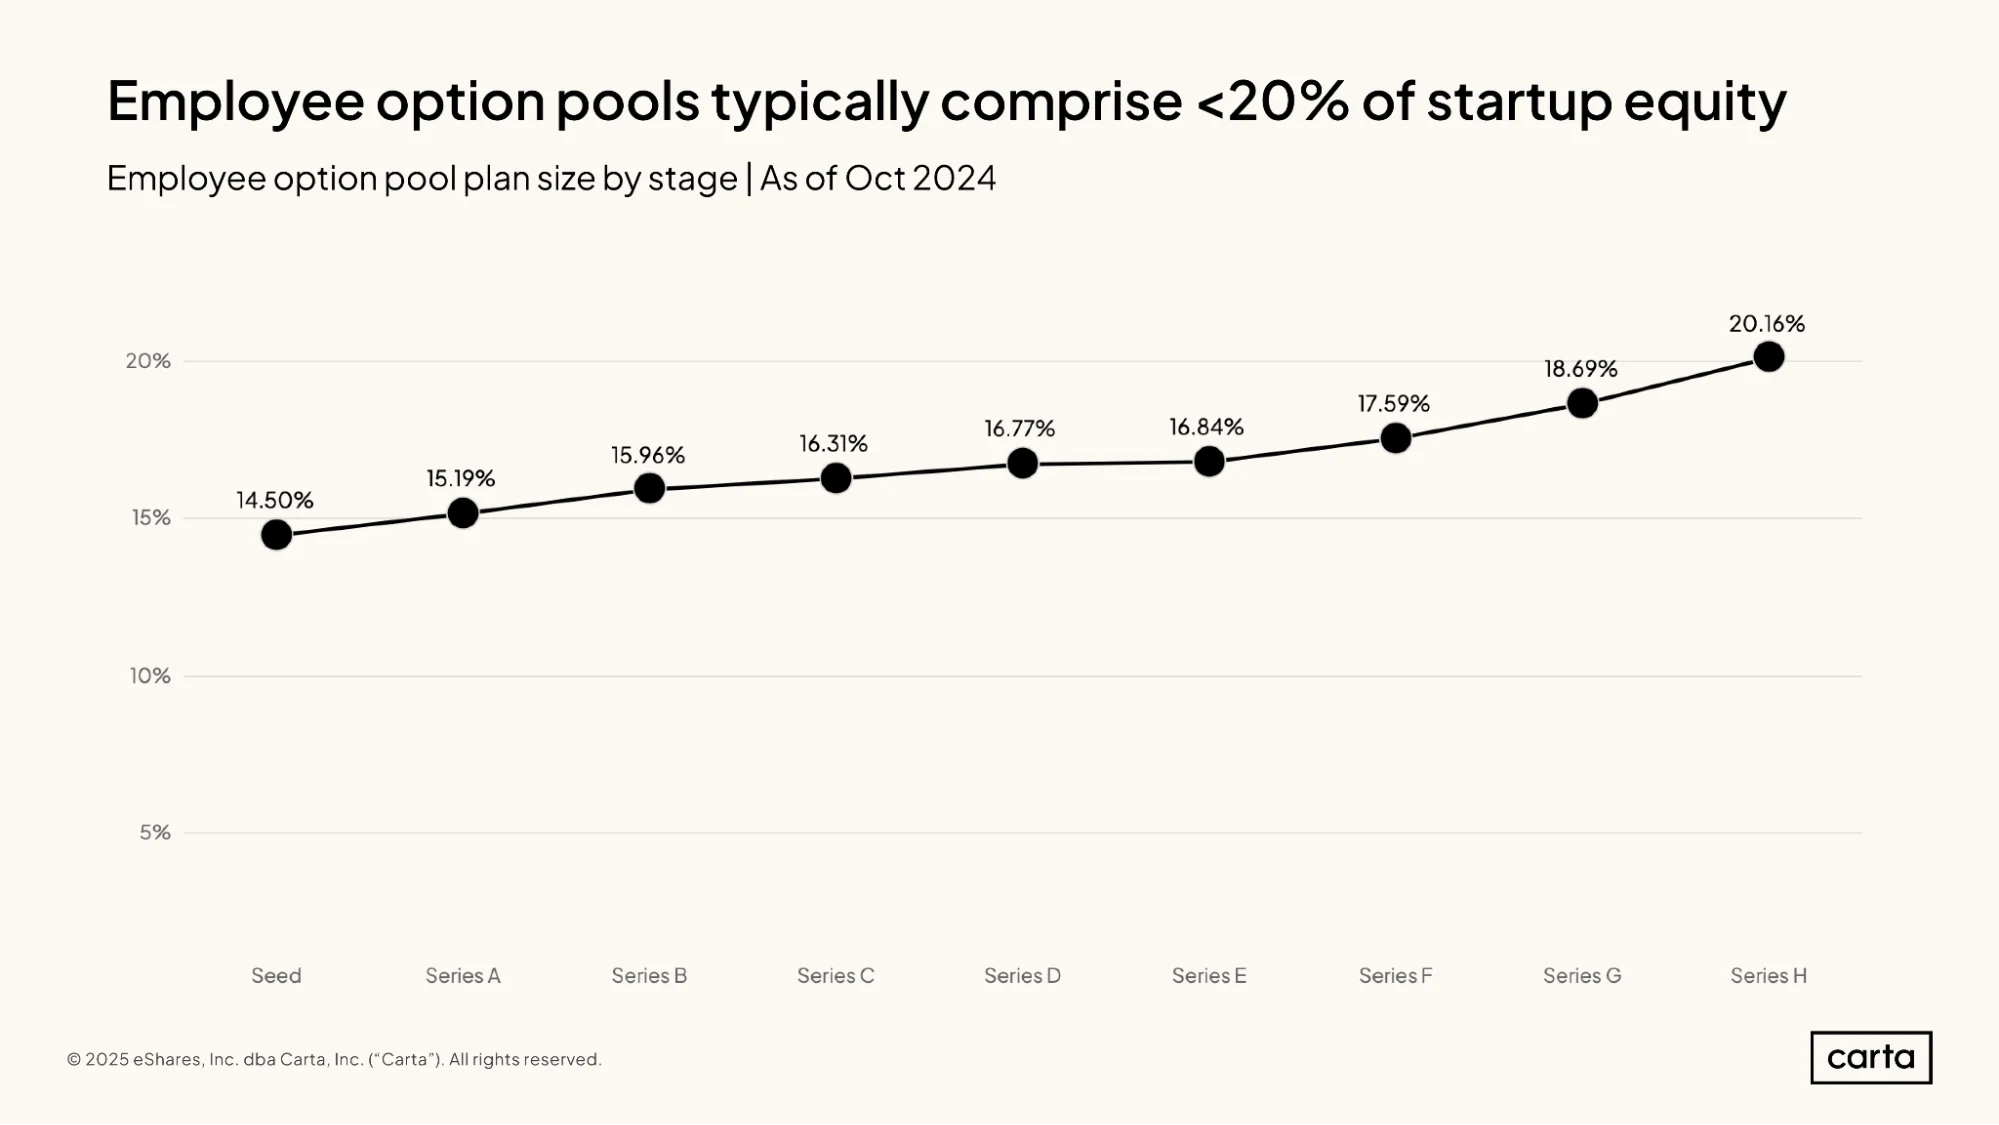
Calculated as a percentage of a startup’s total equity, the typical size of employee option pools typically increases steadily as the company progresses through various fundraising stages. But these increases are relatively small. The difference in median option-pool size between seed startups and Series F startups, for instance, is just about three percentage points.
Of course, since the typical startup’s valuation increases as it moves through funding stages, the overall value of the typical employee option pool also increases. The proportion of a company’s equity that is set aside for employees may not change much as time goes on; in other words, the slice of the pie stays roughly the same. But in most cases, as time goes on, the size of the pie gets quite a bit bigger, which can create new equity ownership opportunities for employees and other key stakeholders.
Methodology
Overall dataset
This report comes from thousands of CTC customers with over 800,000 current salary and equity data points used by Carta Total Compensation. Other metrics in the report, such as those that describe employee movement, derive from the aggregate pool of more than 1 million employees currently working for the 53,000 startups that use Carta to manage their cap tables.
The data presented above represents an aggregated, anonymized view into the compensation practices of these startups. Companies that have contractually requested that we not use their data in anonymized and aggregated studies are not included in this analysis.
This report represents a snapshot as of March 4, 2025. Historical data may change in future studies. New companies signing up for Carta’s services will increase the amount of data available for the report.
Salary & equity
All salaries presented in this report are expressed in U.S. dollars. Except where indicated, total payroll numbers do not include any variable compensation, such as bonuses or commissions, that may be given to employees.
All equity values presented in this report are expressed as a percentage of fully diluted company shares.
In the sections on salary and equity trends, changes over time reflect updates to Carta Total Compensation bands. These benchmarks are updated once per quarter to incorporate newly hired employee data as well as any adjustments to current employee compensation.
Geo adjustments
Metro area comparisons use BLS (Bureau of Labor Statistics) data as a foundation as well as Carta Total Comp models to fine tune the output. Figures are adjusted annually.
Download the Full Report


DISCLOSURE: This communication is on behalf of eShares, Inc. dba Carta, Inc. ("Carta"). This communication is for informational purposes only, and contains general information only. Carta is not, by means of this communication, rendering accounting, business, financial, investment, legal, tax, or other professional advice or services. This publication is not a substitute for such professional advice or services nor should it be used as a basis for any decision or action that may affect your business or interests. Before making any decision or taking any action that may affect your business or interests, you should consult a qualified professional advisor. This communication is not intended as a recommendation, offer or solicitation for the purchase or sale of any security. Carta does not assume any liability for reliance on the information provided herein. © 2026 Carta. All rights reserved. Reproduction prohibited.