This is the first in a series of Carta posts on the ownership graph.
Let’s say you start a company called Meetly. You hire employees and raise money from investors. A few years in, Meetly’s ownership might look like this:
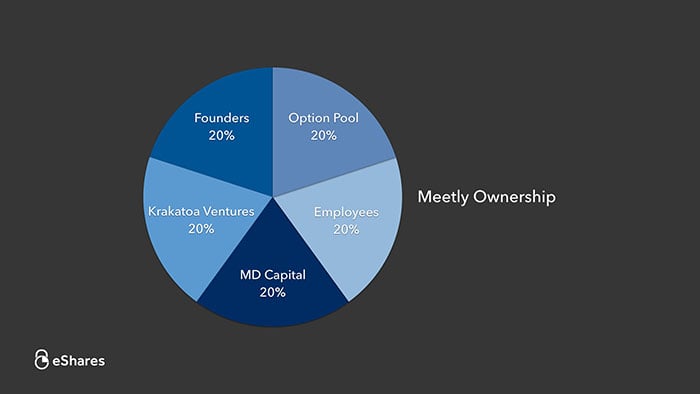
Let’s take a closer look at investor Krakatoa Ventures.
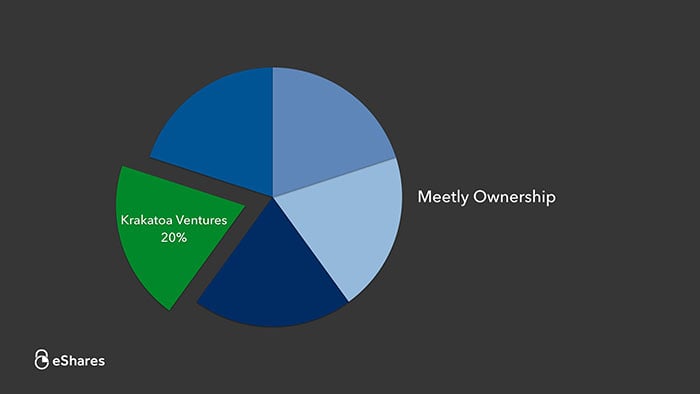
Krakatoa Ventures is the name of the venture capital firm, but the firm isn’t a legal entity. The entity that owns 20% of Meetly is called a fund.
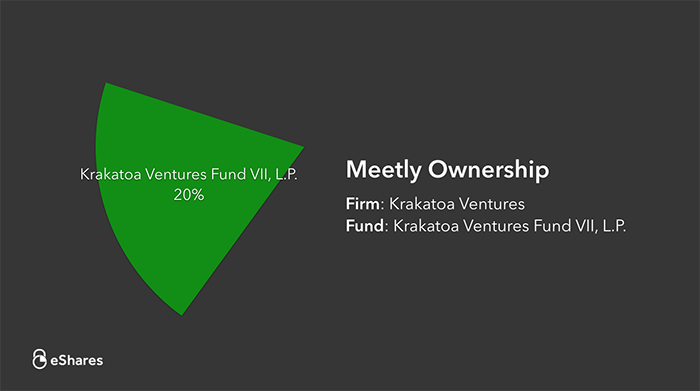
Krakatoa Ventures Fund VII, L.P. owns 20% of Meetly. It also owns pieces of other companies:
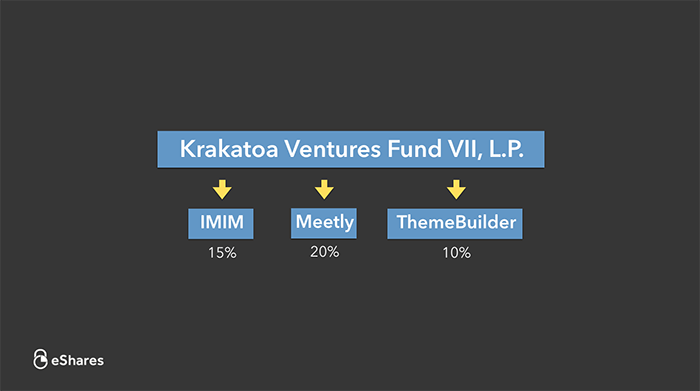
Funds are pooled investment vehicles, meaning multiple parties invest together as one group.
It can be better to invest as a group versus individually. Together, you can buy more ownership, more information, and more influence.
Investors back venture capital funds for those reasons but also because the fund manager has expertise, access, and time that fund investors may not have.
So who owns the fund?
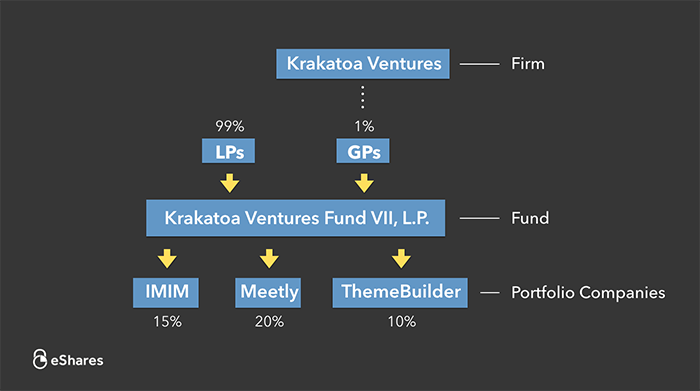
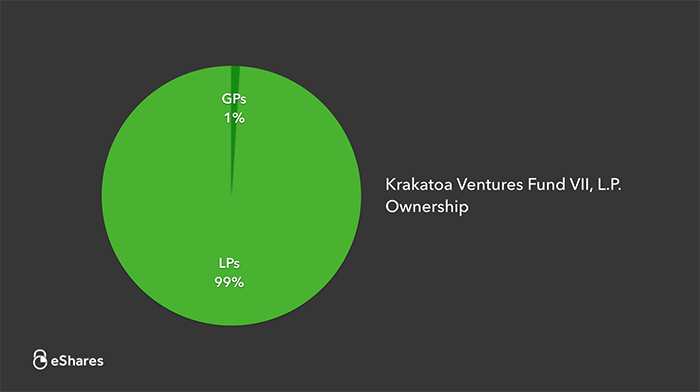
The fund is owned by its partners. General partners (GPs) run day-to-day operations and have personal liability for the fund. Limited partners (LPs) are more passive participants in the fund. Their participation is typically limited to their capital commitment.
In many funds, the GPs only provide 1% of the capital and the LPs provide 99%.
LPs can be divided into two groups: individuals and institutions.
High net worth individuals invest in funds. These often are friends and family of the GPs or technology executives reinvesting their wealth into a new generation of companies.
The LPs that typically invest the most in a fund are institutional investors. These are entities that own part of the fund on behalf of an organization.
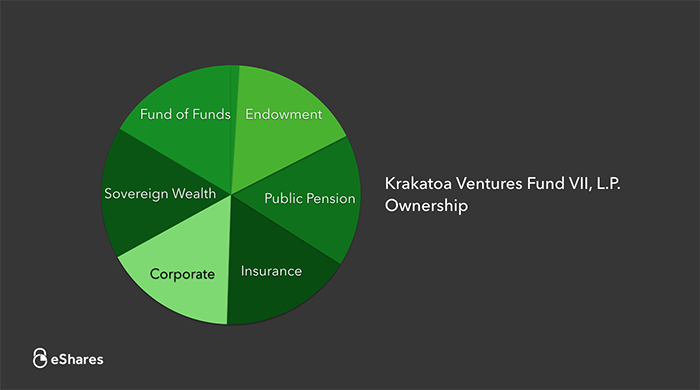
Some examples of major types of institutional investors include:
-
Endowment – Harvard University, University of California
-
Public Pension – Canada Pension Plan Investment Board, California Public Employees’ Retirement System
-
Insurance – MetLife, Allianz Capital Partners
-
Corporate – Boeing, IBM
-
Sovereign Wealth – Australia Future Fund, Government of Singapore Investment Corporation
-
Fund of Funds – AlpInvest Partners, Hamilton Lane
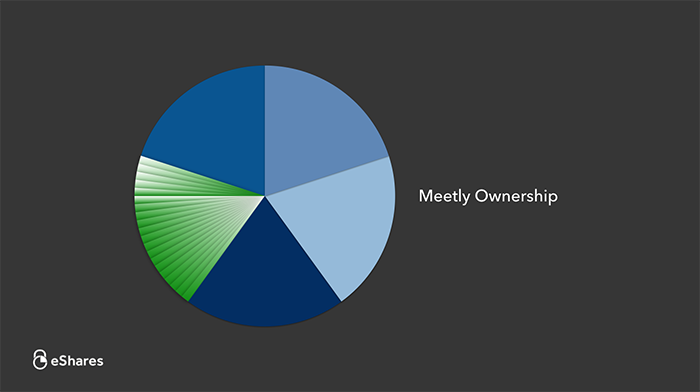
So Meetly’s ownership is much more stratified than it may seem.
It may not even end there. The entity that invested in Krakatoa’s fund may also be a fund.
At Carta, we help track ownership in both directions – managing your shareholder base or managing your investments.
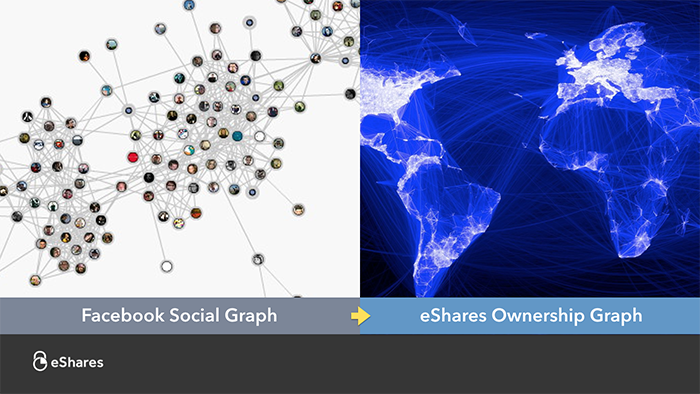
Facebook built the social graph. This helped enable new behavior that couldn’t exist without the friend layer of the internet.
At Carta, we’re building the ownership graph for private assets. This will help enable new commerce that isn’t possible today.