Executive summary
Over the past several years, the picture of what a typical pre-seed round looks like has undergone a transformation.
A dozen years ago, the SAFE—short for simple agreement for future equity—didn’t exist. Most fundraising that occurred before a startup solicited its first priced round took the form of convertible notes.
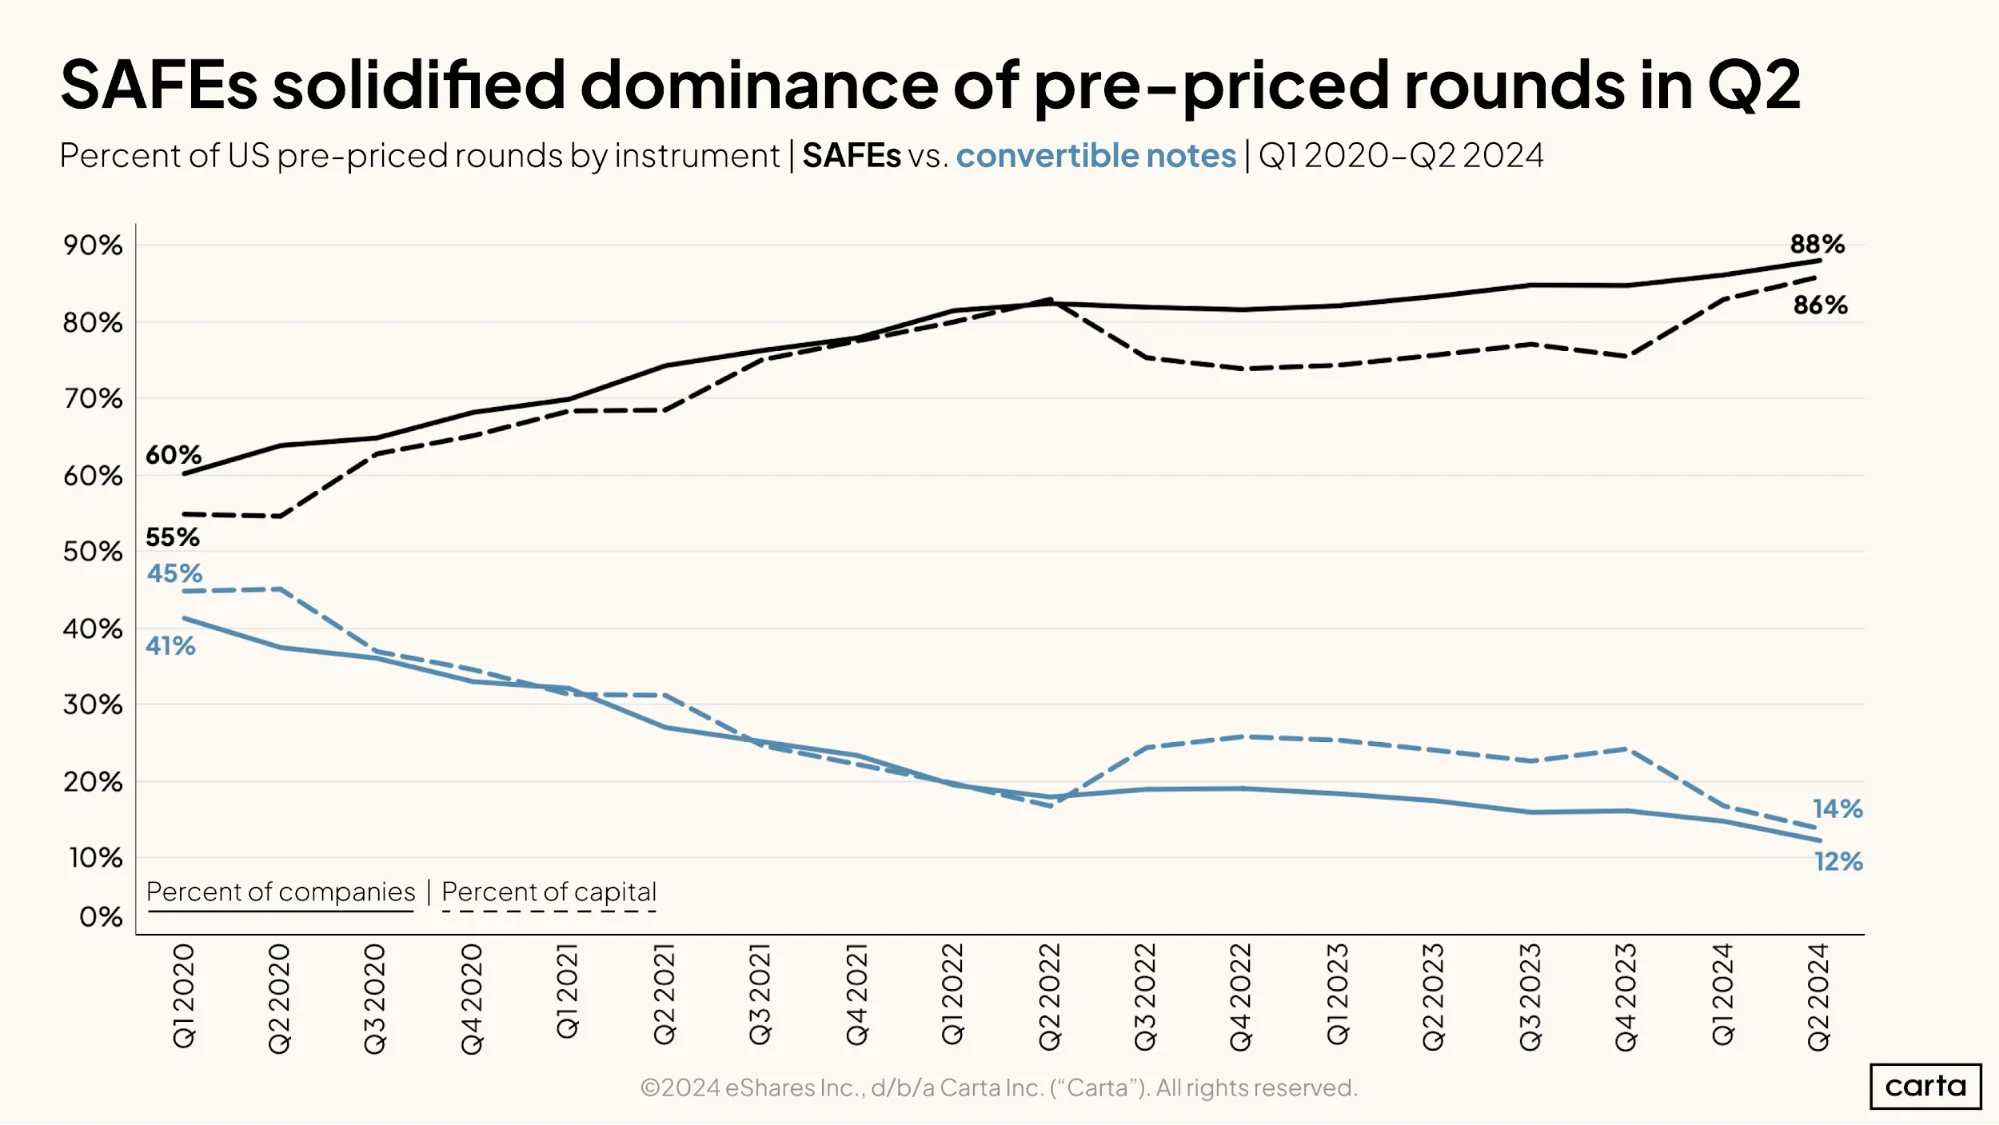
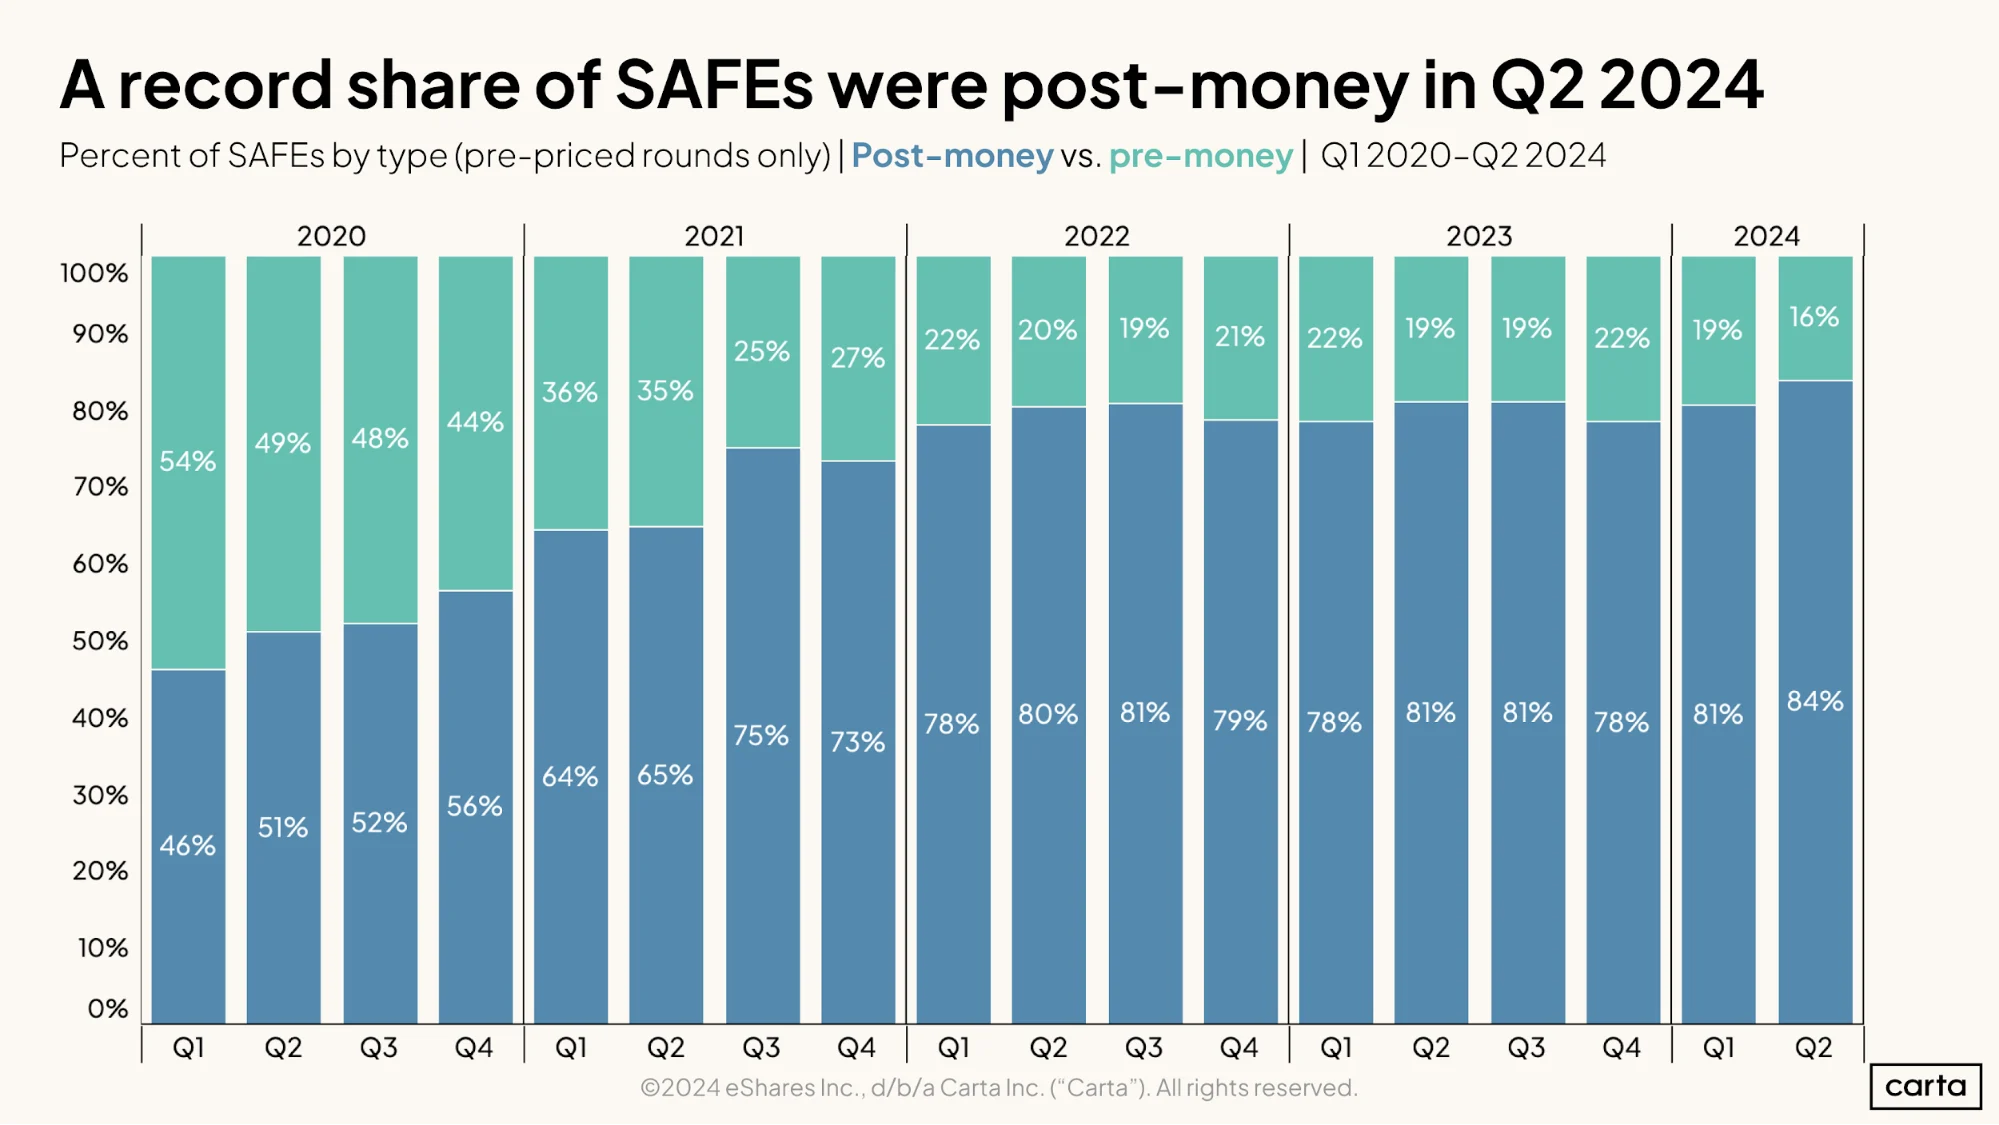
Today, the SAFE is the dominant fundraising mechanism in the pre-seed market. In Q2, 88% of all pre-seed deals on Carta were SAFEs, compared to just 12% that were convertible notes, the largest quarterly split we’ve seen to date.
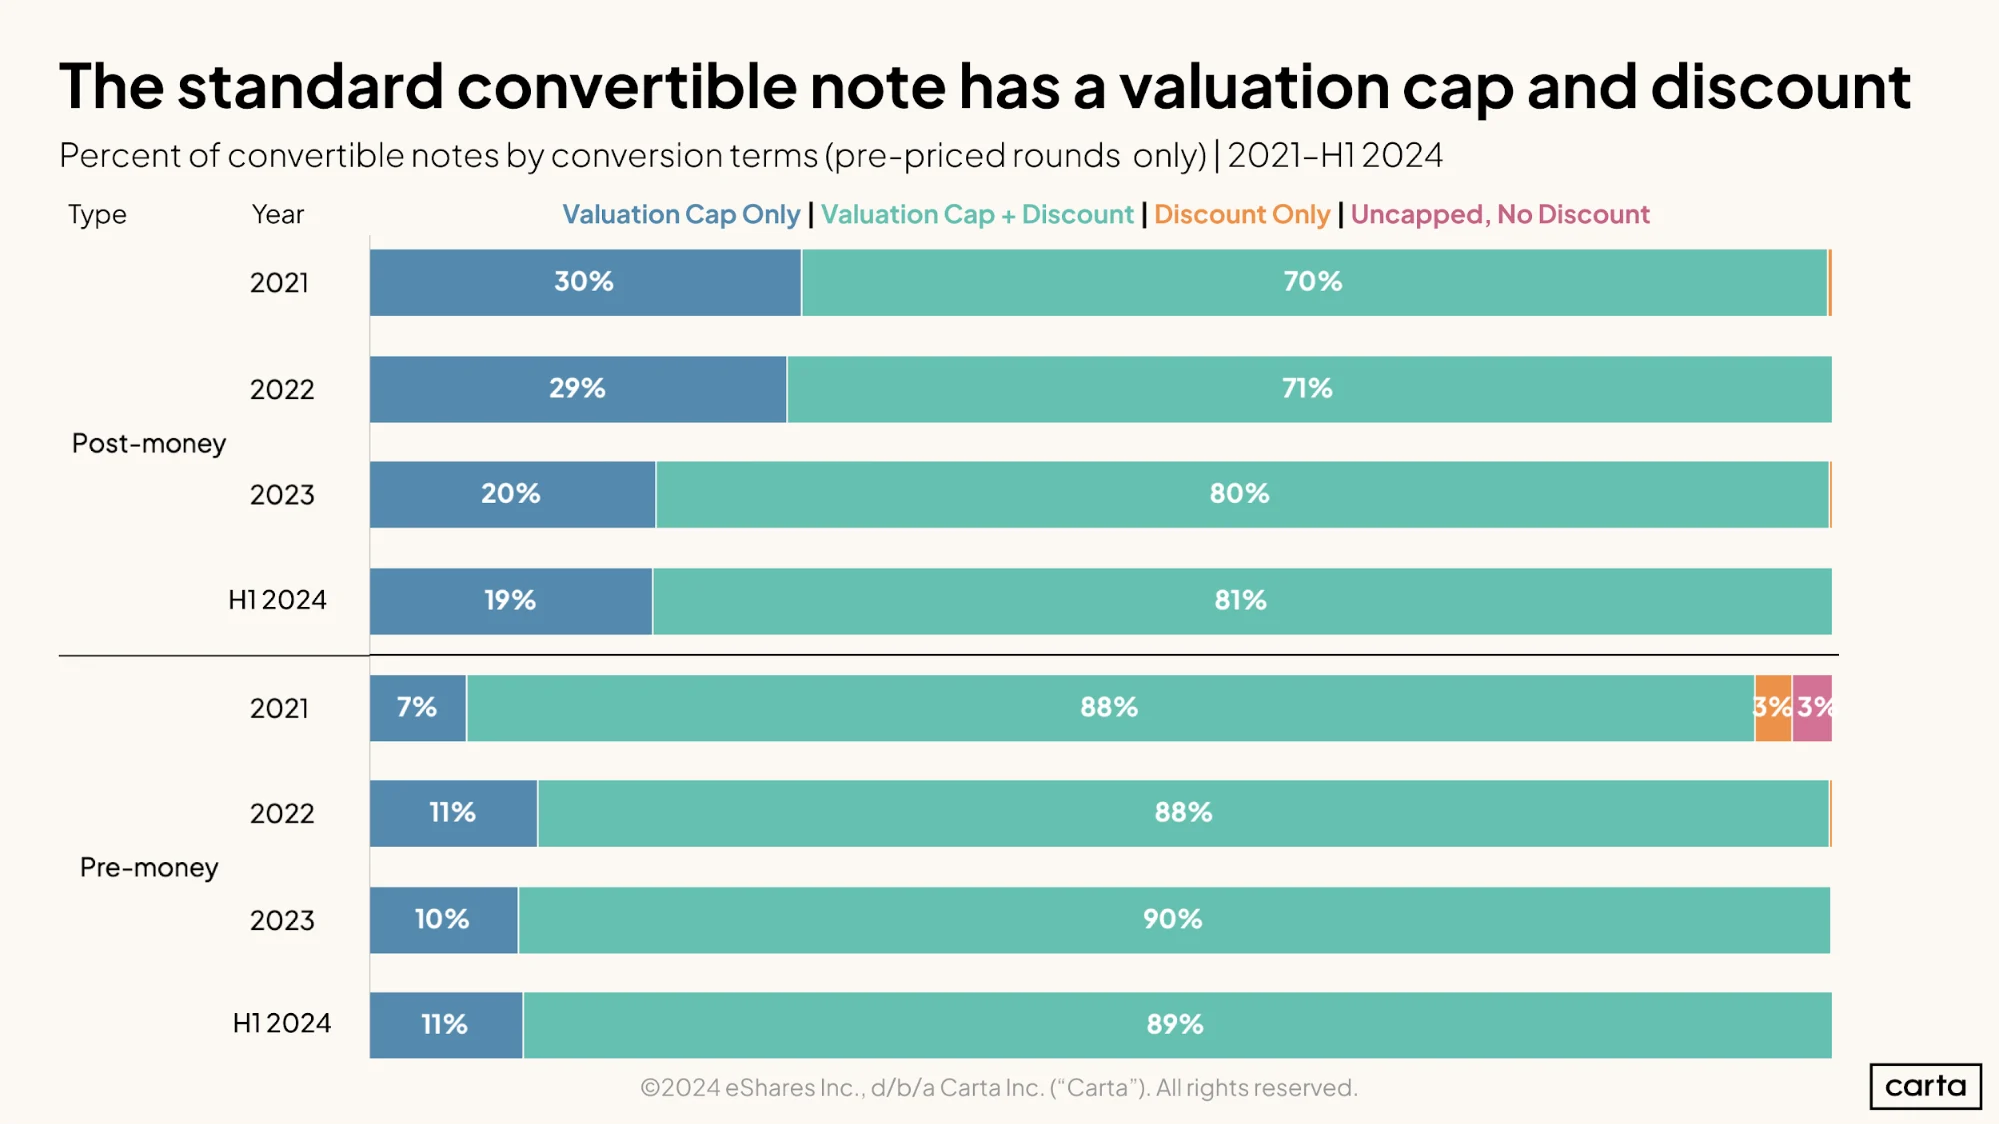
This shakeup on the pre-seed scene has major implications for early-stage founders and investors alike. SAFEs and convertible notes usually differ significantly in structure and terms—and some of those differences can have major financial significance when a startup eventually does begin to raise priced rounds.
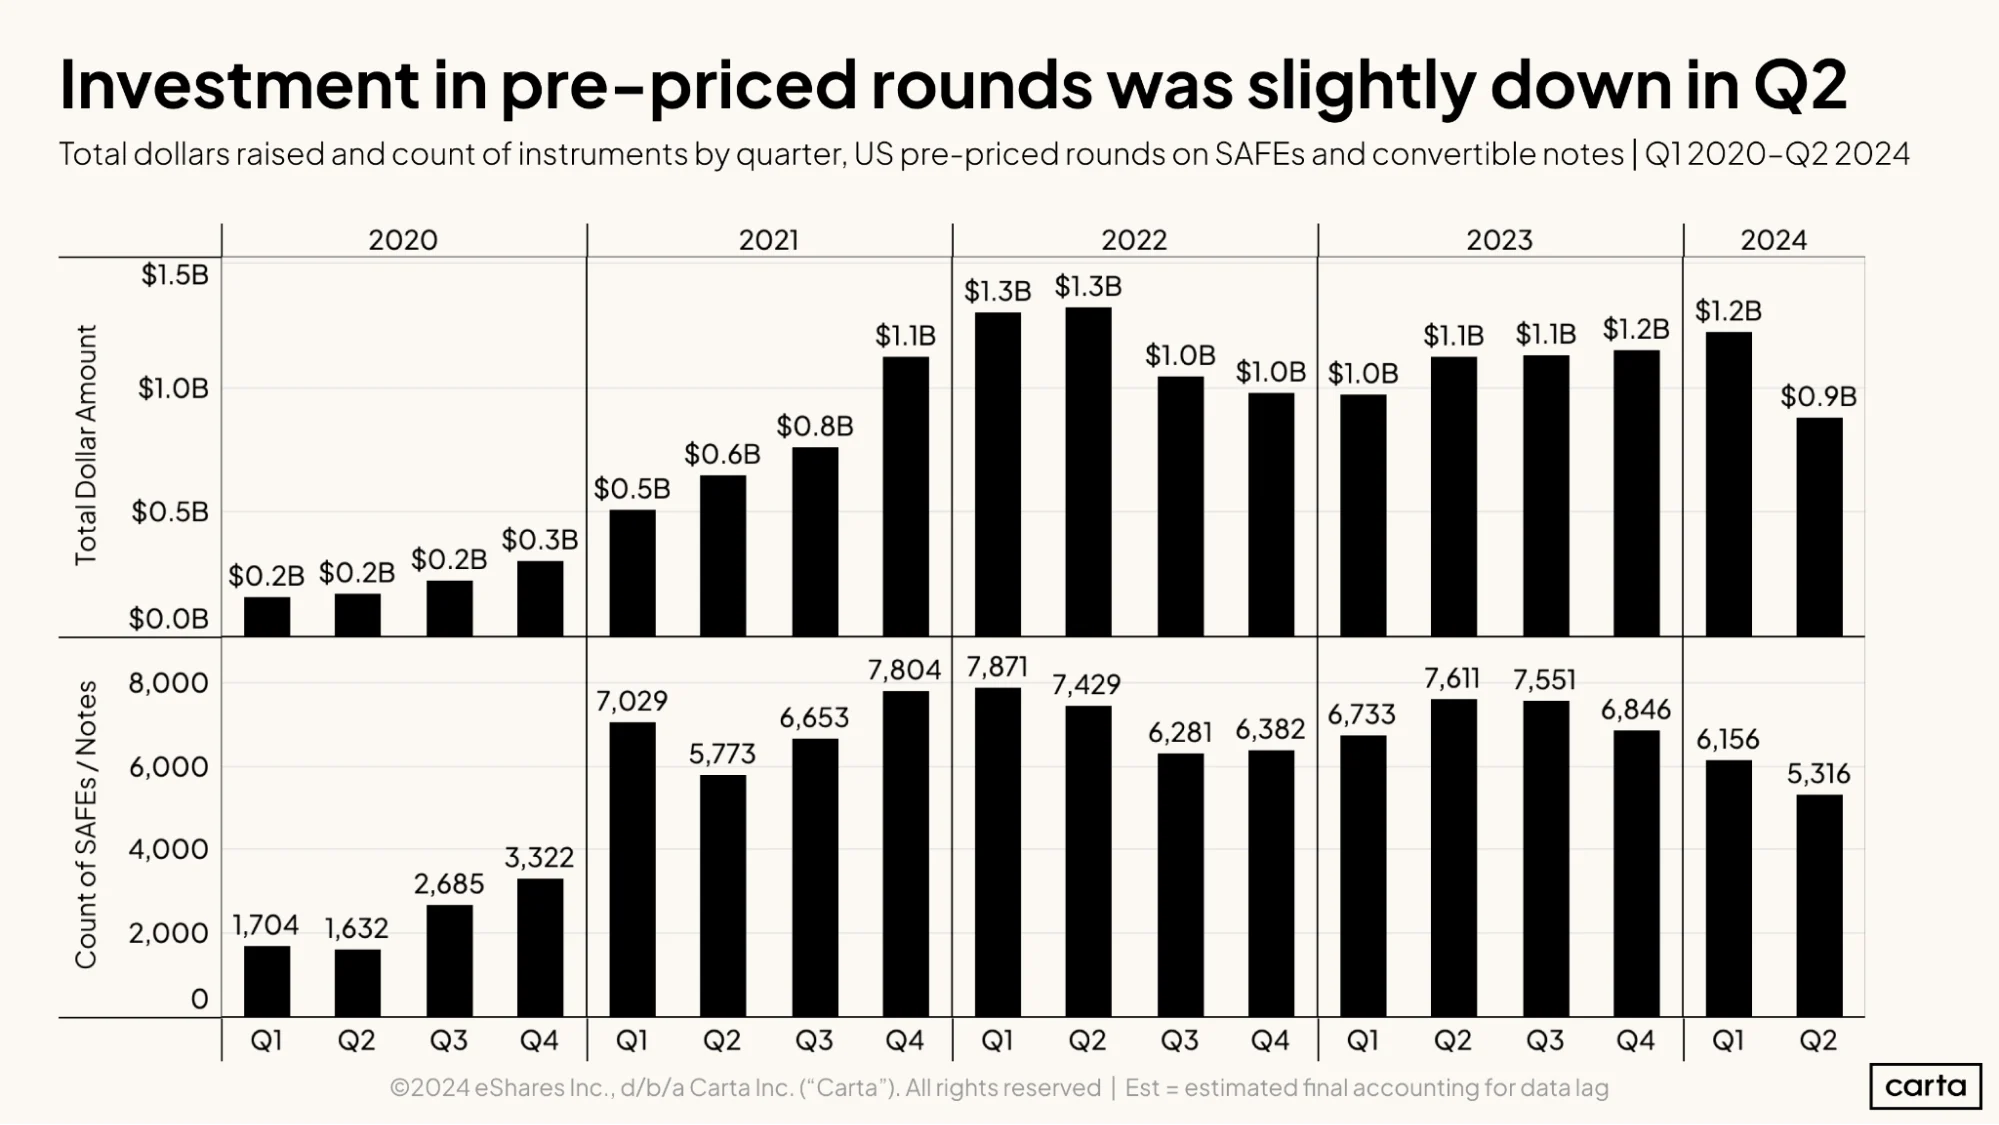
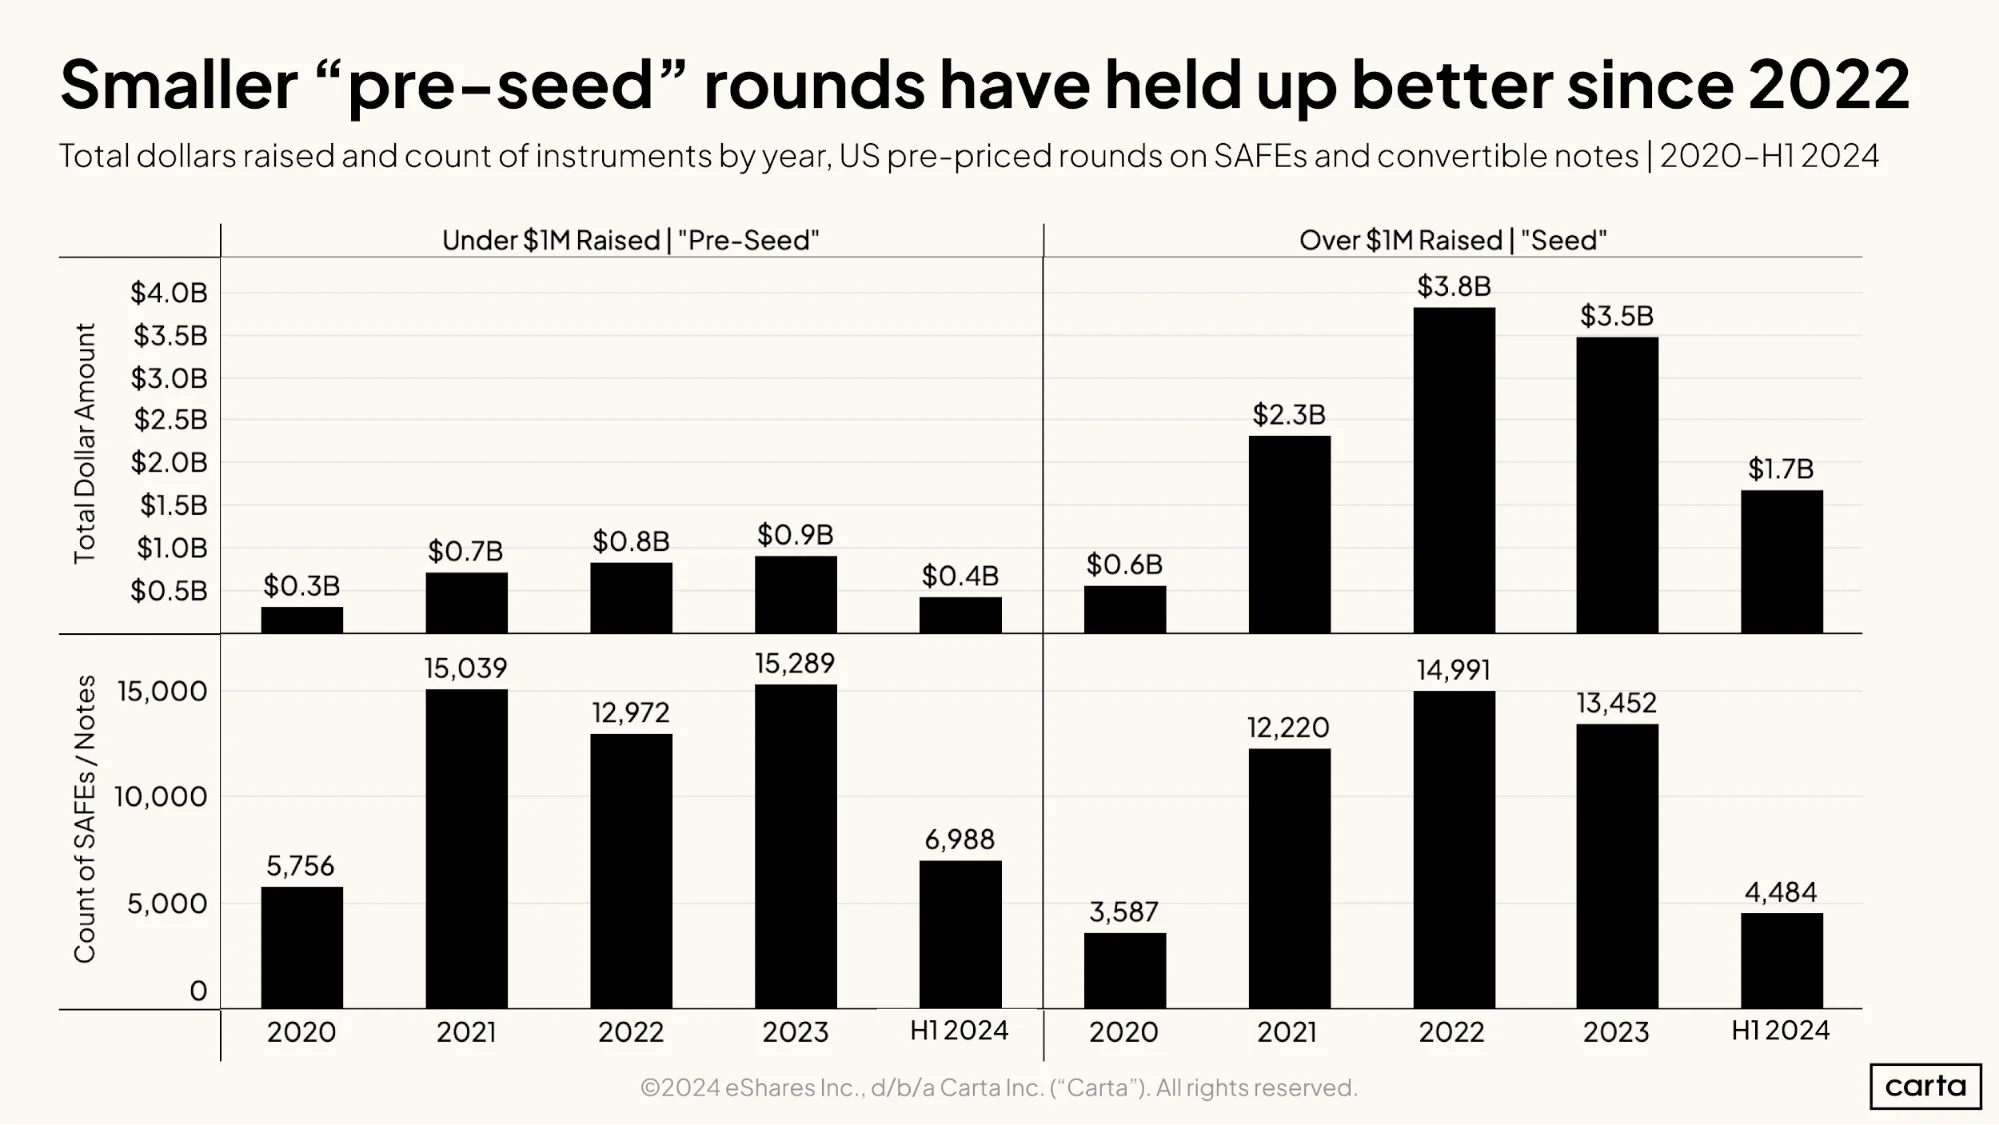
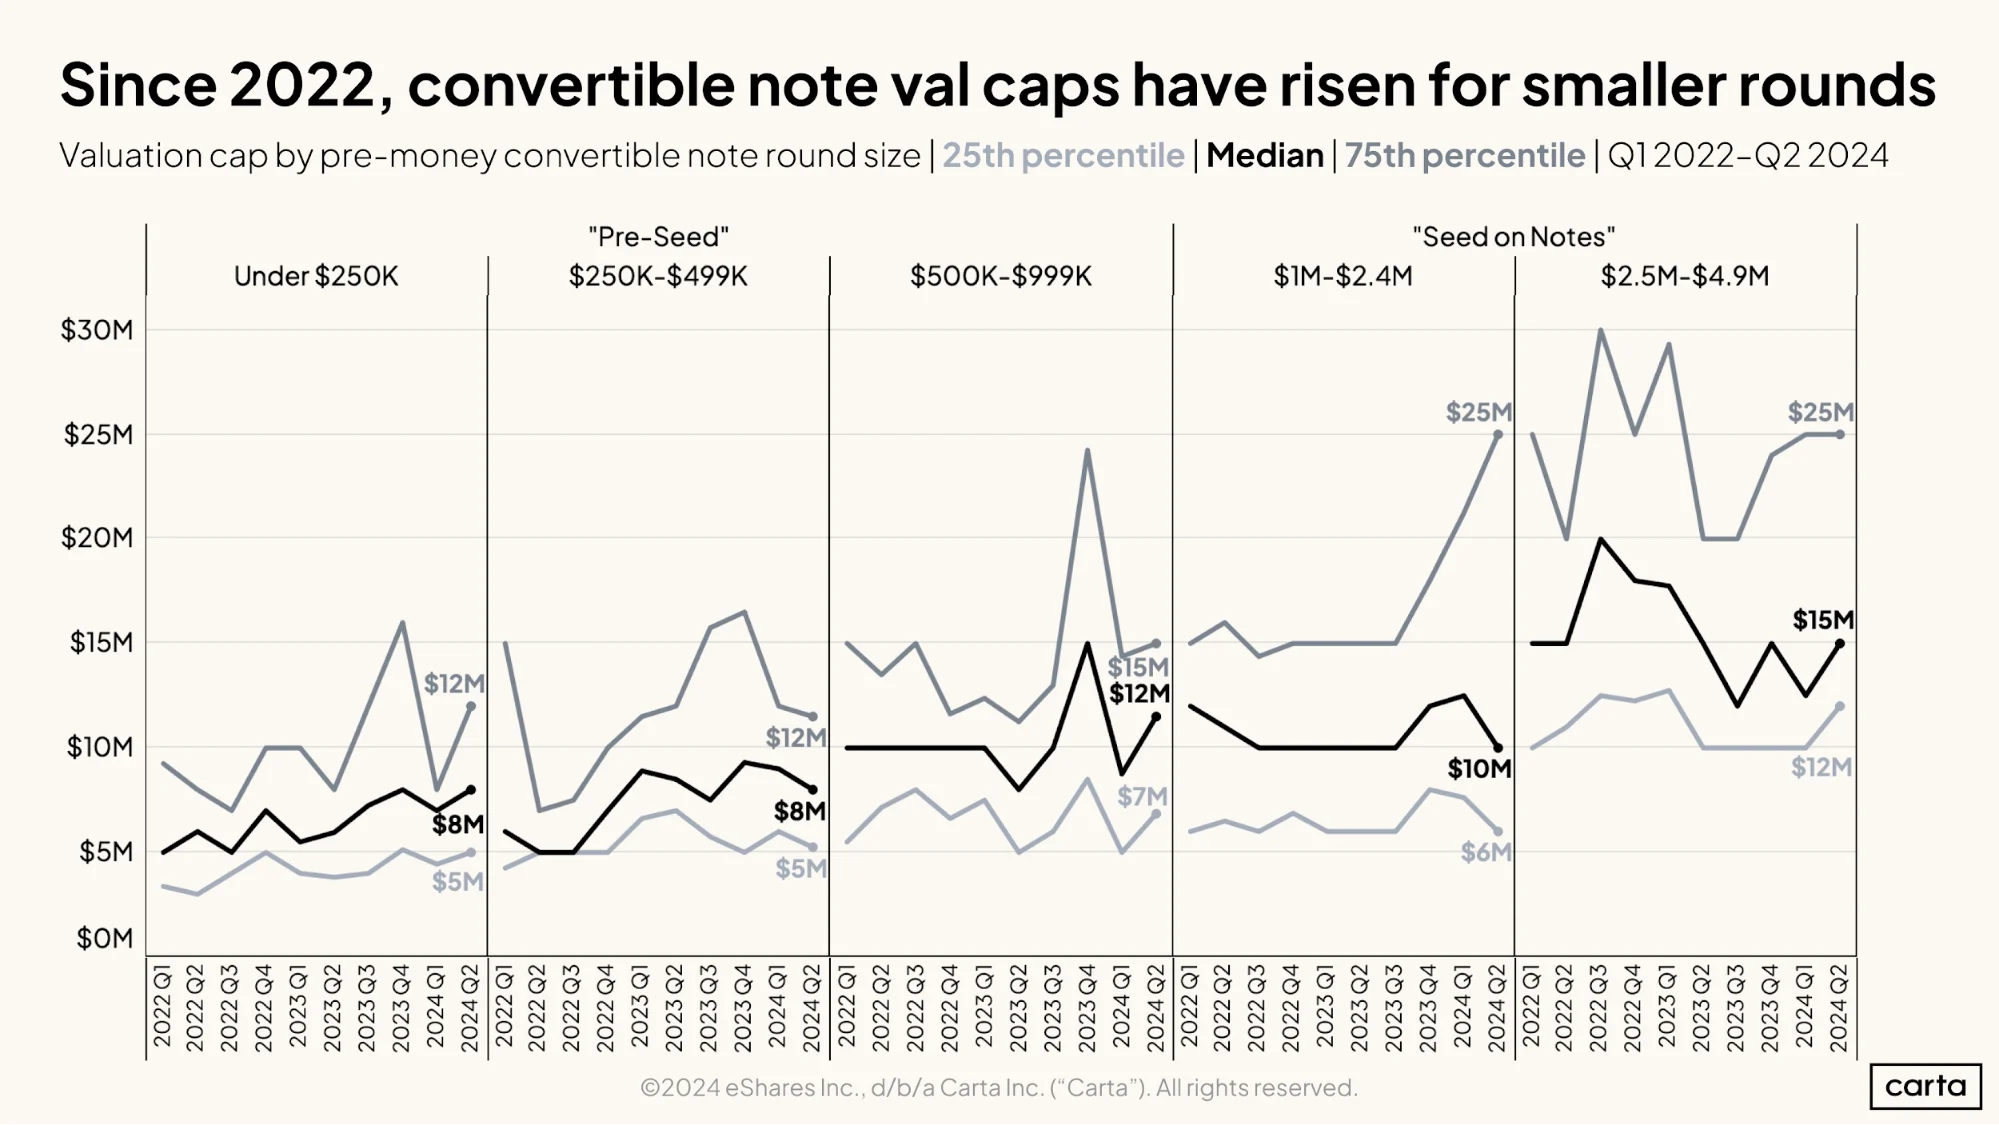
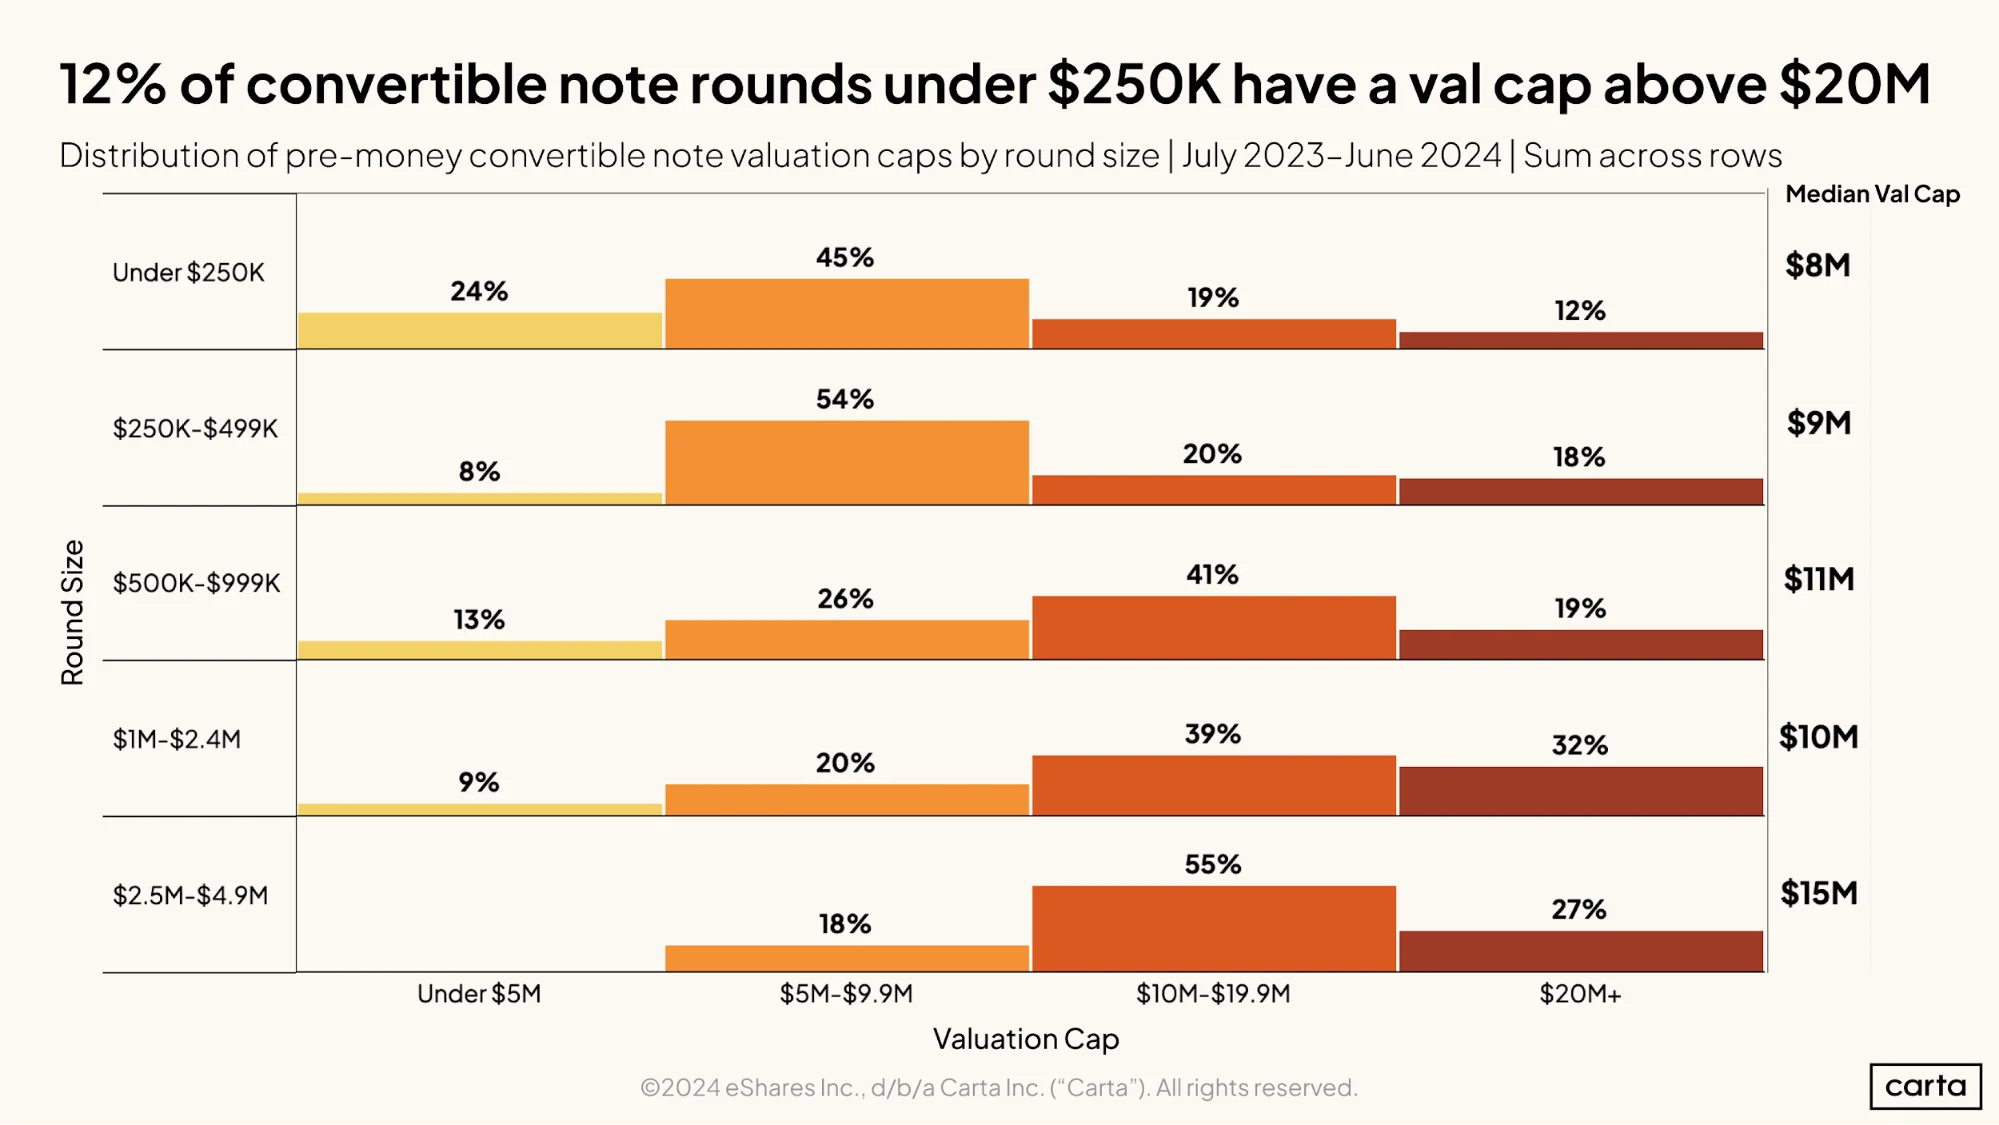
This report relies on data from more than 100,000 individual funding events tracked on Carta since the start of 2020. With this breadth of data, we can offer a comprehensive look at the trends shaping the pre-seed fundraising market today. We also present comparative data on SAFEs and convertible notes across several key variables, including typical valuation caps, individual check sizes, and more.
Founders in the early stages of their own fundraising journeys can access our cap-table platform for free through Carta Launch, which also includes tools to simply create and fund SAFEs.
Scroll to keep reading, or download a high-resolution deck with all of the graphics below plus five industry maps for different round sizes.
Q2 highlights
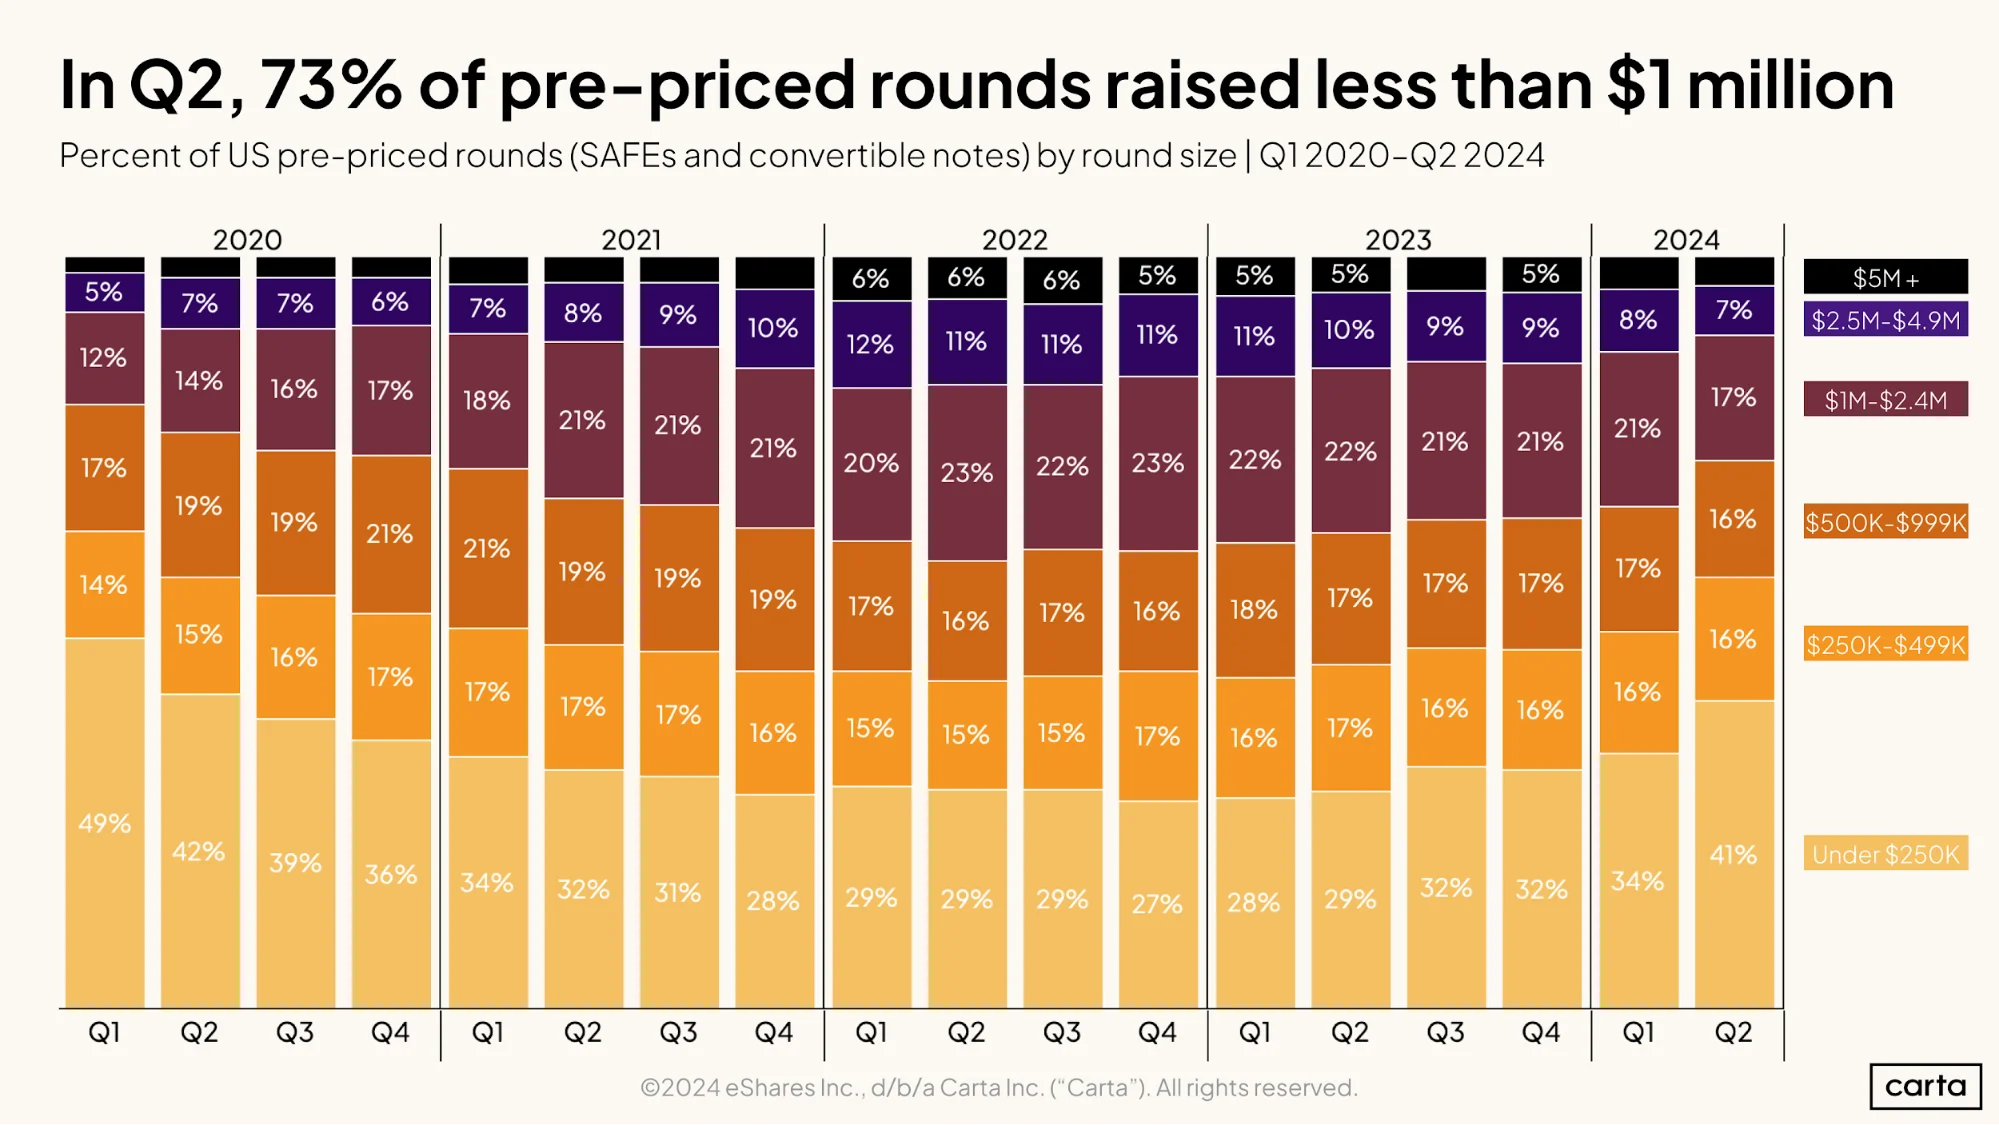
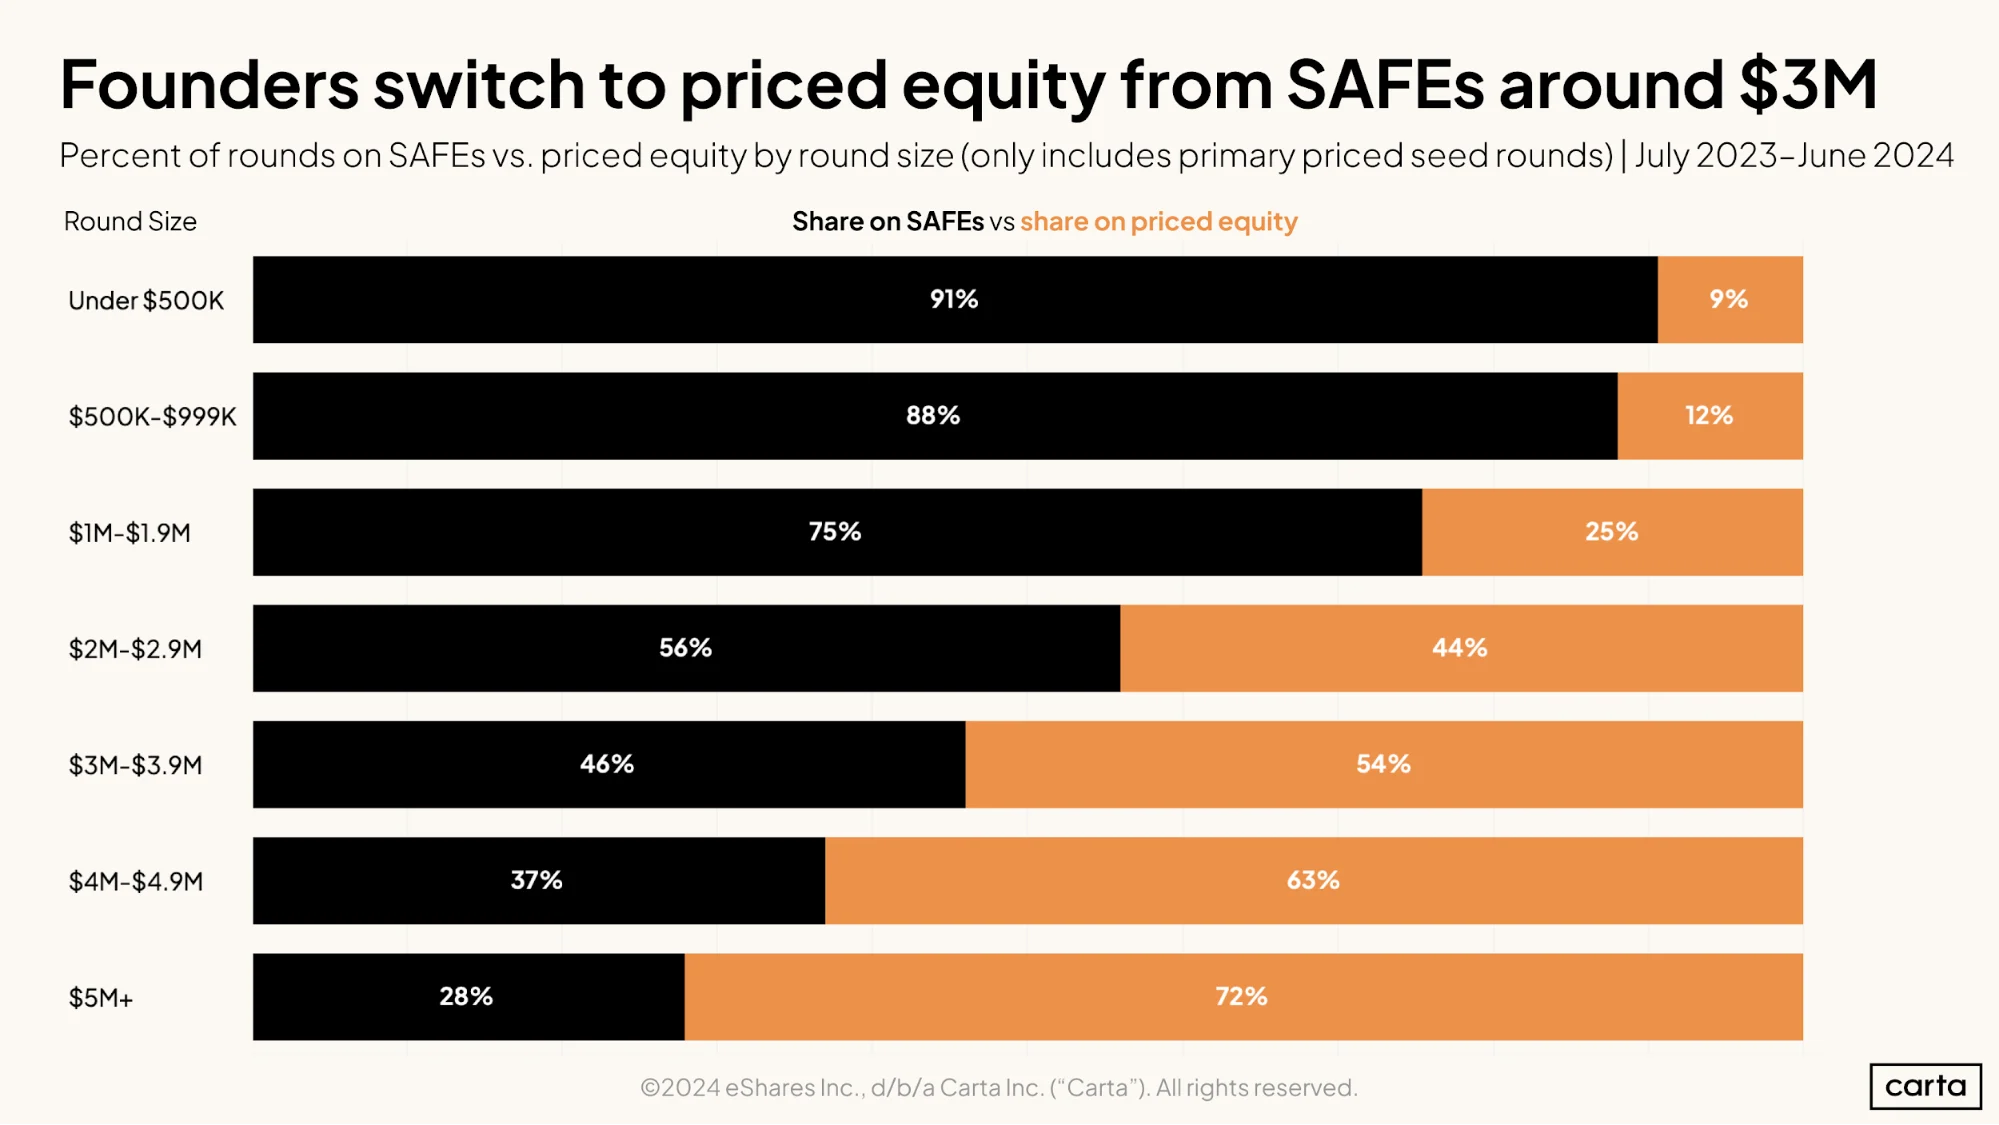
Pre-seed rounds are getting smaller. About 73% of all pre-priced funding events in Q2 were less than $1 million in size, the highest rate in more than three years.
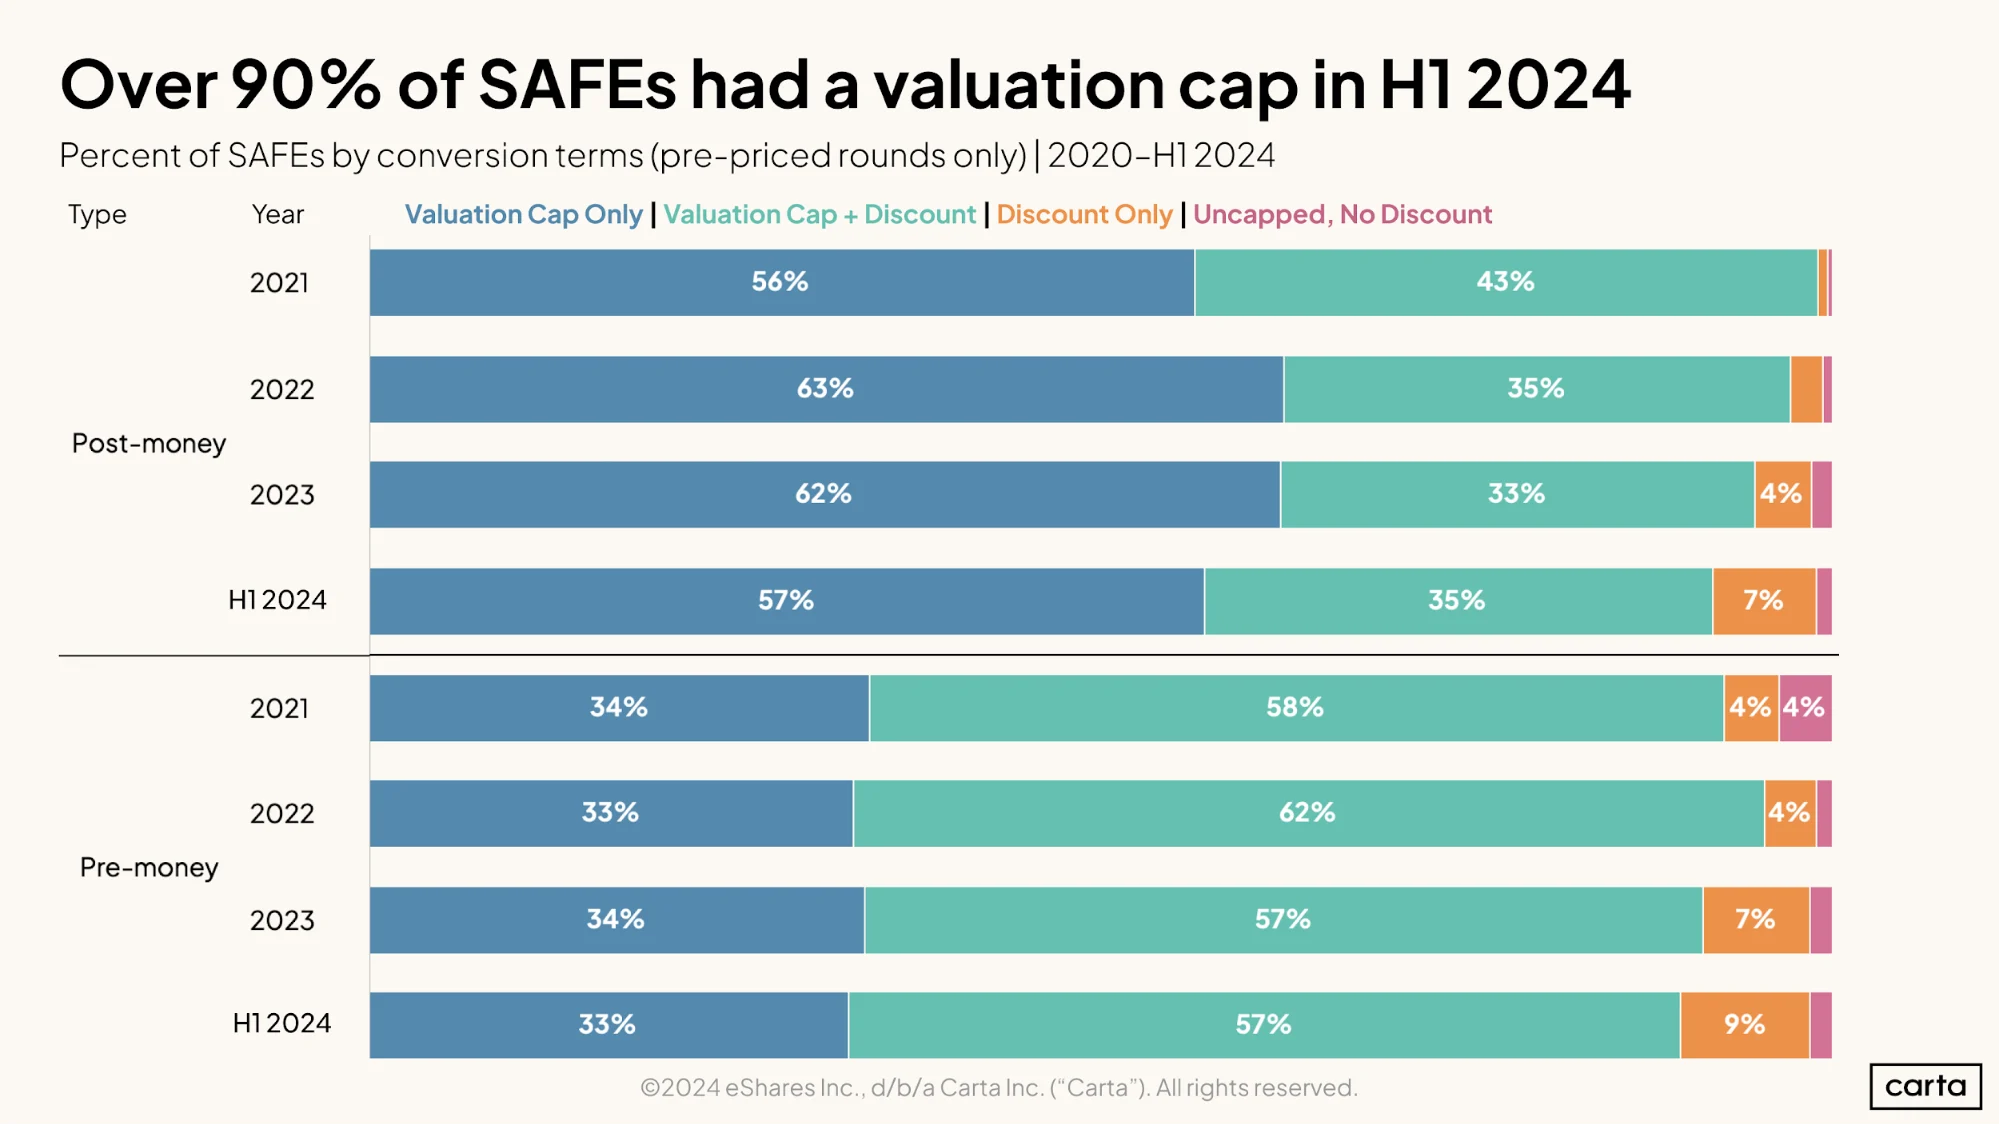
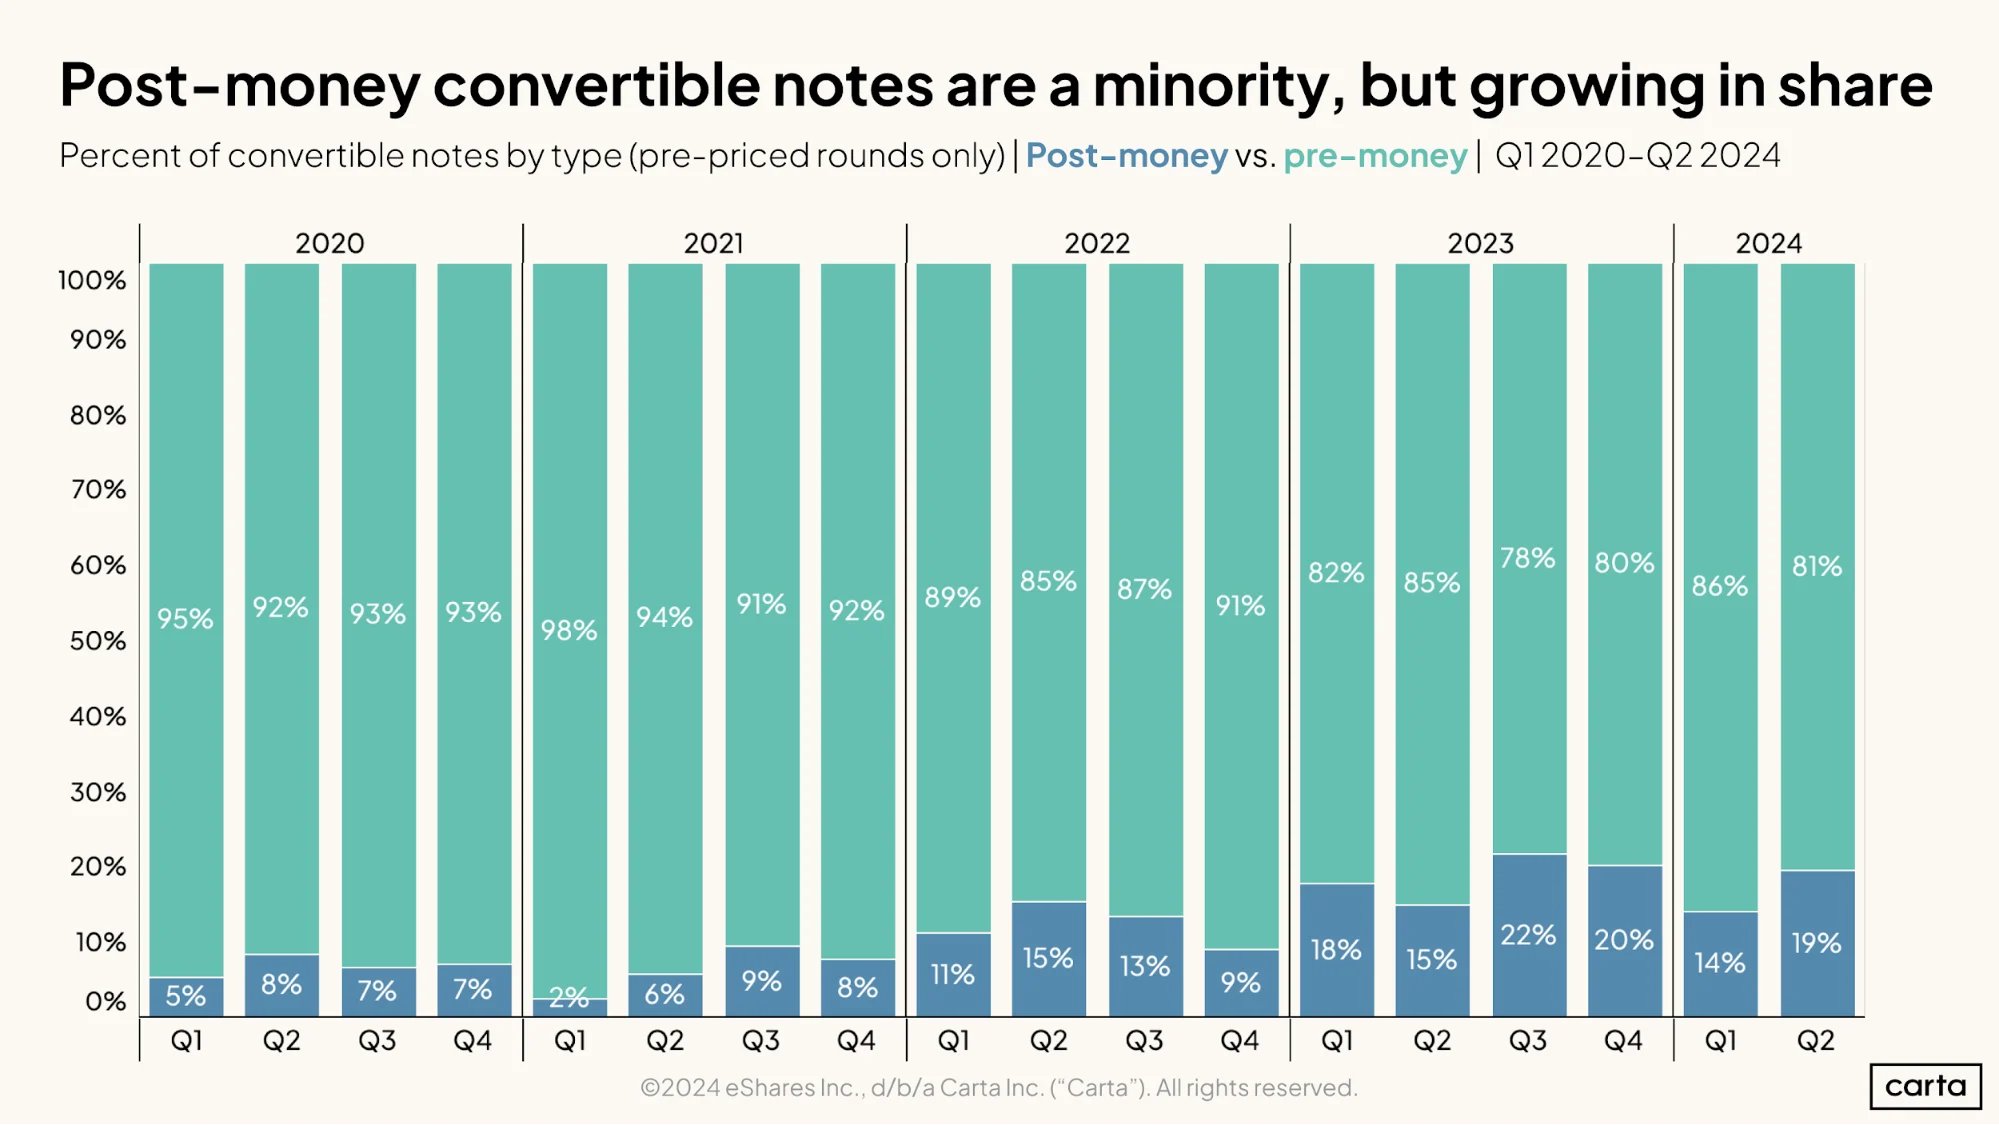
Most SAFEs are post-money, while most convertible notes are pre-money. In Q2, 84% of all SAFEs are post-money, which gives the investor a fixed rather than variable ownership percentage, while just 19% of convertible notes were post-money.
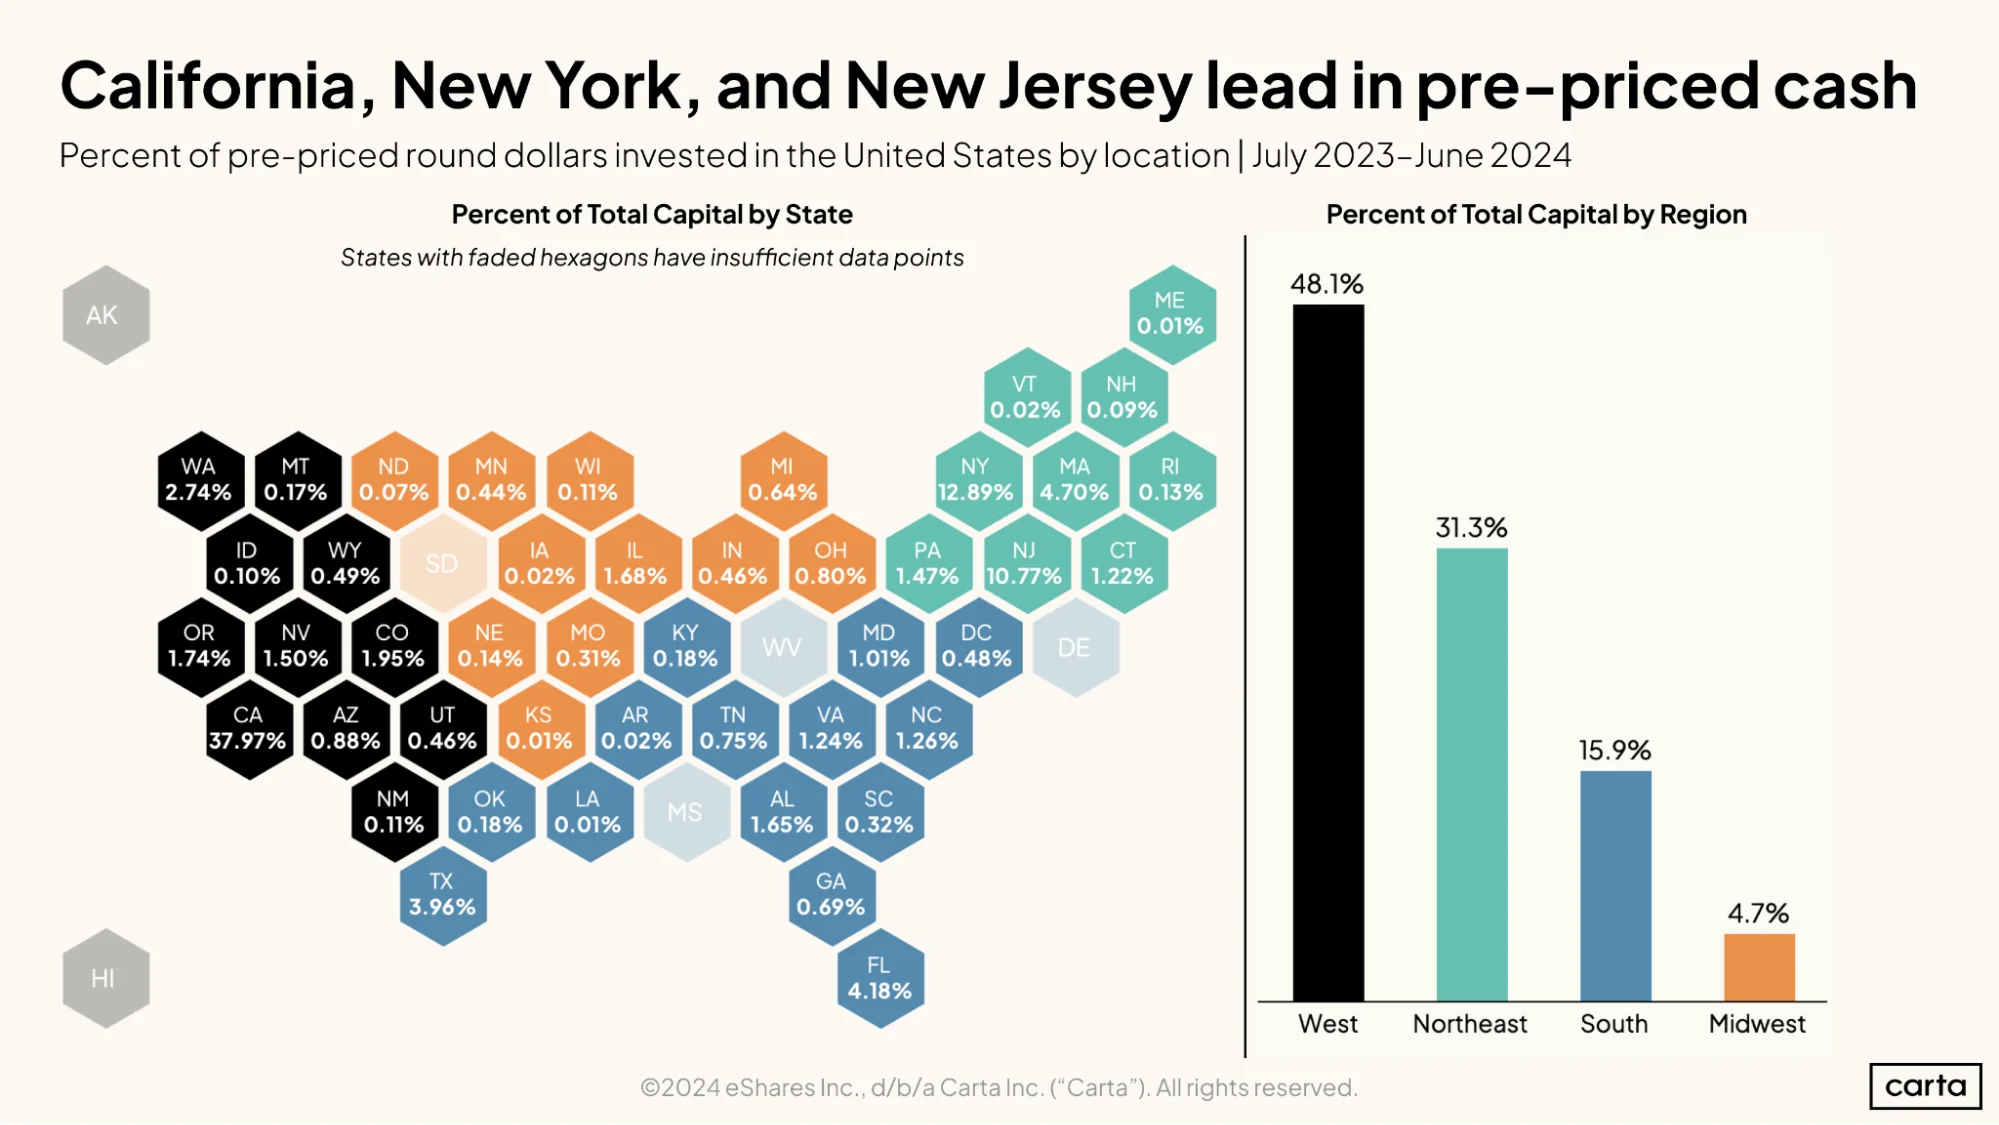
New Jersey is a pre-seed hotspot. Startups based in New Jersey raised 10.77% of all pre-seed capital from Q3 2023 through Q2 2024, compared to just 2.44% of all capital in priced rounds over that same span.
Key trends
SAFEs
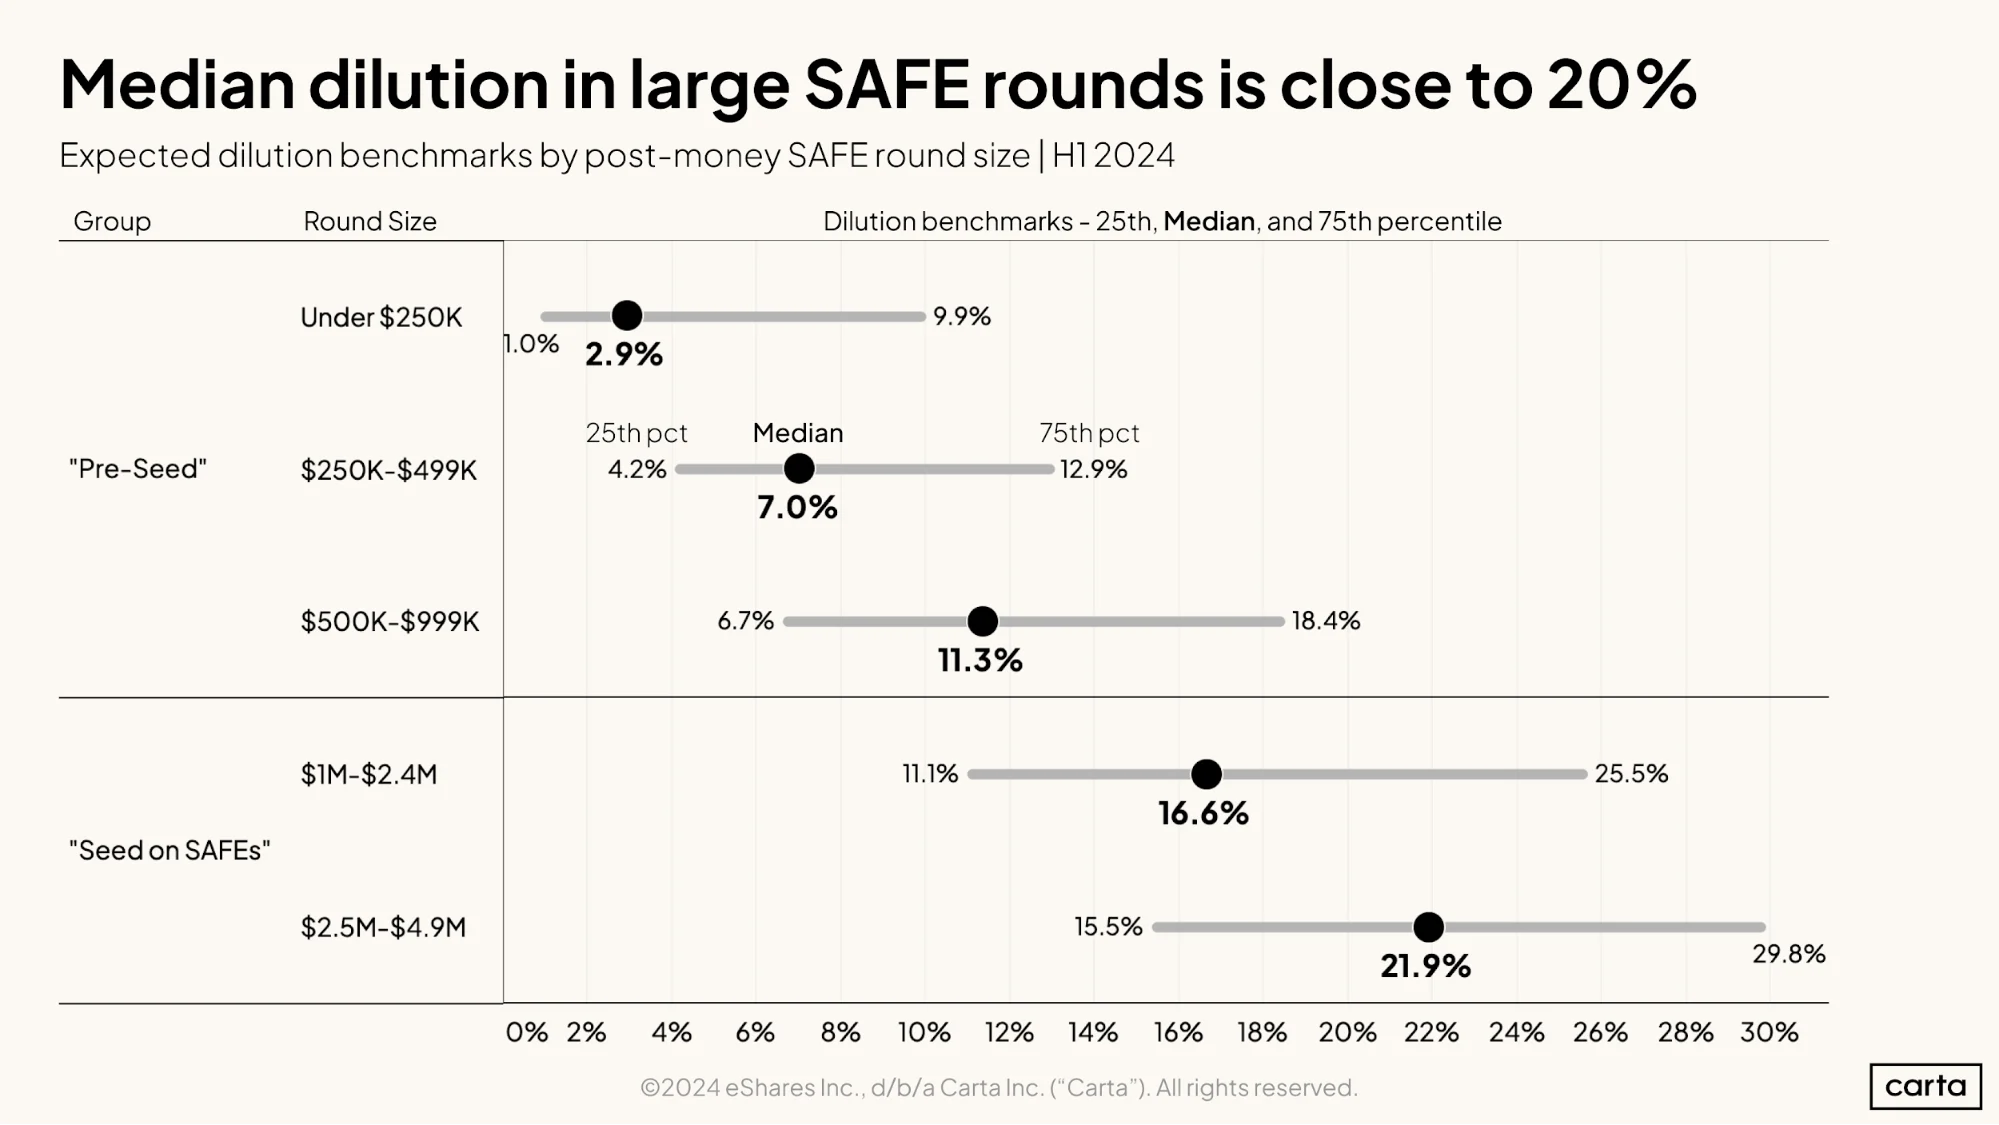
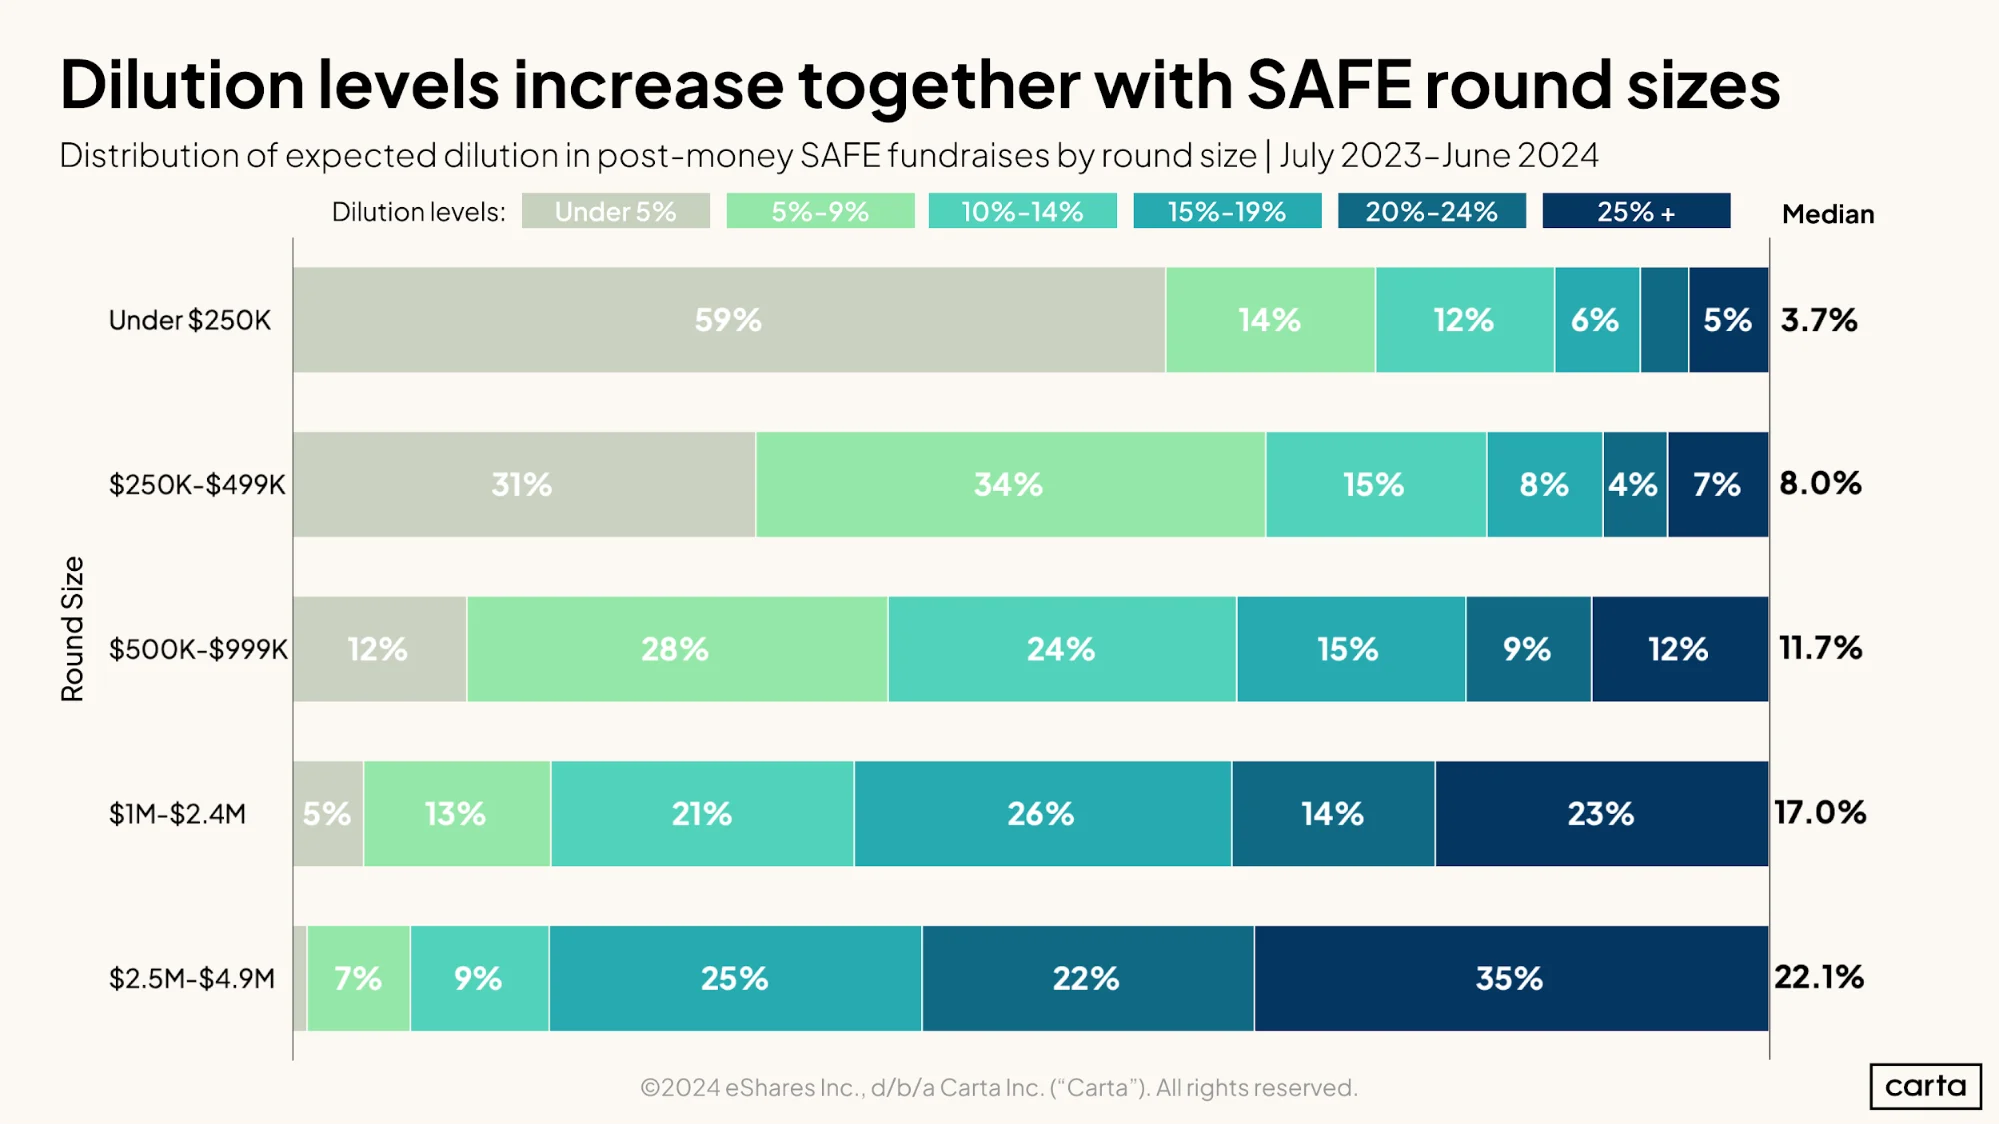
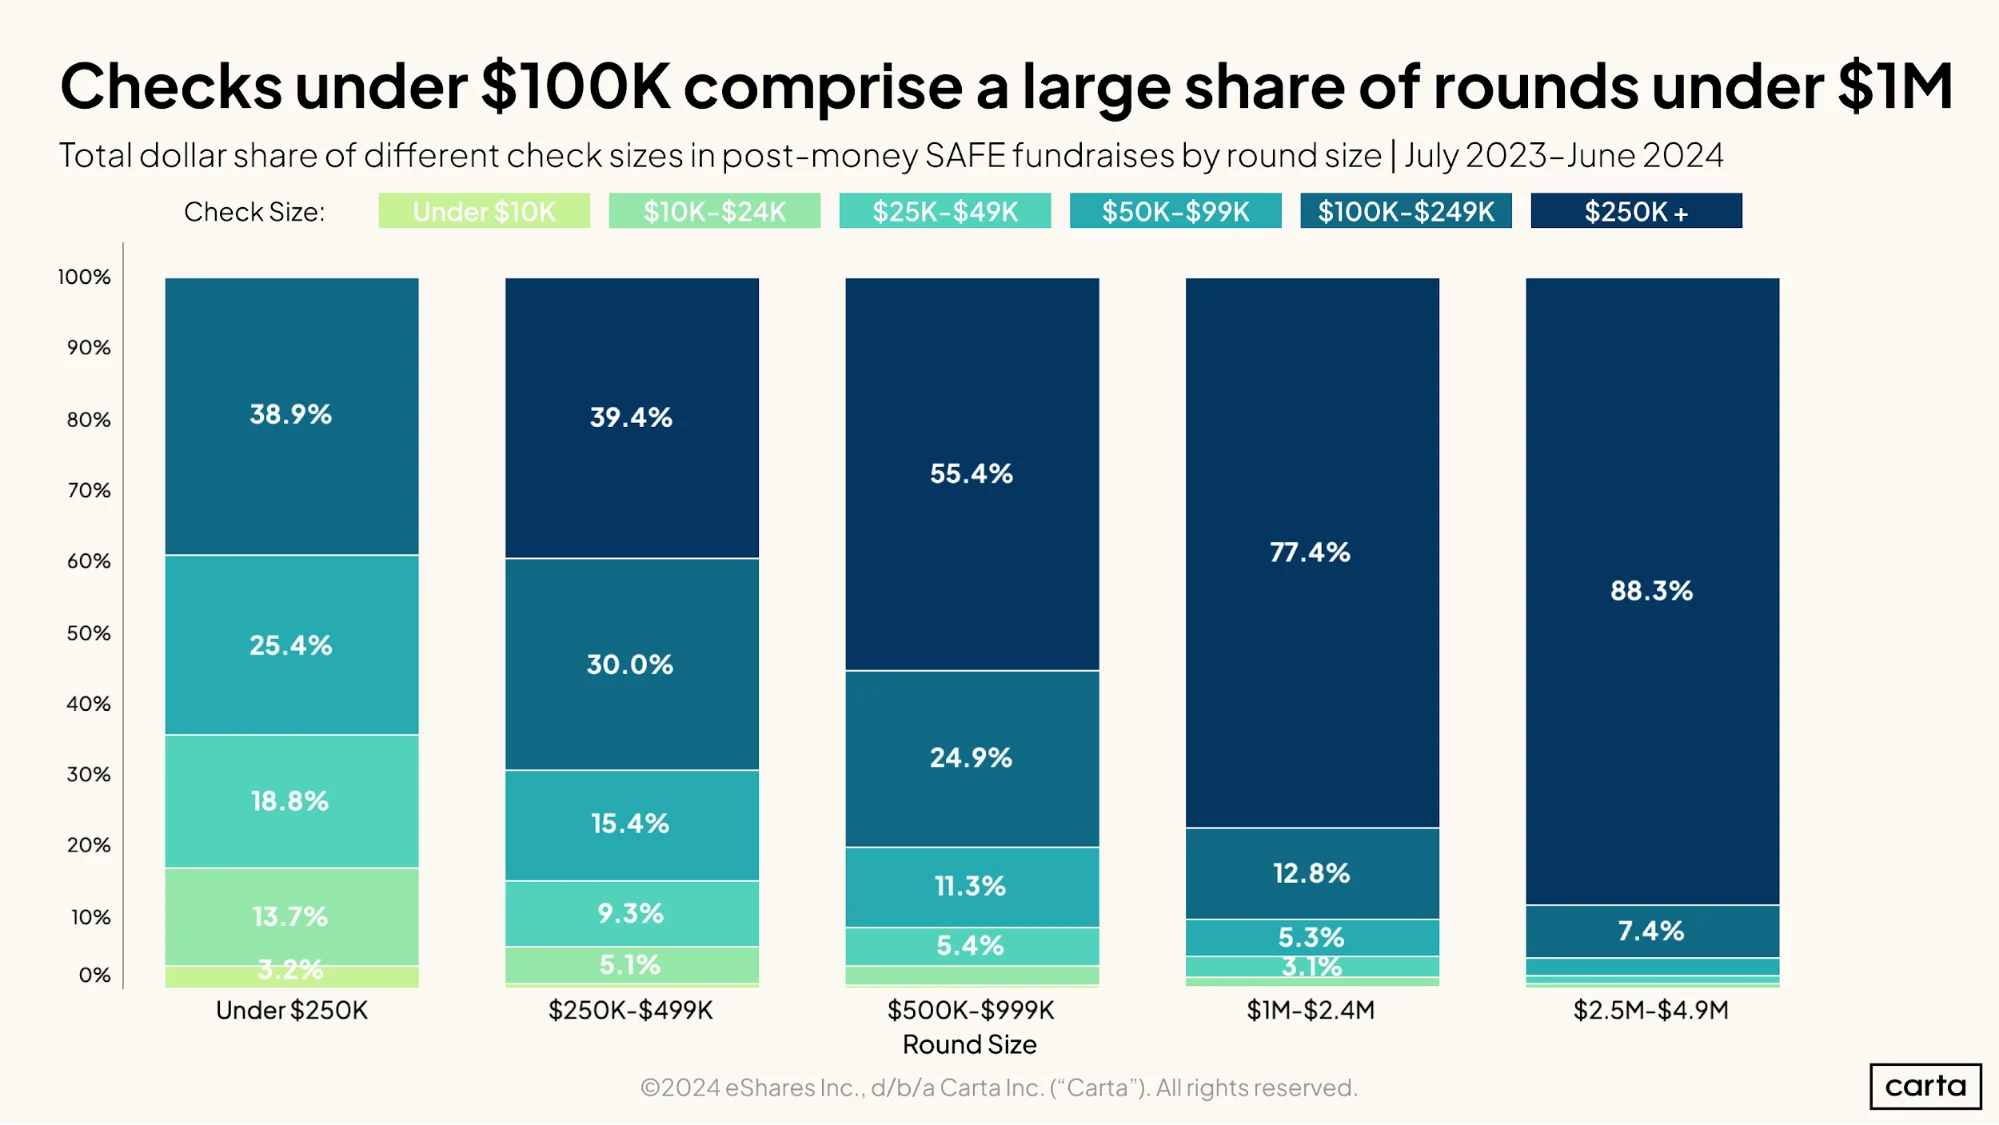
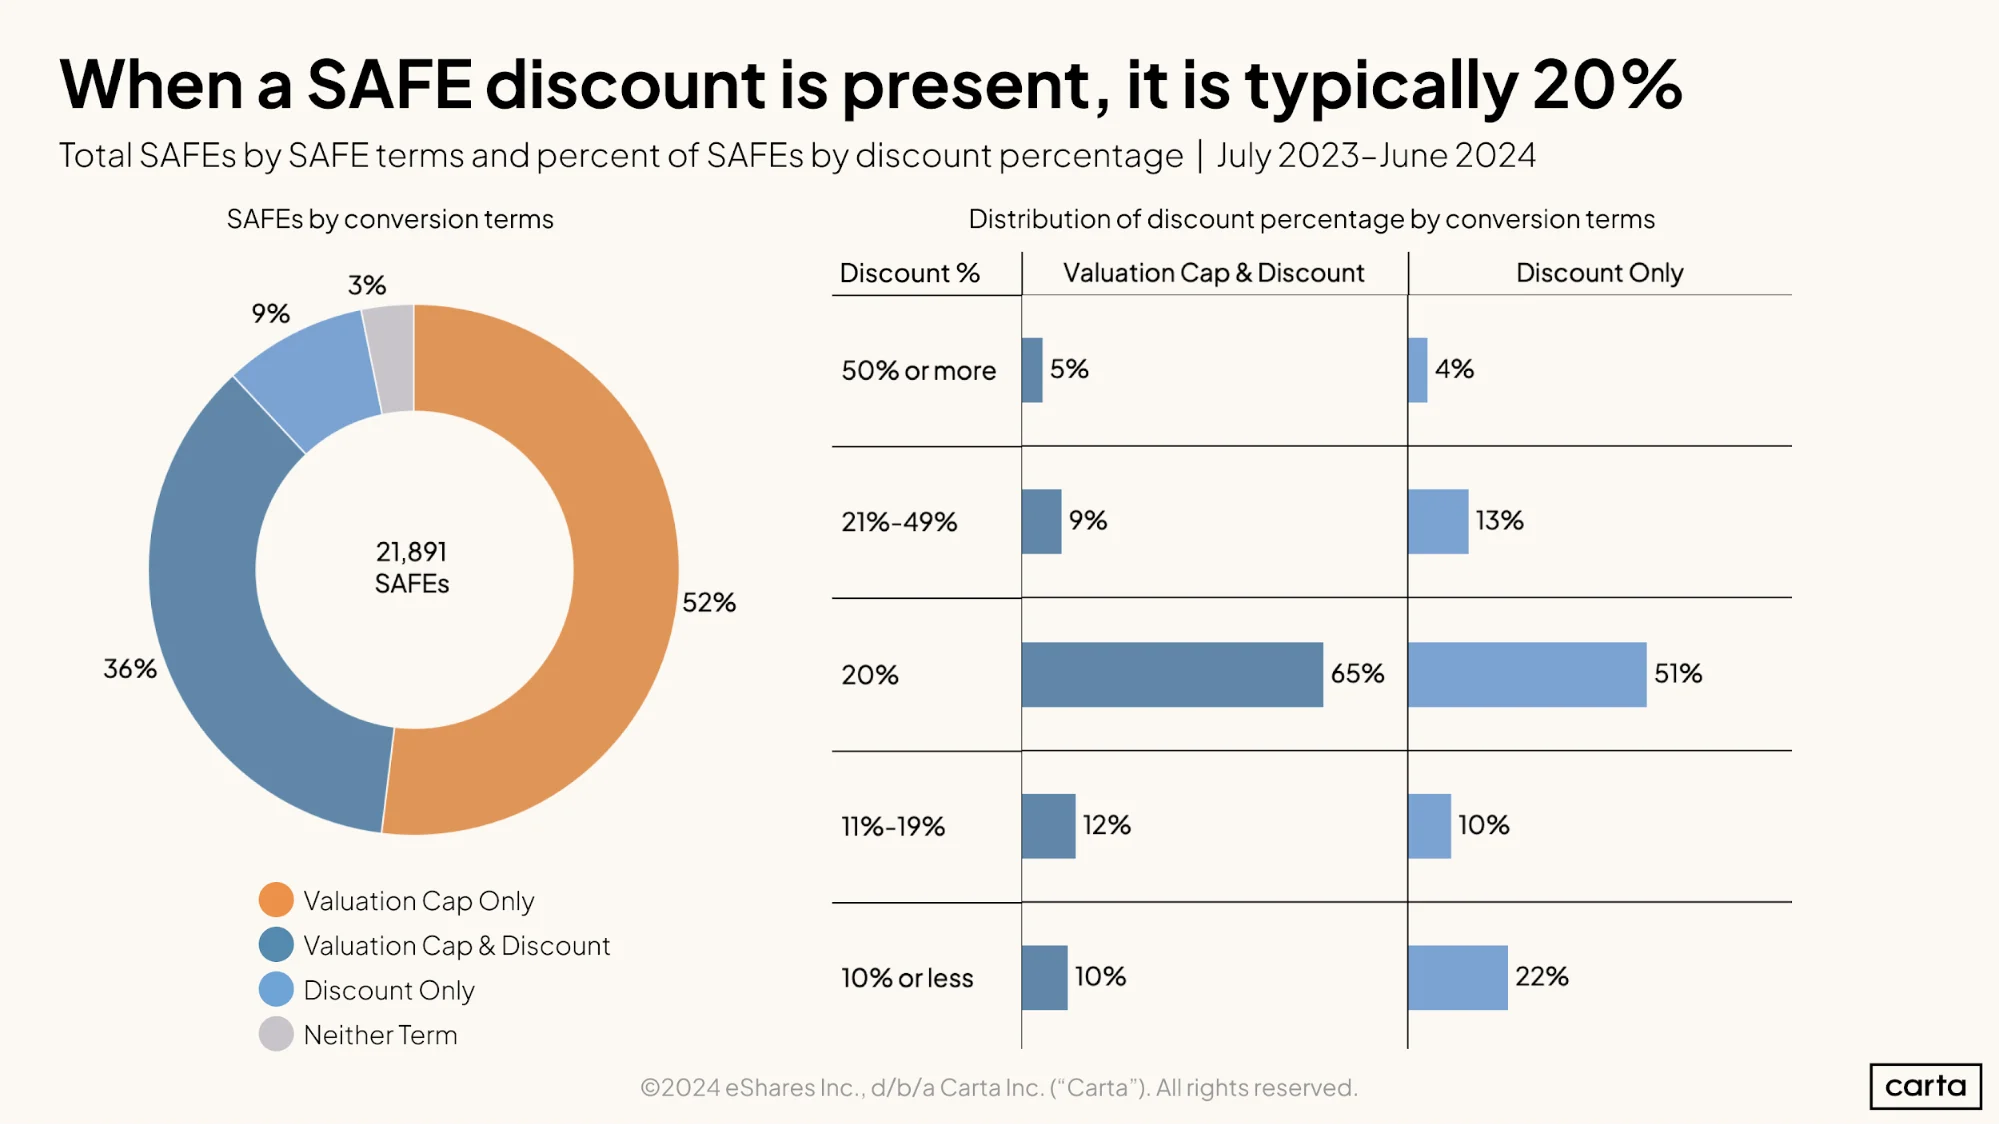
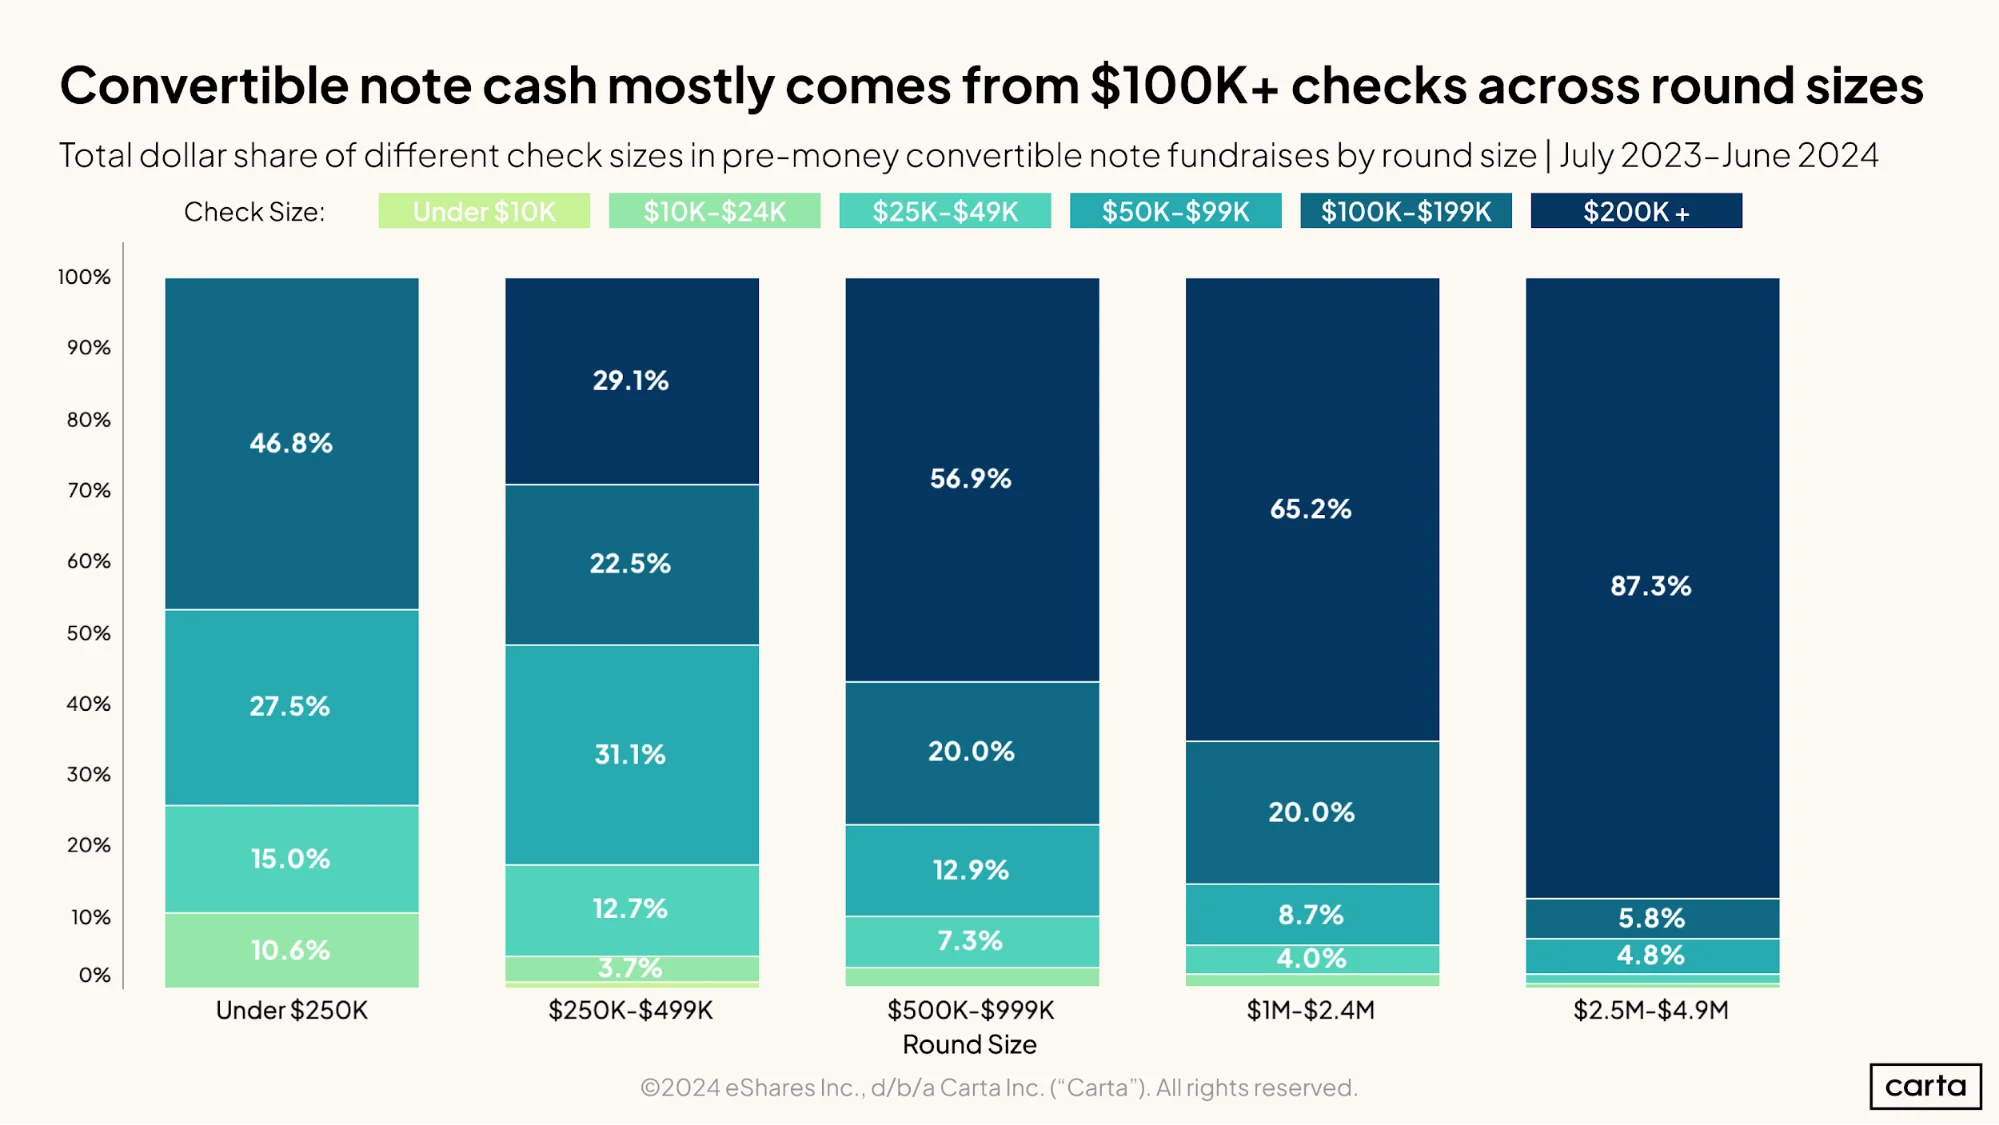
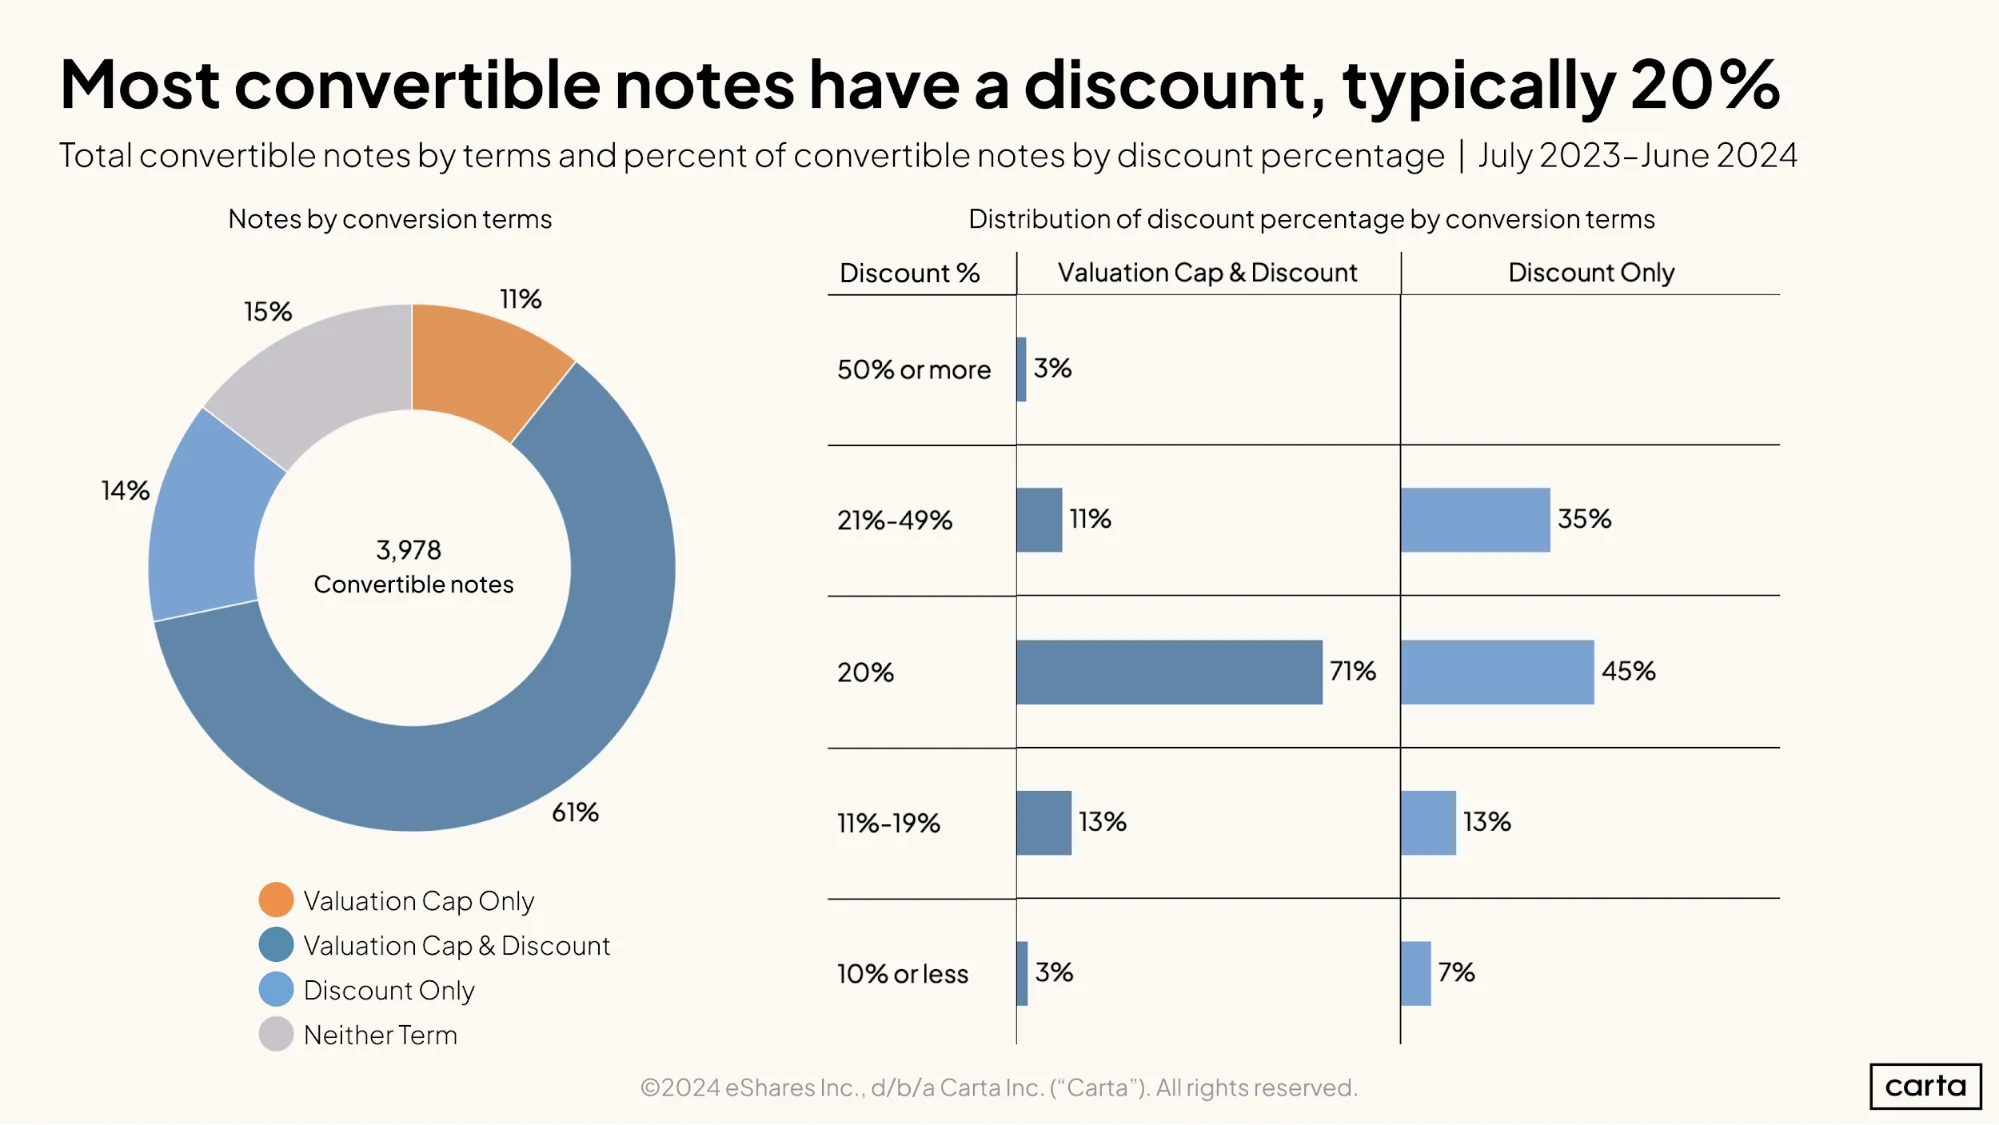
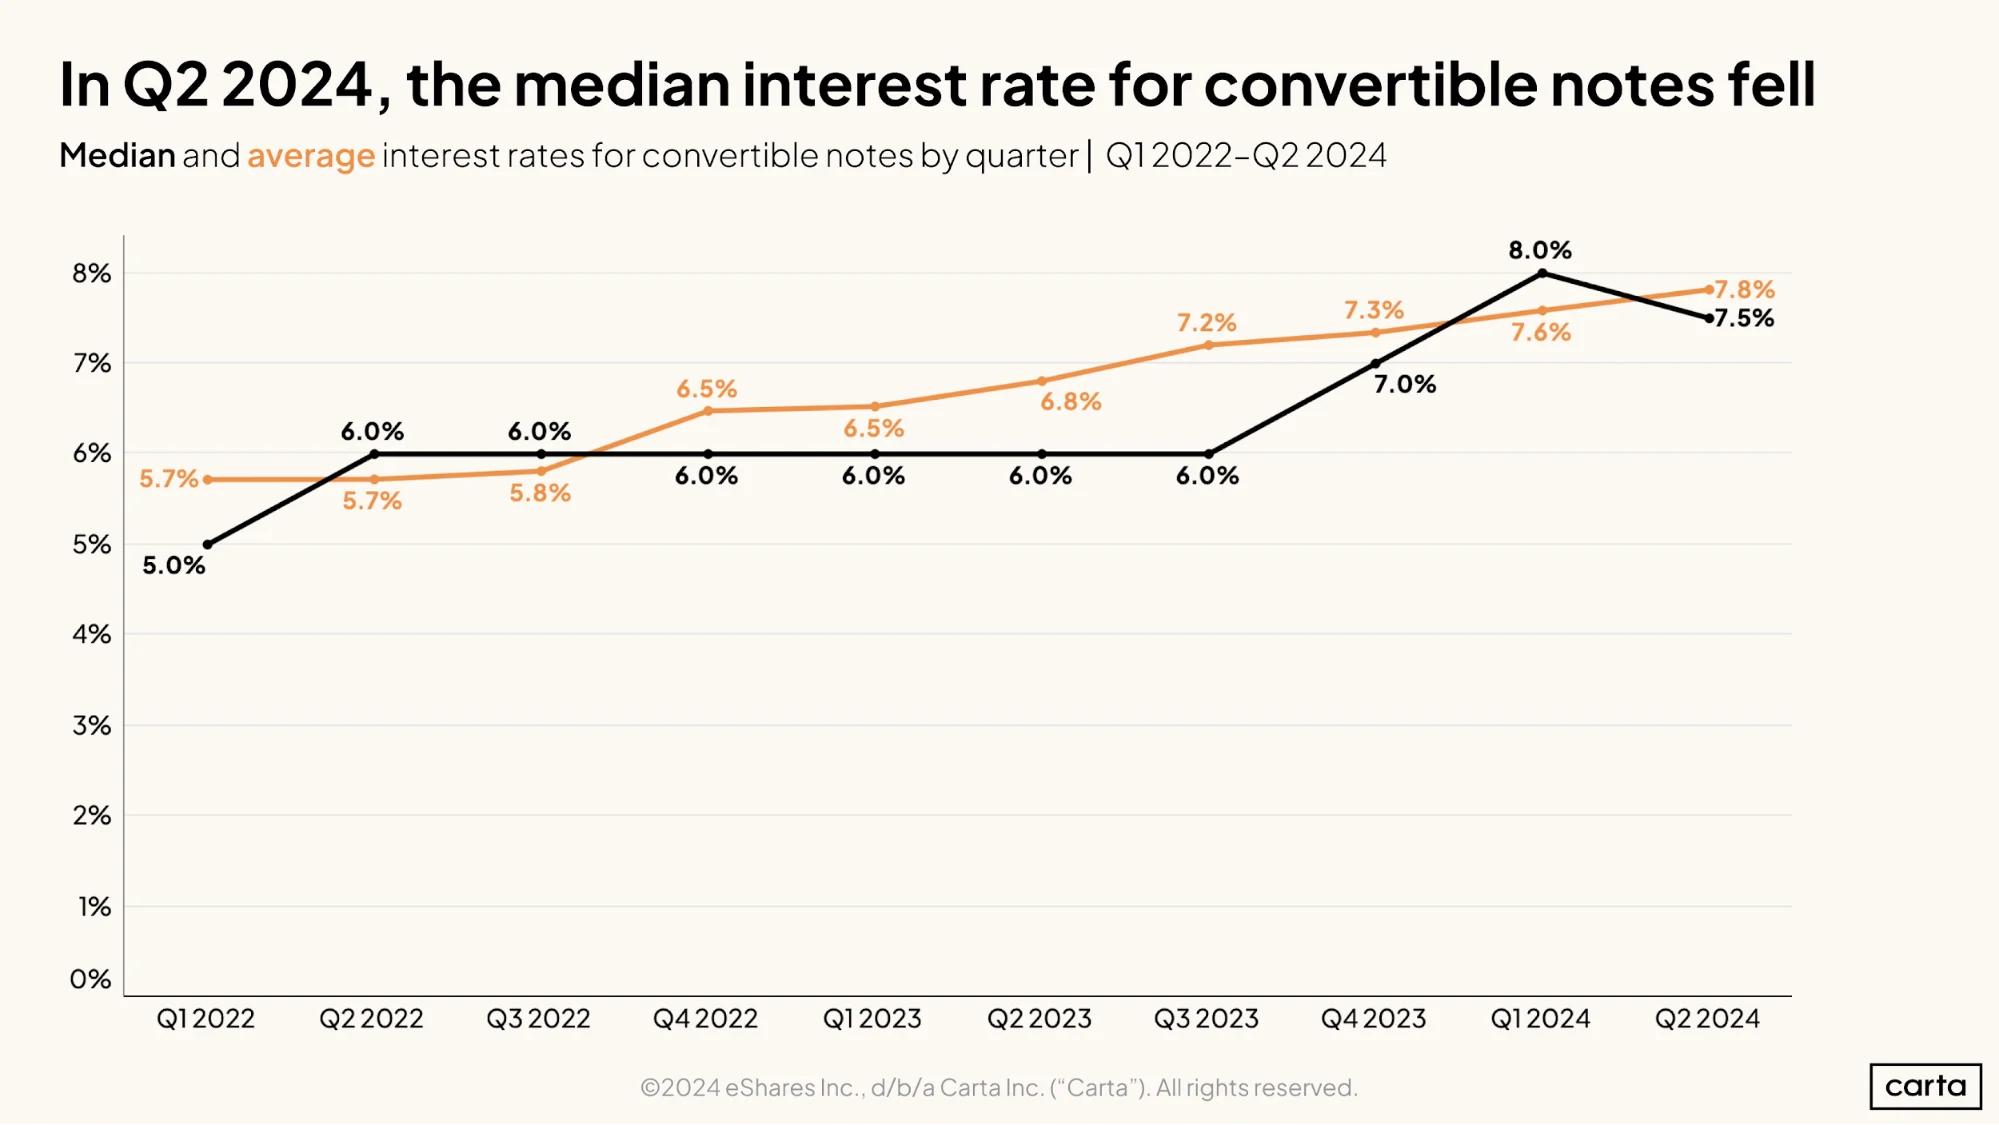
Convertible notes
A new home for Carta Data
Download industry data
Fill out the form below to view the complete report, which includes industry-specific analysis of pre-seed investment.
Methodology
Carta helps more than 45,000 primarily venture-backed companies and 2,400,000 security holders manage over $3.0 trillion in equity. We share insights from this unmatched dataset about the private markets and venture ecosystem to help founders, employees, and investors make informed decisions and understand market conditions.
Overview
This study uses an aggregated and anonymized sample of Carta customer data. Companies that have contractually requested that we not use their data in anonymized and aggregated studies are not included in this analysis.
The data presented in this private markets report represents a snapshot as of August 7, 2024. Historical data may change in future studies because there is typically an administrative lag between the time a transaction took place and when it is recorded in Carta. In addition, new companies signing up for Carta’s services will increase historical data available for the report.