Founders - use our current benchmark data to help raise your next VC round.
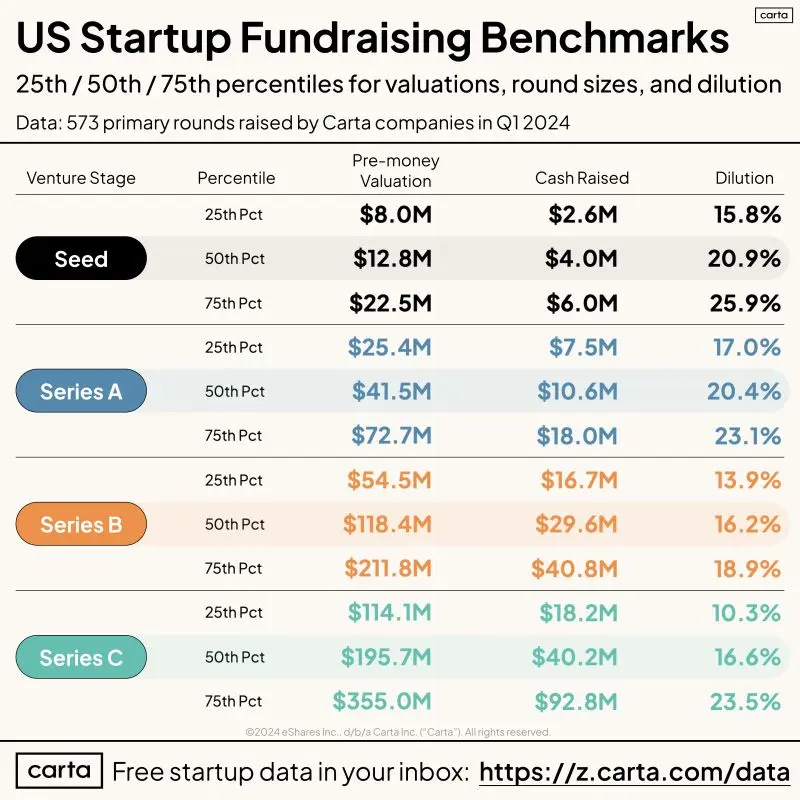
Broken out into 25th, 50th, and 75th percentiles so you can place your fundraise within the broad current market.
𝗩𝗮𝗹𝘂𝗮𝘁𝗶𝗼𝗻𝘀
All numbers in the chart below are pre-money valuations for primary rounds only in Q1 2024. Cleanest round information you can find.
Seed and Series A basically held flat from Q4 while B and C saw some median valuation growth.
𝗖𝗮𝘀𝗵 𝗥𝗮𝗶𝘀𝗲𝗱
All numbers reflect the total amount raised in a given round.
Gentle climb upwards for most stages from Q2 but nothing major shifted.
𝗗𝗶𝗹𝘂𝘁𝗶𝗼𝗻
Percentages in the chart reflect the total equity sold to investors in the round. Does not include any conversions from SAFEs or Notes.
𝗞𝗲𝘆 𝘁𝗵𝗶𝗻𝗴𝘀 𝘁𝗼 𝗸𝗻𝗼𝘄 𝗮𝗯𝗼𝘂𝘁 𝗤𝟭
1. Not a great quarter. I was hopeful fundraising overall would pop back but it was another muddle through affair. $16 billion raised in Q1 vs...$16B in Q4.
2. Highest share of down rounds since Carta stared tracking this stat in 2016. Many founders and investors are shaking over the overvaluation hangover of 2021.
3. Dilution in a median primary round continues to just basically hold flat. Around 20% for seed and Series A, then progressively lower for later rounds.
4. The median time between a Series A and Series B is approaching 2.5 years. Plan for your current dollars to last longer than you think!
5. The dream of M&A remains just a dream for most companies. About 150 startups that use Carta were acquired in Q1, slightly more than in Q4. But the M&A deluge has yet to happen.
Our full State of Private Markets report for Q1 is now live. Head over to this link to for full results, including a downloadable breakout by industry: https://lnkd.in/gU8BMA7F
If you want this graphic for your industry, shout that out in the comments below.
May this spring be better!

DISCLOSURE: This communication is on behalf of eShares, Inc. dba Carta, Inc. ("Carta"). This communication is for informational purposes only, and contains general information only. Carta is not, by means of this communication, rendering accounting, business, financial, investment, legal, tax, or other professional advice or services. This publication is not a substitute for such professional advice or services nor should it be used as a basis for any decision or action that may affect your business or interests. Before making any decision or taking any action that may affect your business or interests, you should consult a qualified professional advisor. This communication is not intended as a recommendation, offer or solicitation for the purchase or sale of any security. Carta does not assume any liability for reliance on the information provided herein. © 2026 Carta. All rights reserved. Reproduction prohibited.