
While there’s no singular path within the venture ecosystem, we know that being an equity-earning employee at any level is often a springboard. People get a job with equity compensation, building both experience and wealth—and at some point, they may make the jump to starting their own company or becoming an investor.
But we also know that not everyone is equally likely to take these leaps. We examine this topic annually in as many areas as possible, in our annual equity report. And we keep examining this data throughout the year to understand where ownership can be expanded and where we see changes.
Race and ethnicity across the venture ecosystem
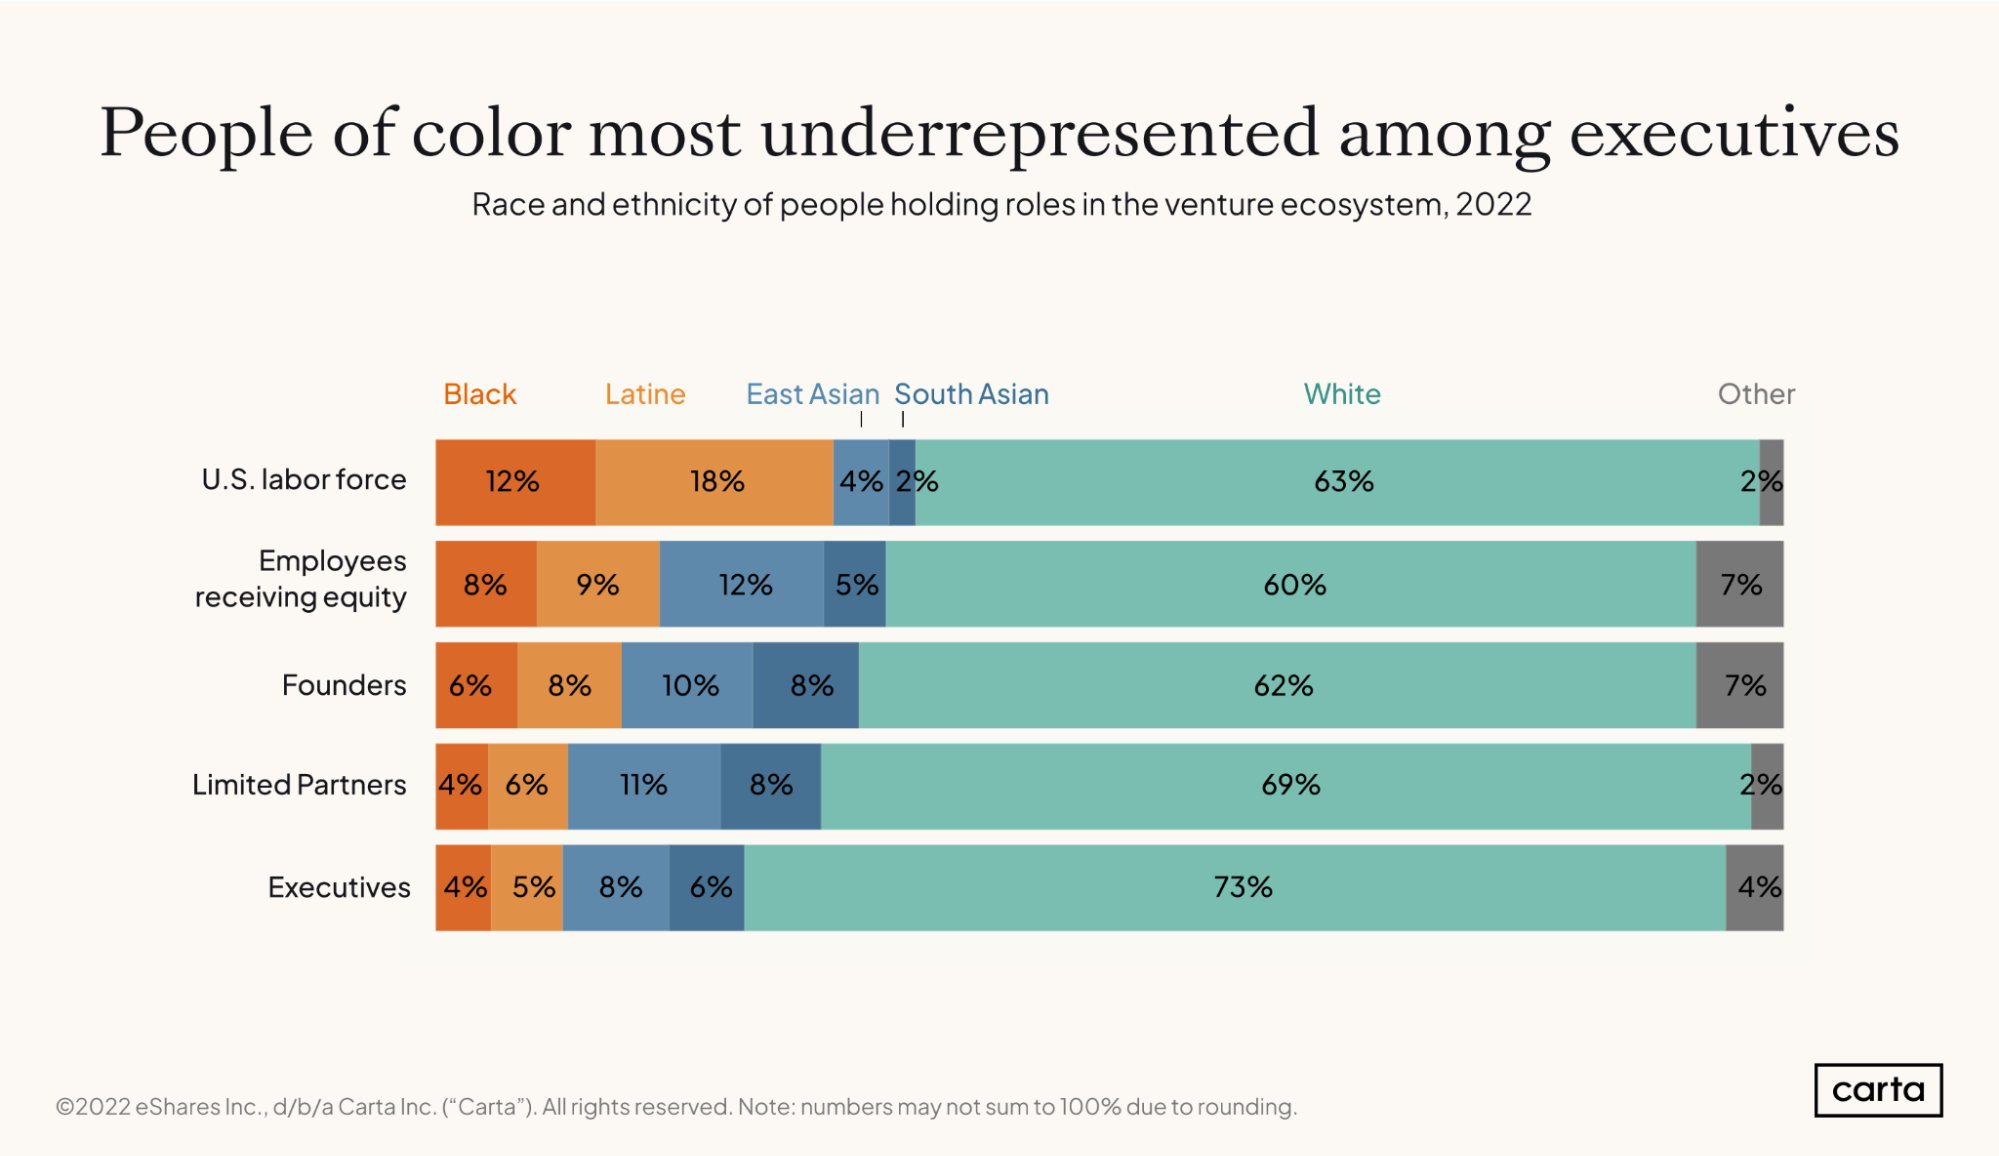
The above chart juxtaposes the breakdown of certain roles within the venture ecosystem, as well as the U.S. labor force as a whole, by race and ethnicity.
Black and Latine employees are underrepresented
We see that Black and Latine workers are less represented in each of these positions in the venture ecosystem than they are in the U.S. labor force as a whole. Latine workers are particularly underrepresented among employees earning equity, where we see just over half (52%) of the number of people we’d expect if the demographics of startup employees reflected those of the U.S. labor force as a whole. The underrepresentation of both Black and Latine employees is most pronounced at the executive level, where we see only about a third of the number of Black and Latine executives that we’d expect.
East Asian employees still face obstacles
East and South Asian employees are more represented within all of these roles than in the U.S. labor force. East Asians, however, make up a smaller percentage among executives than among employees at all levels, suggesting that there may still be a glass ceiling.
People of color are more common among founders than execs
People of color, and particularly Black and Latine people, are more represented among founders than they are among executives, possibly suggesting that people of color are seeking a seat at the table by building their own tables. This is especially true among the youngest cohorts: Whereas 7.3% of employees aged 21 to 30 are Black, 9.3% of founders in this age range are. We saw a similar but smaller difference for Latine employees, who represent 10.0% of employees and 10.4% of founders aged 21 to 30.
Every year, we invite founders, investors, operators, and leaders to talk about our annual report—and the state of the ecosystem—at the Carta Equity Summit each year.

DISCLOSURE: This communication is on behalf of eShares Inc., d/b/a Carta Inc. (“Carta”). This communication is for informational purposes only, and contains general information only. Carta is not, by means of this communication, rendering accounting, business, financial, investment, legal, tax, or other professional advice or services. This publication is not a substitute for such professional advice or services nor should it be used as a basis for any decision or action that may affect your business or interests. Before making any decision or taking any action that may affect your business or interests, you should consult a qualified professional advisor. This communication is not intended as a recommendation, offer or solicitation for the purchase or sale of any security. Carta does not assume any liability for reliance on the information provided herein. ©2023 eShares Inc., d/b/a Carta Inc. (“Carta”). All rights reserved. Reproduction prohibited.