The private secondary market started last year with a bang—the busiest first half ever for secondary activity on Carta. It ended the year with a murmur.
Now, the question puzzling the entire private secondary market is how long the current chill will last.
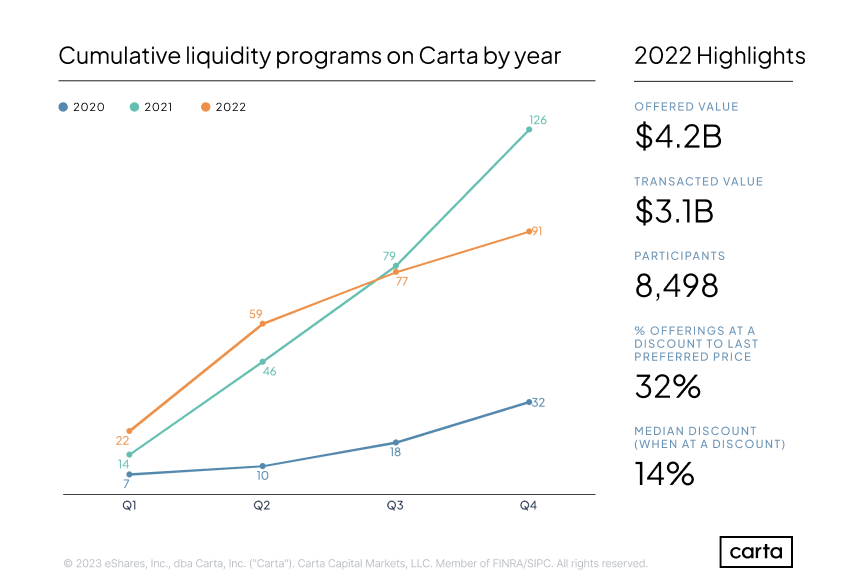
There were a total of 91 secondary transactions on Carta in 2022, with a combined value of $3.1 billion. Deal count was down nearly 30% year over year, while annual transaction value fell 58% from 2021. Nearly two-thirds of the secondary transactions that took place on Carta occurred during the first half of the year, showing a clear second-half slowdown. This shift parallels last year’s pullback in the public markets. Given the timeline to execute and settle a tender offer, many of the transactions completed early in 2022 were structured and launched during the white-hot market of late 2021.
The main cause of the recent lull in the secondary market is a lack of agreement about how to value private companies. Investors are seeking steep discounts, in line with how tech valuations have plunged on the public market over the past year. Because private markets are so opaque, public comparables typically serve as a valuation guidepost for primary venture rounds, and those primary valuations then inform the pricing of secondaries.
But companies are hesitant to lop off hundreds of millions of dollars from their latest valuations due to macro upheaval. Many are taking a measured approach to shareholder liquidity to avoid substantial valuation markdowns.
Some transactions are still taking place. But the pace has cooled off, and the makeup of the market has evolved. Appetite is increasing for smaller transactions and decreasing for mega-deals. There’s still a strong desire for liquidity events, but many companies are choosing to hold off amid this pricing environment.
In the market for private block trades, many sellers are now accepting discounts of 20% to 30%. But that’s not enough to win over buyers who are seeking discounts of 50% or more. Sellers have proven more likely to compromise on price than buyers, particularly if they have near-term liquidity needs. Still, many investors are choosing to wait rather than invest at current prices. They’re seeking more clarity on macro factors such as public company financial projections and the ongoing wave of tech layoffs, and hoping that clarity will lead to better deals.
The market for company-sponsored tender offers has also transformed over the past several months, with a shift toward smaller deals. Larger tenders worth tens or even hundreds of millions of dollars, commonplace a year ago, are now rare. The average size of all secondary transactions on Carta in this year’s second half was $18.5 million, compared to $64.4 million in H2 2021. Some of the tenders taking place are designed not to help shareholders cash out, but rather to achieve other goals, such as repricing stock options or an RSU exchange (in which employees can exchange existing stock options for restricted stock units). These non-liquidity tender offers tend to be much smaller, contributing to 2022’s reduction in deal value.
If a company can’t find outside investors for a tender offer at an attractive price, it could still provide liquidity to shareholders by buying back its own shares through a tender offer. But under the current macro conditions, many companies have other priorities for their balance sheet capital.
So, what are buyers and sellers waiting for? The primary variable is valuations. The slowdown in the private secondary market will likely continue until valuations—and particularly tech valuations—begin to stabilize in the public market, reducing uncertainty. Some companies may wait for a larger valuation rebound before pursuing a liquidity program, thus reducing the threat of a down round. If valuations remain depressed, pressure on companies to accept lower multiples as the new normal will increase.
Dealmakers also have an eye on the market for primary venture funding, which has seen its own decline in activity in recent months, particularly at later stages. This has a chilling effect on tender offers. Tenders often closely follow primary rounds, giving investors a way to access additional shares if the round was oversubscribed. The pricing of recent primary rounds can also serve as a baseline for pricing a tender offer. An upturn in VC activity would be a good sign for the tender market—and with hundreds of billions in dry powder stocked up, venture investors have plenty of ammo.
Investors and companies are still watching and waiting. A wave of activity in 2021 and the first half of 2022 established liquidity as the norm for private-market companies, serving as a useful tool to both attract and retain talent. That appeal hasn’t changed. What’s changed is the rest of the market.
If that broader market bounces back in 2023, there is a full pipeline of companies and shareholders looking for secondary transactions. But for now, most companies are still prioritizing things like profitability and conserving balance sheet capital over the prospect of providing liquidity.
The Carta liquidity team is here to help you and your company navigate the evolving private markets. Write to us at company_coverage@cartacapitalmarkets.com.
Which companies are choosing liquidity?
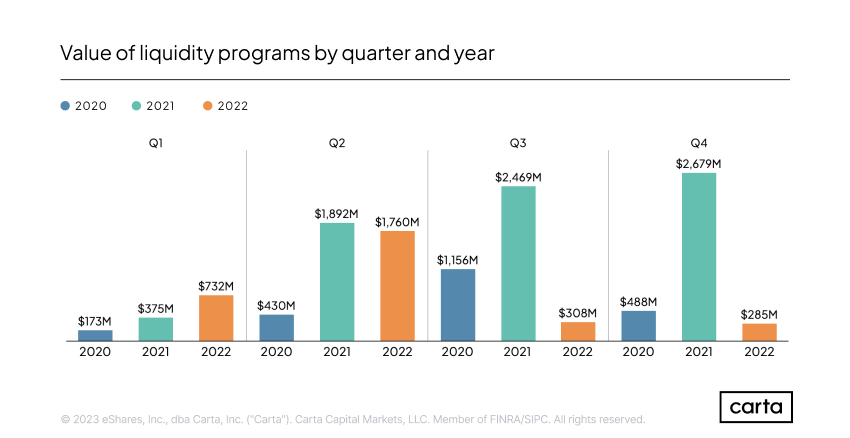
How stark was the market’s shift between the first half of 2022 and the second half? Overall deal value in H2 was $593 million, accounting for just 19% of the full-year total. Nearly as much money changed hands during just the fourth quarter of 2021 (about $2.7 billion) as in all of 2022 combined ($3.1 billion).
There’s been a shift in the secondary liquidity market toward earlier stages of the startup lifecycle. About 41% of liquidity programs on Carta in 2022 involved companies coming off a Series A or Series B round of funding, a significant jump from 21% for the same figure in 2021. The share of secondary transactions coming from companies at Series D or later, meanwhile, fell from 55% to 41%.
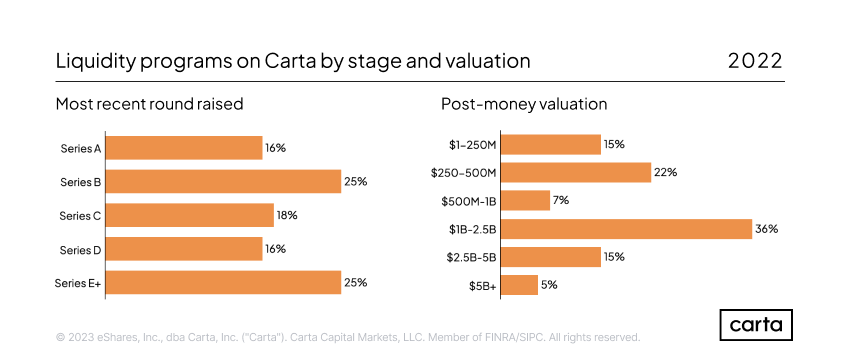
This is likely a factor of the valuation environment. Later-stage companies are more directly affected by sinking valuations on the public market, because late-stage companies are theoretically closer to going public than earlier-stage peers. More mature companies have been hesitant to transact at significantly reduced valuations, while younger startups are more insulated from recent turmoil in the public markets.
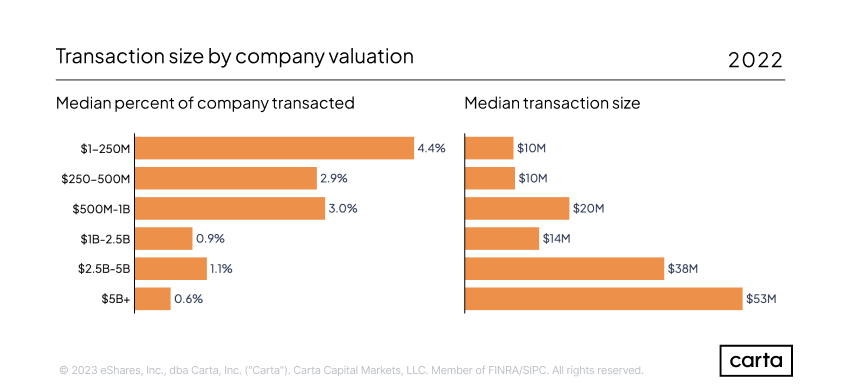
The smallest of companies are executing larger secondary transactions than before. Among companies valued at $250 million or less, the median secondary deal in 2022 was worth $10 million and comprised 4.4% of the company. In 2021, the median transaction among these companies was worth $3.2 million and involved 2.9% of all outstanding shares.
Download the report
For additional insights into how the liquidity market has evolved in 2022, including information on transaction subscription rates and seller participation, download the full report in PDF.
Methodology
Carta helps more than 34,000 primarily venture-backed companies and 2,100,000 security holders manage equity. Our liquidity report examines trends in secondary liquidity to promote transparency and to help investors, companies, and employees make informed decisions.
The data presented in this liquidity report include snapshots as of December 31, 2022, of tender offers and other secondary trades conducted by Carta. With the exception of the list of law firms enabling liquidity programs, data used in this study is aggregated and anonymized. Companies that have contractually requested that we not use their data in anonymized and aggregated studies are not included in this analysis.
Transactions are reported based on their settlement date. Historical data may change in future studies due to administrative lags for transactions to be recorded in Carta, or to reflect calculation updates and corrections. Industry groupings are based on self-reported industry information, which Carta completed and normalized for the purpose of this study.

DISCLOSURE: This publication contains general information only and eShares, Inc. dba Carta, Inc. (“Carta”), and its affiliates, are not, by means of this publication, rendering accounting, business, financial, investment, legal, tax, or other professional advice or services. This publication is not a substitute for such professional advice or services nor should it be used as a basis for any decision or action that may affect your business or interests. Before making any decision or taking any action that may affect your business or interests, you should consult a qualified professional advisor. This communication is not intended as a recommendation, offer or solicitation for the purchase or sale of any security. Carta does not assume any liability for reliance on the information provided herein. This report includes aggregate statistics of transactions on Carta, Inc. and CartaX. All product names, logos, and brands are property of their respective owners in the U.S. and other countries, and are used for identification purposes only. Use of these names, logos, and brands does not imply affiliation or endorsement. © 2023 eShares, Inc., dba Carta, Inc. (“Carta”). Carta Capital Markets, LLC, member FINRA/SIPC. All rights reserved.