Executive summary
At most stages of the fundraising lifecycle, founders in the Asia-Pacific, Middle East, and Africa (APAC & MEA) hold ownership stakes above their U.S. peers.
In both regions, the median founding team owns 51% of the company after raising a seed round. At each stage from Series A through Series C, median ownership among APAC & MEA founders is two to four percentage points more than for U.S. founders. The biggest gap is at Series A, where median ownership in APAC & MEA is 39%, compared to 35% in the U.S. By Series D+, the trend reverses, and U.S. founders are one point ahead (11% versus 10%).
The regions also differ in how company ownership is distributed beyond the founding team. APAC & MEA founders give up less equity than U.S. founders at Series A (17.7% median dilution versus 20.3%), and their companies reserve smaller ESOPs at most stages: 10% versus 12% at seed and 10.6% versus 17% at Series C. A smaller pool leaves less equity for later hires unless the pool is topped up, which dilutes founders, too.
This report analyzes founding structure, dilution, ownership retention, employee option pool sizing, and advisor and board equity across private companies headquartered in APAC & MEA on Carta. Where possible, analysis is broken out into four subregions: Australia and New Zealand (ANZ), East and Southeast Asia (ESEA), Middle East, North Africa, and South Asia (MENASA), and Sub-Saharan Africa (SSA). Comparisons to U.S. companies are provided throughout for reference.
Key takeaways
Solo founding is the most common structure: In APAC & MEA, 40% of startups founded in 2025 had a single founder, compared with 33% in the U.S. By industry, fintech stands out: only 31% of fintech companies launched in APAC & MEA since 2019 were solo-founded, and 16% were founded by teams of four or more.
APAC & MEA founders generally retain more ownership: From Series A through Series C, APAC & MEA founding teams tend to hold more equity than their U.S. counterparts. At Series C, the median founding team in APAC & MEA still owns 18% of the company, versus 16% for teams in the U.S.
ANZ stands apart on ESOP size: The median ESOP among ANZ companies is 13.3% of fully diluted equity, compared with 11.1% in SSA and 10.6% in both ESEA and MENASA. Even so, all four subregions sit below the U.S. median.
ESOPs are smaller than in the U.S., with one exception: At most stages, APAC & MEA companies allocate less of their fully diluted equity for ESOPs than U.S. companies. The exception is Series B, where the median is identical: 15.4% for both.
Founder journey
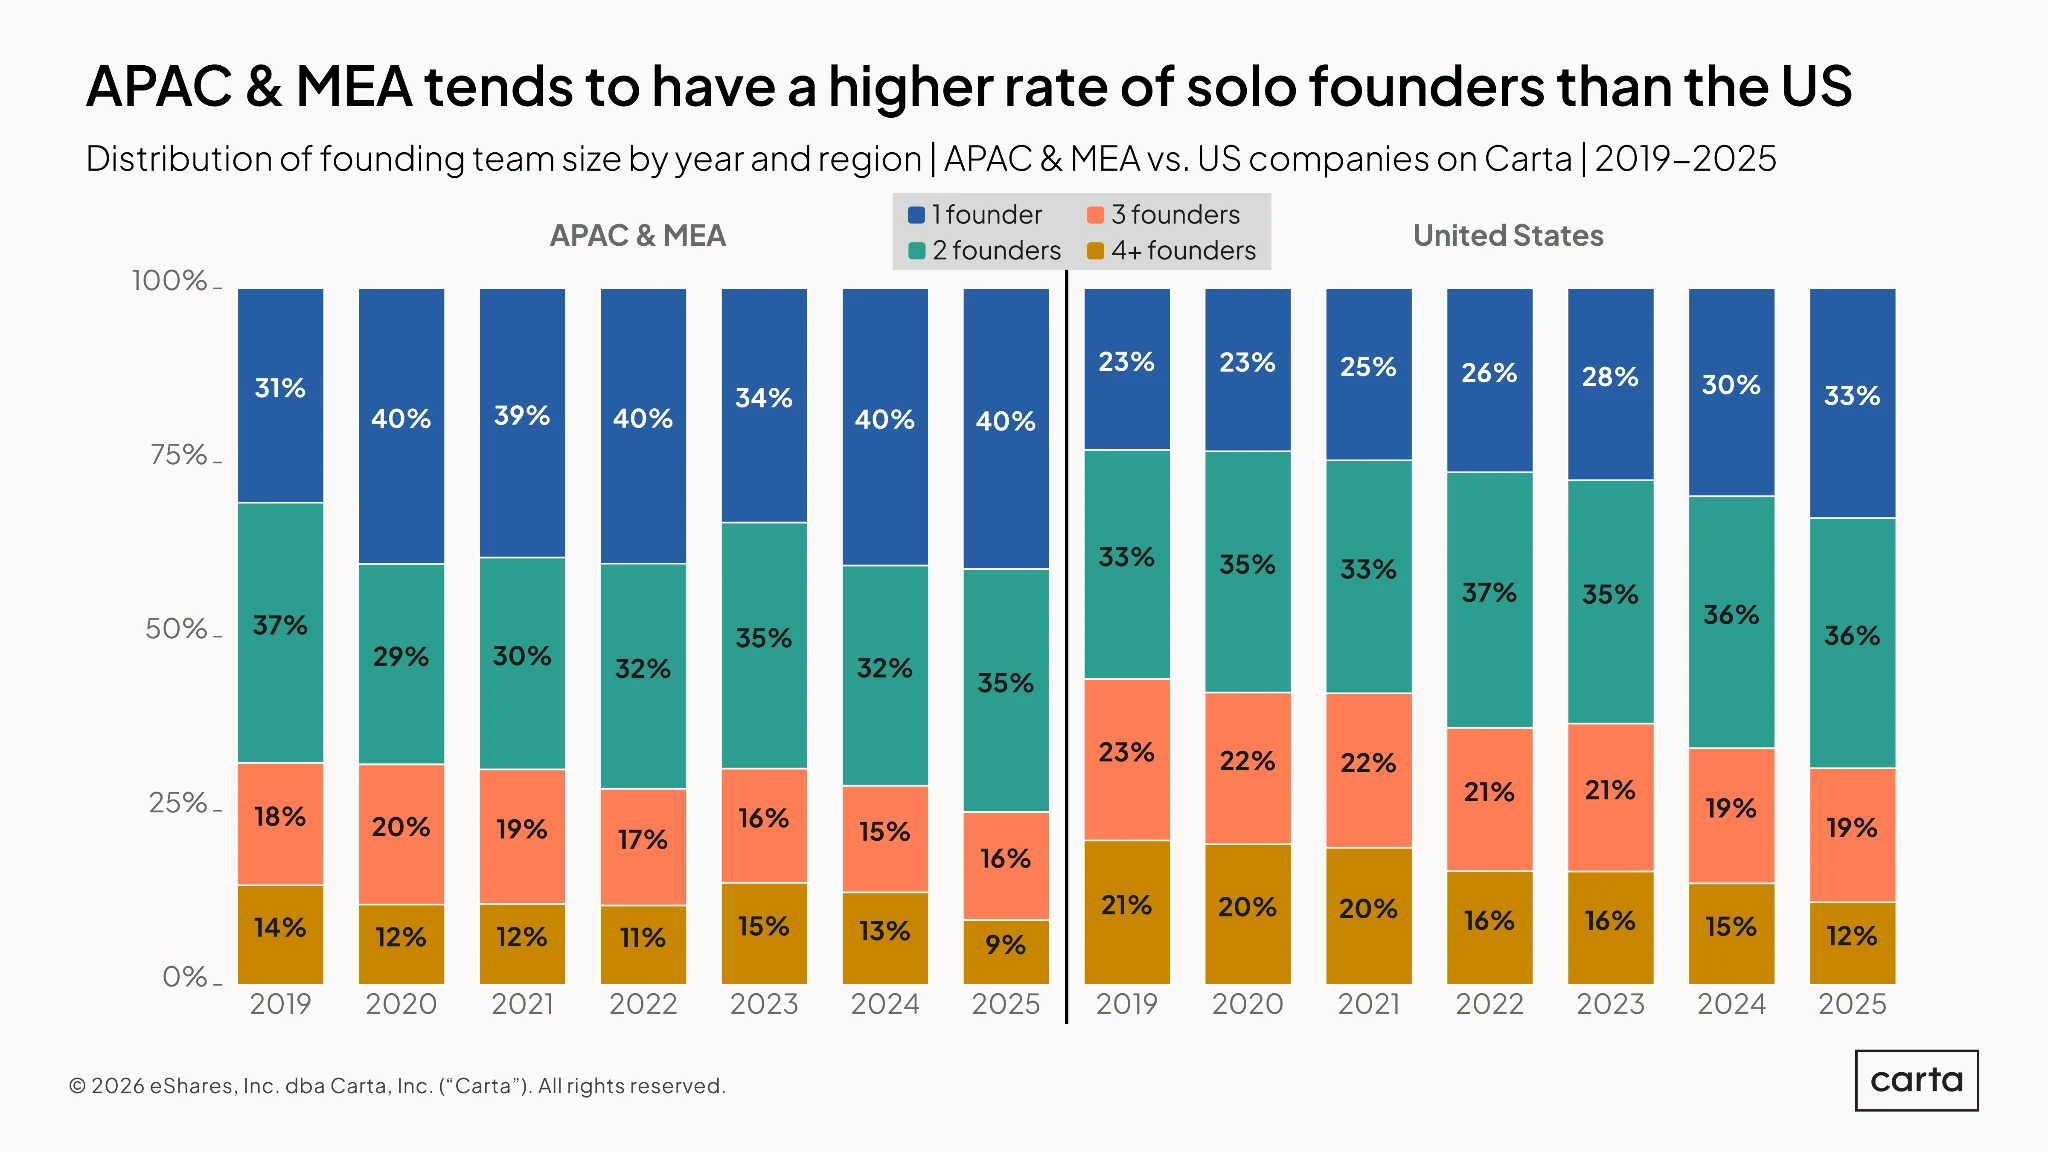
Going solo is the most common founding structure in APAC & MEA. Among APAC & MEA startups on Carta that were founded in 2025, 40% were founded by a single person, up from 31% in 2019. Throughout this period, the U.S. has had a lower prevalence of solo founders, reaching 33% in 2025. Both regions have similar rates of two-person teams, but APAC & MEA startups are less likely to have three or more founders.
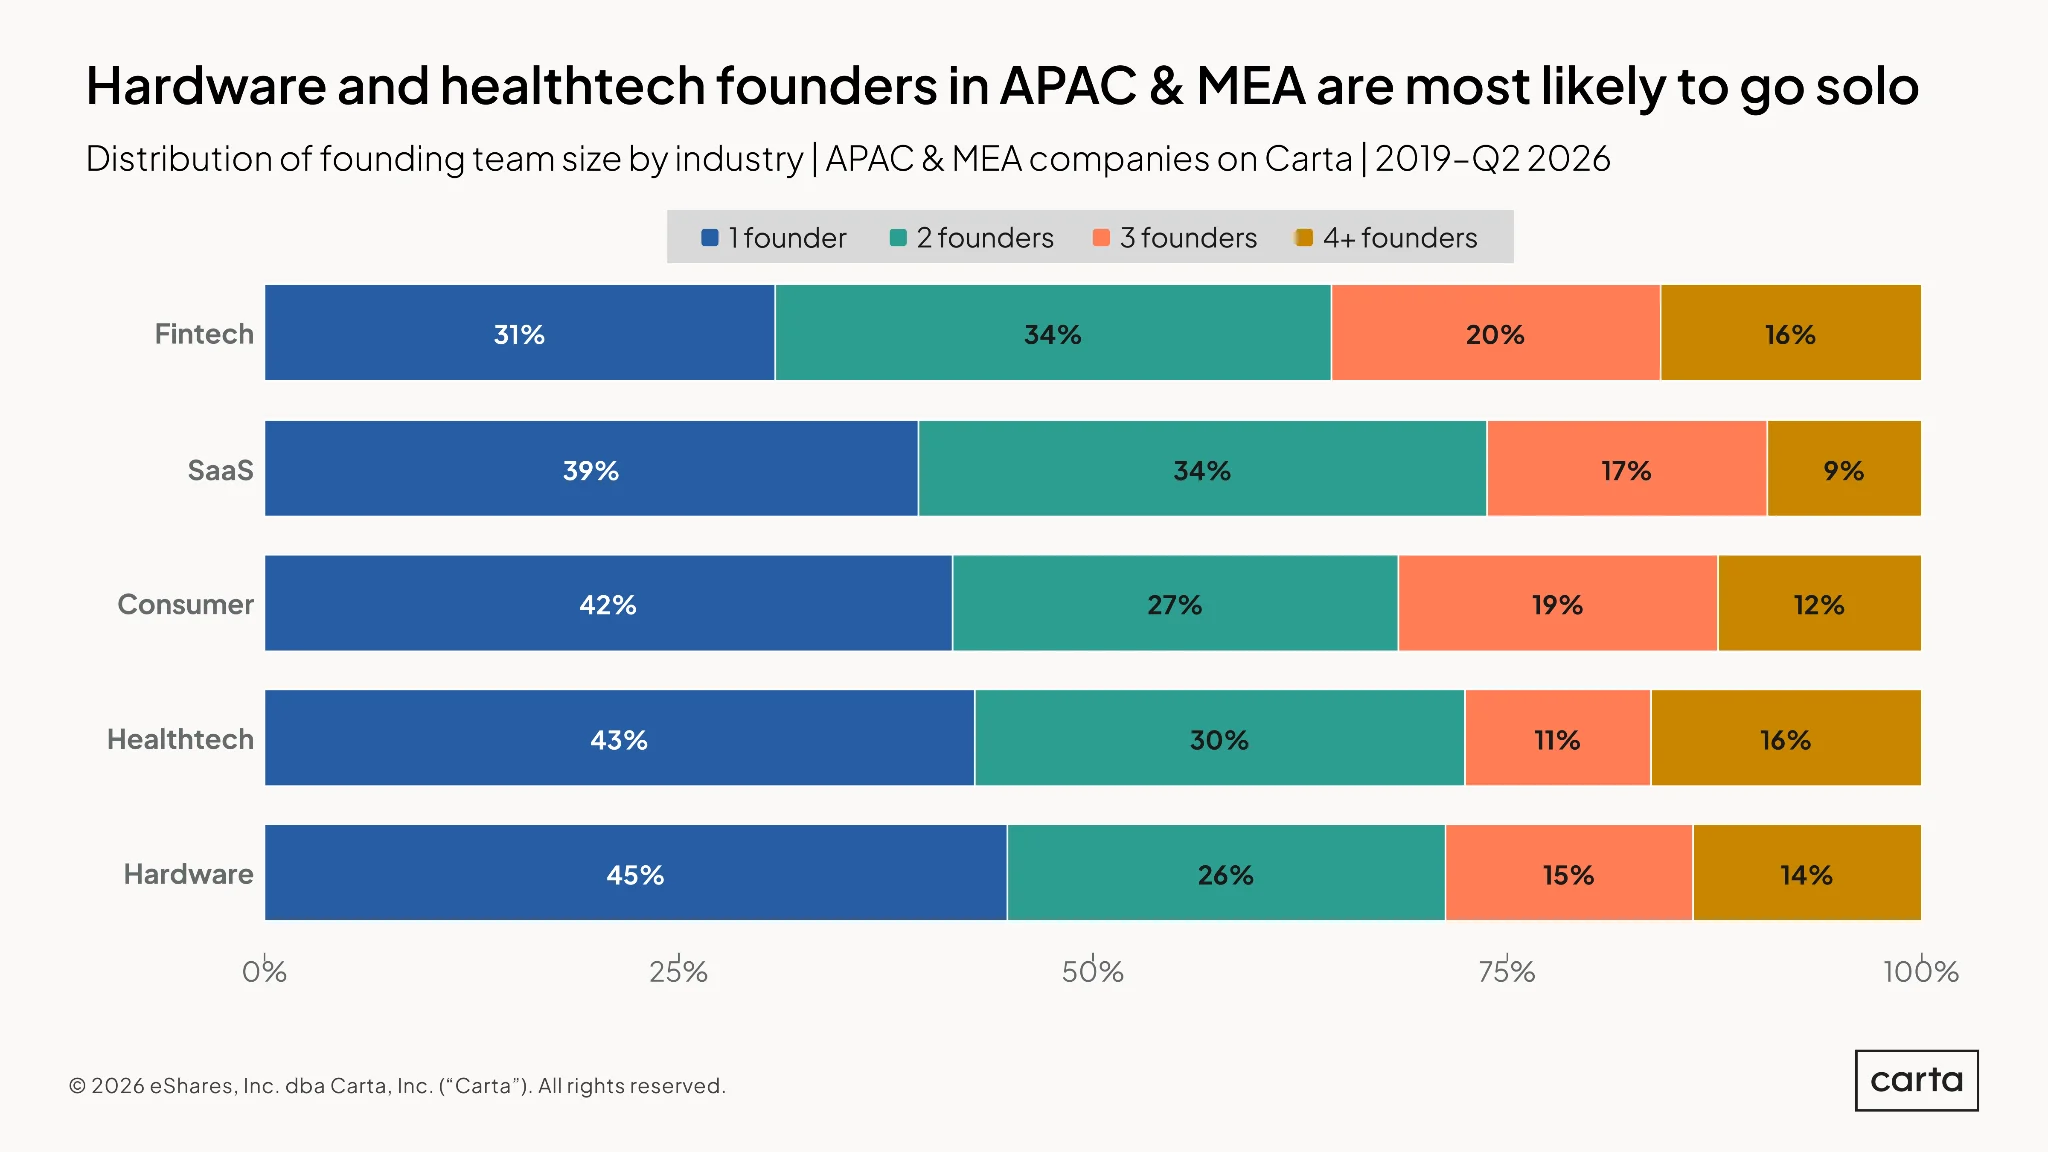
Hardware (45%) and healthtech (43%) have the highest rates of single founders in APAC & MEA among these major startup sectors. Fintech is different: only 31% of companies launched in the region since 2019 were solo-founded, and 16% were founded by teams of four or more.
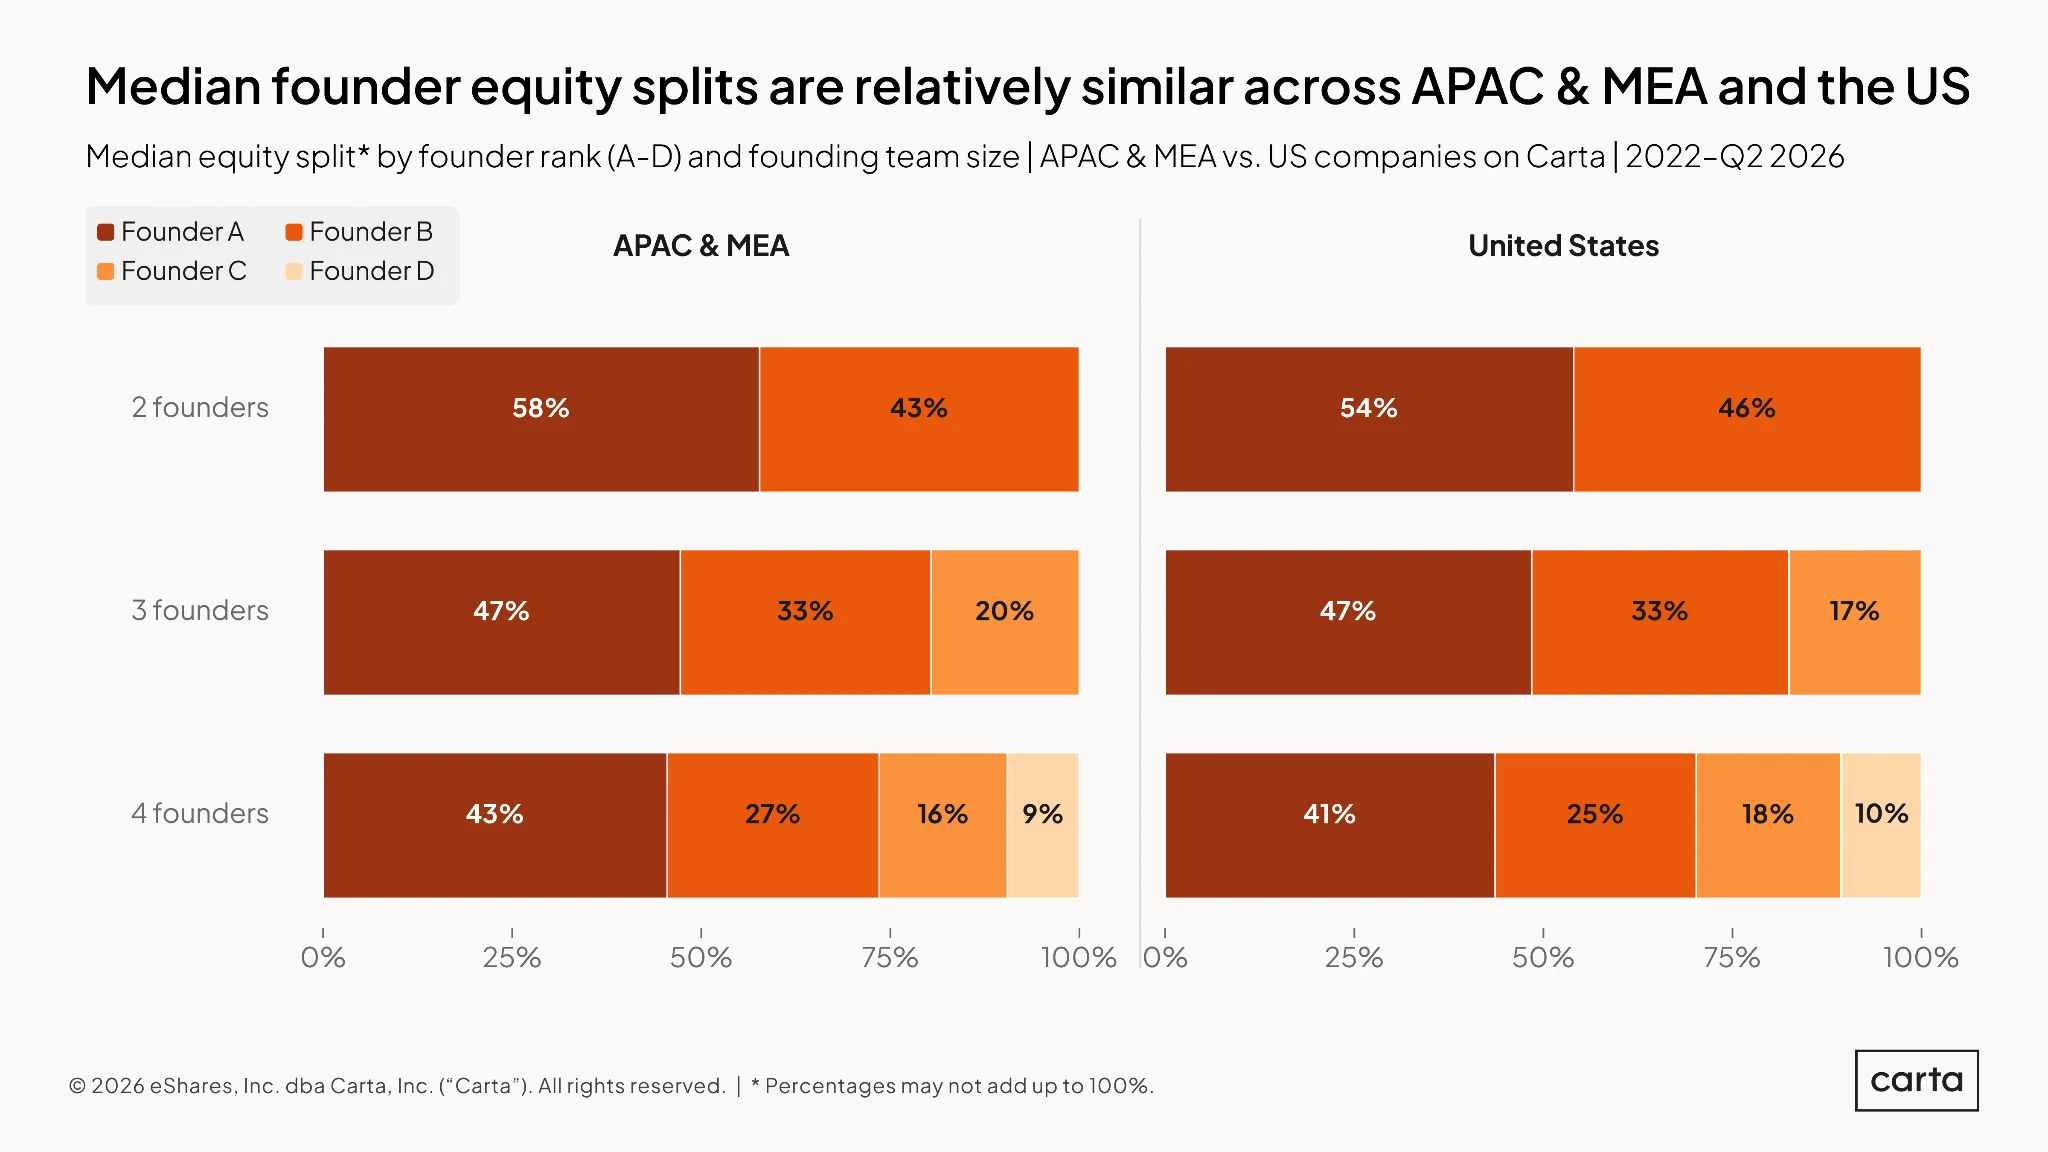
When APAC & MEA startups have two founders, the equity split between them tends to be less equal than it would be in the U.S. The median larger stake in an APAC & MEA two-founder team is 58%, versus 54% in the U.S. For three- and four-person teams, the regional gap mostly disappears, as the distributions across regions are nearly identical. In both regions, the lead founder, who is typically the CEO, receives an outsized portion while each successive cofounder gets a smaller stake.
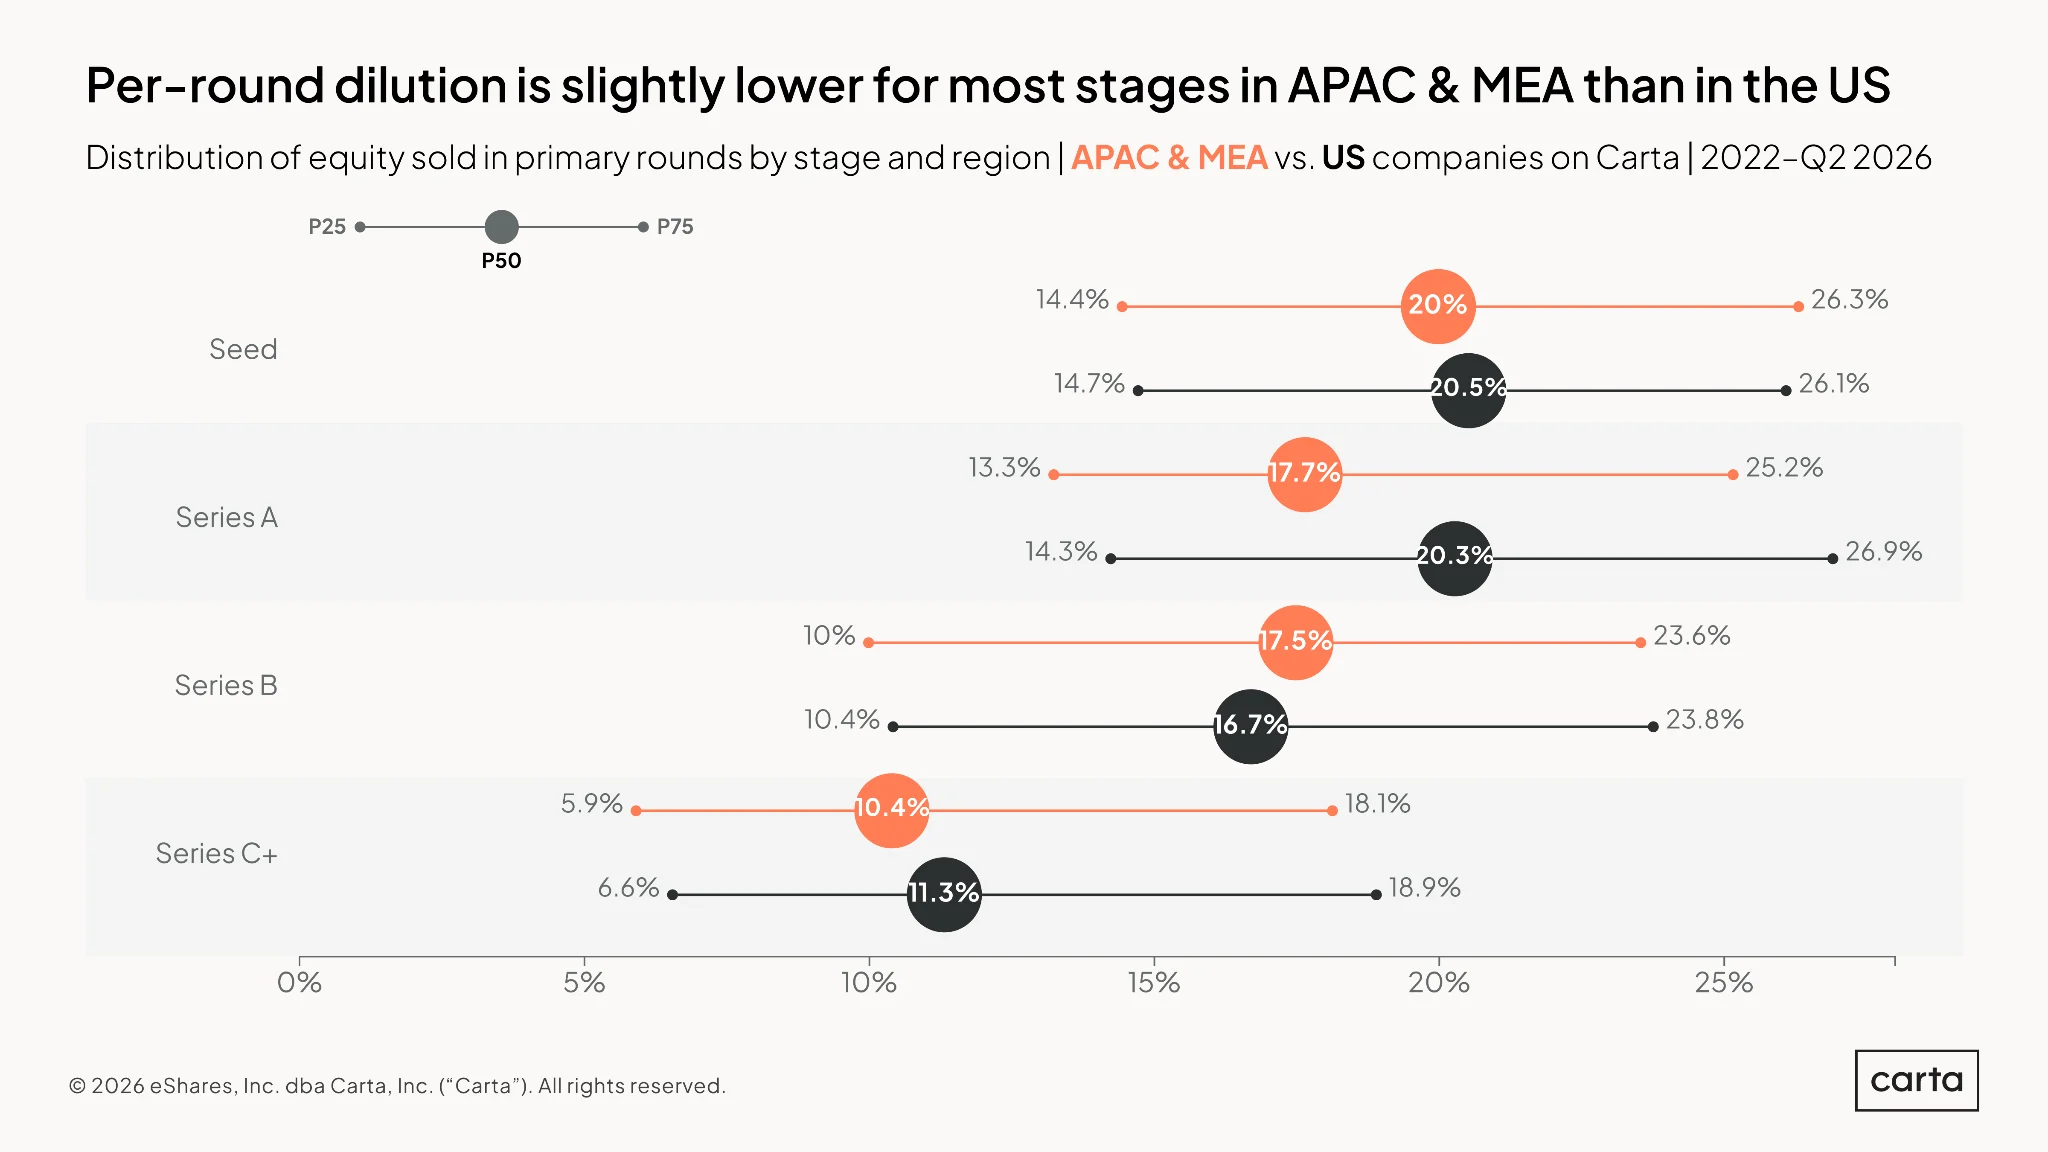
At most stages, APAC & MEA founders typically give up less equity when they raise a new round. At seed, median dilution in APAC & MEA from 2022 through Q2 2026 is 20%, versus 20.5% in the U.S. At Series A, the gap in median dilution is wider: 17.7% in APAC & MEA versus 20.3% in the U.S. Series B is the exception, with companies in APAC & MEA taking on slightly higher dilution than those in the U.S.
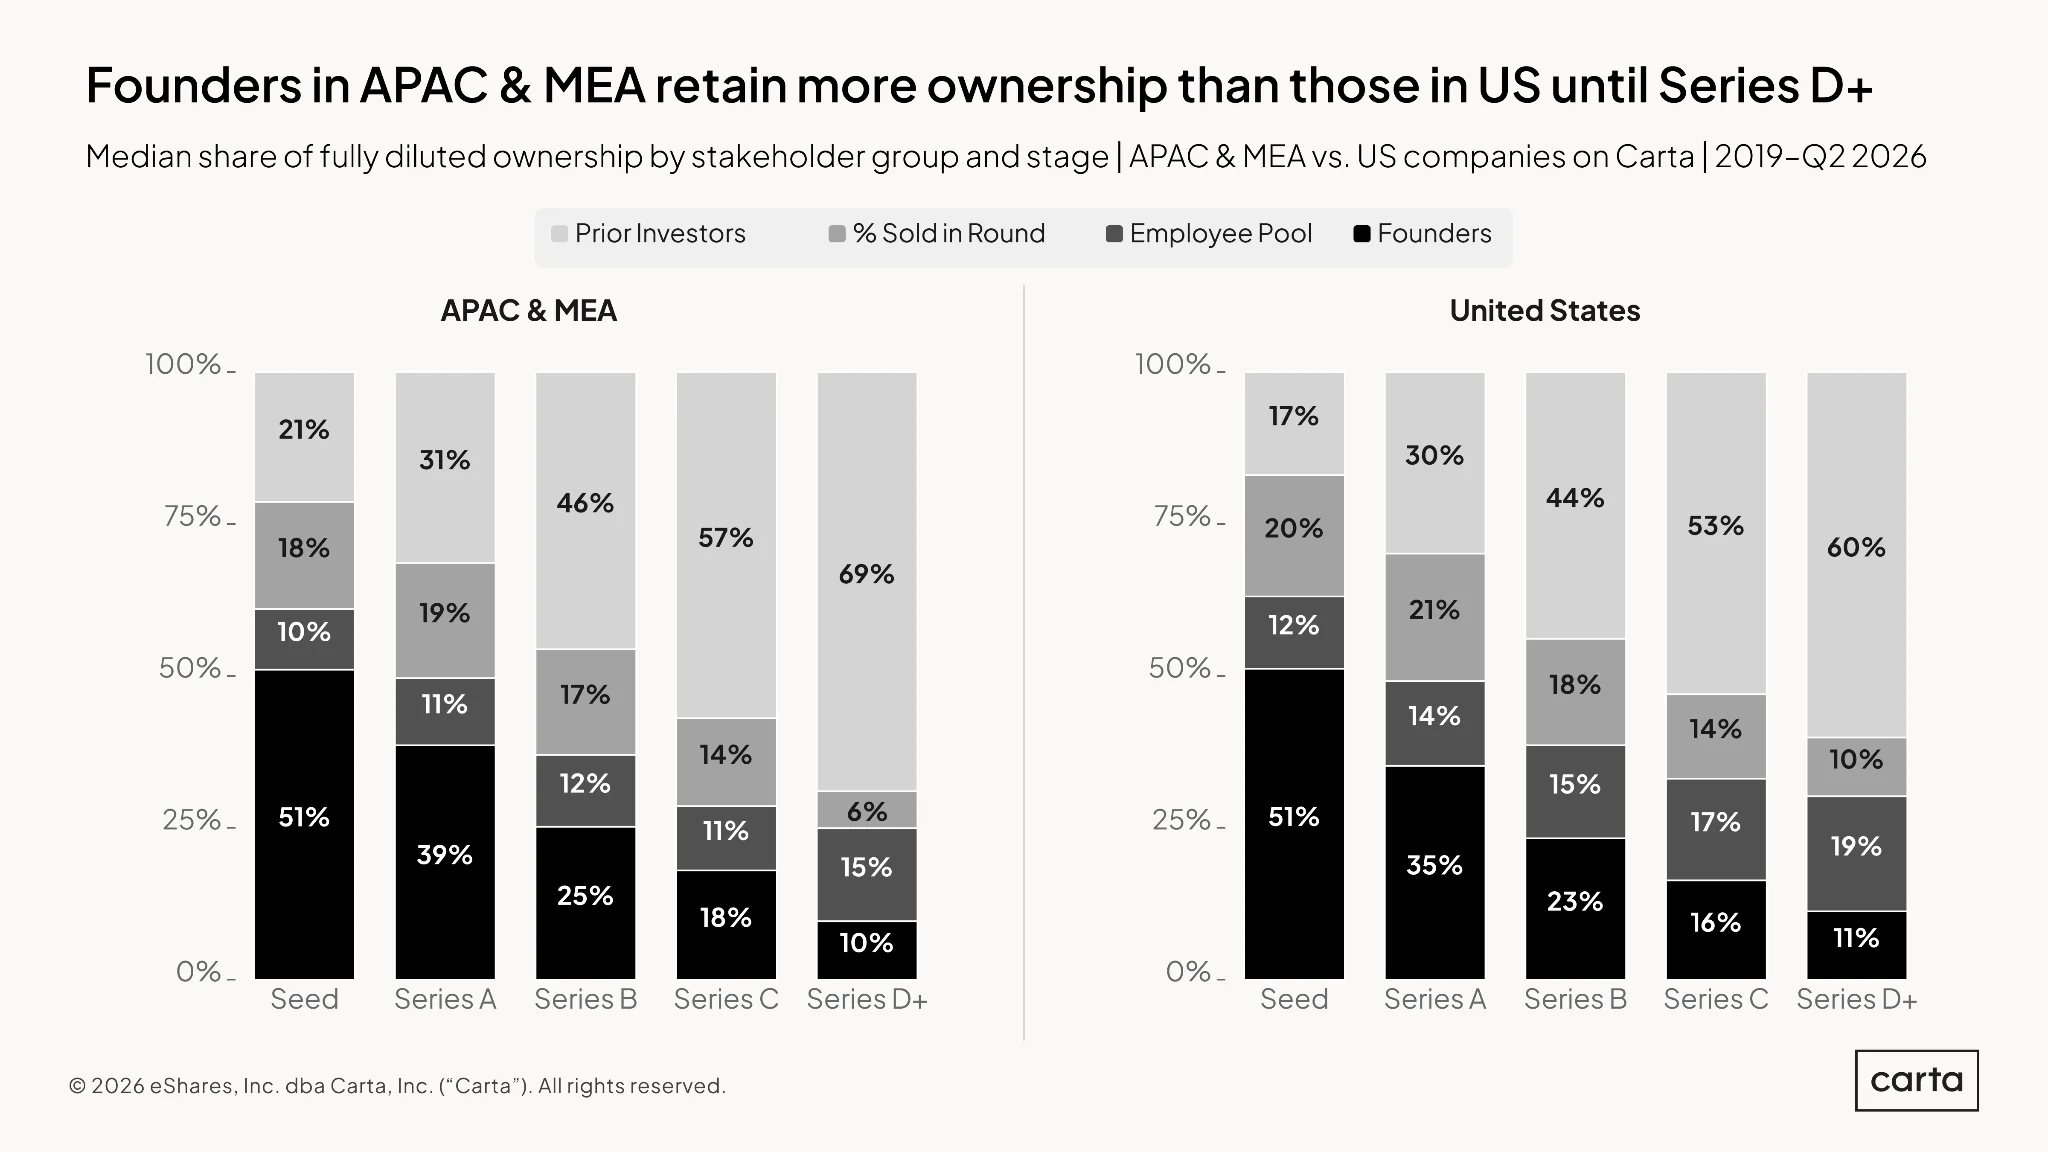
APAC & MEA founding teams retain slightly more ownership than their U.S. peers from Series A through Series C, driven mainly by smaller option pools and lower dilution rates. After raising a seed round, the median founding team in each region still owns 51% of their company. By Series C, the median APAC & MEA founding team holds 18% of fully diluted equity, versus 16% for founders in the U.S.
By the later stages of startup growth, however, the regional lead for APAC & MEA disappears. The median APAC & MEA founding team retains 10% ownership at Series D+, compared to 11% for U.S. founders.
Employee stock ownership plans
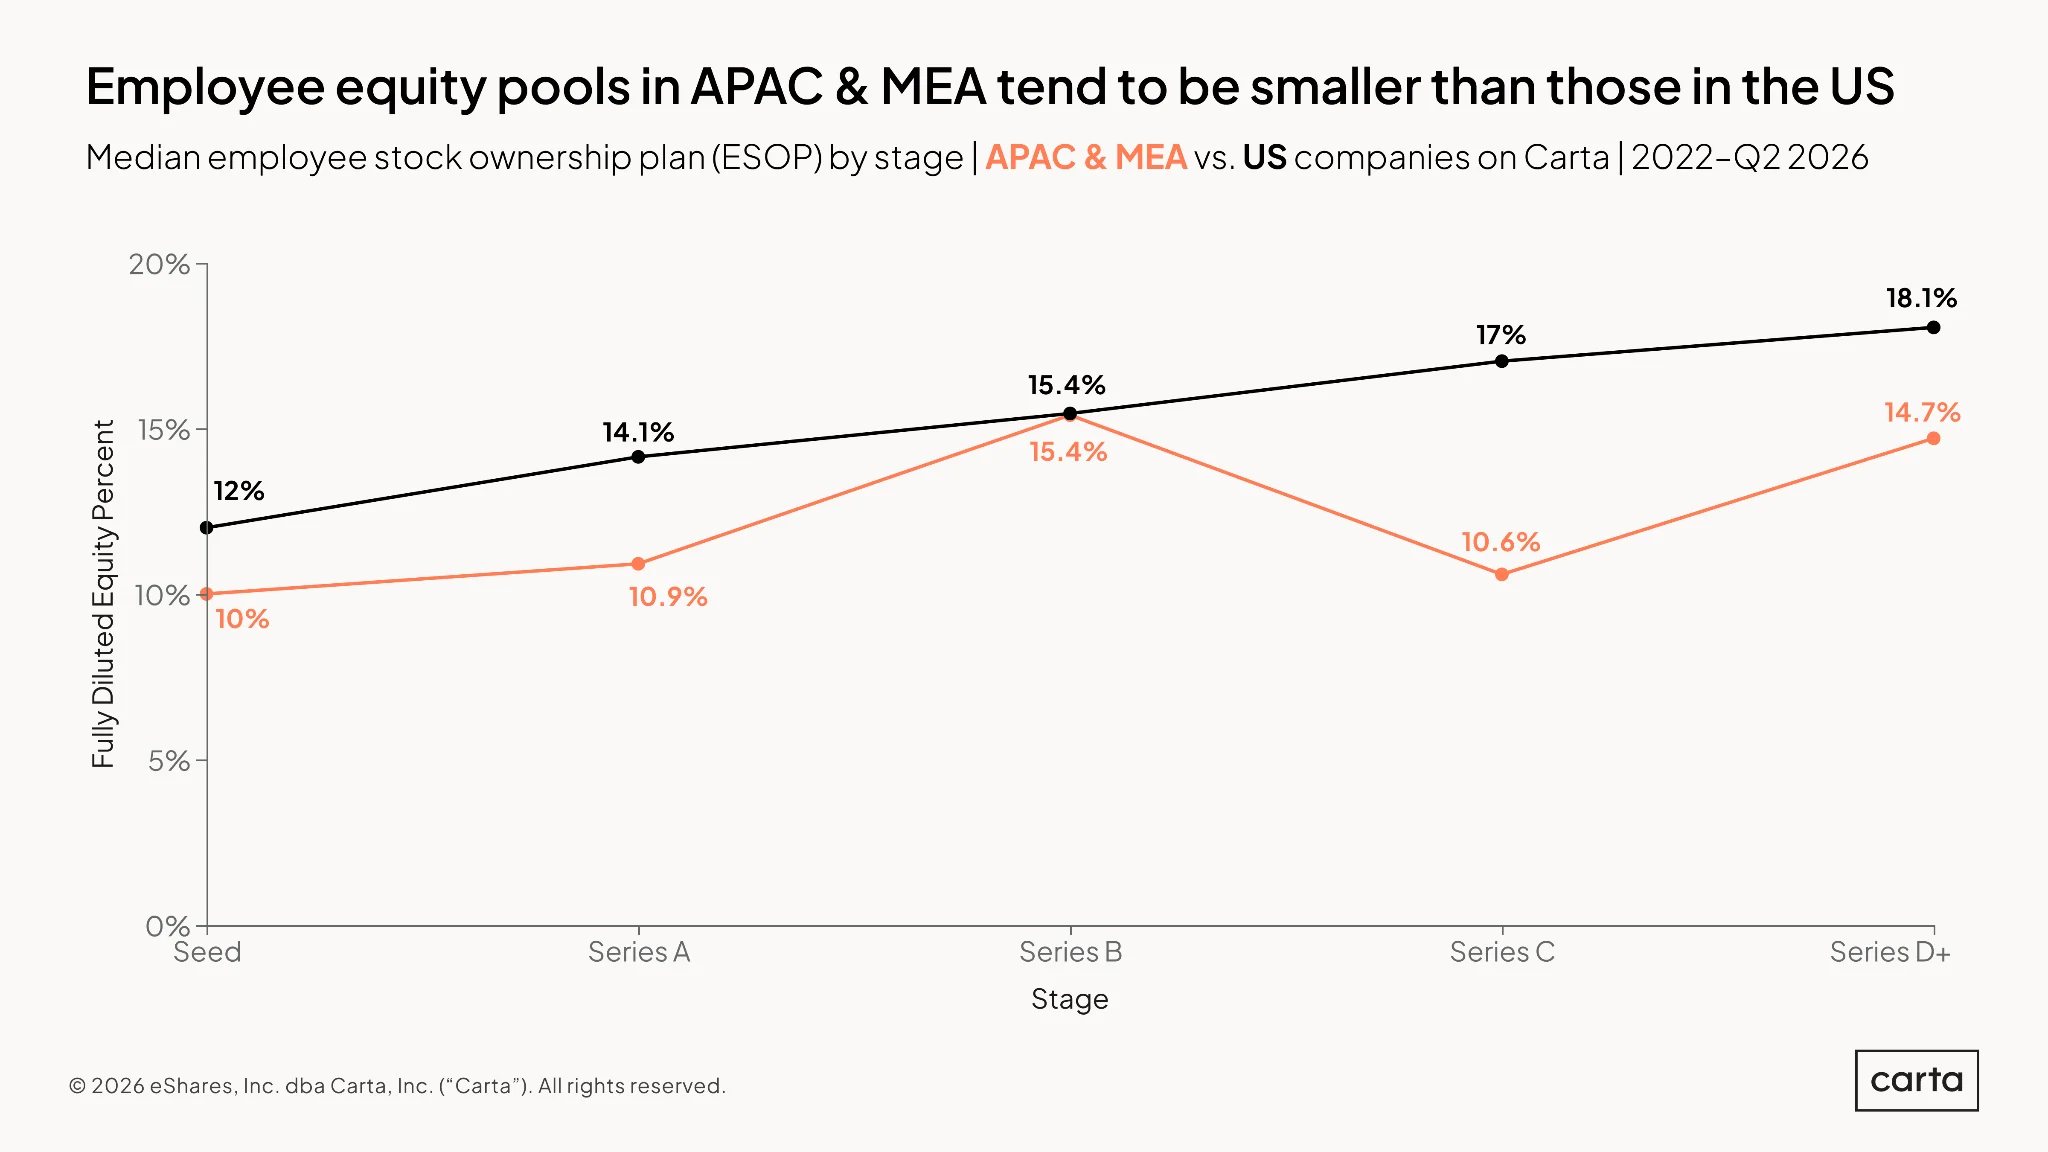
At most stages, APAC & MEA companies reserve meaningfully less equity for their employees than U.S. companies. At seed, the median ESOP in APAC & MEA comprises 10% of fully diluted equity, versus 12% in the U.S. At Series C, the gap widens: 10.6% versus 17%. There is one exception: at Series B, the medians are identical, at 15.4%.
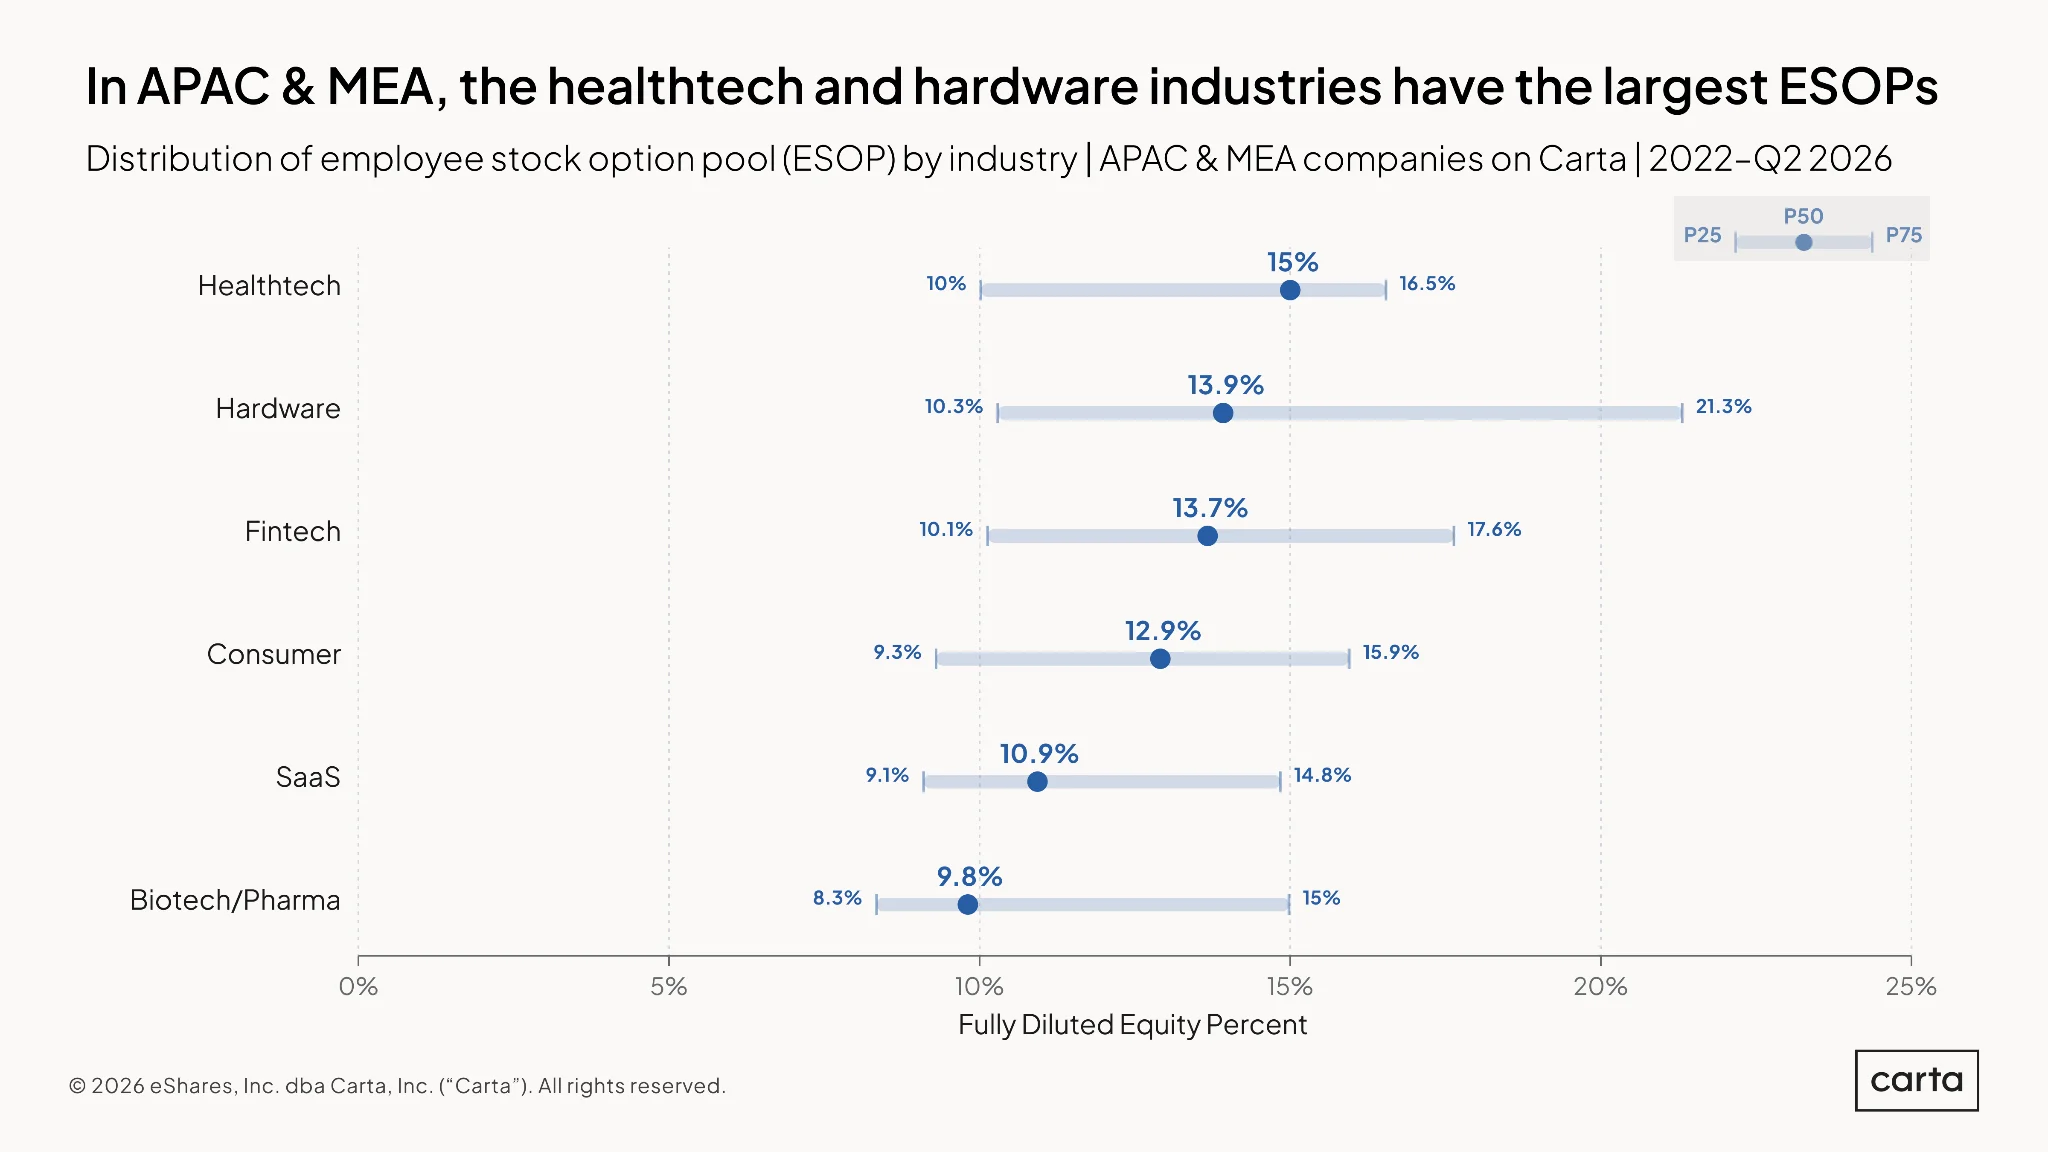
Within APAC & MEA, the healthtech sector has the largest median ESOP size of any major startup sector, at 15% of fully diluted equity. Hardware is second at 13.9%, and it also has a wide upper tail, with the 75th percentile reaching 21.3%. SaaS, the sector with the most companies in this dataset, sits towards the bottom at 10.9%.
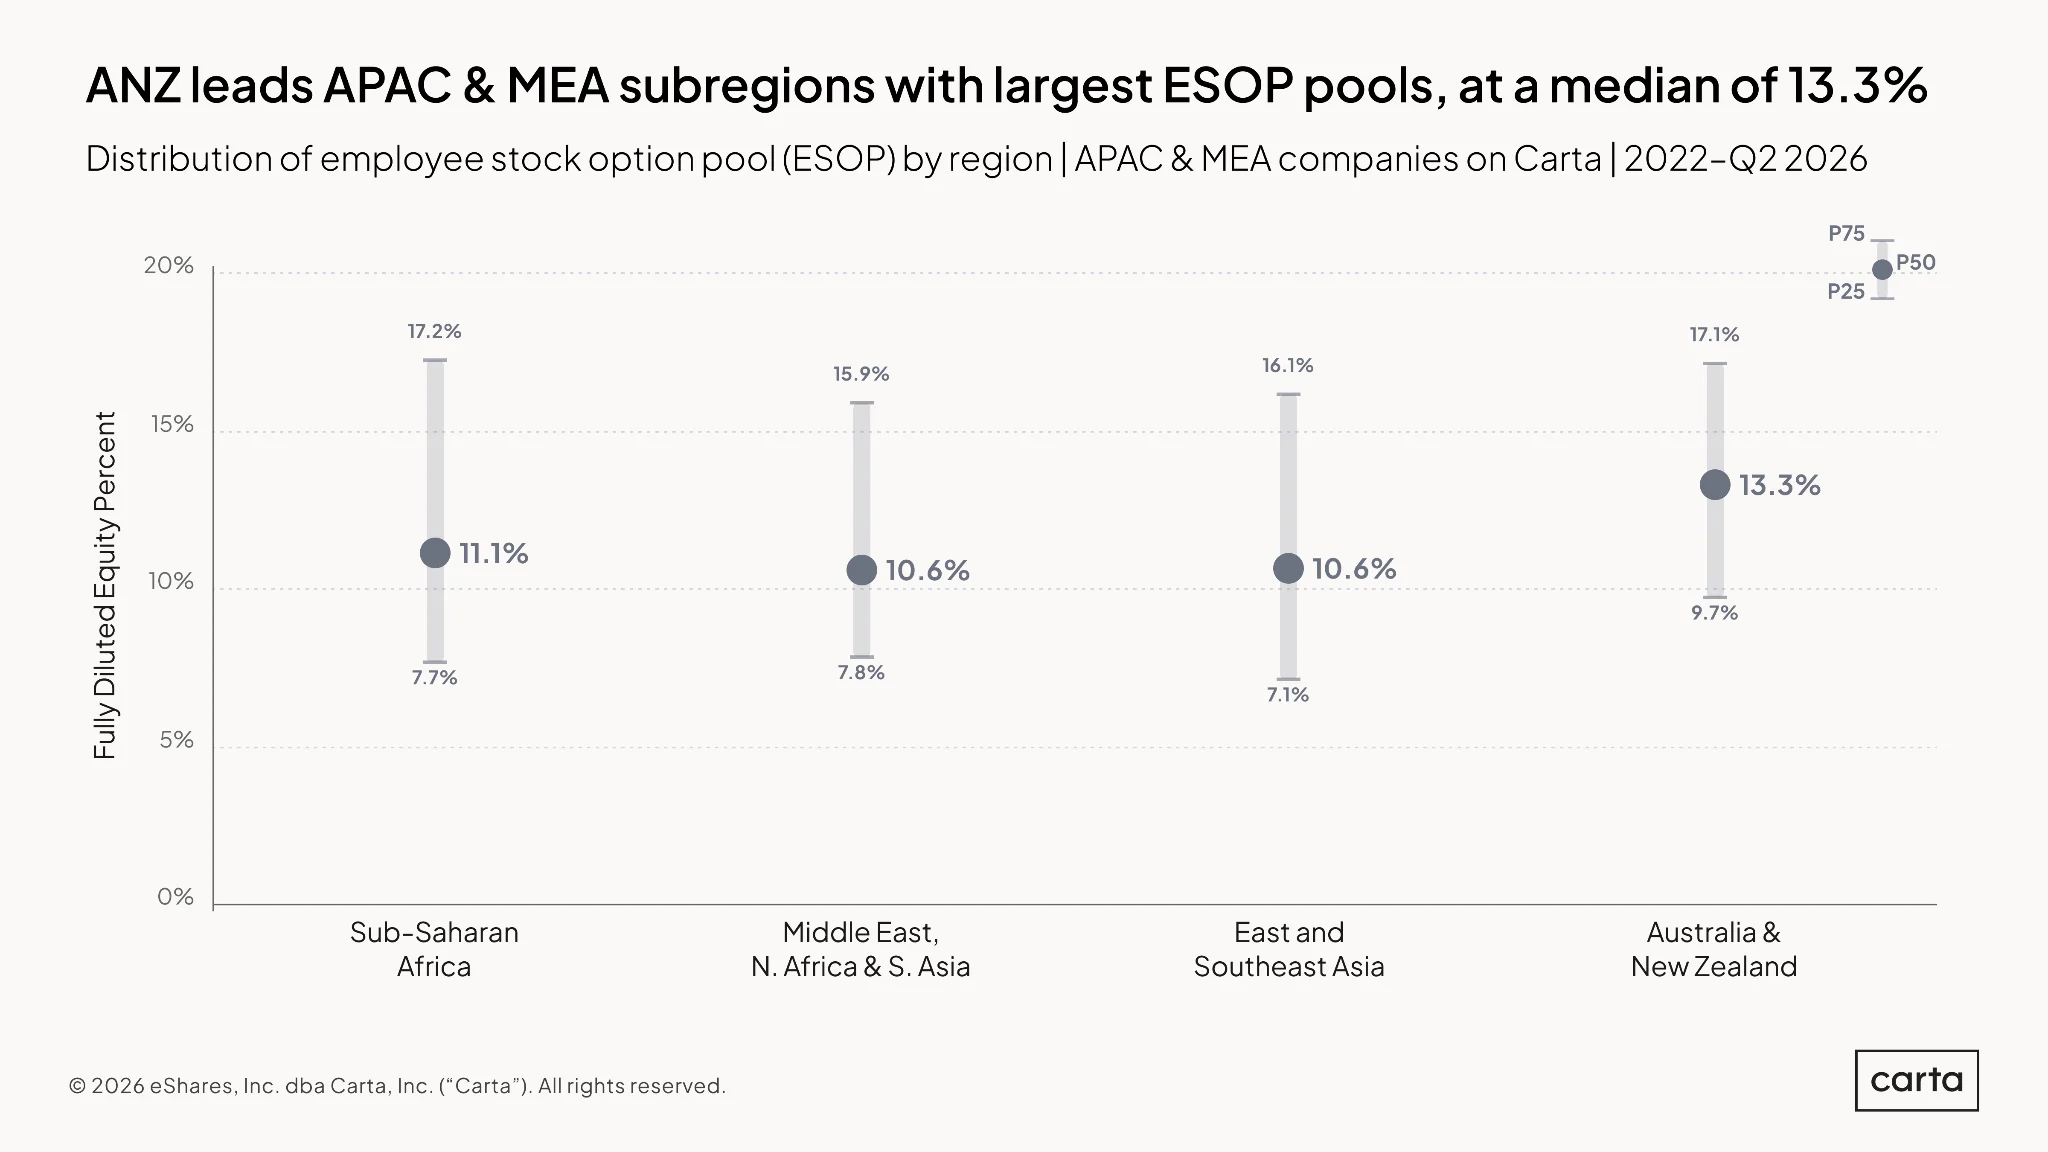
Within APAC & MEA, ANZ stands apart. The median ESOP among ANZ companies is 13.3% of fully diluted equity, larger than the medians in SSA (11.1%), ESEA (10.6%), and MENASA (10.6%). Still, all four subregions sit below the corresponding U.S. median of 14.4%. ANZ’s larger pools compared to other APAC & MEA subregions likely reflect its closer ties to U.S. investor and founder norms, where bigger option pools are standard.
Advisor & board member equity
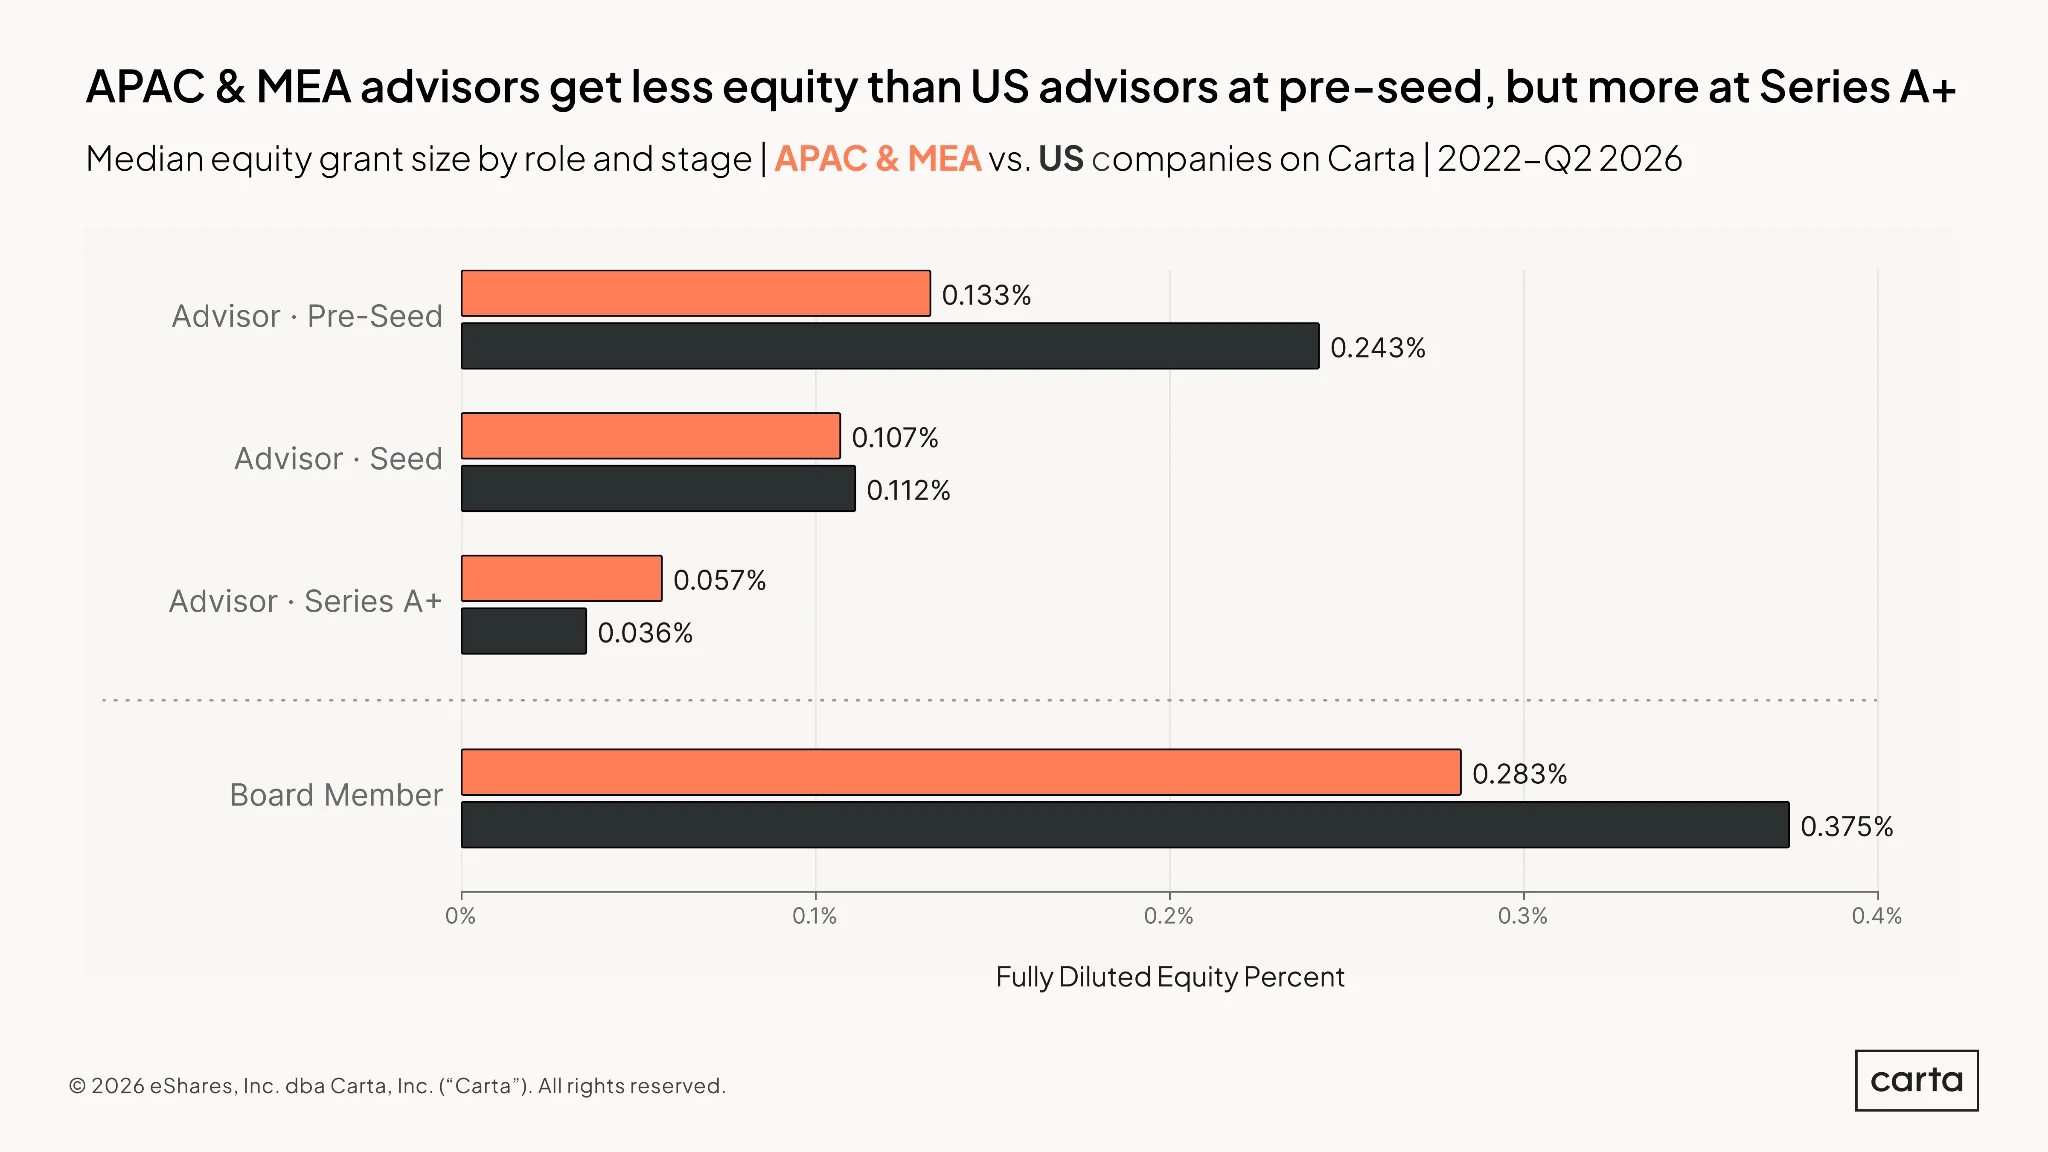
Advisors to pre-seed companies in APAC & MEA receive a median equity grant totaling 0.133% of fully diluted equity, just over half of the median grant issued by U.S. startups at the same stage. At seed, this gap between the regions is nearly closed. At Series A and beyond, it inverts, with advisors to APAC & MEA companies receiving larger stakes than their peers in the U.S. In both regions, the typical grant size issued to advisors gets smaller at each successive fundraising stage.
Board member grants are also smaller in APAC & MEA, at a median of 0.283% of equity, versus 0.375% in the U.S. In other words, the median grant issued to board members in APAC & MEA is about 75% the size of the median grant issued in the U.S.
Methodology
Carta helps more than 50,000 companies and 2.5 million security holders manage over $3.0 trillion in equity around the world. We share insights from this unmatched dataset about the private markets and venture ecosystem to help founders, employees, and investors make informed decisions and understand market conditions.
Overview
This study uses an aggregated and anonymized sample of Carta customer data, encompassing companies from the Asia-Pacific, Middle East, and Africa. Companies based in the U.S. are included in some charts for comparison. Customers that have contractually requested that we not use their data in anonymized and aggregated studies are not included in this analysis.
The data presented in this report represents a snapshot as of August 2026. Historical data may change in future studies because there is typically an administrative lag between the time a transaction took place and when it is recorded in Carta. In addition, new companies signing up for Carta’s services will increase historical data available for the report.
APAC & MEA subregions
The scope of this report includes companies on Carta that are headquartered in the Asia-Pacific, Middle East, and Africa. For some data points, these larger regions are segmented into four subregions: Australia and New Zealand (ANZ), East and Southeast Asia (ESEA), Middle East, North Africa, and South Asia (MENASA), and Sub-Saharan Africa (SSA). These subregions are defined as follows, based on United Nations Statistics Division (UNSD) groupings:
ANZ corresponds to UNSD’s entire Oceania region;
ESEA corresponds to UNSD’s Eastern Asia and Southeastern Asia subregions;
MENASA corresponds to UNSD’s Western Asia, Central Asia, Southern Asia, and Northern Africa subregions; and
SSA corresponds to UNSD’s entire Sub-Saharan Africa subregion.
Company stages
Companies that have not raised a priced equity round are classified as “pre-seed.” Otherwise, the fundraising stage or “series” (e.g. Series A) is taken from the share class name in their applicable certificate or articles of incorporation. Primary rounds are defined as the first equity round within a series.
Equity
All equity values, including employee stock option pools and individual stakes, are expressed as a percentage of fully diluted company shares.


DISCLOSURE: This communication is on behalf of eShares, Inc. dba Carta, Inc. ("Carta"). This communication is for informational purposes only, and contains general information only. Carta is not, by means of this communication, rendering accounting, business, financial, investment, legal, tax, or other professional advice or services. This publication is not a substitute for such professional advice or services nor should it be used as a basis for any decision or action that may affect your business or interests. Before making any decision or taking any action that may affect your business or interests, you should consult a qualified professional advisor. This communication is not intended as a recommendation, offer or solicitation for the purchase or sale of any security. Carta does not assume any liability for reliance on the information provided herein. © 2026 Carta. All rights reserved. Reproduction prohibited.