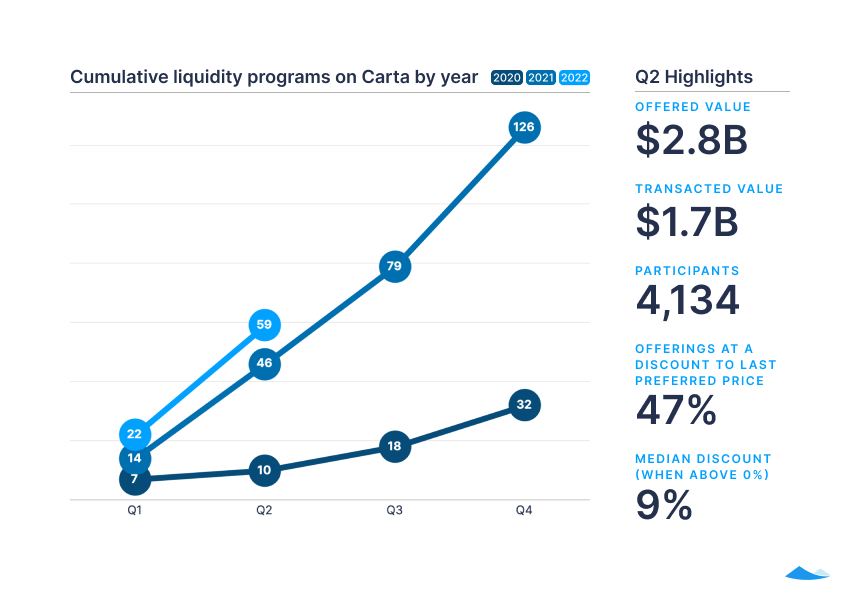
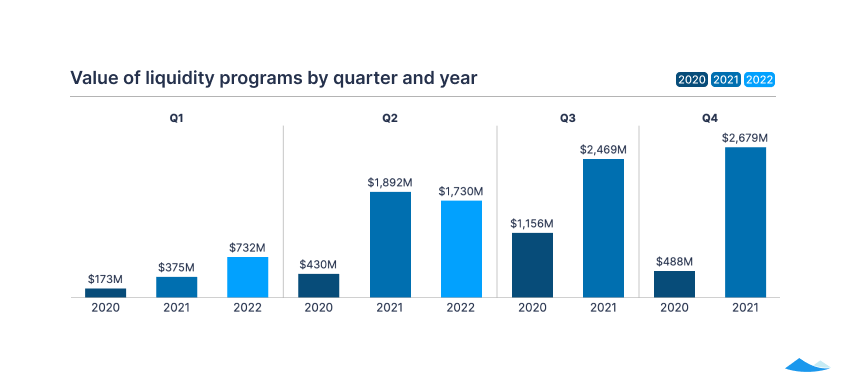
The volume of secondary transactions on Carta remained robust, reflecting momentum from a record-breaking 2021 for venture capital. Q2 saw a 68% quarter-over-quarter growth in number of transactions, a 136% increase in transaction value, and an 85% increase in participants.
But the second half of the year is unlikely to maintain this pace. Inflation, rising interest rates, public market volatility, and continued uncertainty around Russia’s war on Ukraine and the global supply chain are dampening investor demand in private markets. We expect the market for secondary transactions to reflect these headwinds in Q3—there’s usually a lag of a few months between compressions in the public and private markets due to the longer lead time for private market transactions.
How are these factors impacting private market liquidity? As venture capital has slowed after several months of unprecedented activity and rises in valuations, the gap between seller and buyer expectations has grown. Investors are looking to acquire assets at a discount, while companies are looking for ways to avoid down rounds. Both are waiting and hoping for valuations to shift in their favor, or for some of the macro-level uncertainties affecting the market to resolve so they can make more informed decisions.
Over the past year, we saw a rise of the trend toward companies staying private, due to readily available venture capital in 2021 and the near-freeze in IPOs that took hold in H1 2022. Companies that might otherwise choose to exit through an IPO are now seeking liquidity in large transactions with a large number of eligible sellers, reflecting their late stage.
When more investors believe that the market has bottomed out—or when they start to feel pressure to deploy their capital—we expect to see secondary transactions pick up as investors return to meeting companies’ pricing expectations.
Despite the slowdown, record levels of dry powder from VC funds raised in the past few years have yet to be deployed, and companies with strong fundamentals and growth will likely continue to have options. When these companies seek liquidity, they are still usually receiving the prices they’re looking for.
The CartaX team is here to help you and your company navigate the evolving private markets. Write to us at company_coverage@cartacapitalmarkets.com.
Which companies are choosing liquidity?
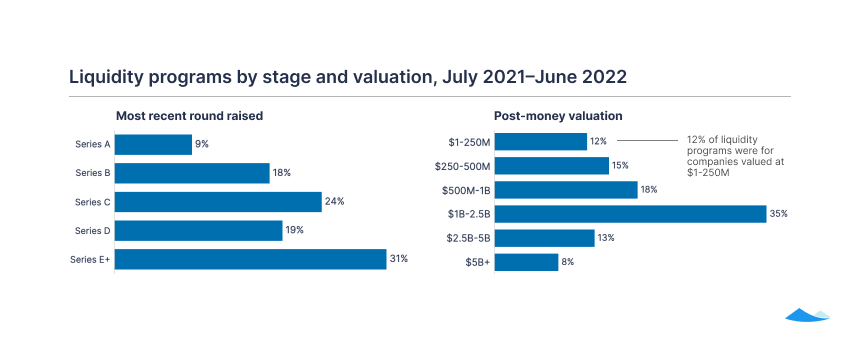
During the 12 months ending in June 2022, 50% of secondary liquidity transactions were for companies at Series D and beyond. Earlier-stage companies were also seeking liquidity: In Q2, 59% of transactions were for companies at Series C and earlier.
The distribution of programs by post-money valuation remained consistent with prior quarters, with a median company valuation of $1.0B in Q2.
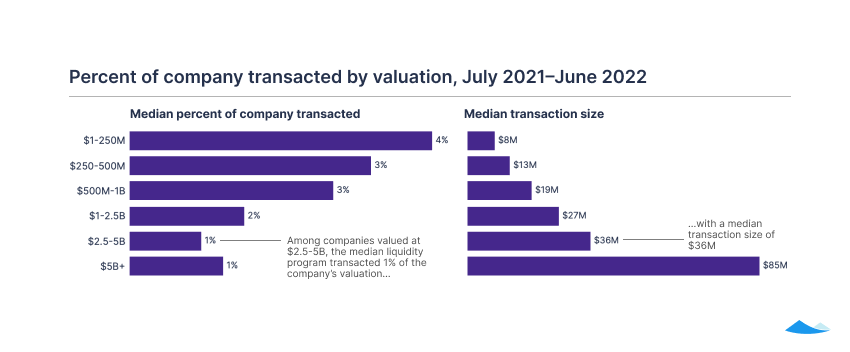
On average, companies with higher valuations had larger transactions in most quarters during this timeframe, even while the percentage of the company being transacted is often much lower.
Which industries are choosing liquidity?
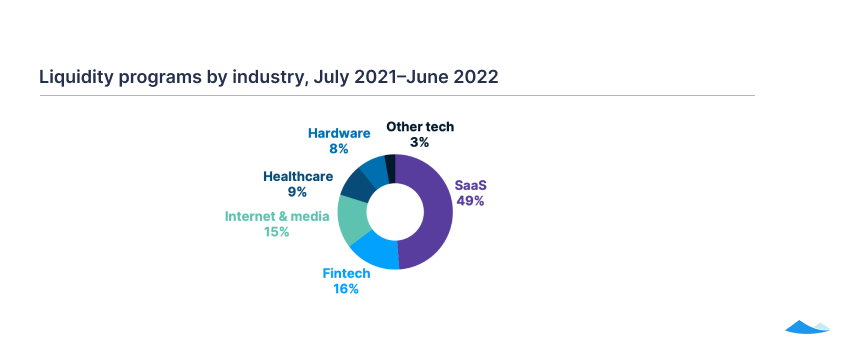
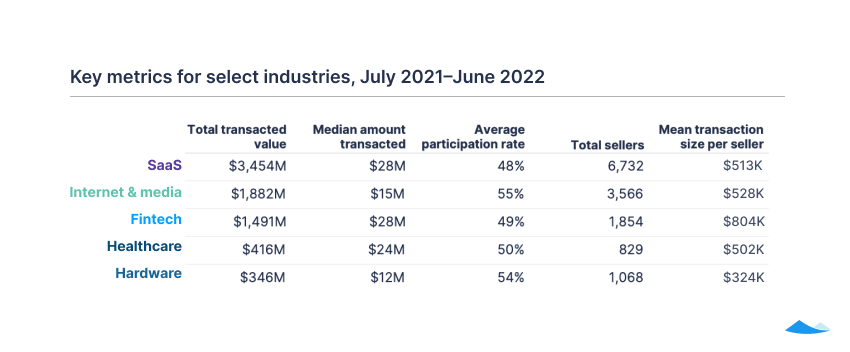
In the 12 months ending in June 2022, SaaS companies saw nearly half of all liquidity transactions and nearly twice as many sellers as the next industry (internet and media). SaaS also had the highest median transaction size, at $28.4M—slightly more than fintech’s $27.5M.
The median participation rate across all industries was 50%, with half of all eligible sellers choosing to cash out at least some of their equity. Fintech had the largest mean transaction size per seller at $804K, as well as the highest mean valuation at $2.4B. However, there was not a clear trend of companies with higher valuations having larger transaction sizes per seller.
How much value is changing hands?
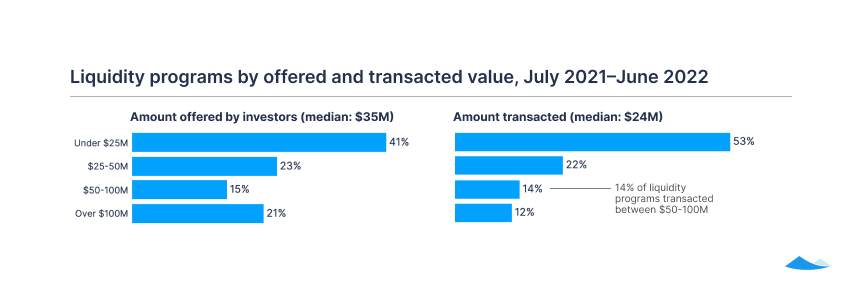
Over the 12 months ending in June 2022, $35M was the median amount offered by all investors per transaction. Looking at Q2 2022 alone, this amount dipped to $30M. The median amount transacted remained more stable, at $24M over both the past 12 months and in Q2 2022.
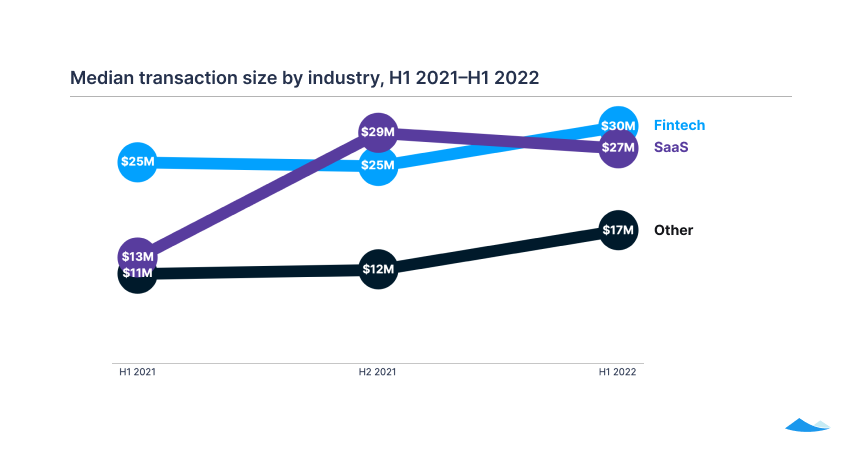
The median transaction size grew for SaaS, fintech, and other industries when comparing the first half of 2022 to the same period last year, in part due to companies staying private longer and therefore seeking liquidity at a later stage.
Who is choosing to sell equity?
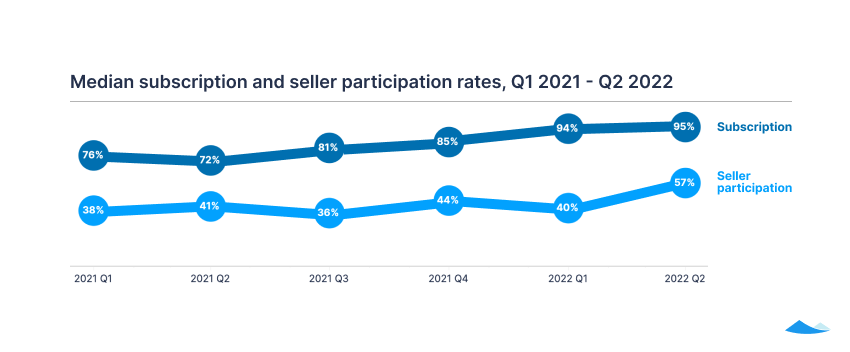
The seller participation rate is the percentage of eligible sellers who transacted. The subscription rate is the value of shares that sellers elect to sell, divided by the amount investors have offered to buy. The medians for both grew year over year, likely reflecting more awareness of secondary transactions, and the pressure on later-stage companies to meet employee and early investor thirst for liquidity. Widespread volatility in public markets and contractions in startup headcounts in 2022 have also increased sellers’ preference for cash.
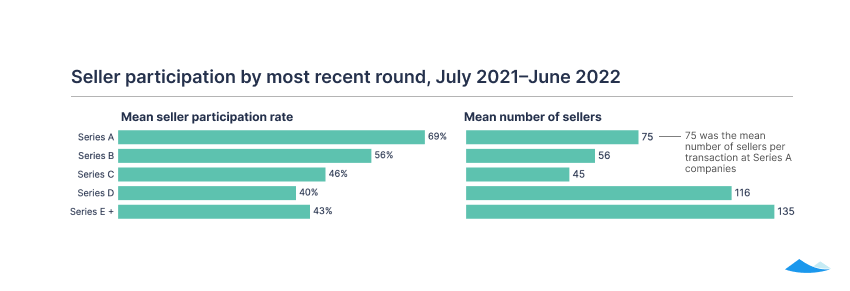
On a longer time horizon, the trend of companies staying private longer has also resulted in larger late-stage headcounts, increasing the mean number of invited participants at Series D and beyond by more than 50% between Q1 2021 and Q2 2022.
Law firms enabling secondary liquidity
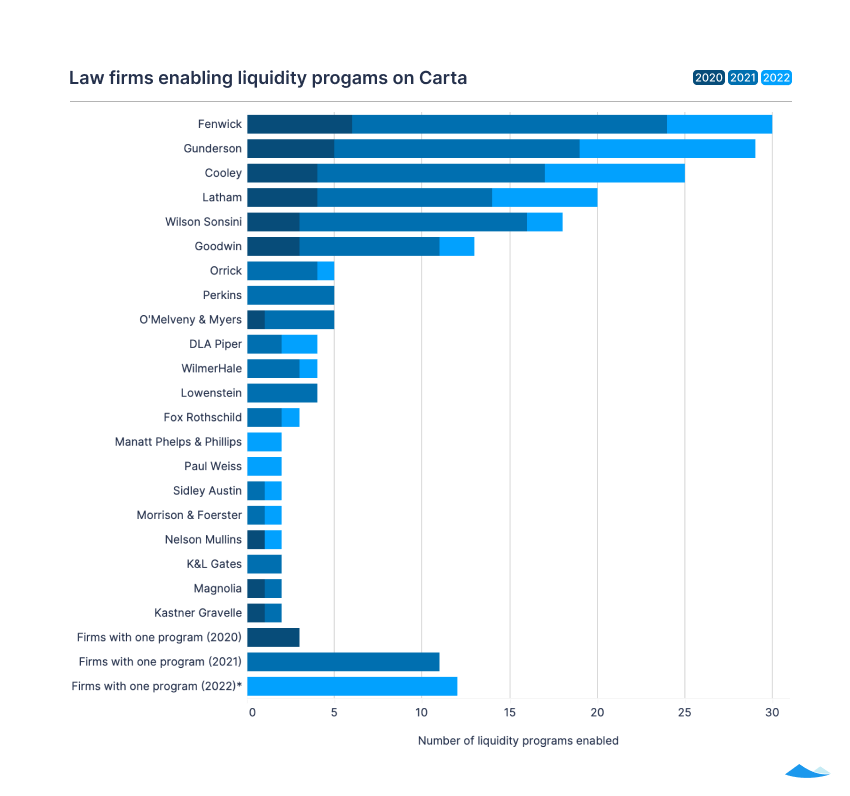
In Q2, the CartaX team worked with 20 law firms, of which ten enabled secondary liquidity on Carta for the first time. In 2022 to date, 27 law firms have represented companies working with Carta.
You can also download this report as a PDF—and sign up for Carta’s data newsletter so you don’t miss an insight.
Learn more about Carta’s liquidity programs or write to us at company_coverage@cartacapitalmarkets.com.
Methodology
Carta helps more than 30,000 primarily venture-backed companies and 1,900,000 security holders manage equity. Our liquidity report examines trends in secondary liquidity to promote transparency and to help investors, companies, and employees make informed decisions.
The data presented in this liquidity report includes snapshots as of June 30, 2022 of tender offers, Carta Cross transactions, and other secondary trades conducted via the Carta platforms. With the exception of the list of law firms enabling liquidity programs, data used in this study is aggregated and anonymized.
Transactions are reported based on their settlement date. Historical data may change in future studies due to administrative lags for transactions to be recorded in Carta, or to reflect calculation updates and corrections.
Mean transaction size per seller is calculated across all sellers per category, dividing the total of all transaction values by the total number of participating sellers. Industry groupings are based on self-reported industry information, which Carta completed and normalized for the purpose of this study.

DISCLOSURE: This publication contains general information only and eShares, Inc. dba Carta, Inc. (“Carta”), and its affiliates, are not, by means of this publication, rendering accounting, business, financial, investment, legal, tax, or other professional advice or services. This publication is not a substitute for such professional advice or services nor should it be used as a basis for any decision or action that may affect your business or interests. Before making any decision or taking any action that may affect your business or interests, you should consult a qualified professional advisor. This communication is not intended as a recommendation, offer or solicitation for the purchase or sale of any security. Carta does not assume any liability for reliance on the information provided herein. This report includes aggregate statistics of transactions on Carta, Inc. and CartaX. All product names, logos, and brands are property of their respective owners in the U.S. and other countries, and are used for identification purposes only. Use of these names, logos, and brands does not imply affiliation or endorsement. © 2022 eShares, Inc., dba Carta, Inc. (“Carta”). Carta Capital Markets, LLC, member FINRA/SIPC. All rights reserved.
All product names, logos, and brands are property of their respective owners in the U.S. and other countries, and are used for identification purposes only. Use of these names, logos, and brands does not imply affiliation or endorsement.