The global economy took a downward turn in 2022, leaving behind 2021’s environment of easy money and soaring valuations. The U.S. venture capital market followed suit. Venture deal count for private companies on Carta in 2022 declined 29% year over year, while the value of those investments fell more than 50%. Both of those annual figures had increased each of the prior five years.
There were plenty of other shifts in the venture market in Q4. Investments worth less than $5 million became more common, while mega-deals fell out of favor. The frequency of bridge rounds boomed. And deal sizes are decreasing at nearly every stage of the startup lifecycle.
Q4 highlights
Median valuations are trending down at every stage. Seed and Series A valuations ticked down only slightly, but later stages experienced much larger drops—at Series E+, median valuations fell 72% year over year, reaching their lowest point since the 2010s.
Founders are playing the waiting game. The average wait time in between venture rounds climbed to recent highs in Q4 at several stages. The average interval between a Series A round and a Series B rose to 893 days, or about two years and five months. This means companies need more runway than ever.
The South is picking up steam. Companies in the region brought home 15.5% of all venture capital funding in the U.S. last year, a notable uptick from 11.7% the year prior. The South was also the fastest-growing region in the U.S. last year in terms of population.
Note: If you’re looking for more industry-specific data, you can also download the addendum to this report to get an extended dataset.
Key trends

Last year’s counts for deal volume and deal value are both down significantly year over year. But it would have been difficult to maintain the frantic pace of activity from 2021, when investment totals rocketed past previous records. On a longer timeline, 2022 actually continued an upward trend: Last year saw more venture deals and more capital invested than any year between 2016 and 2020. However, the number of companies in Carta’s dataset is also higher today than it was five years ago.

Last year’s activity was front-loaded. Venture investors put more than $40 billion to work during the first quarter of the year. By Q4—typically the strongest quarter for venture activity—that figure had fallen below $15 billion. In fact, in terms of both venture deal count and dollars invested, Q4 was the slowest quarter on Carta since 2018.
Deal count has now declined in two consecutive quarters for just the second time in the past seven years; the other occurrence was in Q1 and Q2 of 2020, when the onset of the pandemic sent global markets into turmoil. Then, as now, the primary reason for the slowdown is uncertainty. Investors are still seeking clarity on many of the now-familiar factors that roiled markets last year, including rising interest rates, the effects of inflation on consumer spending, and war in Ukraine.

Nearly half of all venture capital raised last year went to companies based in California, reaffirming Silicon Valley’s role as the industry’s beating heart. But the gradual diversification of venture capital continues. California’s share of 46.2% in 2022 was a decline from 47.5% in 2021.
Many of the states that gained the largest share of venture investment are located in the South. Florida jumped to 3.2% of all cash raised in 2022, up from 1.7% in 2021. Virginia jumped from 0.7% to 1.2%, North Carolina went from 0.6% to 1.1%, and the District of Columbia went from 0.5% to 1%. Overall, the South’s share of venture cash raised in the U.S. climbed from 11.7% in 2021 to 15.5% in 2022.

The downward trends that were already underway at these earlier stages mostly accelerated during Q4—with the exception of deal count at Series B, which saw a slight uptick. Deal counts at both seed and Series A, on the other hand, suffered their largest quarterly declines of the year. At all three stages, deal activity is down more than 50% year over year.
Total cash raised in seed rounds is down 68% from its recent peak. Series A cash raised is down 77% from its recent high, and Series B has undergone a 79% decline. Total cash raised at Series B has now decreased in four consecutive quarters.

No stage of the startup lifecycle has taken a bigger hit to activity than Series D. Companies on Carta raised just 22 Series D rounds in Q4 and pulled in less than $650 million in cash. That latter figure is down a stunning 92% year over year.
There were some positive signs at other stages: Series C deal count increased by 13% quarter over quarter, and overall cash raised at Series E+ rose by 10%. But both of those stages had already experienced significant declines in prior quarters. Overall, the venture market for late-stage companies remains gloomy.
Fundraising & valuations

For four straight quarters, the trend has been the same: Rounds of more than $50 million are growing less common, and rounds of less than $5 million are growing more common. Nearly half of all cash raised in Q4 was in deals worth less than $5 million, the highest rate since Q2 2020.
The frequency of megadeals—rounds of more than $50 million—increased significantly during 2021. With plenty of cash on hand and a climate of steadily rising valuations, venture investors had both means and motive for massive transactions. But that math has clearly shifted. No quarter in the past four years saw a smaller percentage of cash going to megadeals than Q4 2022.

Pre-money valuations at these earliest stages of the startup lifecycle ticked down only slightly in Q4, remaining more resilient than later stages. At Series A, the median valuation steadied after suffering its largest quarterly decline of the past three years in Q3.
Investors at these stages think on longer timelines and are less influenced by public valuations than later-stage investors. This has insulated seed and Series A deals from some of the worst side effects of the ongoing venture downturn.

Even with that insulation, seed deals are still feeling something of a crunch. The median seed funding was 9% smaller in Q4 than in Q3, the most significant quarter-over-quarter dip at that stage since the start of the pandemic. Median seed deal size is now down 17% from its recent high in Q2 2022.
An ongoing decline in median deal size also continued at Series A. The curve now appears to be flattening out, but the slide has already been significant. The median Series A size of $7.8 million in Q4 was the second-lowest quarterly figure since the start of 2020. Compare that to seed stage, where this quarter’s $3 million median is still higher than every quarter from 2020.

For valuations at these stages of the startup cycle, what went up during 2021 has now come all the way back down. Median valuations at both Series B and Series C are now below where they were at the end of 2020.
The median Series B valuation rose by 68% between Q4 2020 and Q4 2021; over the course of 2022, however, it fell by 46%. At Series C, the median valuation rose by 55% throughout 2021, only to then fall by 55% between Q4 2021 and the end of 2022.

The median Series B round was 40% smaller in Q4 than in Q3, the biggest quarterly drop in recent history. Year over year, the median Series B fell 60%.
Those declines are causing the gap between Series A and Series B to shrink. The median Series B round size of $12 million in Q4 was only 54% larger than the median Series A size of $7.8 million, the smallest ratio of the past three years. A year ago, for instance, the median Series B was 156% bigger than the median Series A.
The decline has been similar at Series C, with the median round size plunging from $56 million a year ago to $21 million in Q4 2022. That’s its lowest point in the past three years.

The ziggurat shape of the chart for Series D demonstrates how the market for late-stage valuations has evolved over the past three years: A step-by-step climb to new heights, followed by a step-by-step decline back to where things started. There was an uptick in Q3 2022, but it proved ephemeral—Series D valuations fell 45% quarter over quarter and are now down 58% year over year.
The annual decline has been even steeper at Series E+, where the median valuation fell 72%. Things reversed sharply in the second half of 2022, when two-and-a-half years of prior momentum came to a screeching halt.

The median Series D round was smaller than the median Series C during Q4, a rare inversion that reflects just how difficult late-stage fundraising became late in 2022. The median Series D round in Q4 2022 was 79% smaller than the median Series D from Q4 2021.
There were positive signs at Series E+, as median deal size rose 68% after three straight quarters of serious declines. Still, the median round size is lower than it was three years ago. To sum up the shift in late-stage funding from Q4 2021 to Q4 2022: There were far fewer investments, and those deals that did occur involved far less cash and came at far lower valuations.

One of more counterintuitive trends of the year intensified in Q4. Lower dilution rates mean that founders are selling off smaller percentages of their company to investors in new venture rounds. Founders generally want to retain as much of the company as they can. Thus, lower dilution rates are typically linked to a founder-friendly deal environment, such as the one we saw in 2021.
The broader market got much less founder-friendly in 2022, a fact highlighted by plunging valuations. But dilution rates remained low—and in fact, went even lower. This could be linked to the fact that investors were so picky in 2022: Only the very best companies were able to raise rounds at all, and perhaps those premium targets were still able to negotiate favorable terms.
The trend could also be a sign that the downturn has had a greater effect on deal sizes than valuations. Dilution is the quotient of valuation divided by deal size; for example, a $10 million investment at a $100 million valuation leads to more dilution than a $2 million investment at a $30 million valuation. Median dilution could sink if companies are more willing to accept smaller round sizes than they are down rounds.

Bridge rounds grew more common in Q4 at every stage of the startup lifecycle, but they spiked the highest at Series D. There, bridge rounds made up 31% of all fundings in Q4. The previous high over the past three years was 22%. This is another sign that Series D startups had a particularly difficult time navigating the downturn in Q4.
These high rates of bridge rounds may be another factor contributing to the reduction in dilution last quarter. If companies in need of a cash infusion that might typically raise primary rounds at higher dilution rates are raising bridge rounds instead, the median dilution of primary rounds that do occur might fall.
Read more: Bridge rounds rise as VC market slows

Eighteen months is not enough runway. In fact, not even two years is enough runway. The average time between venture rounds continued to climb at all stages in Q4, reaching a five-year high at every stage.
The longest interval is for companies coming off a Series A round, which are waiting an average of 893 days to raise their Series B—more than two years and five months. For companies seeking to raise a Series B or a Series C, the average wait time has increased for four consecutive quarters.
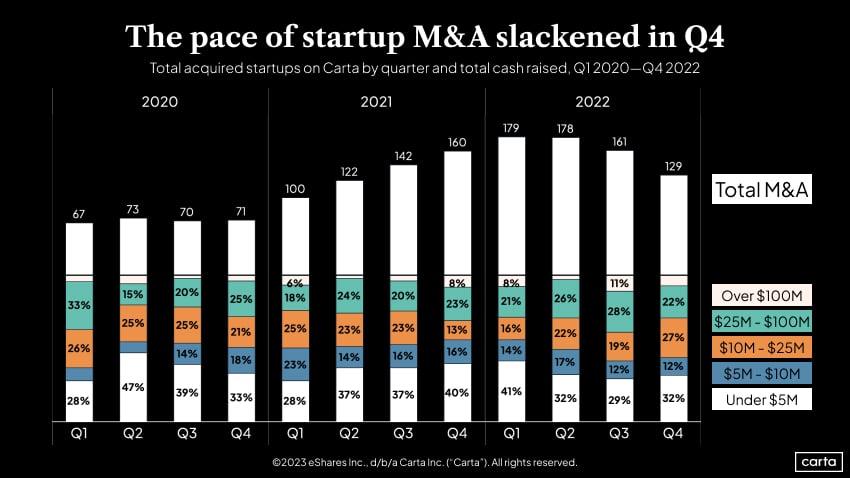
What began as a modest decline in startup M&A activity in Q3 became more pronounced in Q4, with deal count falling 20% quarter over quarter. Beginning in Q4 2020, the number of acquired startups on Carta increased in five straight quarters. Now, it’s declined in three straight quarters.
Among the deals getting done, a plurality are still small sales under $5 million. Last quarter saw a notable shift toward smaller transactions. Acquisitions worth less than $25 million comprised 71% of activity in Q4, compared to 60% in Q3. The twin trends of smaller deals and fewer deals could reflect the current high cost of capital brought on by elevated interest rates. They could also be a sign that would-be corporate buyers currently have other priorities for their balance-sheet capital beyond funding acquisitions—such as lengthening their cash runways.
Employee equity & movement

There was little change in the makeup of 409A valuations on Carta between Q3 and Q4. But the rate of new 409A valuations that declined from the previous valuation did tick up slightly, to 25%, a new five-year high. The rate of increasing 409A valuations, meanwhile, remained at a five-year low of 33%.
On a longer timeline, the shift in the 409A valuations market from 2021 to 2022 mirrors the shift in the broader market for venture deals. Uneasiness about startup valuations isn’t restricted to new primary funding rounds.

Tech layoffs were on the rise in Q4, which meant thousands of former employees were left to decide what to do with their stock options. Typically, companies give former employees 90 days to decide whether to exercise vested options or else lose them forever. In recent months, however, the number of companies allowing longer than 90 days to make that decision has inched up. This gives those former employees more time to situate their finances and account for the cost to exercise.
Employees owning 17% of all terminated options in Q4 were given longer than 90 days—the highest rate of the past five years besides Q2 2020, after the onset of the pandemic. Higher rates of extended post-termination exercise period (PTEP) typically correlate to higher layoff rates; this was again the case in 2022.

Employees exercised just 32% of their vested options before expiration during Q4, the lowest rate since 2020. Throughout 2021, when valuations were climbing, the rate of exercised options also climbed sharply—employees didn’t want to miss out on their rapidly appreciating shares. But in 2022, when valuations declined, employees were more likely to let their shares expire.
The 2021 increase in share exercises also coincided with a period of near-zero interest rates. With the Federal Reserve hiking rates repeatedly in 2022, to their highest point in more than a decade, some employees may have found it more difficult to finance a share exercise.

In a climate of sinking valuations, companies became much more likely to reprice stock option grants during the second half of the year. Reducing the price of issued grants increases the upside for grant holders, which makes those grants a more attractive benefit for both current and future employees.

In each of the past two months, more workers tracked on Carta were laid off than left their jobs by choice. That’s only the second time in the past five years when involuntary job departures were more common than voluntary ones—a clear sign of the layoffs that have swept through the tech industry over the past several months.
The number of workers leaving jobs by choice has declined every month since May 2022. Still, December saw more optional departures than any month prior to 2021.
Industry-specific data
For more industry-specific details on Q4 fundraising, download the addendum to the Q4 report.
Methodology
Carta helps more than 33,000 primarily venture-backed companies and 2,100,000 security holders manage over $2.7 trillion in equity. We share insights from this unmatched dataset about the private markets and venture ecosystem to help founders, employees, and investors make informed decisions and understand market conditions.
Overview
This study uses an aggregated and anonymized sample of Carta customer data. Companies that have contractually requested that we not use their data in anonymized and aggregated studies are not included in this analysis.
The data presented in this private markets report represents a snapshot as of February 2, 2023. Historical data may change in future studies because there is typically an administrative lag between the time a transaction took place and when it is recorded in Carta. In addition, new companies signing up for Carta’s services will increase historical data available for the report.
Financings
Financings include equity deals raised in USD by U.S.-based corporations. The financing “series” (e.g. Series A) is taken from the legal share class name. Financing rounds that don’t follow this standard are not included in any data shown by series but are included in data not shown by series. Primary rounds are defined as the first equity round within a series. Bridge rounds are defined as any round raised after the first round in a given series. If there is no indication that a round is a Primary or Bridge round, both are included.
In some cases, convertible notes are raised and converted at various discounted prices within a series (e.g. Series A-1, Series A-2, Series A-3). In these cases, converted securities are not included in cash raised, and only the post-money valuation of the new money is included.
Terminations
Terminations entered into Carta must include a reason. Involuntary terminations include both terminations for performance and company layoffs. Voluntary terminations are employees who decided to leave of their own accord. Other termination reasons, including for cause, death, disability, and retirement were not included in the data and make up less than 1% of all terminations combined.


DISCLOSURE: This communication is on behalf of eShares Inc., d/b/a Carta Inc. (“Carta”). This communication is for informational purposes only, and contains general information only. Carta is not, by means of this communication, rendering accounting, business, financial, investment, legal, tax, or other professional advice or services. This publication is not a substitute for such professional advice or services nor should it be used as a basis for any decision or action that may affect your business or interests. Before making any decision or taking any action that may affect your business or interests, you should consult a qualified professional advisor. This communication is not intended as a recommendation, offer or solicitation for the purchase or sale of any security. Carta does not assume any liability for reliance on the information provided herein. ©2023 eShares Inc., d/b/a Carta Inc. (“Carta”). All rights reserved. Reproduction prohibited.