
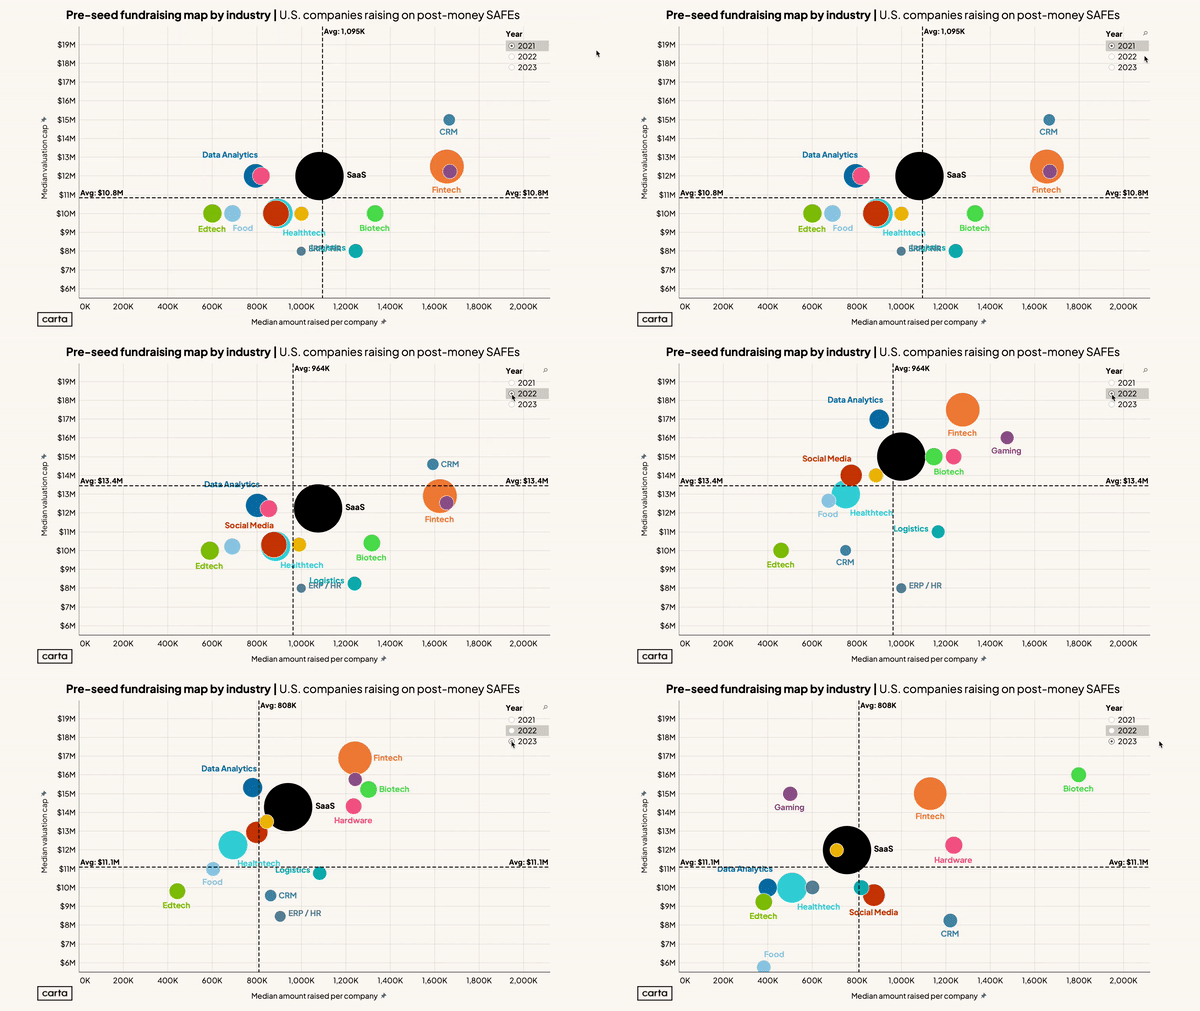
Round 2: change over time for startup industries in pre-seed fundraising
This time, we animate!
𝗪𝗵𝗮𝘁 𝗱𝗼𝗲𝘀 𝘁𝗵𝗶𝘀 𝗰𝗵𝗮𝗿𝘁 𝘀𝗵𝗼𝘄?
The median valuation cap and the median amount raised by company for:
U.S. pre-seed companies using Carta cap table (data skewed towards San Francisco and New York)
That raised on SAFEs
That specifically used post-money SAFEs
𝗛𝗼𝘄 𝘁𝗼 𝗿𝗲𝗮𝗱 𝘁𝗵𝗲 𝗰𝗵𝗮𝗿𝘁:
y-axis is the median valuation cap (all data is for pre-seed SAFEs)
x-axis is the median amount raised per company in a given industry
bubble size is how many companies in the dataset
Watch the years change in the upper right corner
𝗞𝗲𝘆 𝘁𝗮𝗸𝗲𝗮𝘄𝗮𝘆𝘀:
The average amount raised across industries declines every year from 2021 to today. The drop is from $1.1 million to $808K.
2022 was a weird year. The first half was gangbusters, the second half was doldrums. So higher valuation caps and lower total raises may seem odd, but it's likely due to the first half / second half splits.
Pre-seed founders are being asked to do more with less.
Given the response from these SAFE posts, we are definitely going to be building a big report on the subject. Get it direct to your inbox by signing up to our newsletter in the comments!
Would selfishly love your feedback on the animated graphics - should we be building more of these?
#SAFEs #cartadata #preseed #founders #startups #earlystage #angelinvesting

DISCLOSURE: This communication is on behalf of eShares, Inc. dba Carta, Inc. ("Carta"). This communication is for informational purposes only, and contains general information only. Carta is not, by means of this communication, rendering accounting, business, financial, investment, legal, tax, or other professional advice or services. This publication is not a substitute for such professional advice or services nor should it be used as a basis for any decision or action that may affect your business or interests. Before making any decision or taking any action that may affect your business or interests, you should consult a qualified professional advisor. This communication is not intended as a recommendation, offer or solicitation for the purchase or sale of any security. Carta does not assume any liability for reliance on the information provided herein. © 2026 Carta. All rights reserved. Reproduction prohibited.