Executive summary
Venture is back, but it is not back for everyone. Carta recorded $30.4 billion in startup funding in Q1 2026, already ahead of last year at this point. The market has fully cleared the hangover from the 2022 valuation reset. Down rounds are rare again. Dilution is down. Terms favor founders.
The catch is where the money is going. More than 60% of all venture capital raised by companies on Carta in Q1 went to AI companies. Within that, a small number of foundational model companies are raising at valuations that bear no resemblance to what everyone else is seeing. An AI foundational model startup at Series A might be raising at a $300 million median valuation. A non-AI startup at the same stage is at $55 million. These are not comparable markets.
SaaS, which has historically dominated this dataset, is facing a genuine question about its future. The category most likely to be disrupted by capable AI is also the largest category in the Carta data. Early-stage SaaS valuations softened this quarter. That may be seasonal. It may not be. Hardware is the quiet winner. Non-dilutive debt is letting hardware founders build before they raise, arriving at institutional rounds with sophisticated cap tables and less dilution than prior generations. Valuations are starting to reflect it.
On liquidity: The IPO market is cracking open. 34 IPOs priced in Q1, raising $9.9 billion. Cerebras priced 20 times oversubscribed. OpenAI has filed confidentially. SpaceX has filed its S-1. But for most companies in this dataset, the public markets are not yet the answer. The secondary market and the tender offer are the real liquidity mechanisms right now. Public listings are returning, but selectively. This is not a crisis. It is a structural shift that is still in progress.
Q1 highlights
AI crosses 60% of capital: Over 60 cents of each dollar of venture capital investment on Carta in Q1 2026 went to AI companies, the highest share recorded to date. Foundational model companies specifically drove much of this, accounting for 14.2% of total capital and nearly a quarter of AI capital. In SaaS, 83% of capital went to AI startups.
Down rounds at historical lows: The down-round rate fell to 11.4% in Q1. This is back in line with 2019 and 2020 levels. Before the bull market, before the reset, before the recovery. The three-year hangover from the valuation lows of 2022 may now be in the past.
Series B and Series C valuations rising: While early-stage primary valuations softened, Series B and Series C primary pre-money valuations are up 17.2% and 12.5%, respectively, since Q1 2025. This may be because AI companies are maturing and moving toward later stages after promising early wins.
New this quarter: Three side-by-side tables breaking out non-AI, AI applied, and AI foundational model companies across every stage from seed to Series E+. Post-money valuation, round size, and pre-money valuation. Q1 2025 versus Q1 2026. The clearest picture yet of how differently these three categories are being priced right now.
What's inside? 40+ charts spanning…
Volume and valuations
Capital raised and deal count by stage, every quarter back to 2018. The full recovery in one view.
Q1 2026 at seed, A, B, C, D, and E+. What each stage raised. What it looked like a year ago.
Median and 90th percentile post-money valuations by stage, 2018 to today.
Key trends
Which stages are seeing valuation gains. Which are softening.
Dilution across every stage for three years running. The numbers are moving in favor of founders.
Down rounds. From a peak of 22% in 2023 to below 12% today. The full arc.
Bridge rounds, time between rounds, company age at raise. The stay-private-longer trend in three charts.
Deal terms. Liquidation preferences and participation rights near multi-year lows.
Tender offers by year and by quarter. The acceleration is visible.
AI
The share of capital going to AI since 2018. Applied versus foundational.
Which industries are most AI-concentrated. SaaS, healthtech, hardware, adtech, education, fintech, consumer, biopharma, and more.
Which cities lead on AI investment. Bay Area, Austin, Washington, D.C., Seattle, Boston, Los Angeles.
Geography
State-by-state capital map for the last 12 months. Regional share by quarter since 2023.
Median valuations by metro: Bay Area, Austin, Boston, Washington, D.C., Los Angeles, New York, San Diego, Seattle, Philadelphia.
Capital raised by quarter since 2018 with industry mix for Bay Area and New York.
Fundraising volume
Year-over-year comparisons throughout this section use Q1 2025 figures as recorded in the charts, which reflect the full dataset as of May 22, 2026. Because of the typical administrative lag in deal recording, Q1 2025 figures in the current charts are higher than what was reported at the time of the Q1 2025 report.
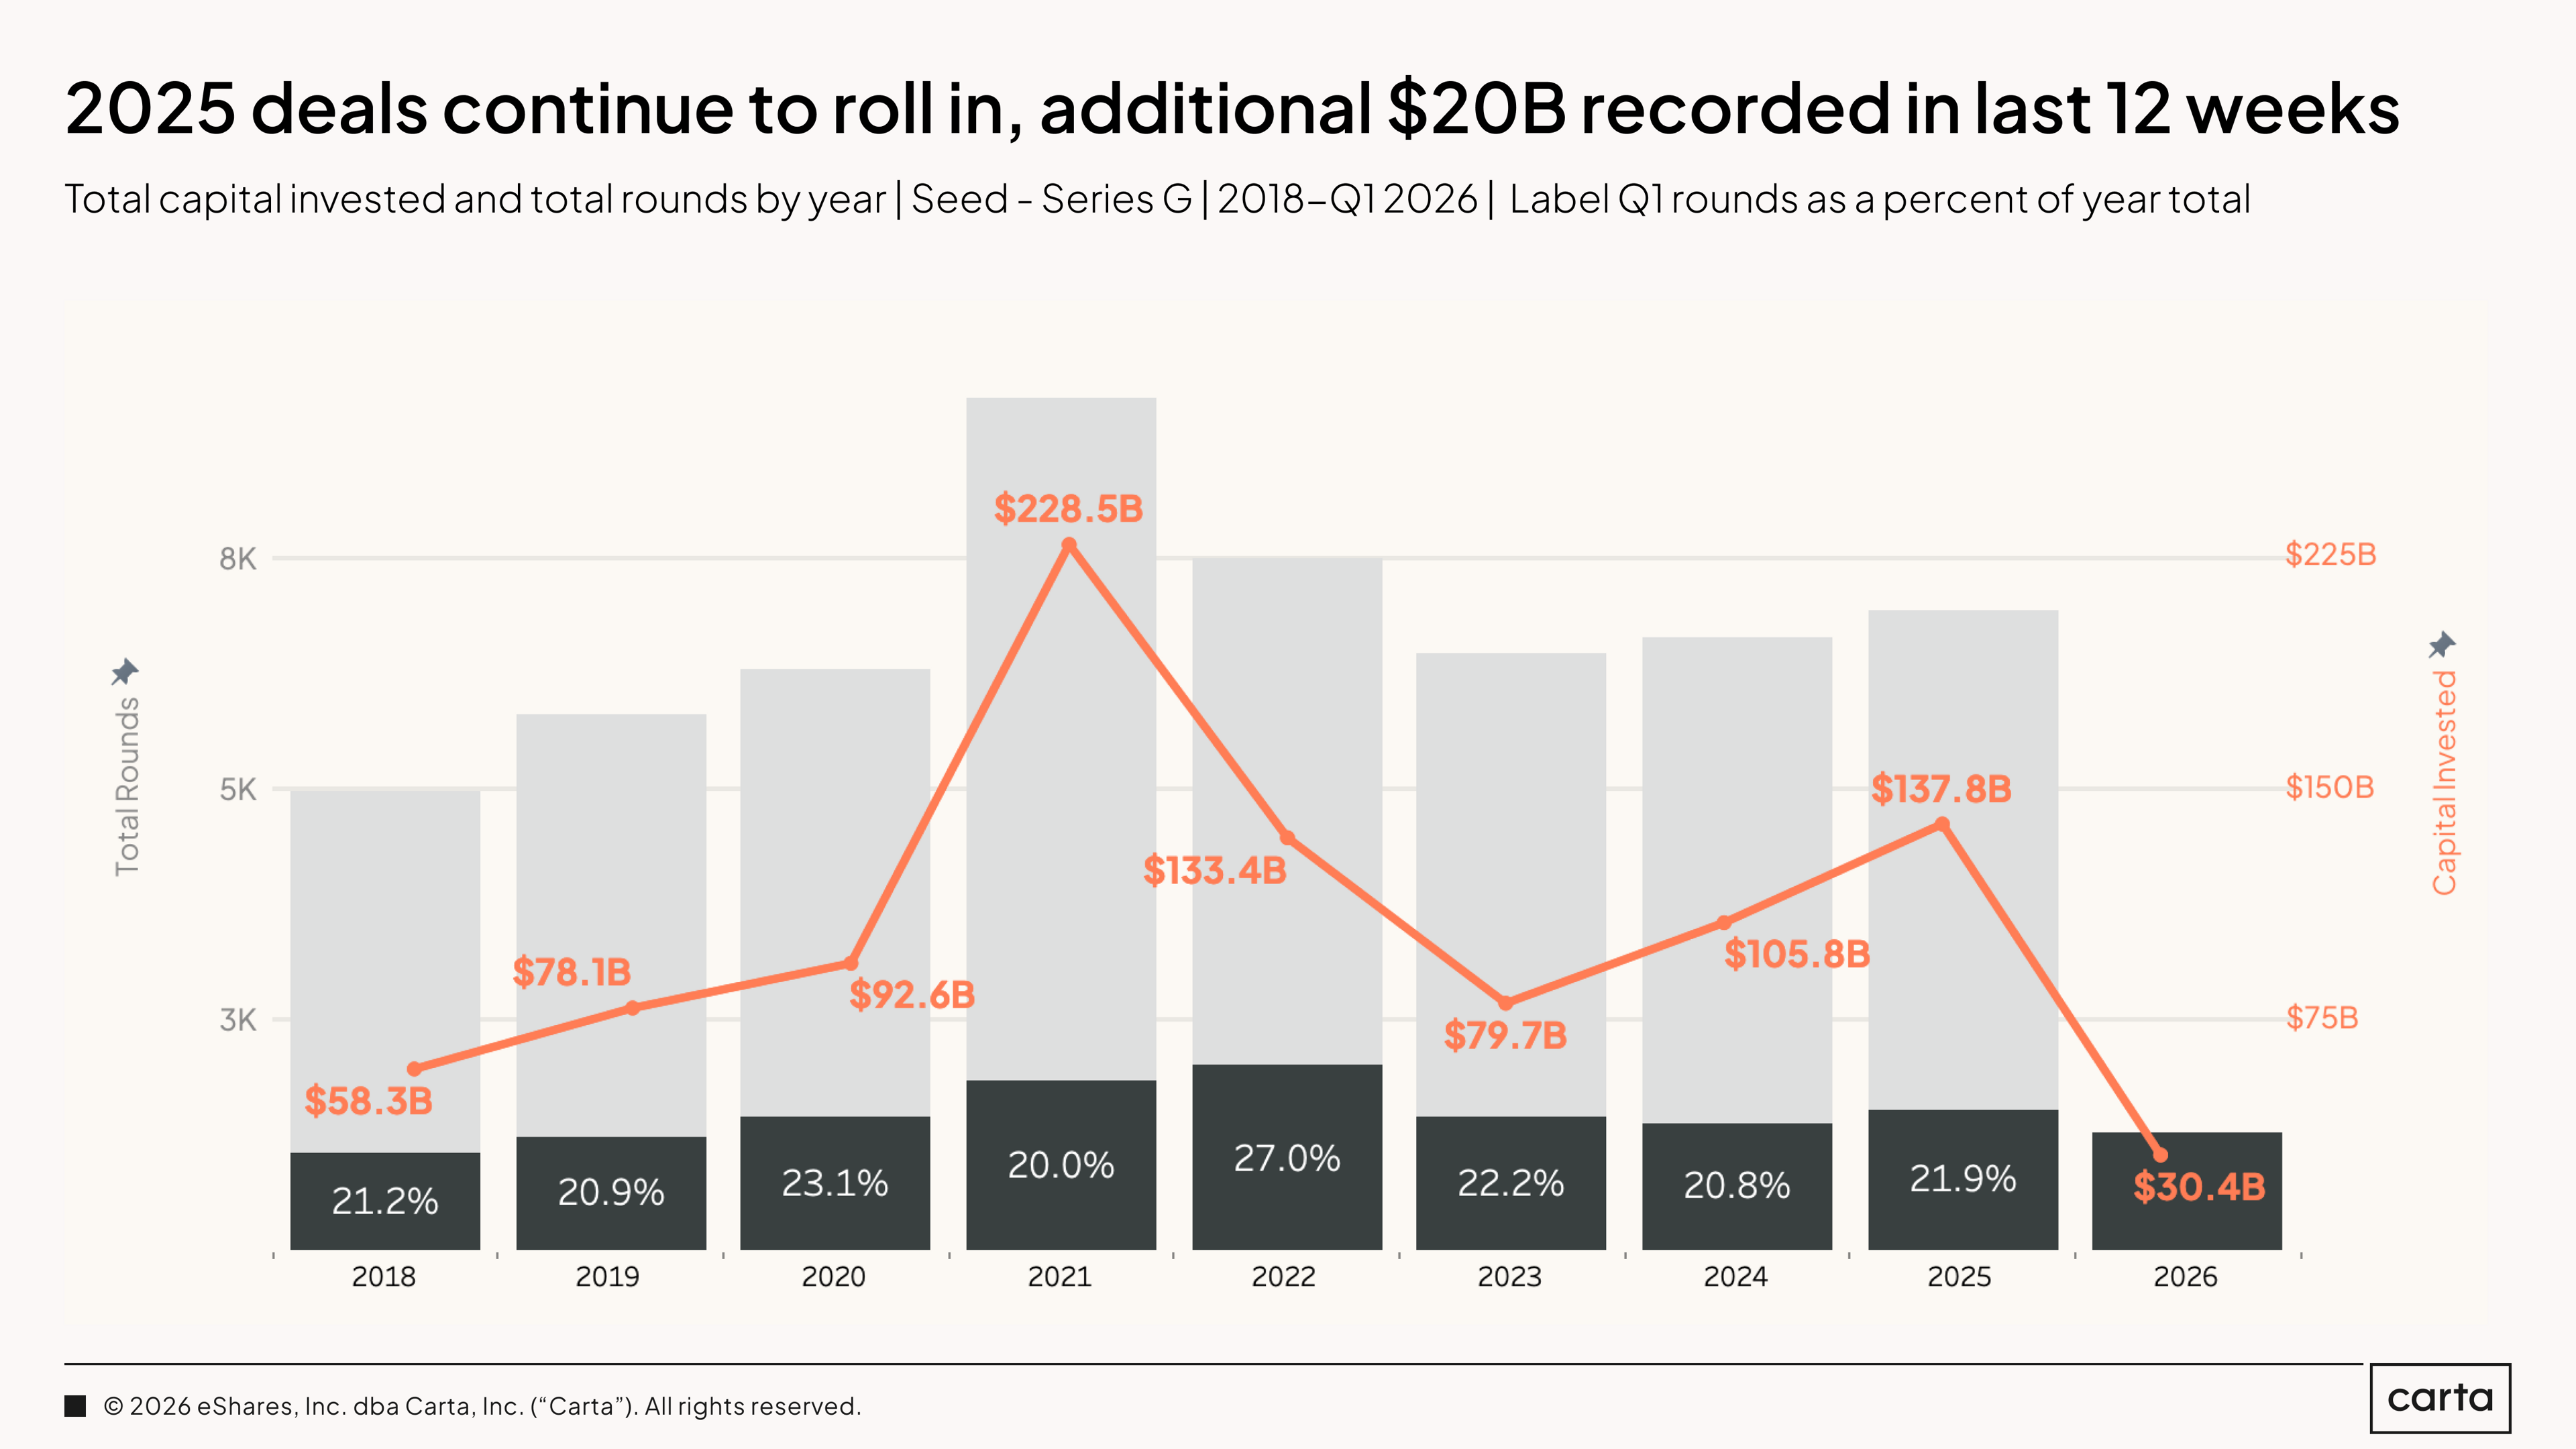
The 2025 annual total for all priced equity rounds now stands at $137.8 billion, up from $109 billion in 2024 and $82.9 billion in 2023. That figure is notably higher than the figure reported in our 2025 annual review published in February, with nearly $20 billion in additional investments recorded in the 12 weeks following that report. The current Q1 2026 figure of $30.4 billion is 22% of the previous year's annual total, consistent with where the market has historically started the year.
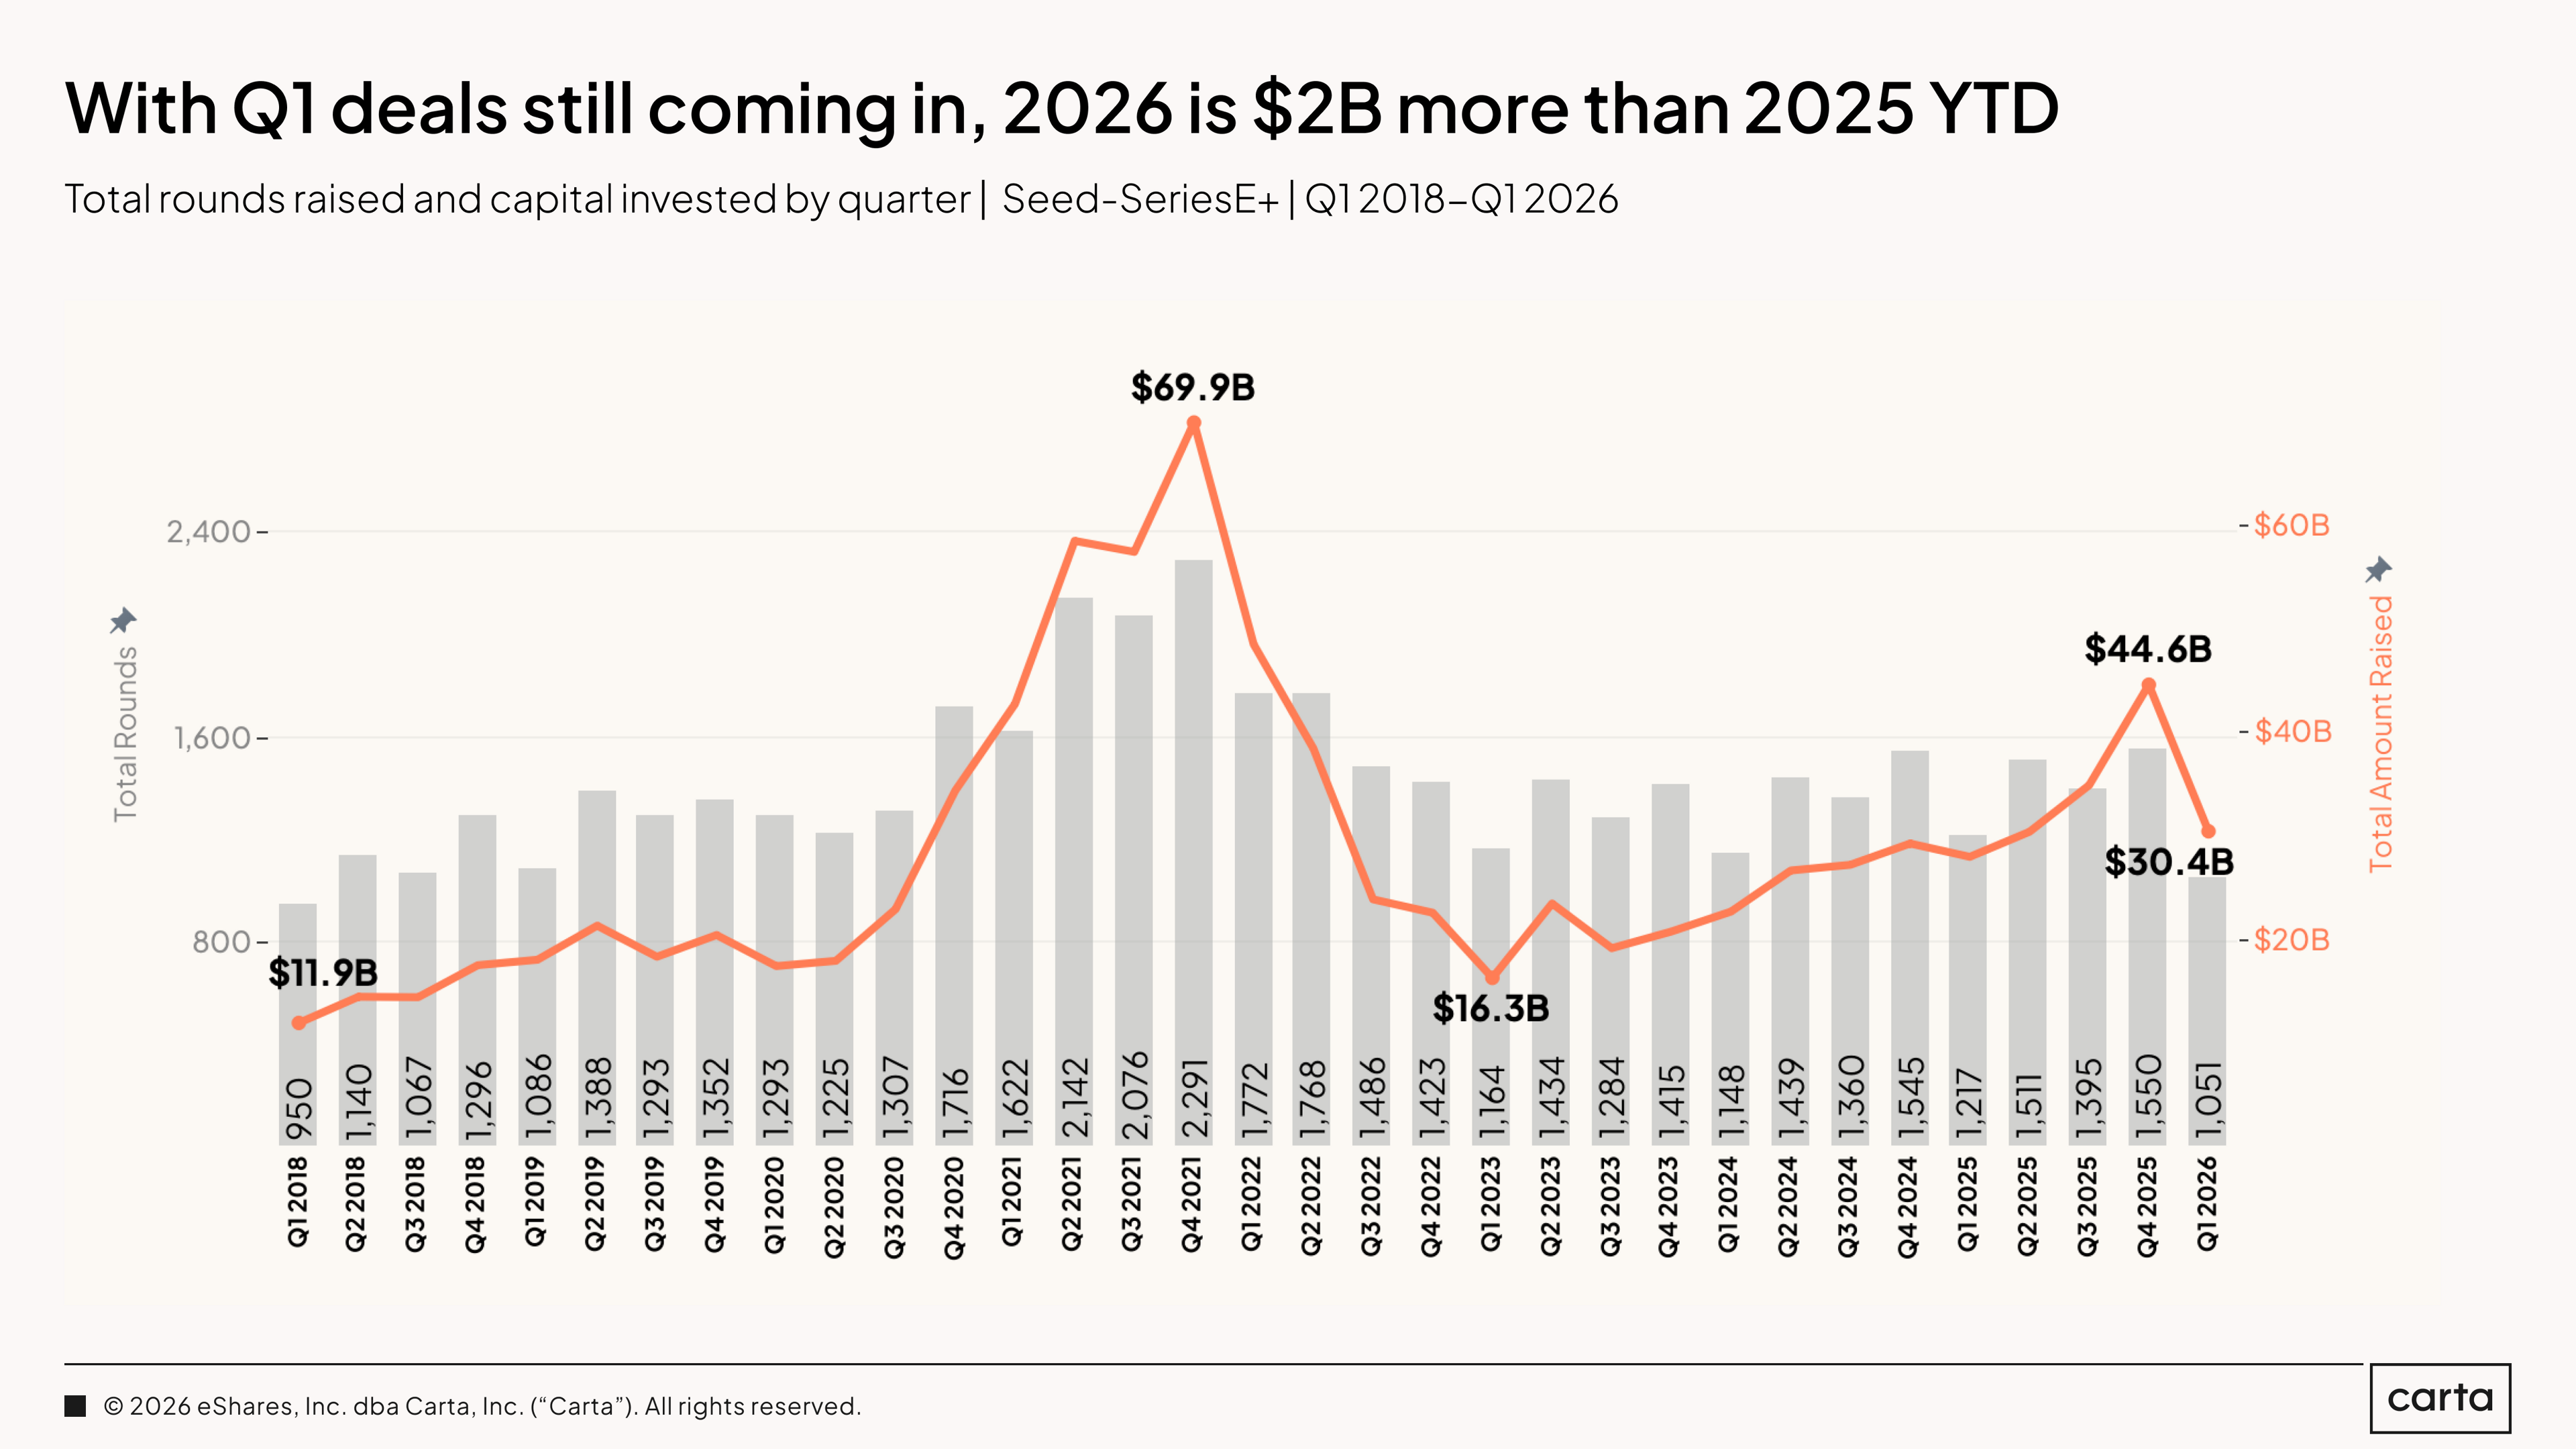
Total capital invested on Carta in Q1 2026 reached $30.4 billion across 1,051 rounds, compared to $44.6 billion in Q4 2025. That step-down is seasonal and expected. In four of the past six years, Q1 has been the quietest quarter for deal activity, with Q4 the busiest. What matters is the year-over-year read: Q1 2026 is already tracking $2 billion ahead of where Q1 2025 finally landed.
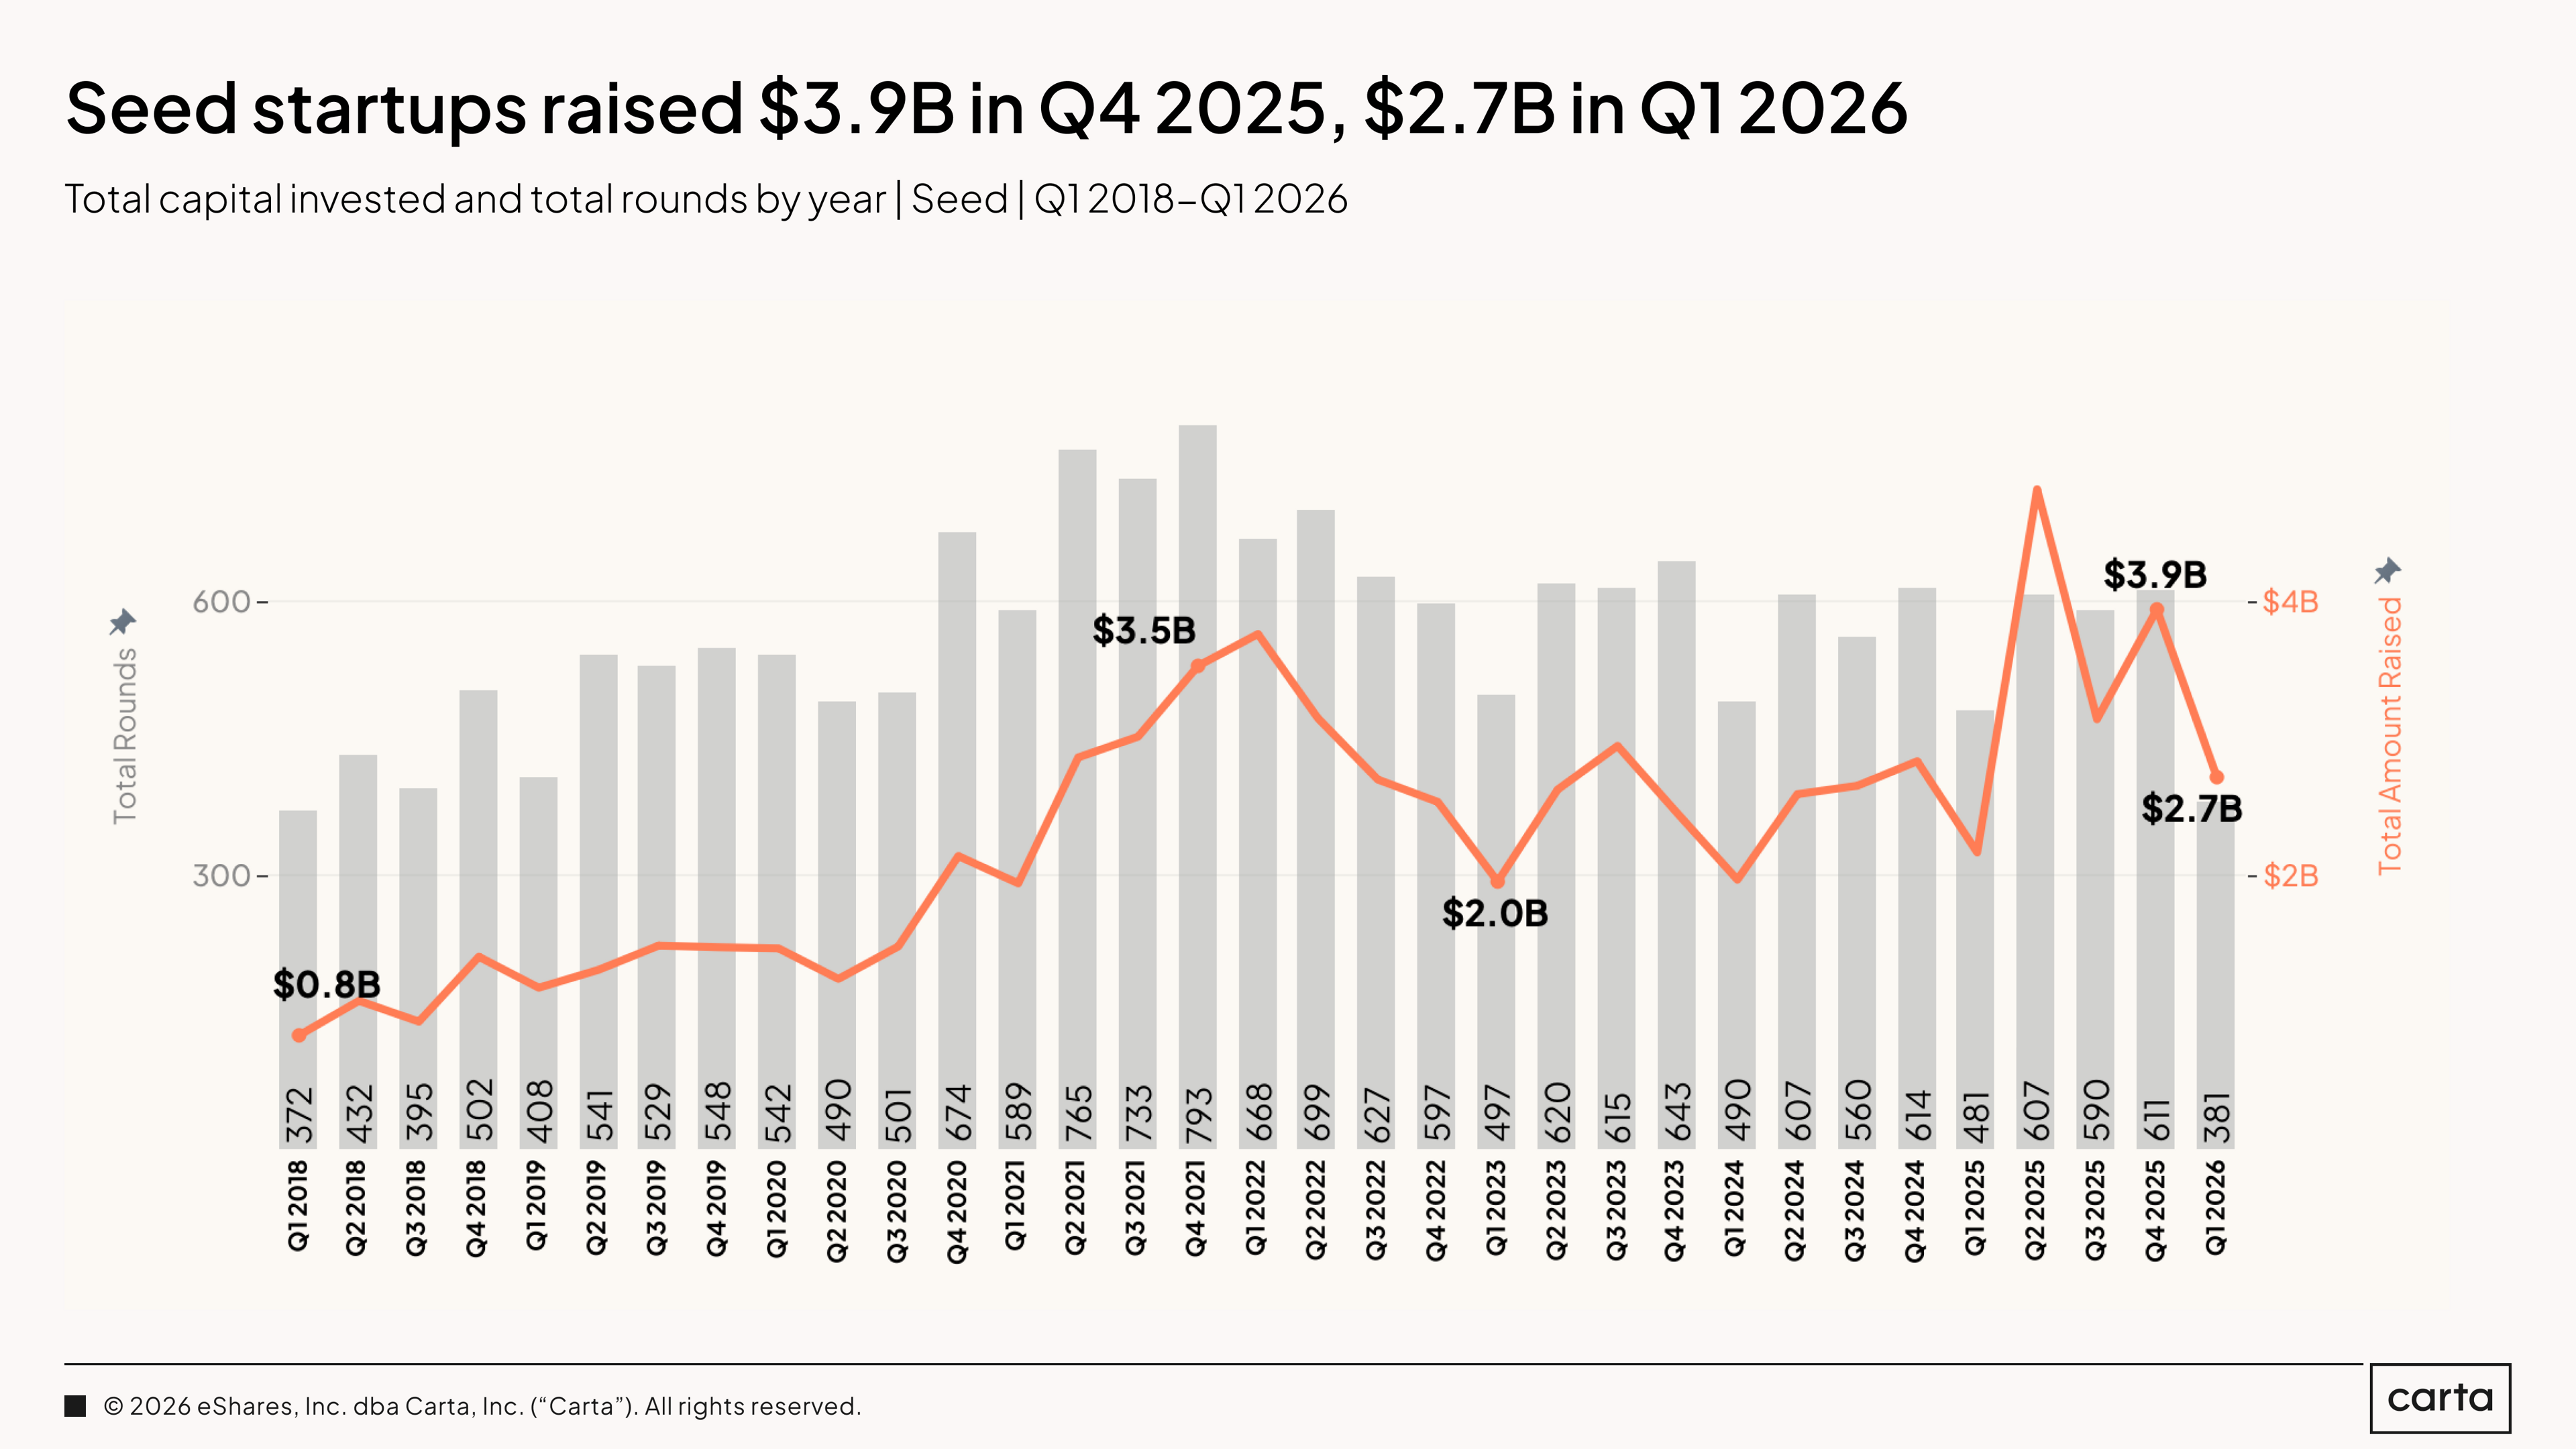
Seed startups raised $2.7 billion across 381 rounds in Q1 2026, compared to $2.2 billion and 481 rounds in Q1 2025. Capital is up 25%. Deal count is down 21%. The pattern is consistent with what is happening across the market: more dollars chasing fewer, larger rounds. The step-down from Q4 2025's $3.9 billion is seasonal and expected.
The seed funnel is narrowing. The companies getting their first check are raising more than ever. The companies not getting one are waiting longer or not raising at all. That dynamic has been building since 2022 and shows no sign of reversing.
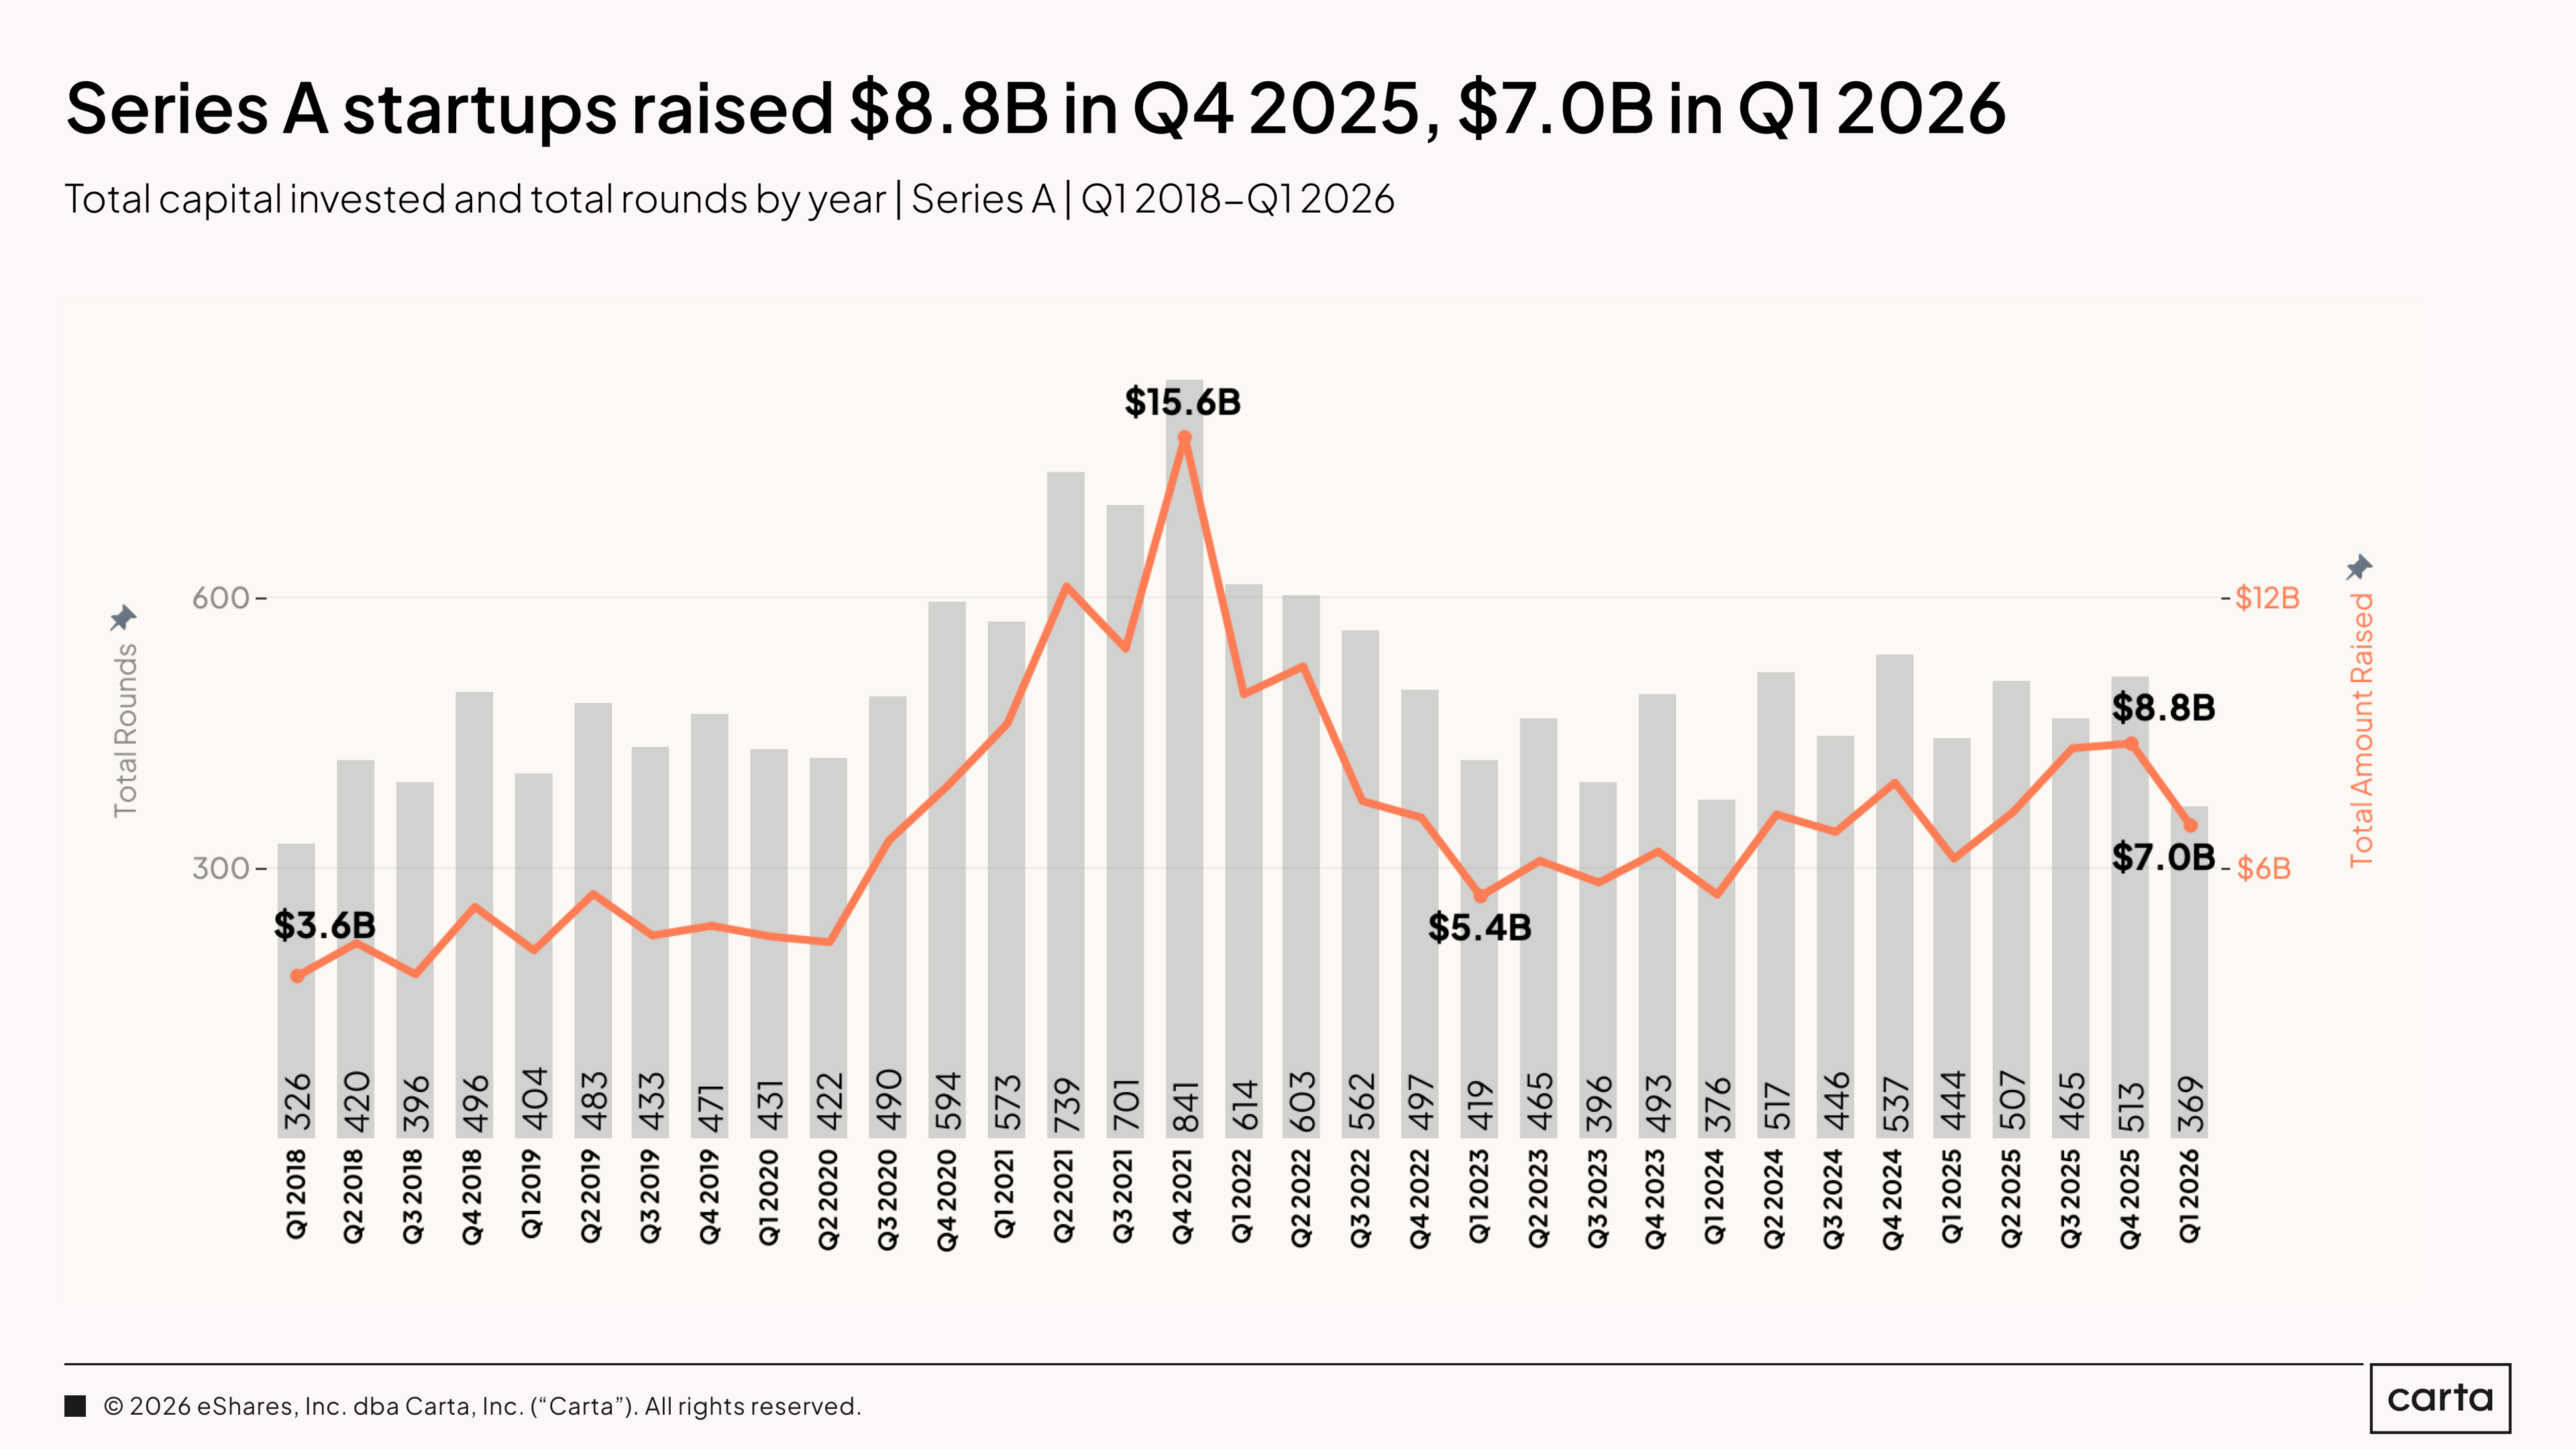
Series A raised $7.0 billion across 369 rounds in Q1 2026, compared to $6.2 billion and 444 rounds in Q1 2025. Capital is up 12% year over year. Deal count is down 17%. Q1 held its capital level flat against Q4 2025, which is unusual. Most stages see a sequential decline from Q4 to Q1. Series A held. That is a signal worth noting.
The average round size at Series A is growing. Investors are concentrating capital into fewer companies at each stage, and Series A is no exception. The stage that was most compressed during the 2022 to 2023 downturn has been recovering steadily. Q1 2026 continues that trajectory.
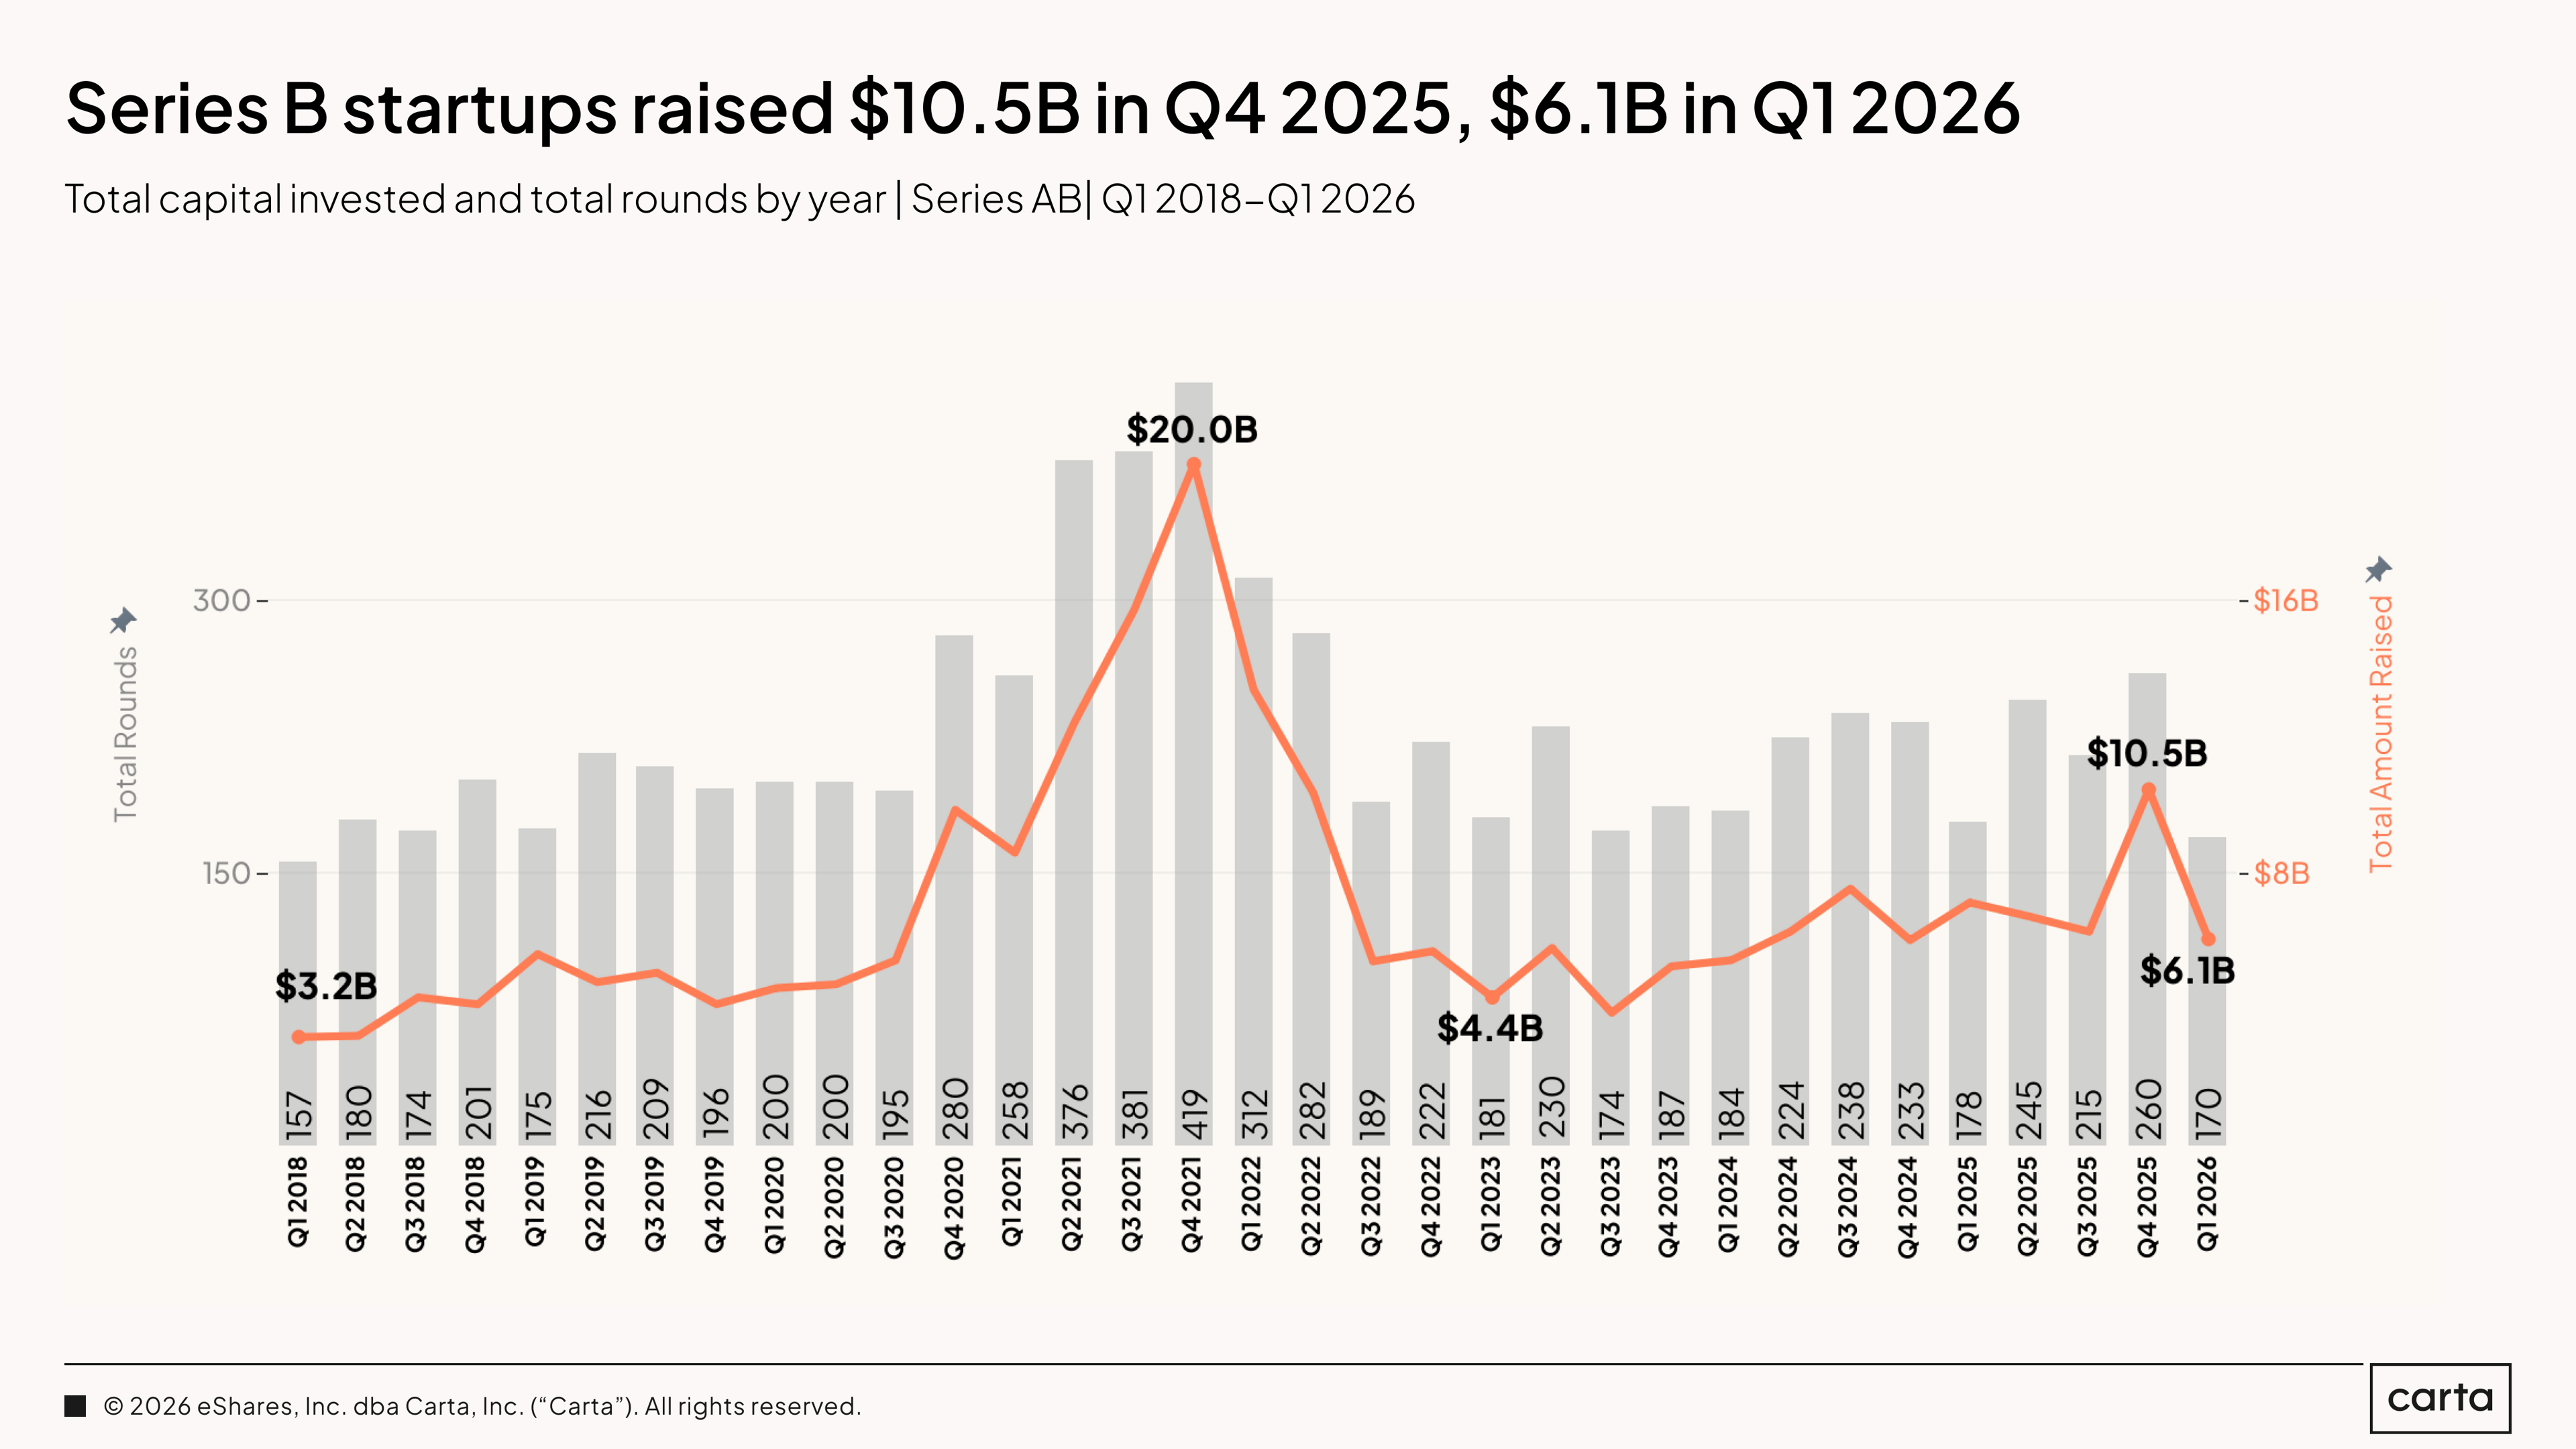
Series B raised $6.1 billion across 170 rounds in Q1 2026, compared to $7.2 billion and 178 rounds in Q1 2025. Capital is down 15% year over year. Deal count held roughly steady, which means the year-over-year decline in total capital is being driven by smaller average round sizes, not a pullback in deal activity. The sequential comparison to Q4 2025's $10.5 billion is less meaningful; that quarter was exceptional across multiple stages.
The underlying Series B market is intact. Round counts have been stable for two years. The year-over-year capital softness is worth watching but not yet a trend requiring a change in read.
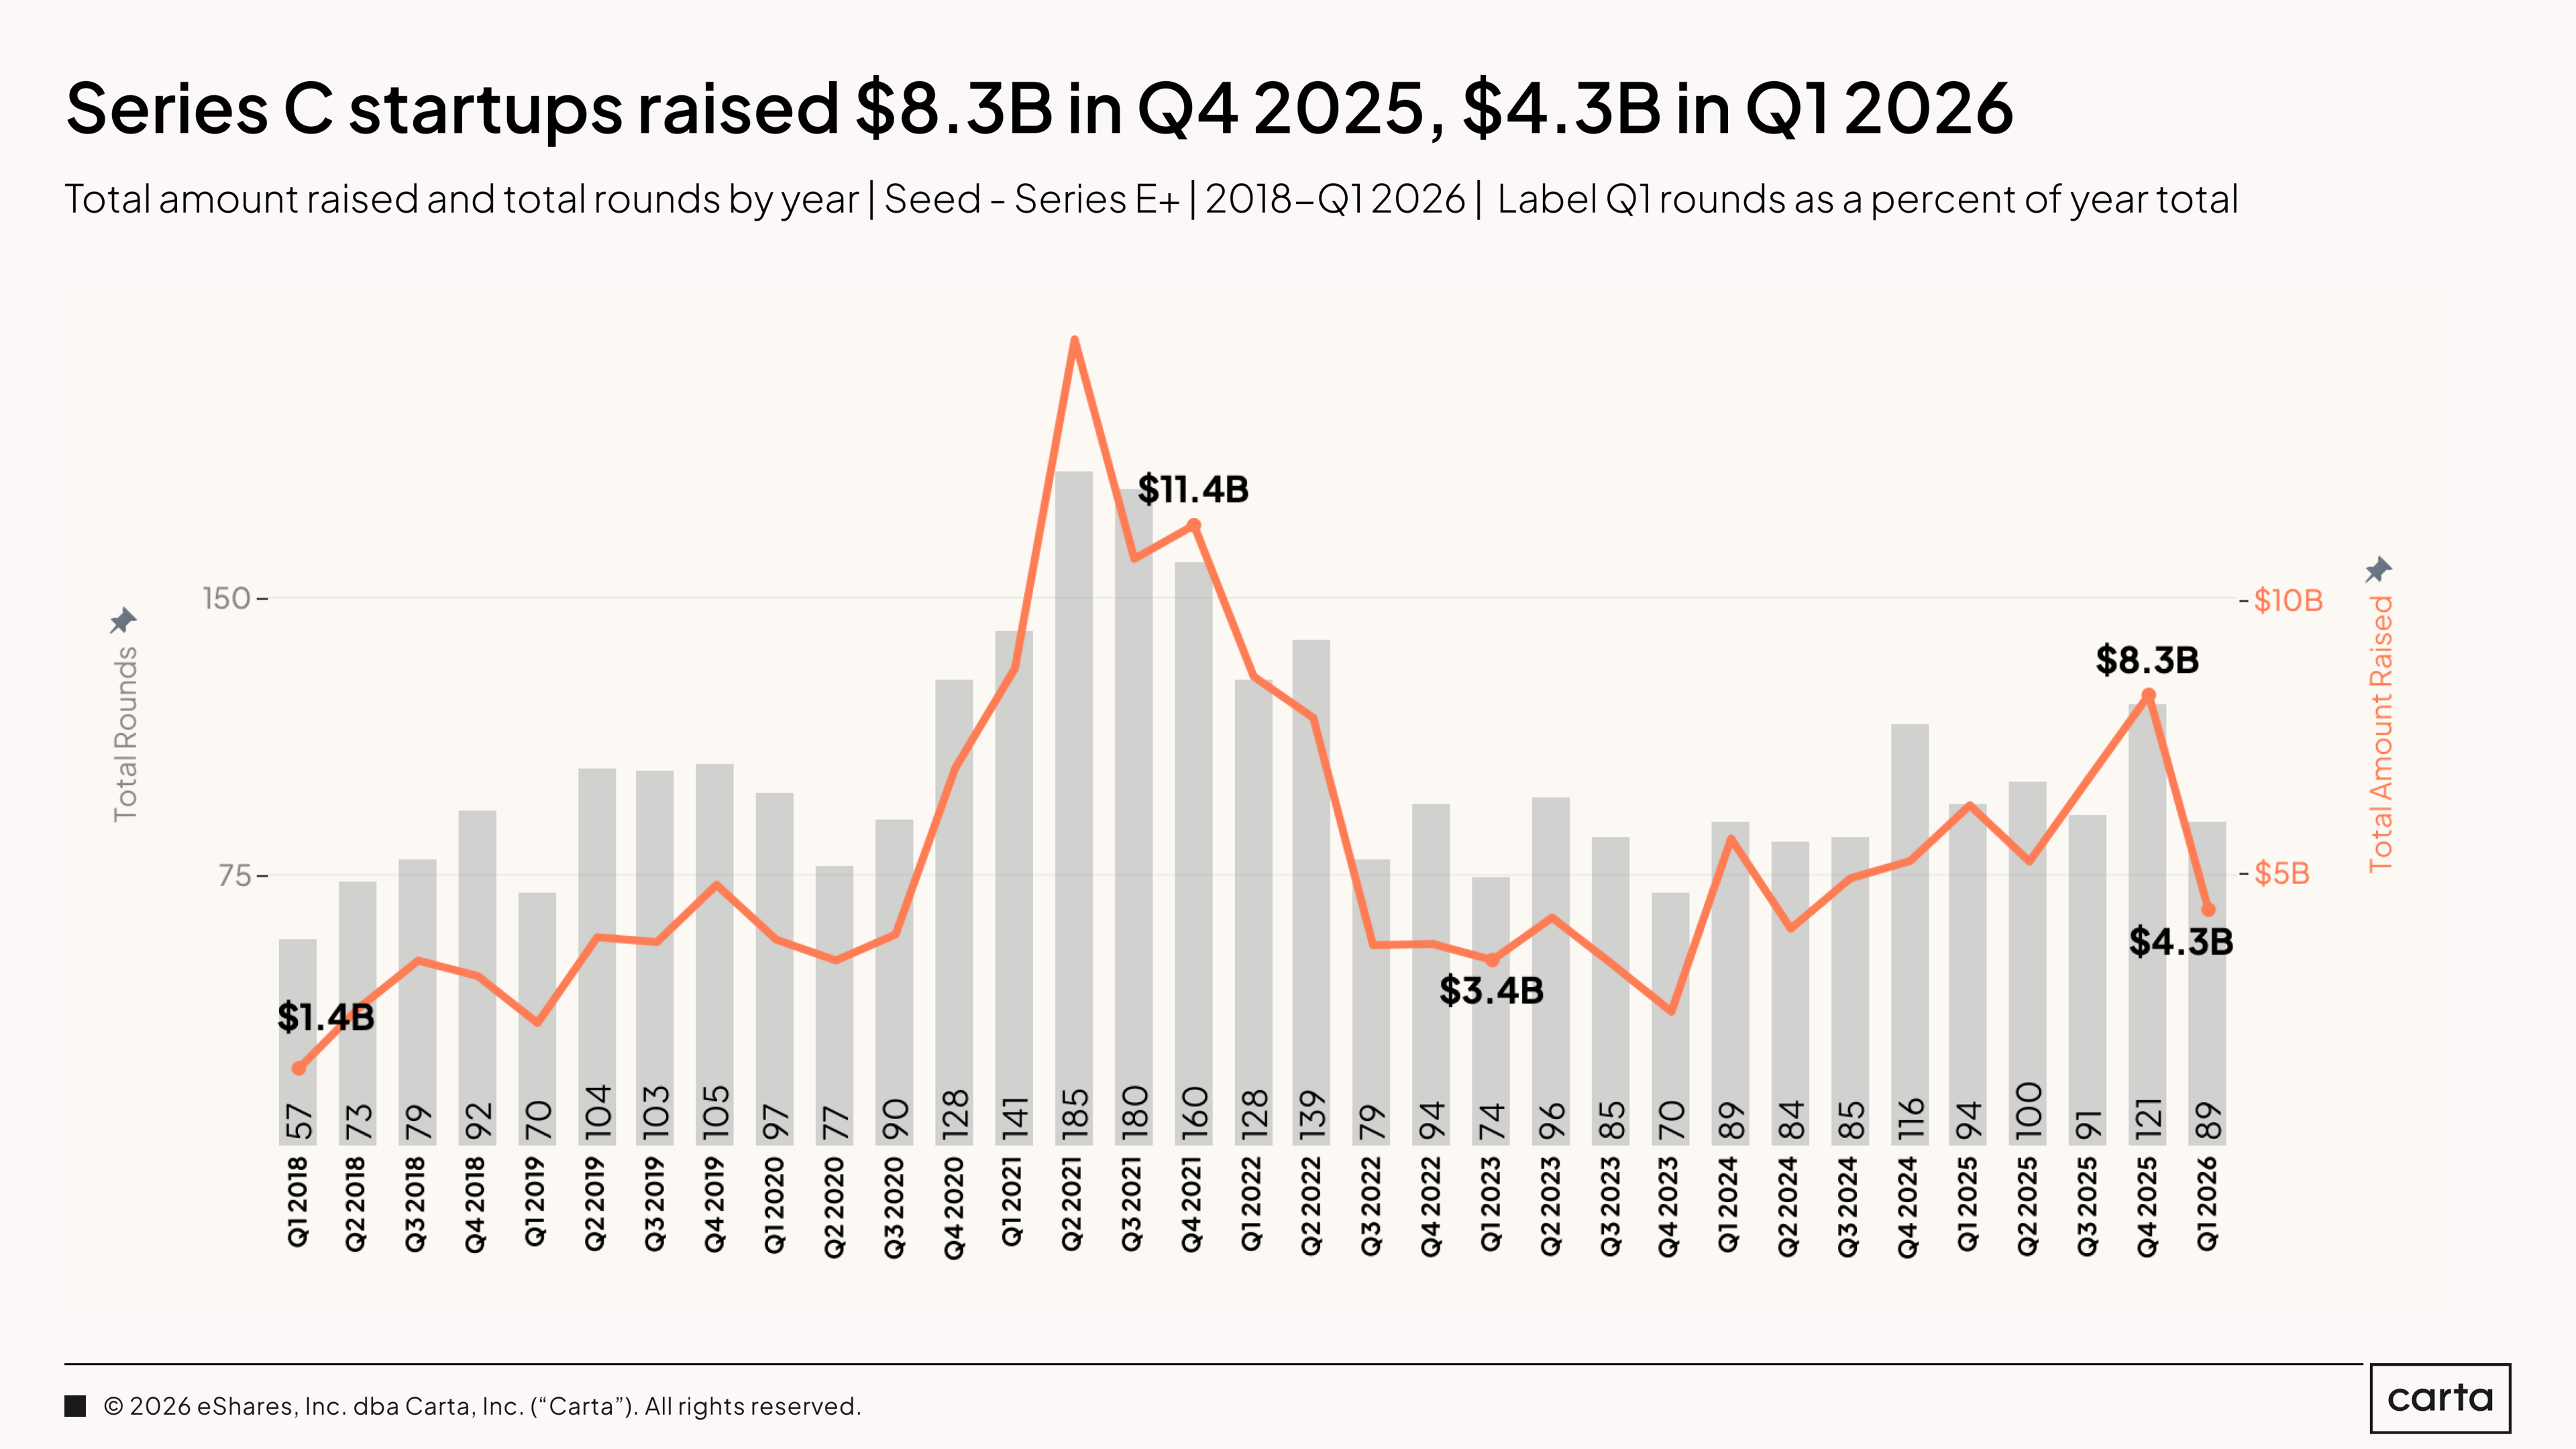
Series C raised $4.3 billion across 89 rounds in Q1 2026, compared to $6.3 billion and 94 rounds in Q1 2025. Capital is down 31% year over year. Deal count is essentially flat. The capital decline is coming from round size, not deal activity. Q4 2025 at $8.3 billion was a high-water mark; Q1 is the seasonal correction.
Series C remains the hardest stage to raise in the current market. The time between Series B and Series C has stretched to 2.4 years at the median. Institutional investors at this stage want demonstrated scale, not positioning. The companies that are raising are raising well. The ones that are not are waiting longer than any prior cycle suggested they would need to.
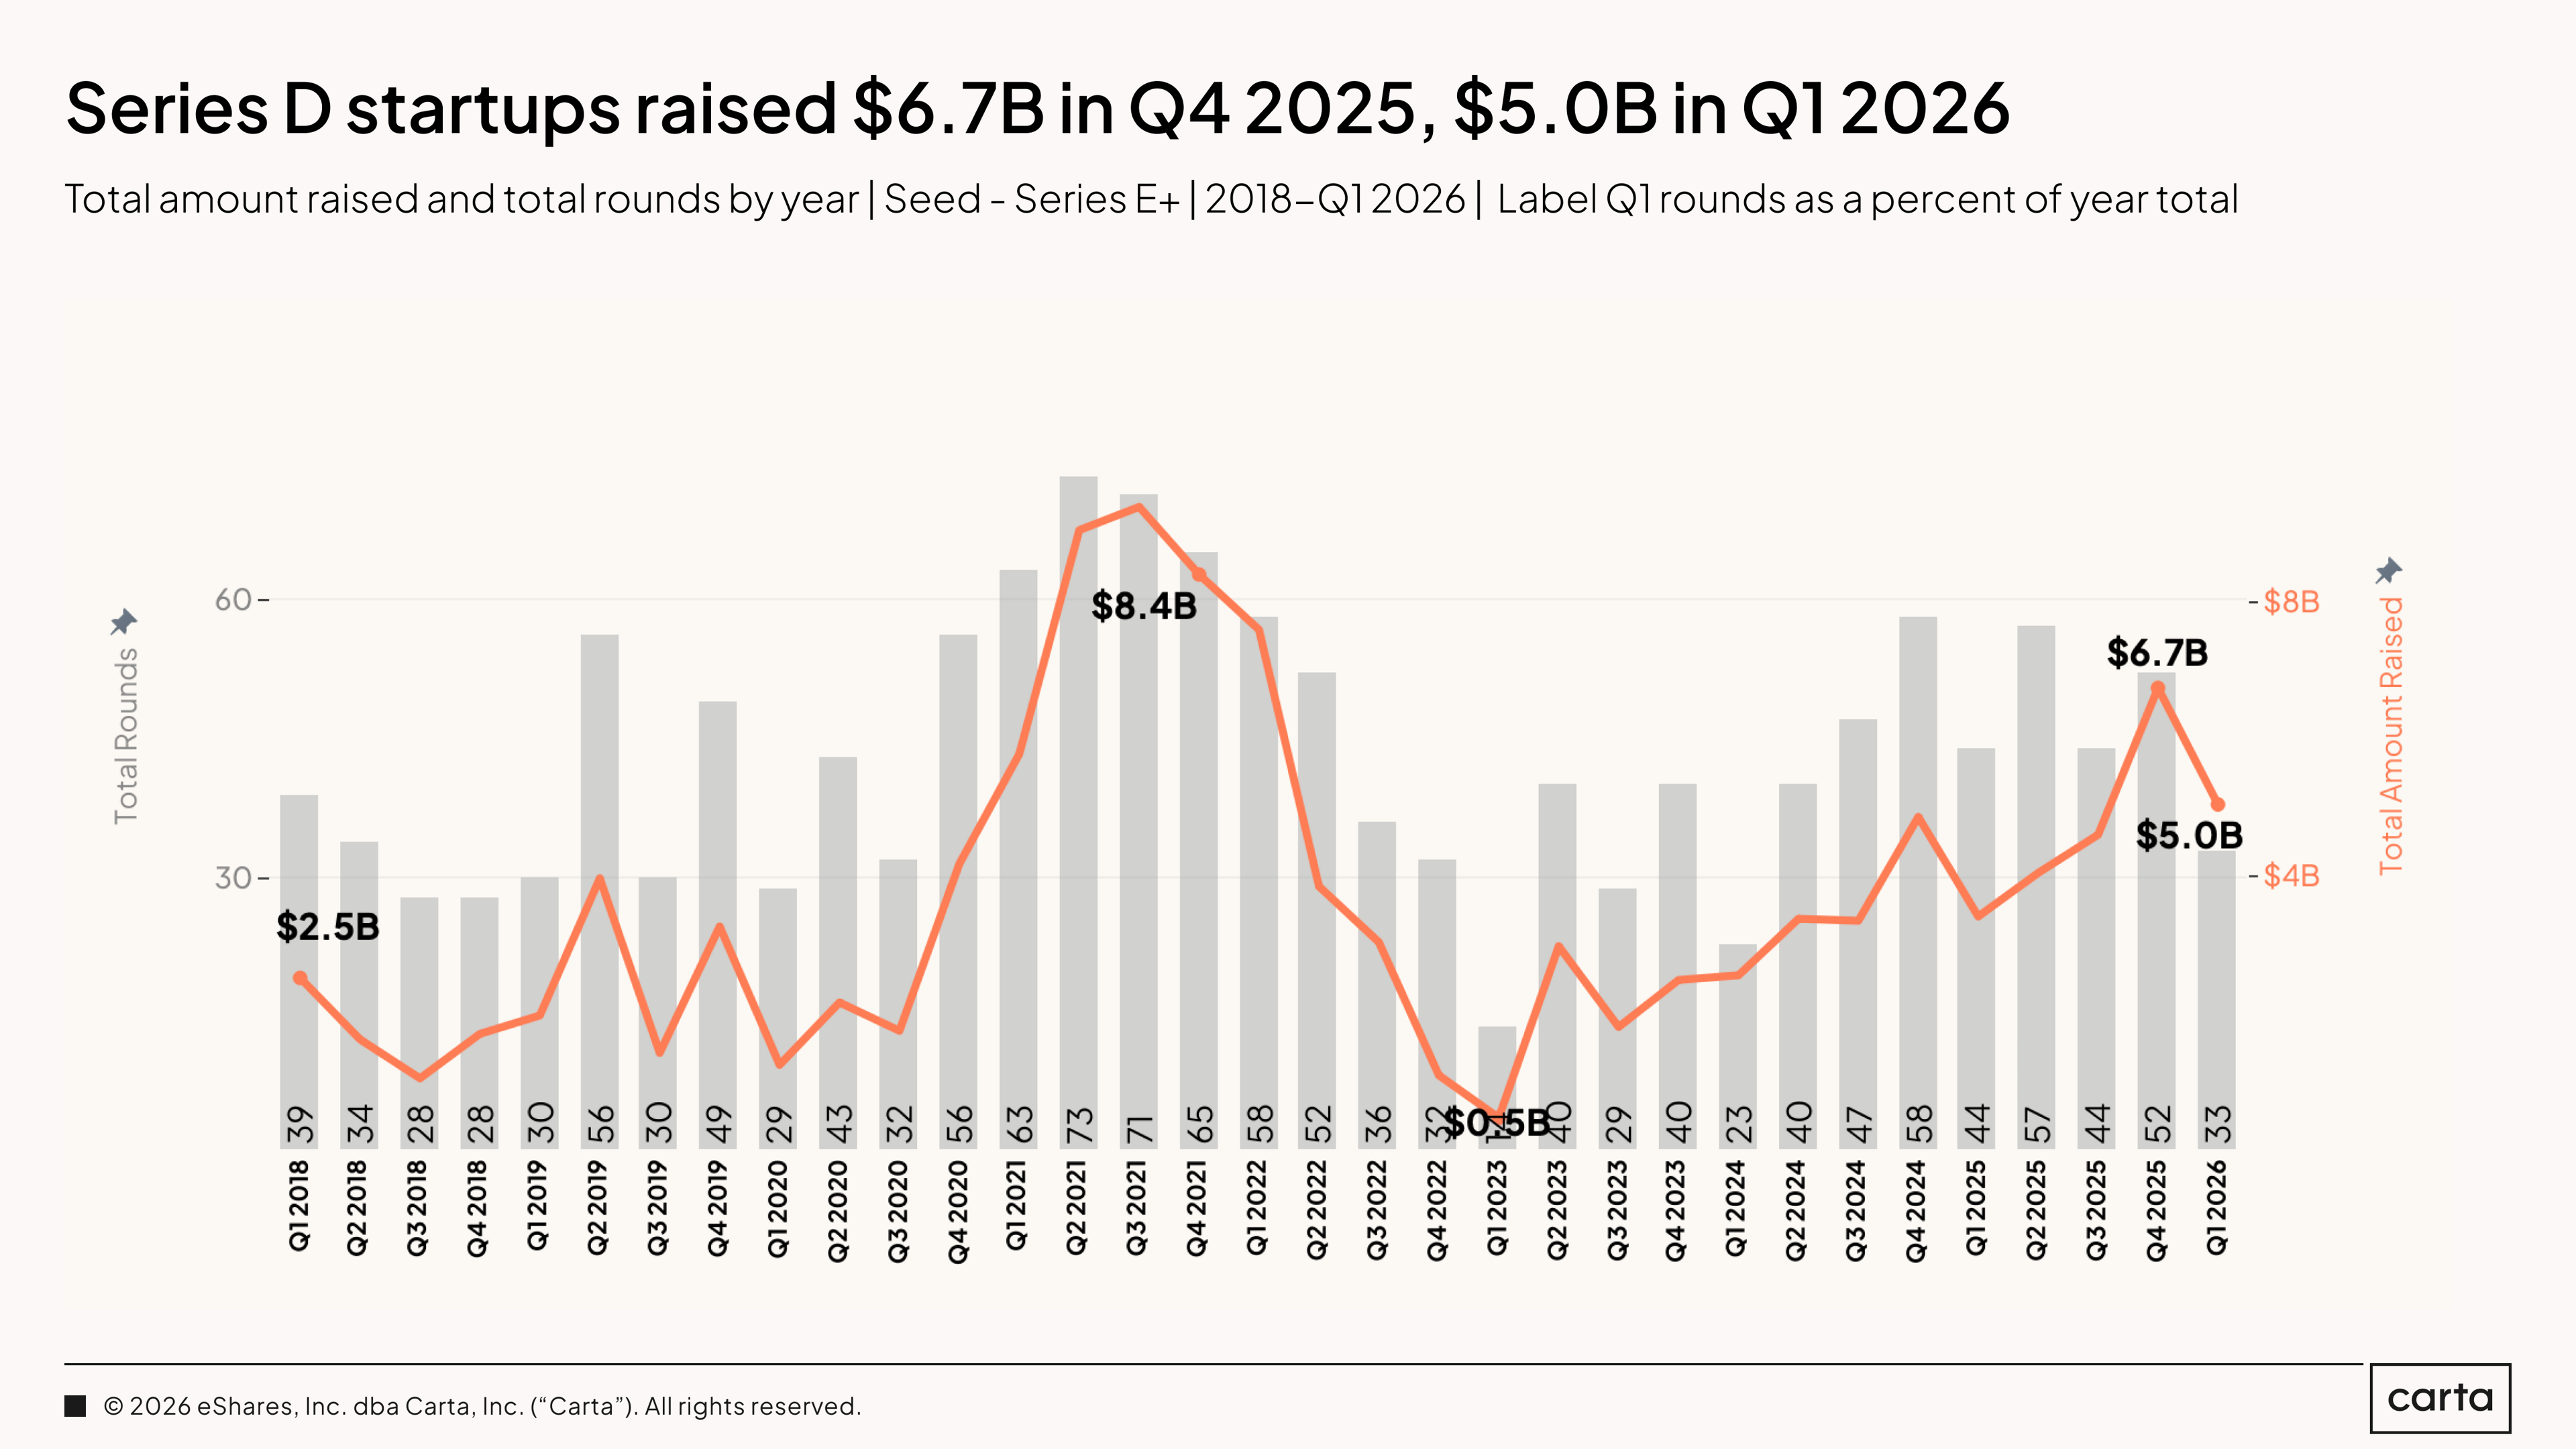
Series D raised $5.0 billion across 33 rounds in Q1 2026, compared to $3.4 billion and 44 rounds in Q1 2025. Capital is up 48% year over year. Deal count is down 25%. The average round size jumped from $77.6 million to $152.9 million in a single year. The late-stage concentration story is at its most pronounced here: far fewer rounds, dramatically larger checks, and capital going almost exclusively to companies with strong AI positioning or proven scale.
Series D was at near-zero levels in early 2023. The recovery since then has been steep and largely AI-driven. The rebound is real. It is also narrow.
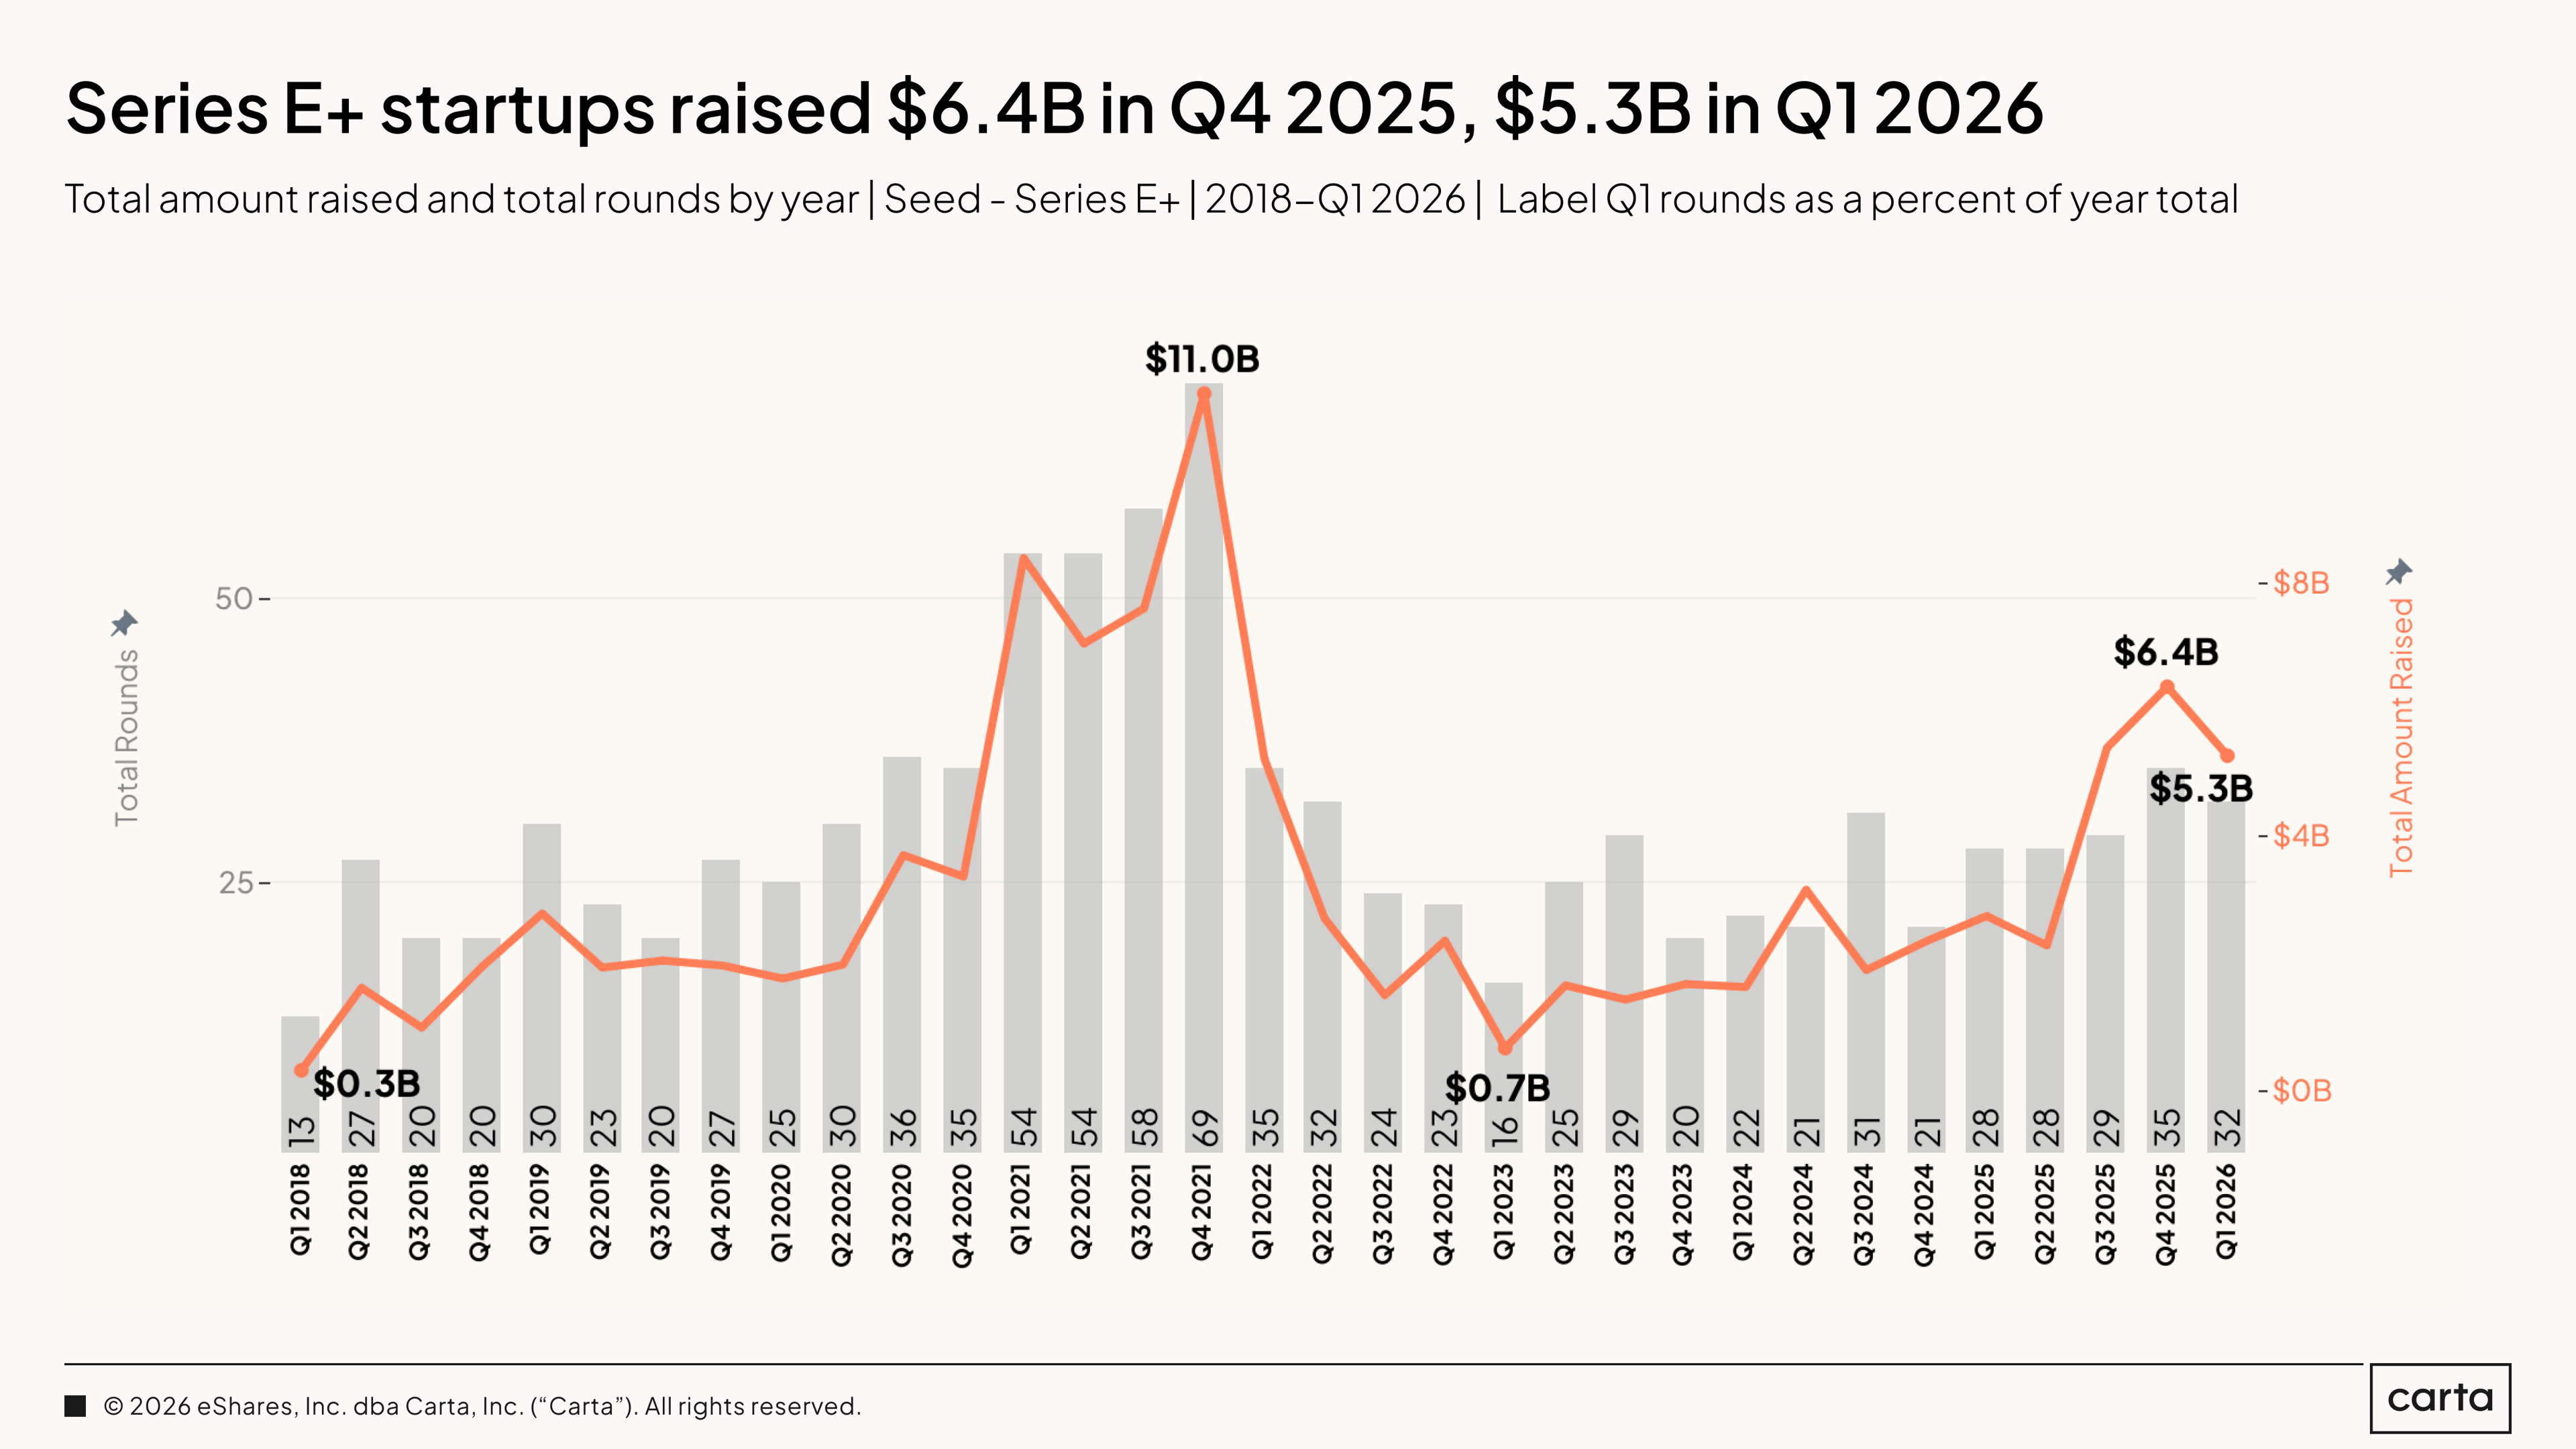
Series E+ raised $5.3 billion across 32 rounds in Q1 2026, compared to $2.7 billion and 28 rounds in Q1 2025. Capital nearly doubled year over year. Deal count grew 14%. It is the only stage in Q1 where both capital and deal count moved higher simultaneously. The average round size grew from $98.1 million to $165.3 million.
Key trends
The headline numbers tell you the market is healthy. The trend data tells you who it is healthy for. This section tracks the metrics that sit beneath capital raised and deal count: how much equity founders are giving up, how long they are waiting between rounds, how often they are bridging, and what terms investors are extracting. Taken together, these charts describe the operating conditions for every company raising right now. The direction across almost every measure is favorable. The distribution of that favorability is uneven.
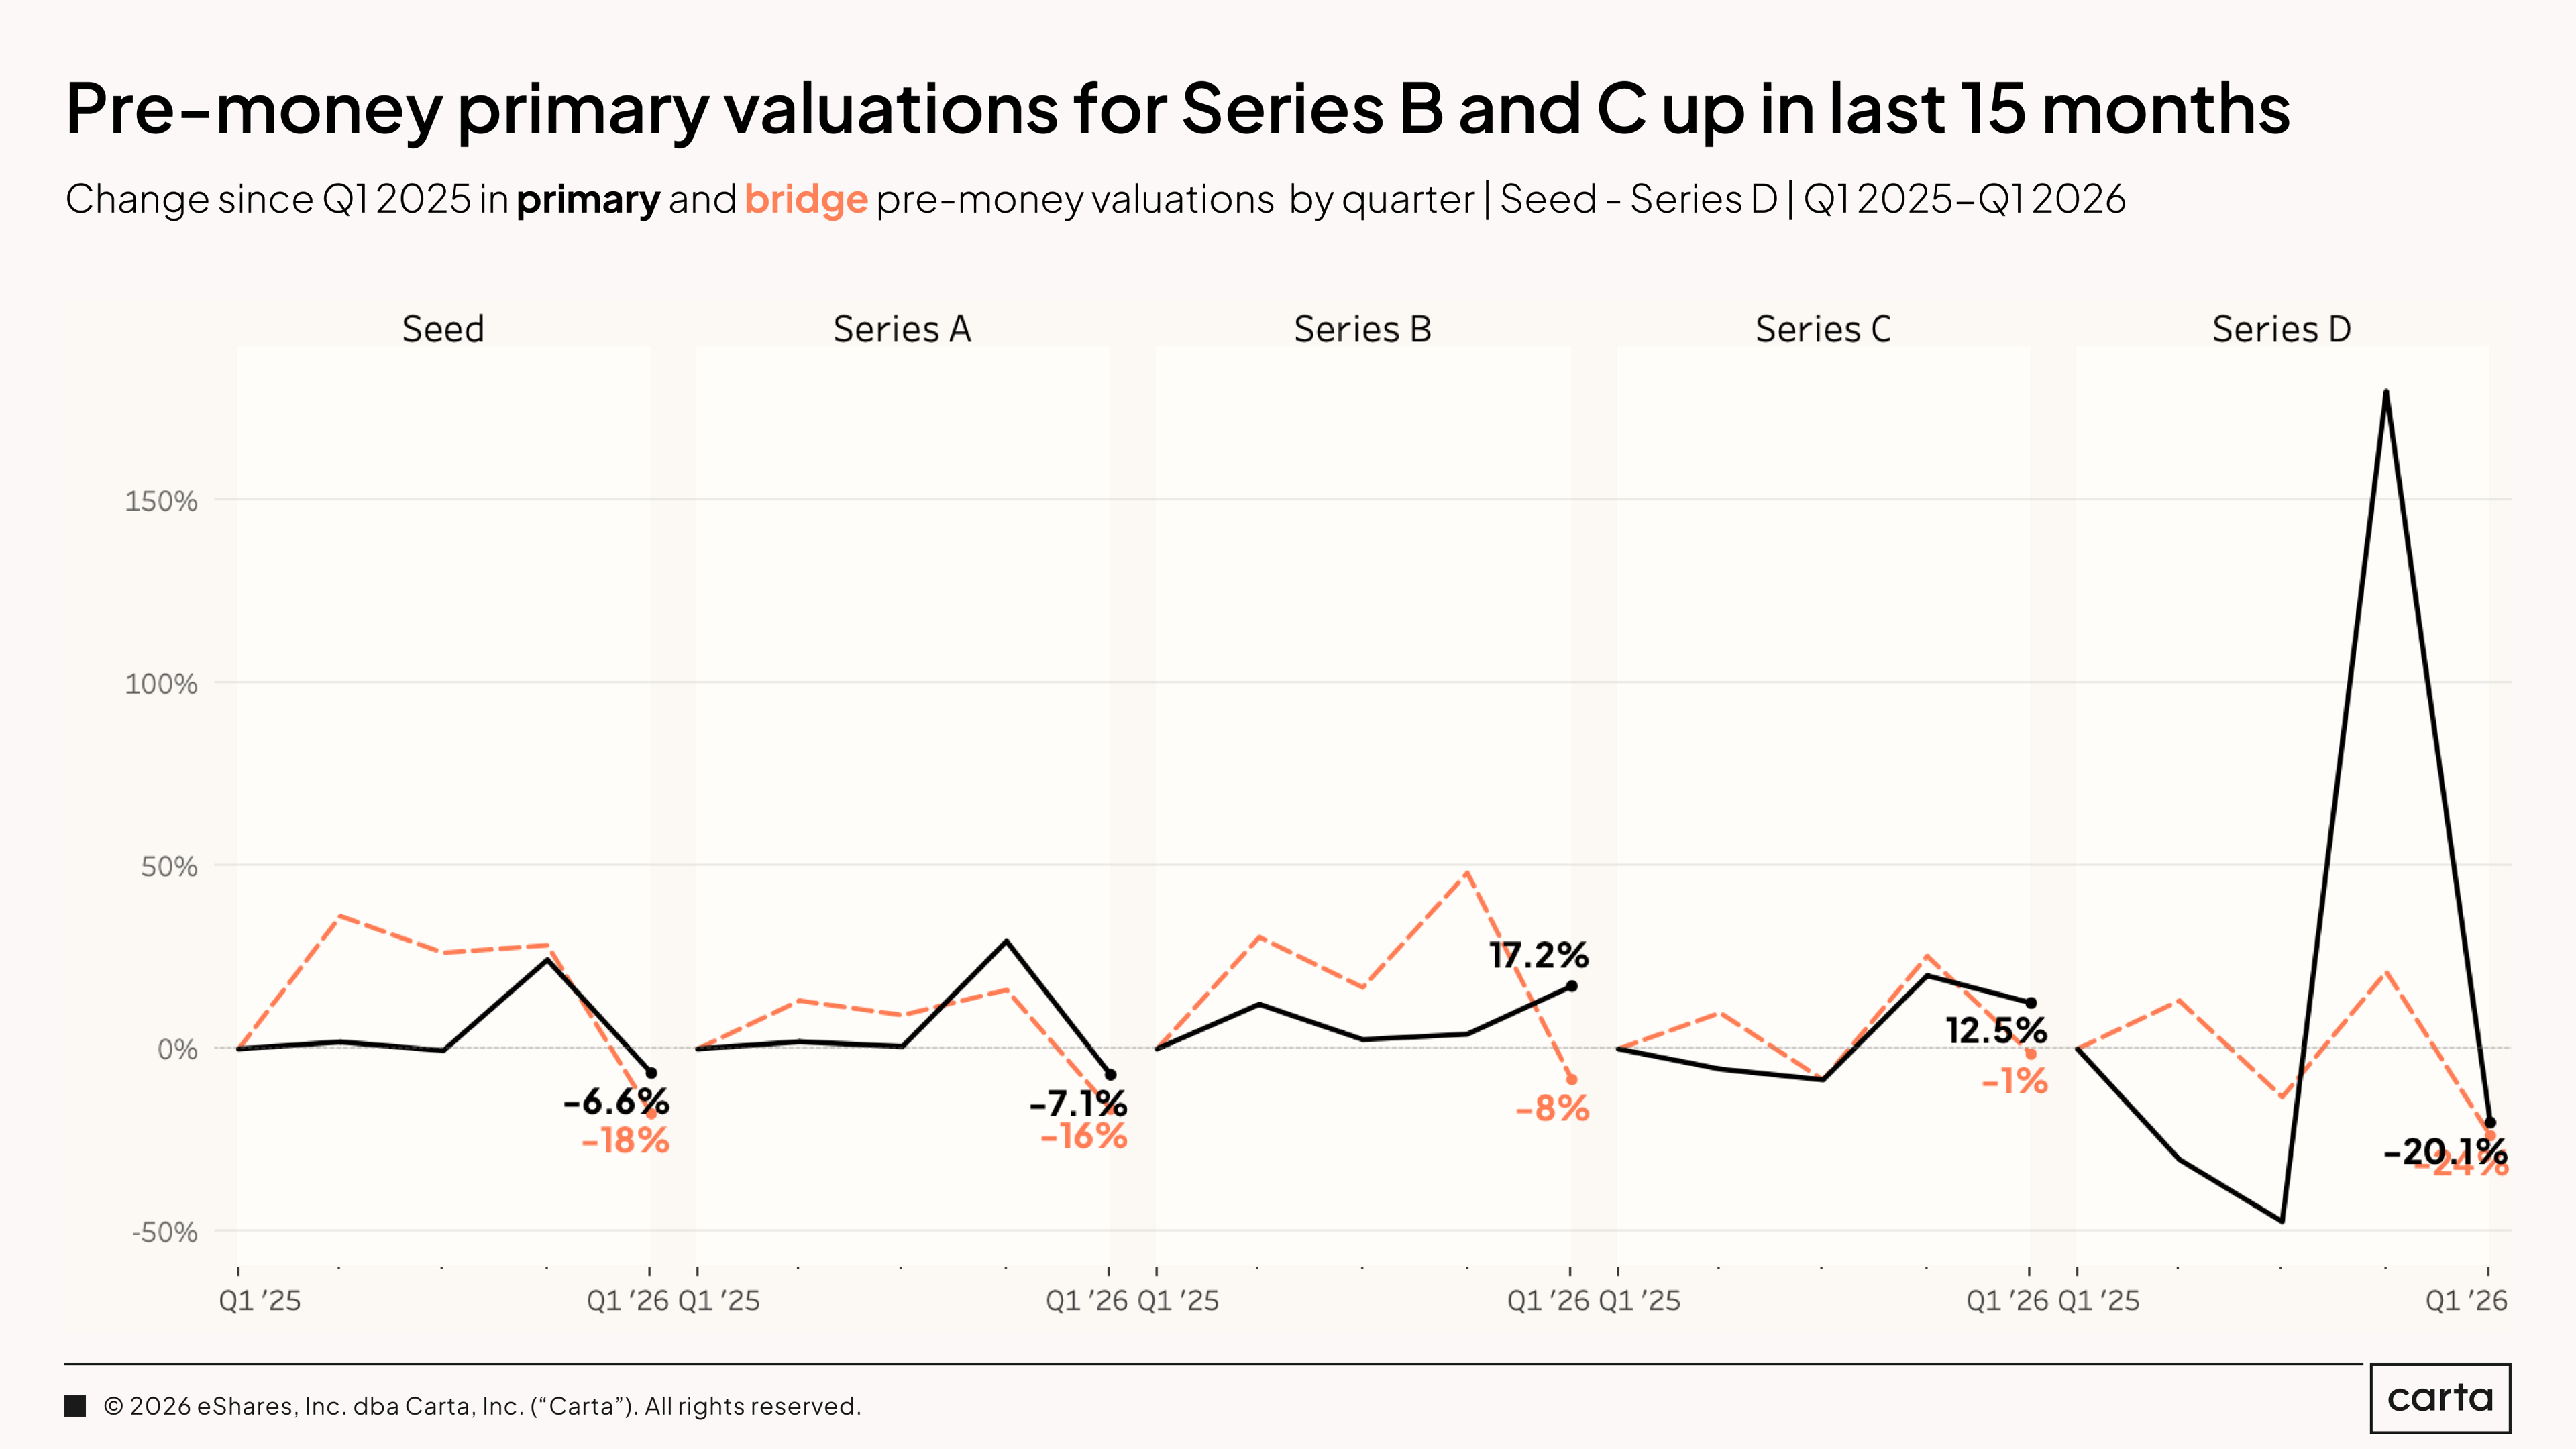
Pre-money valuations at seed fell 6.6% year over year and 7.1% at Series A. Bridge valuations moved even more: down 18% at seed and 16% at Series A. This softening at early stages may reflect the weight of AI premium expectations: Investors are pricing non-AI seed and Series A deals more conservatively, as AI foundational companies command increasingly extraordinary multiples. For a founder raising a seed or Series A round today outside of AI, this means the negotiating environment is tighter than the headline numbers suggest. The opposite is true at mid-stage. Series B primary pre-money valuations are up 17.2% year over year, and Series C is up 12.5%.
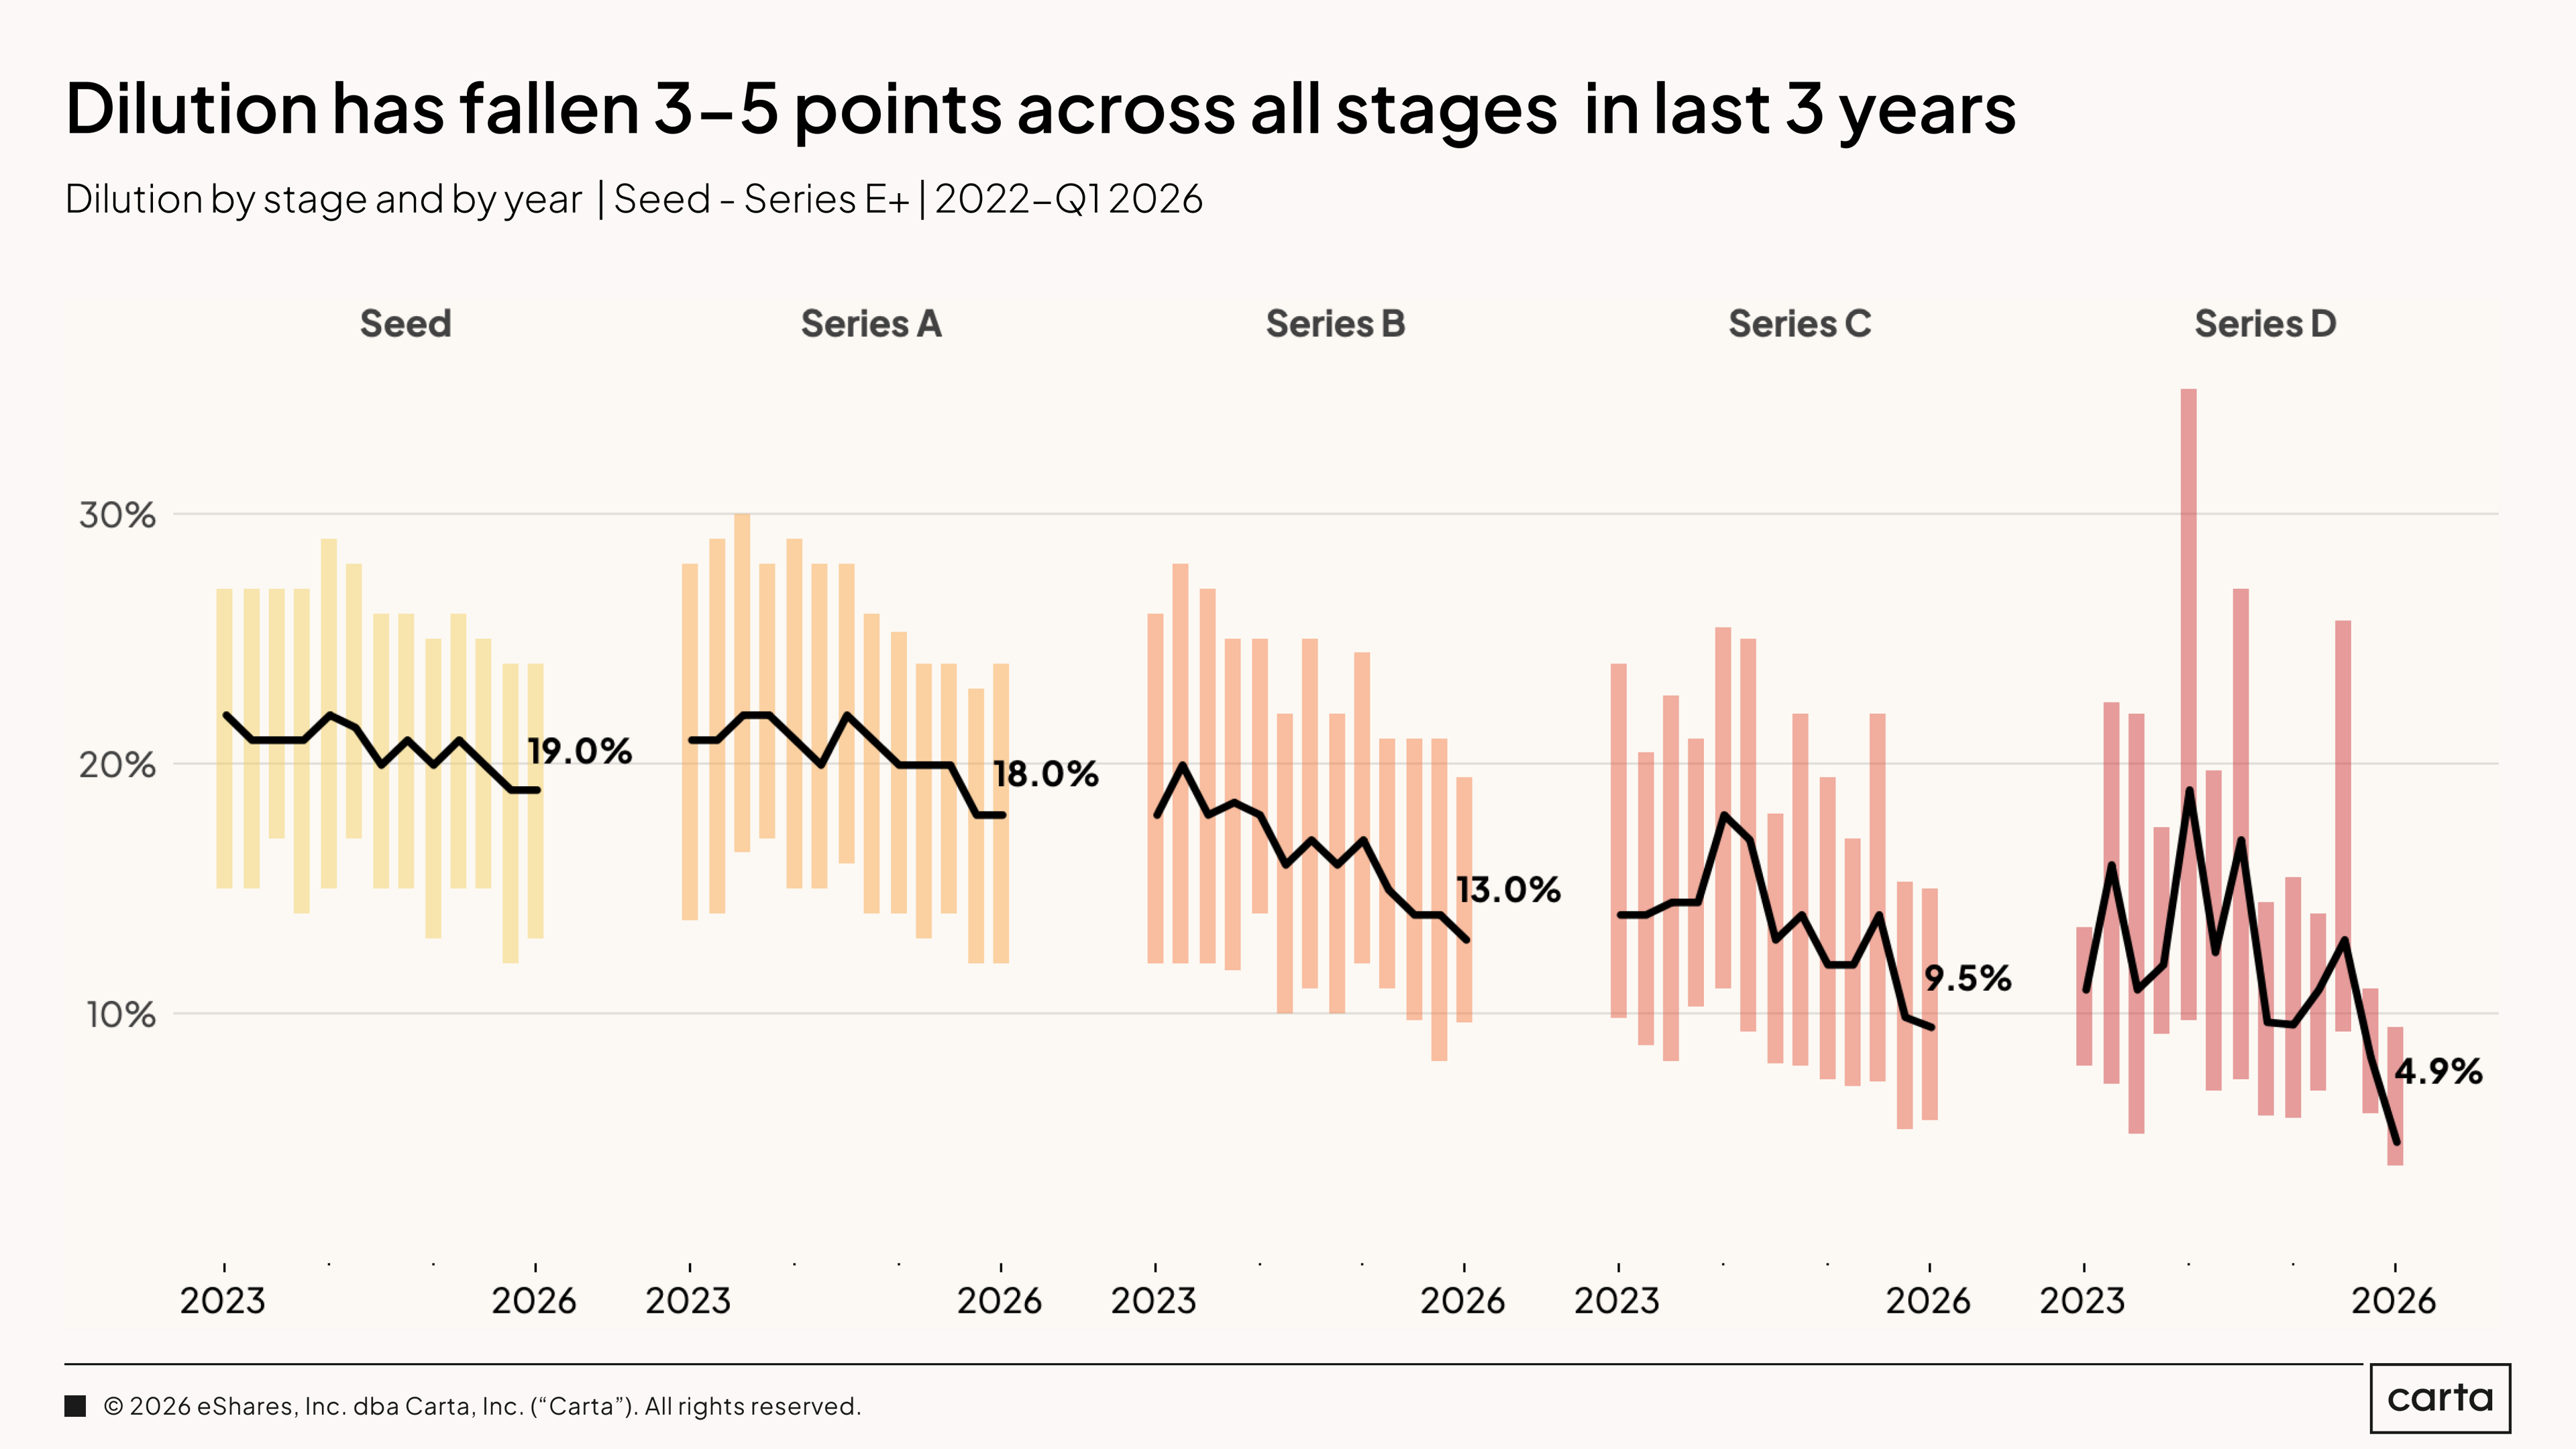
Median dilution has now fallen three to five percentage points across every stage over the past three years. In Q1 2026, median dilution was approximately 19% at seed, 18% at Series A, 13% at Series B, 9.5% at Series C, and a remarkable 4.9% at Series D. That 4.9% is a notable outlier, likely reflecting the dominance of large capital deployment into well-positioned late-stage companies where founders have maximal leverage.
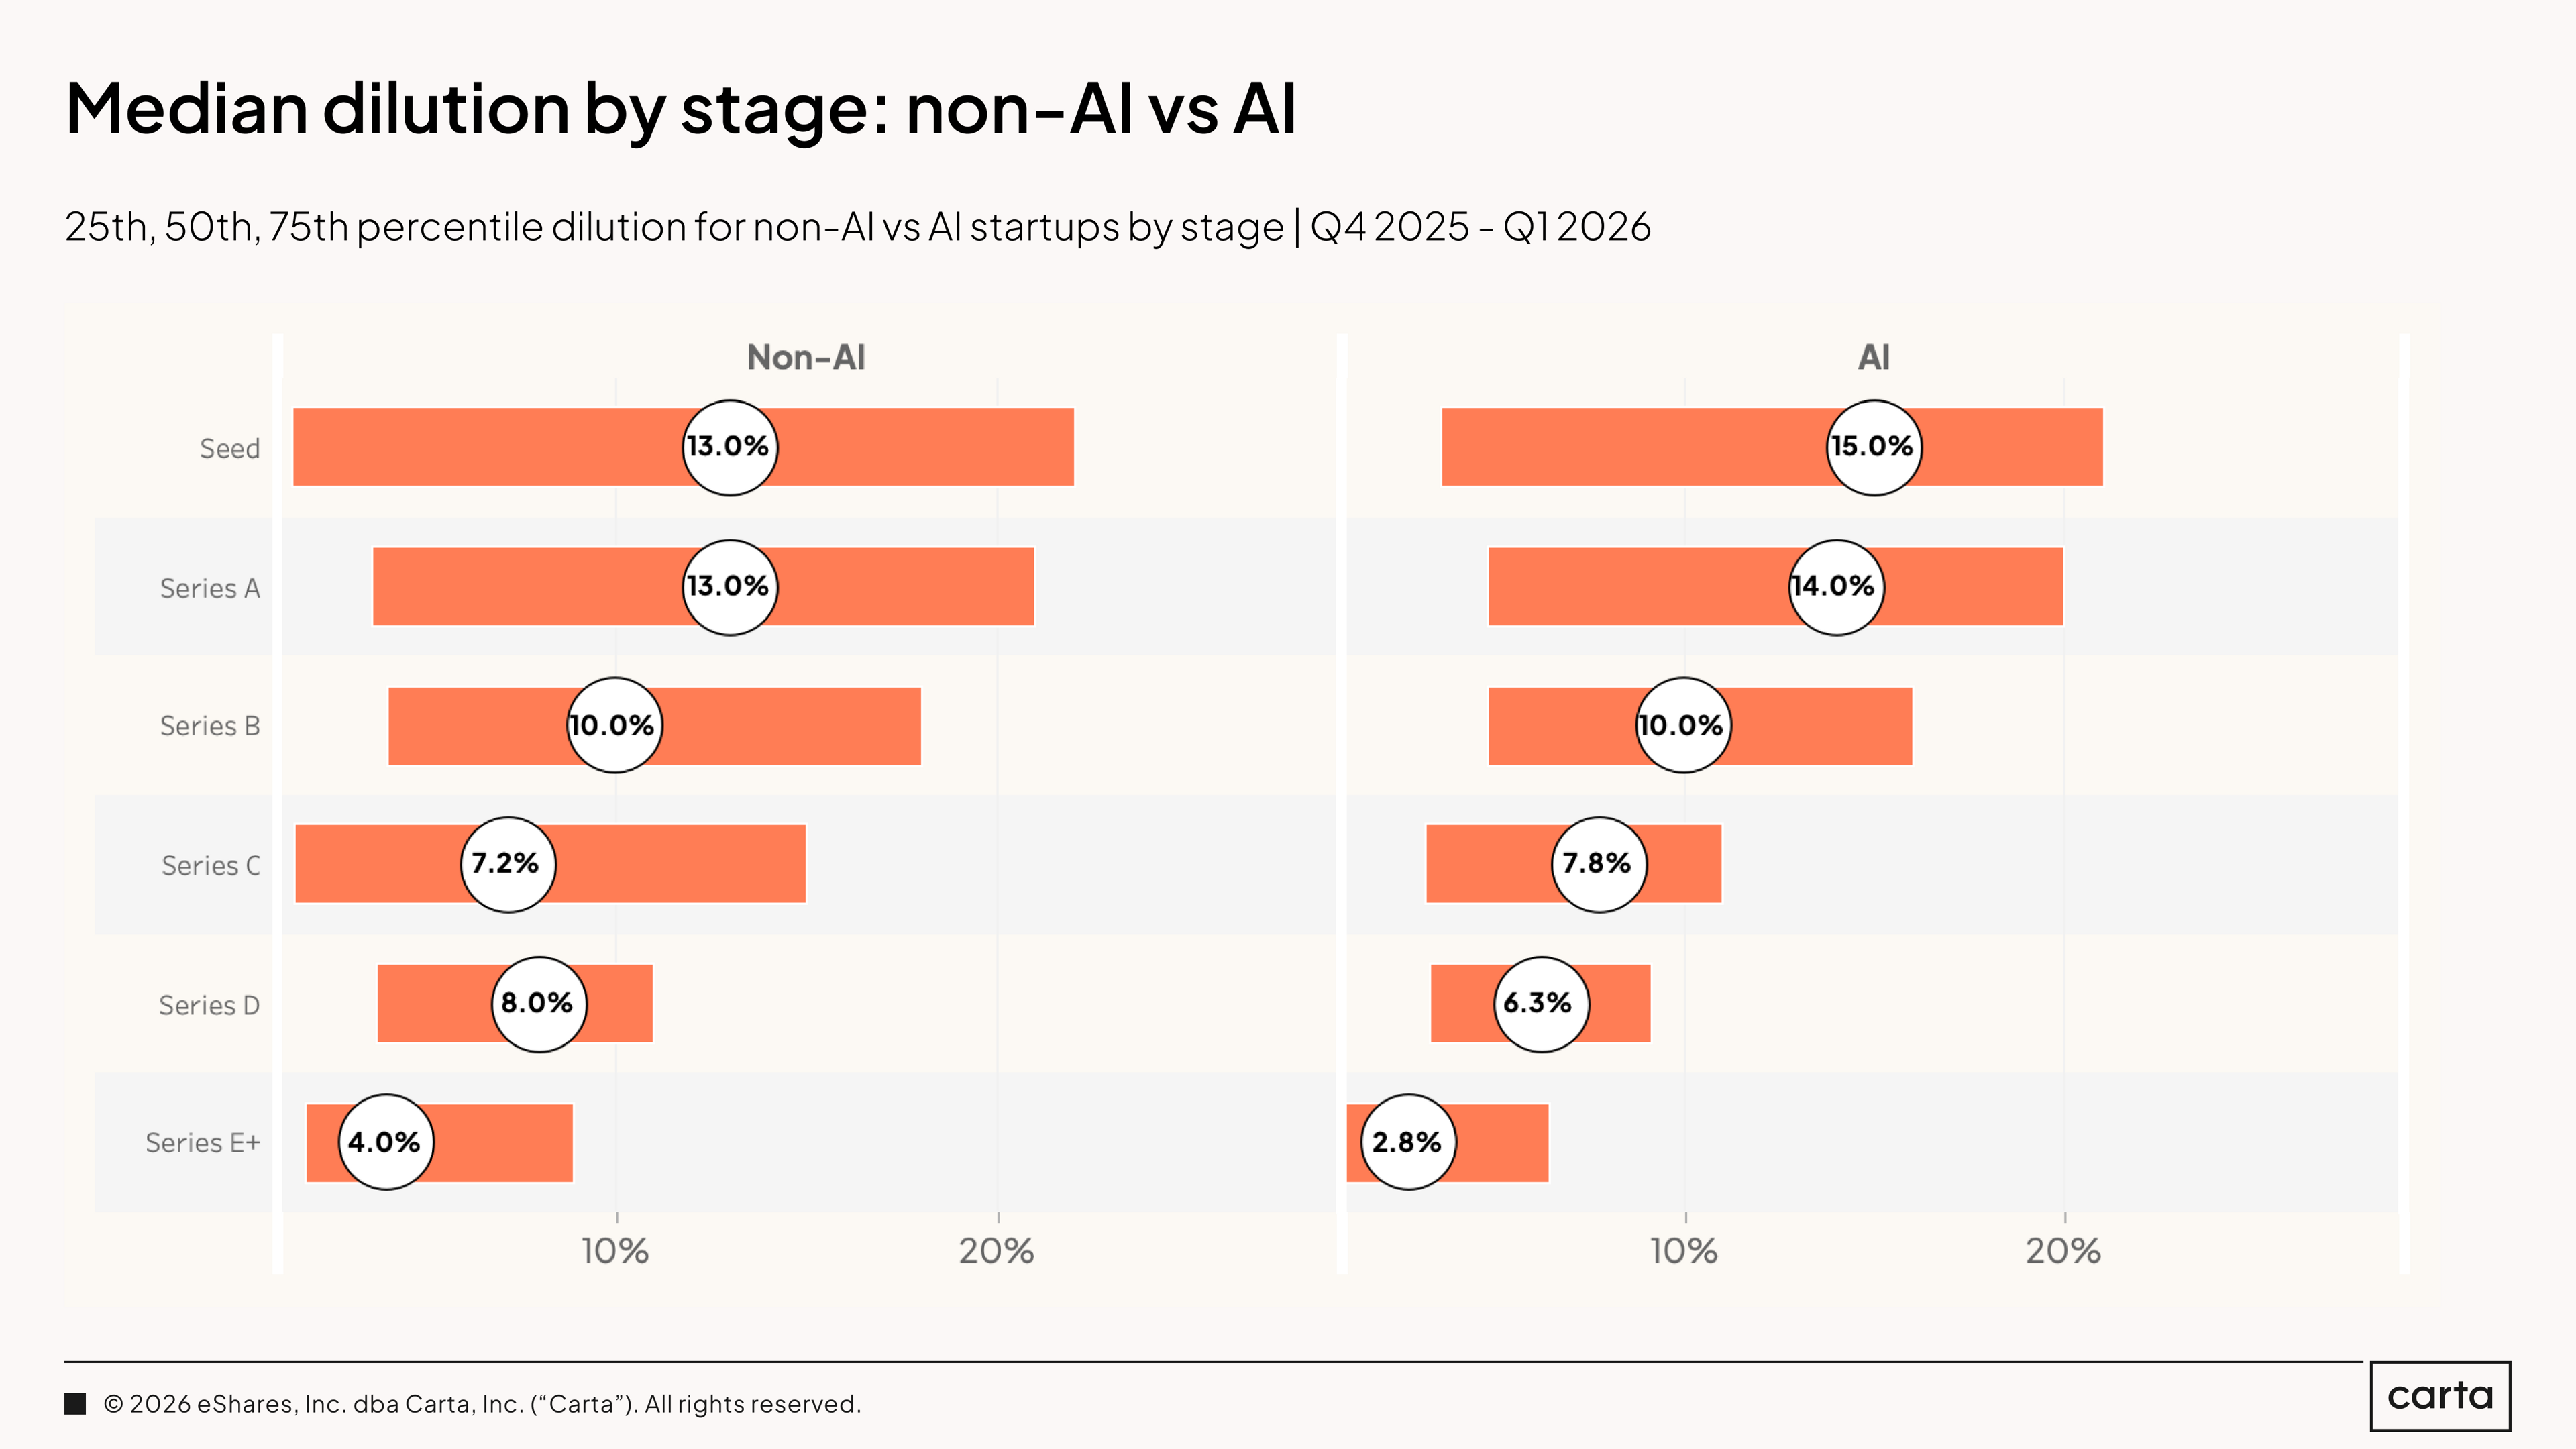
At early stages, AI companies are diluting slightly more than their non-AI peers. Median dilution at seed is 15% for AI versus 13% for non-AI. At Series A, 14% versus 13%. The gap is modest and likely reflects the premium investors expect to pay for access: AI founders are raising at higher valuations but giving up slightly more equity to get there.
The later the stage, the more leverage AI founders have at the table. At Series B the two groups are identical at 10%. At Series C, AI companies dilute slightly more at 7.8% versus 7.2% for non-AI. At Series D the gap widens in AI's favor: 6.3% for AI versus 8.0% for non-AI. At Series E+ the gap is the largest in the dataset: AI companies dilute at just 2.8% compared to 4.0% for non-AI.
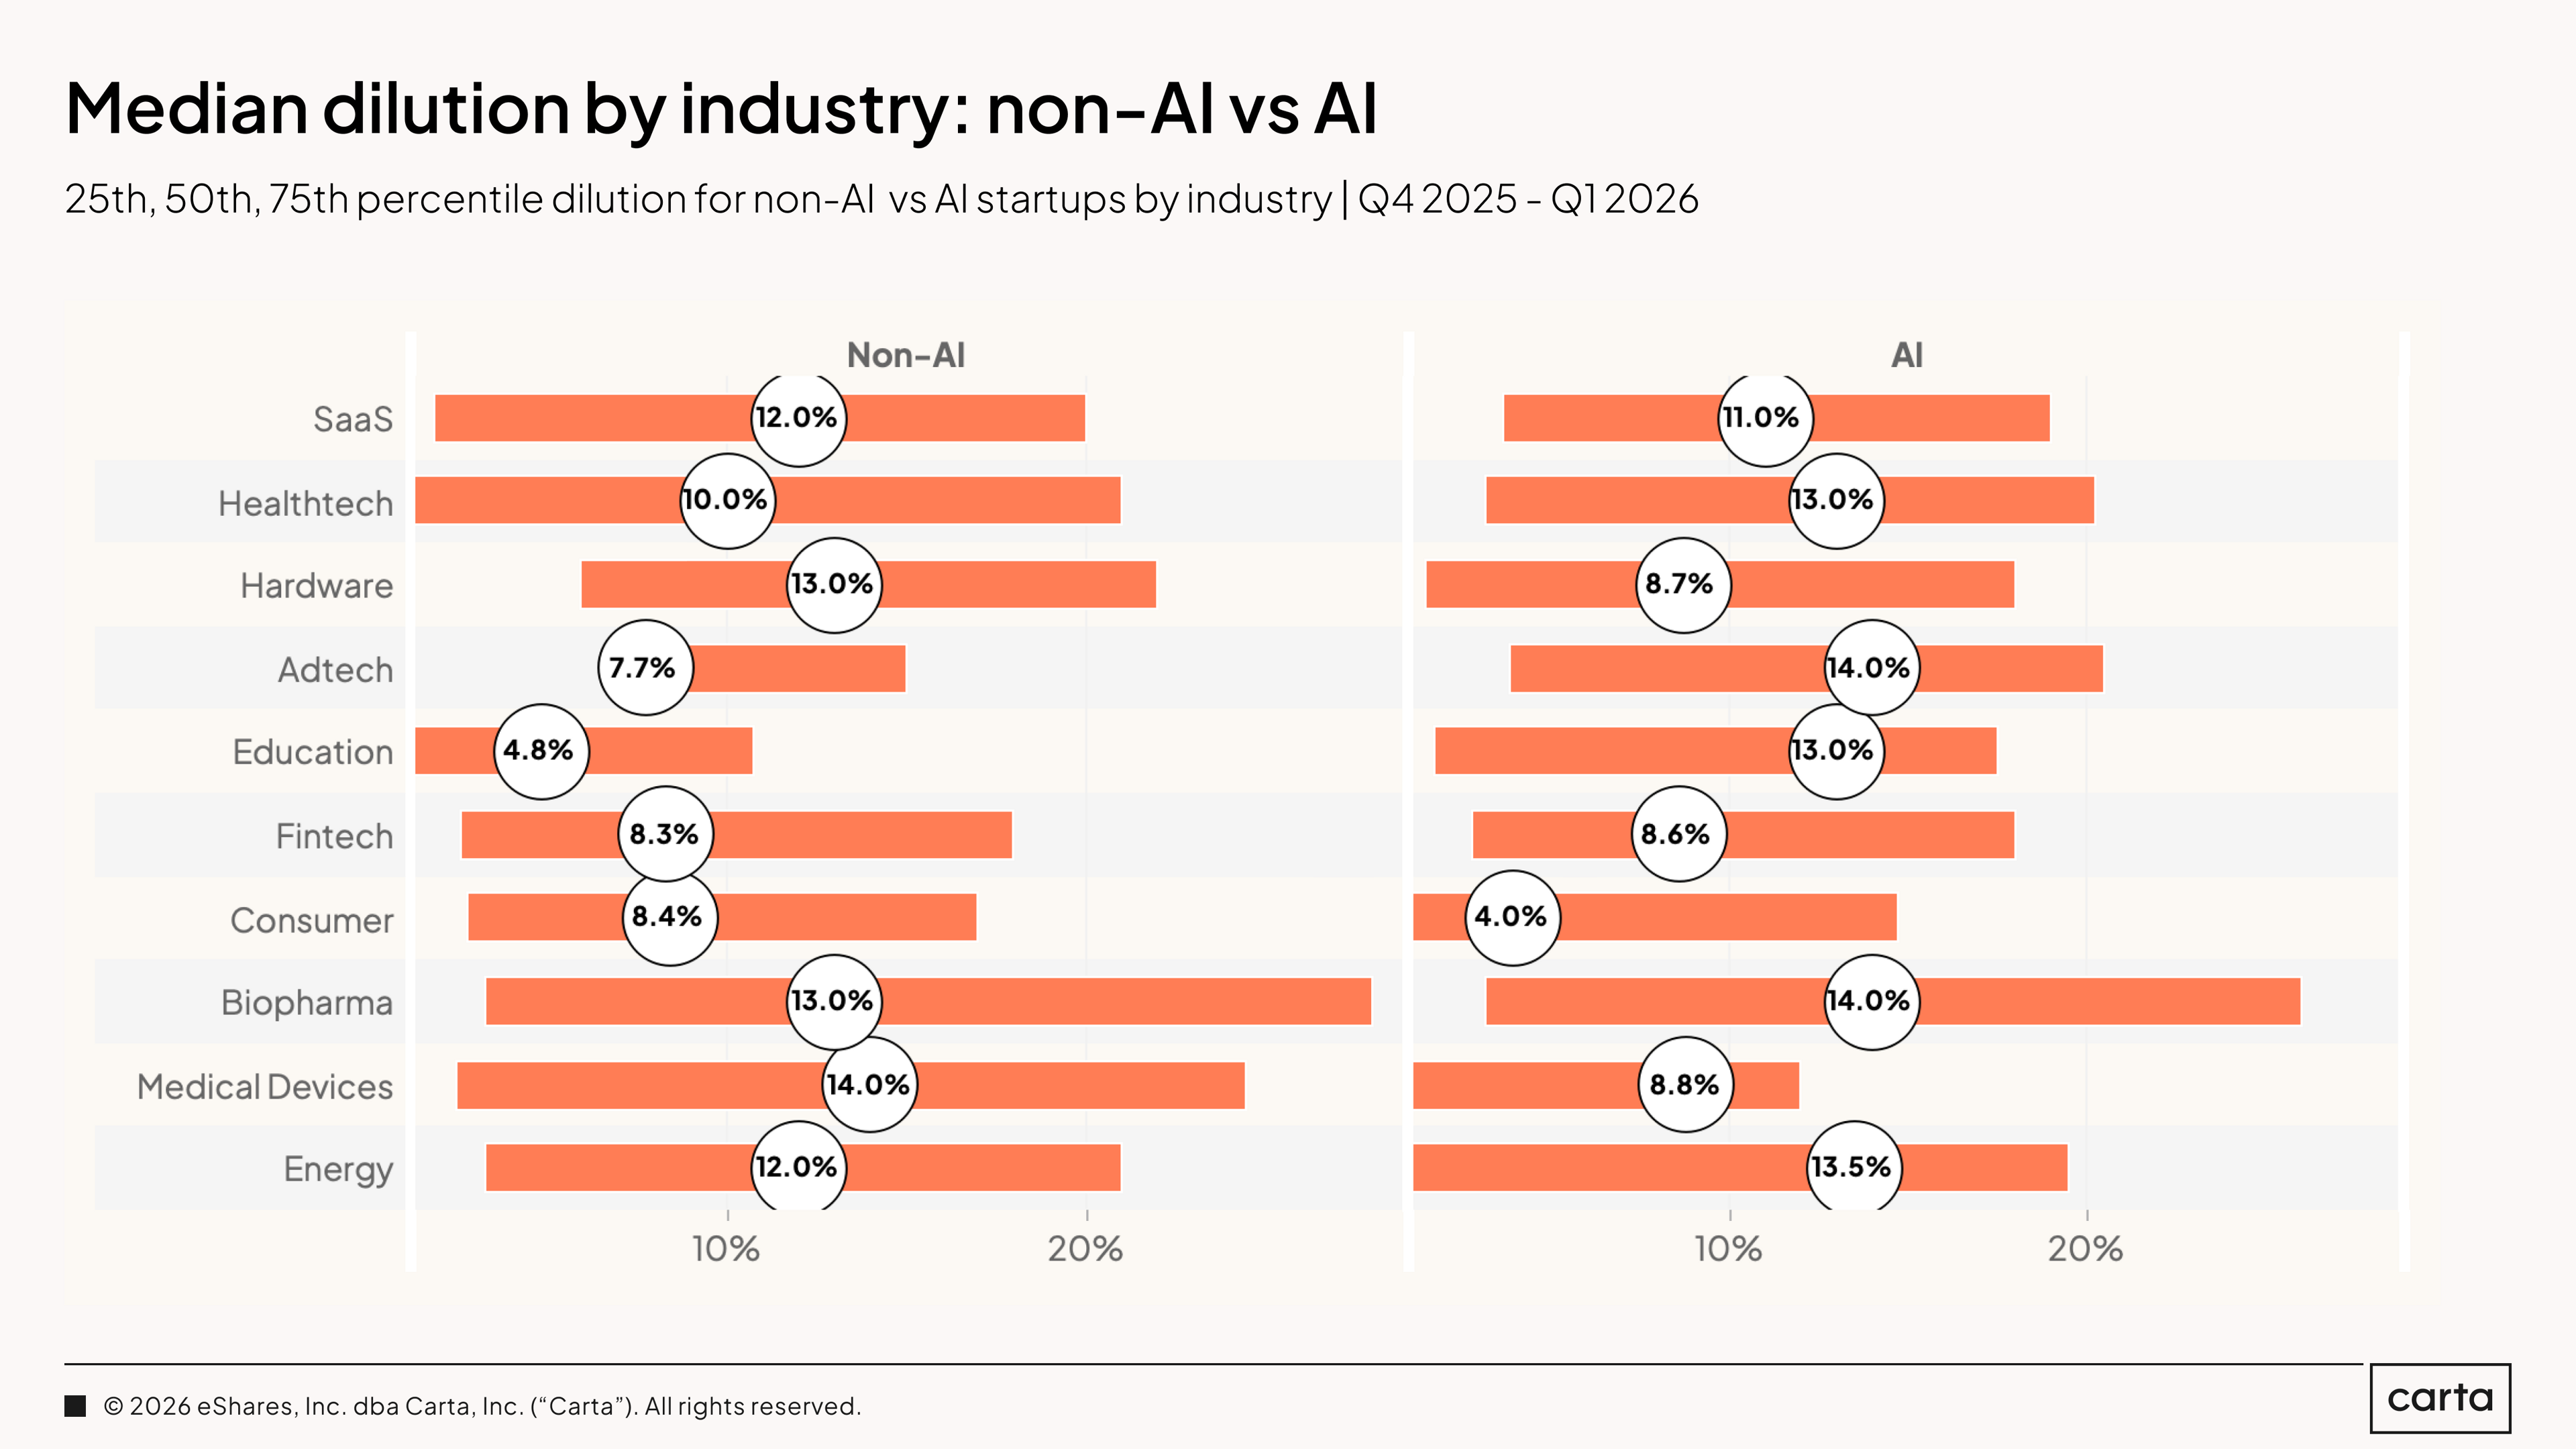
In SaaS, AI companies saw slightly lower median dilution (11%) over the past two quarters than non-AI companies (12%). In healthtech, the relationship reversed: AI at 13%, non-AI at 10%. The picture varies by sector. But the direction across all categories is the same: down. For a founder who has raised multiple rounds in this environment, the compounding effect is real. Three rounds at three to five percentage points less dilution each is not a rounding error at exit. It is the difference between founders owning a business and founders having participated in one.
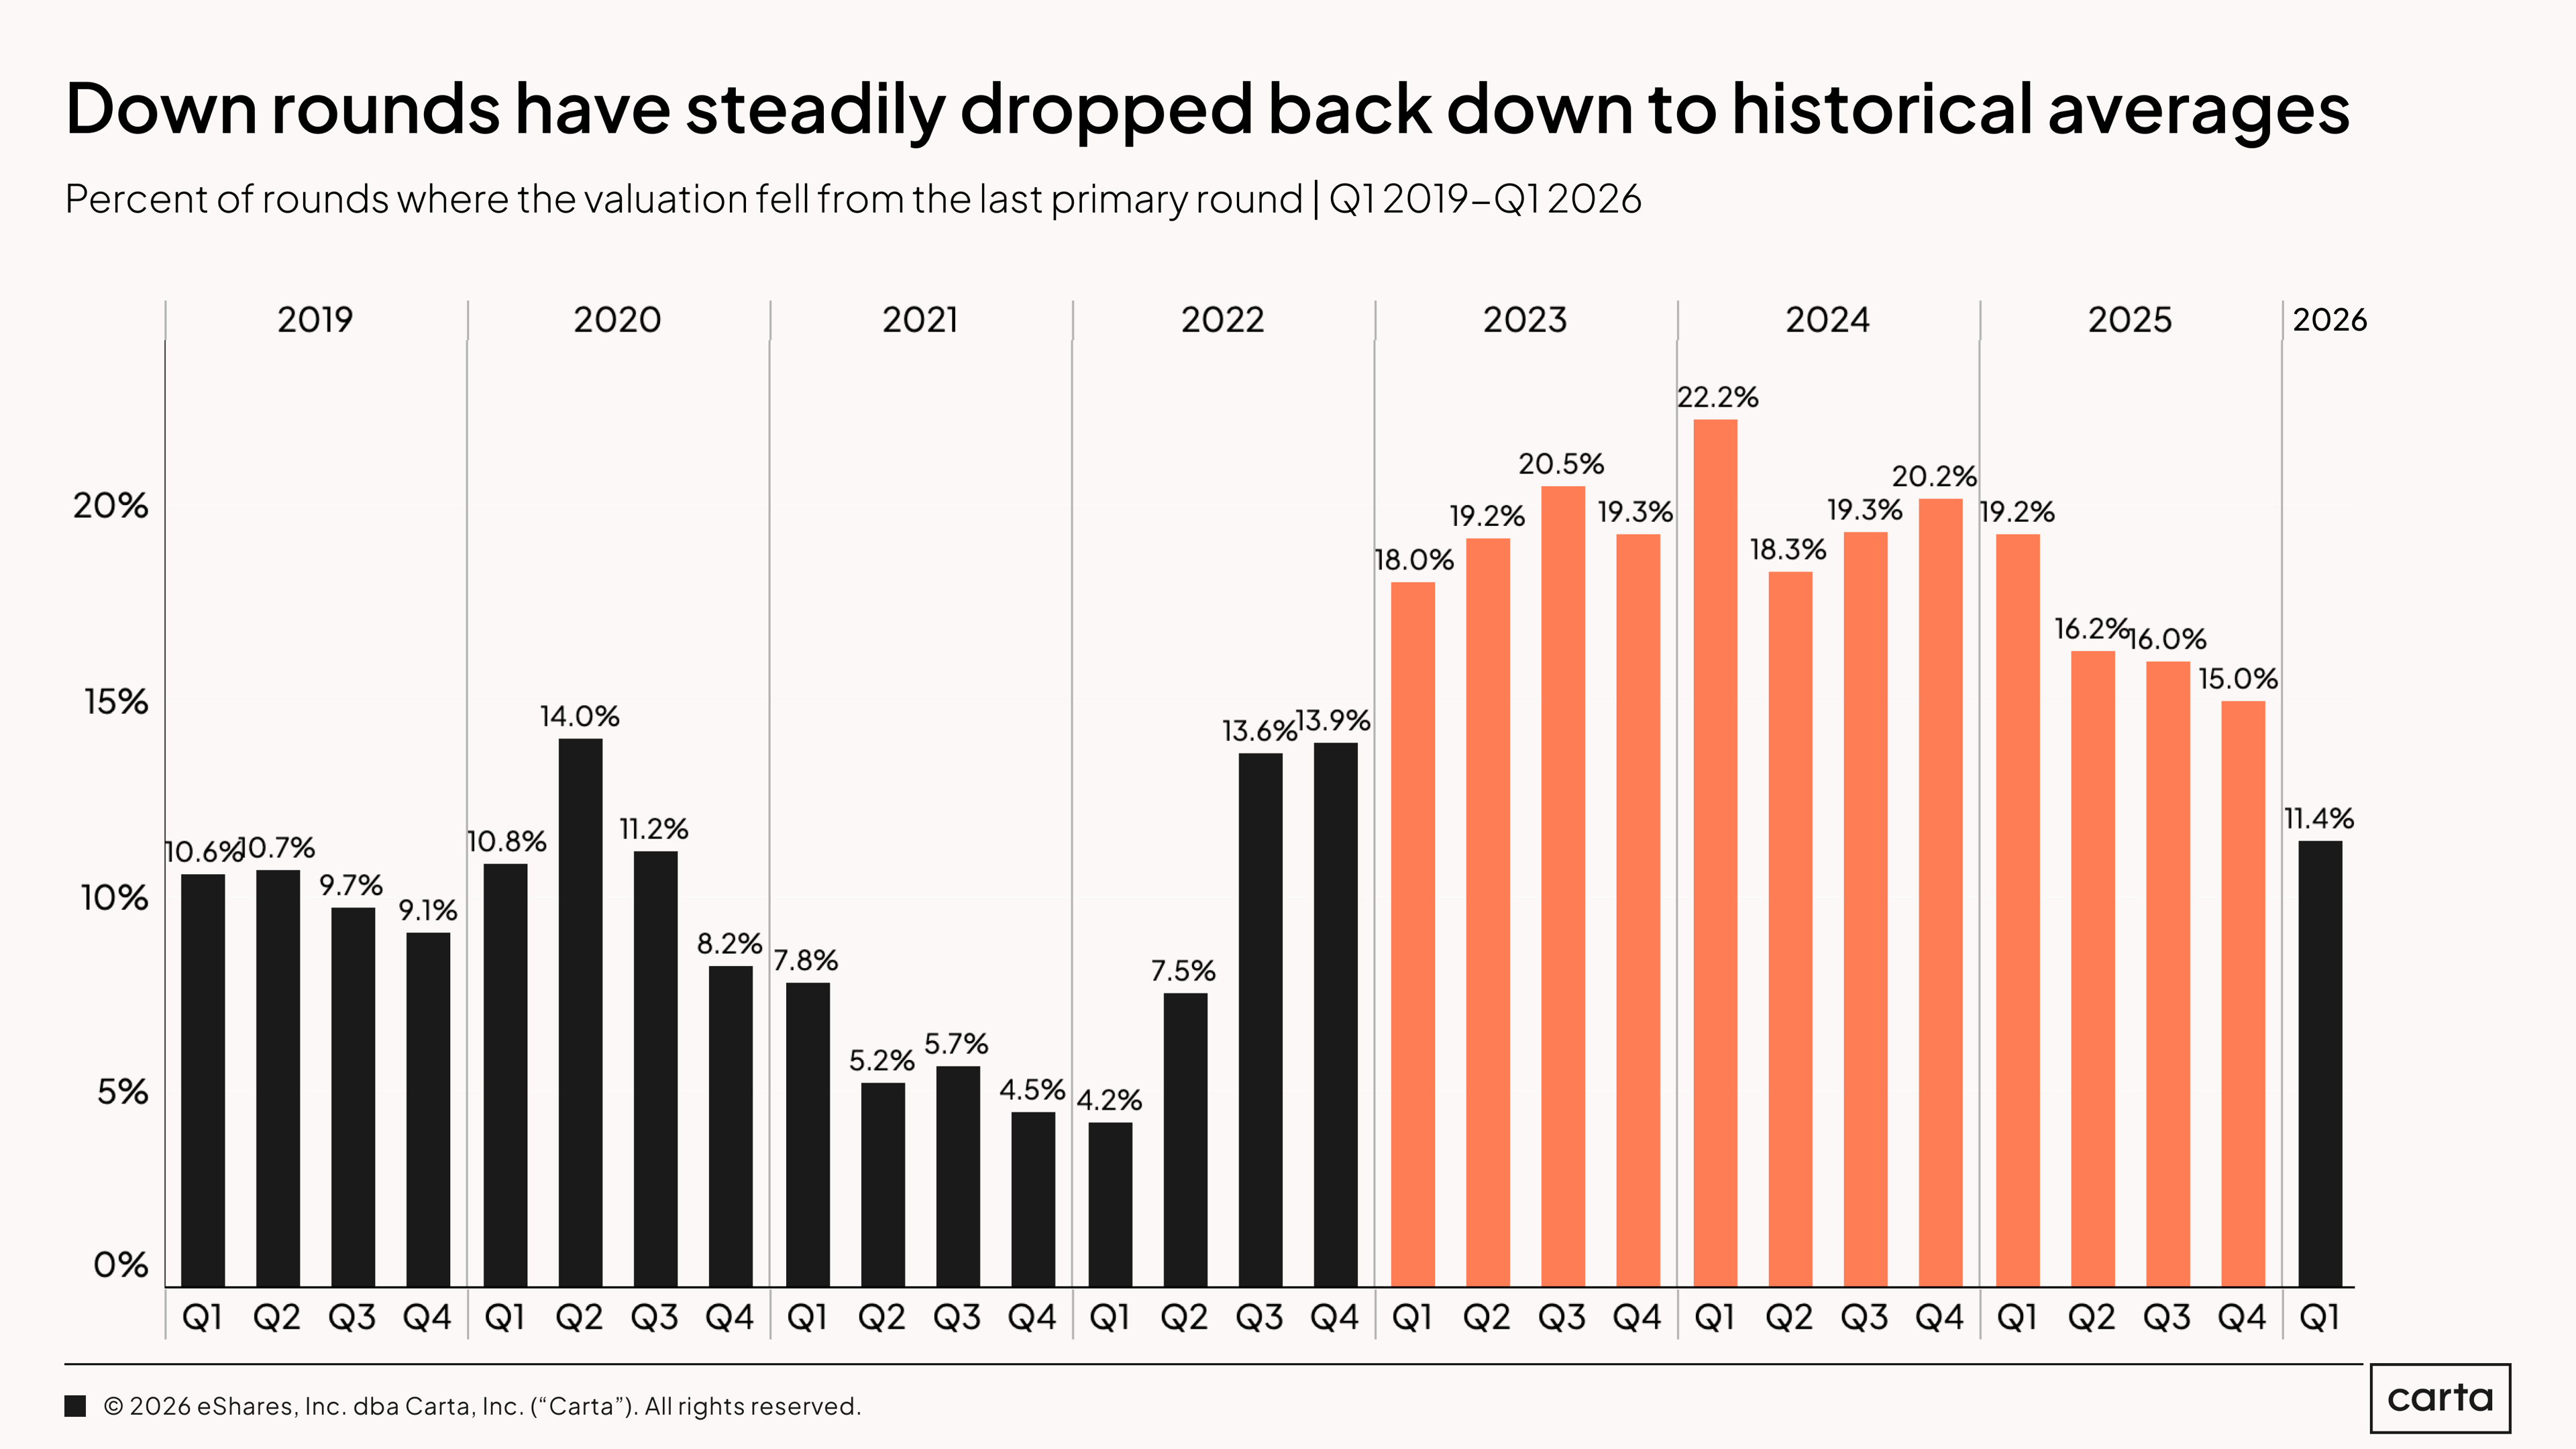
The down-round rate in Q1 2026 fell to 11.4%, the lowest figure in nearly four years. That rate has nearly halved since Q1 2024, when 22.2% of all rounds were down rounds. Through most of 2023 and 2024, the rate held between 18% and 22%. It began declining in 2025. Now, it is back in the 10% to 14% range found in the pre-reset years of 2019 and 2020.
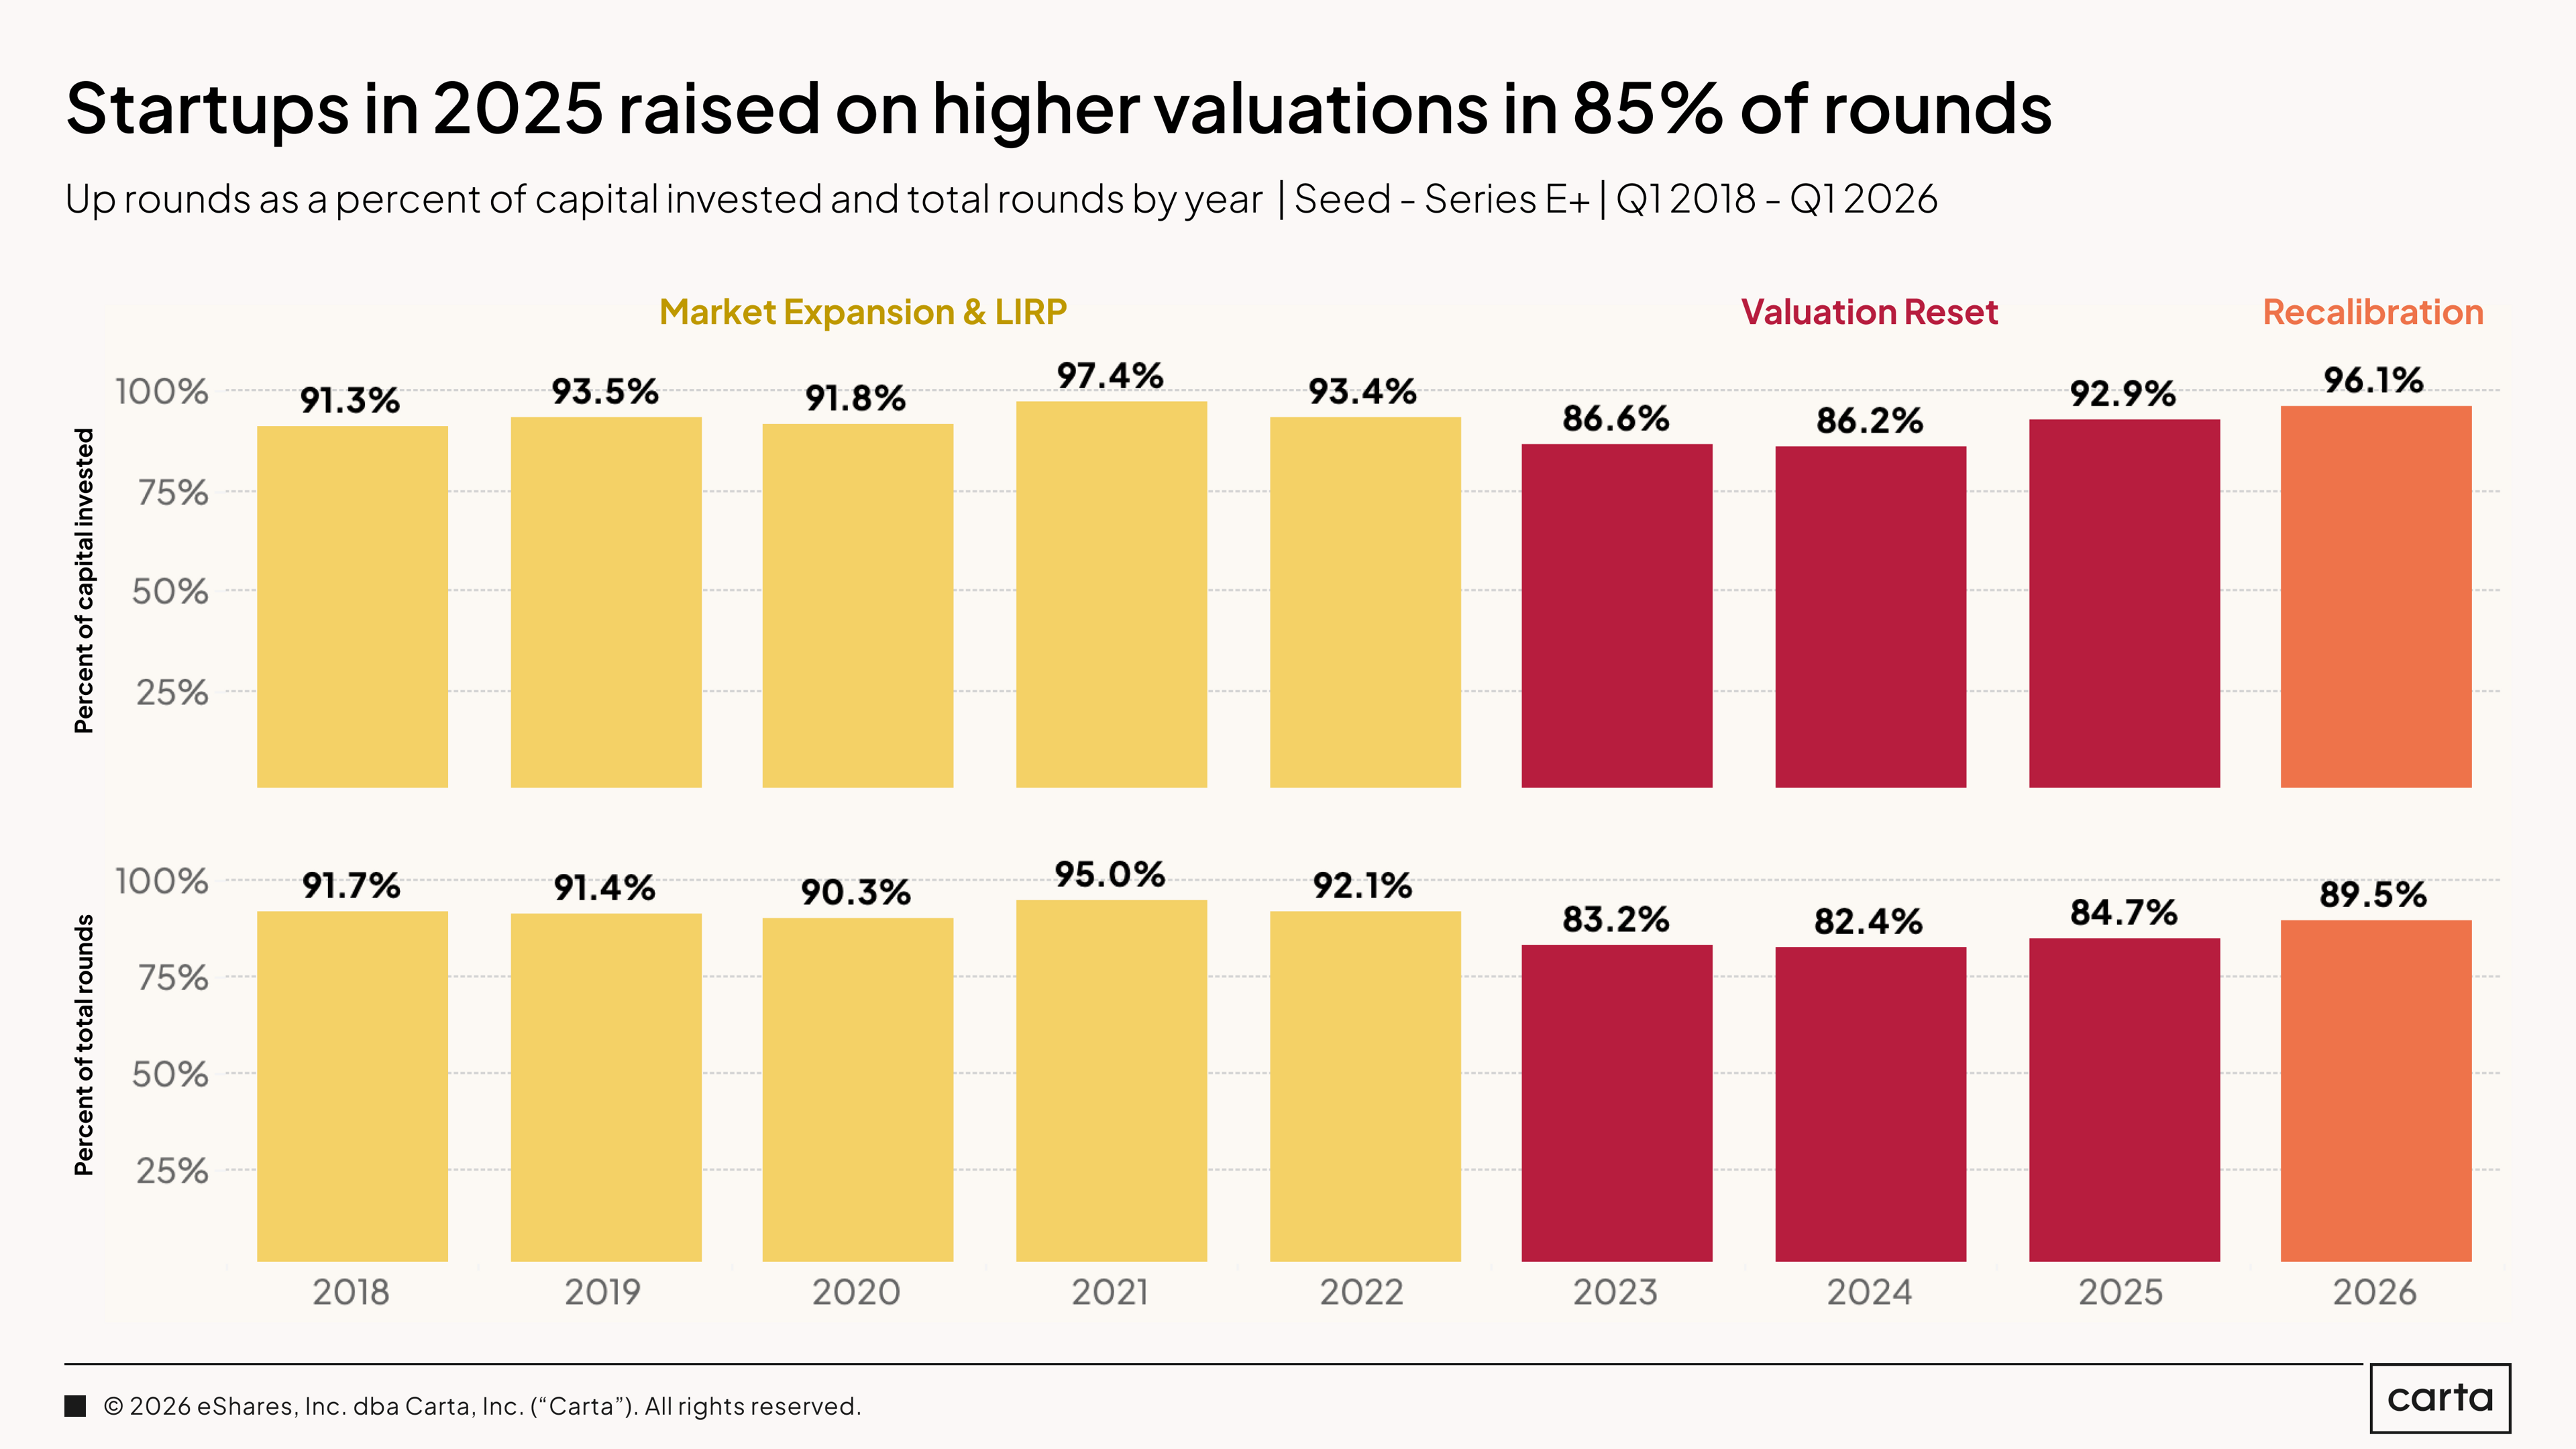
96.1% of all capital raised on Carta in Q1 went to up rounds, the highest proportion since 2021. The 2022 reset was a real and painful correction. Three years later, the vast majority of companies that needed to reset their valuations have done so. For founders who raised a down round between 2022 and 2024, the stigma is fading. The market has absorbed enough of them that a clean narrative explaining the reset, the path since, and the growth achieved is sufficient. Investors are not marking those companies off the list. They are pricing them on what comes next.
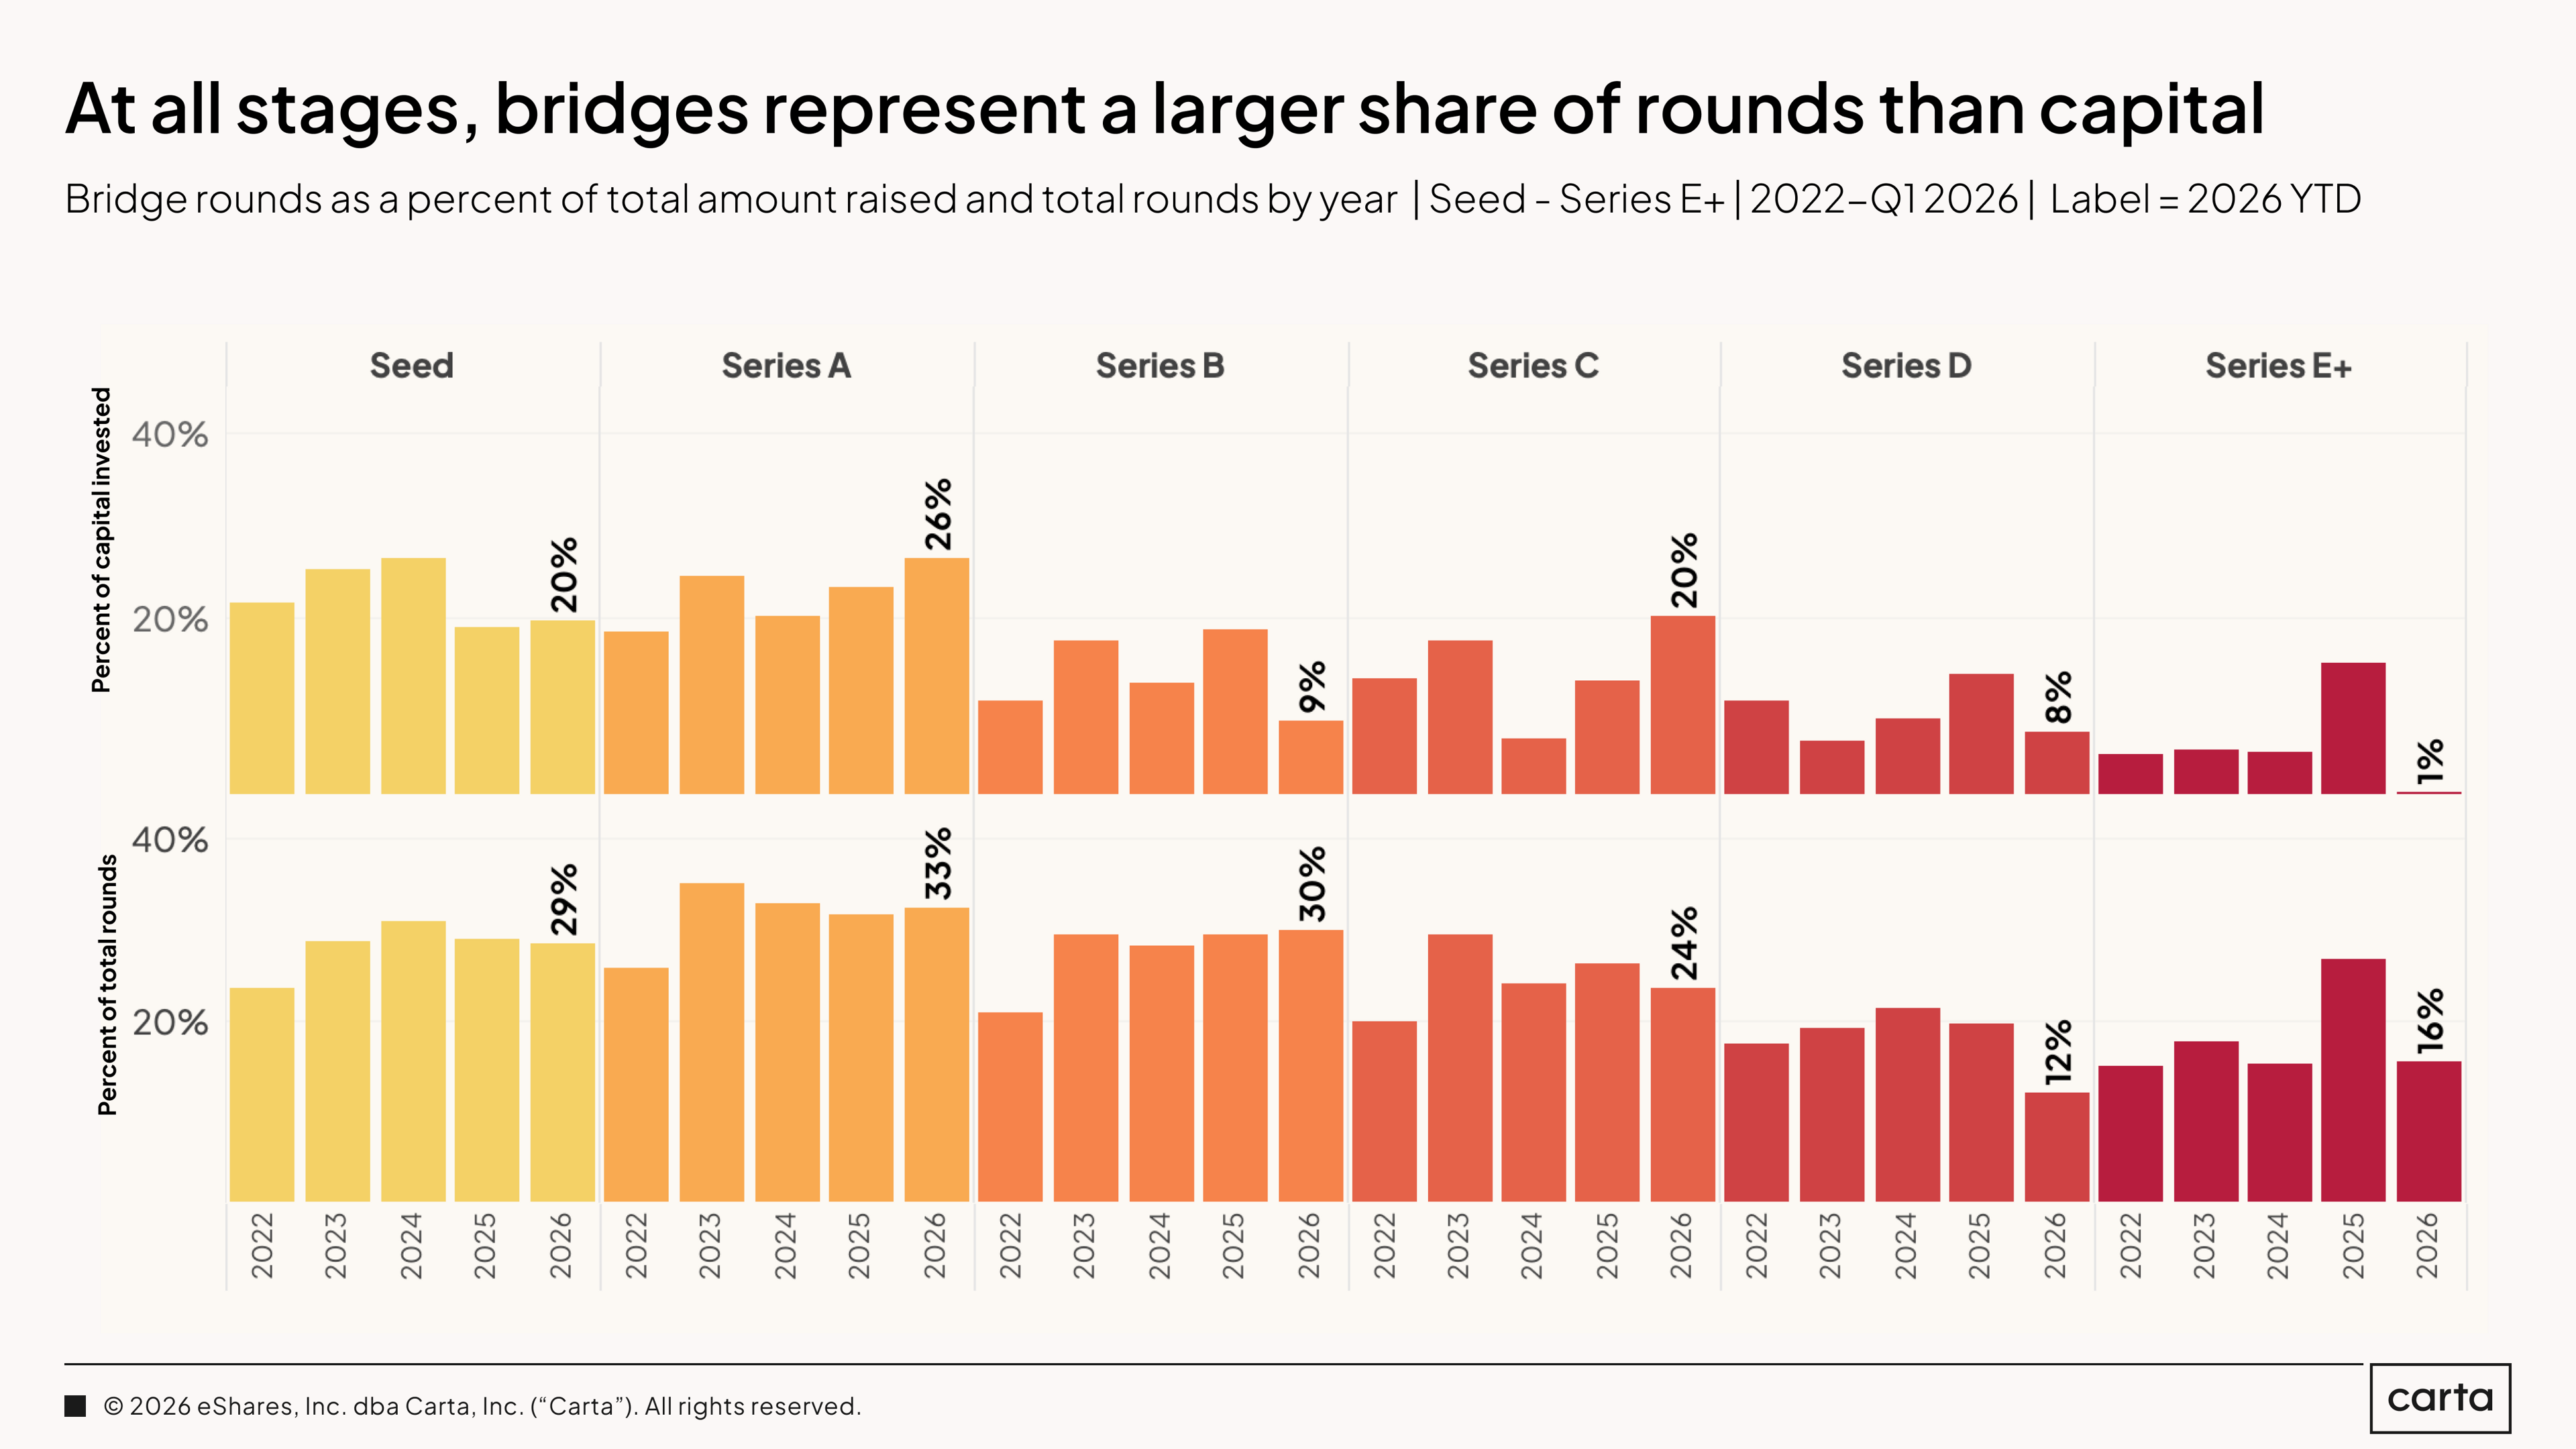
Bridge rounds make up more rounds than capital invested across stages. Bridge round sizes are meaningfully smaller than primary round sizes at these stages. In a market where deal counts are falling and the bar for a primary raise is rising, many companies simply need to extend the runway to get there. A bridge is not a strategic financing choice in most cases. It is a continuation of capital while the company earns its way to the next primary round
Founders considering a bridge should understand the cost clearly: Bridge valuations at seed are down 18% from a year ago, and bridge terms typically carry more investor protection than primary rounds. Taking bridge capital is often the right call. It is rarely a free one. At Series E+, bridge rounds account for 16% of capital raised versus 1% of all rounds. These are large, late-stage companies that have outgrown the typical bridge dynamic entirely and are using extension capital to wait for exit conditions, not the next fundraise.
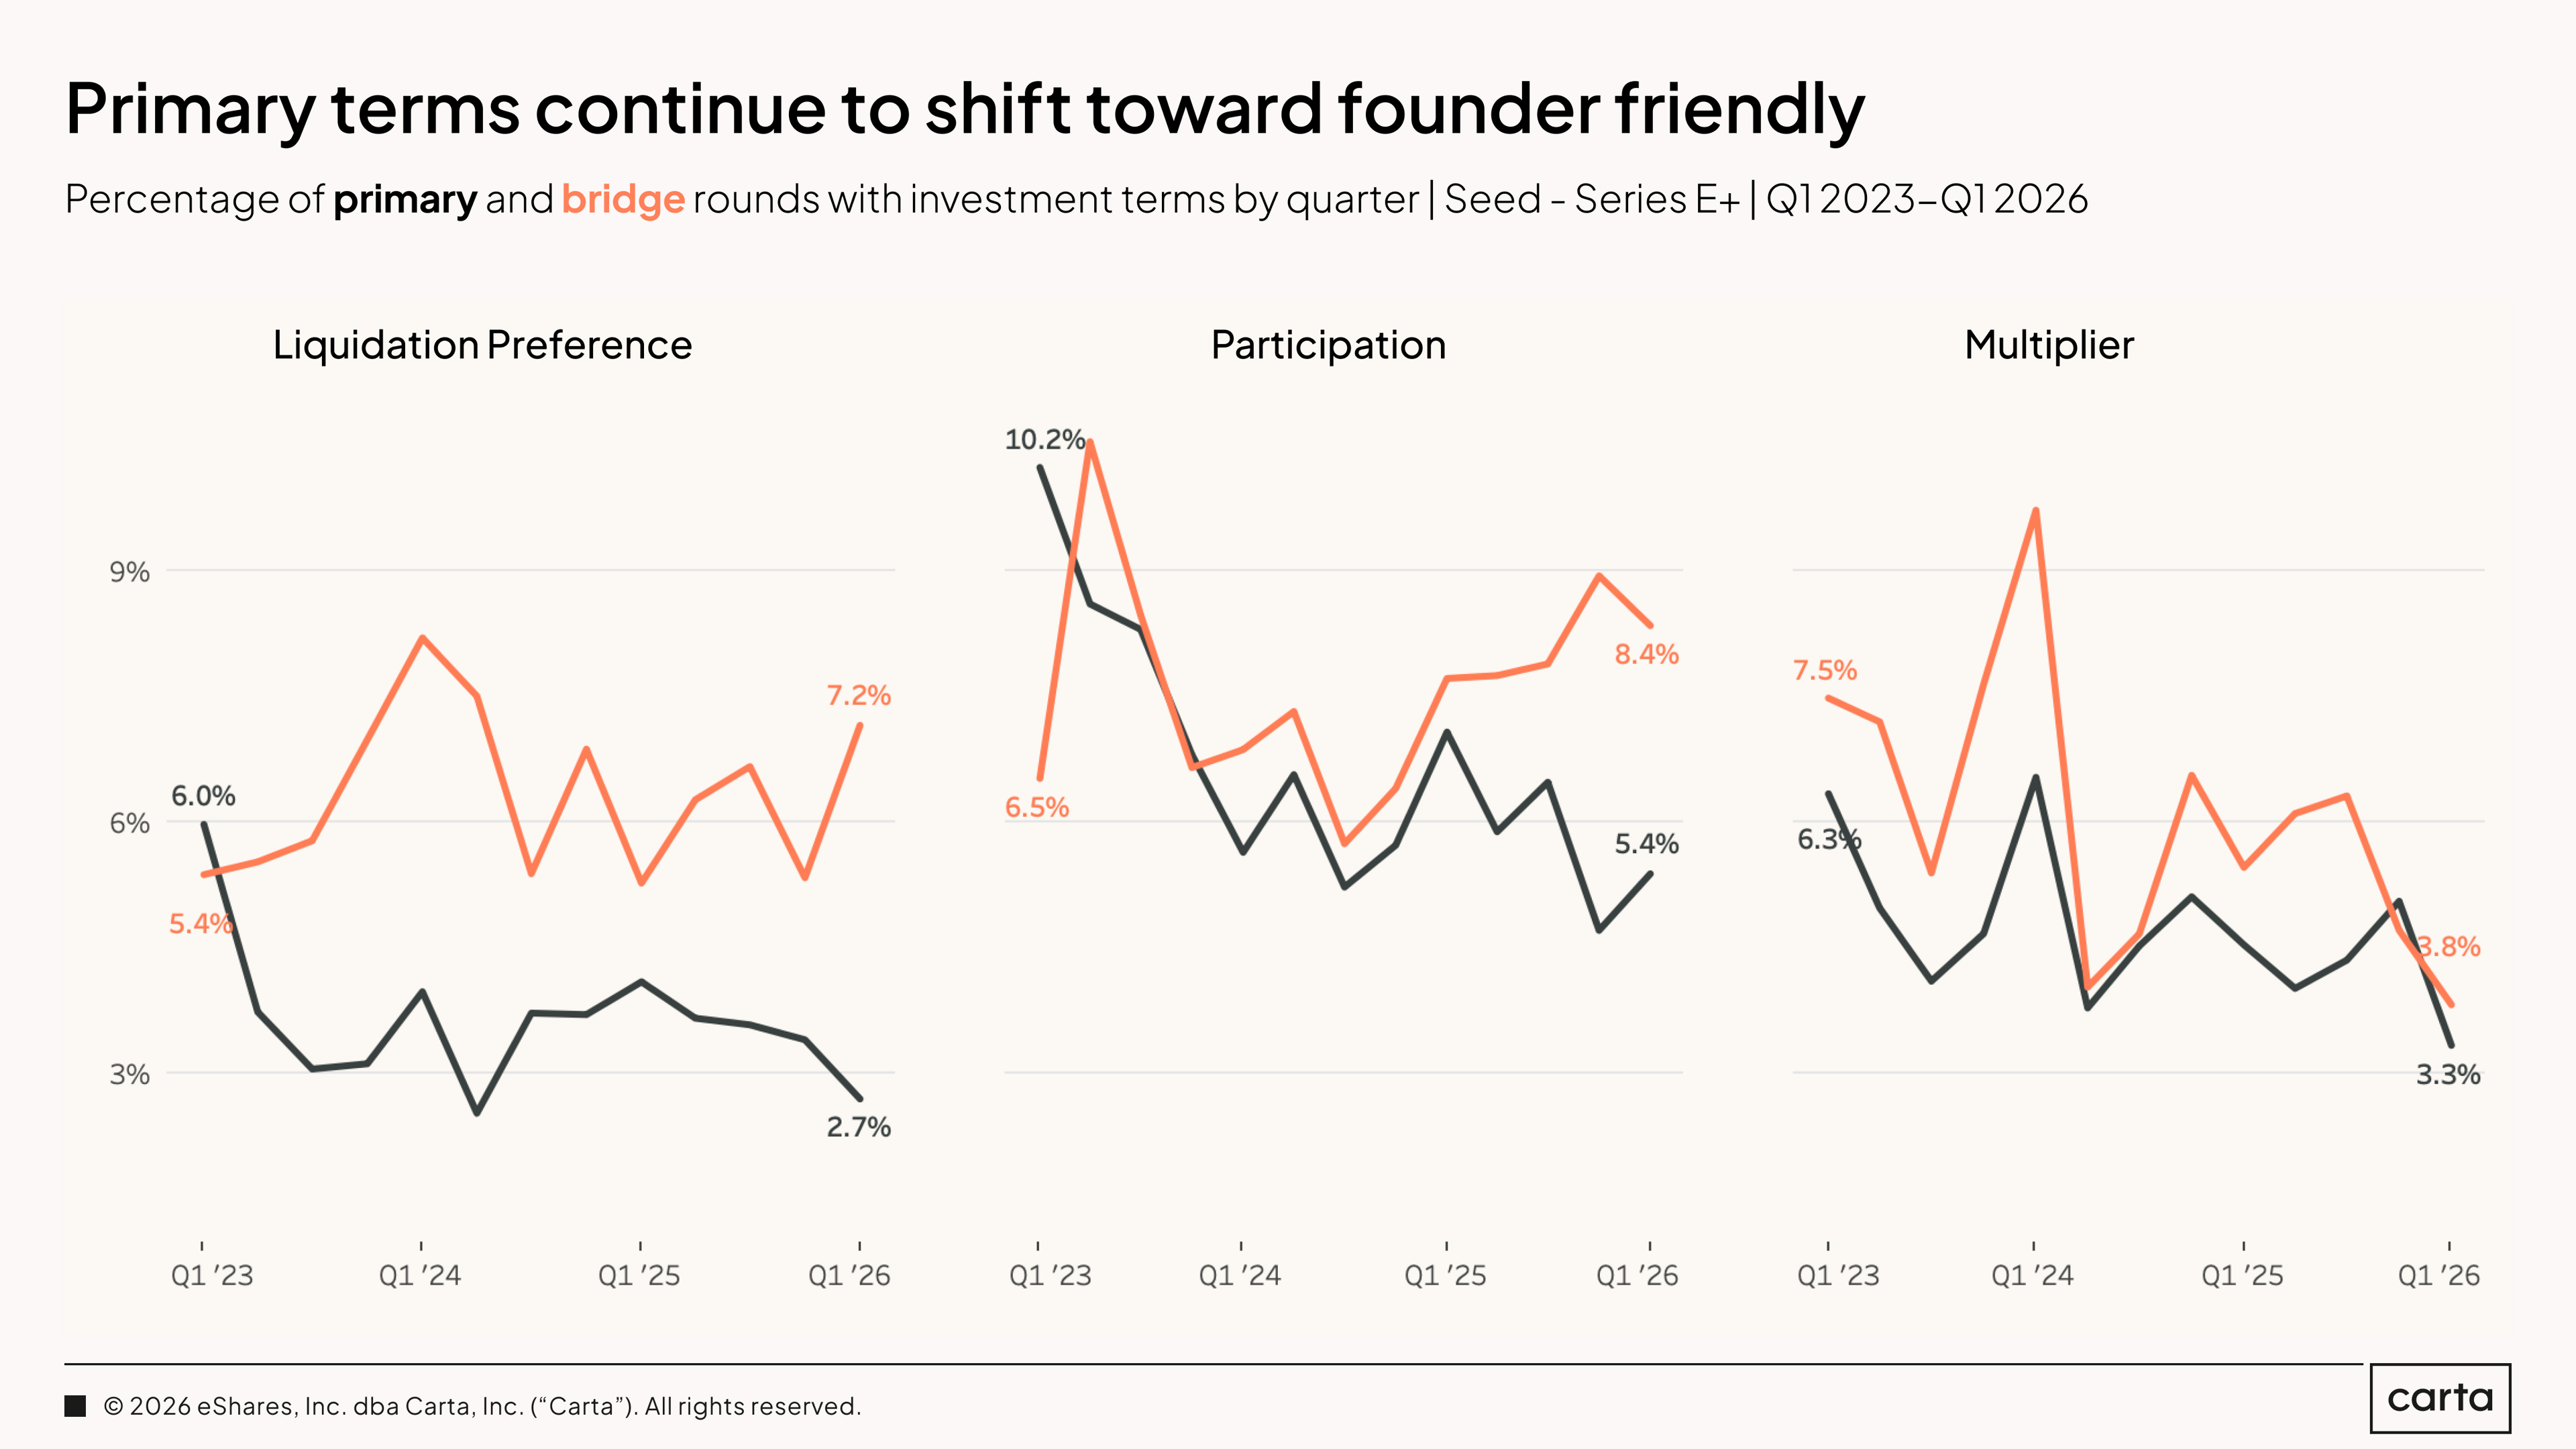
Deal terms on primary funding rounds continued to get a little more founder-friendly in Q1 2026. Liquidation preferences above 1x appeared in 2.7% of primary rounds. Participation rights appeared in 5.4% of primary fundings, and multipliers appeared in 3.3%. All three figures are at or near multi-year lows. Bridge rounds carry slightly more investor-protective terms, as expected. Even there, the levels remain low by historical standards.
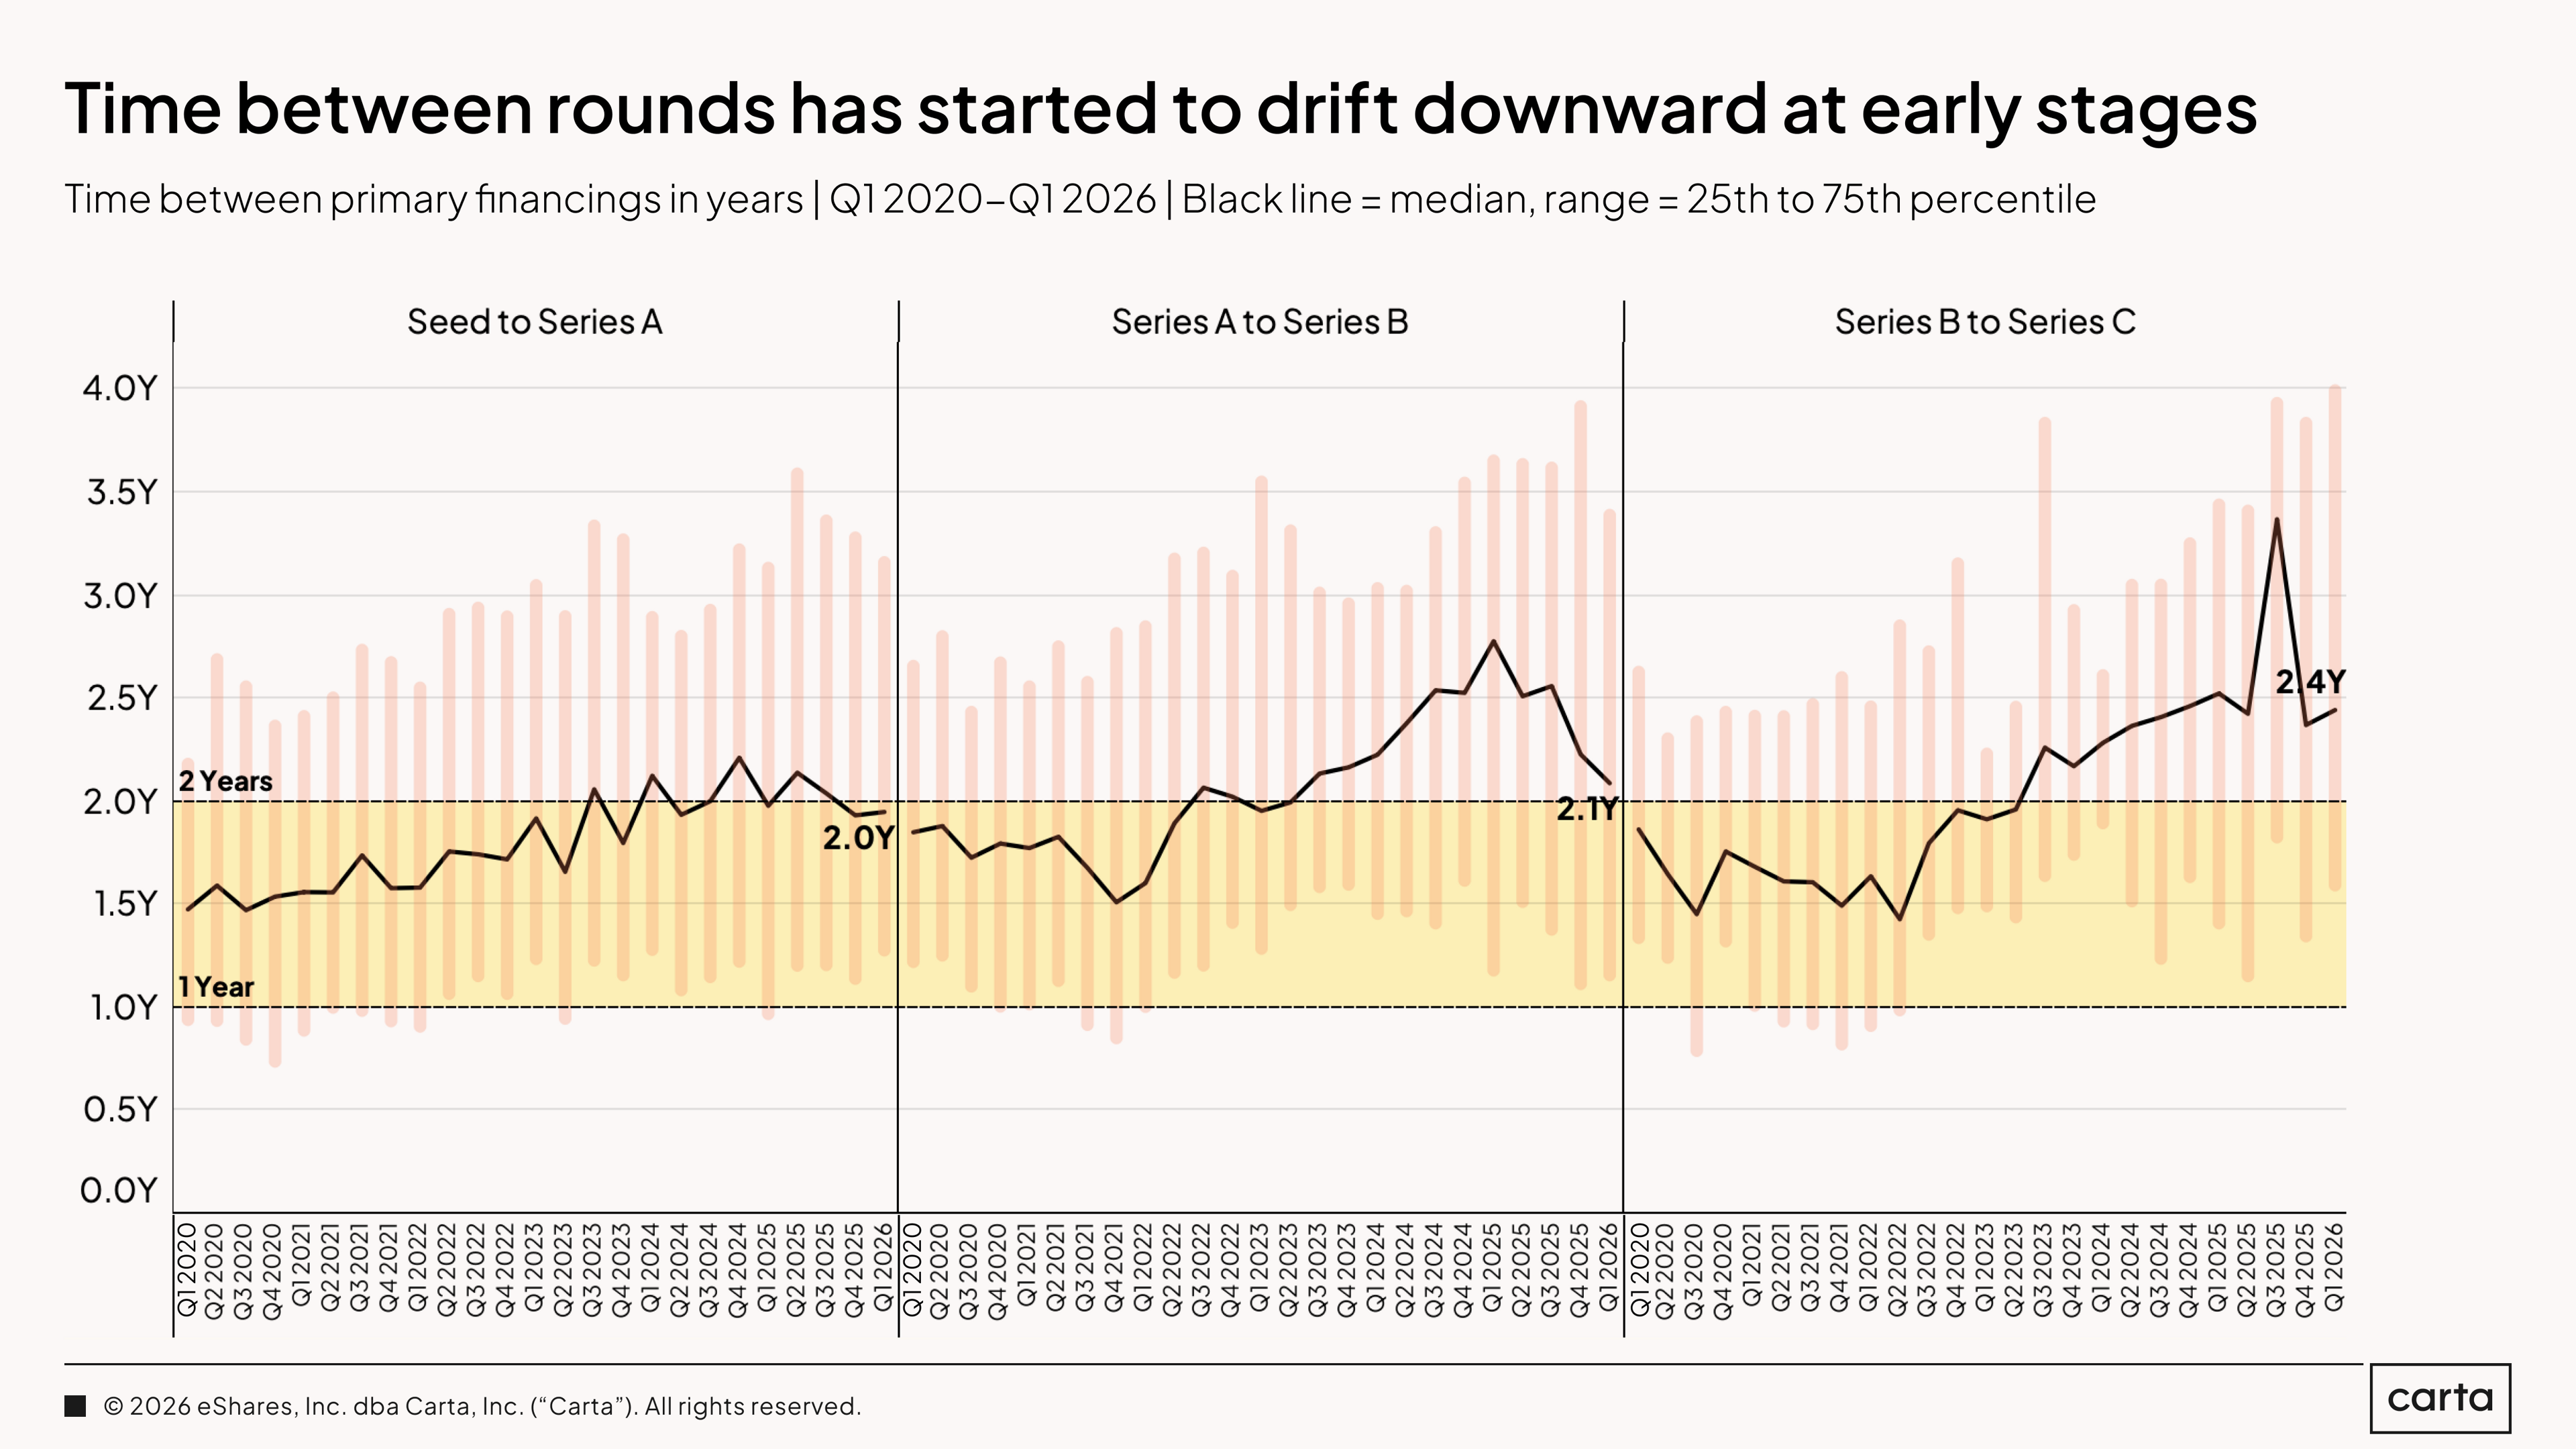
The median time between primary rounds edged down slightly at early stages in Q1 2026. The typical period between seed and Series A stands at an even two years. The median gap is 2.1 years between Series A and Series B and 2.4 years between Series B and Series C. These are historically elevated intervals. Compared to a year ago, however, early-stage intervals are beginning to compress. Companies are moving faster again, at least at the front of the funnel.
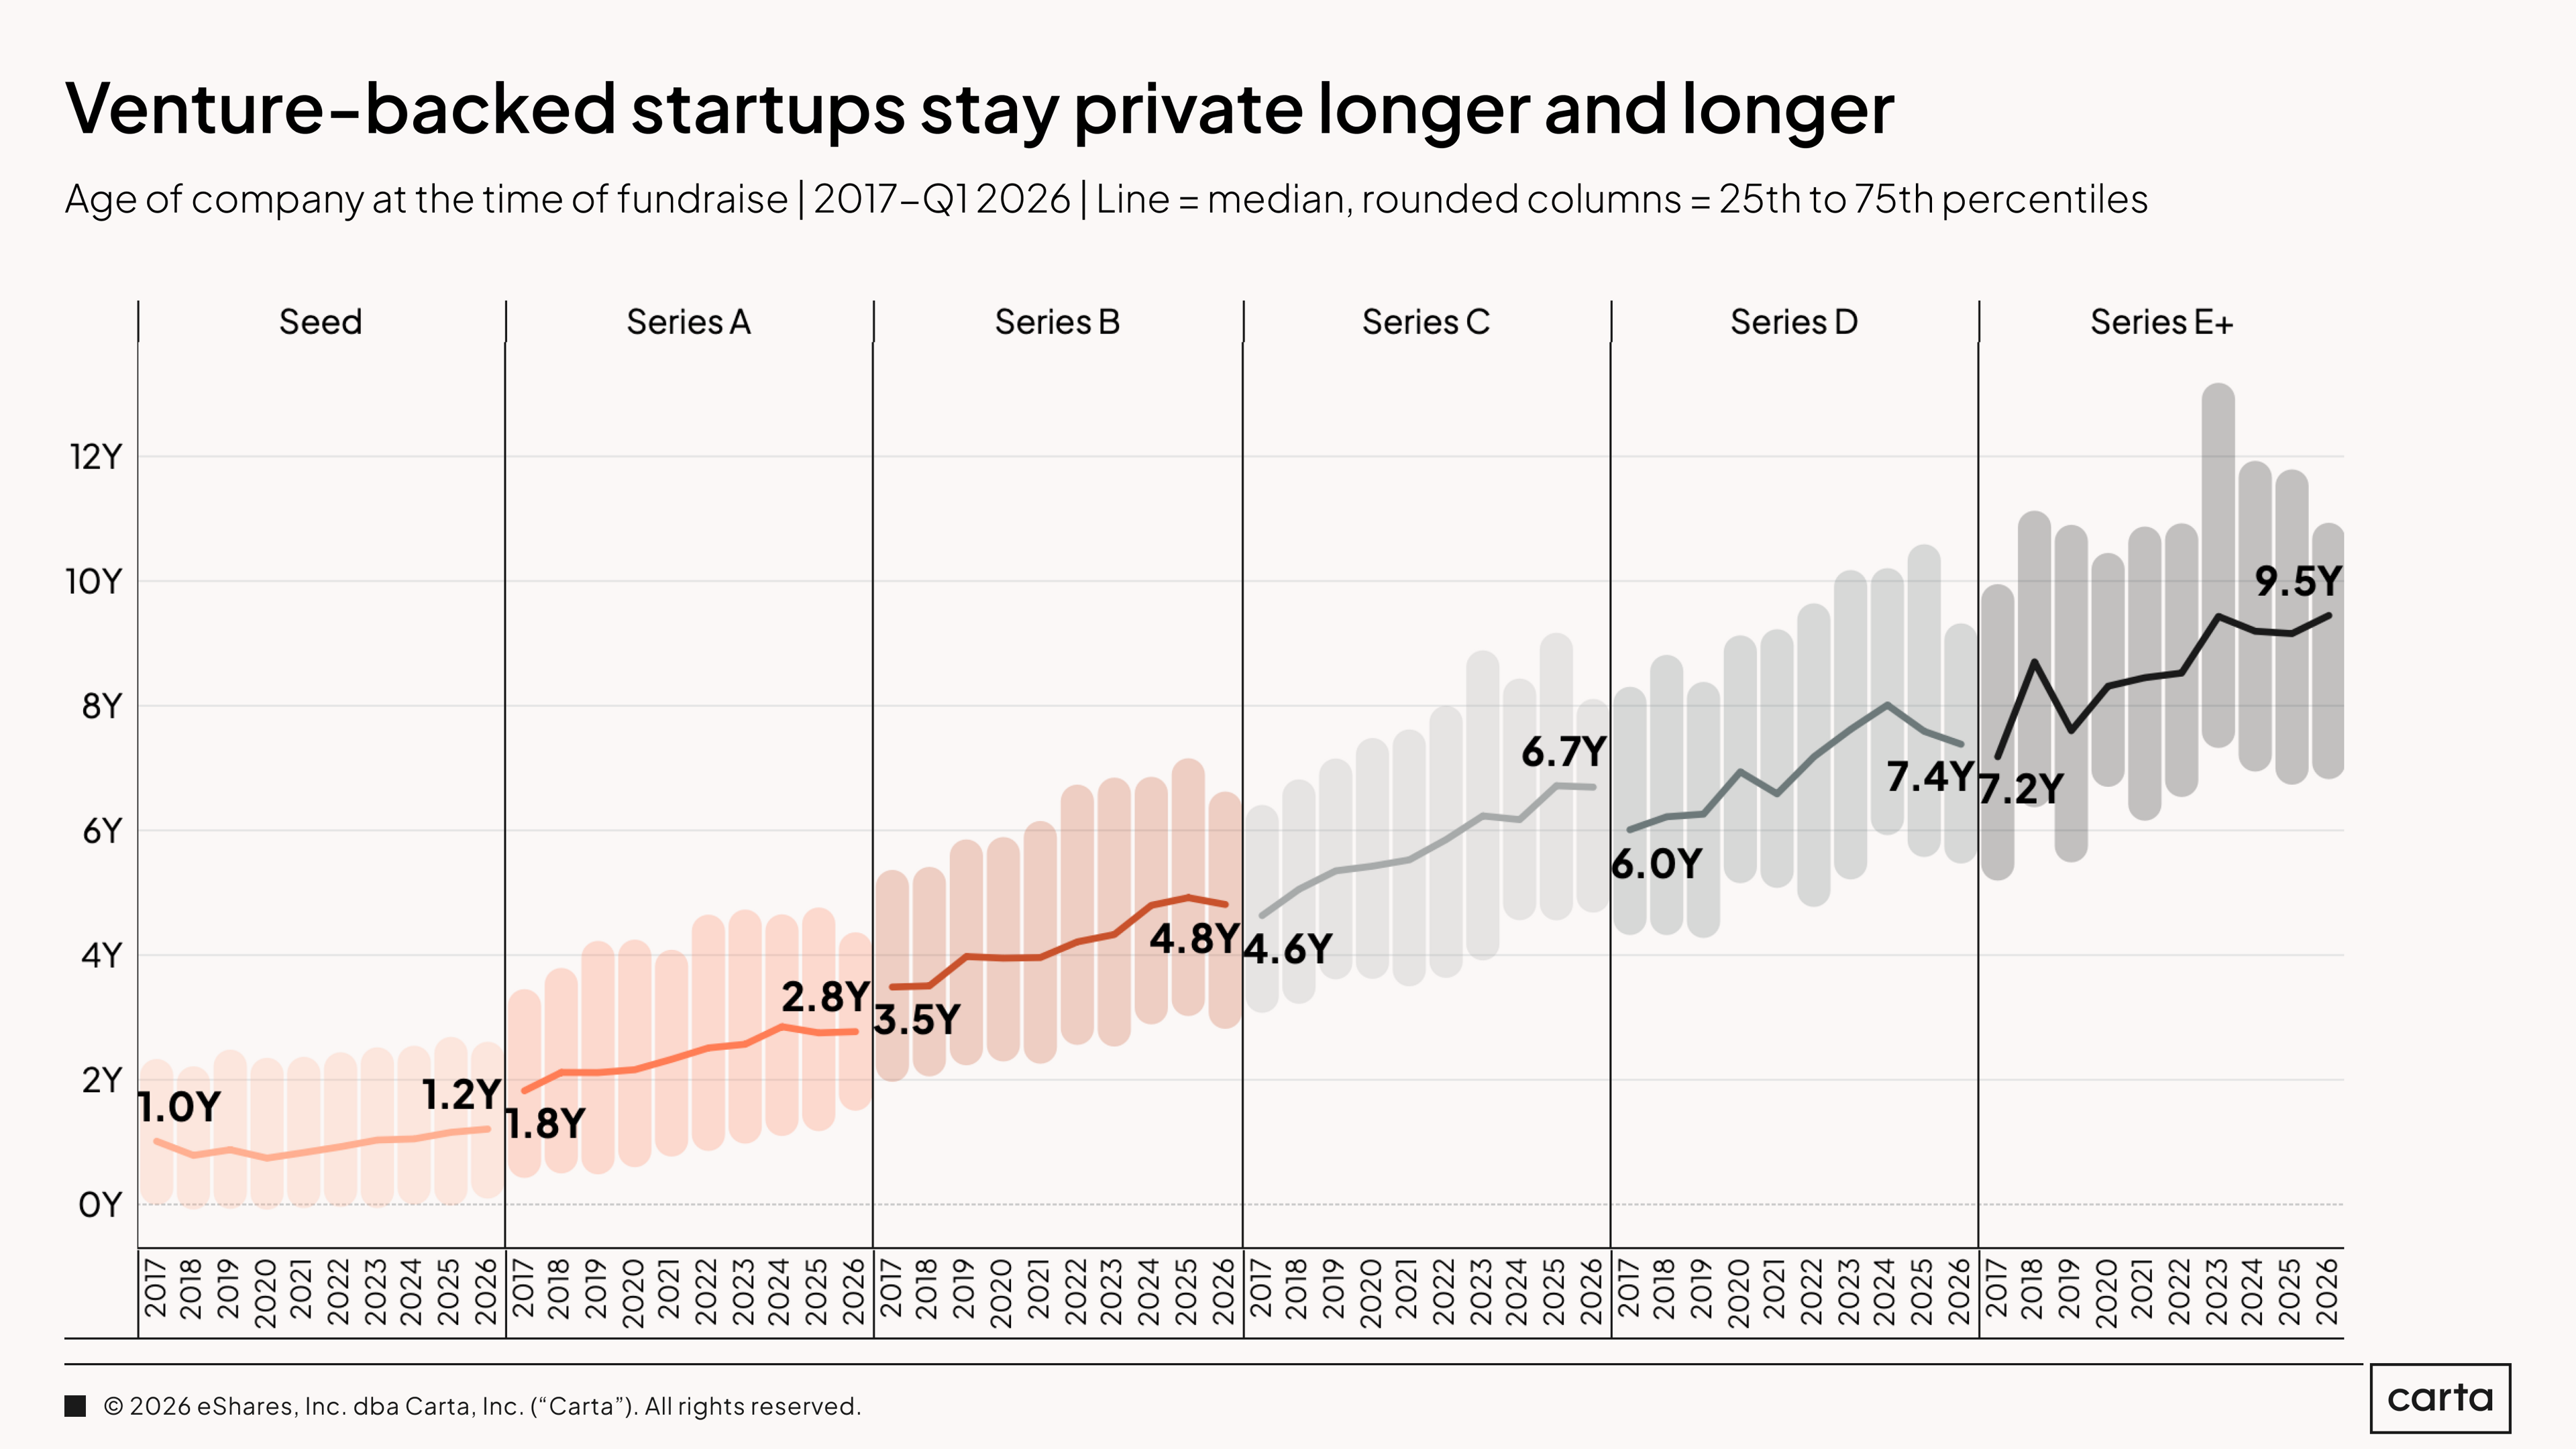
The long-term picture is clear: At each stage of the fundraising cycle, companies raising new rounds in 2026 are older than they used to be. The median company raising a Series E+ round in Q1 2026 was 9.5 years old. At Series D, 7.4 years. At Series A, 2.8 years. The slowdown in IPOs, elevated bridge activity, and a culture of later-stage private financing have collectively extended the private life of venture-backed companies well beyond what was normal a decade ago.
Liquidity
The exit data from the broader market explains much of why companies are staying private for longer. Only half of venture-backed tech IPOs in the U.S. in 2025 priced above their final private valuation. Less than a third stayed above their initial IPO price after listing. M&A is absorbing deal flow but not generating real returns in many cases. Founders and investors are not staying private by choice alone. The public market's verdict on private valuations has, for most companies, been to mark them down. Until that changes, private timelines will keep extending.
There are signs the climate is shifting. Q1 2026 saw 34 IPOs price in the U.S., raising $9.9 billion. Cerebras priced in May 2026, 20 times oversubscribed, above an already-raised range, and opened at nearly double its IPO price. SpaceX filed its S-1 publicly on May 20.
These are not broad signals for all industries. They are narrow ones: AI infrastructure, fintech with clear unit economics, companies where the public market found the private valuation credible. But narrow signals matter. Each successful listing resets the benchmark, tightens bid-ask spreads in the secondary market, and gives the next company in the pipeline a reference point to price against.
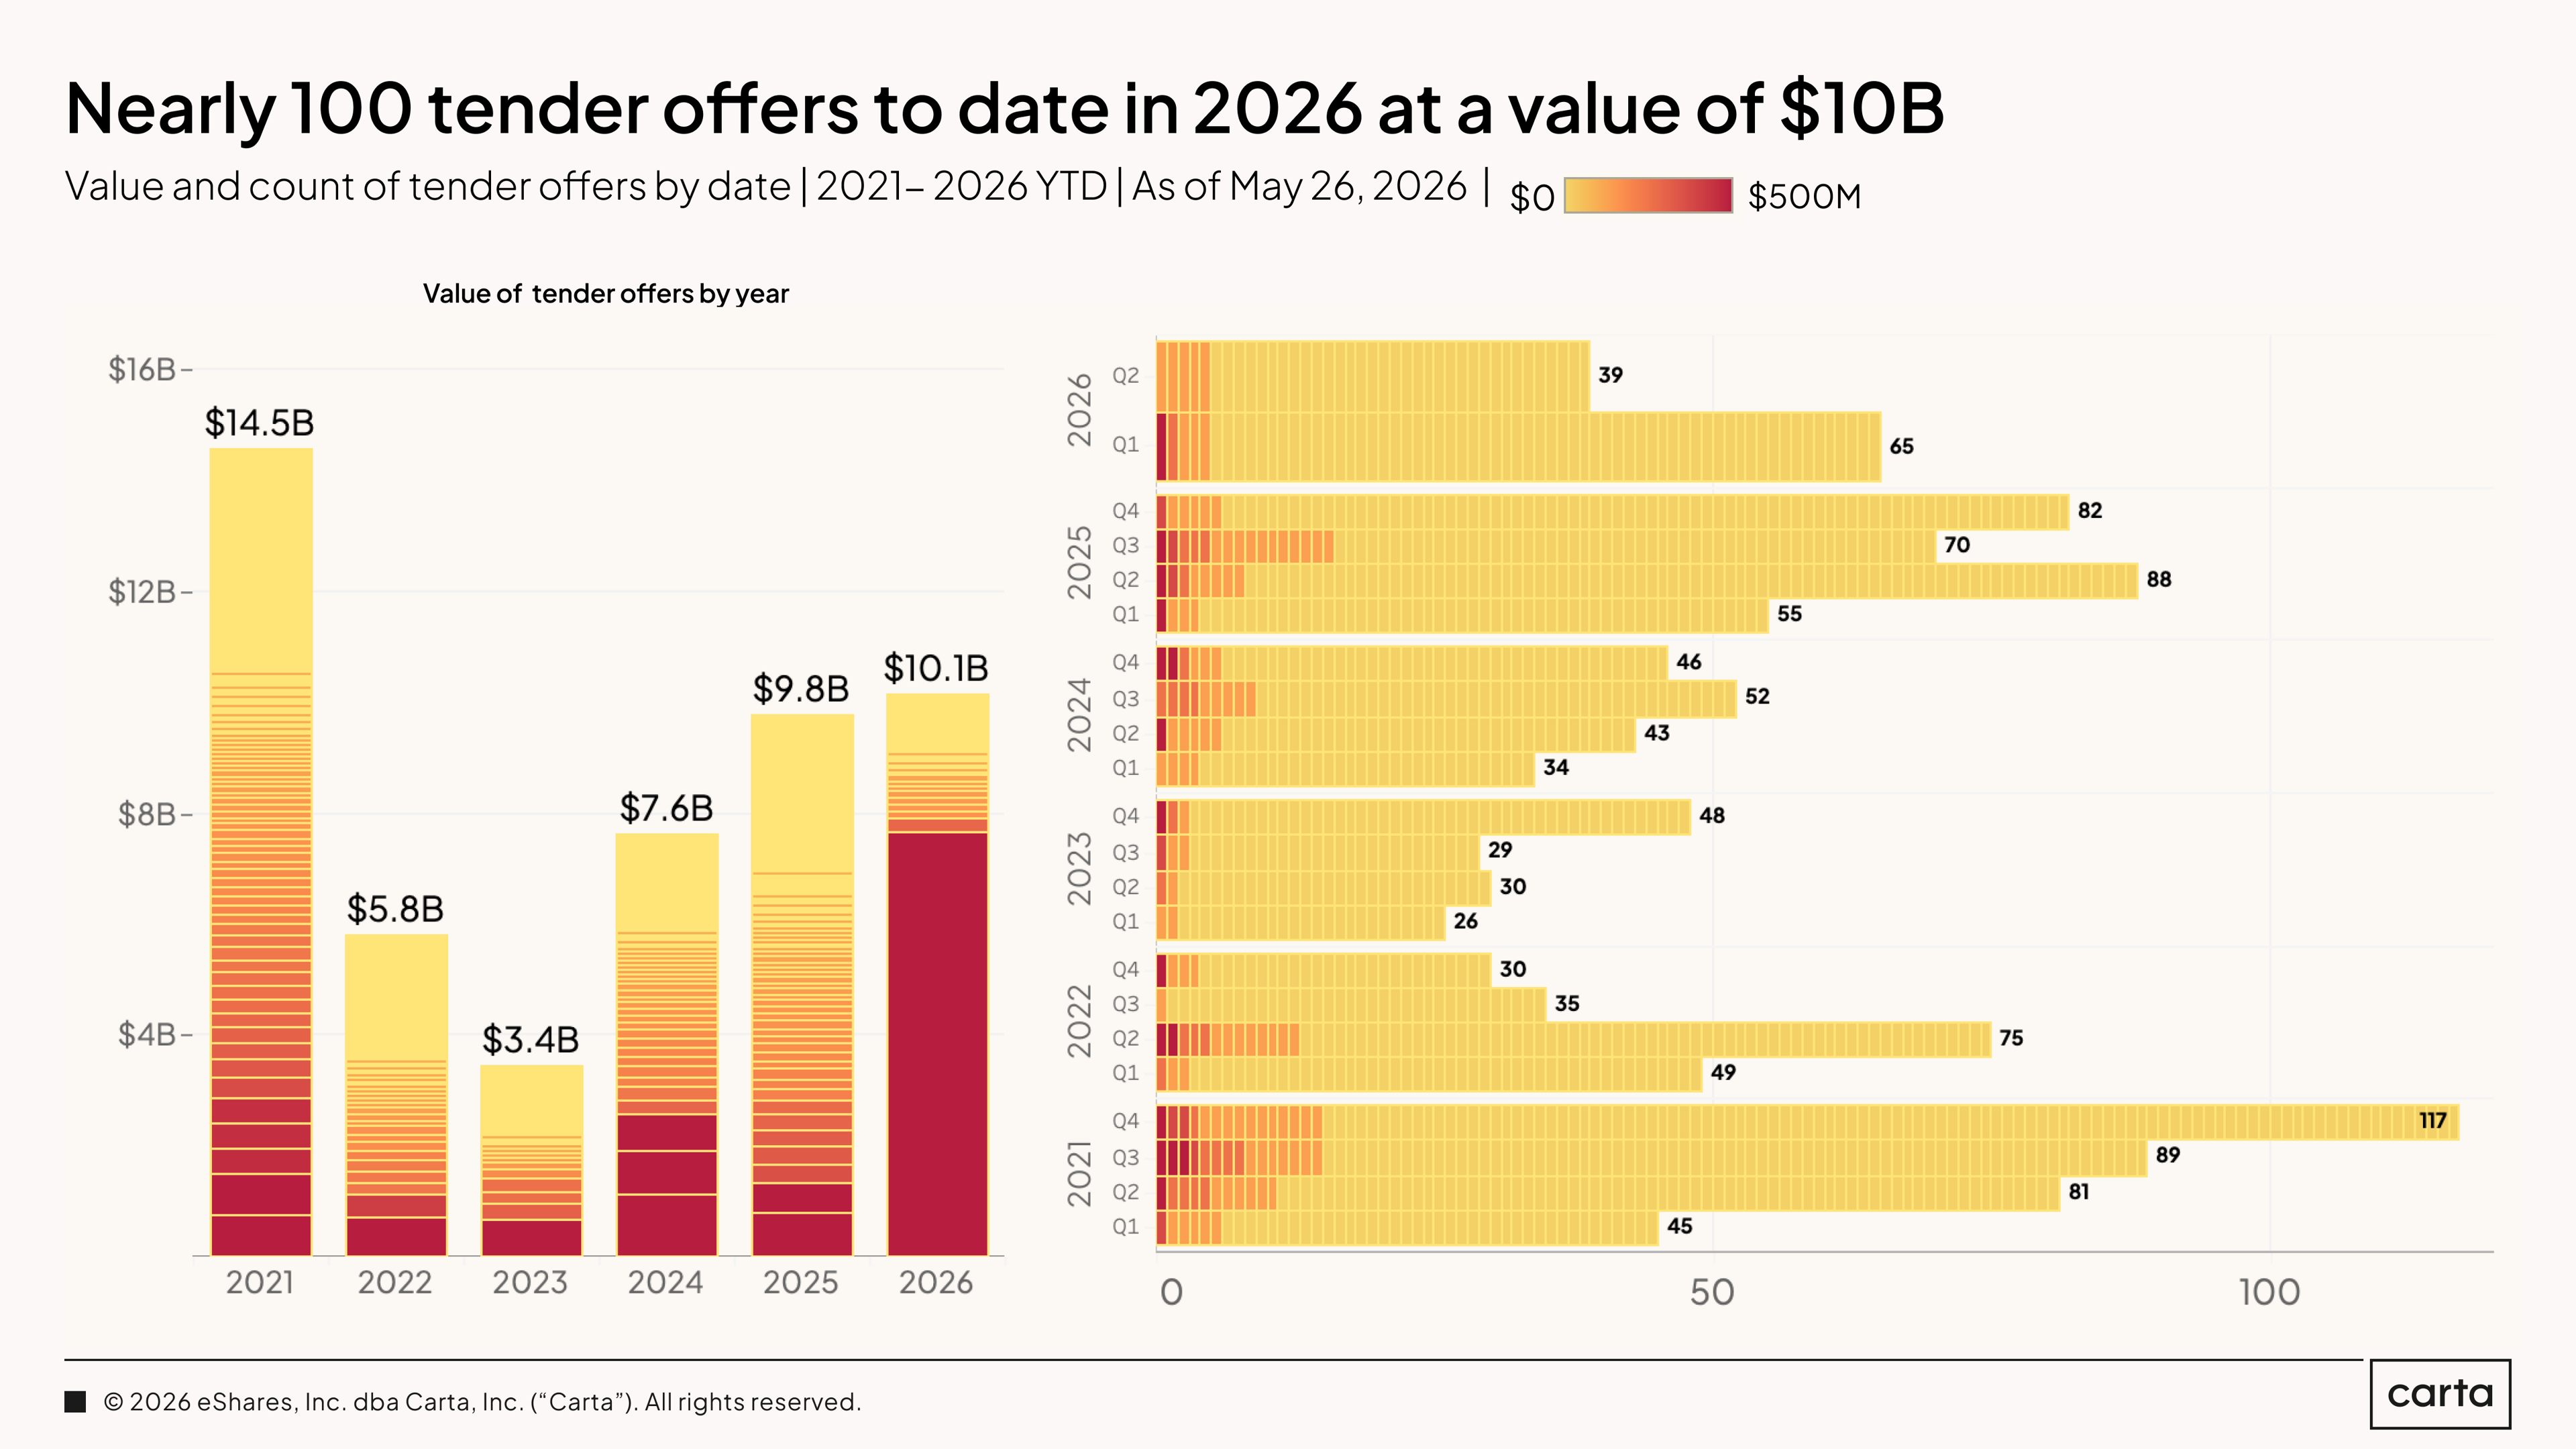
Tender offer data captures one slice of a much larger market-wide shift. Nearly 100 tenders market wide have been visible to Carta in 2026 at a combined value of $10.1 billion, already ahead of 2025's full-year total.
Tender offer is no longer a single instrument with a single purpose. It has sorted itself into distinct categories, each serving a different strategic function. The first is the permanent alternative to the IPO: profitable, self-funding companies providing employee liquidity on a schedule they control. The second is the retention weapon, used by elite AI companies competing for talent against nine-figure poaching offers, where the tender is a competitive response as much as a liquidity event. The third is pre-IPO sequencing: valuation establishment on record and lockup preparation. This usually signals IPO imminence, not hesitation.
The fourth, and least discussed, is cap table management. Some tenders are not primarily about giving employees liquidity. They are about cleaning up the ownership structure before a primary raise or an exit. Early investors approaching the end of fund life, former employees whose continued ownership creates administrative complexity, small holders accumulated across years of employee grants. A well-structured tender offer lets a company consolidate its cap table, remove holders who are no longer aligned with the company's direction, and arrive at the next stage of its life with a cleaner, more manageable ownership structure.
Post-money valuations
Valuations in Q1 2026 are telling two stories, depending on where you look. At the median, valuations at most stages are holding or improving. At the 90th percentile, the numbers have moved into territory that would have been unrecognizable three years ago. The gap in this dataset between the middle of the market and the top has never been wider.
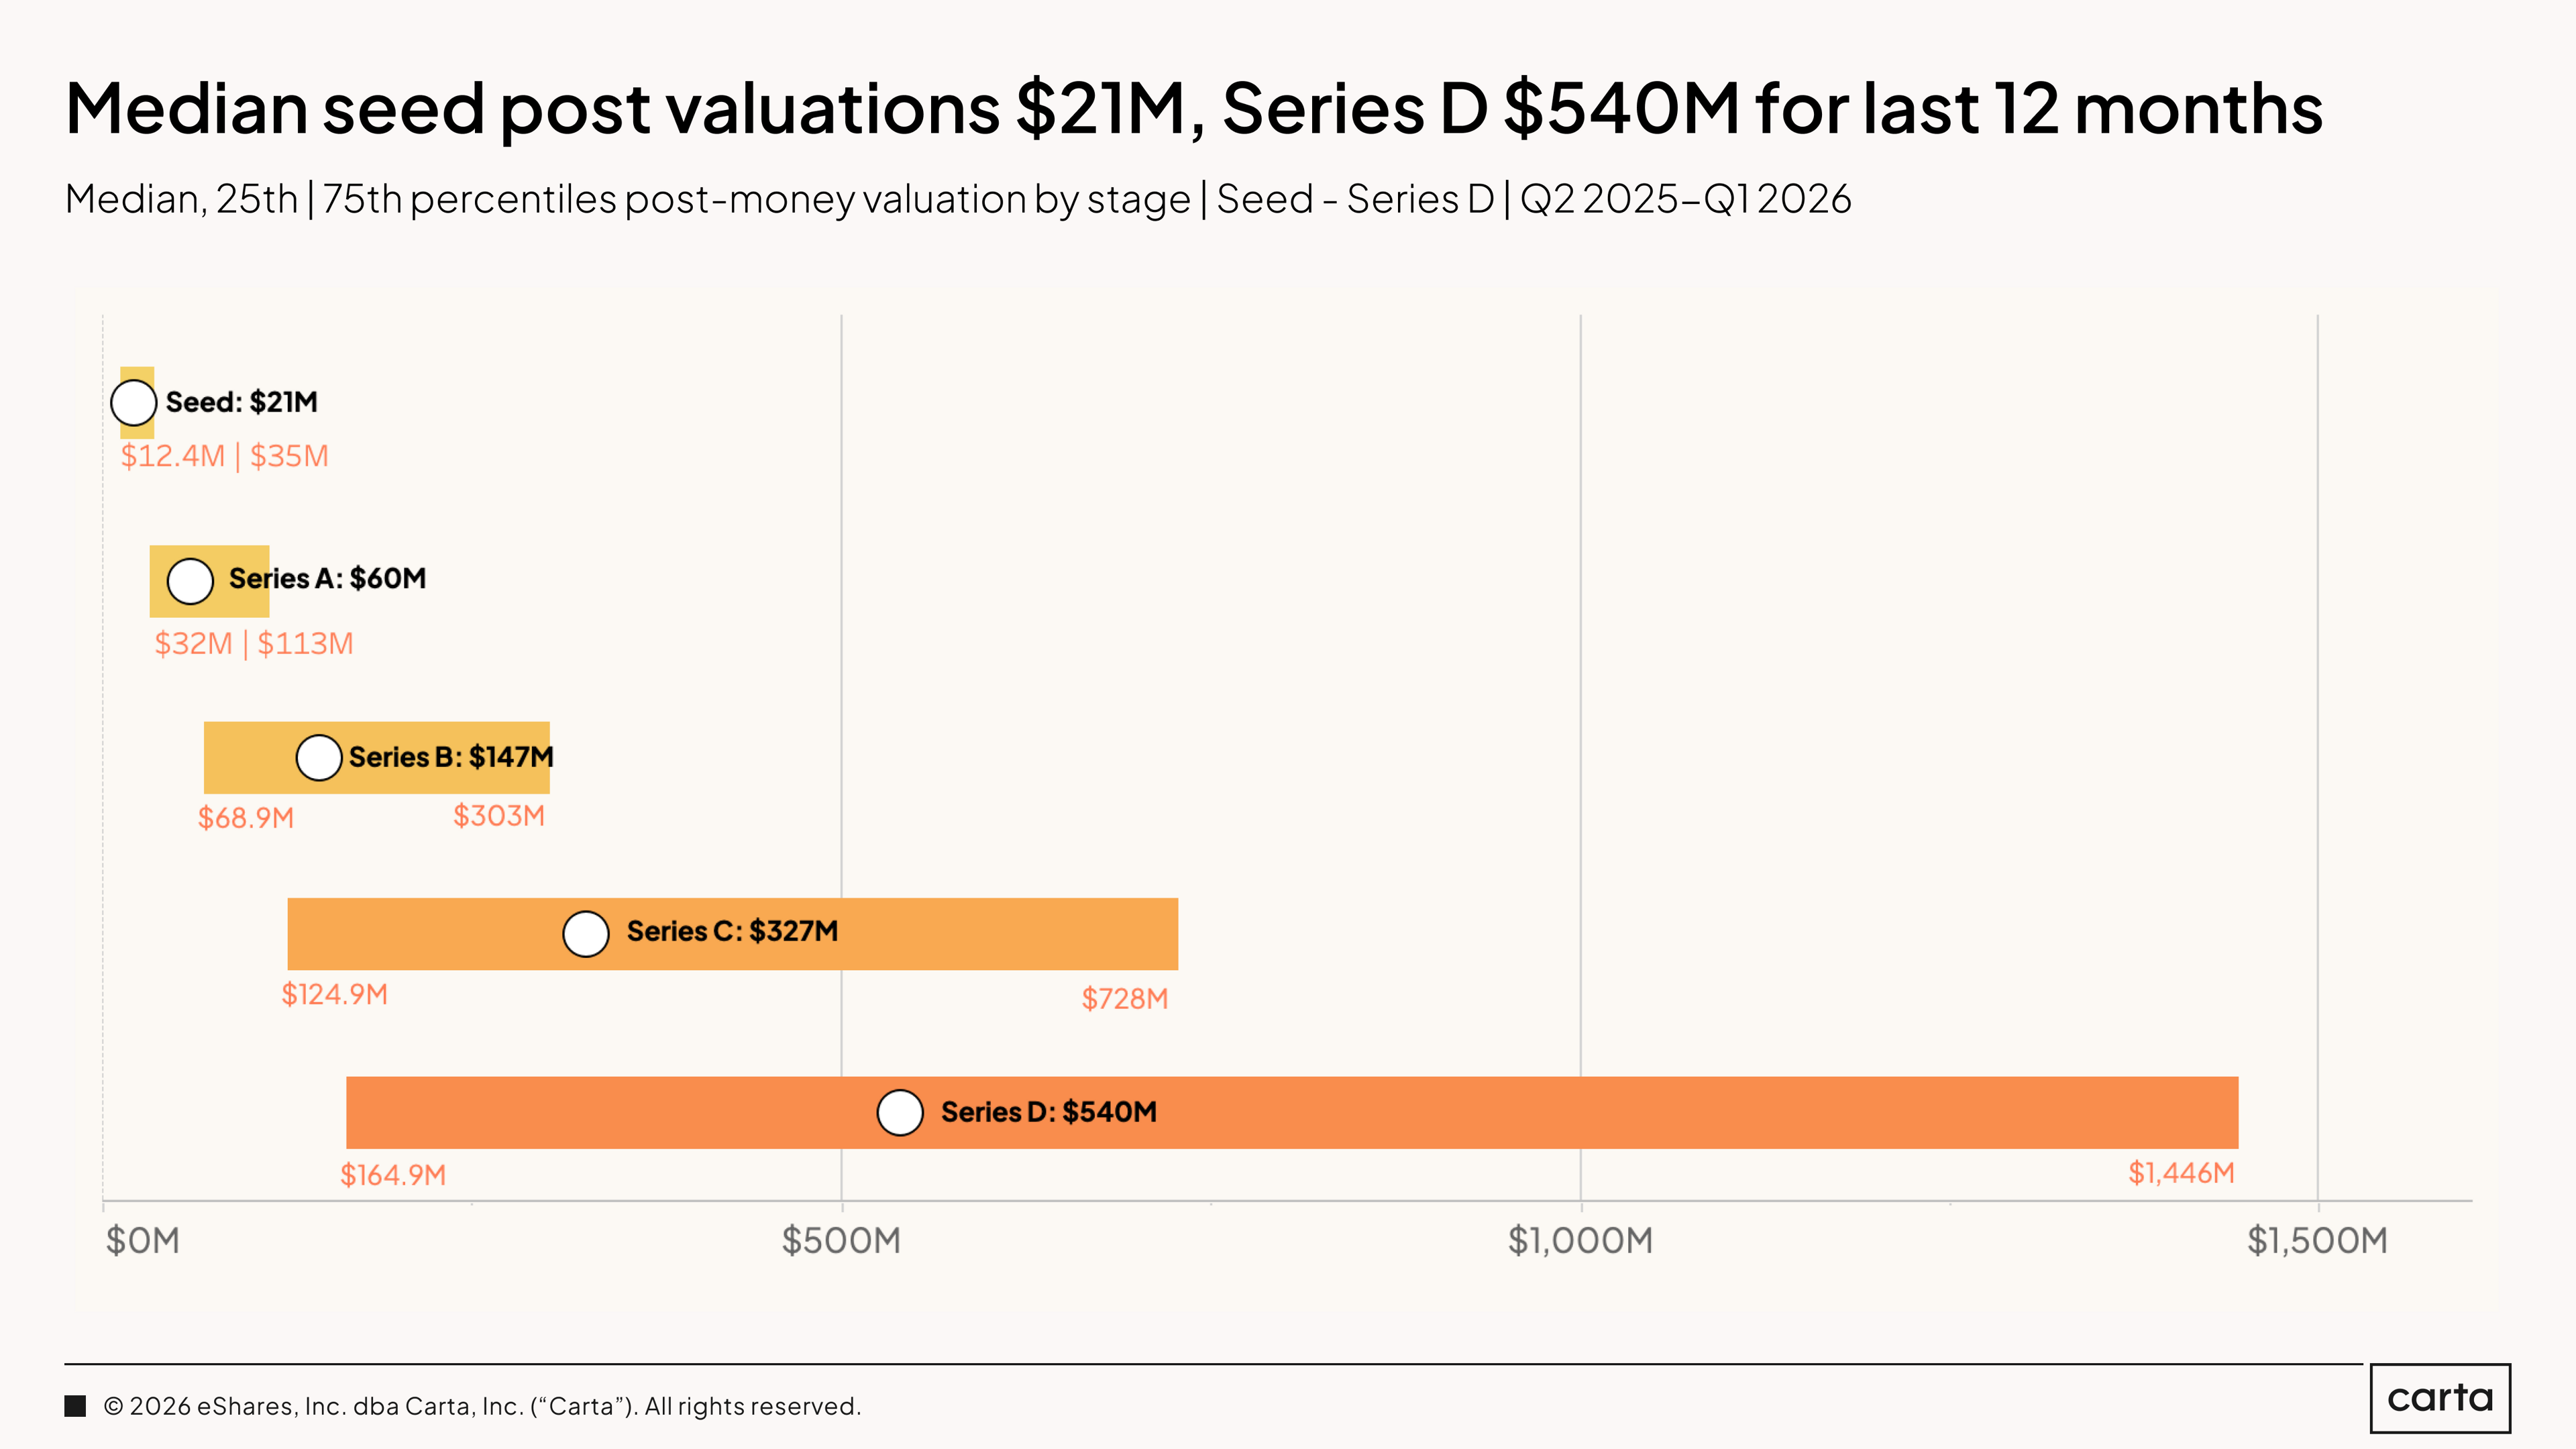
The 12-month rolling medians for post-money valuations on Carta from Q2 2025 through Q1 2026 give the clearest single-frame benchmark for where the market is pricing each stage right now. These are the numbers a typical founder should expect to see on a term sheet if they are raising a primary round at each stage today.
The above chart also shows the range around each median. At seed, the gap from the 25th percentile to the 75th percentile runs from $12.4 million to $35 million, a relatively tight band. By Series D, that interquartile range stretches from $164.9 million to over $1.4 billion. The later the stage, the wider the spread between a typical valuation outcome and an exceptional one.
For founders this means benchmarks become less useful at later stages. At seed, you can calibrate against the median with reasonable confidence. At Series D, the median and your outcome may have very little correlation.
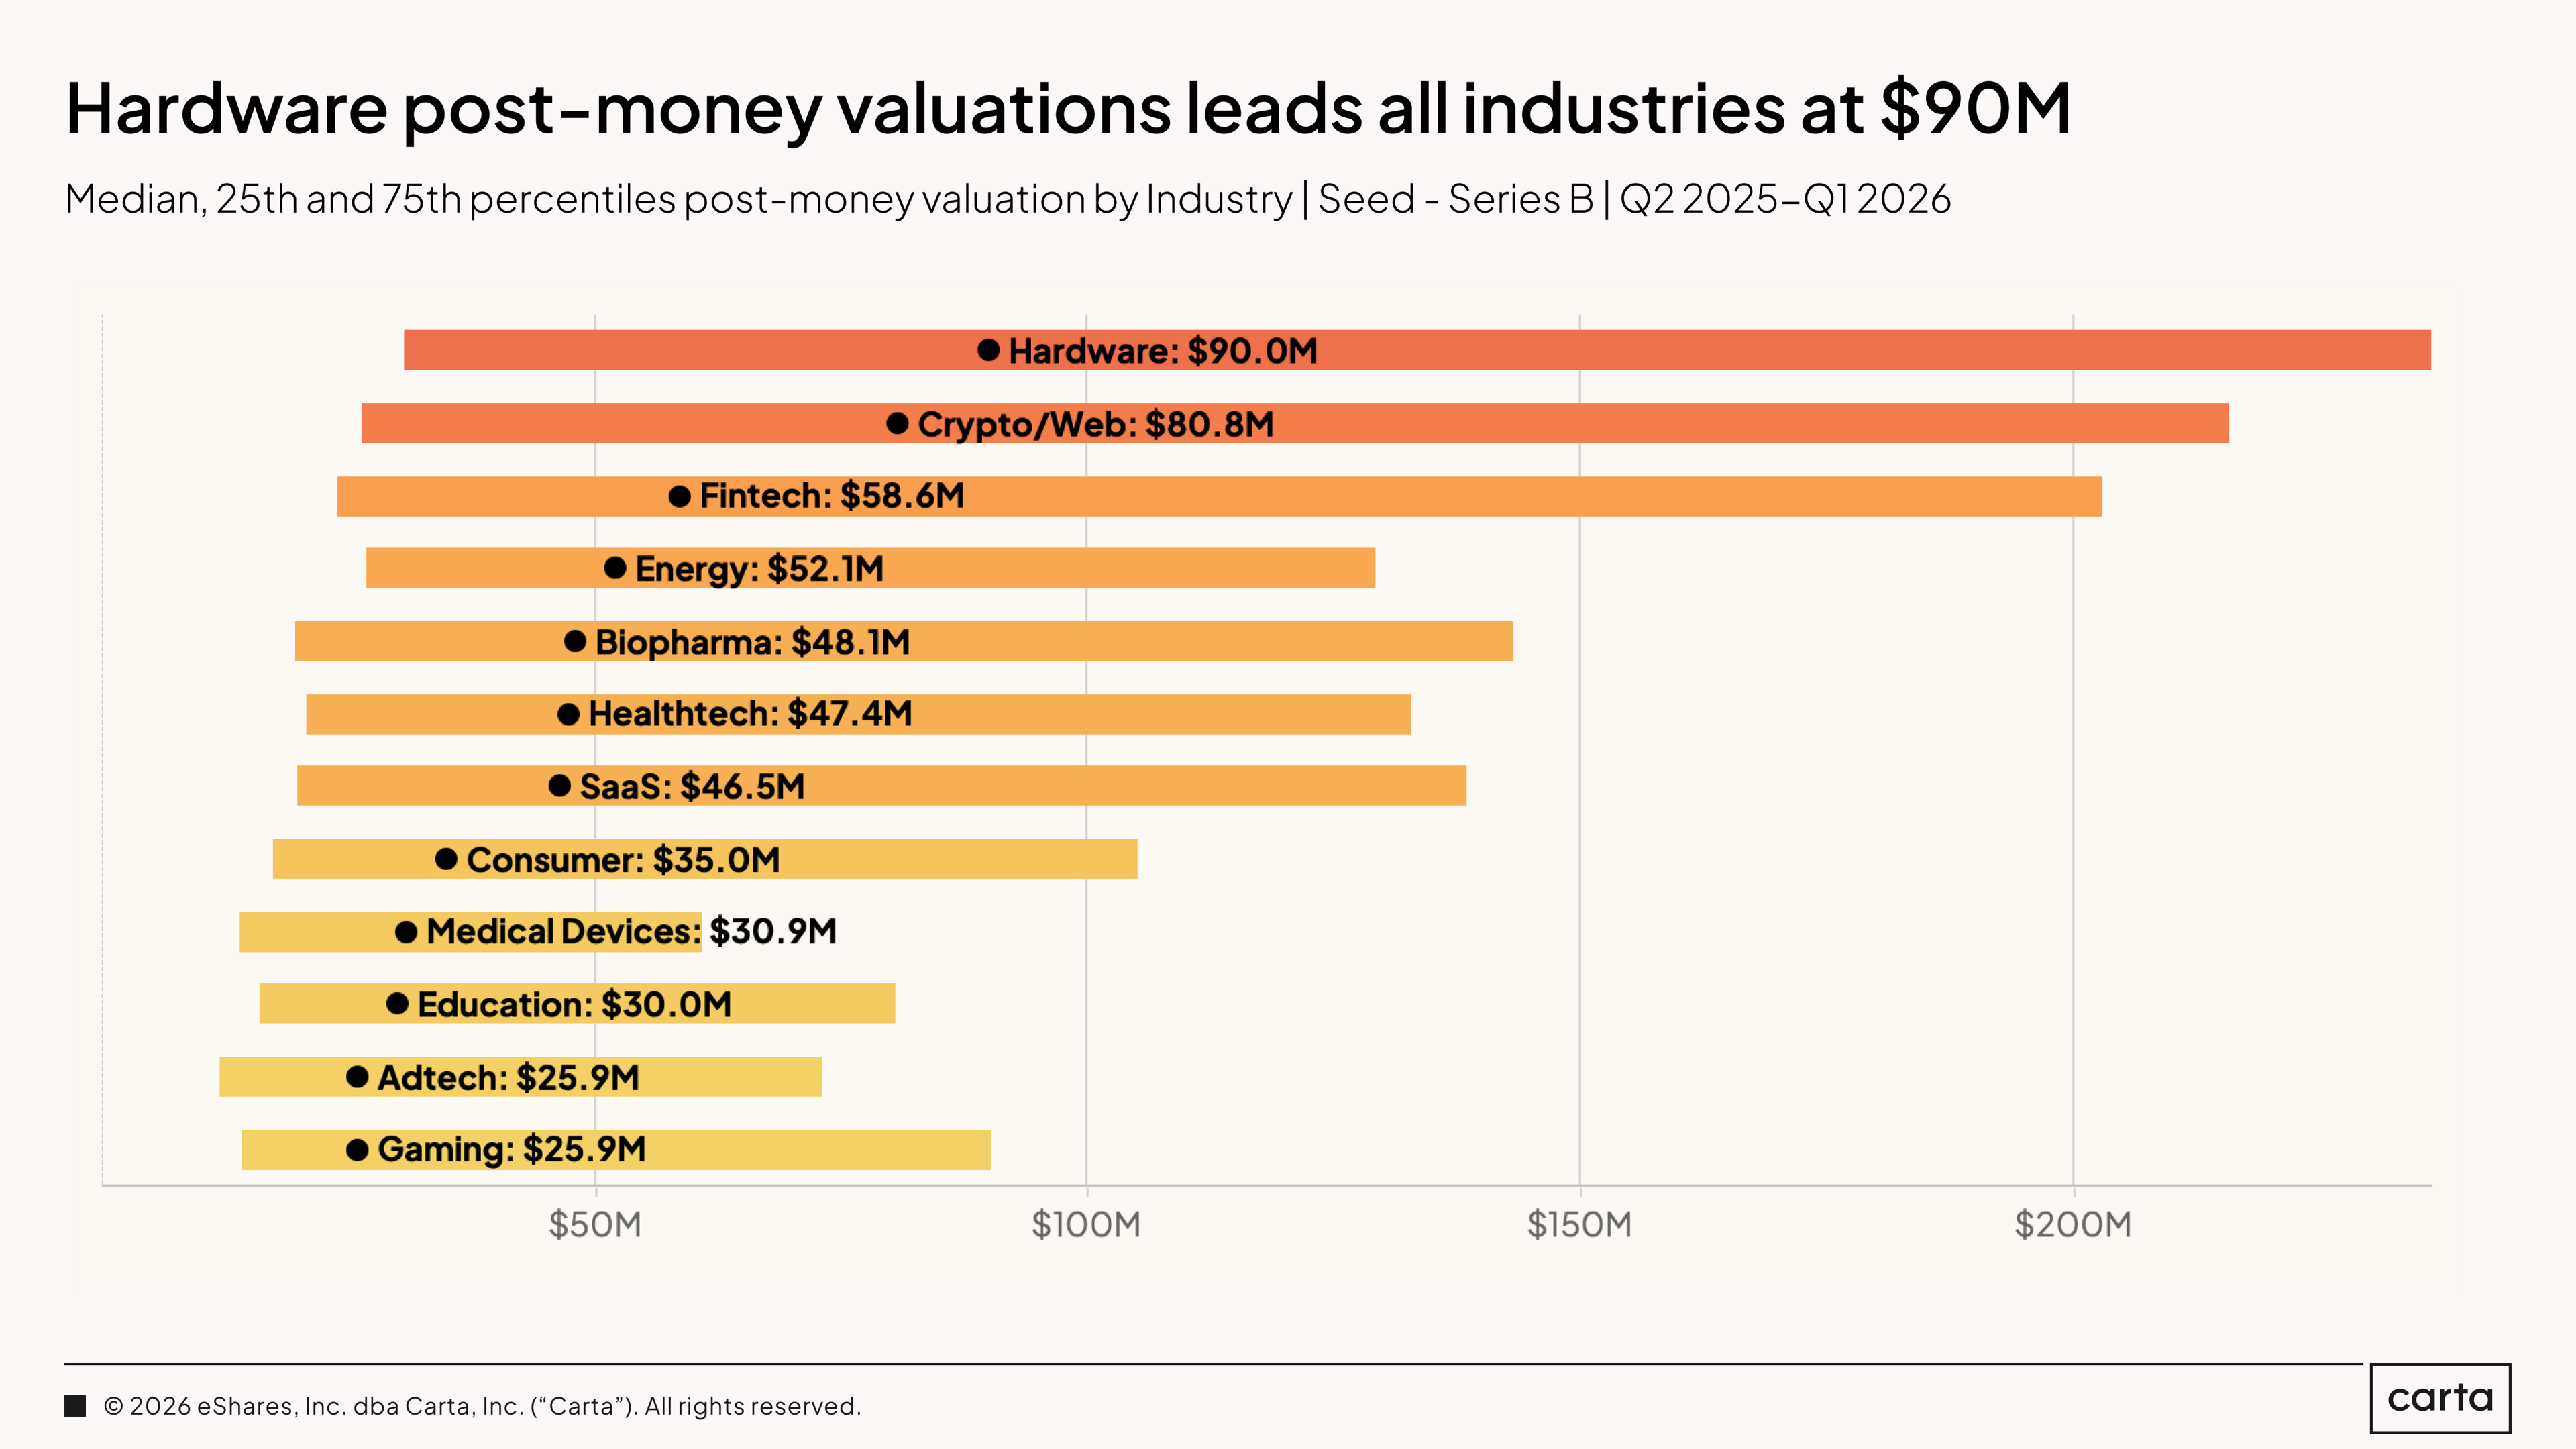
Hardware leads all industries in median post-money valuation at $90 million across seed through Series B, well ahead of every other category in this dataset. Crypto/Web is second at $80.8 million. Both sit significantly above the next tier. The gap between hardware and the middle of the pack, where SaaS sits at $46.5 million, is not a rounding error. It is a structural valuation premium reflecting capital intensity, longer development cycles, and the increasing conviction among investors that the next generation of AI applications will be built on physical infrastructure.
SaaS at $46.5 million is below the midpoint of the industry rankings. That is worth sitting with. SaaS has been the dominant category in venture for a decade. It is also the most commoditized at early stages right now, where AI tools are compressing the cost of building software and raising questions about defensibility. The categories commanding premium valuations, hardware, crypto, fintech, energy, all share one characteristic: they are harder to replicate. The moat is structural, not just a product decision.
The bottom of the chart tells its own story. Adtech and gaming both at $25.9 million. Education at $30 million. Medical devices at $30.9 million. These are categories where either the sales cycle is long, the regulatory burden is high, or the AI disruption thesis is less clear. Investors are pricing that uncertainty in.
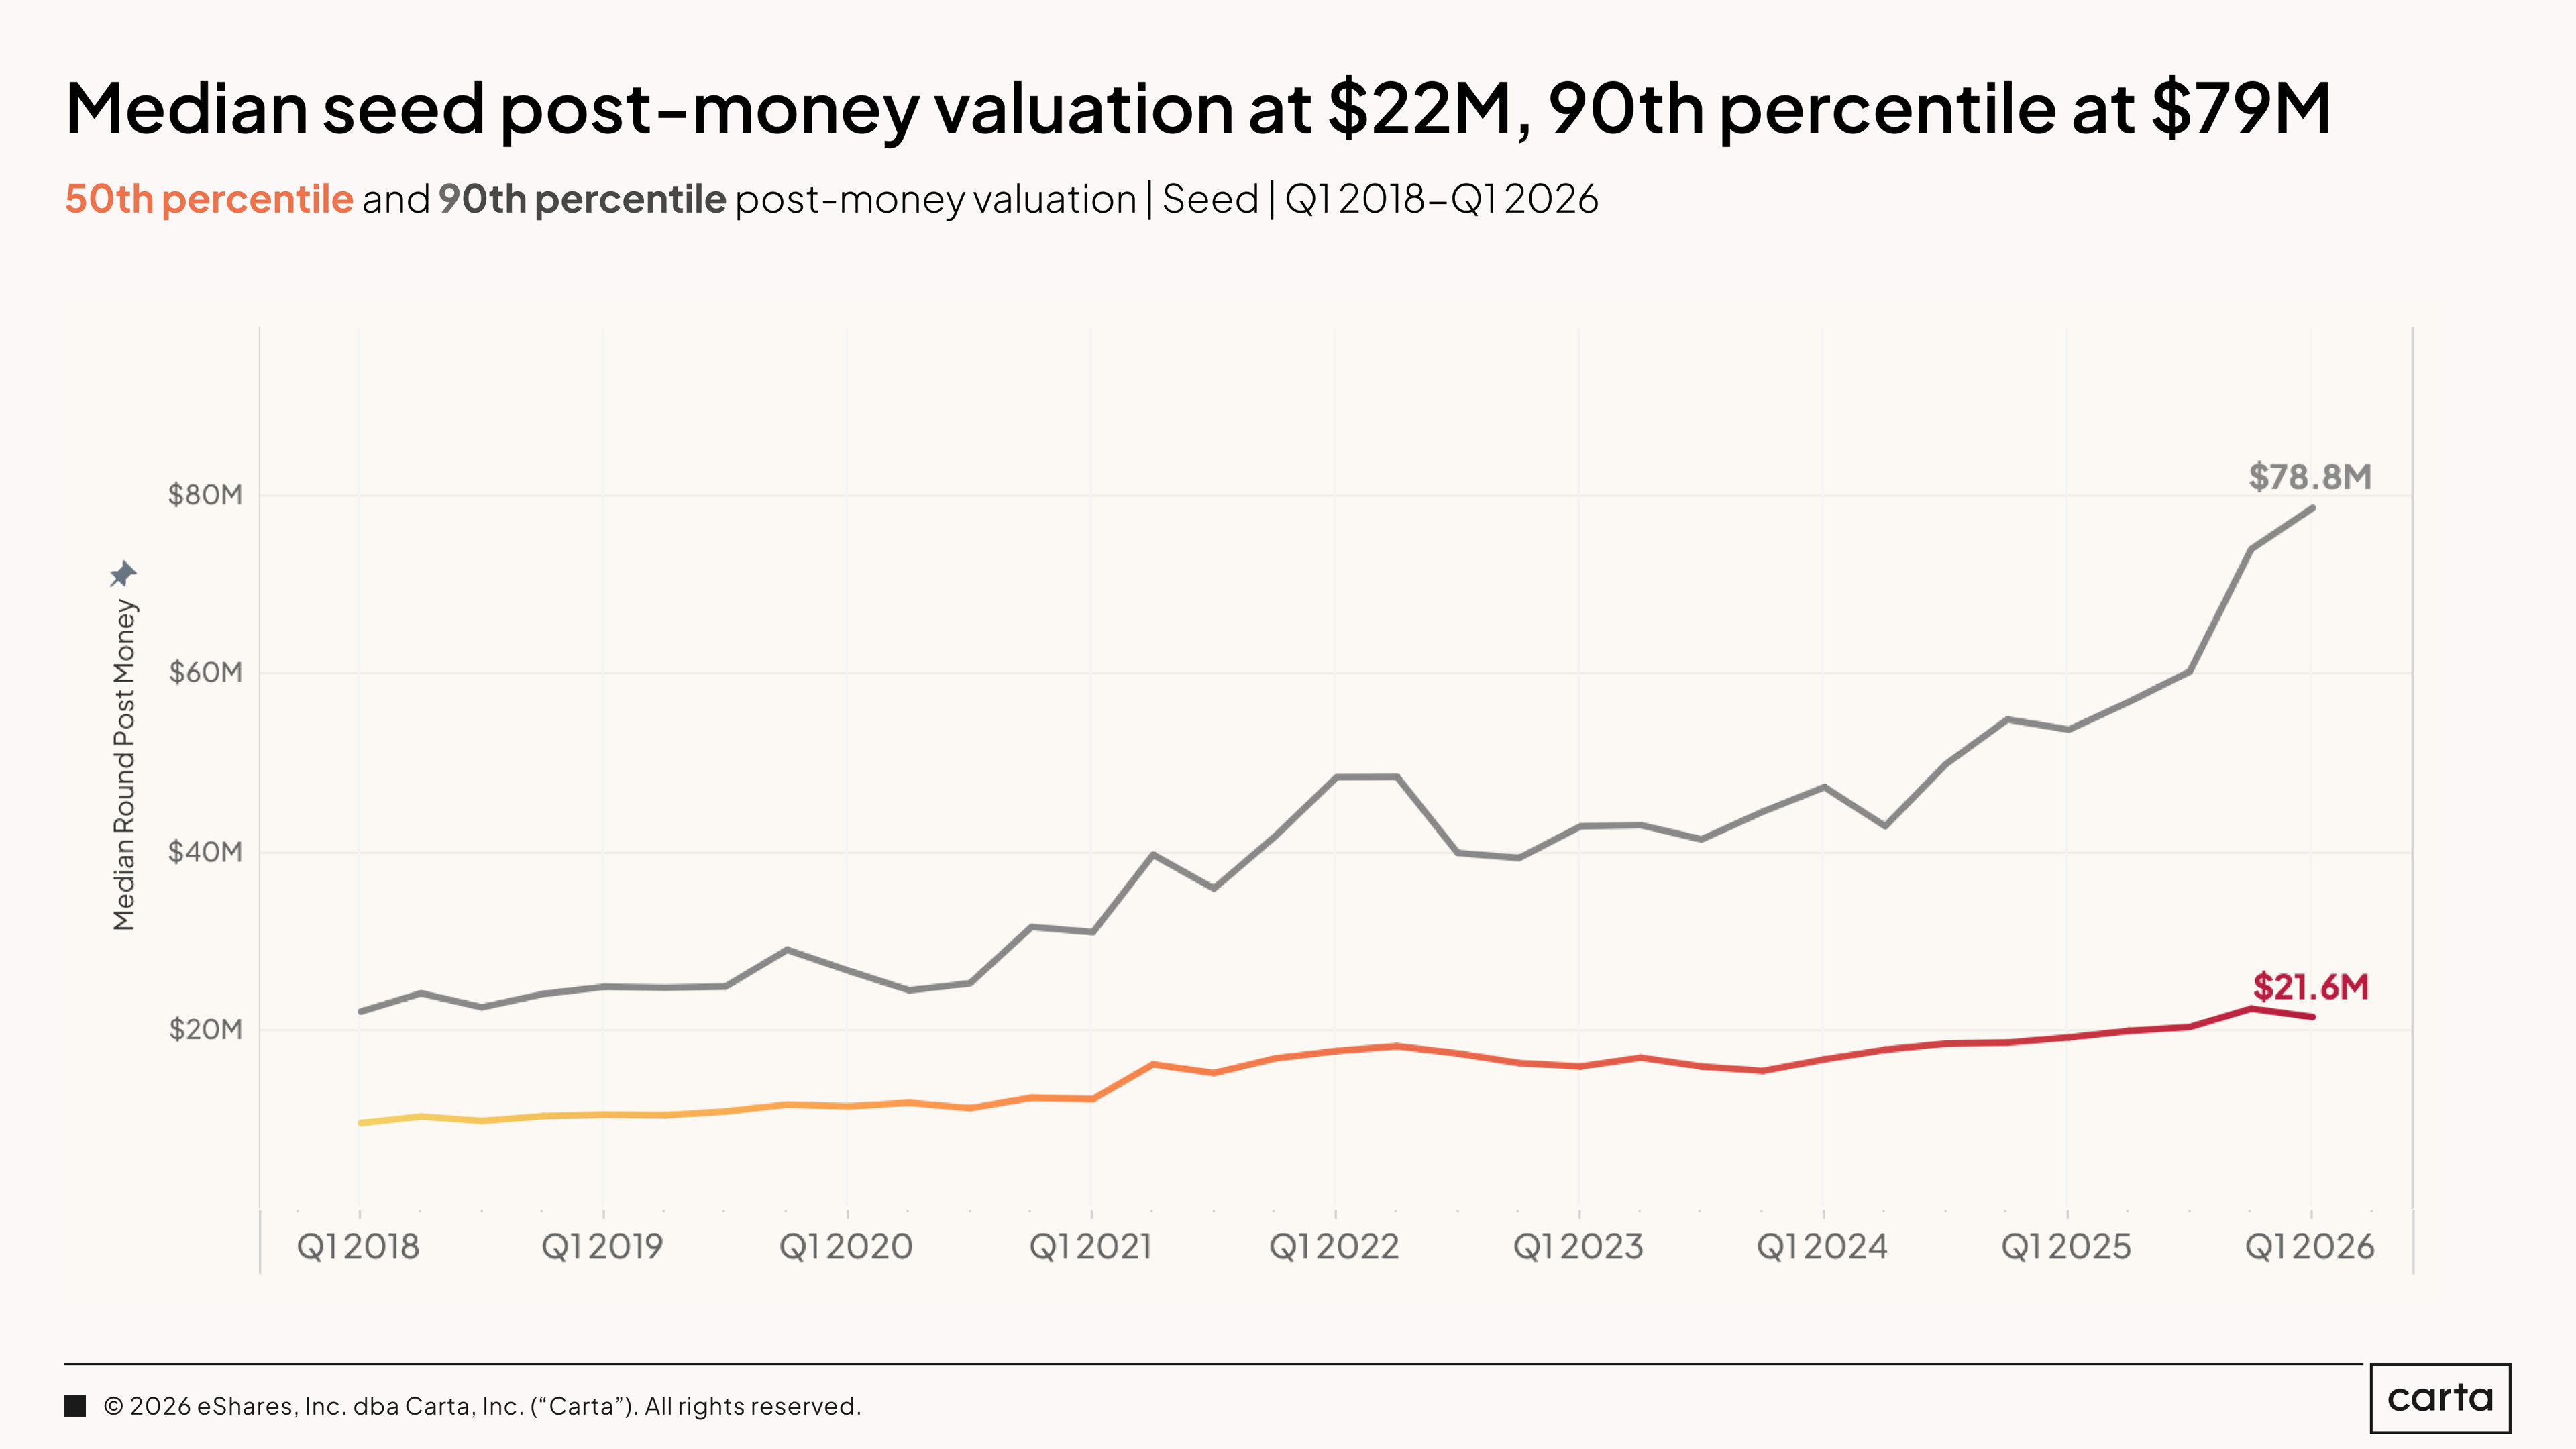
The median post-money valuation at the seed stage reached $21.6 million in Q1 2026, continuing a steady climb that has been underway since 2018, with only modest interruption during the 2022 reset. The more striking number is at the top: the 90th percentile seed valuation hit $78.8 million in Q1, nearly double where it stood just two years ago. The gap between the median and the 90th percentile is widening.
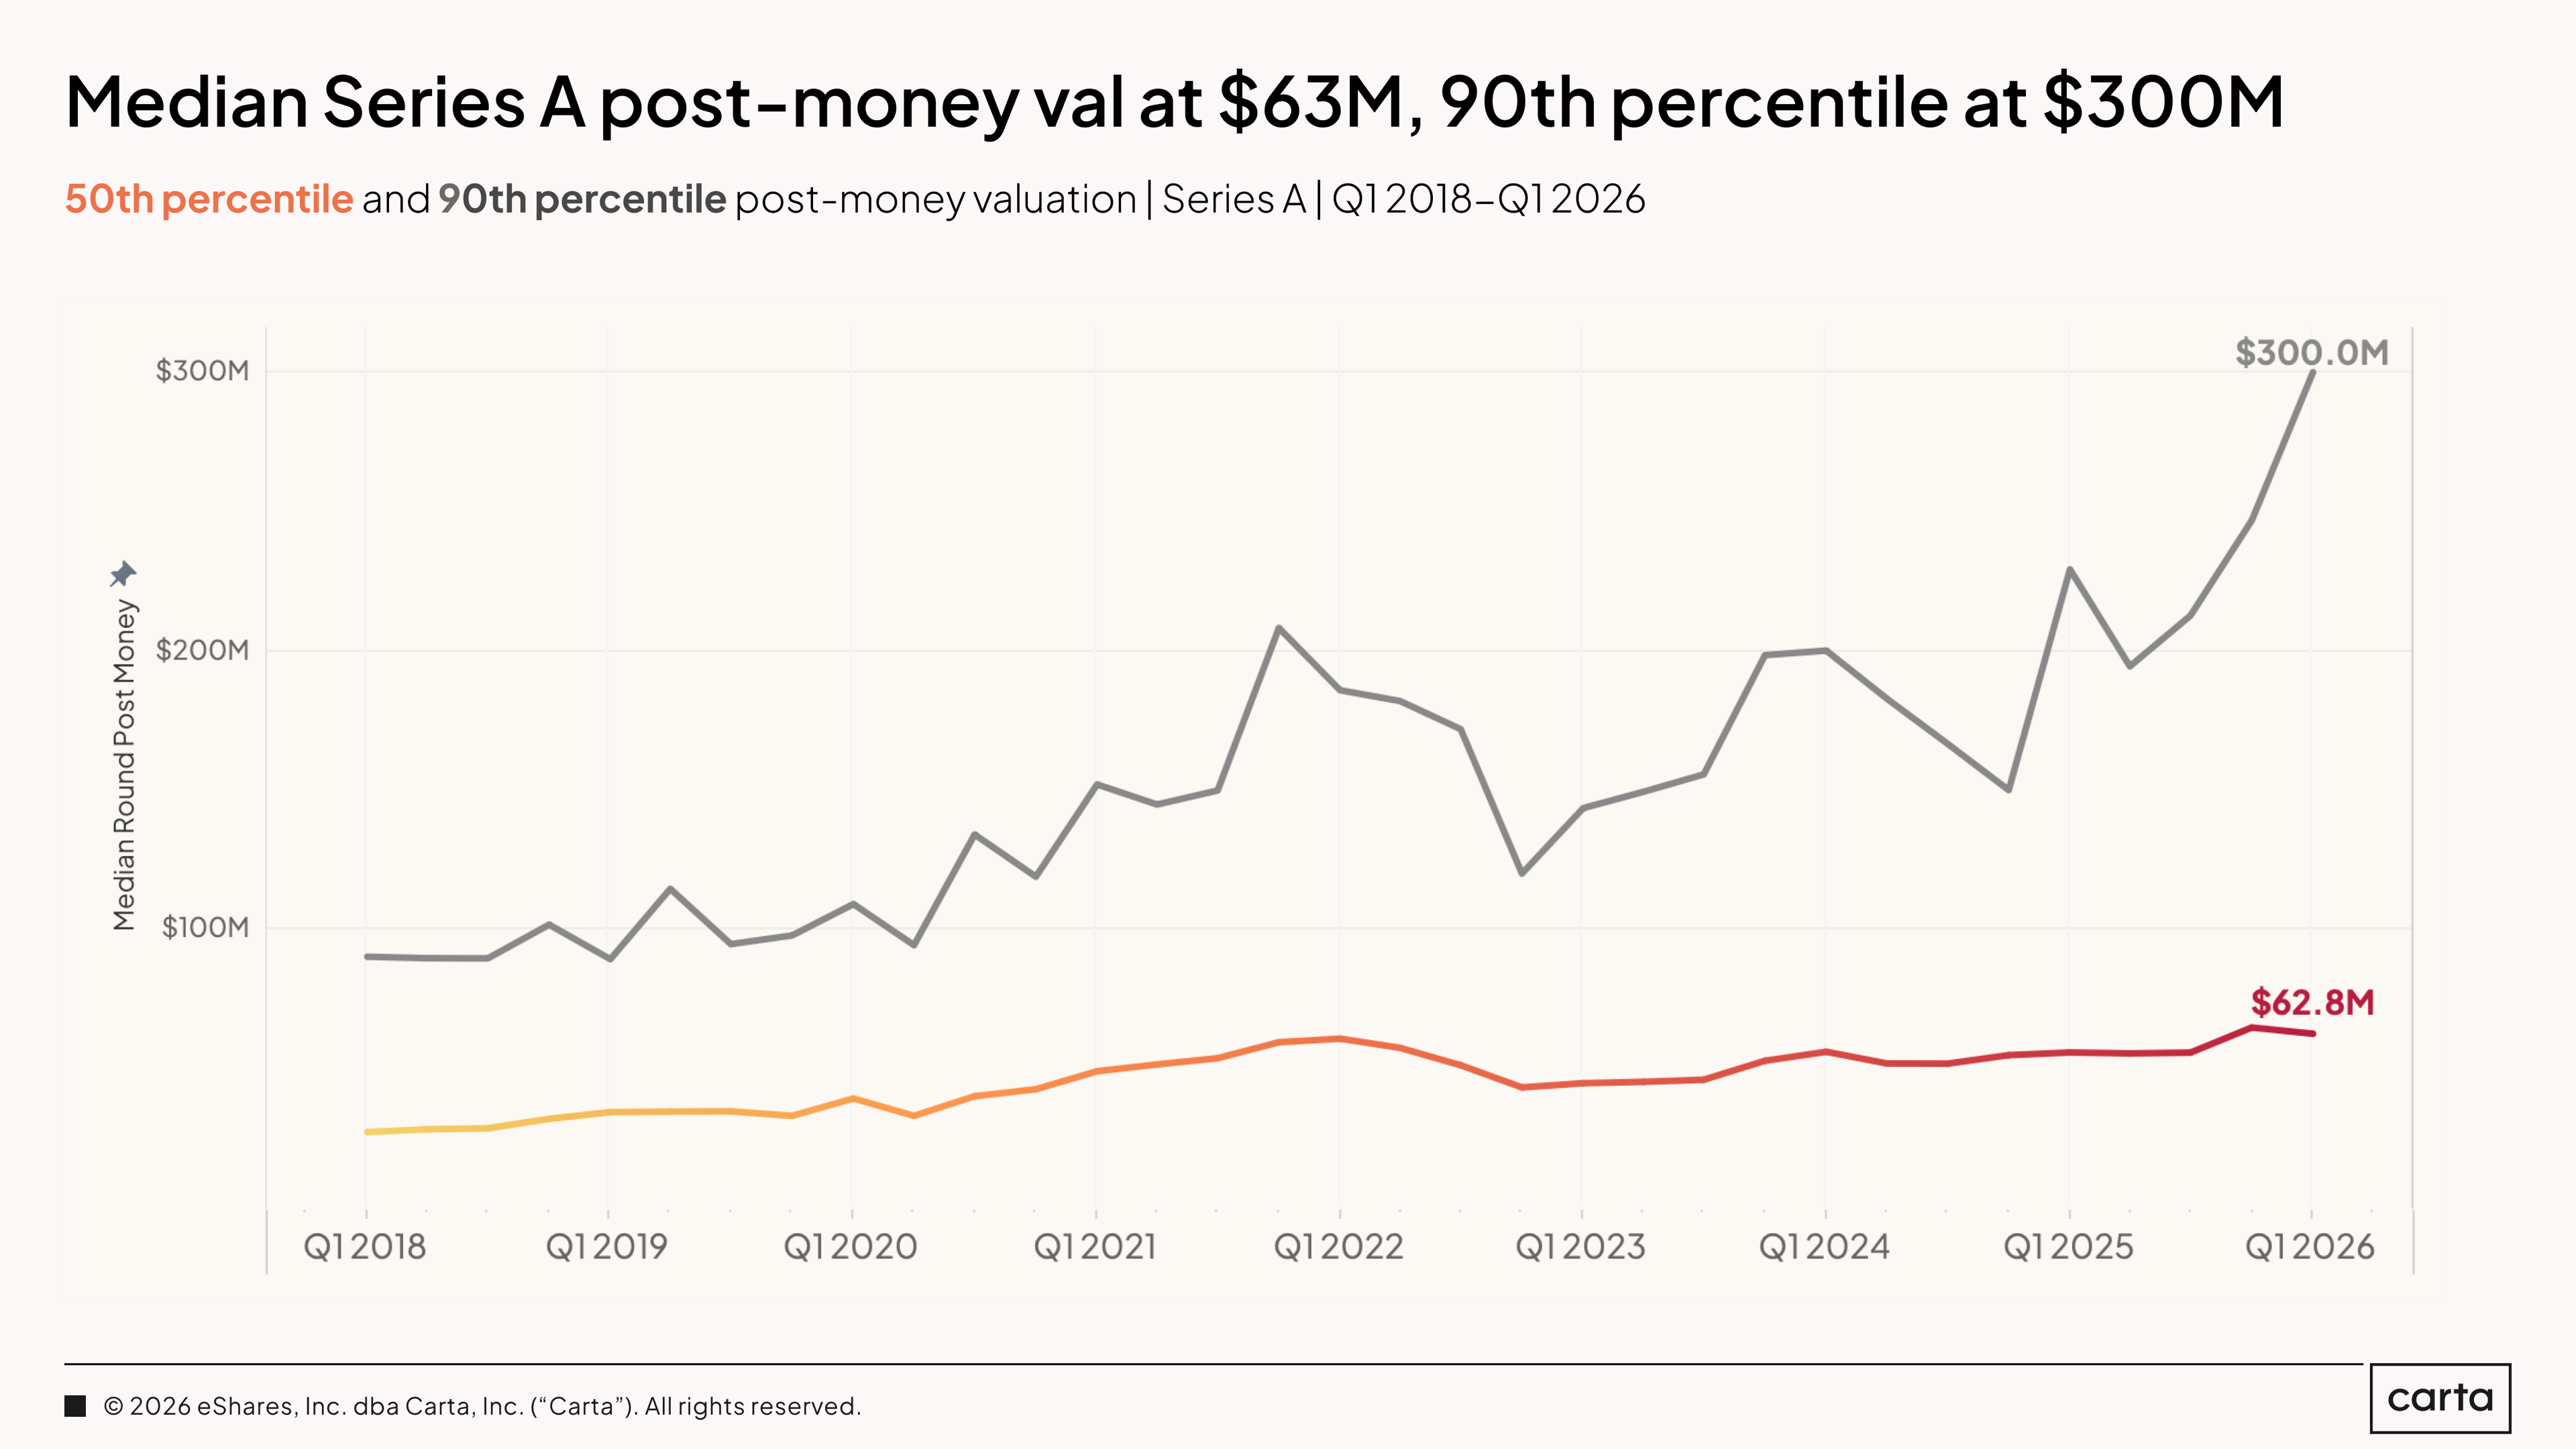
The median Series A post-money valuation in Q1 2026 was $63 million, roughly in line with the past several quarters and consistent with a market that has recovered from the 2022 to 2023 trough without overheating at the middle. The 90th percentile tells a different story entirely. At $300 million, it has more than doubled from where it sat in 2023 and surpassed the peak of the 2021 bull market. The top of the Series A market is now priced at levels the broader market has never seen, and which would be unrecognizable to the median founder.
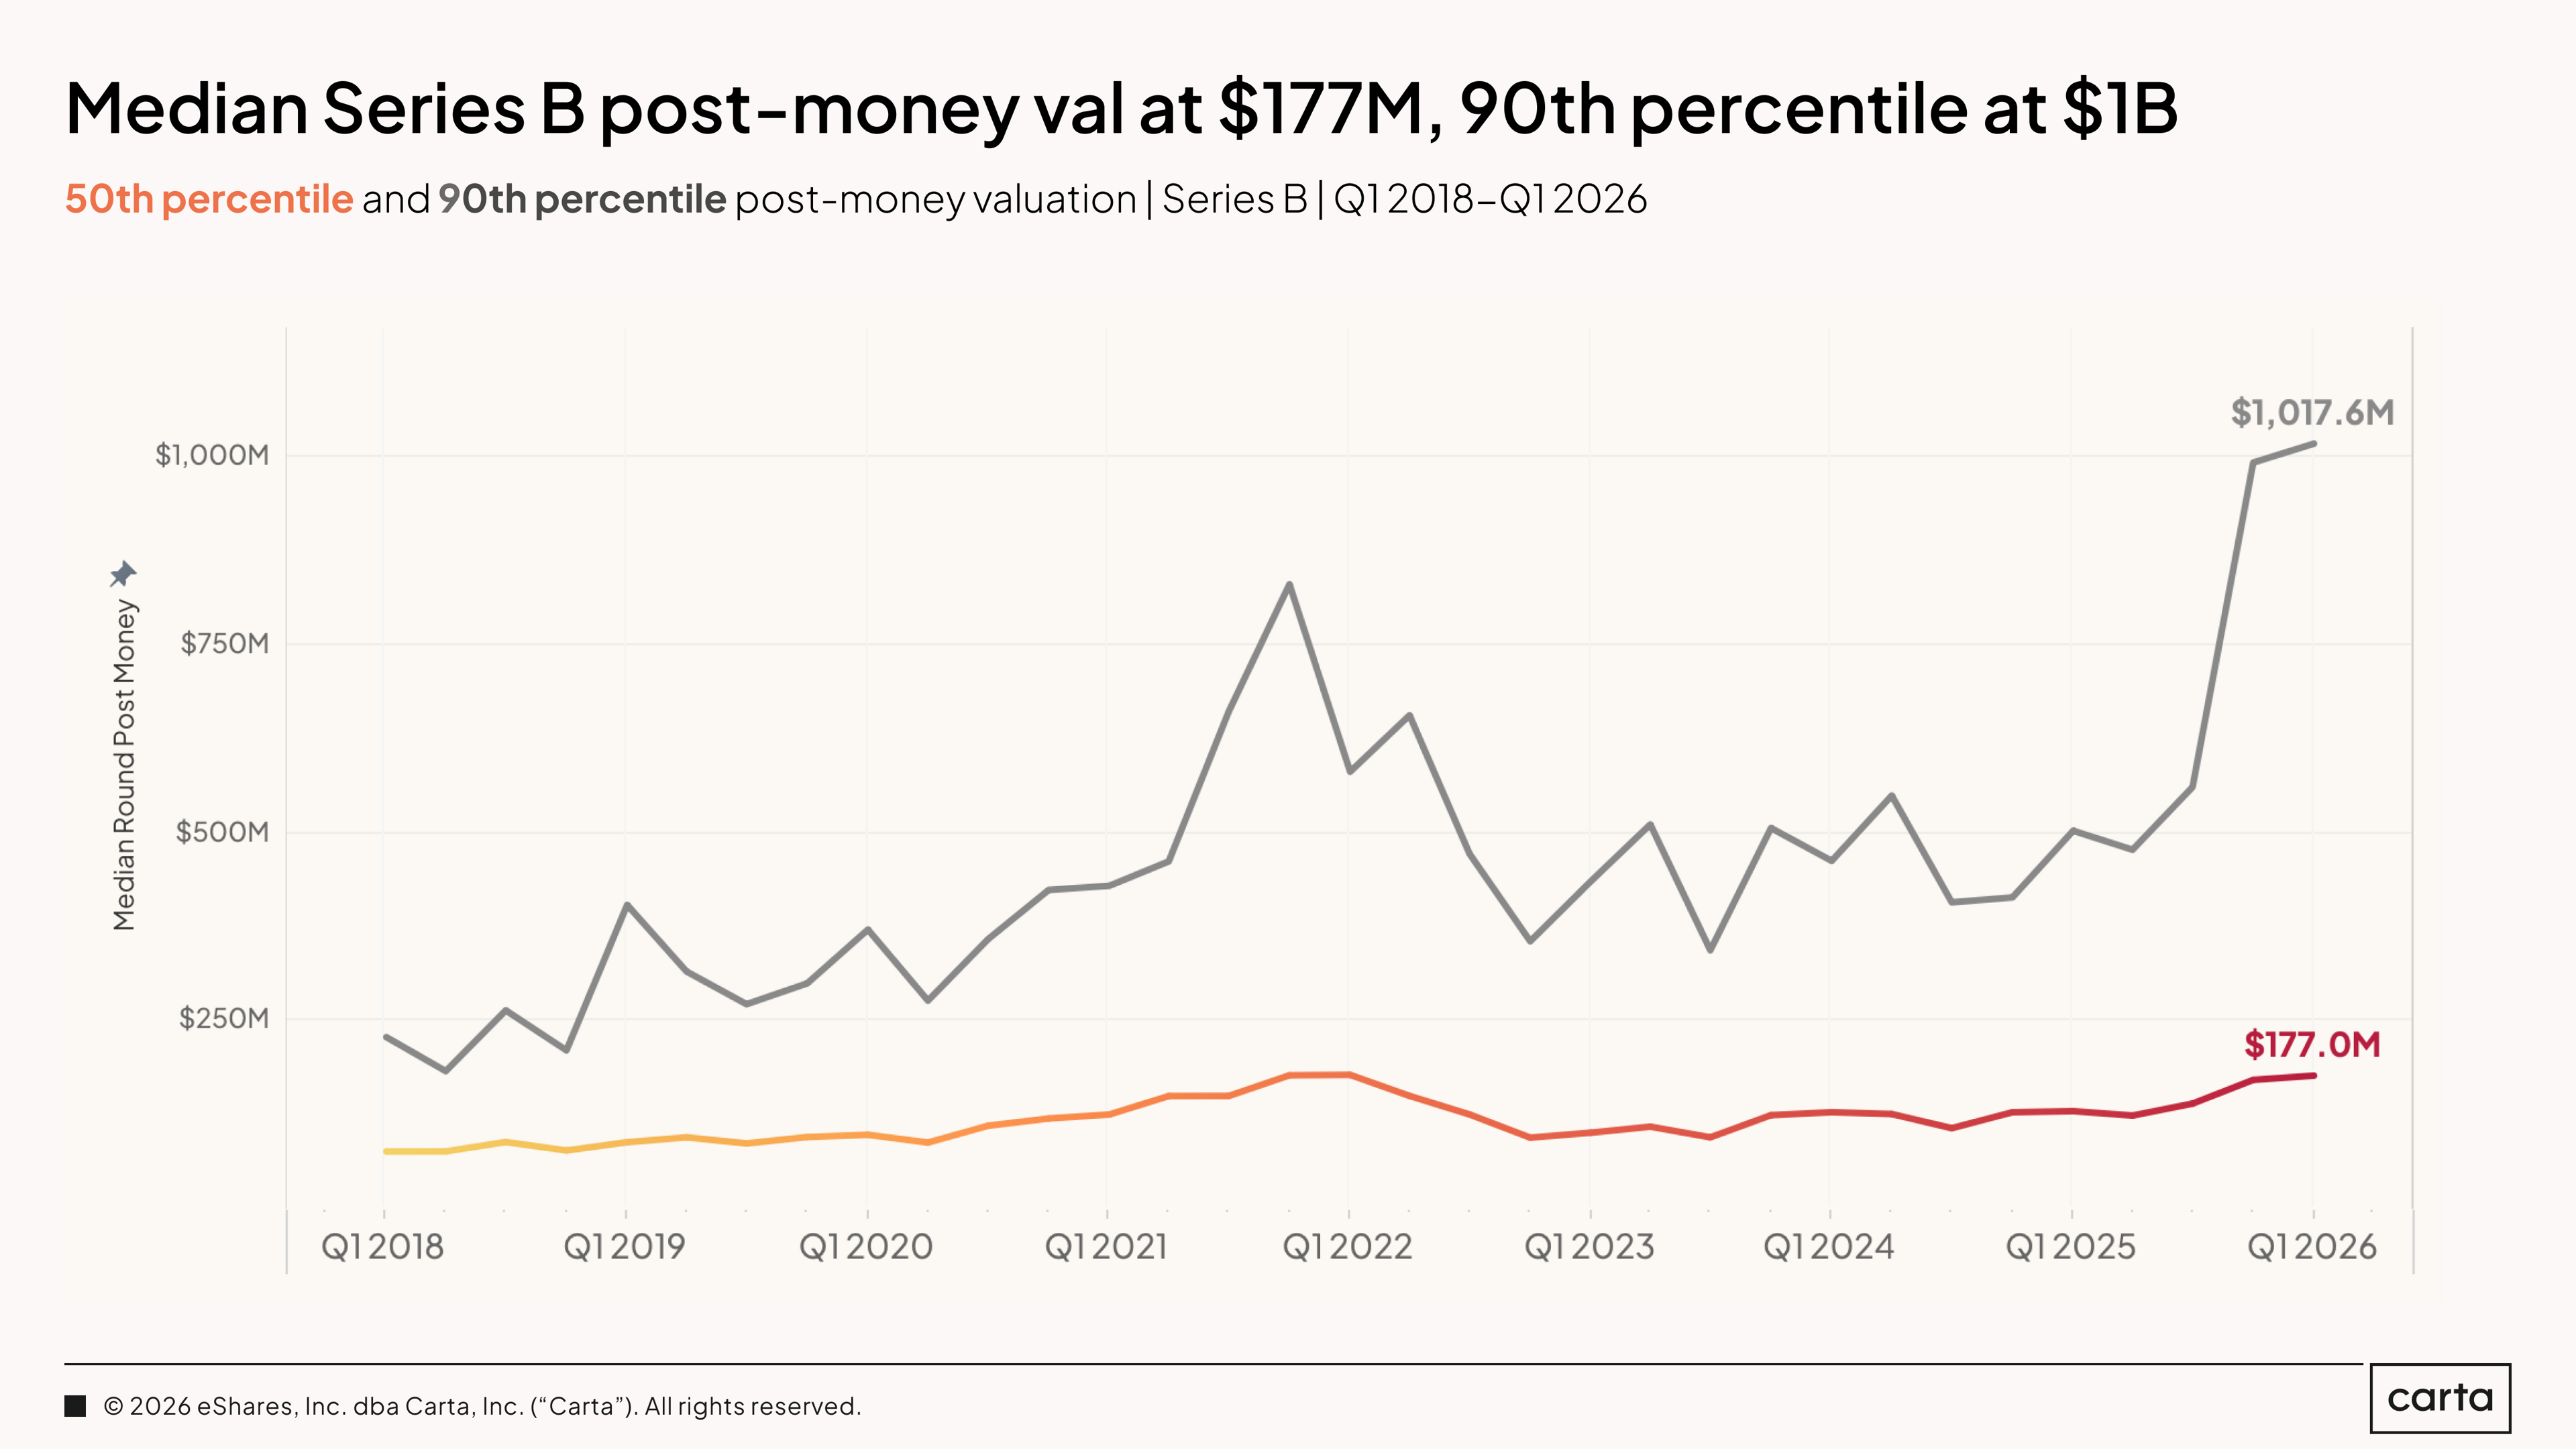
The median Series B post-money valuation came in at $177 million in Q1 2026, up meaningfully from recent quarters and continuing the recovery that began in 2024. The 90th percentile crossed $1 billion in Q1 for the first time in the history of this dataset. That threshold matters psychologically as much as statistically. A Series B round in the top decile is now a billion-dollar company by post-money valuation. Three years ago, that was a Series D outcome.
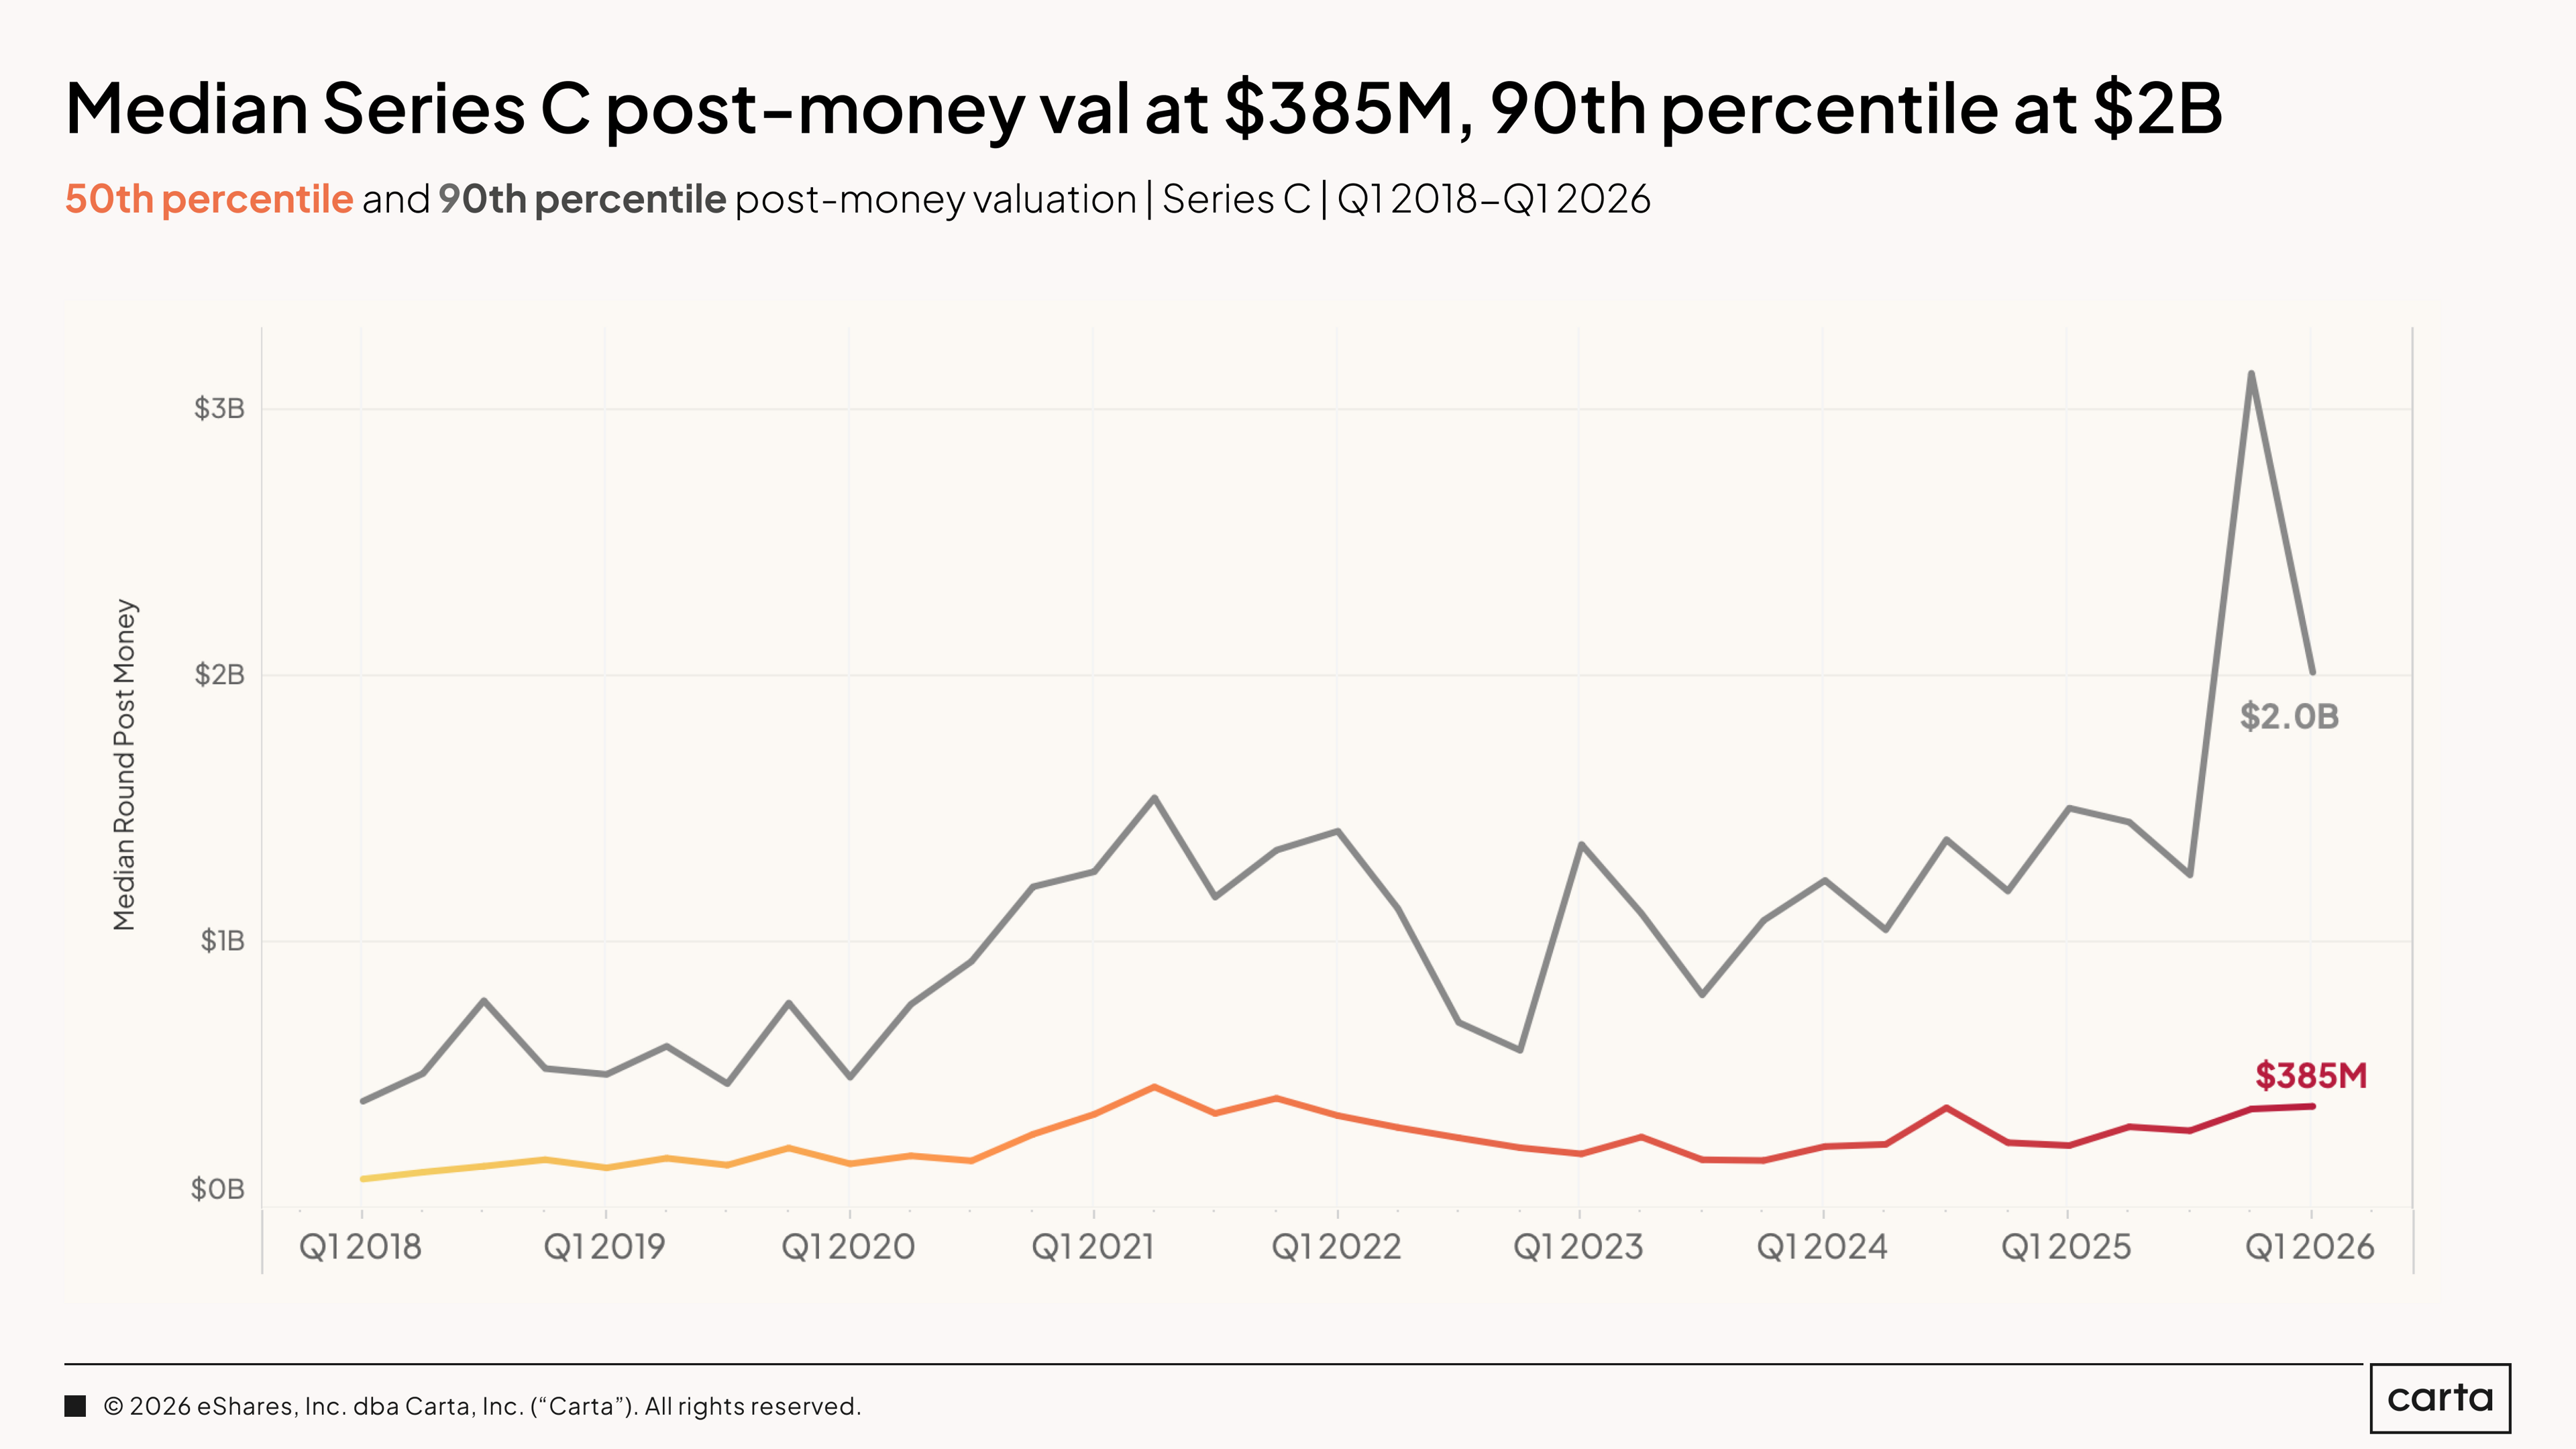
The median Series C post-money valuation was $385 million in Q1 2026, the highest recorded in this dataset. This continues a trend of steady appreciation since 2023. The 90th percentile for Series C valuations spiked sharply in Q4 2025 before settling back to $2 billion in Q1, reflecting the impact of a small number of very large rounds at the top of the market. The range between the 25th percentile ($124.9 million) and the 75th percentile ($728 million) is wide.
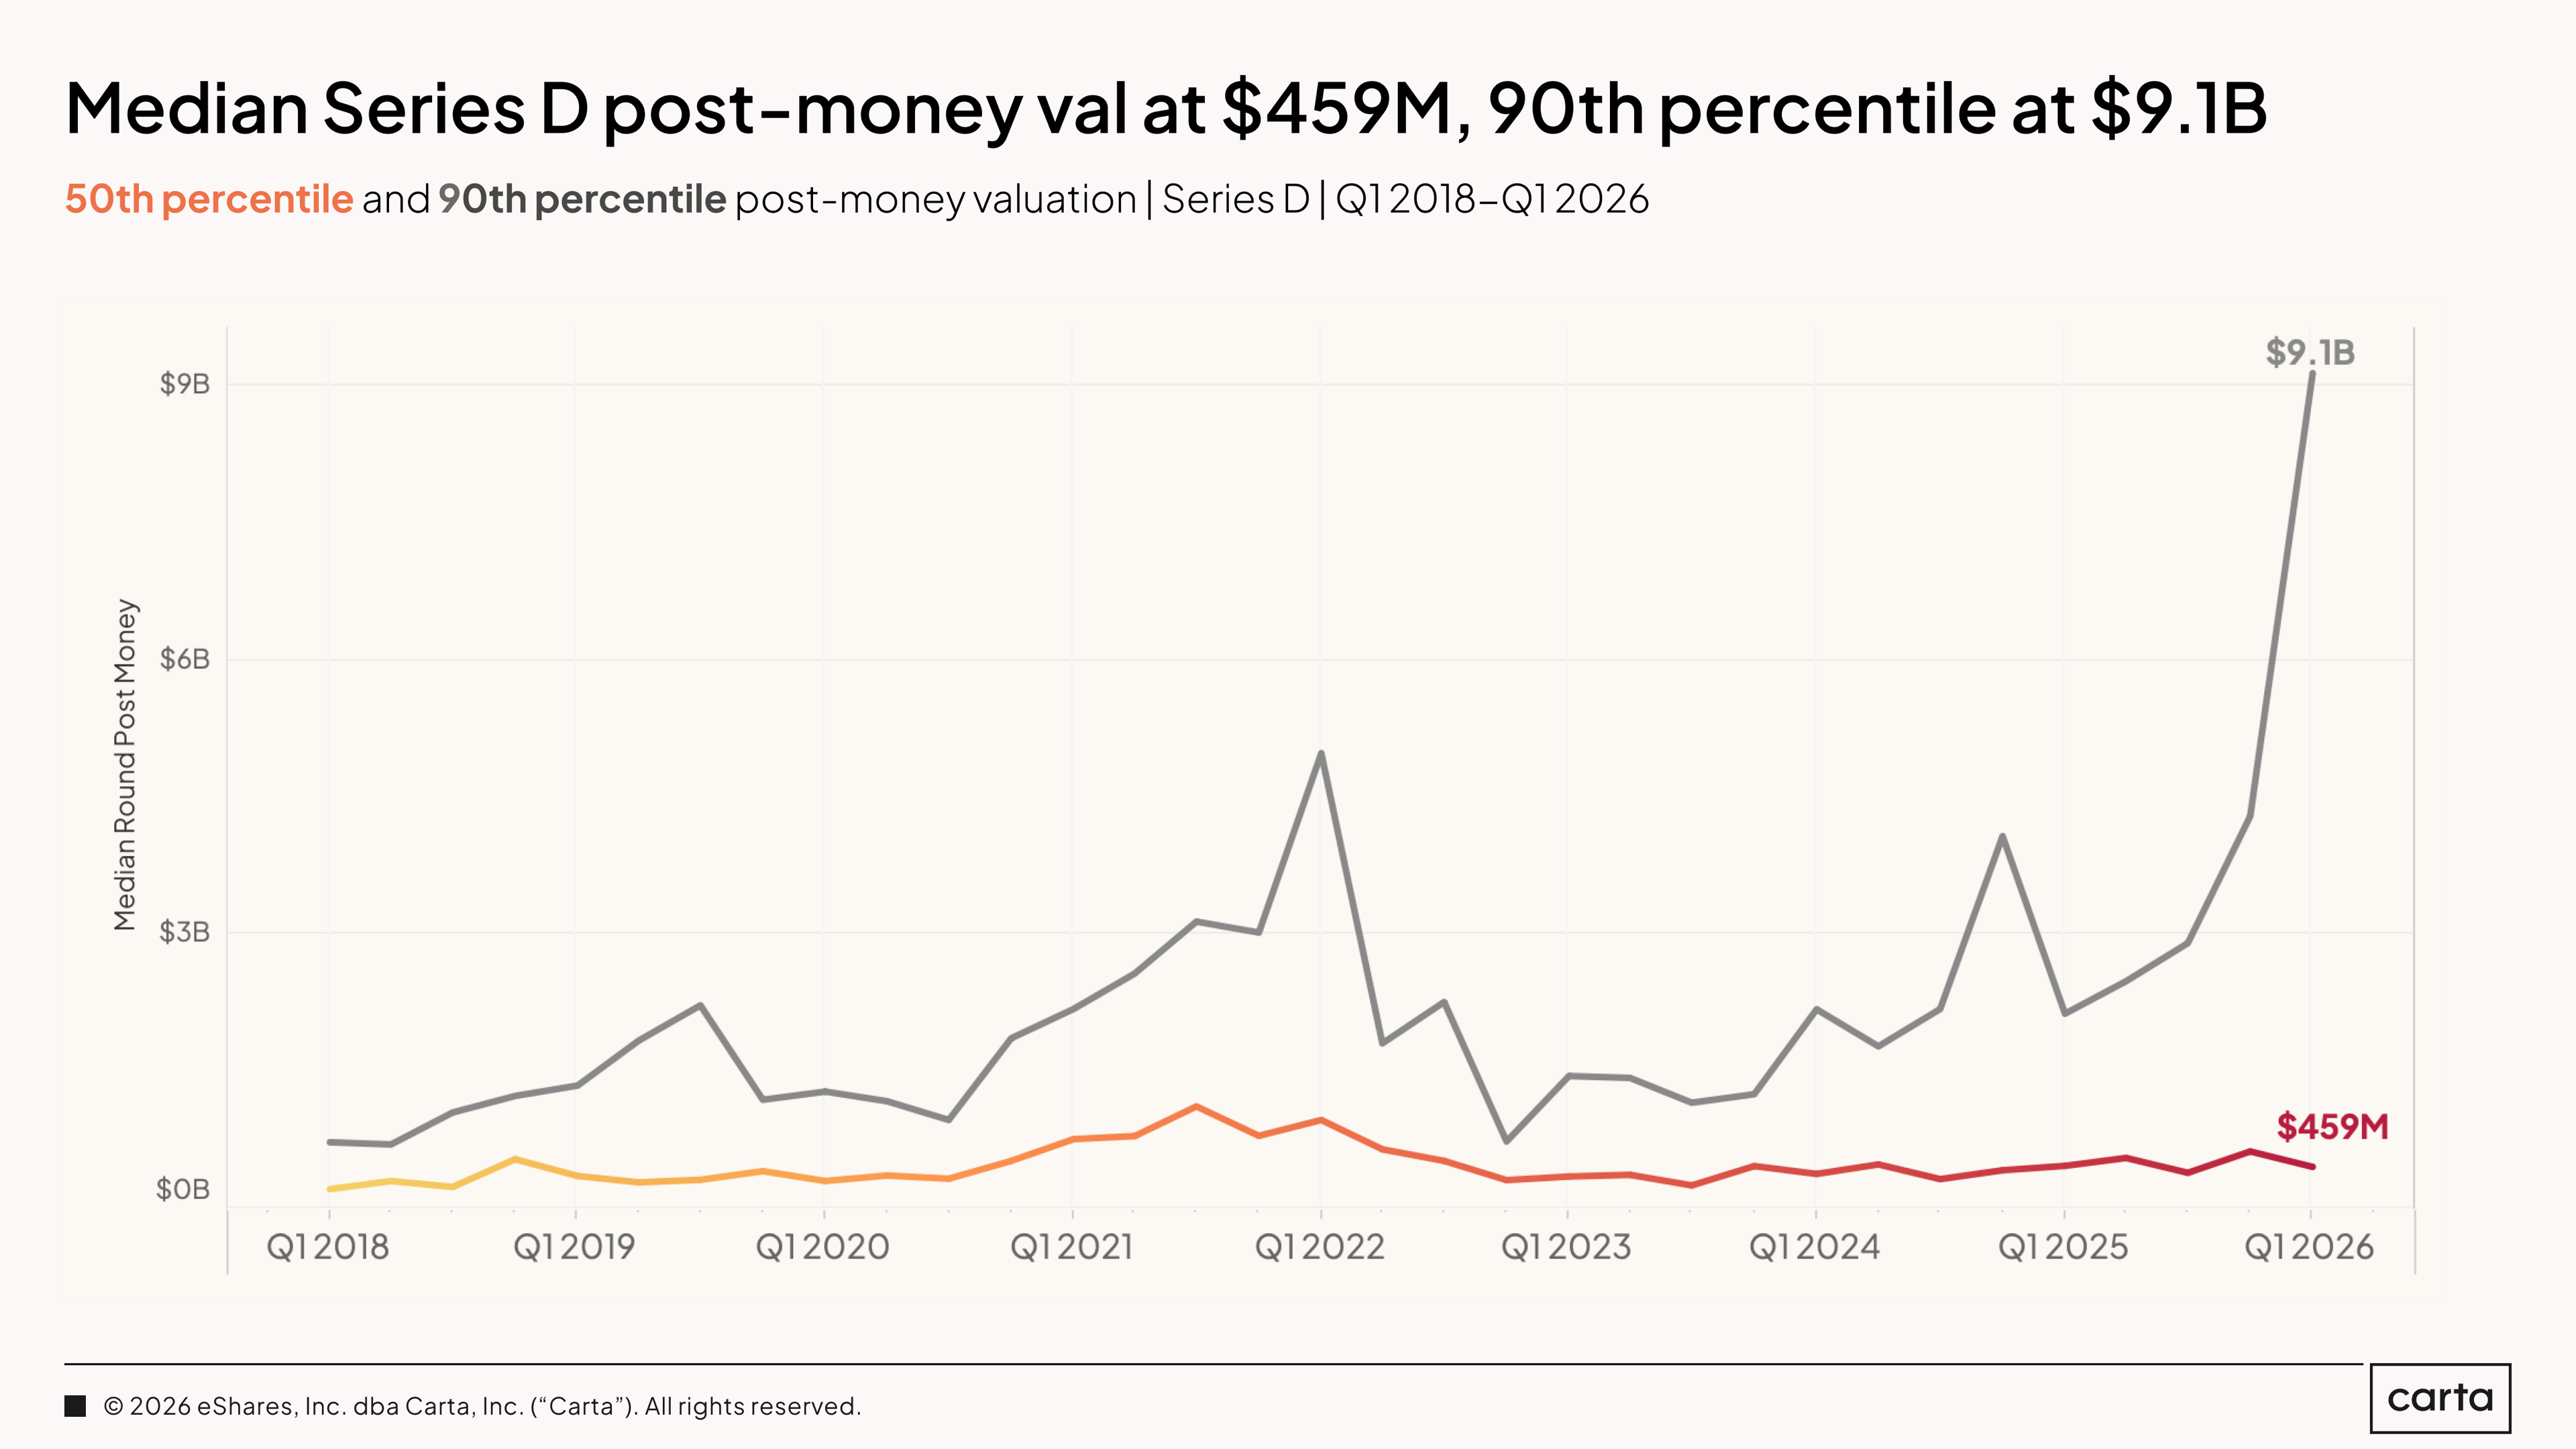
The median Series D post-money valuation was $459 million in Q1 2026, while the rolling median over the past 12 months was $540 million. The 90th percentile reached $9.1 billion in Q1, the highest figure ever recorded at Series D in the Carta dataset. This number reflects a handful of AI foundational model companies raising at extraordinary valuations. Strip them out, and the picture at Series D is strong, but not extreme.
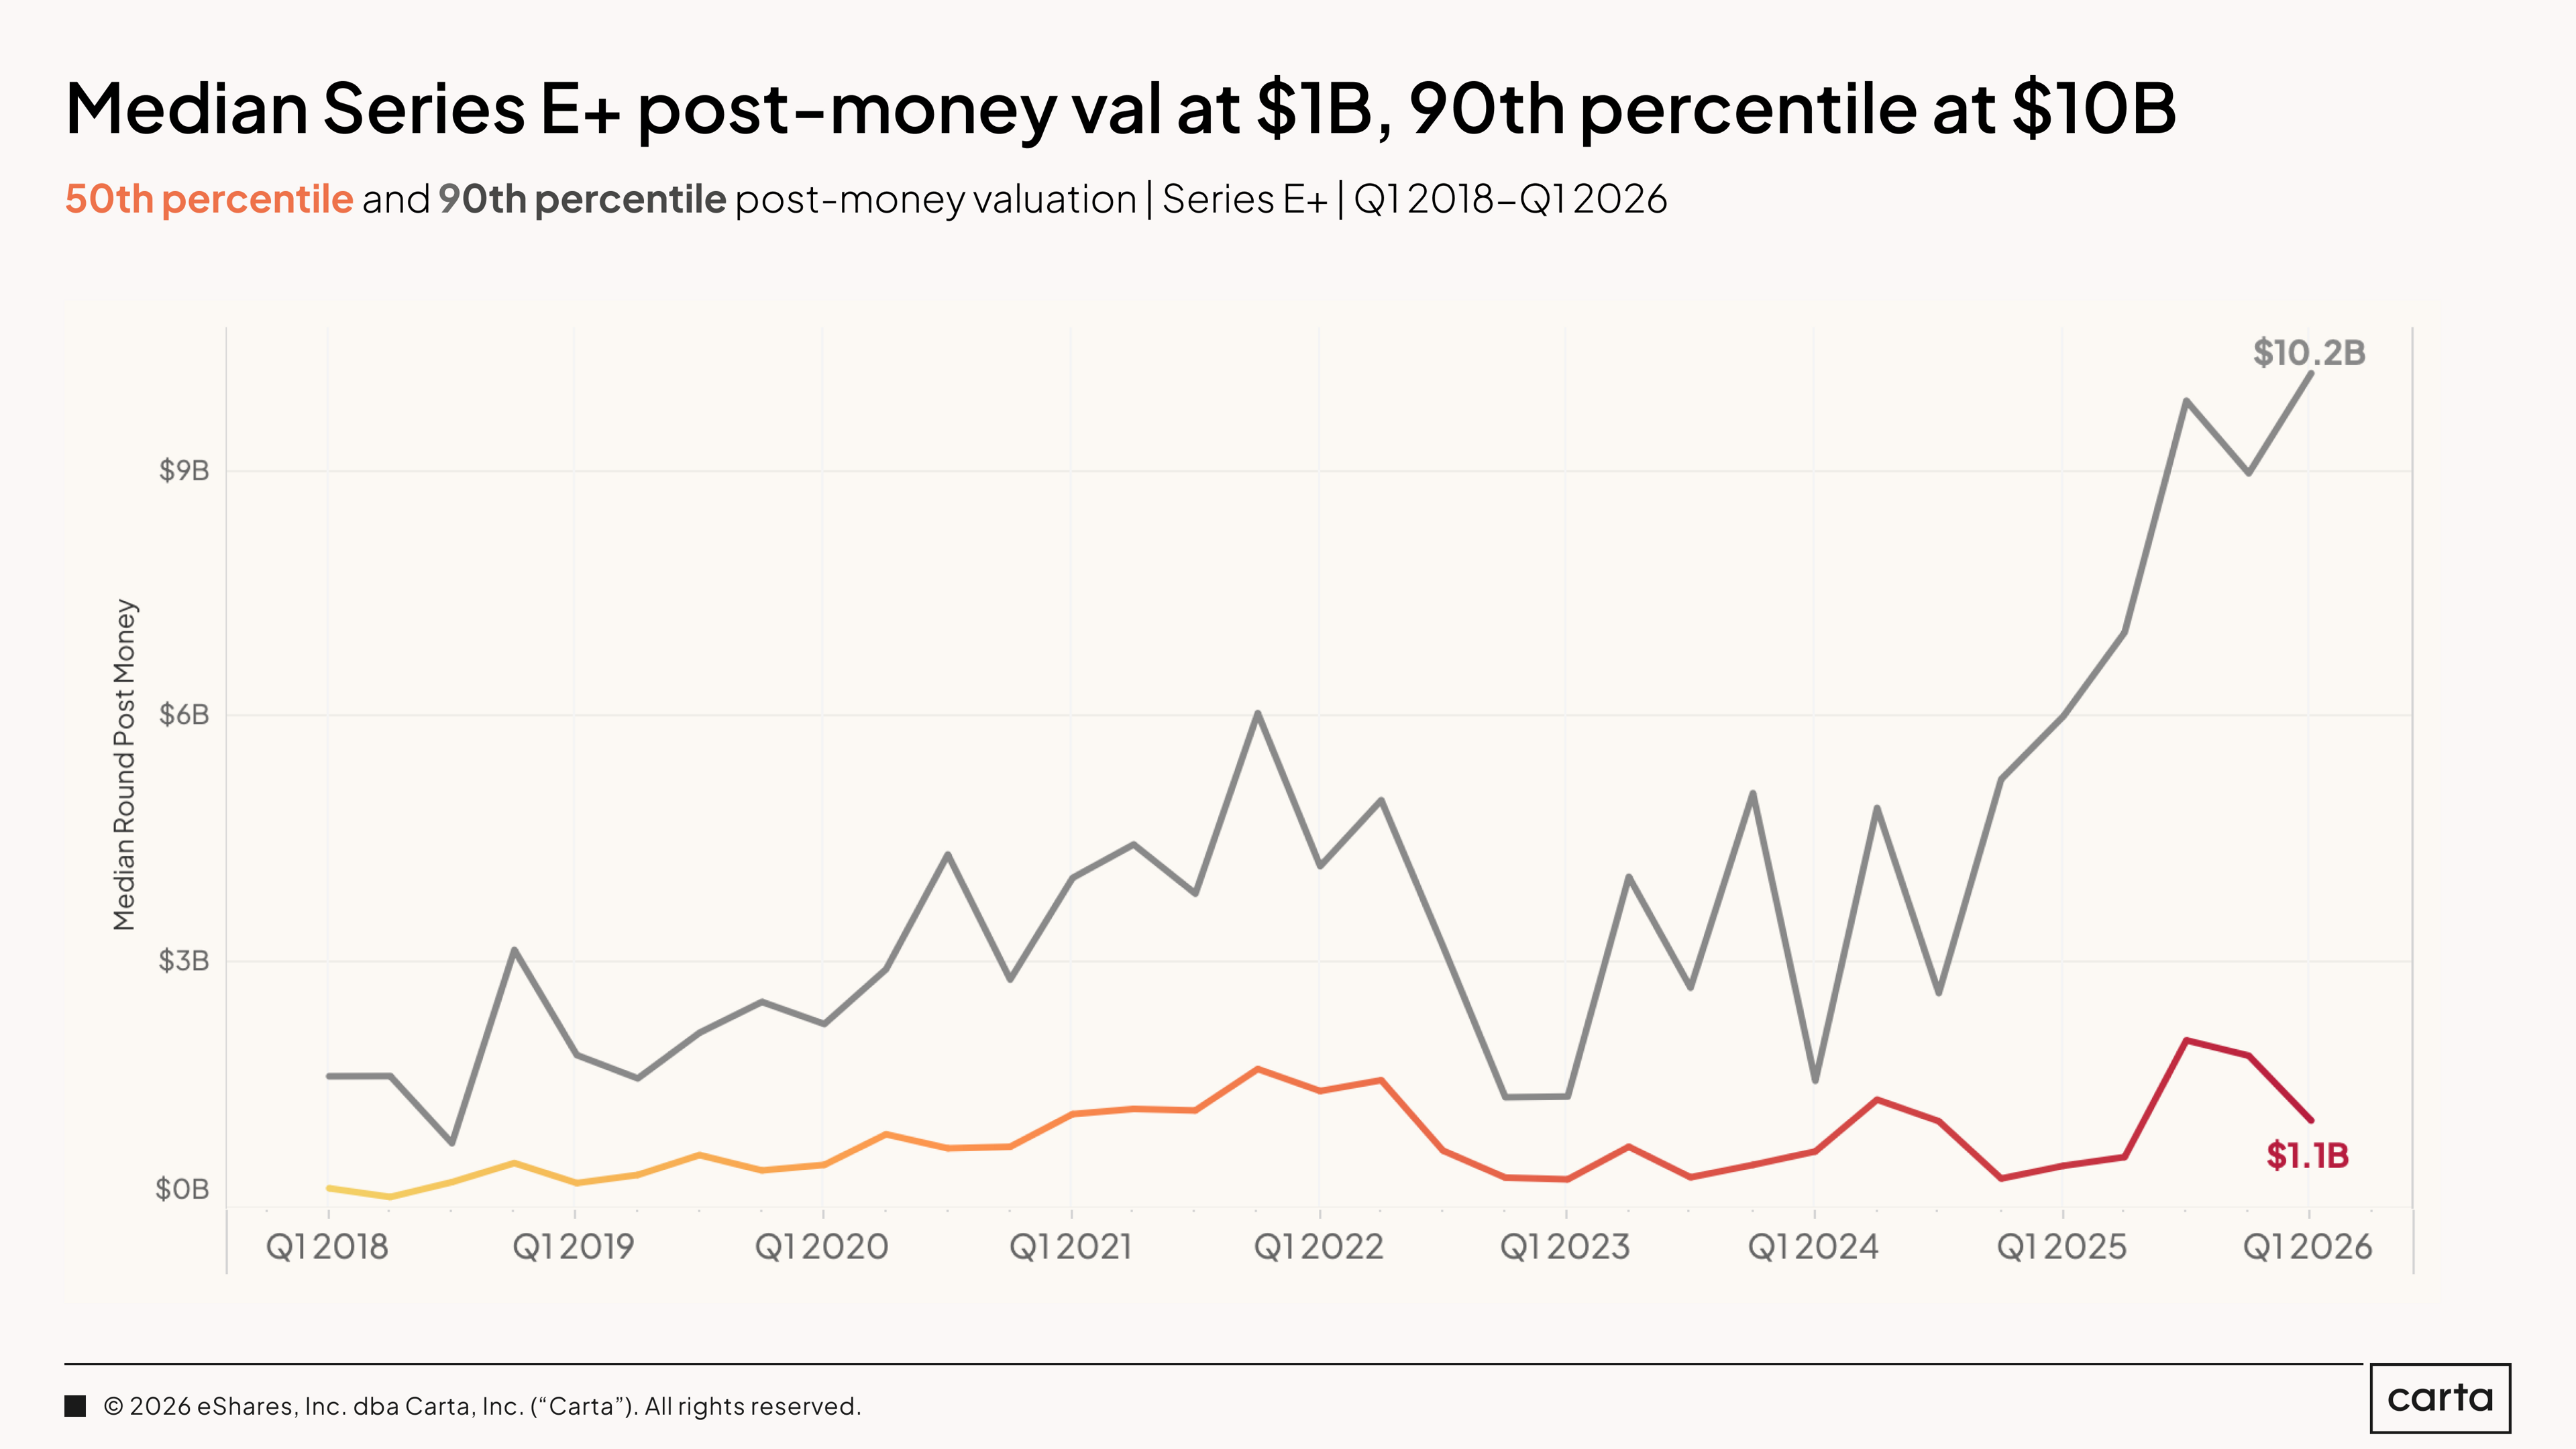
The median Series E+ post-money valuation was $1.1 billion in Q1 2026. The 90th percentile hit $10.2 billion. As is the case at several other stages, the latter figure is at an all-time high for this dataset.
What the above chart shows most clearly is the divergence between these two thresholds. The median line has been within a relatively narrow range for years, hovering well below $2 billion even during the 2021 peak, while the 90th percentile has broken sharply upward in the past six quarters. Late-stage venture is increasingly a two-tiered market. The companies in the top decile are raising at valuations that have no precedent in this data.
AI and foundational models
The AI story in venture is no longer about whether AI is dominant. It is. The question now is which kind of AI, and what that distinction means for how capital is being priced and deployed.
This section breaks the market into three categories: non-AI companies, AI applied companies building products and workflows on top of existing models, and AI foundational model companies training the models themselves. The differences between these three groups in terms of how they raise, at what valuations, and on what terms can be significant.
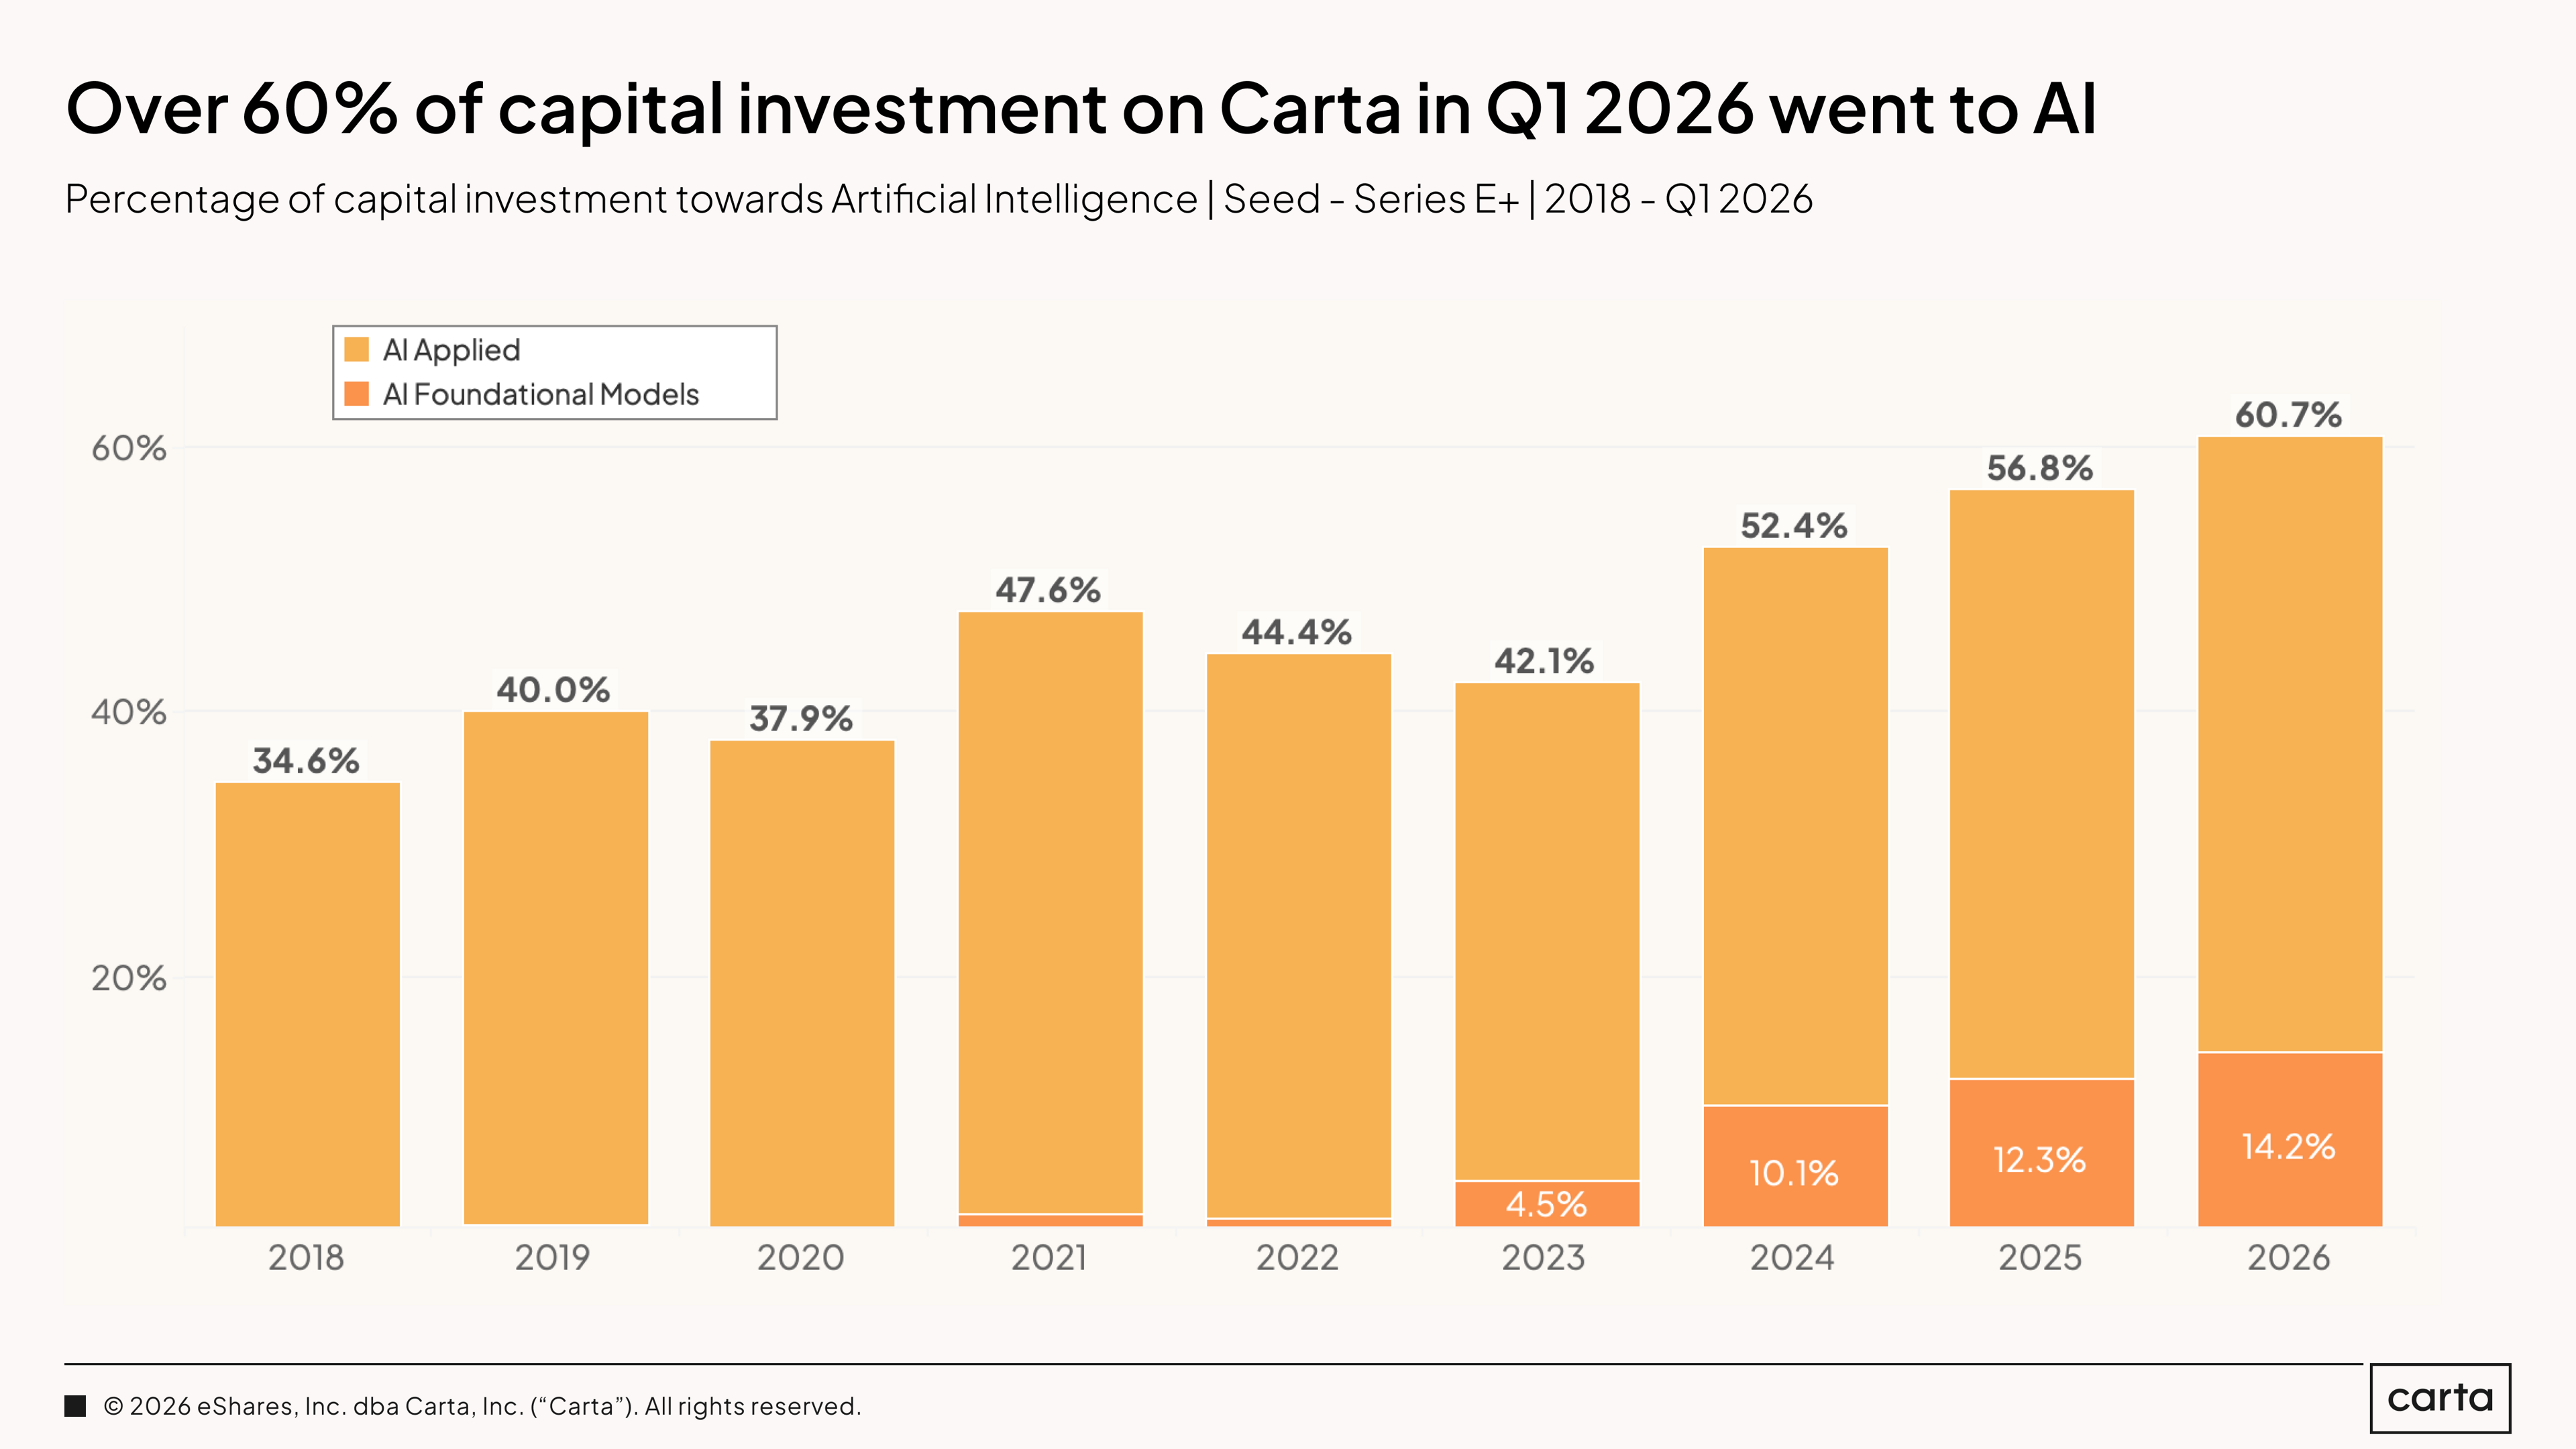
60.7% of all capital invested on Carta in Q1 2026 went to AI companies. That's up from 56.8% in 2025, 52.4% in 2024, and 42.1% in 2023. The trajectory is consistent.
Within AI, the foundational model segment is driving some of the acceleration. AI foundational model companies received 14.2% of total capital in Q1, up from 12.3% in full-year 2025 and 10.1% in 2024. The infrastructure layer of AI is attracting a growing share of the capital that's already massively concentrated in AI overall.
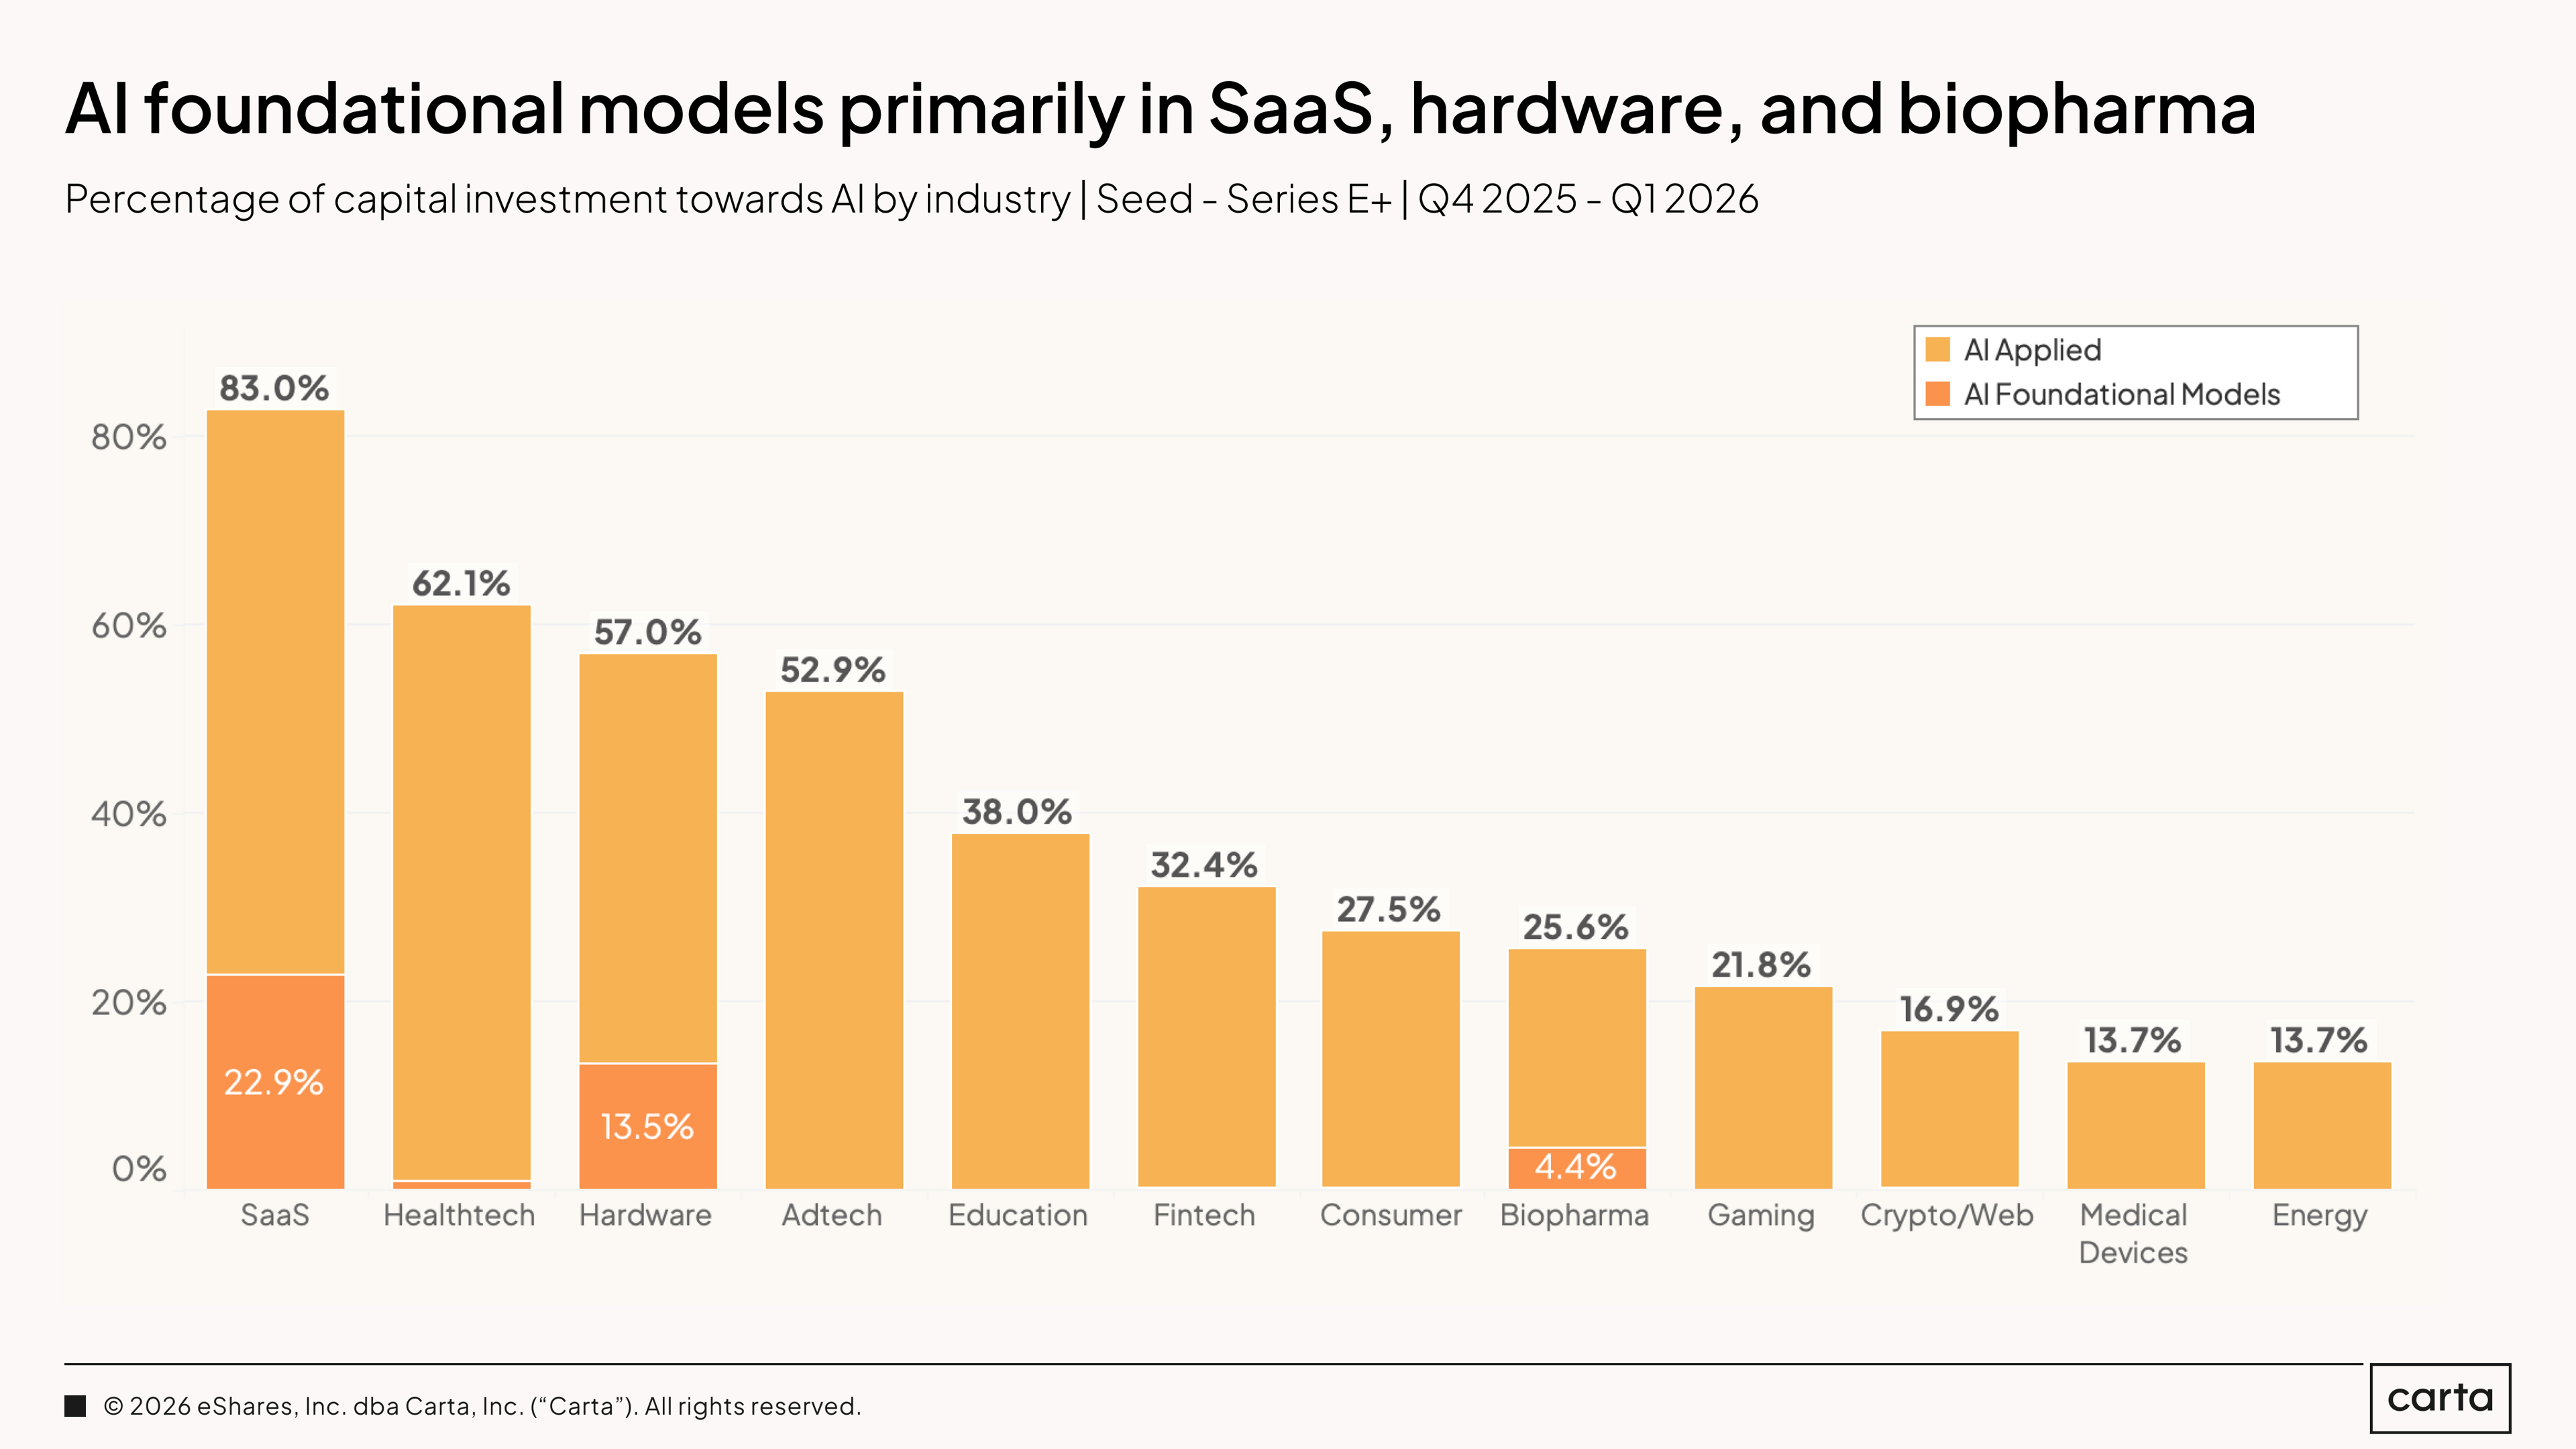
In SaaS, 83% of capital raised on Carta went to AI companies across Q4 2025 and Q1 2026. AI companies accounted for another 62.1% of capital raised in healthtech, 57% in hardware, and 52.9% in adtech. Nearly every major sector is being reshaped.
The foundational model segment has a concentrated footprint. It shows up most prominently in SaaS (22.9% of that sector's total capital), hardware (13.5%), and biopharma (4.4%). In most other industries, the majority of AI capital is applied AI, rather than foundational.
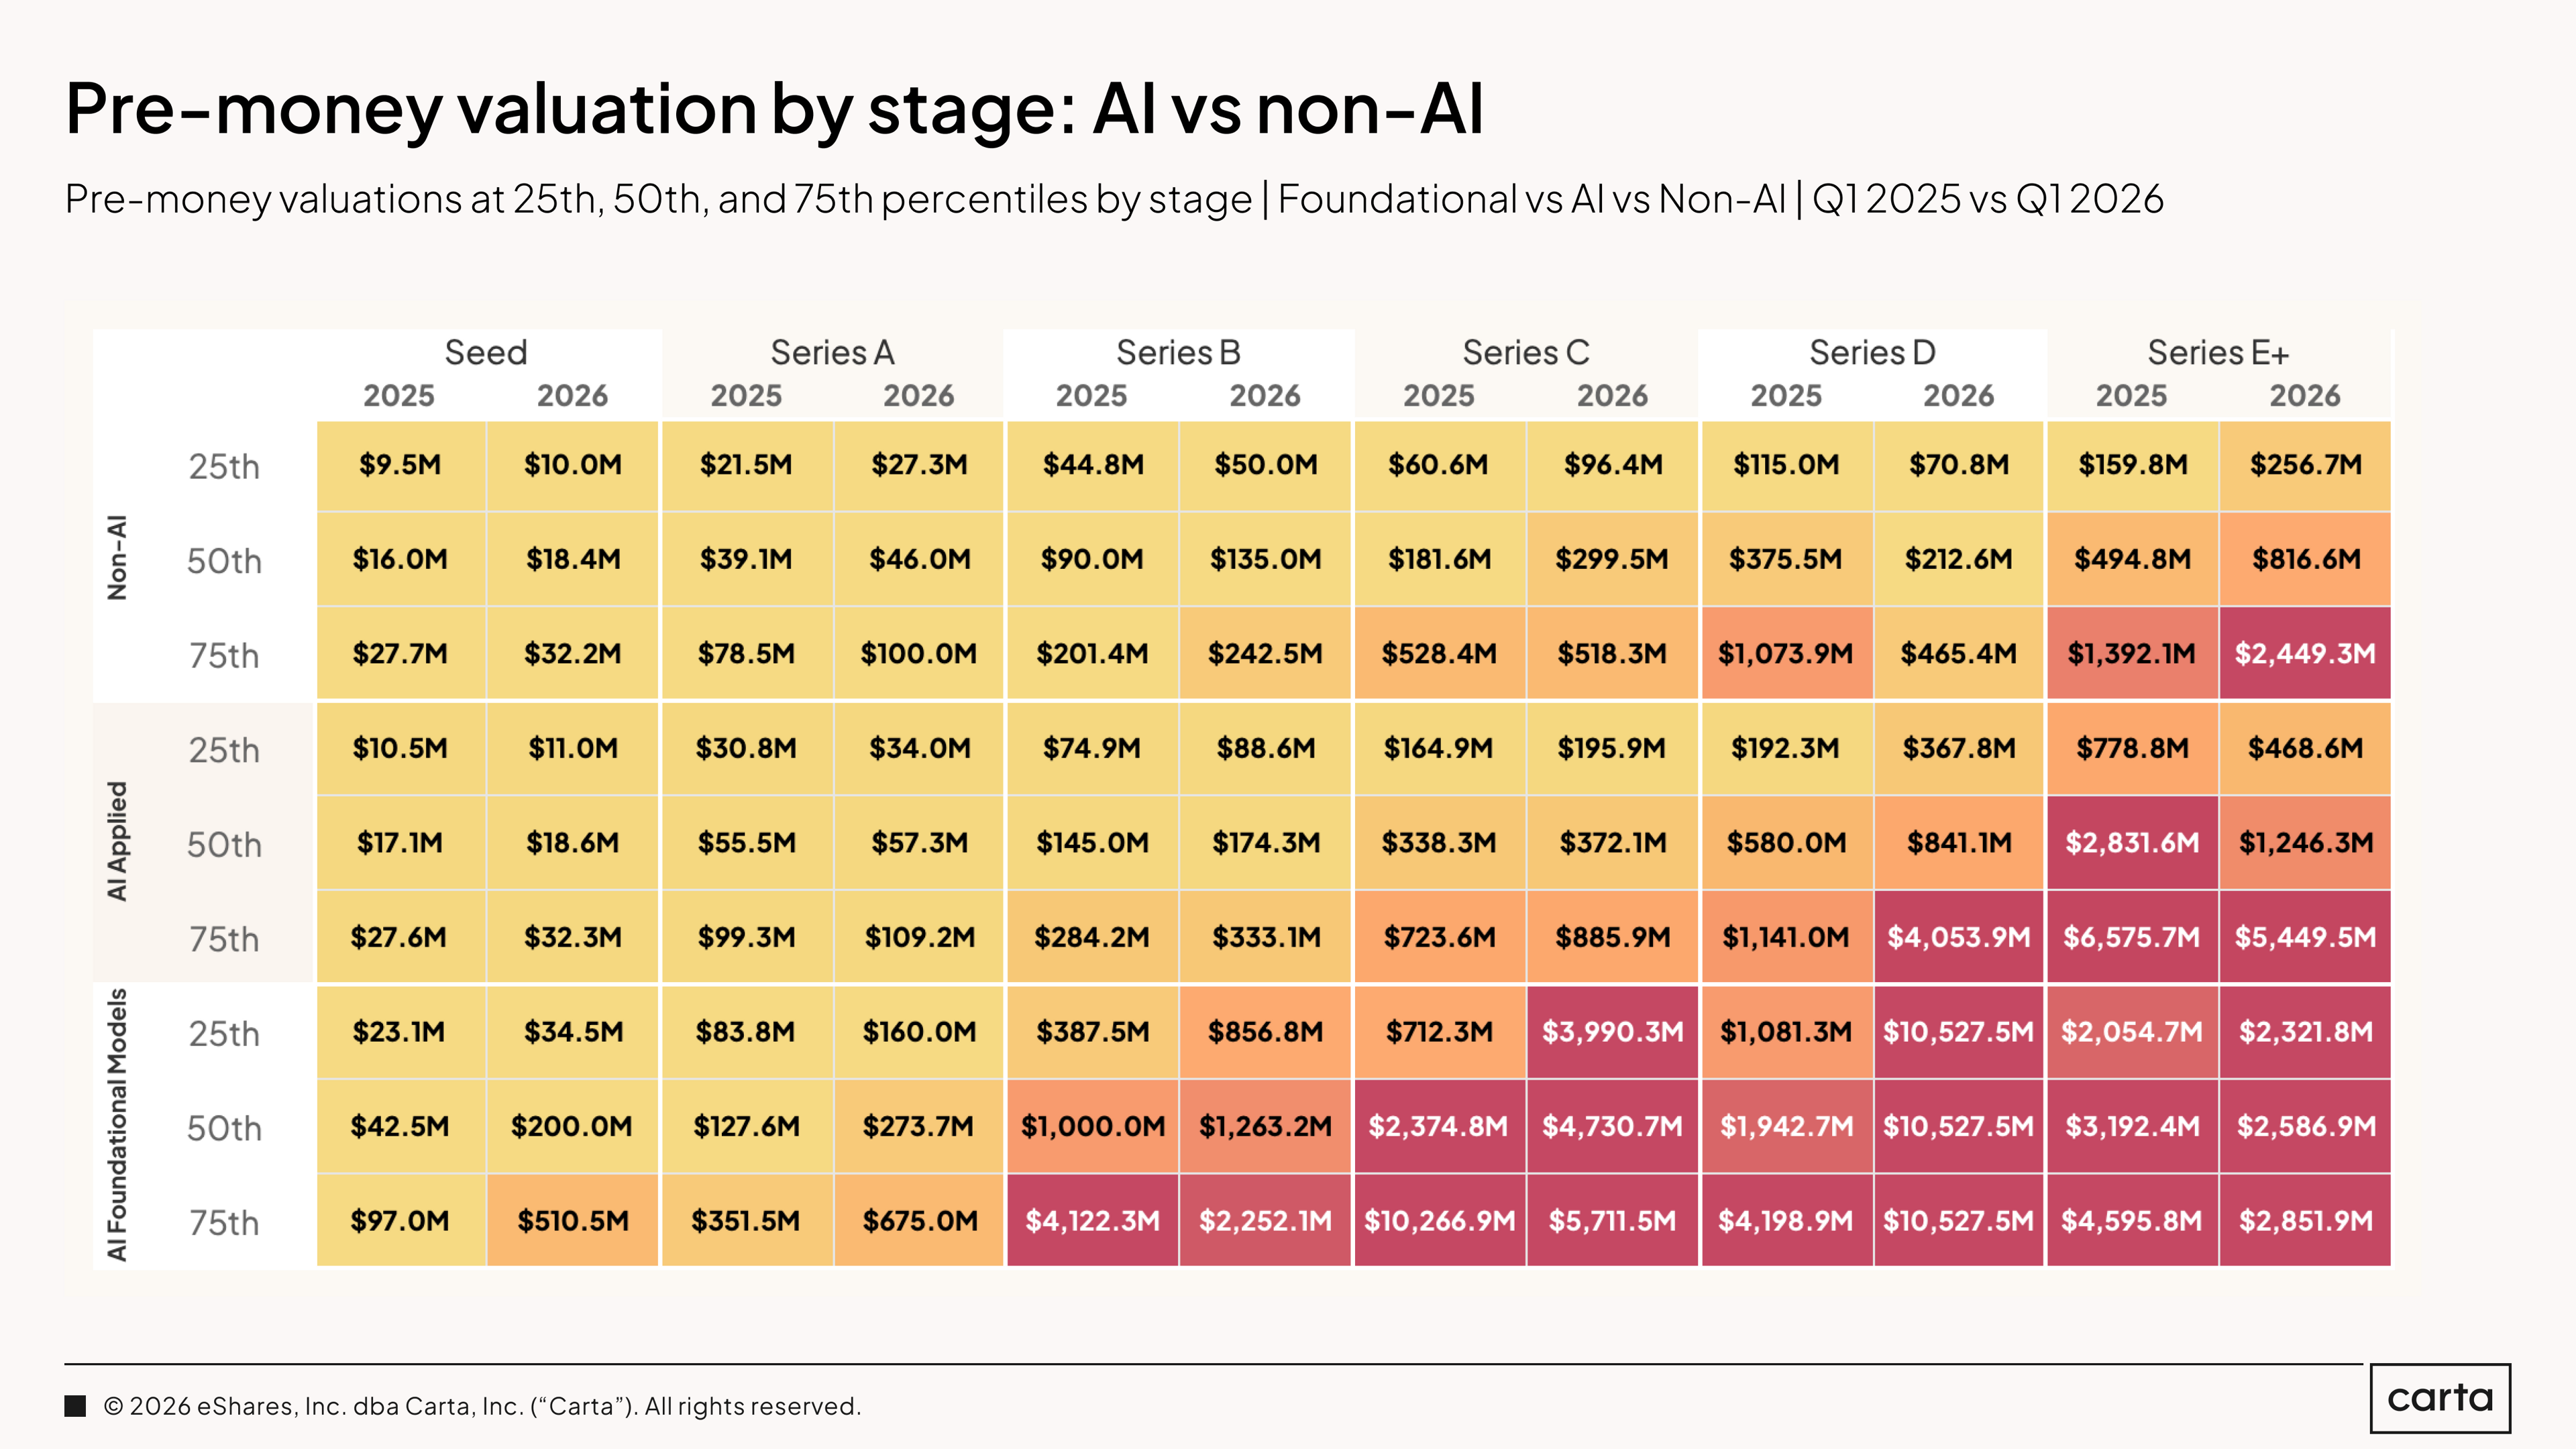
At seed, the distinction between non-AI and AI applied is still modest, but the foundational premium at seed is exceptional, driven by a growing number of highly priced startups.
At later stages, the valuation gap between foundational model AI and non-AI companies widened measurably in Q1 2026. At Series C, median AI applied valuation was 1.86x higher than median non-AI valuation in 2025, while in 2026 it's only 1.24x higher. Conversely, compared to last year the gap between non-AI and AI applied at most stages actually got smaller.
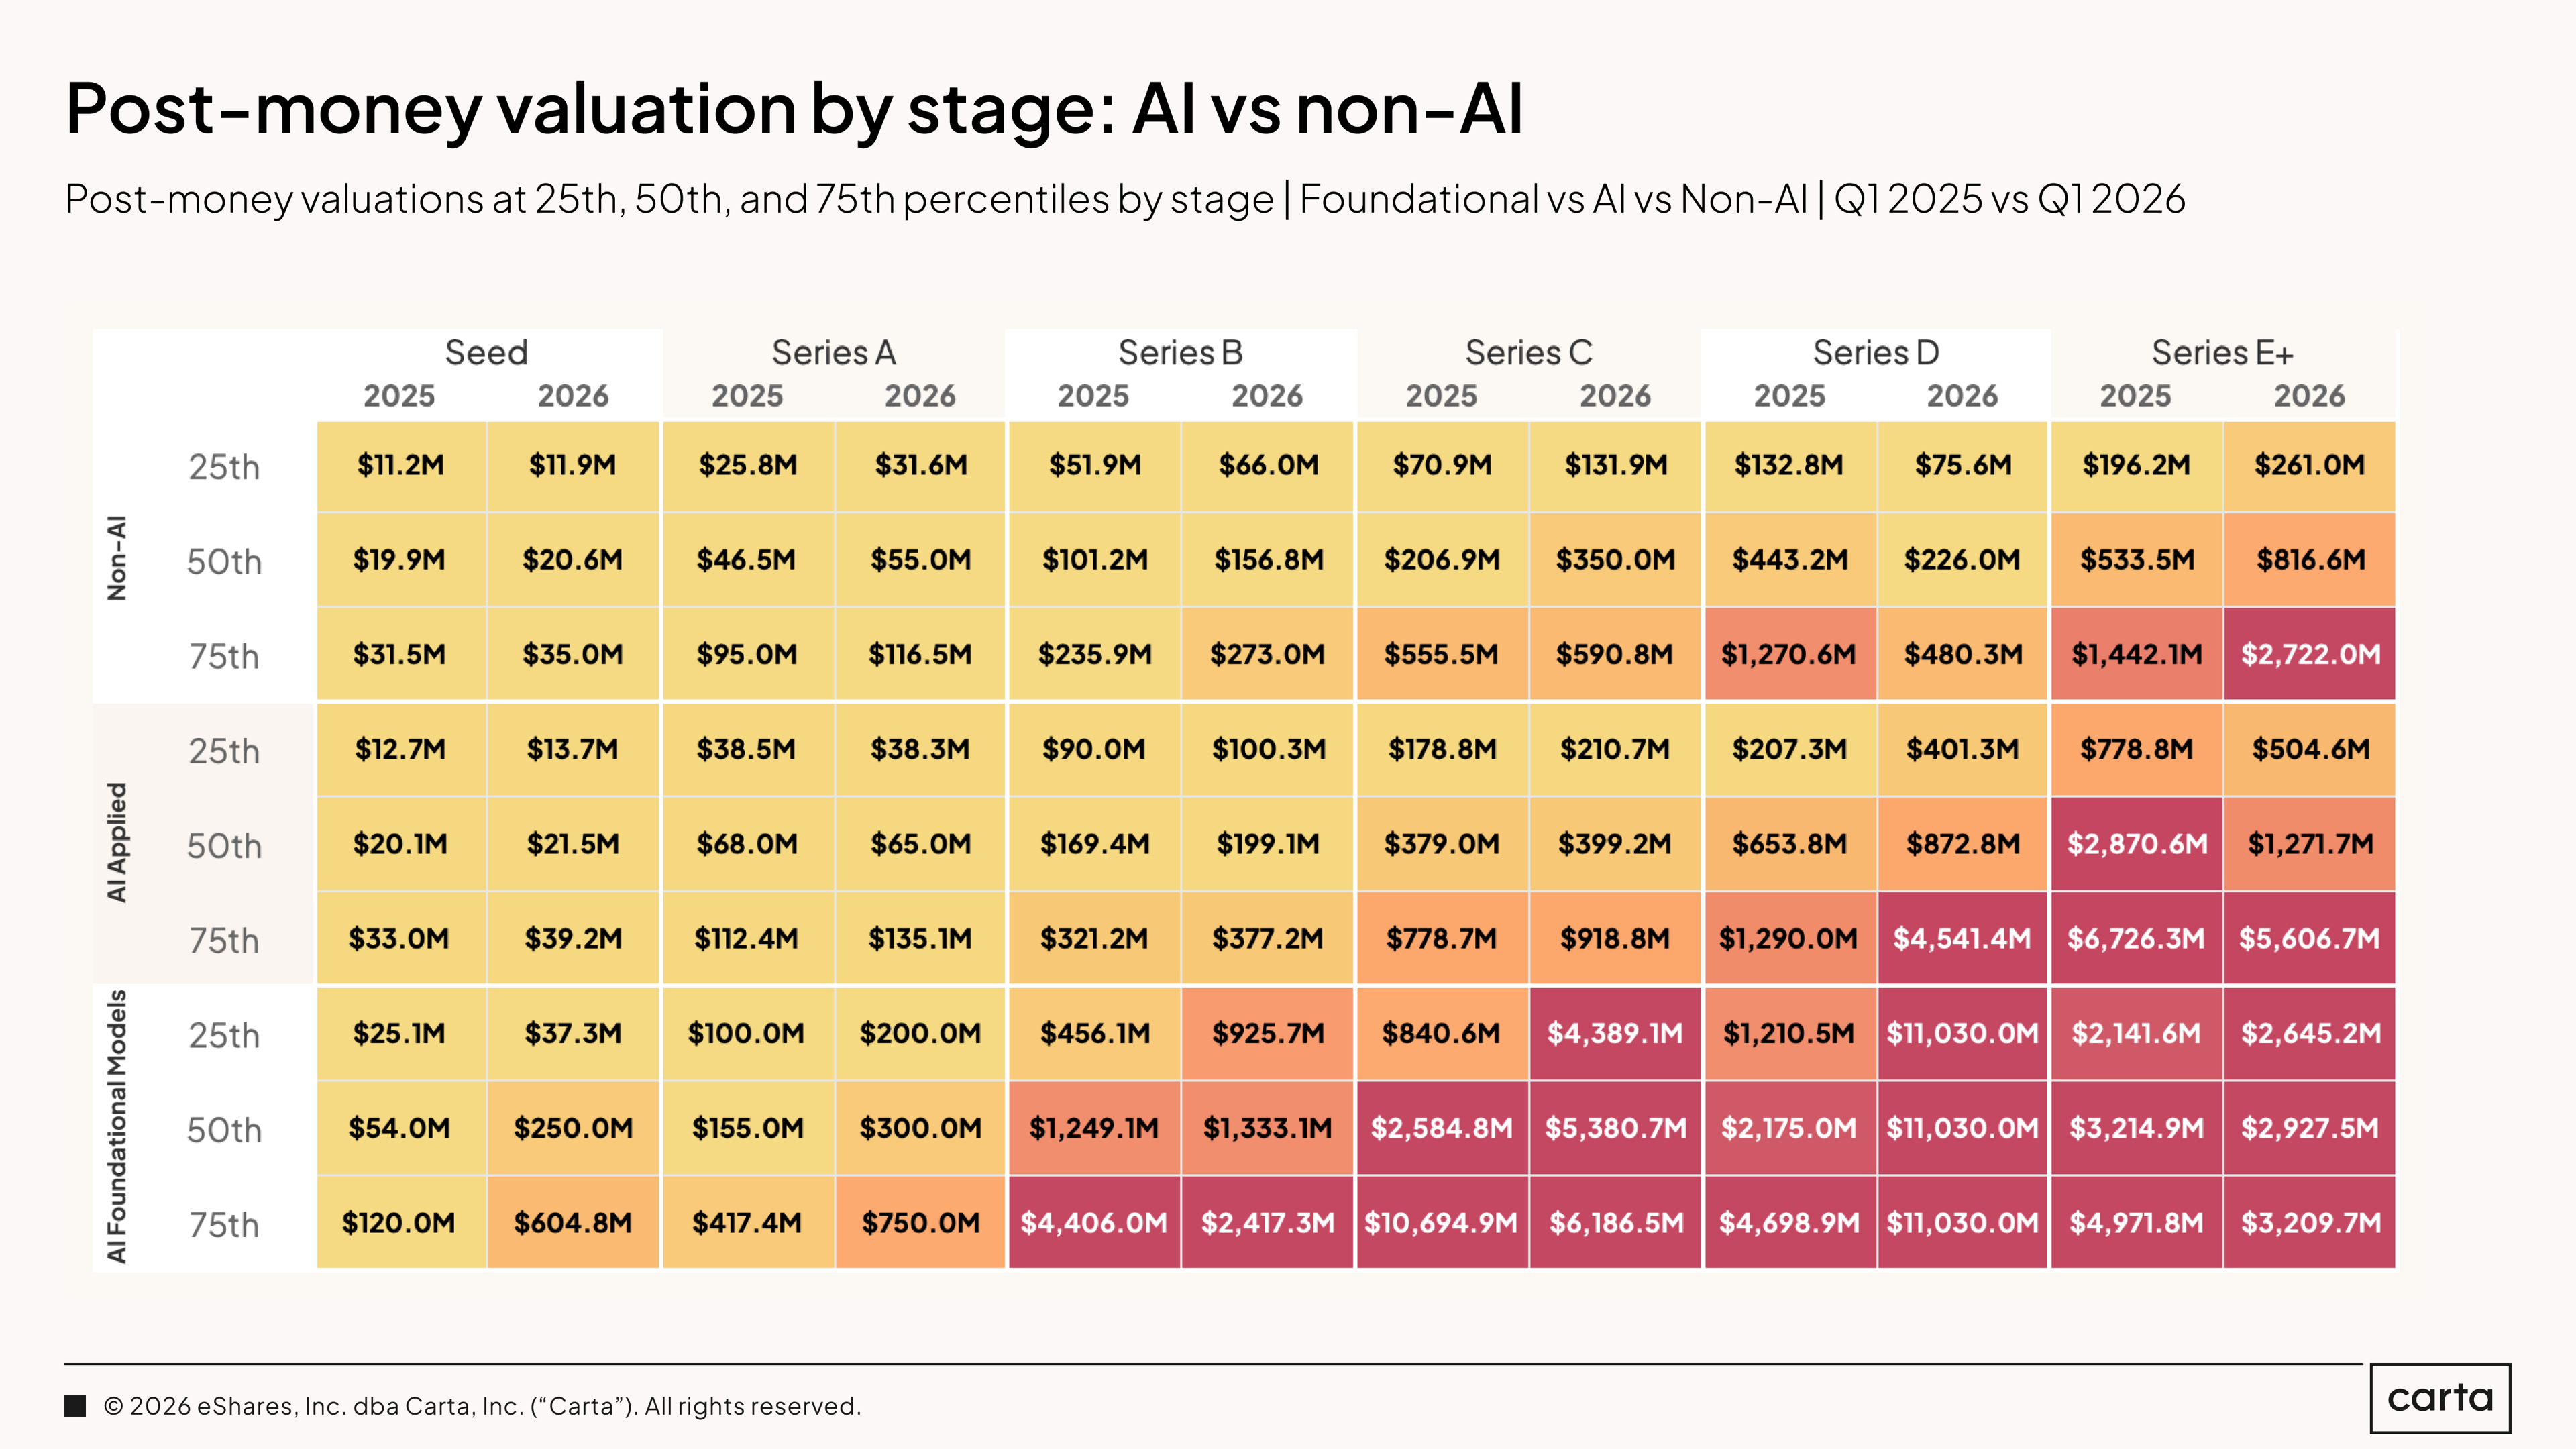
At Series A, the median non-AI post-money valuation on Carta was $55 million in Q1 2026. Among AI applied companies, it was $65 million, and among AI foundational companies, $300 million. The foundational premium has widened substantially relative to 2025, when the median post-money valuation for AI foundational companies was $155 million.
At later stages, especially Series C and Series D, the foundational model companies are operating above just a valuation premium.
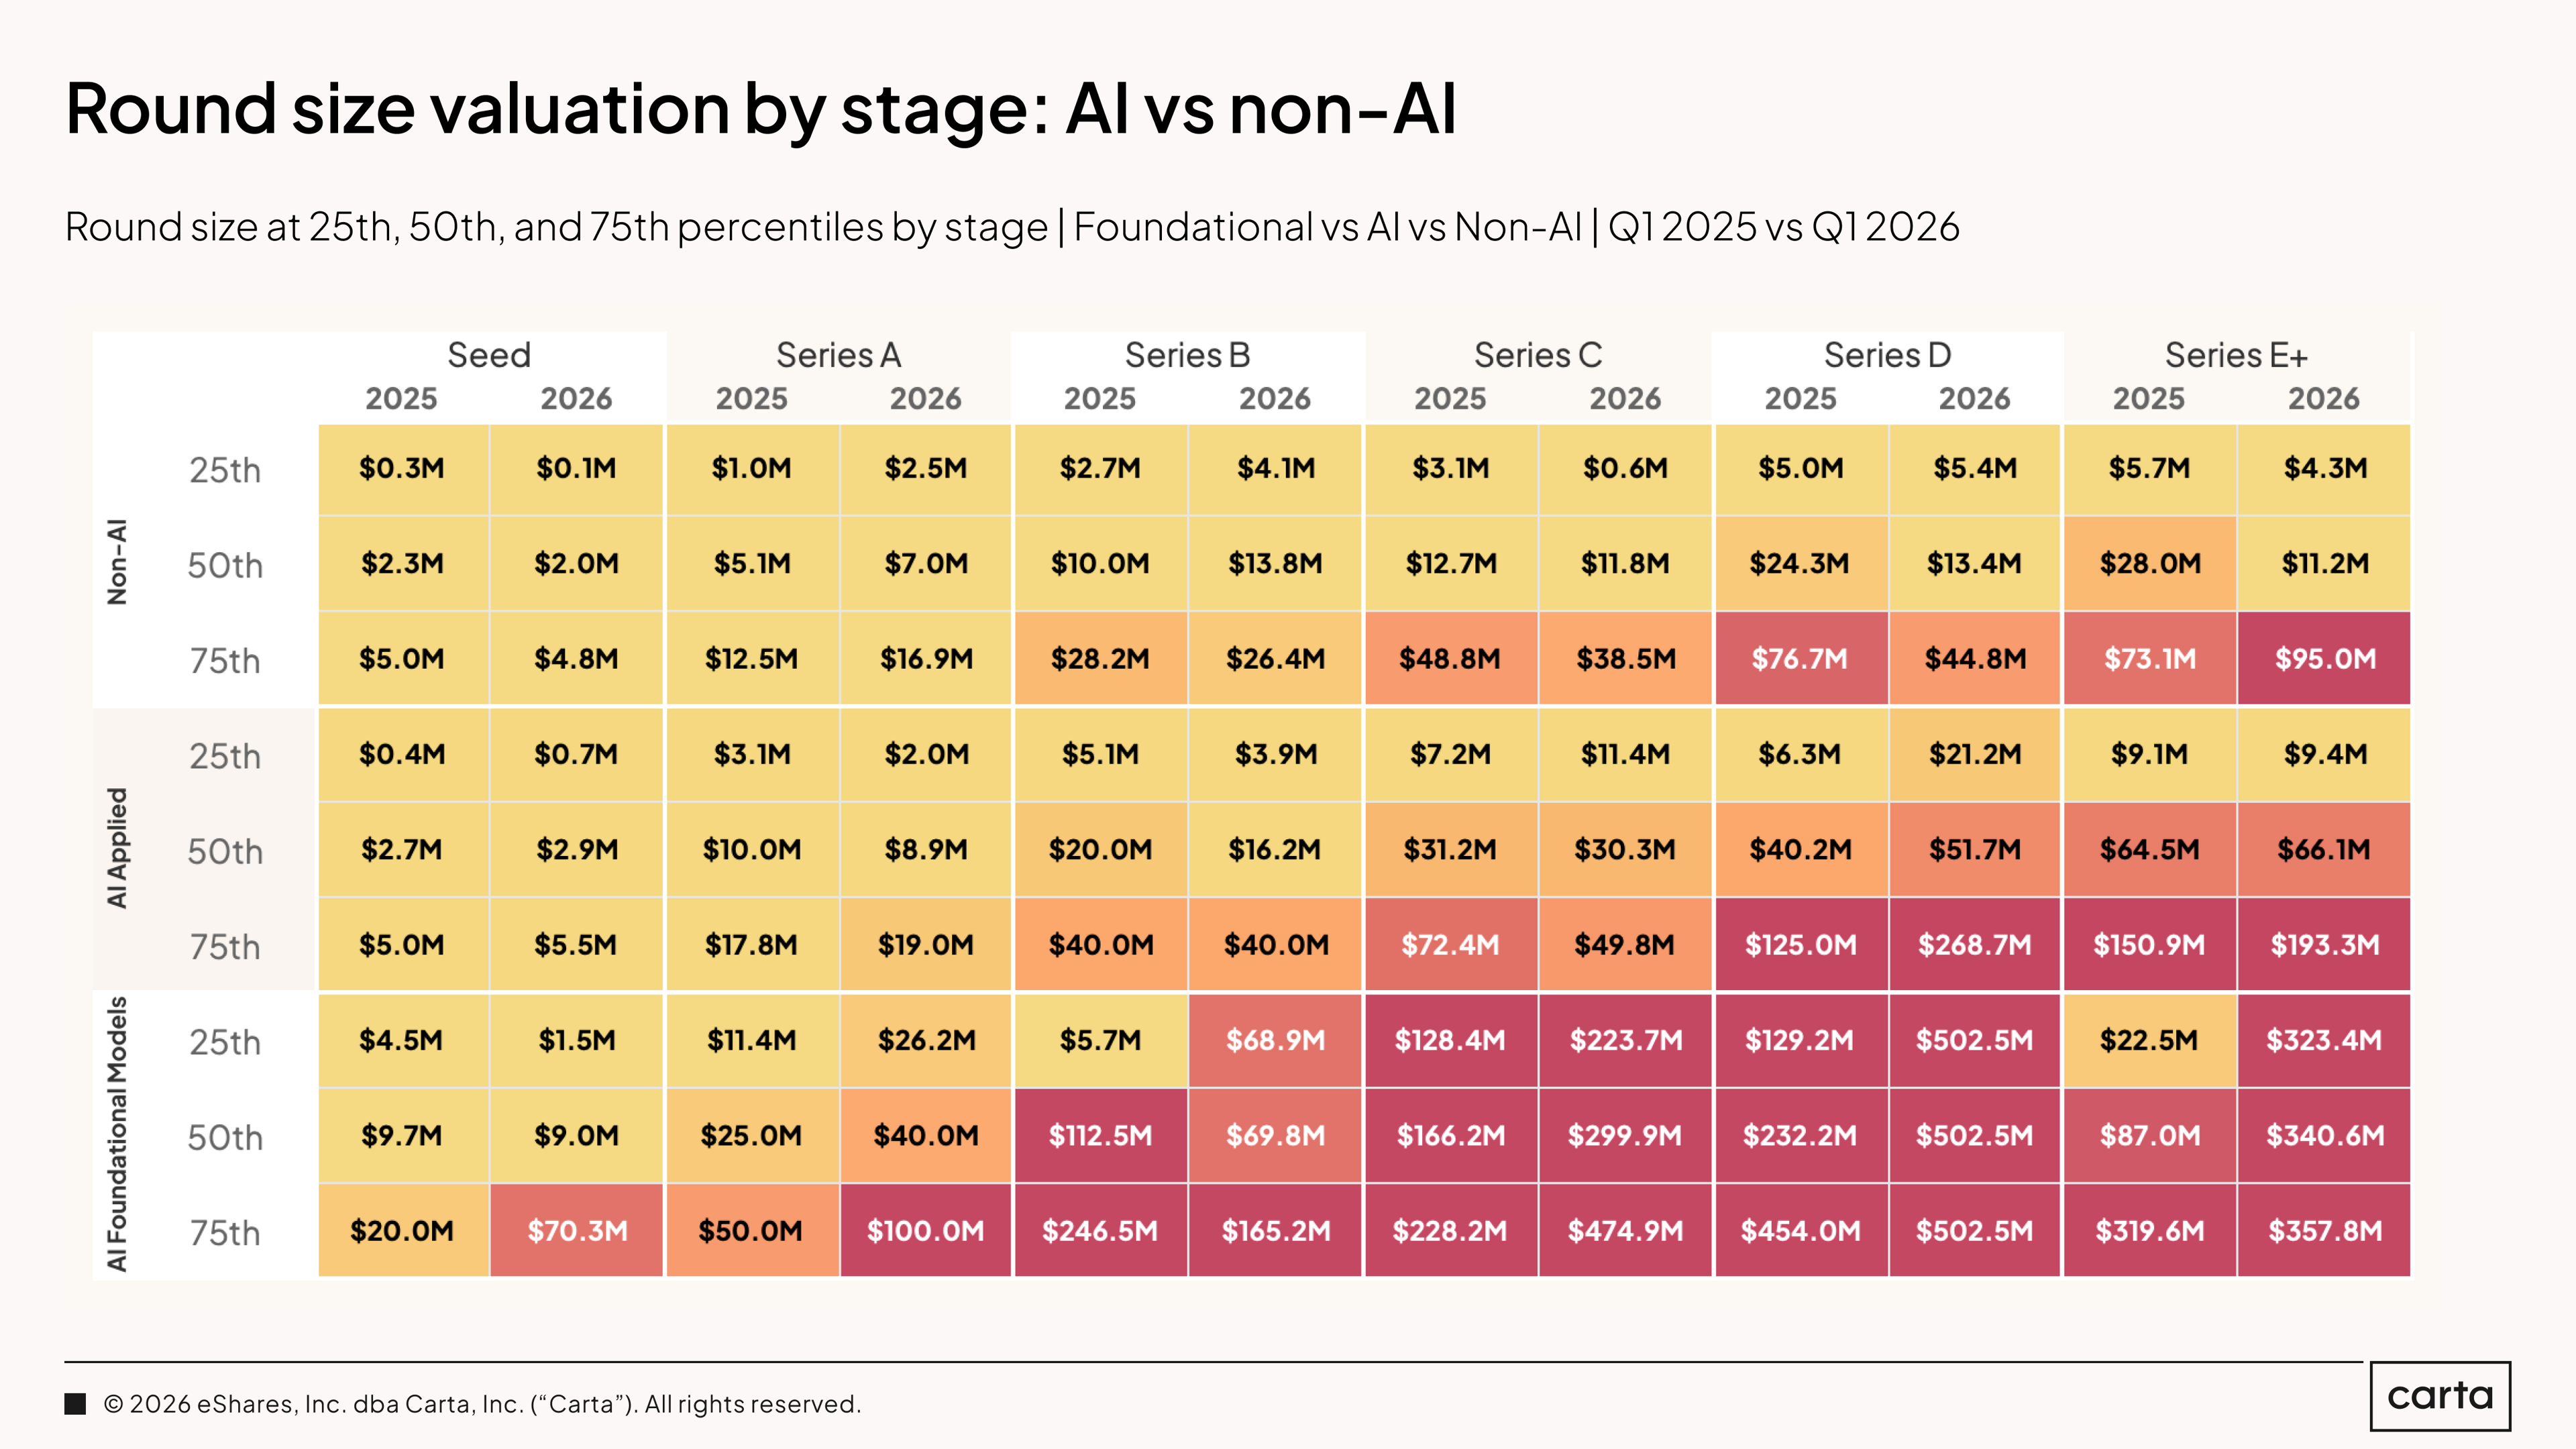
Round sizes are also much larger for AI foundational model companies than for their AI applied and non-AI peers. At Series A, the median AI foundational model company on Carta raised $40 million in Q1, versus $7 million for non-AI companies and $8.9 million for AI applied. At Series B, foundational model companies raised a median of $69.8 million, versus $13.8 million for non-AI.
Geography and industry
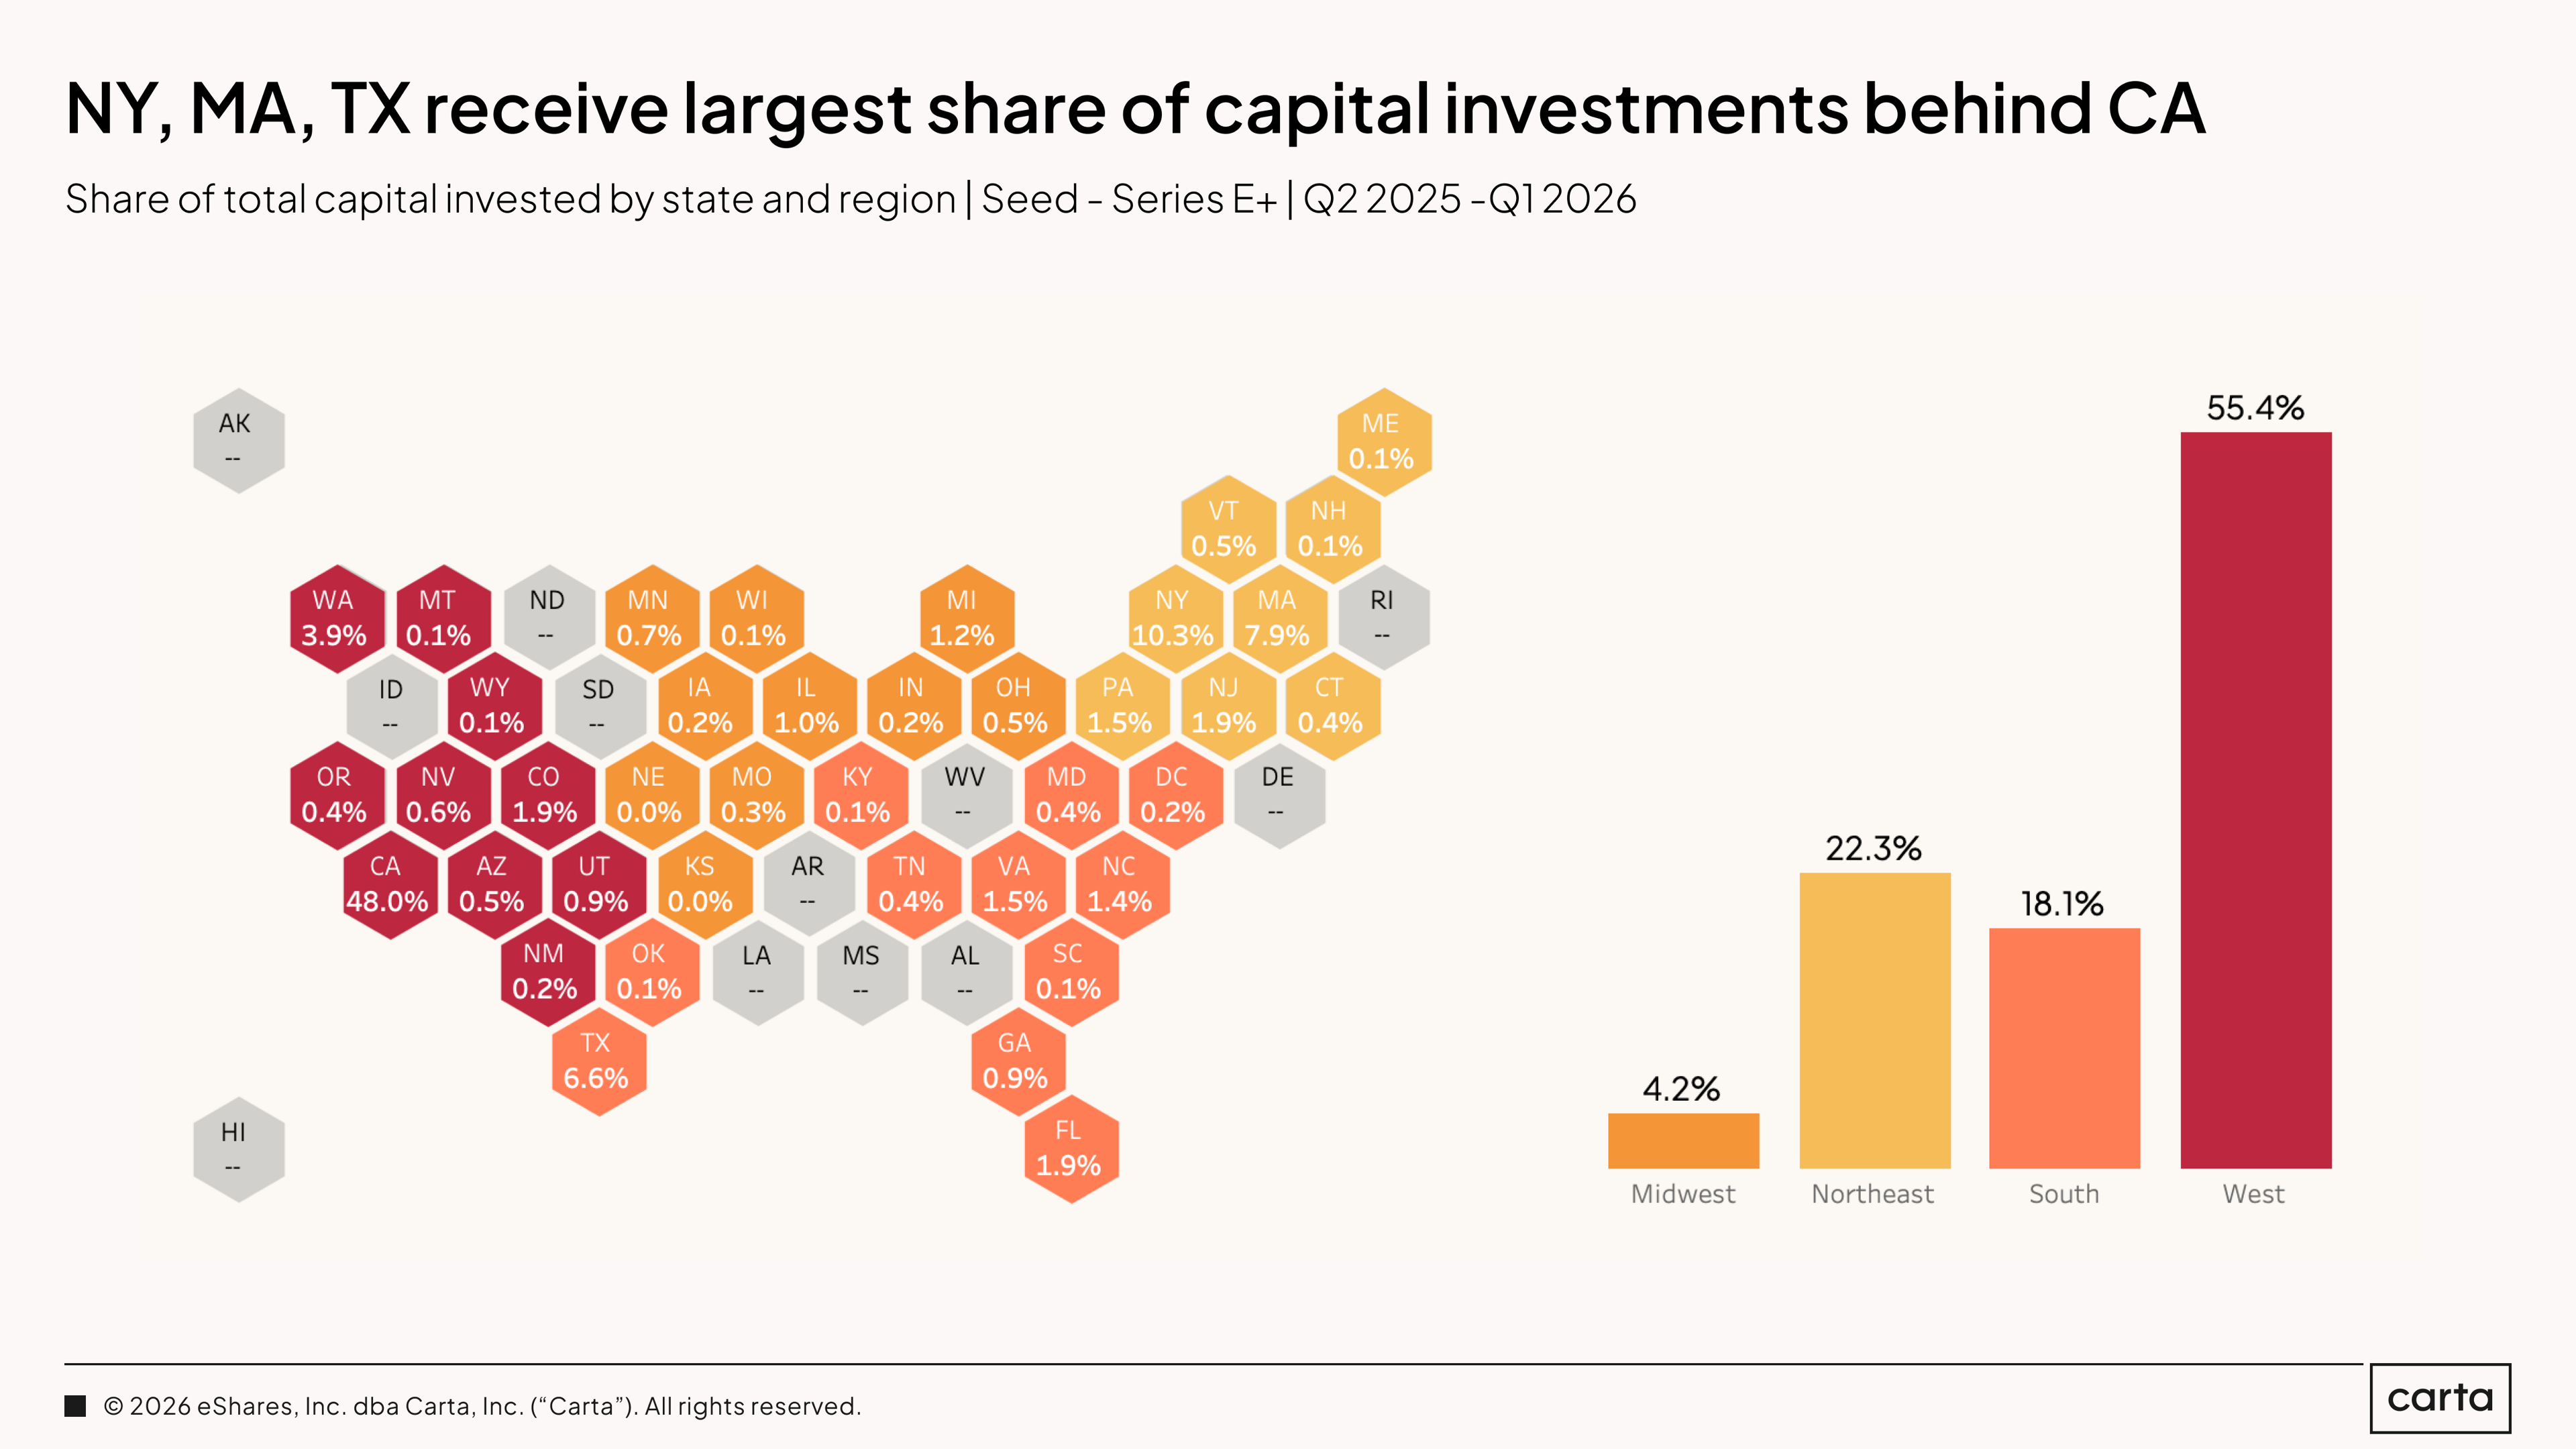
Companies based in the West census region were responsible for 55.4% of all capital raised on Carta from the start of Q2 2025 through the end of Q1 2026. California alone accounted for 48% of all VC raised in the U.S. over this span.
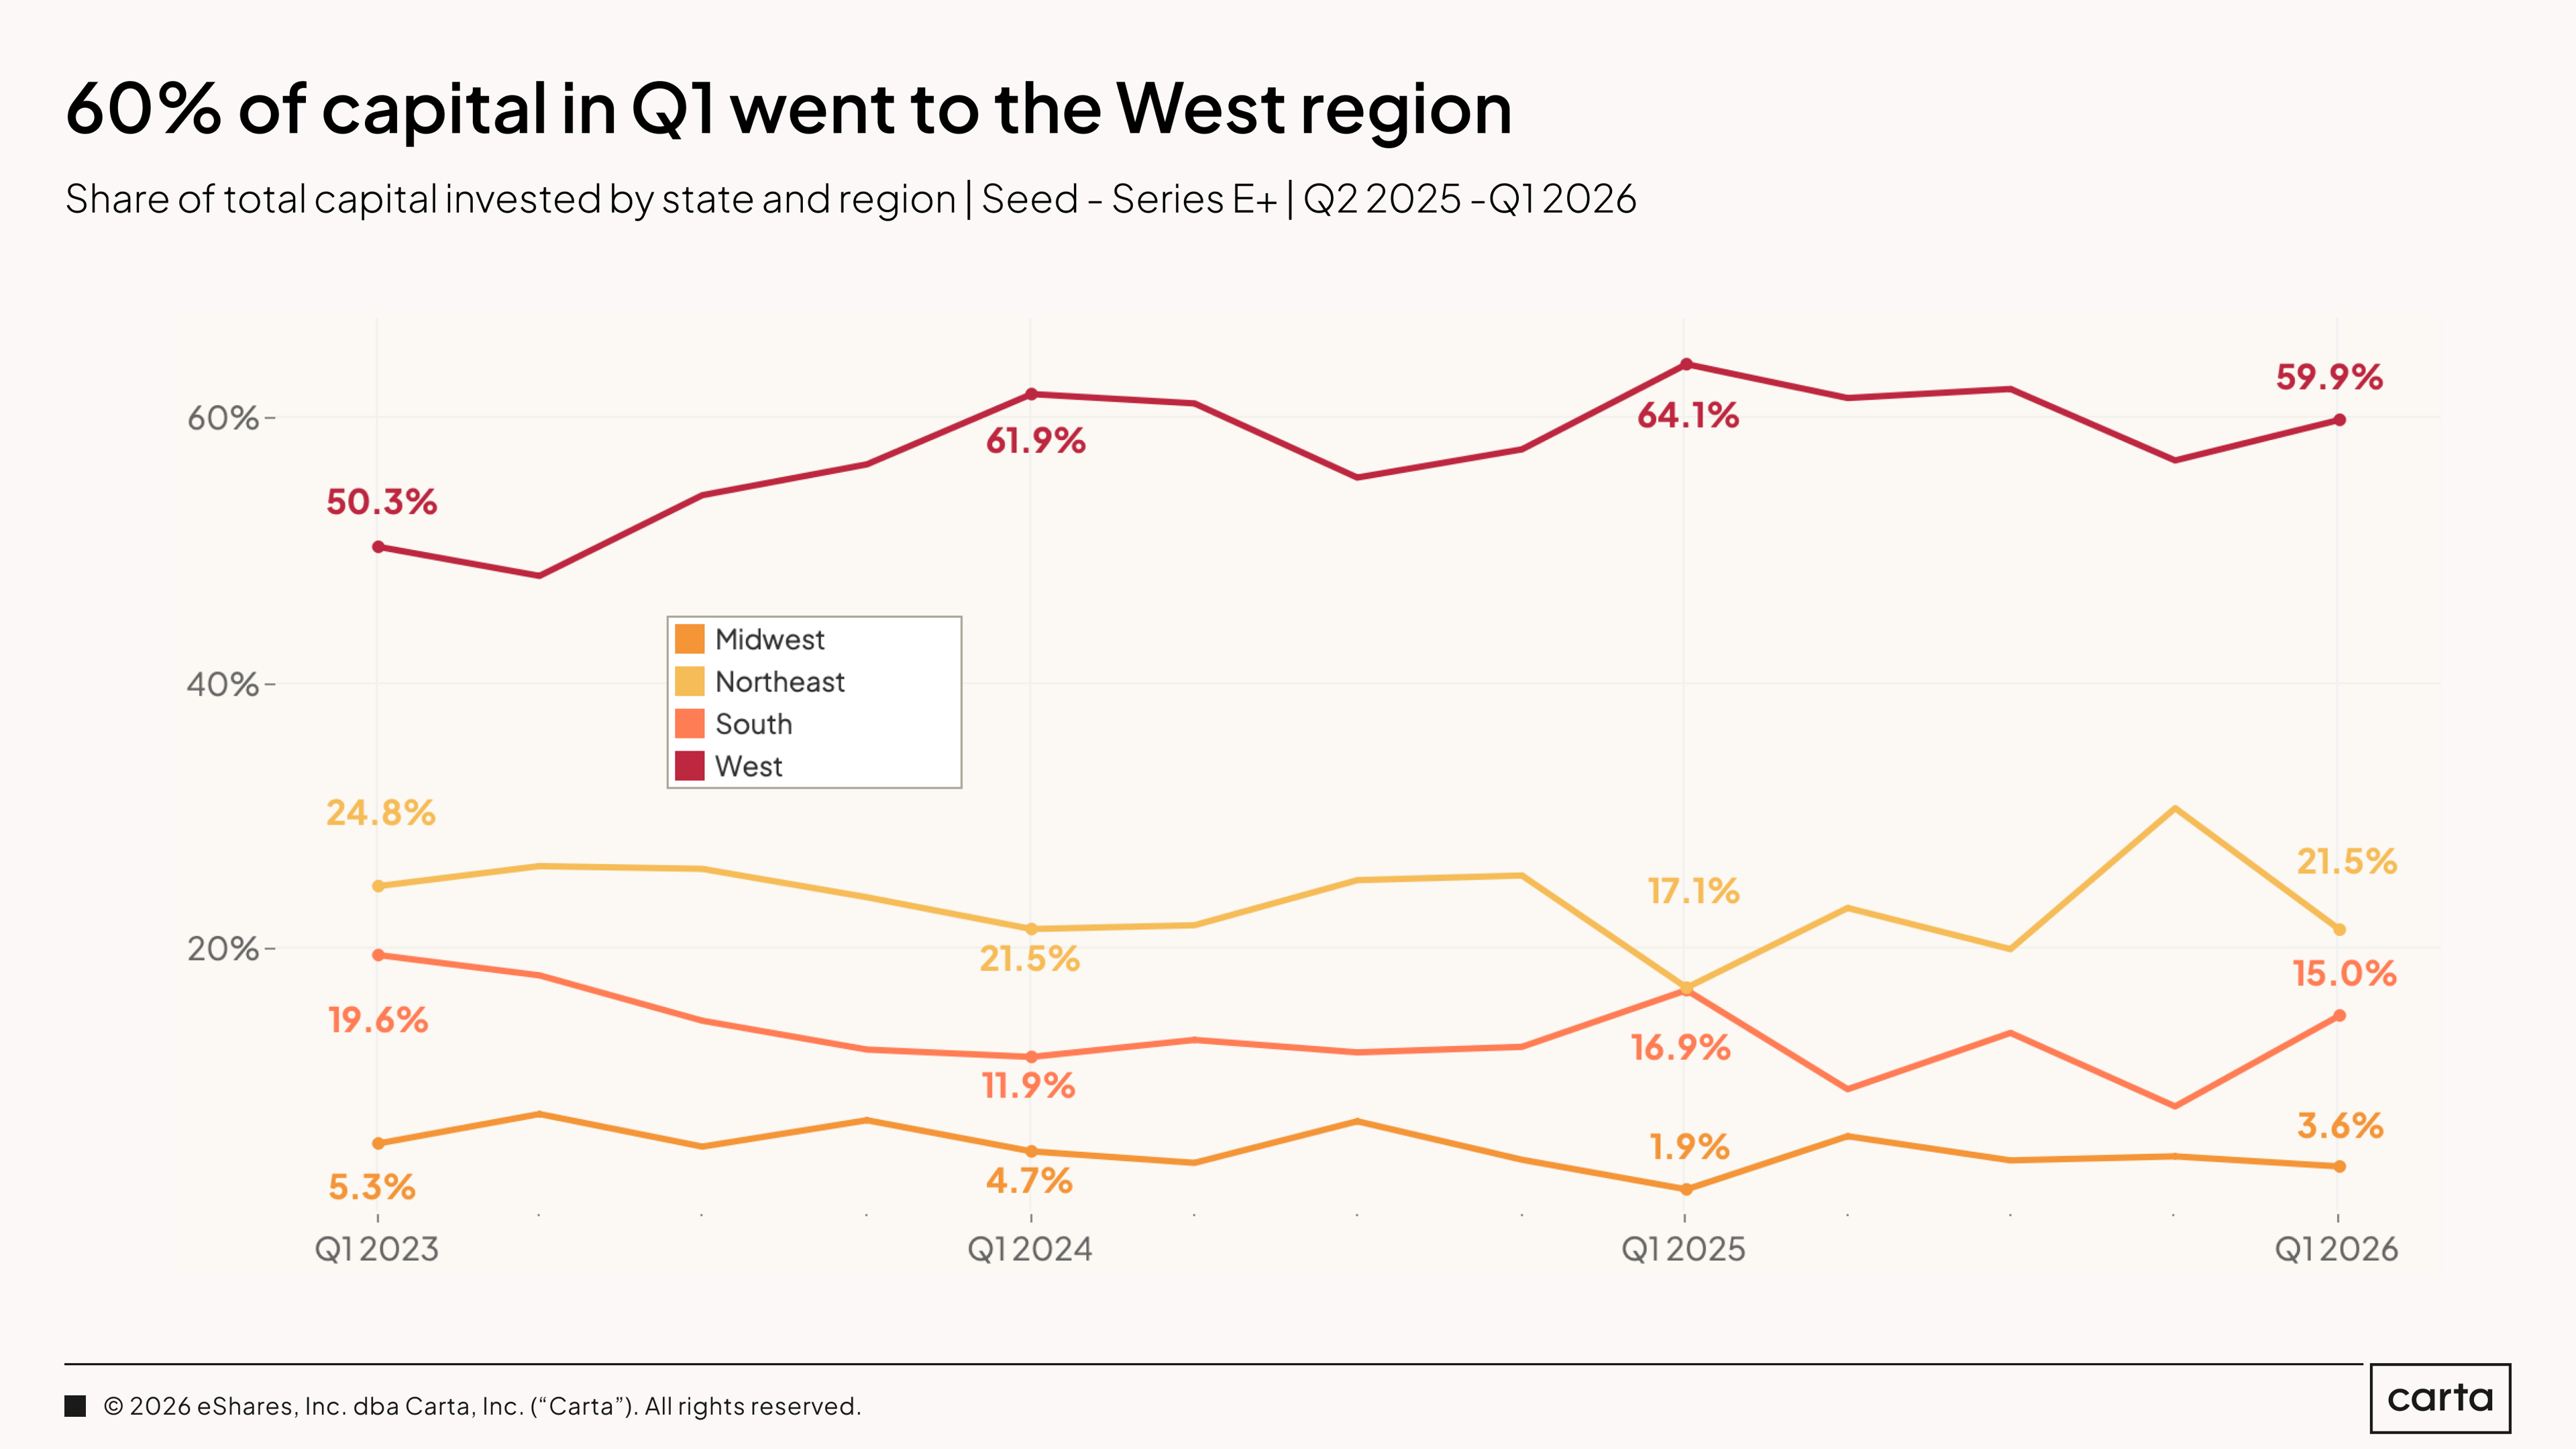
The West census region claimed 59.9% of all capital invested in Q1 2026, up from its recent low of around 50% in Q1 2023. Over the past several quarters, the West’s market share has been relatively stable.
The Northeast pulled 21.5% of capital raised on Carta in Q1. The regional concentration story remains consistent: Toughly 80 cents of every dollar raised on Carta goes to companies in the West and Northeast, with California the dominant recipient by a wide margin.
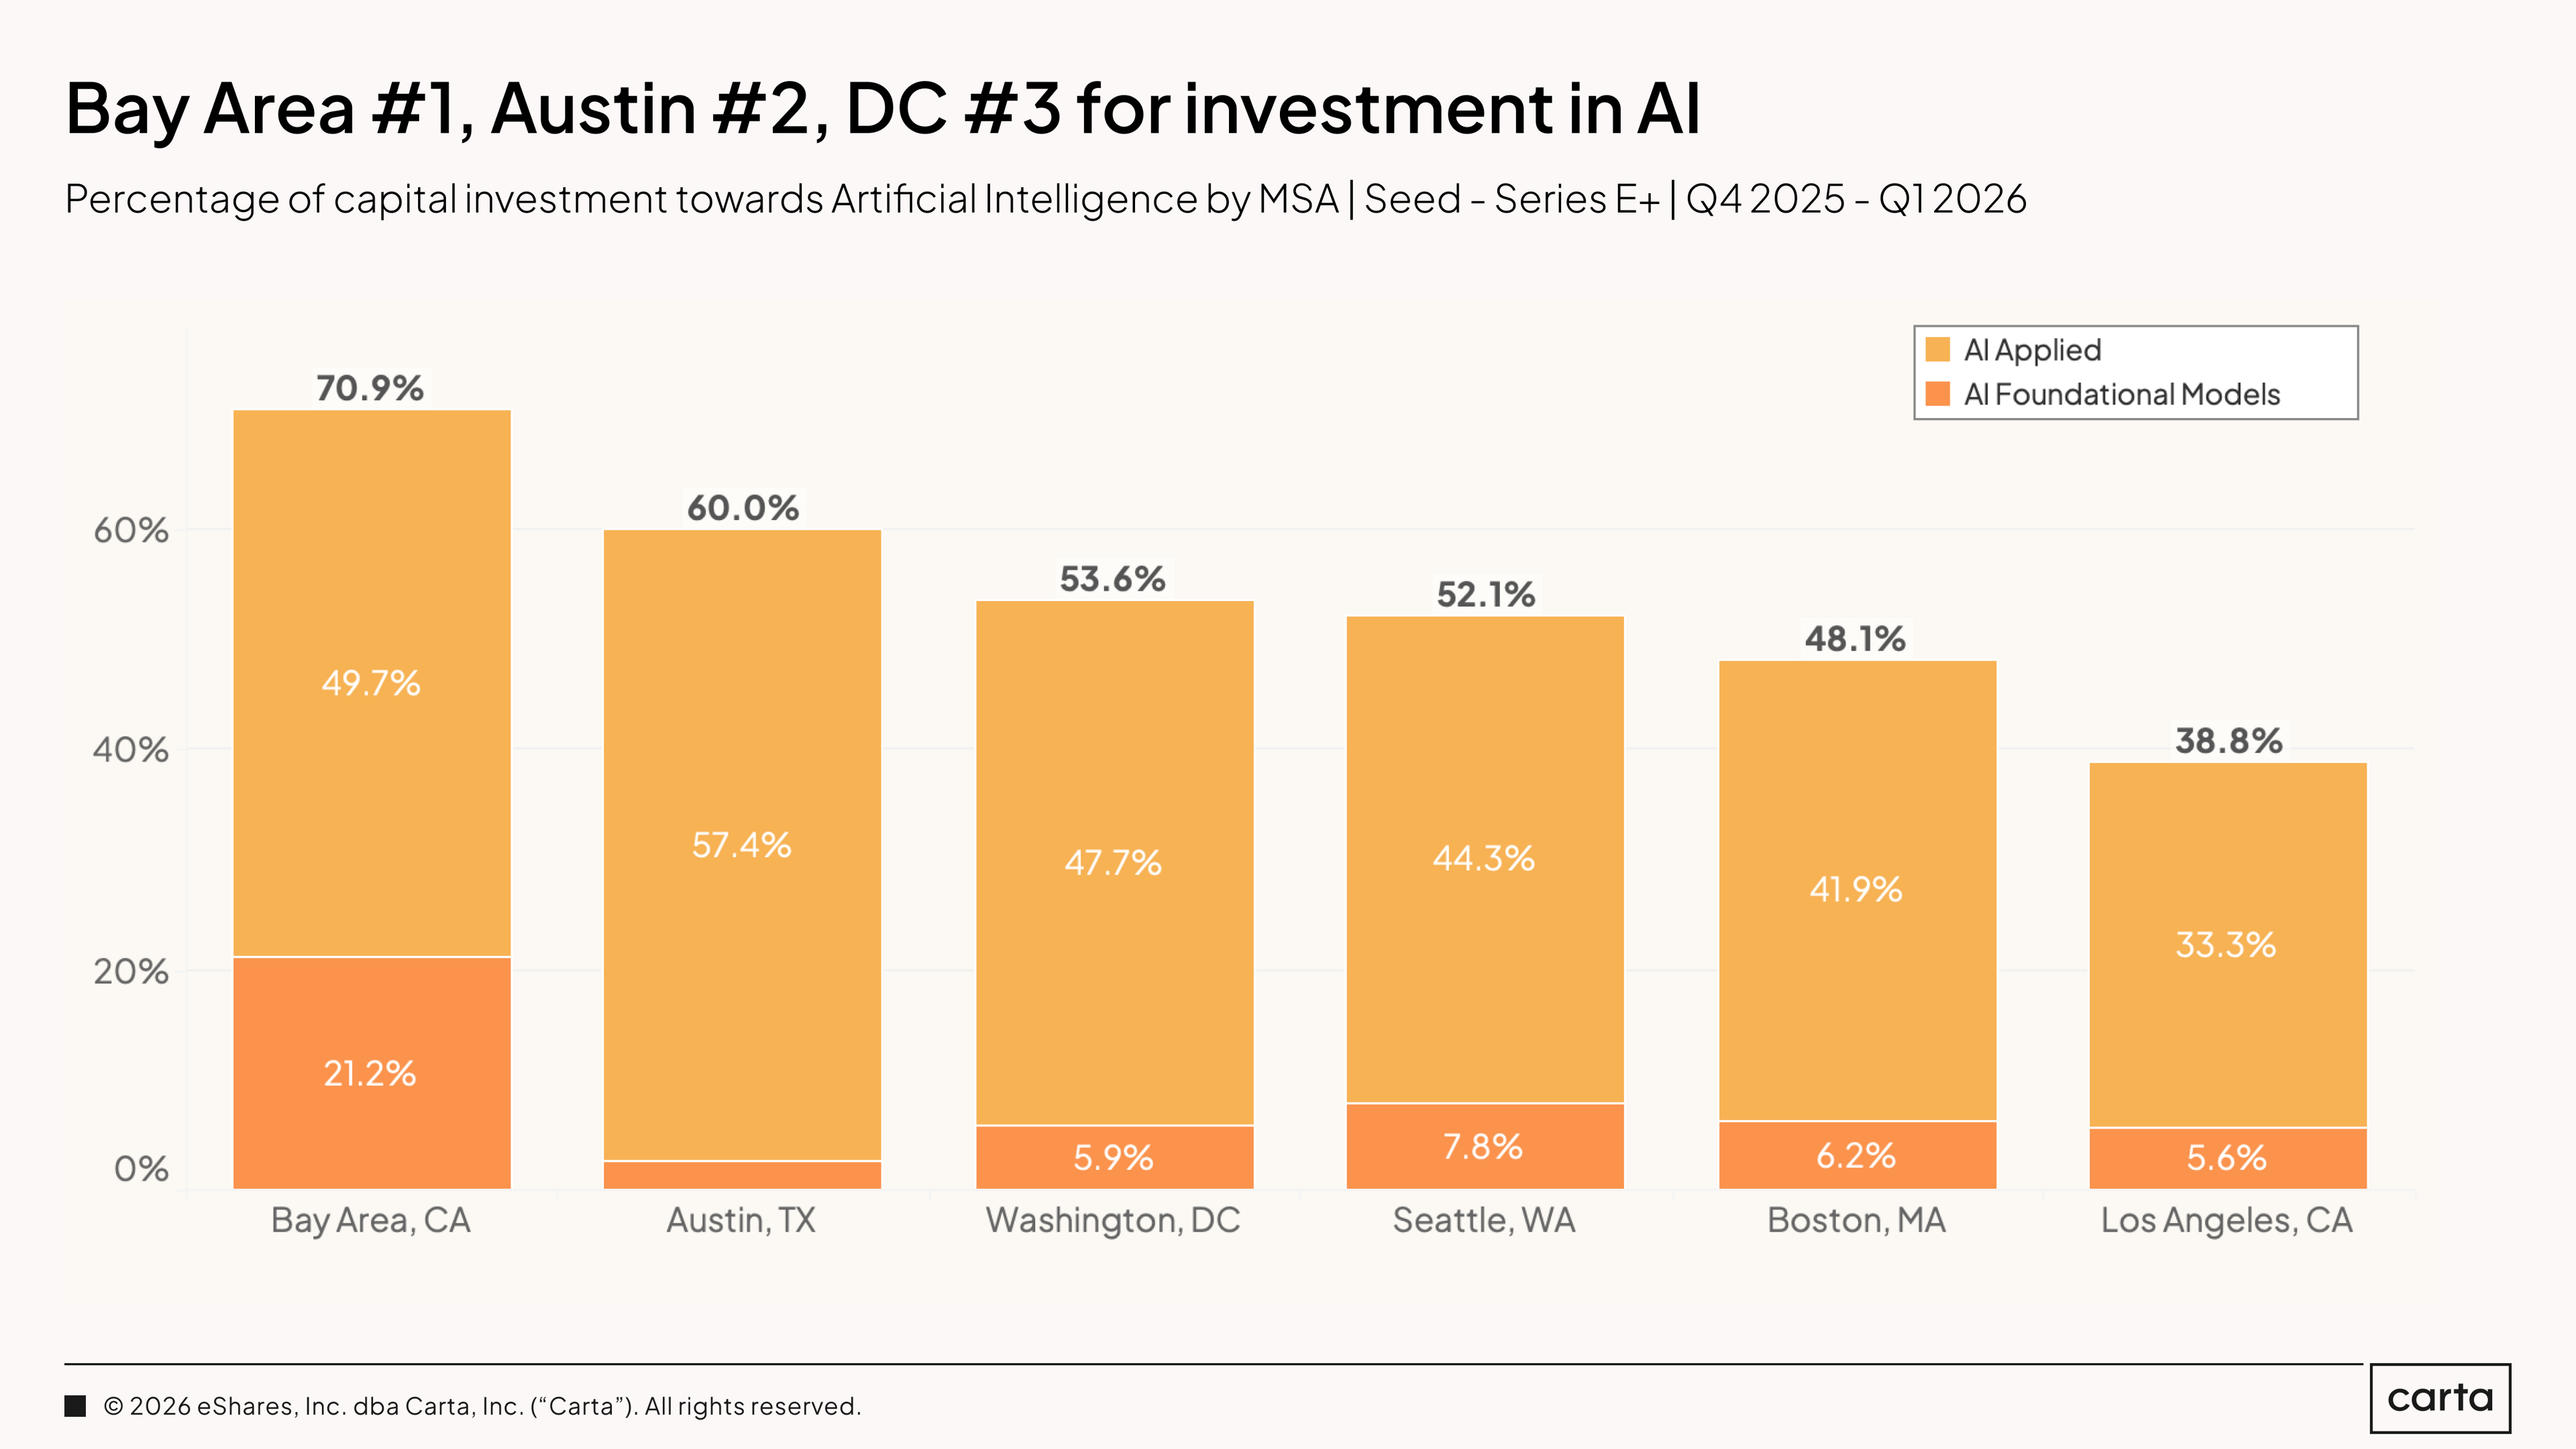
In the Bay Area, 70.9% of all cash raised on Carta in Q4 2025 and Q1 2026 went to AI companies, the highest proportion of any major metro area. Austin ranks second in terms of AI’s local market share, at 60%, followed by Washington, D.C., Seattle, Boston, and Los Angeles.
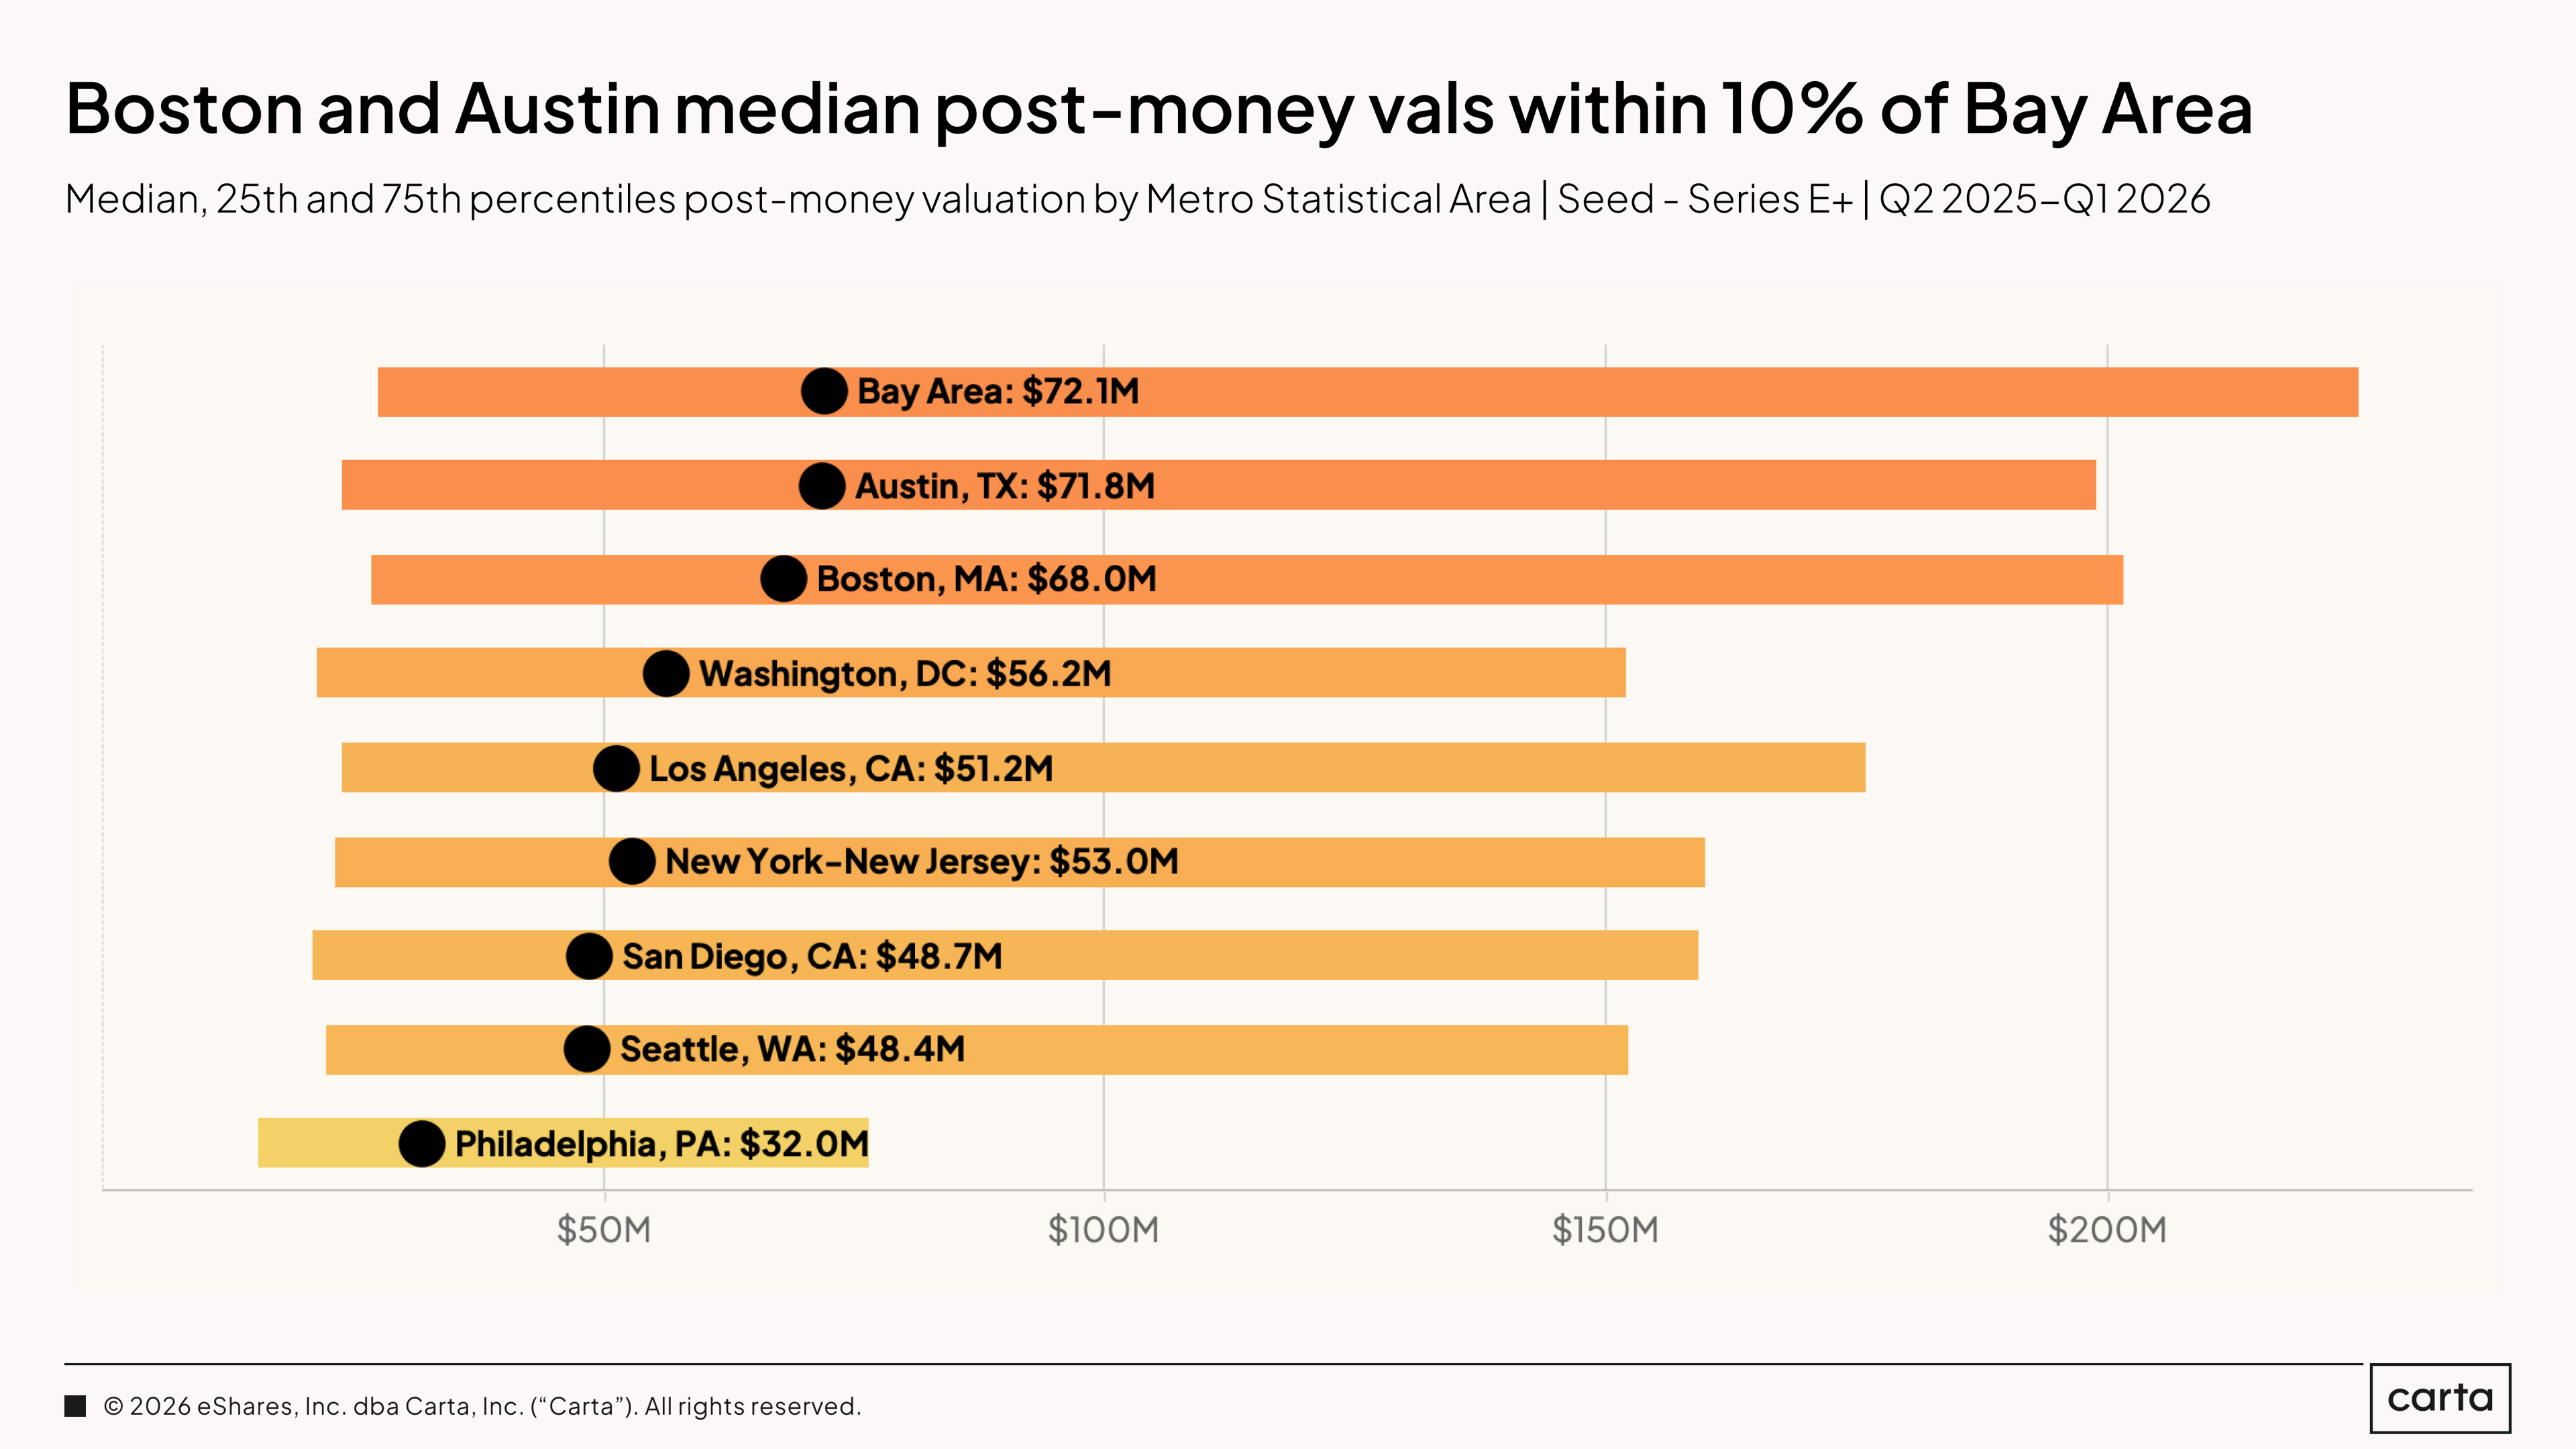
Among the busiest metro areas for VC investment, median post-money valuations across all sectors and stages don’t differ too greatly. The Bay Area median from Q2 2025 to Q1 2026 was $72.1 million, while the median post-money valuation in Austin was $71.8 million. Boston is also within striking distance, at $68 million.
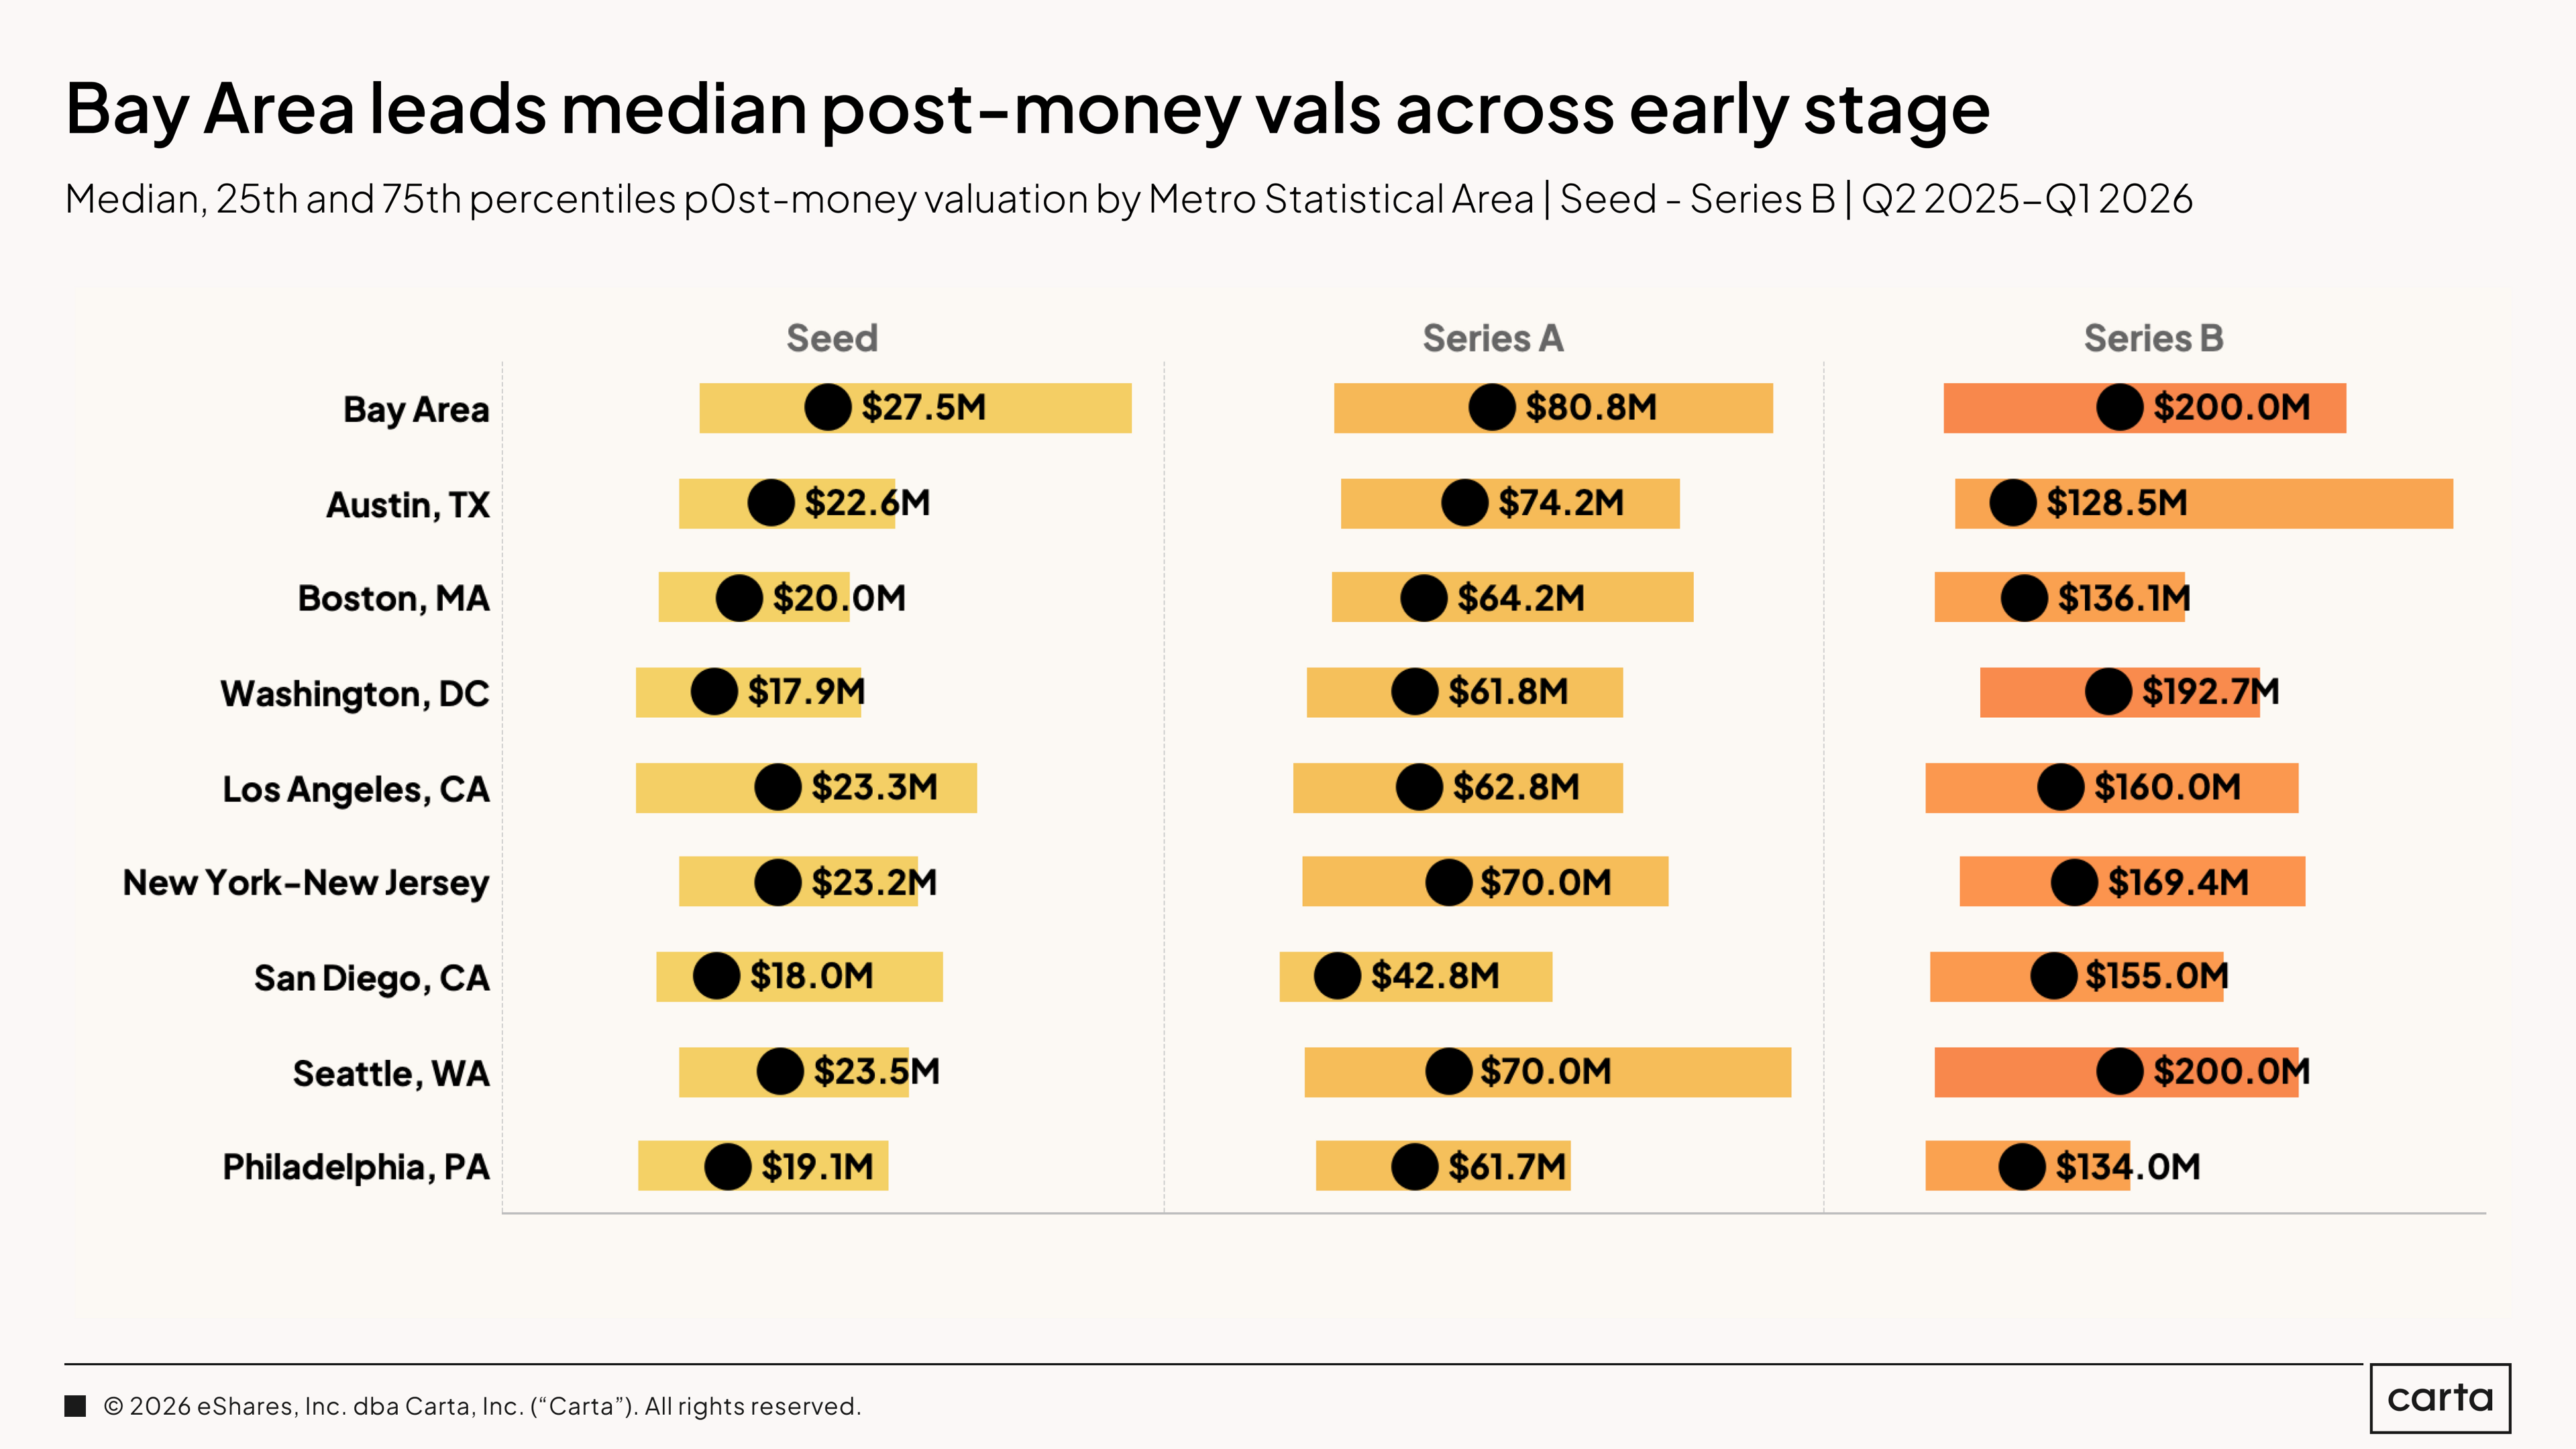
At early stages, the Bay Area maintains a more noticeable premium over the competition. The median post-money valuation on seed deals raised by Bay Area startups over the past 12 months was $27.5 million, compared to $22.6 million for Austin and $20 million for Boston. At Series A, the relative gaps between these metro areas were similar. At Series B, Seattle tied the Bay Area for the top spot, with a median post-money valuation of $200 million.
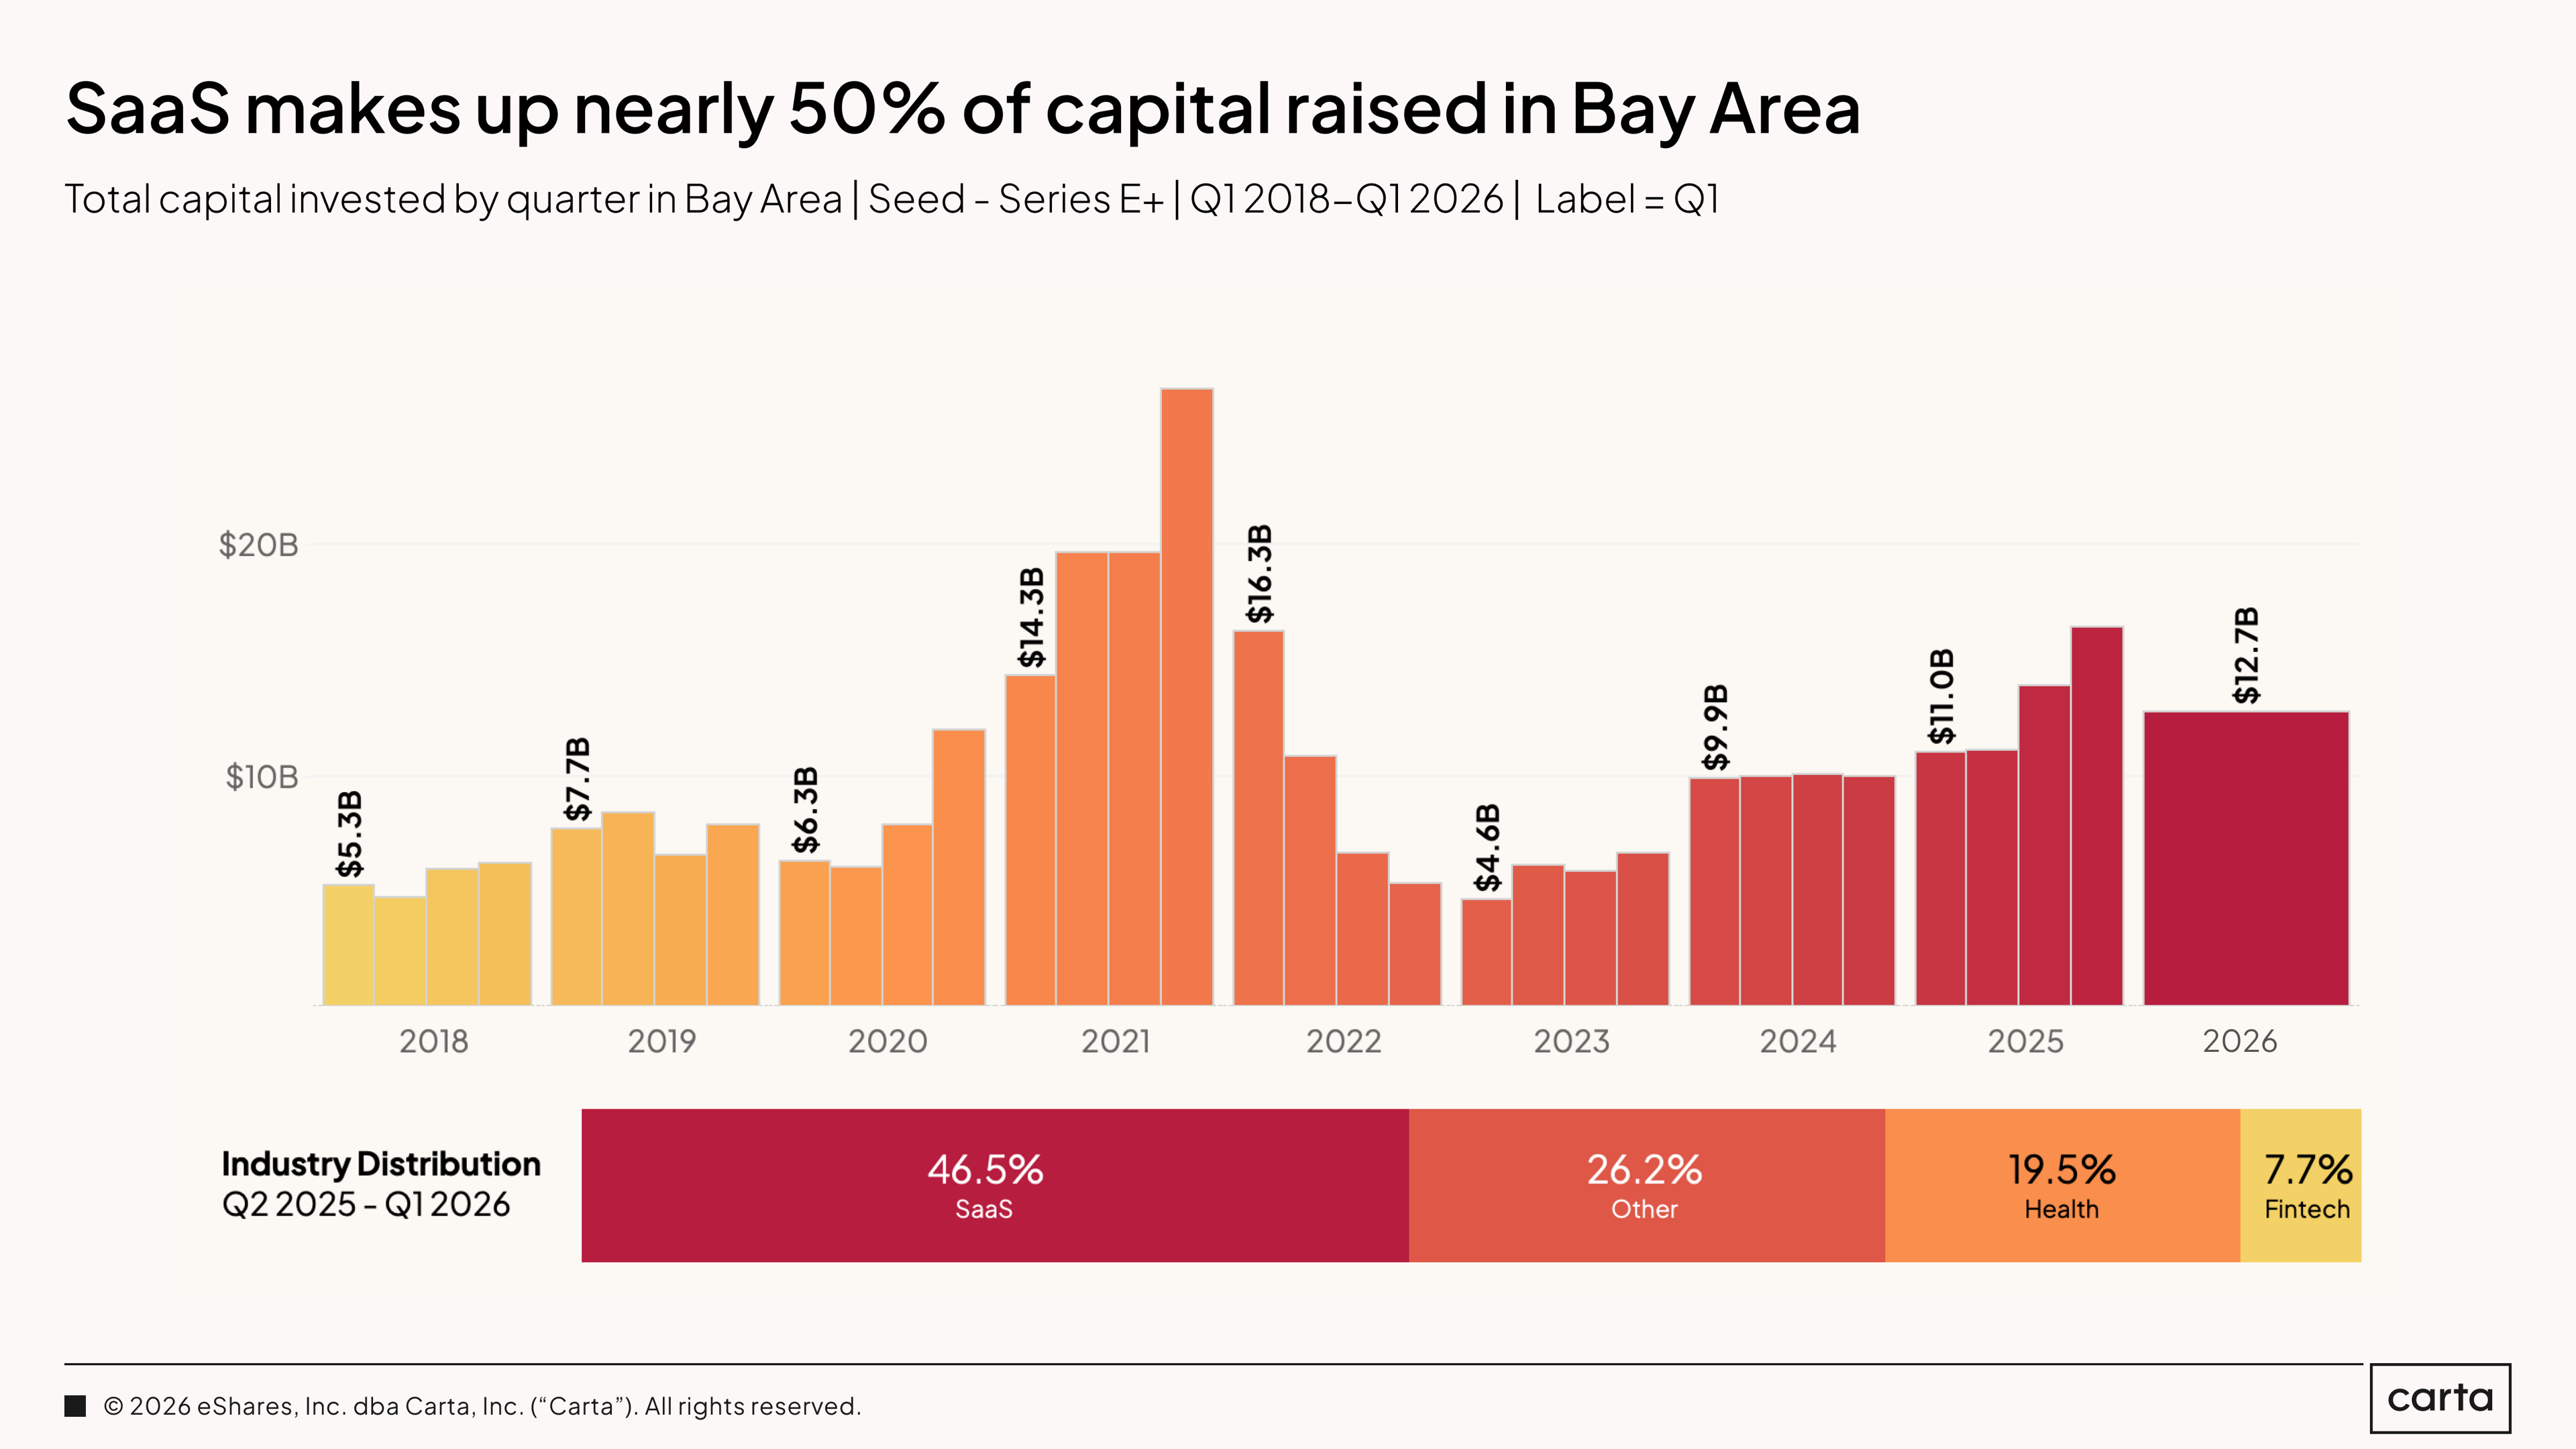
SaaS accounted for 46.5% of all capital invested in the Bay Area over the past 12 months, with health and fintech representing another 27.2% of funds raised. Overall, startups based in the Bay Area raised $12.7 billion in Q1 2026. That’s down from both Q3 and Q4 2025, but ahead of every other quarter over the past three years.
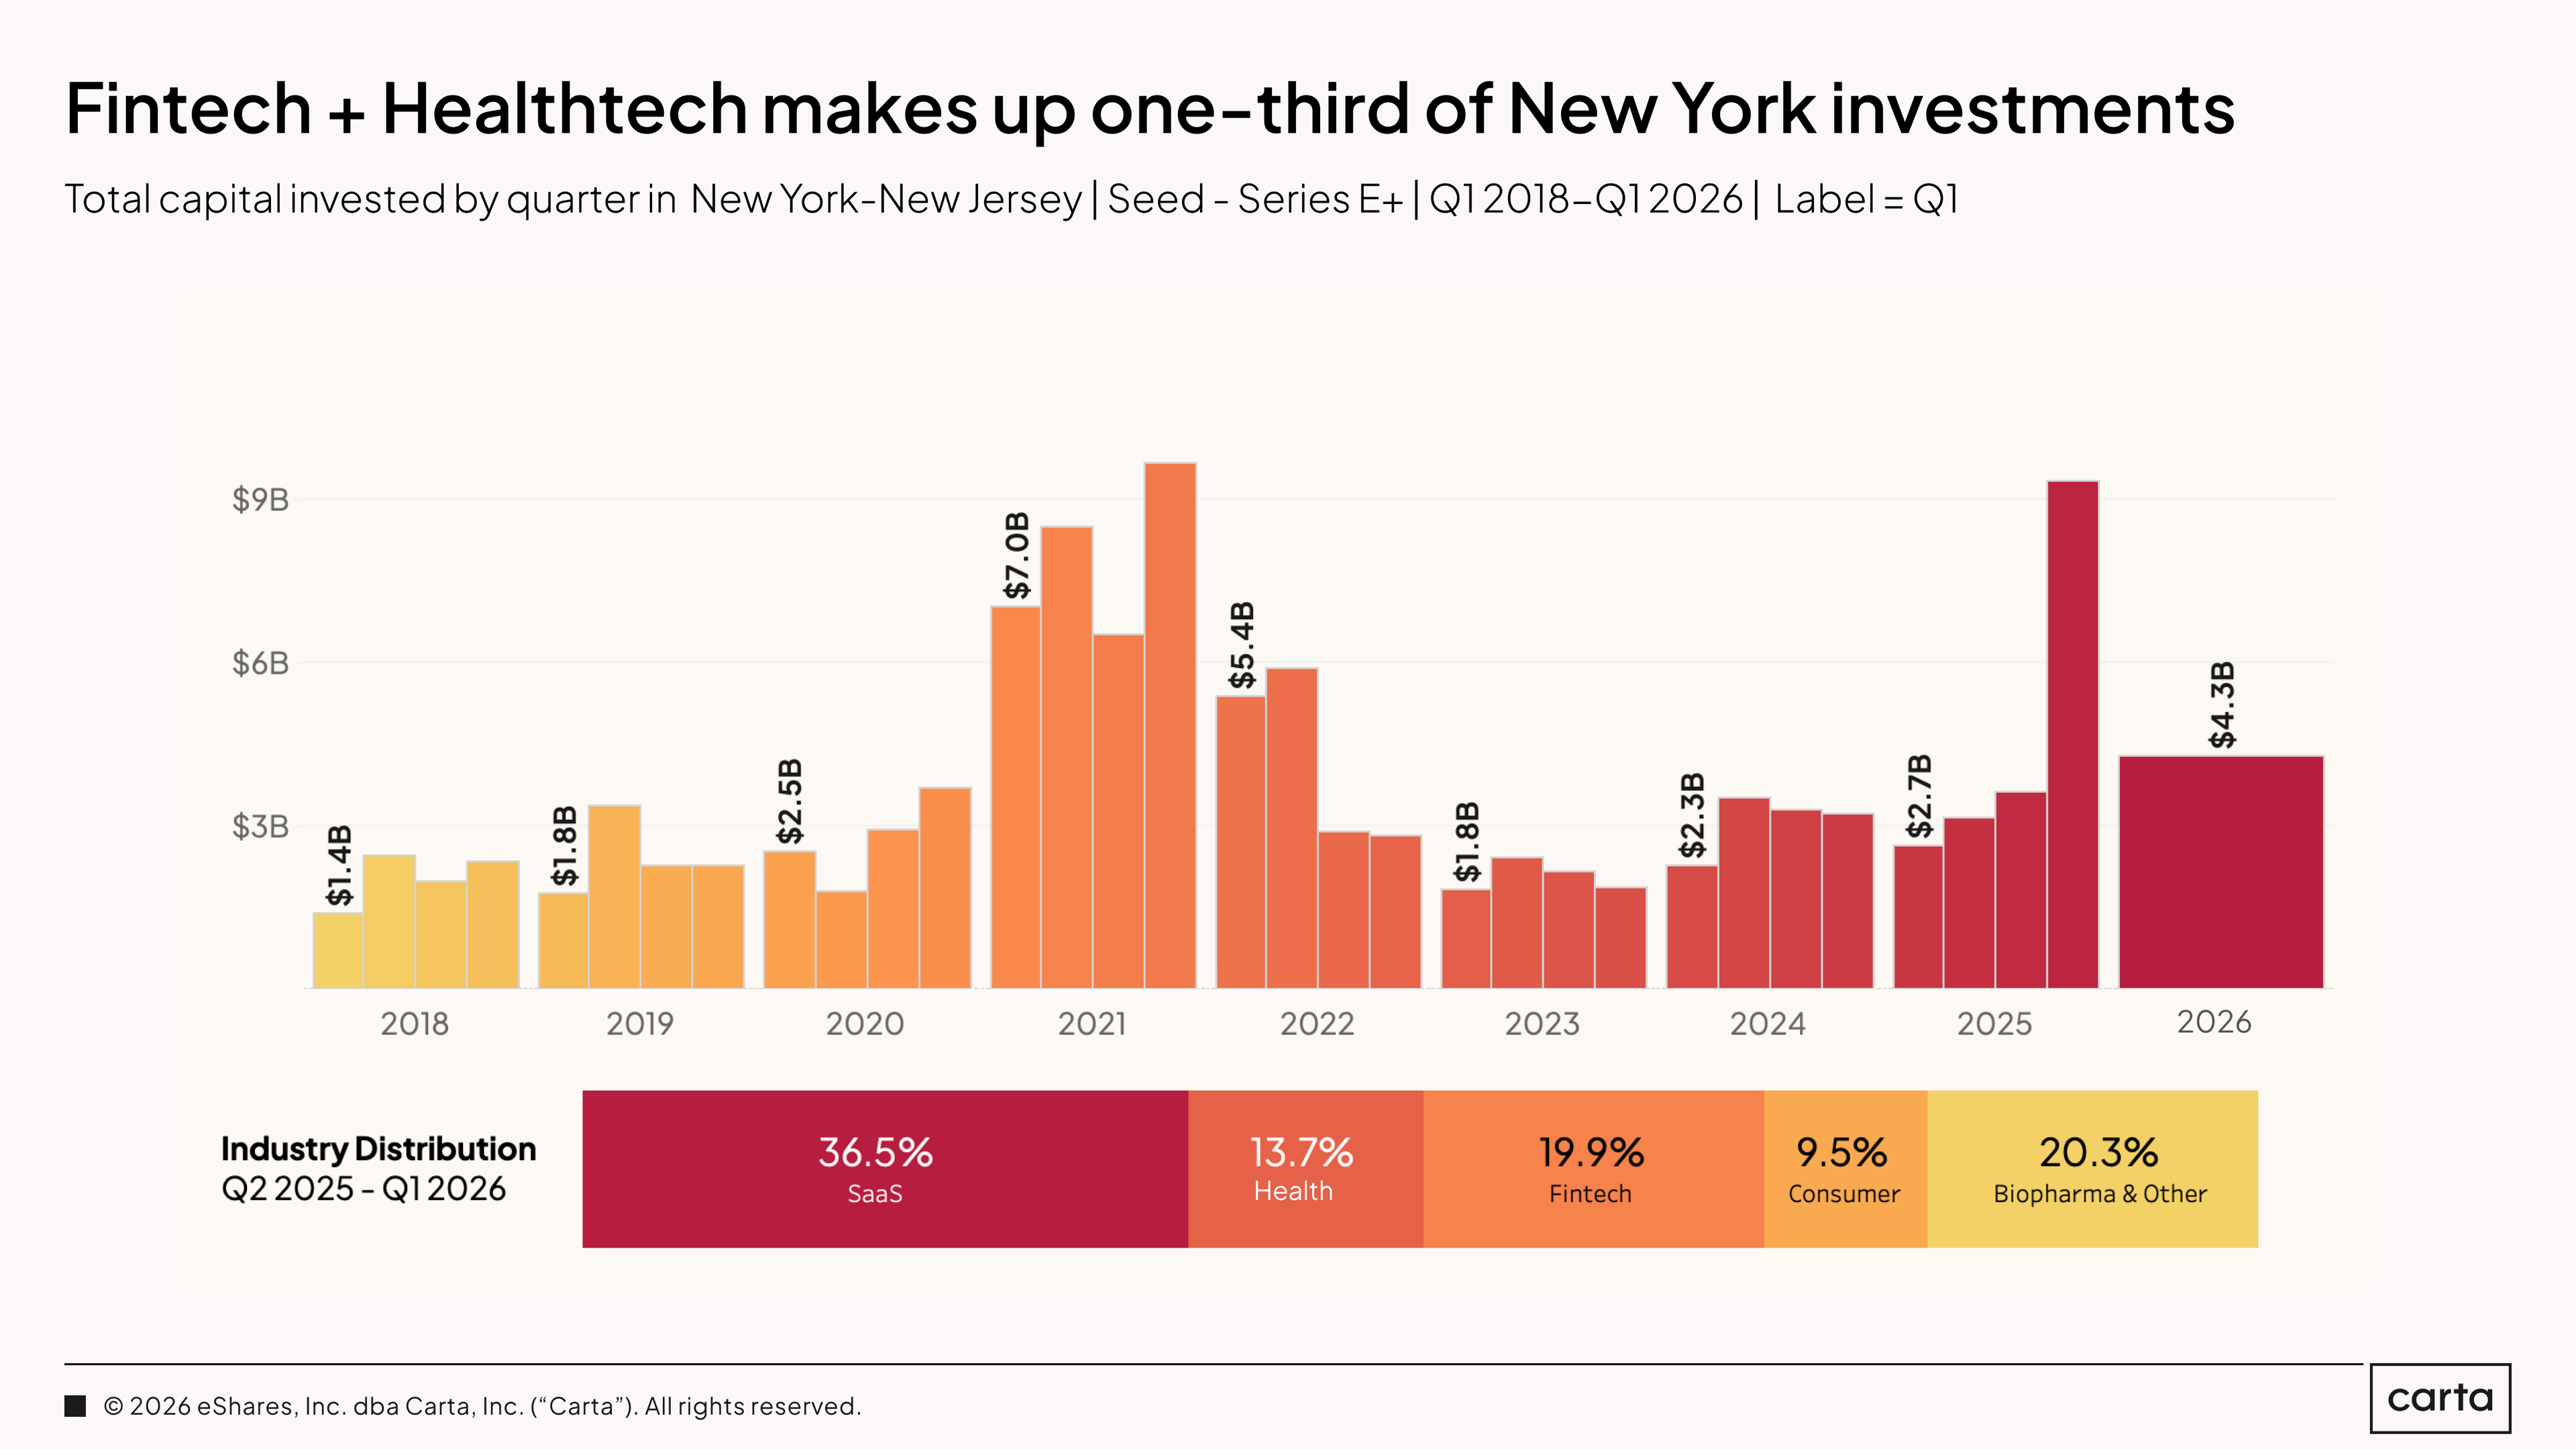
The New York metro area shows a different composition. There, SaaS accounted for 36.5% of capital raised from Q2 2025 to Q1 2026, with fintech (19.9%), healthtech (13.7%), and consumer (9.5%) also logging a substantial presence. In Q1 2026, startups in the New York metro raised $4.3 billion—a strong quarter by historical standards, and well above the trough years of late 2022 and 2023.
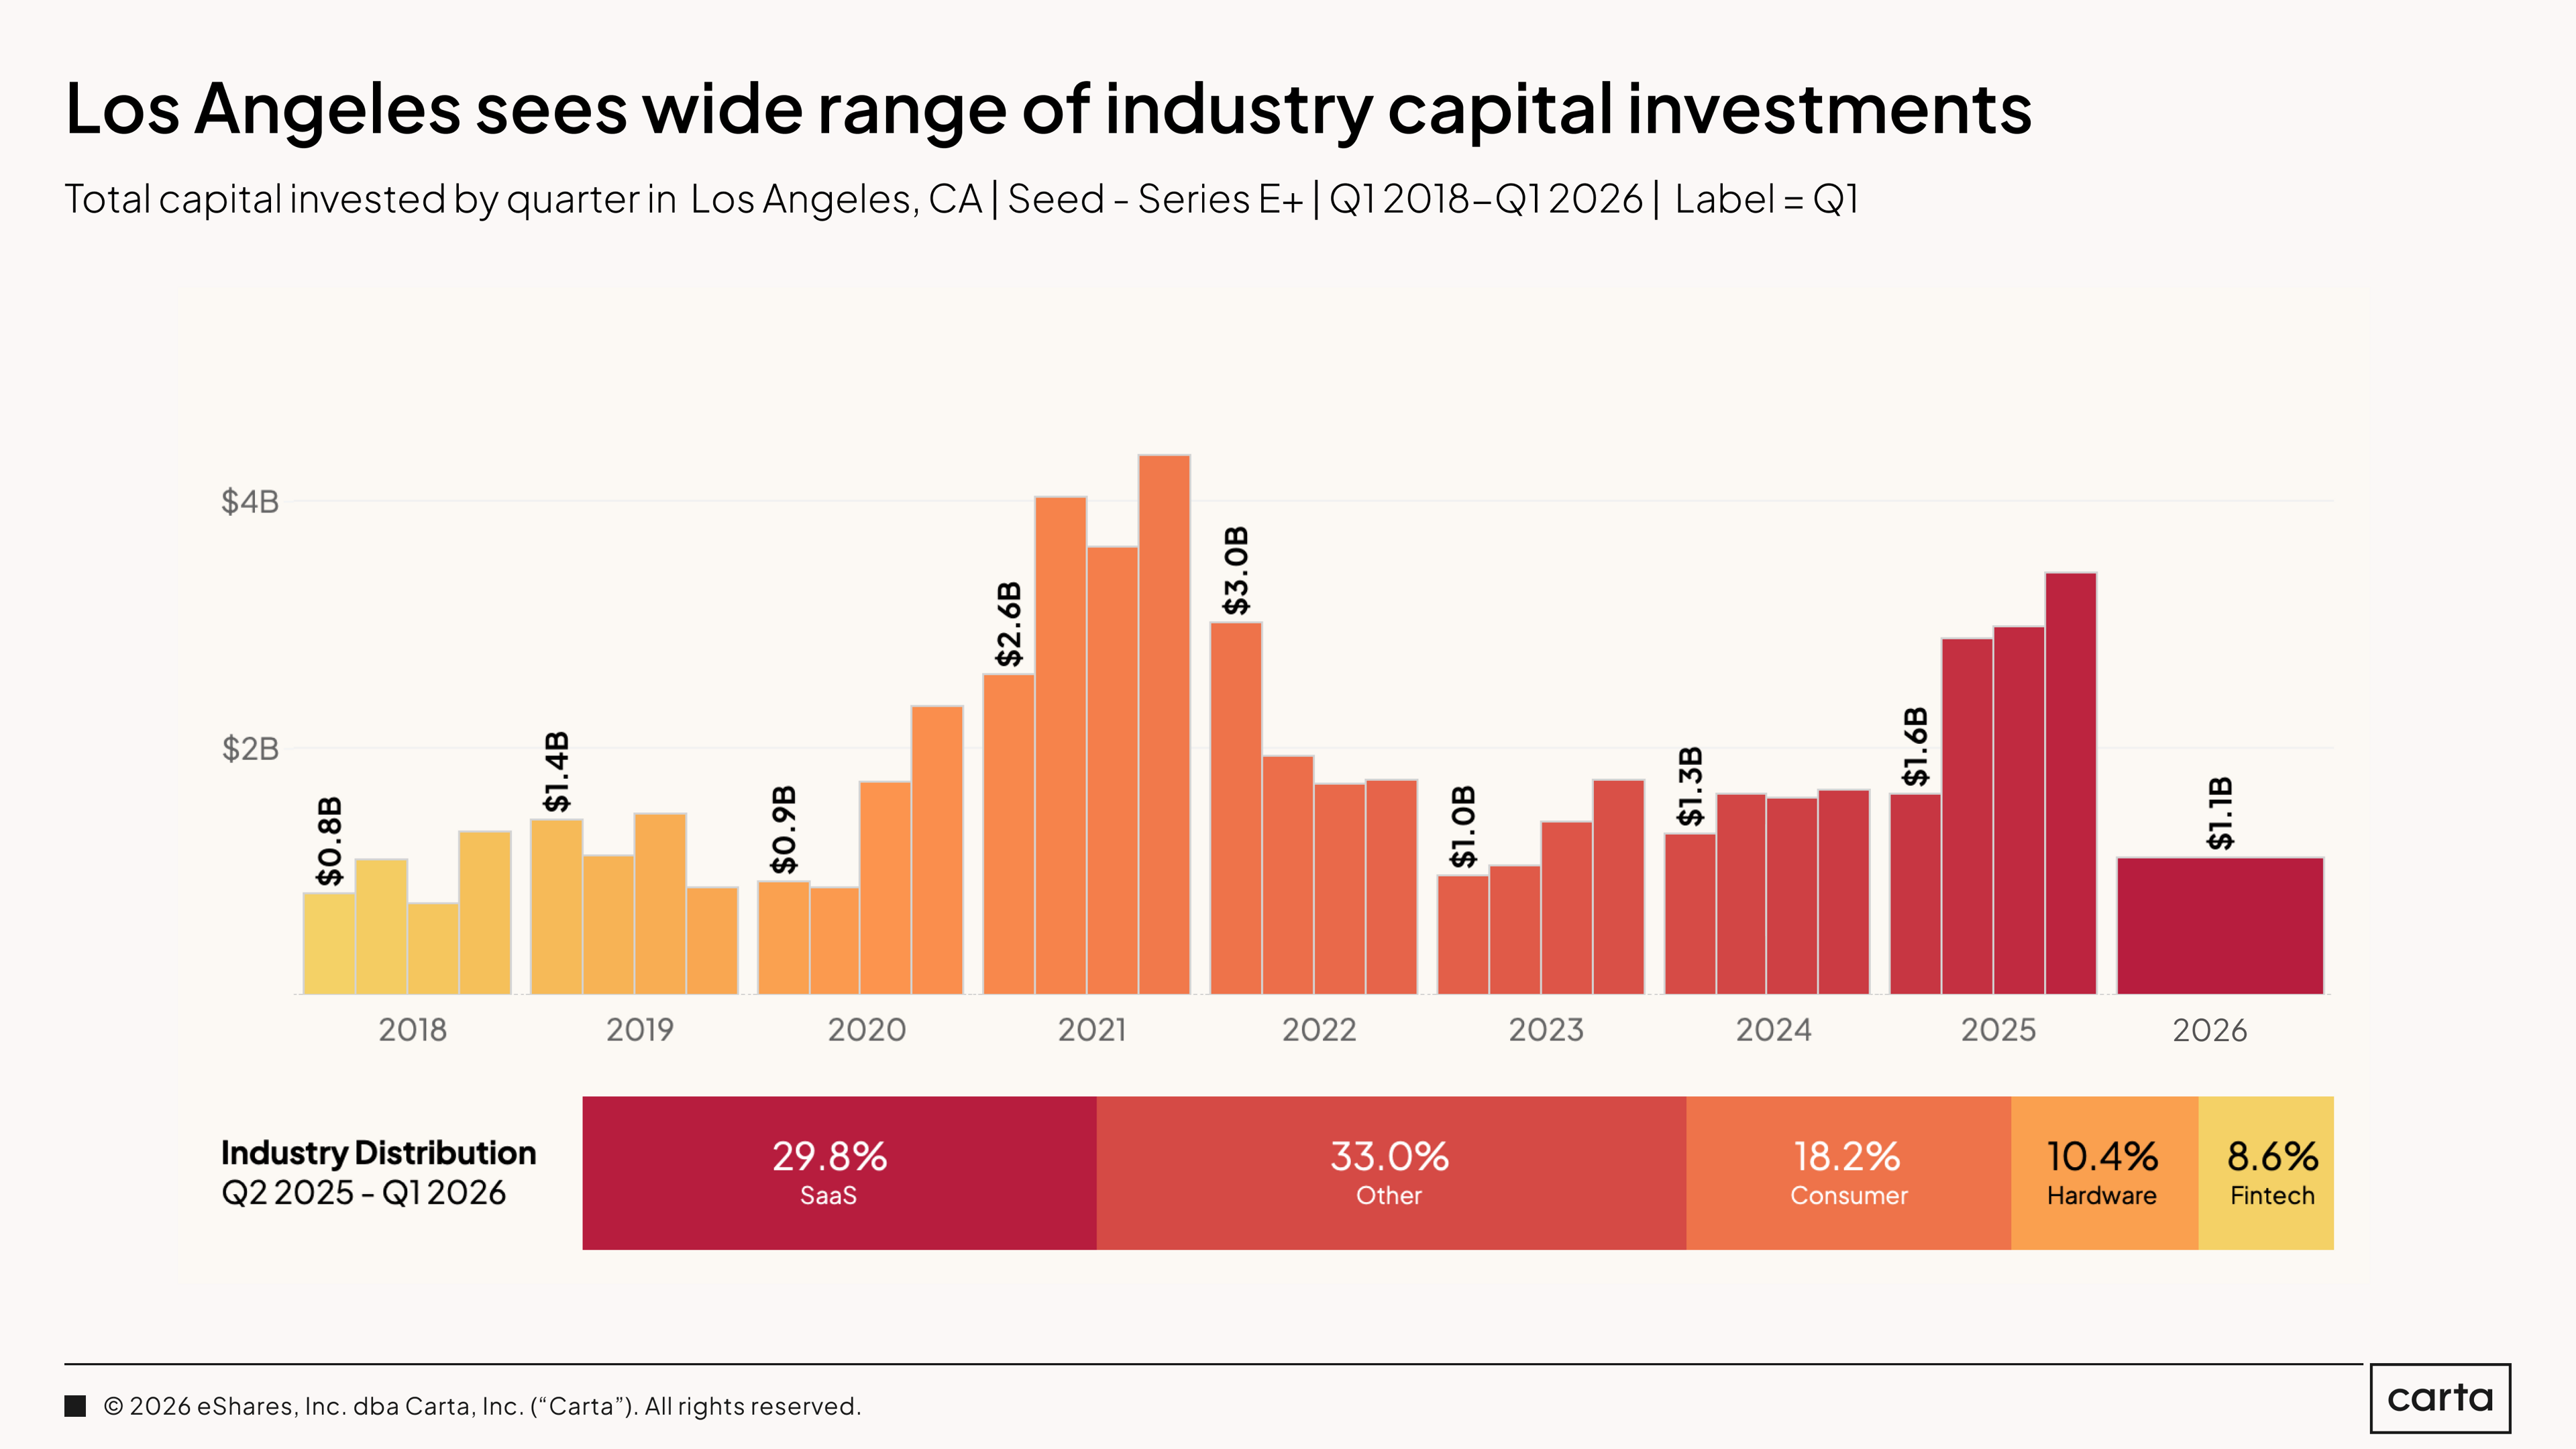
Los Angeles is the most diversified of the major U.S. venture markets included in this report, with SaaS, consumer, hardware, and fintech each claiming a meaningful slice of capital raised. That diversity has historically been Los Angeles's strength and its ceiling: broad exposure, but fewer of the concentrated bets that produce outsized outcomes.
AI is beginning to change the composition. 38.8% of capital in the LA metro went to AI companies over the past two quarters. That’s the lowest AI share of any major city tracked here, but it’s rising.
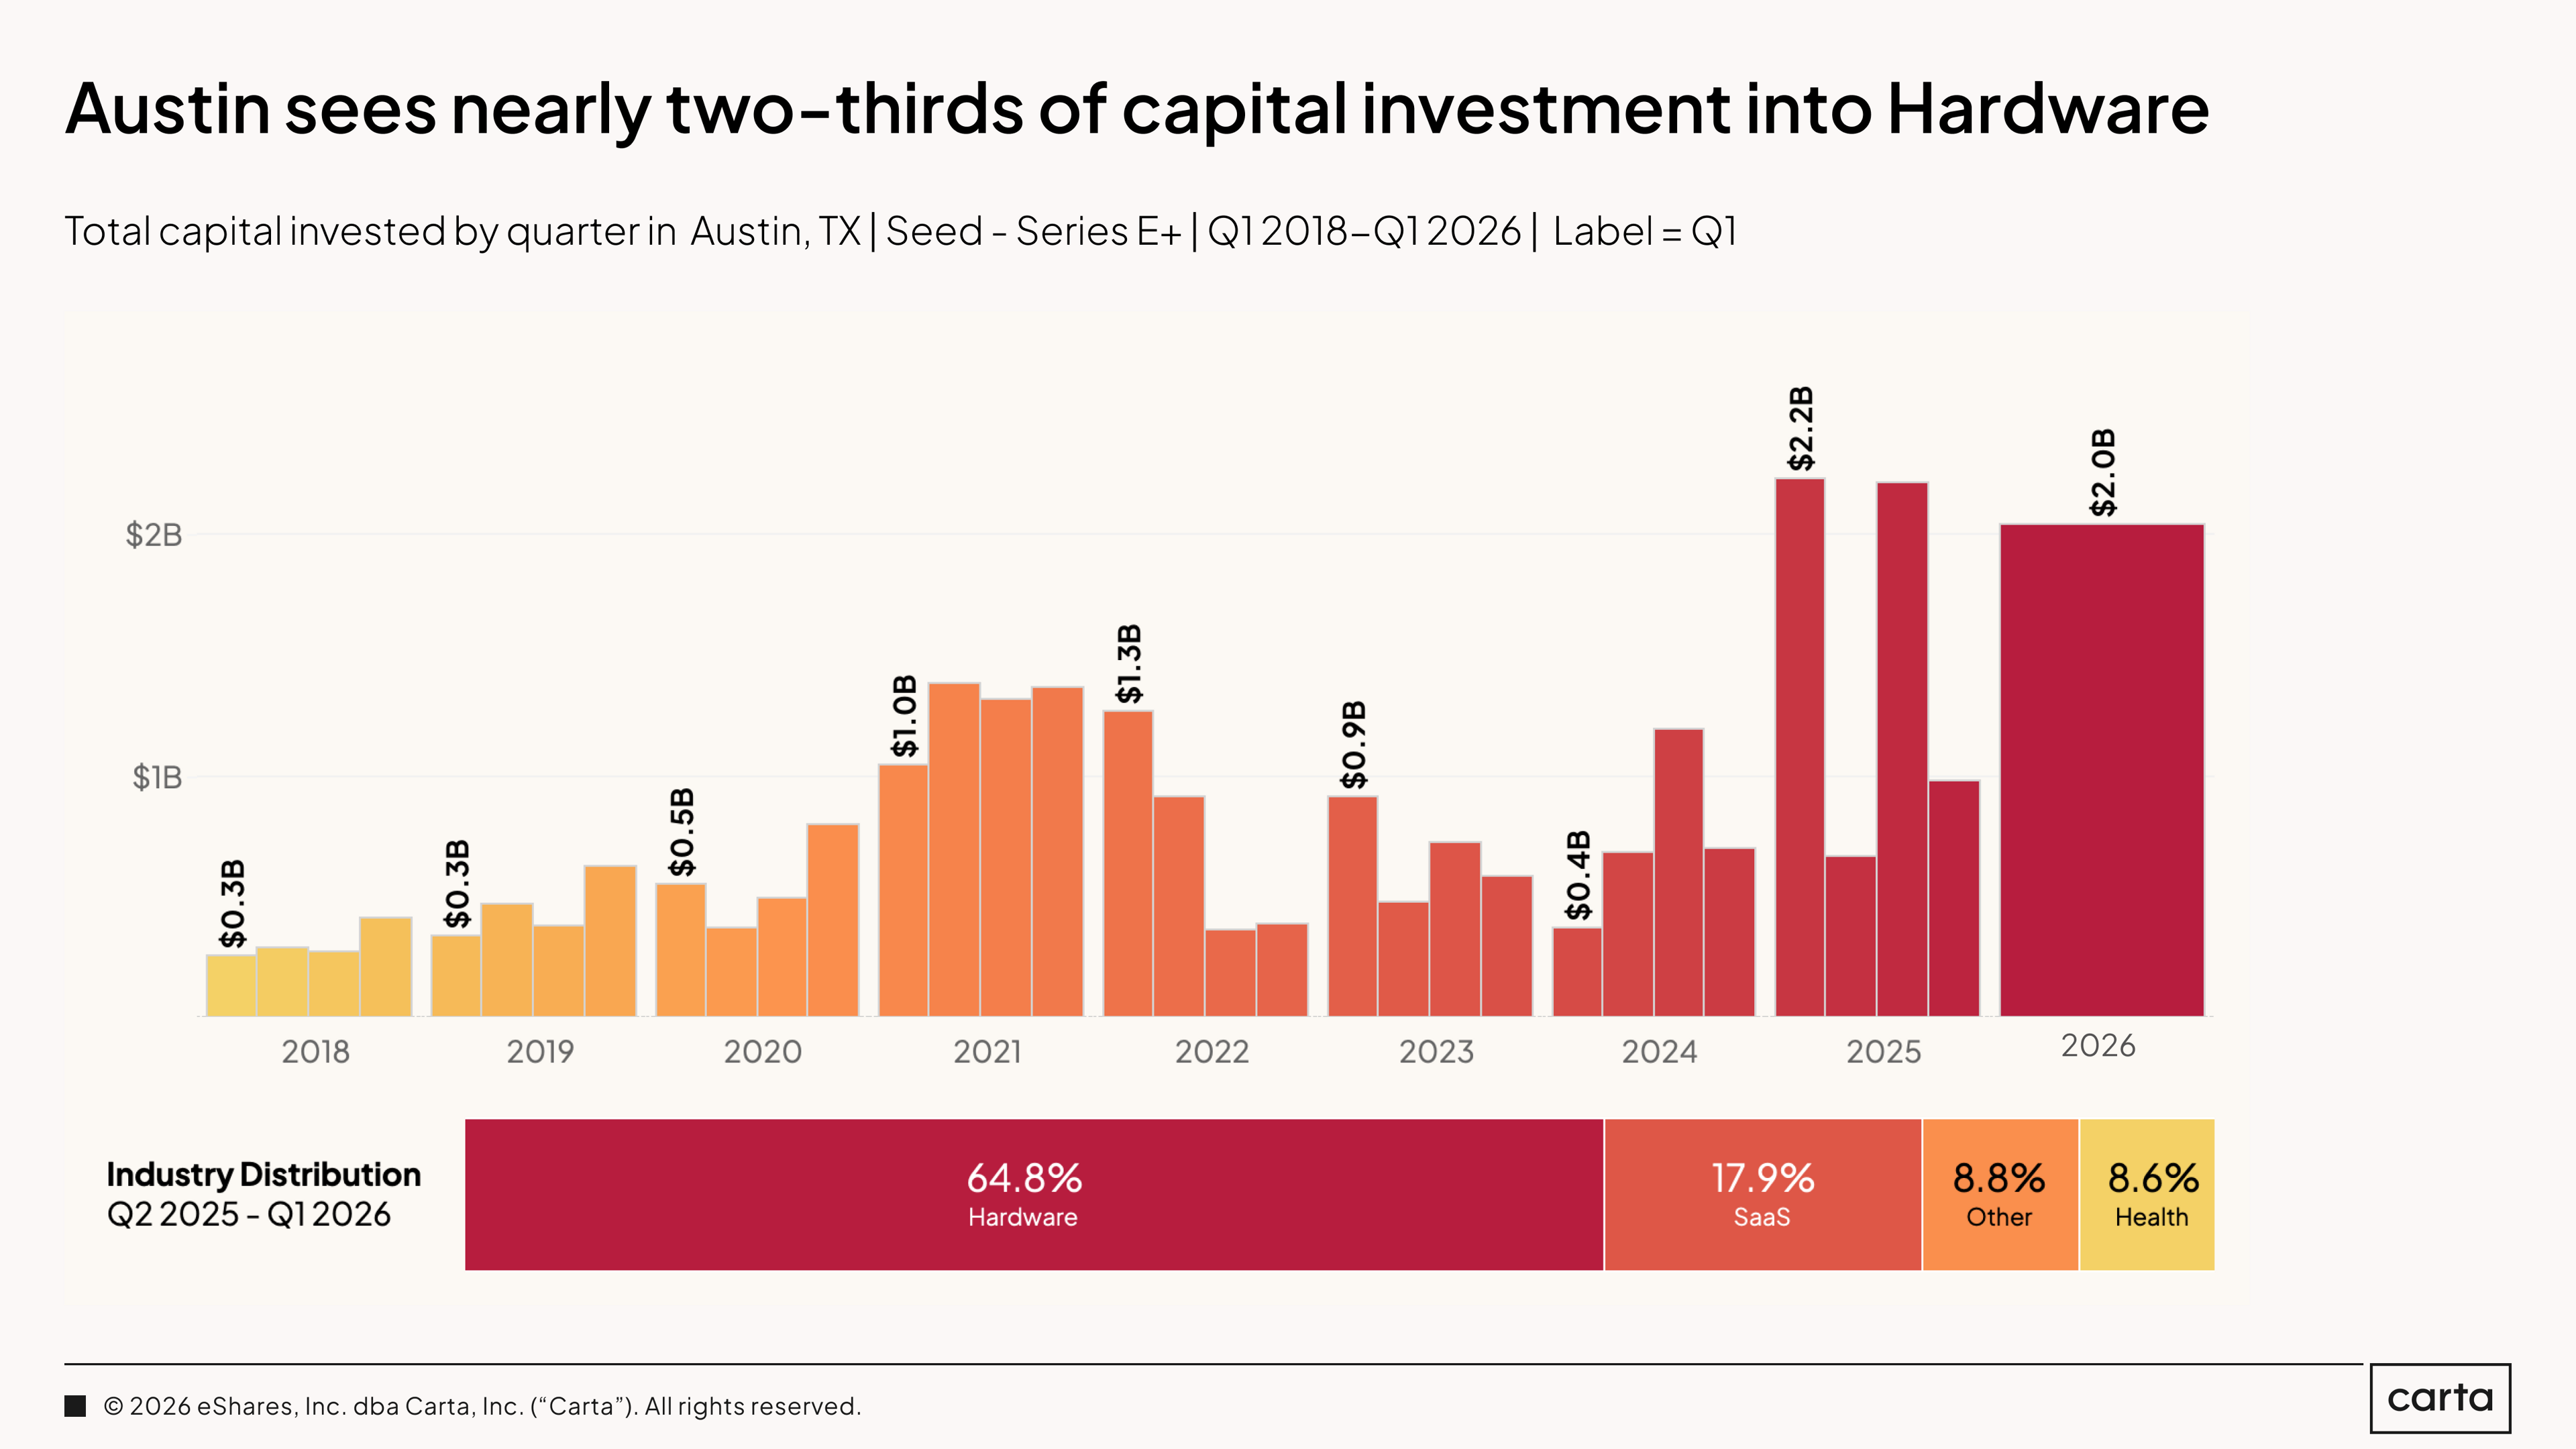
Austin is the second-largest AI hub in the country by share of capital, trailing only the Bay Area. 60% of venture investment in the Austin metro went to AI companies over the past two quarters, and the vast majority of that is AI applied rather than foundational model investment. Austin is building with AI, not building the models.
Texas claimed 6.6% of all U.S. venture capital on Carta over the past 12 months, the fourth-largest share of any state in the country. Austin’s early-stage valuations are within striking distance of the Bay Area: $22.6 million at seed, $74.2 million at Series A. The city is no longer a regional market. It is a national one.
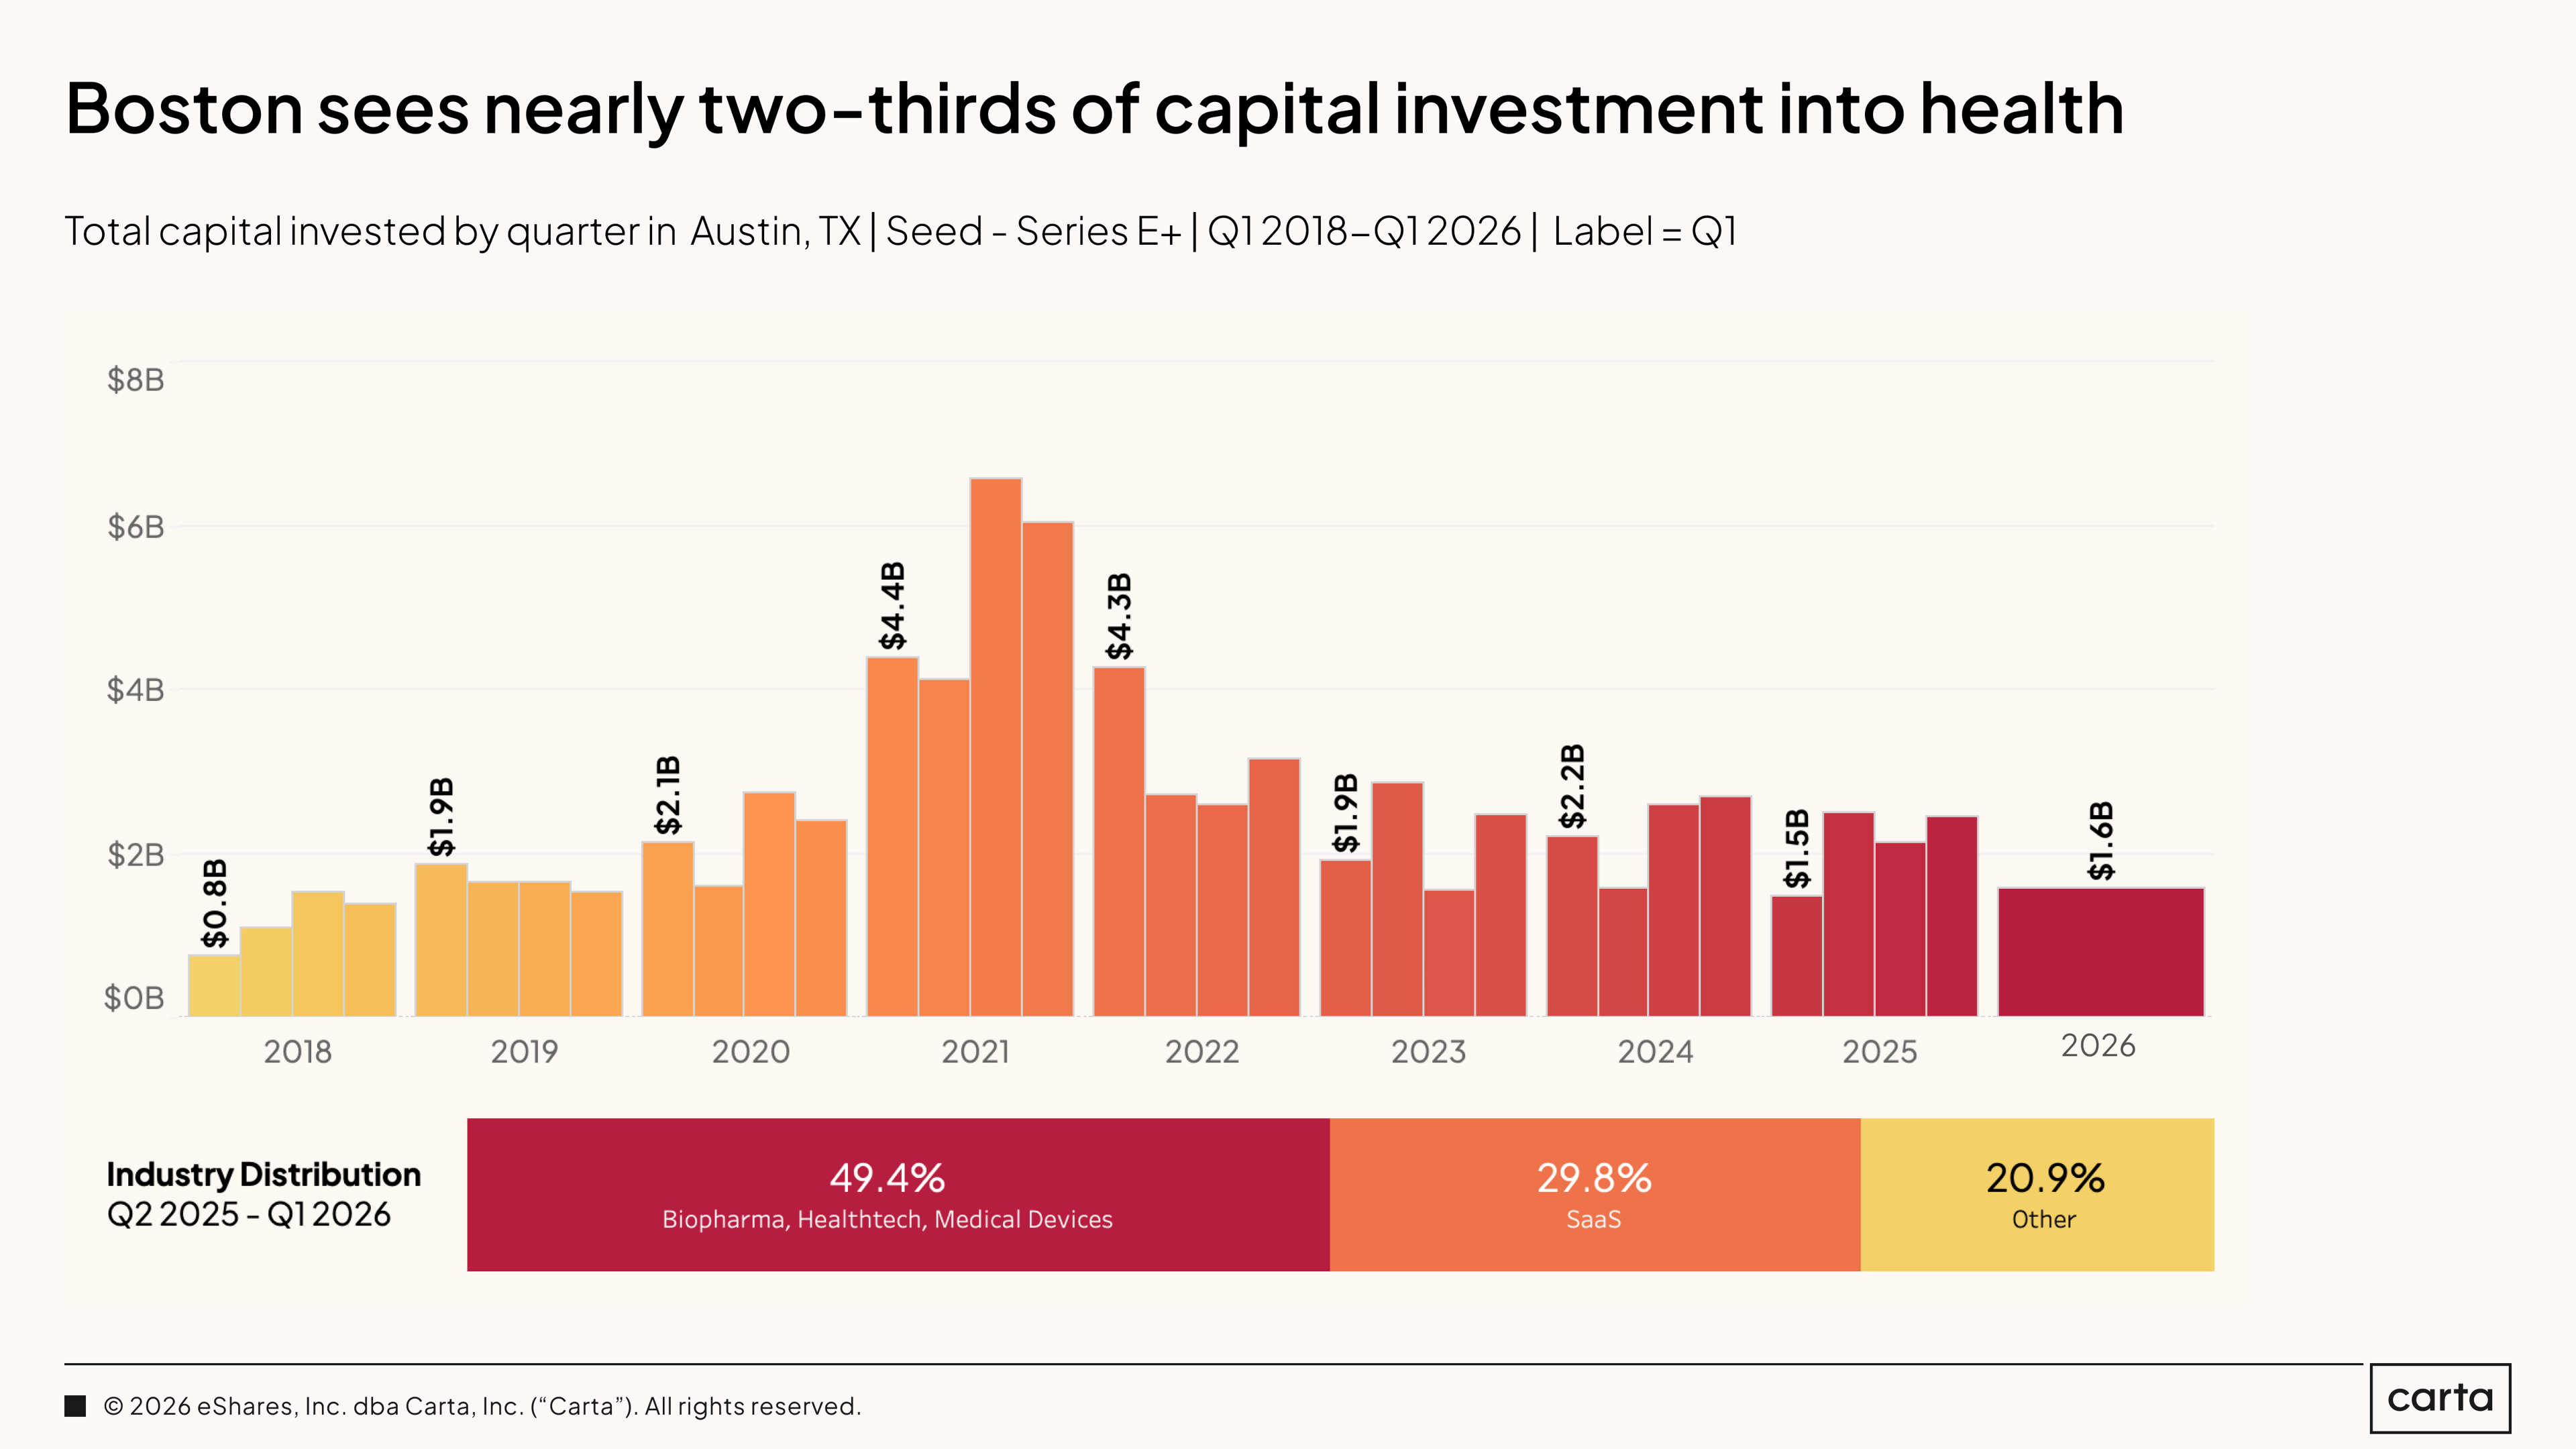
Boston is a health city. Nearly half of all capital invested in the metro over the past 12 months went to biopharma, healthtech, and medical devices combined, with SaaS a distant second at 29.8%. Q1 2026 came in at $1.6 billion, consistent with the range Boston has occupied since 2023 after falling sharply from the 2021 peak of $4.4 billion.
The concentration in health is both Boston's strength and its exposure. Federal funding cuts to research institutions have created headwinds for a startup ecosystem that sits unusually close to academic medical centers and NIH-dependent pipeline companies. The capital is still flowing. The environment around it is more complicated than the chart alone suggests.
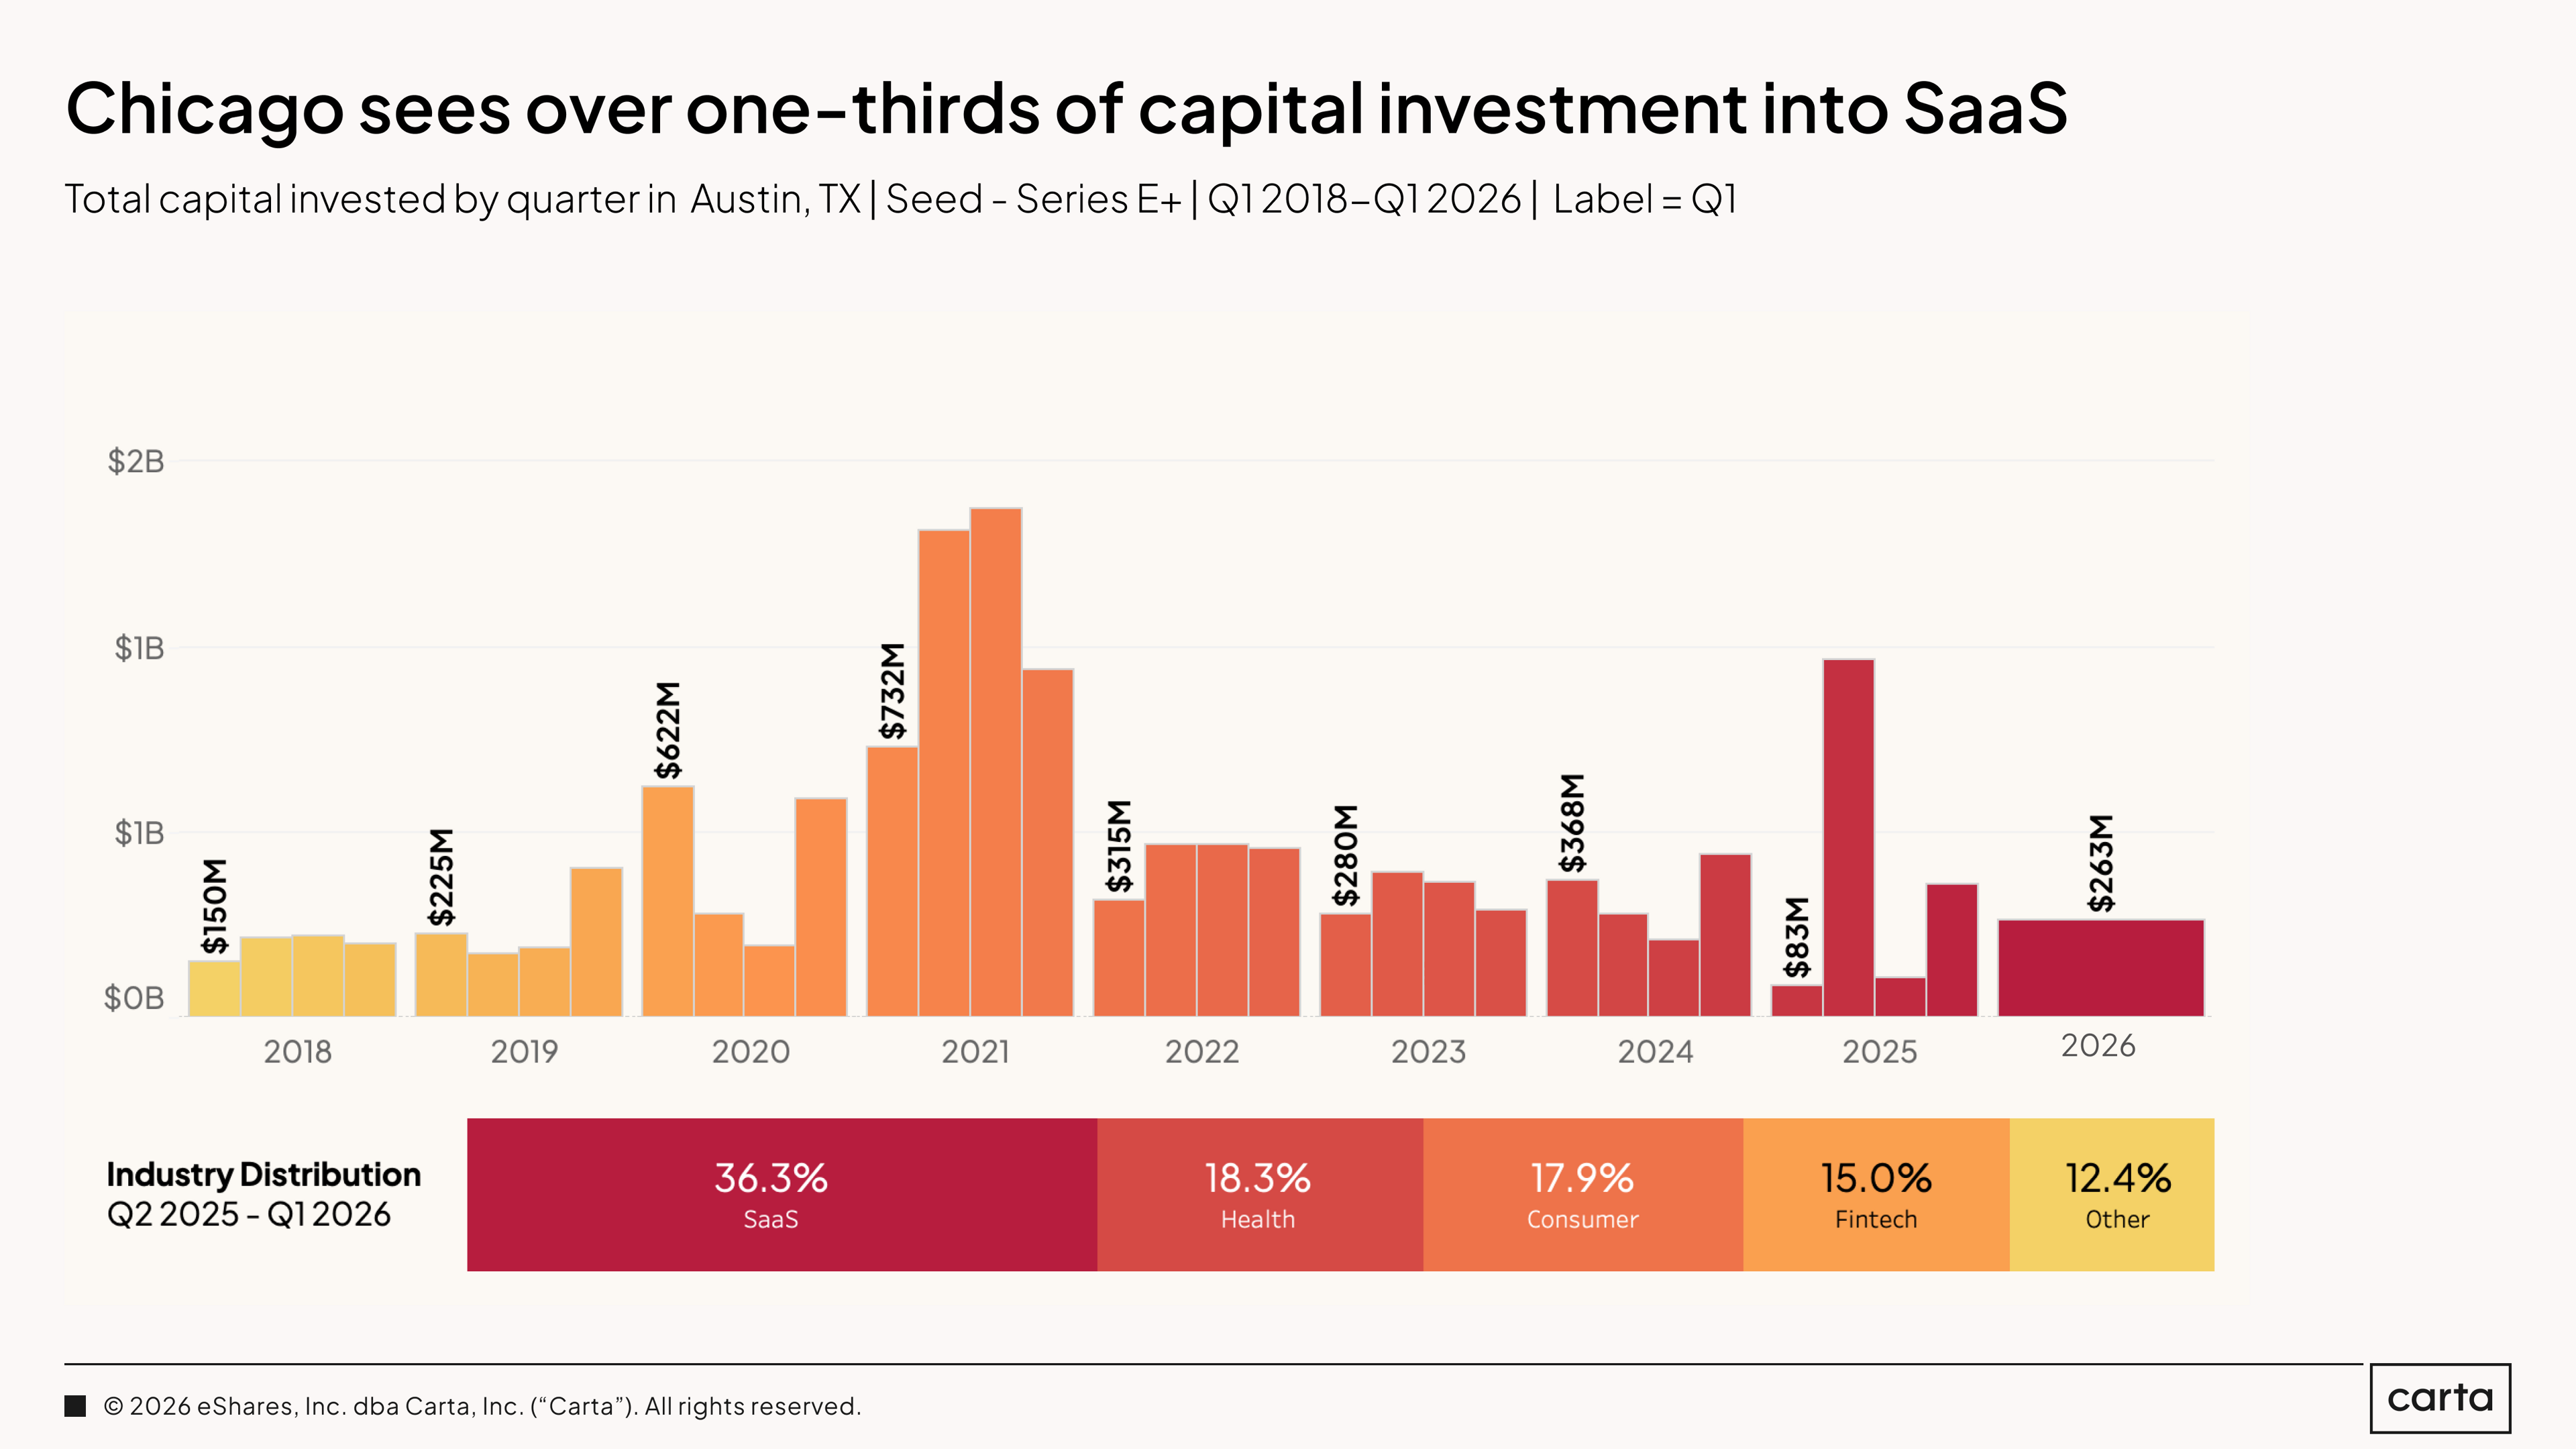
Chicago raised $263 million in Q1 2026, in line with the steady post-reset range the city has occupied since 2022. SaaS leads industry distribution at 36.3%, followed by health at 18.3%, consumer at 17.9%, and fintech at 15%. That balance is Chicago's defining characteristic: no single sector dominates, and the four leading categories are spread within a relatively tight range of each other.
The city peaked at $732 million in Q1 2021 and has not come close since. What it has built instead is a stable, diversified base that does not depend on any one category to sustain activity. For a market that is increasingly rewarding concentration elsewhere, Chicago's breadth is either resilience or a ceiling, depending on what comes next.
Conclusion
The Q1 2026 data describes a market that has healed unevenly and is now accelerating in specific directions. The terms are toward founders. The down-round cycle ended. Founders are retaining more equity. But the market is not uniformly healthy. It is specifically healthy for companies at the intersection of AI and institutional conviction, and notably more difficult for everyone else.
For founders outside the AI premium, the concentration trend is not going away. The average round size has more than doubled in three years. This means the companies getting funded are getting funded well. The ones that are not successfully raising are not getting a smaller check—they are getting nothing, or a bridge to wait for better conditions. The data on early-stage primary valuations softening this quarter is worth watching. It may be seasonal. It may also be the first legible signal that investors are beginning to price in what capable AI replaces.
For GPs, the barbell is real, and it requires a choice. The top of the market, foundational model companies, mega-rounds, the secondary names that account for the bulk of trading value—these groups all operate by different rules than the rest of the VC landscape. Entry discipline matters more than it has in years, because there are fewer rounds, larger checks, and higher prices. If you are writing the same check size you wrote in 2023, you are getting materially less ownership. The math on fund returns has changed at every stage.
For both, the liquidity environment is in transition. The secondary market has grown into a genuine parallel system. Tender offers have become standard practice at the most sophisticated companies and a meaningful strategic tool for cap table management at others. The IPO market is not open at scale, but it is cracking. This matters for the current IPO pipeline. The $4 trillion in value sitting locked in private unicorns needs an exit path. The IPOs of SpaceX, Anthropic, and Databricks, if and when they come, will be the largest liquidity events in the history of venture capital. What they do for LP distributions, fund recycling, and the appetite for the next generation of early-stage investment will define the market for the rest of the decade.
Methodology
Carta helps more than 50,000 primarily venture-backed companies who have combined to raise more than $1.2 trillion in equity. We share insights from this unmatched dataset about the private markets and venture ecosystem to help founders, employees, and investors make informed decisions and understand market conditions.
Overview
This study uses an aggregated and anonymized sample of Carta customer data. Companies that have contractually requested that we not use their data in anonymized and aggregated studies are not included in this analysis.
The data presented in this private markets report represents a snapshot as of May 2026. Historical data may change in future studies because there is typically an administrative lag between the time a transaction took place and when it is recorded in Carta. In addition, new companies signing up for Carta’s services will increase historical data available for the report.
Financings
Financings include equity deals raised in USD by U.S.-based corporations. The financing “series” (e.g. Series A) is taken from the share class name in their applicable certificate or articles of incorporation. Financing rounds that don’t follow this standard are not included in any data shown by series but are included in data not shown by series. Primary rounds are defined as the first equity round within a series. Bridge rounds are defined as any round raised after the first round in a given series.
In some cases, convertible notes are raised and converted at various discounted prices within a series (e.g. Series A-1, Series A-2, Series A-3). In these cases, converted securities are not included in cash raised, and only the post-money valuation of the new money is included.

DISCLOSURE: This communication is on behalf of eShares, Inc. dba Carta, Inc. ("Carta"). This communication is for informational purposes only, and contains general information only. Carta is not, by means of this communication, rendering accounting, business, financial, investment, legal, tax, or other professional advice or services. This publication is not a substitute for such professional advice or services nor should it be used as a basis for any decision or action that may affect your business or interests. Before making any decision or taking any action that may affect your business or interests, you should consult a qualified professional advisor. This communication is not intended as a recommendation, offer or solicitation for the purchase or sale of any security. Carta does not assume any liability for reliance on the information provided herein. © 2026 Carta. All rights reserved. Reproduction prohibited.