Executive summary
During the second quarter of 2025, the typical venture investment got a little bit smaller.
At every stage from seed through Series D, there were more new venture investments on Carta in Q2 than there were in Q1. At the same time, total cash raised declined quarter over quarter at Series A, Series B, and Series C, and increased slightly at Series D.
As a result, the average venture round size is shrinking across most of the startup lifecycle. Average check size in Q2 was down at every stage from Series A through Series D, with declines landing between 3% and 9%.
Venture deal counts were higher in Q2 than in Q1. But on a longer timeline, activity remains relatively diminished. Across all stages in Q2, startups on Carta closed 1,187 new venture rounds, down 13% year over year. Across the whole of H1, deal count is down 10% compared to 2024.
At the same time, startup valuations in new funding rounds continue to trend up, at least at the early stages. At both seed and Series A, the median valuation was higher in Q2 than it’s ever been before. In just the past year, the median valuation on primary rounds at Series A has risen by 20%.
Combine these various fundraising trends together, and a picture starts to emerge of how the venture capital industry is shifting in the early days of the AI age. Investors have grown more selective in their investments, leading to fewer deals. Aided by AI, many companies can do just as much (or more) with less funding, reducing the need for enormous checks. And the rising tide of valuations shows that VCs believe that many of these young, lean startups are poised for explosive, lucrative growth in the years to come.
Q2 highlights
SaaS, hardware see a funding surge: SaaS startups on Carta combined to raise $9.7 billion in Q2, a 91.2% increase from the same period two years ago. Over that same span, cash raised by hardware startups has risen by 110.4%.
Time between rounds ticks up: The median wait time between new funding rounds across all stages reached 696 days in Q2. That’s a slight increase both quarter over quarter (up 5%) and year over year (also 5%).
The Bay Area’s fundraising bump: In the past two years, the map of venture fundraising in the U.S. has tilted even further toward Silicon Valley. Startups in San Francisco raised $36.7 billion in Q2, up 138% from two years earlier. Fundraising in San Jose is up by 14% over the same span.
Key trends
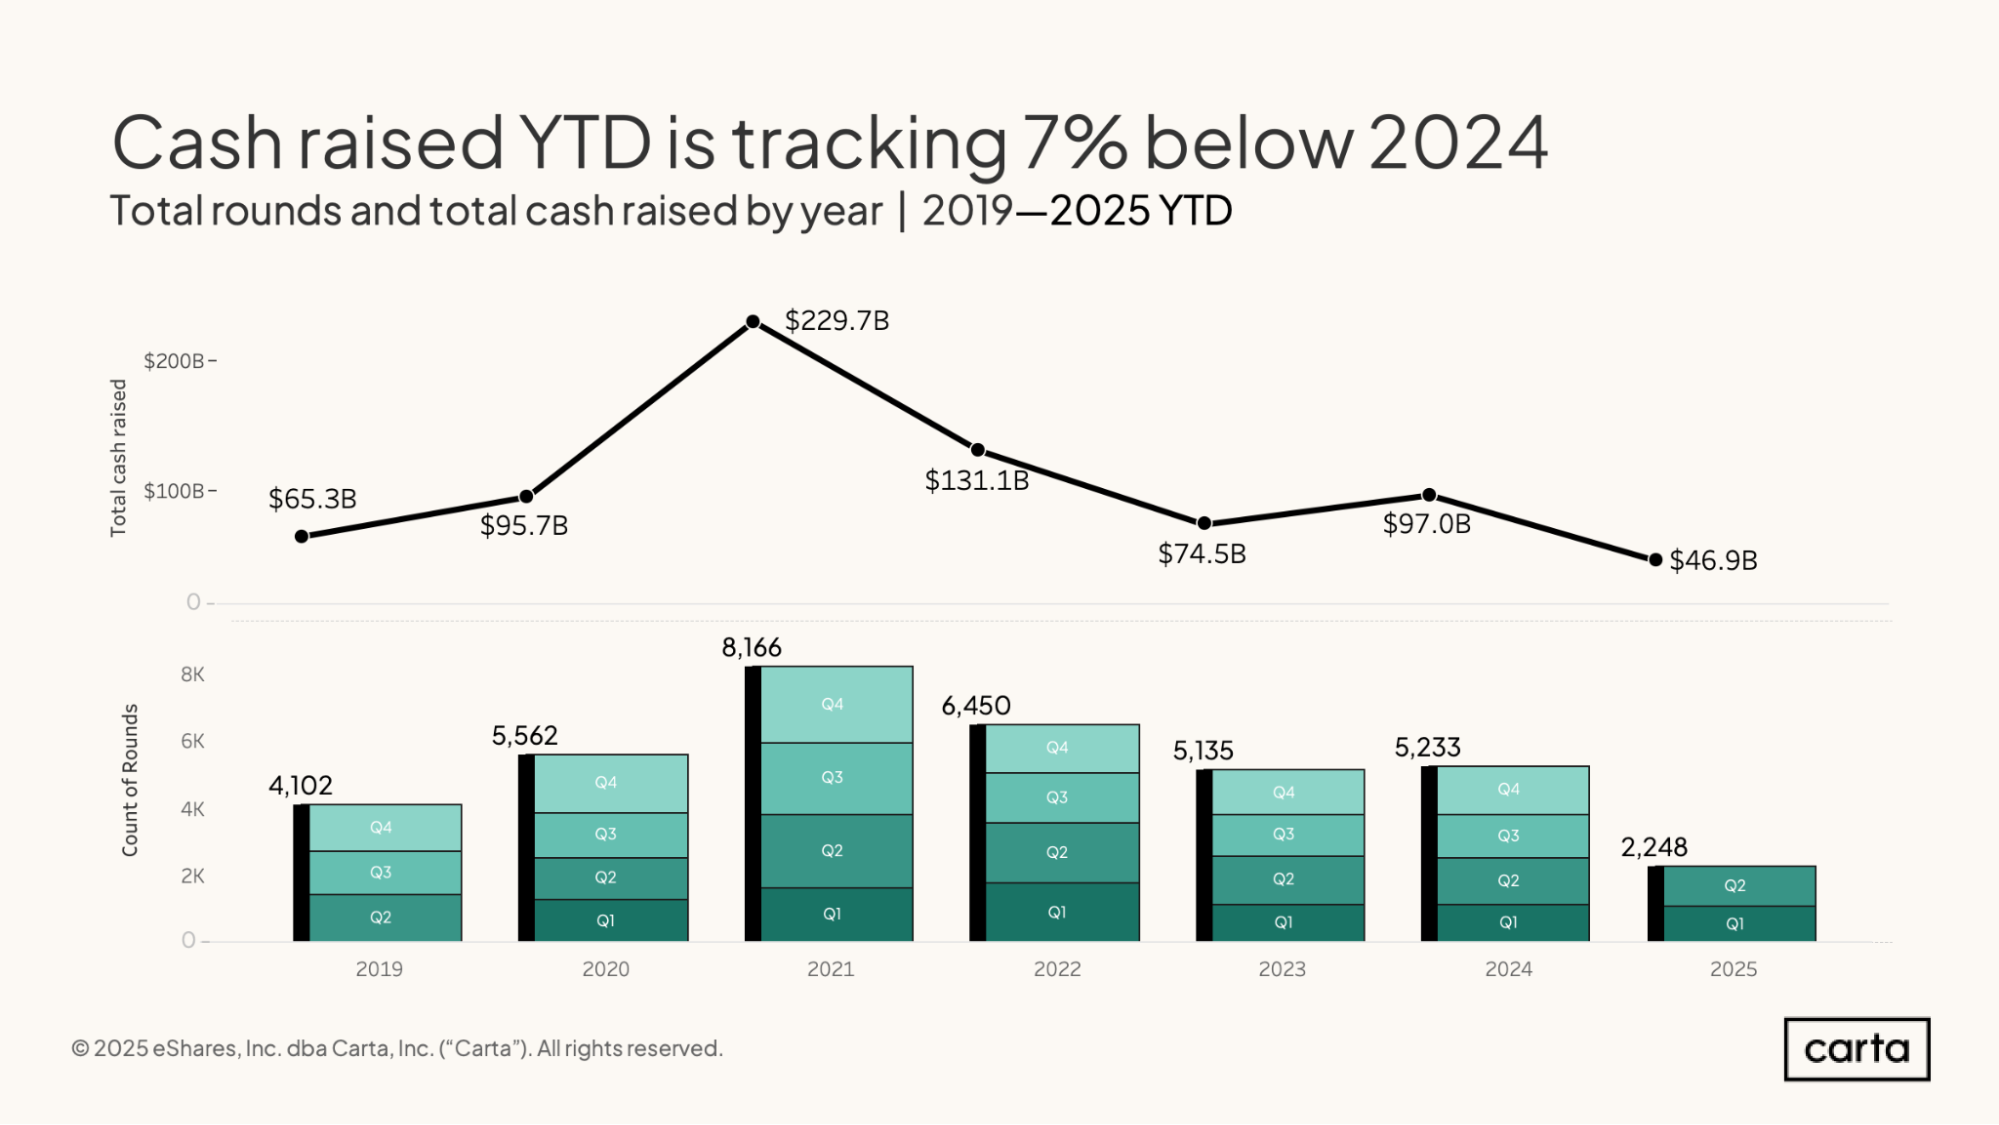
Through the first half of 2025, companies on Carta combined to raise $46.9 billion in new venture capital across 2,248 funding events.
In terms of cash invested, this year is pacing slightly behind 2024; if we extrapolate H1 2025’s total over the full year, we get $93.8 billion, just shy of last year’s $97 billion. The pace of new investments taking place has slowed down more substantially. Compared to H1 of last year, deal count in H1 2025 was down 10%.
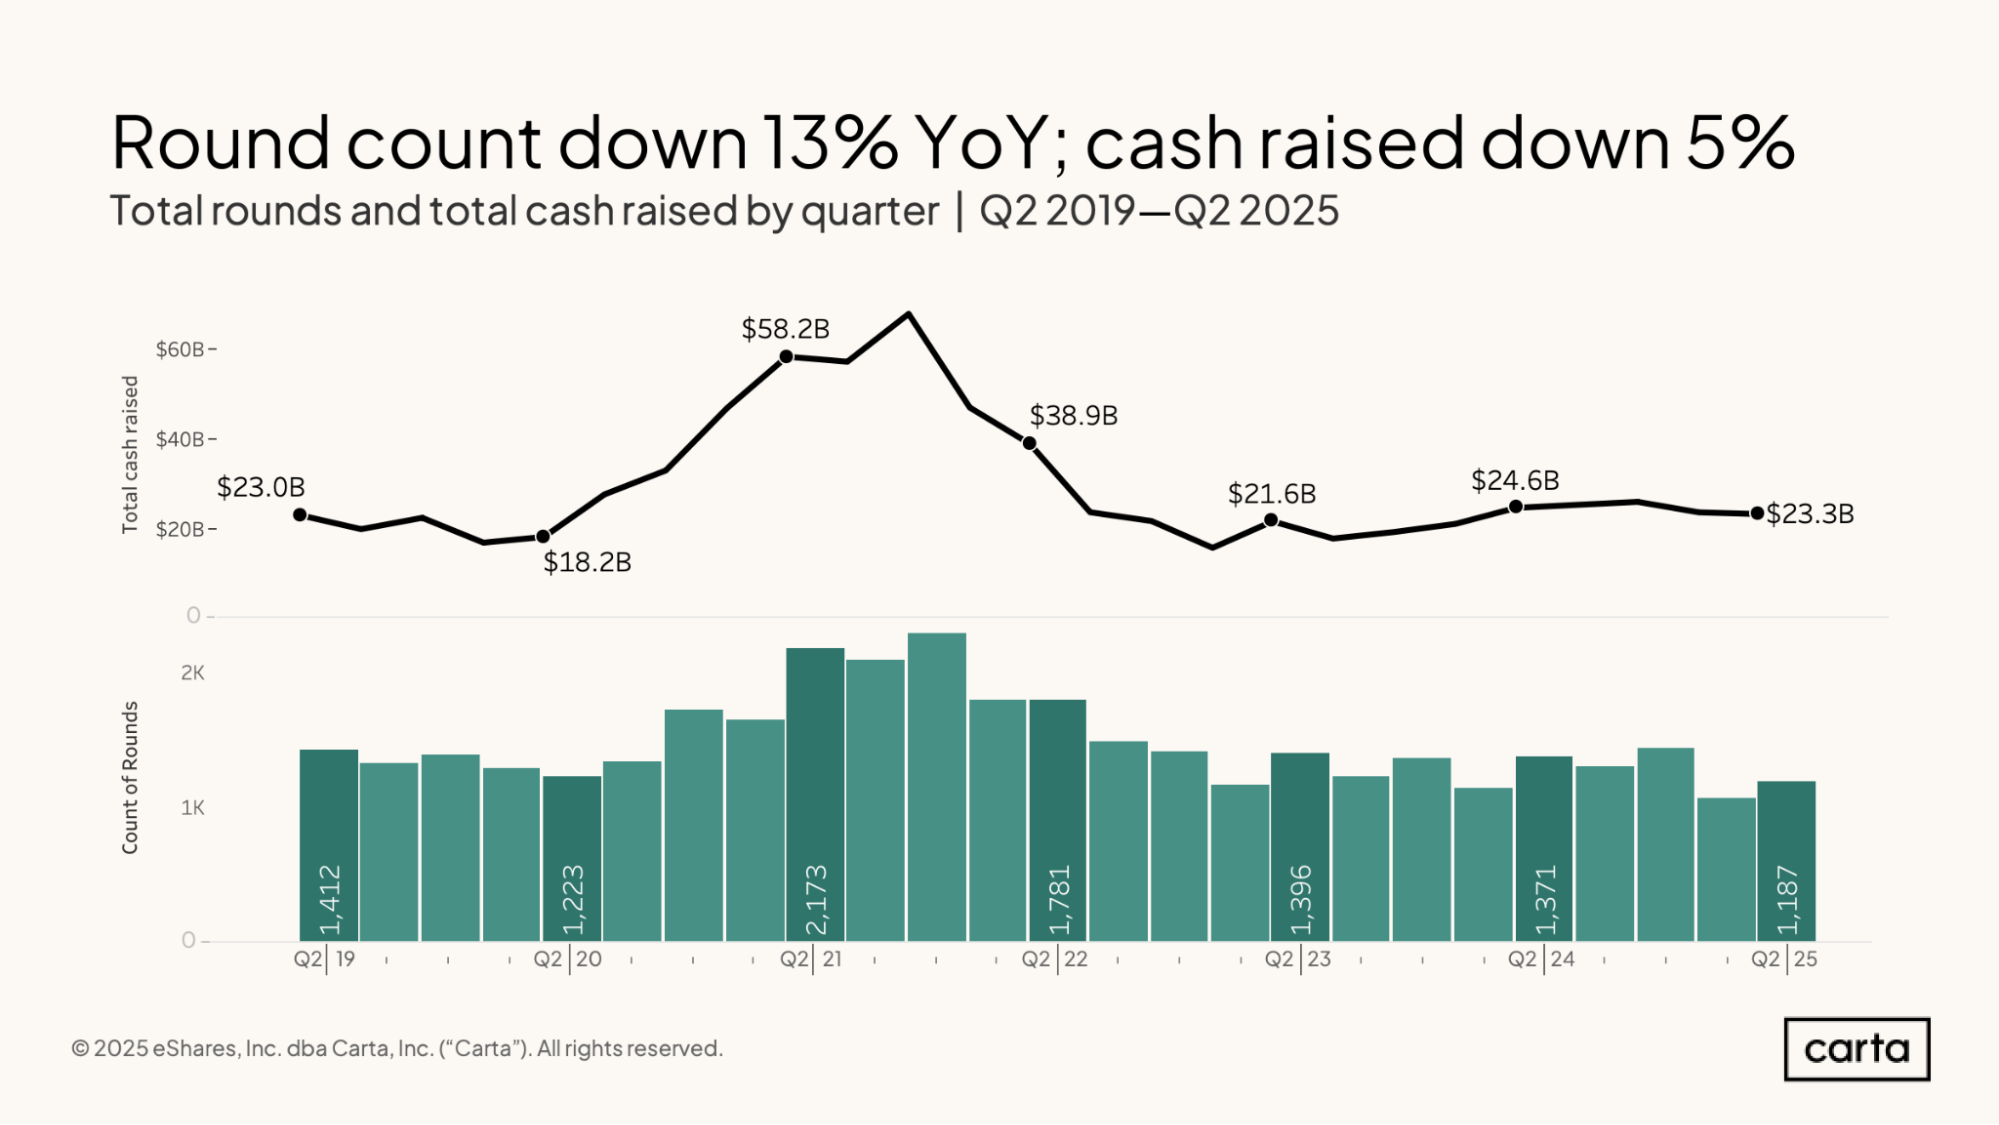
Compared to a year ago, companies on Carta raised 13% fewer venture rounds this Q2. This marks the fourth consecutive Q2 in which the number of new investments has declined on a year-over-year basis. Total cash raised in Q2 also declined year over year, falling by 5%.
Despite this recent downward movement, both total round count and total cash raised by startups on Carta has remained relatively consistent over the past 10 quarters. Dating back to Q4 2022, most quarters have seen between 1,100 and 1,400 new investments and between $20 billion and $25 billion in cash raised.
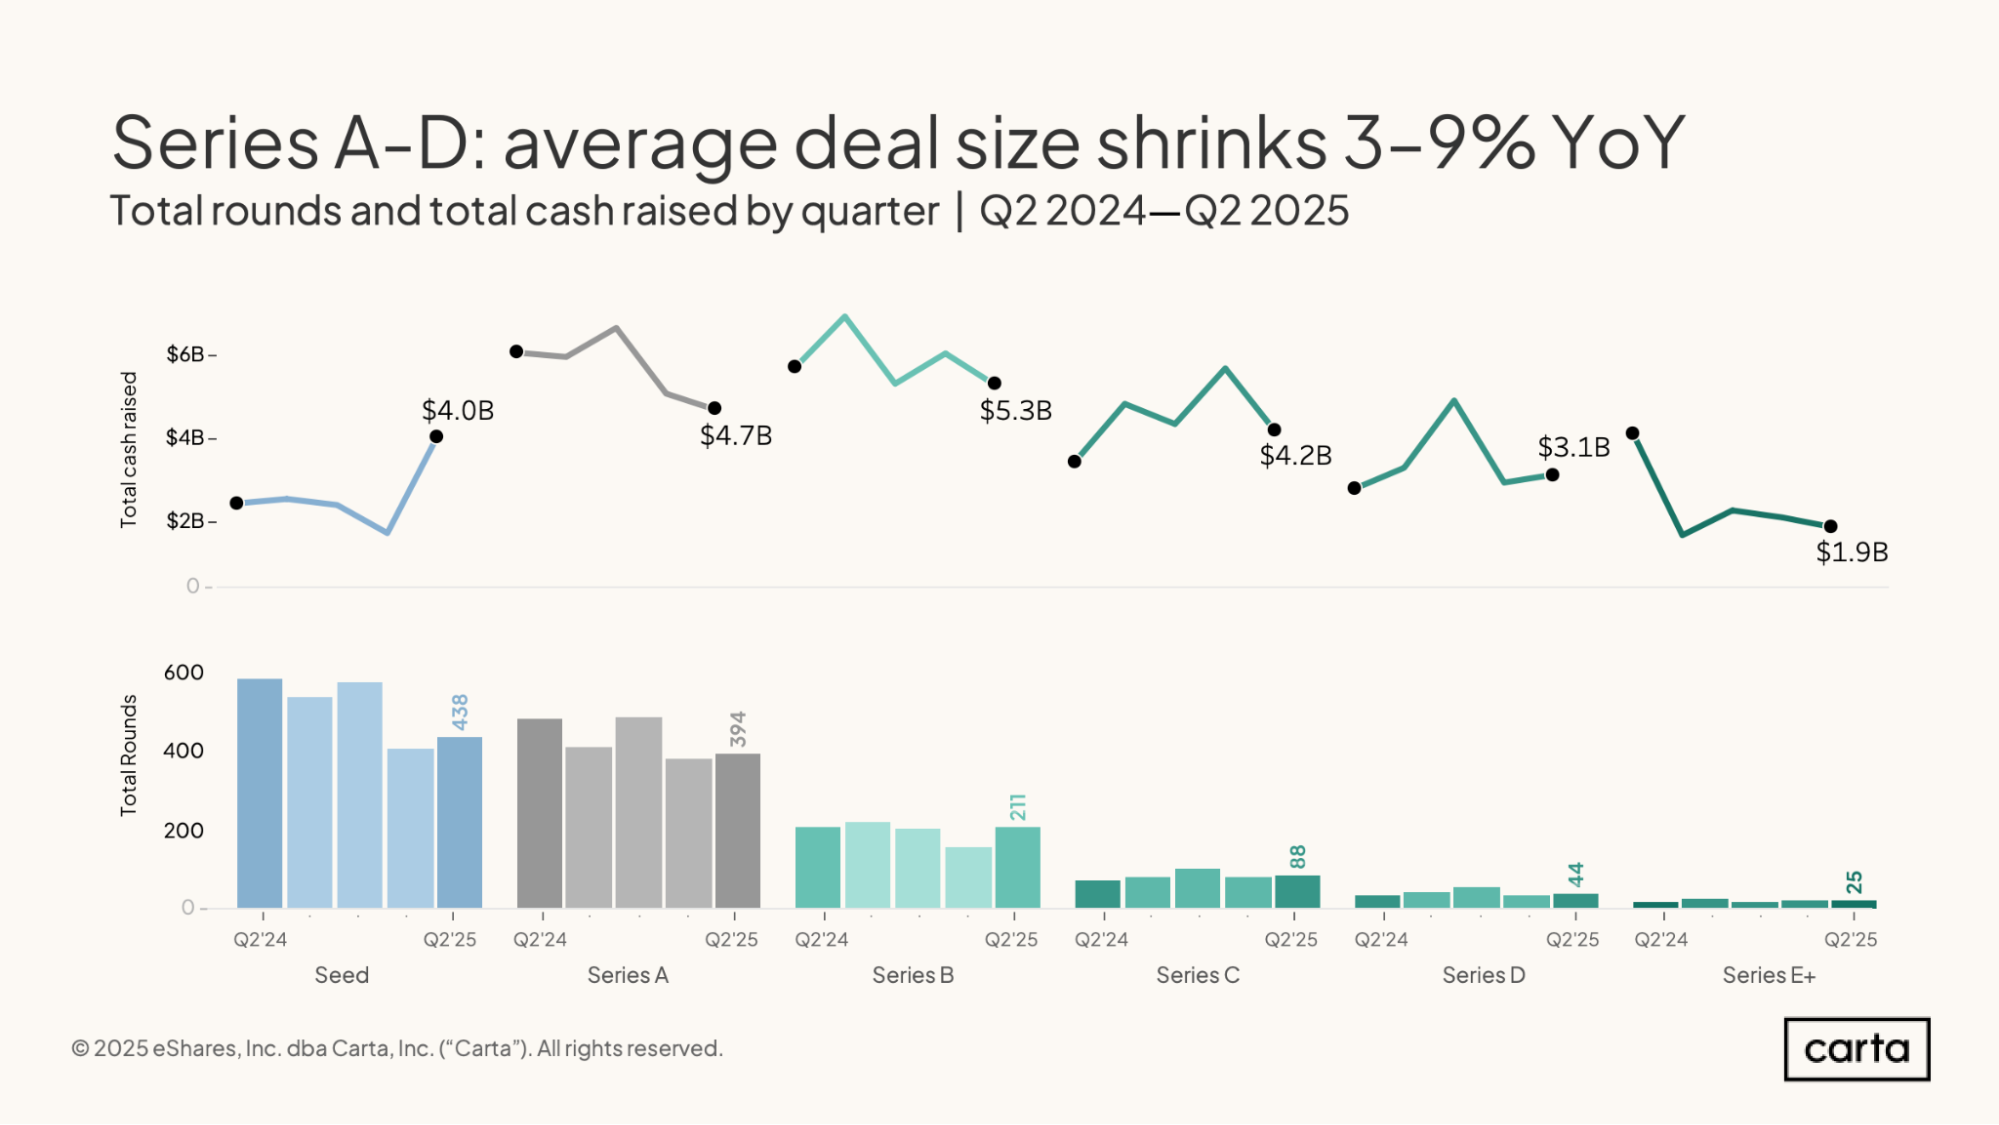
Compared to the previous quarter, Q2 saw an increase in venture deal count at every stage from seed through Series D. At the same time, however, total cash raised in Q2 declined at Series A, Series B, Series C, and Series E+. While more venture investments were taking place, the amount of total cash going into those investments was shrinking.
The seed stage was a major exception to this trend, with cash raised spiking all the way to $4 billion in Q2. This is primarily due to a single large outlier investment—but even without that outlier, transaction value at the seed stage would have been slightly up in Q2 on a quarter-over-quarter basis.
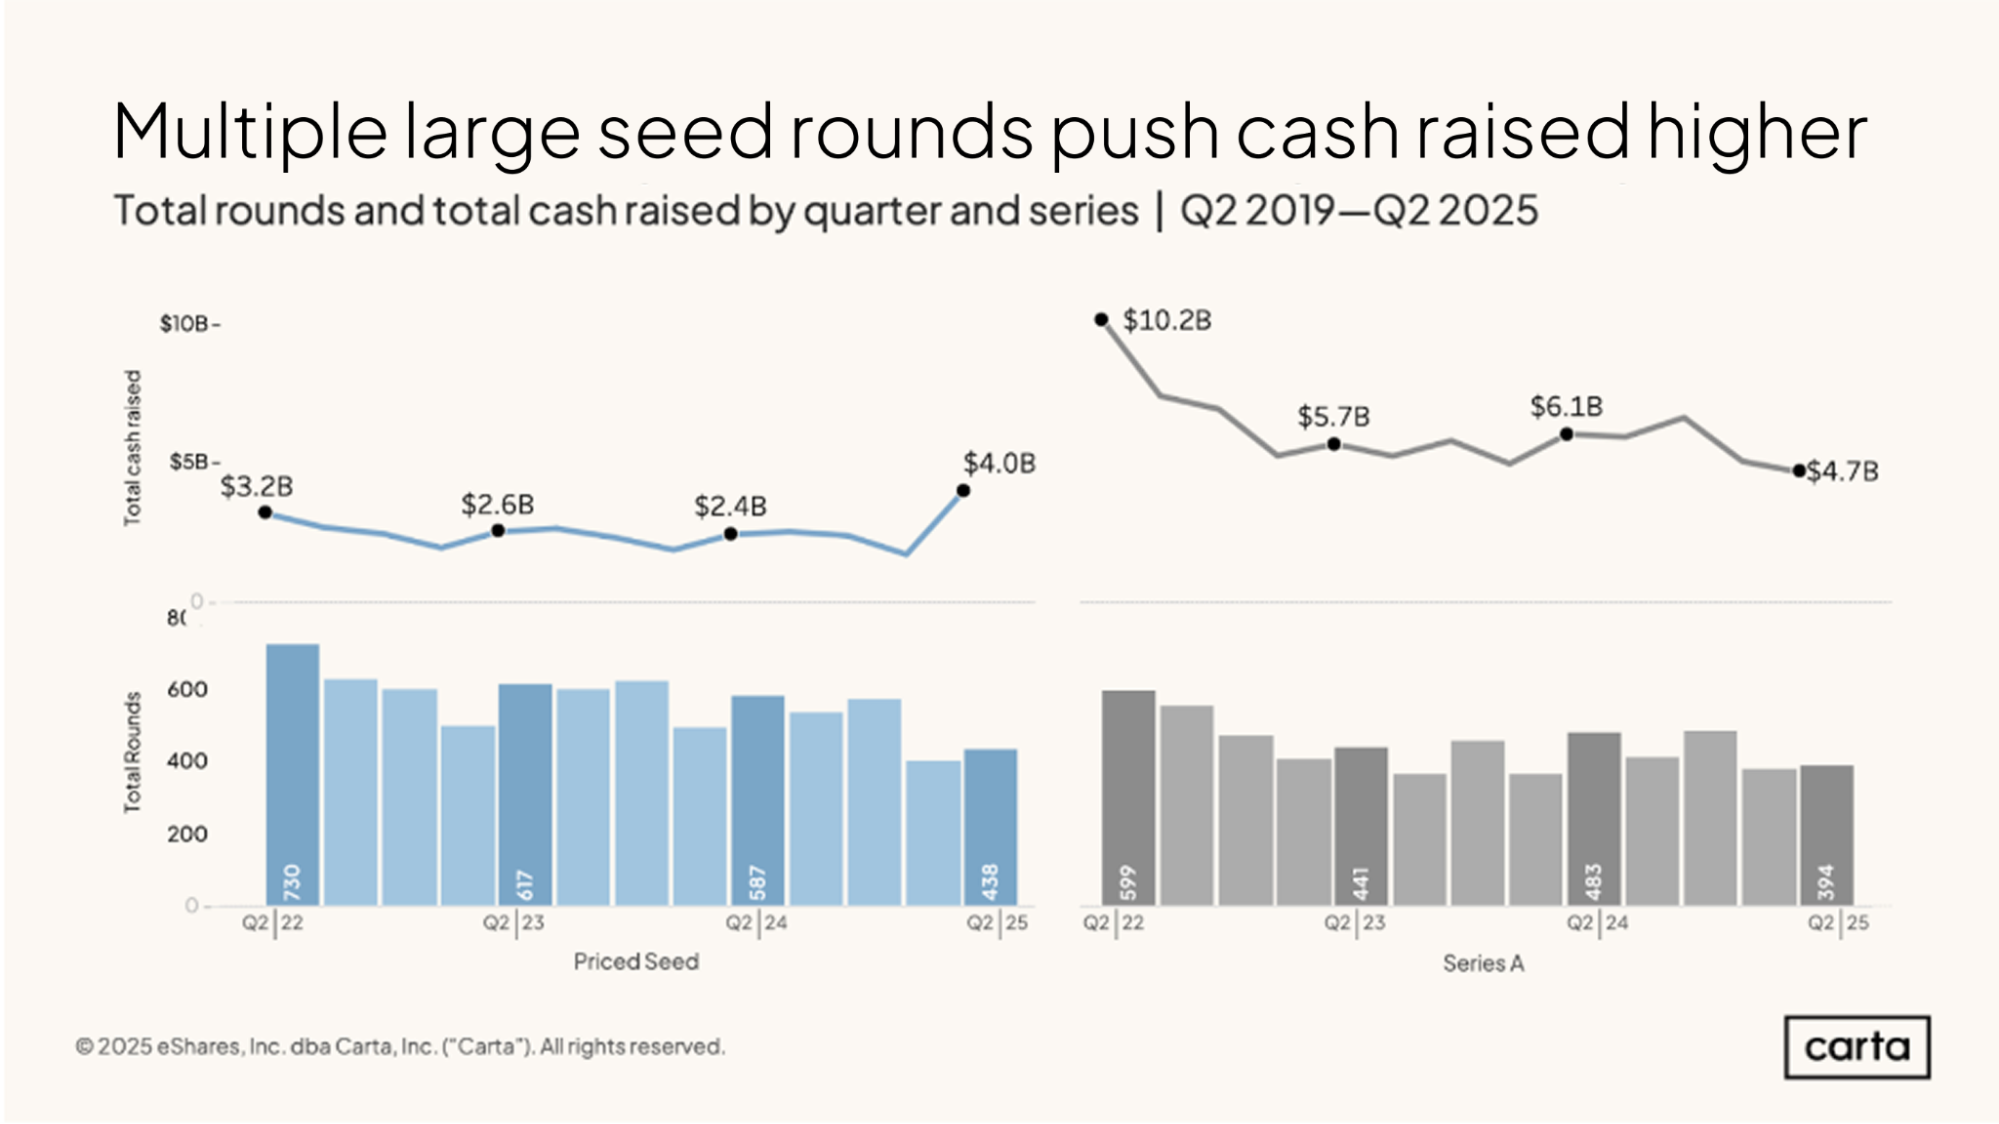
At both the seed stage and Series A, quarterly round counts in Q2 were near their lowest points of the past three years. Compared to this same time a year ago, deal count at seed is down 25%, while deal count at Series A fell by 18%.
At seed, total cash raised in Q2 rose considerably, boosted by the presence of the aforementioned outlier round. Cash raised at Series A, meanwhile, has continued to trail off in the past year. In Q2 2025, Series A startups on Carta raised 23% less funding than they did in Q2 2024.
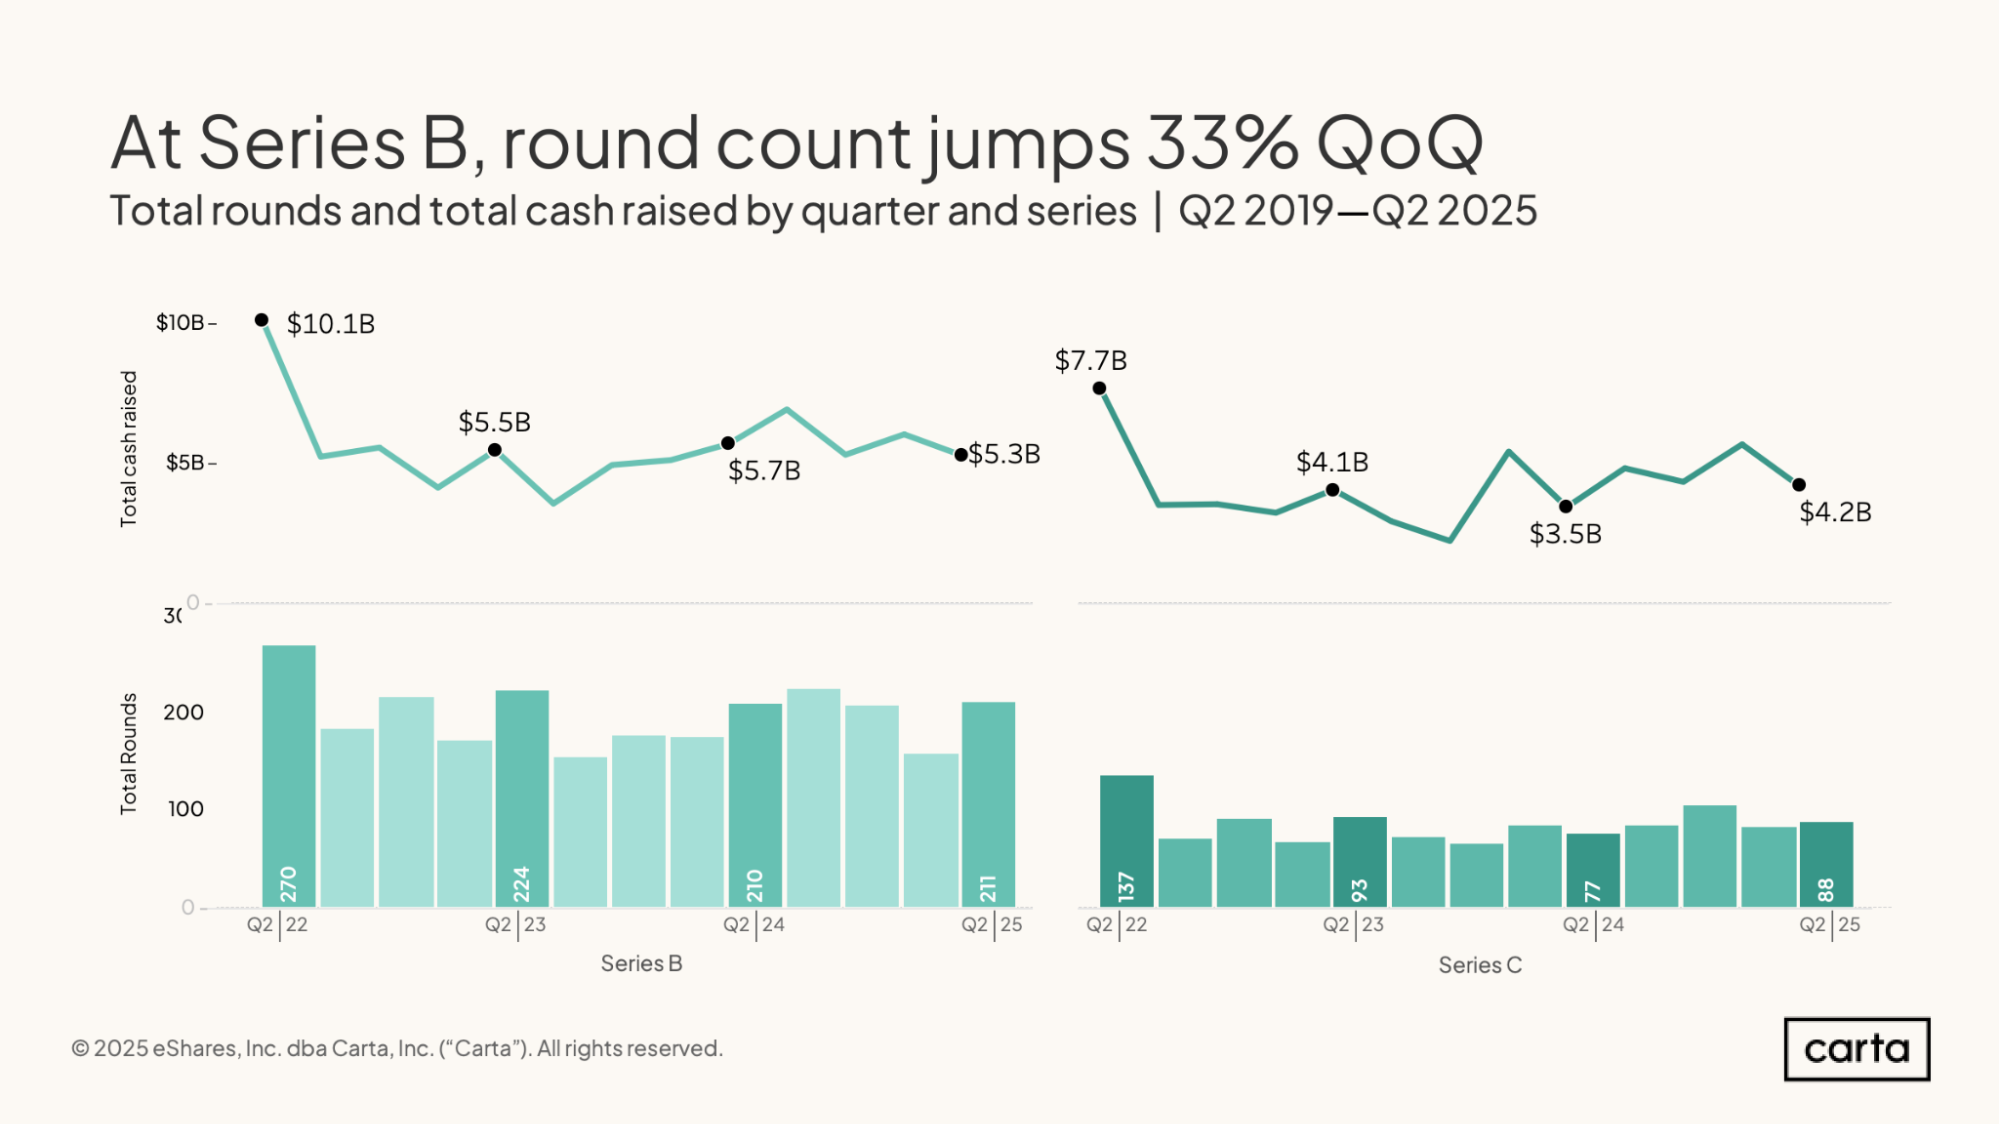
Series B deal count on Carta jumped 33% quarter over quarter in Q2, bouncing back from a slow Q1. On a year-over-year basis, deal count at Series B has held almost perfectly steady. Cash invested at Series B, meanwhile, is down 7% YoY.
Series C startups on Carta raised $4.2 billion in new funding in Q2, which is a decline from Q1 but still good for a 20% increase year over year. Series C also saw a 14% annual bump in deal activity during Q2, the largest year-over-year increase in deal count at any stage.
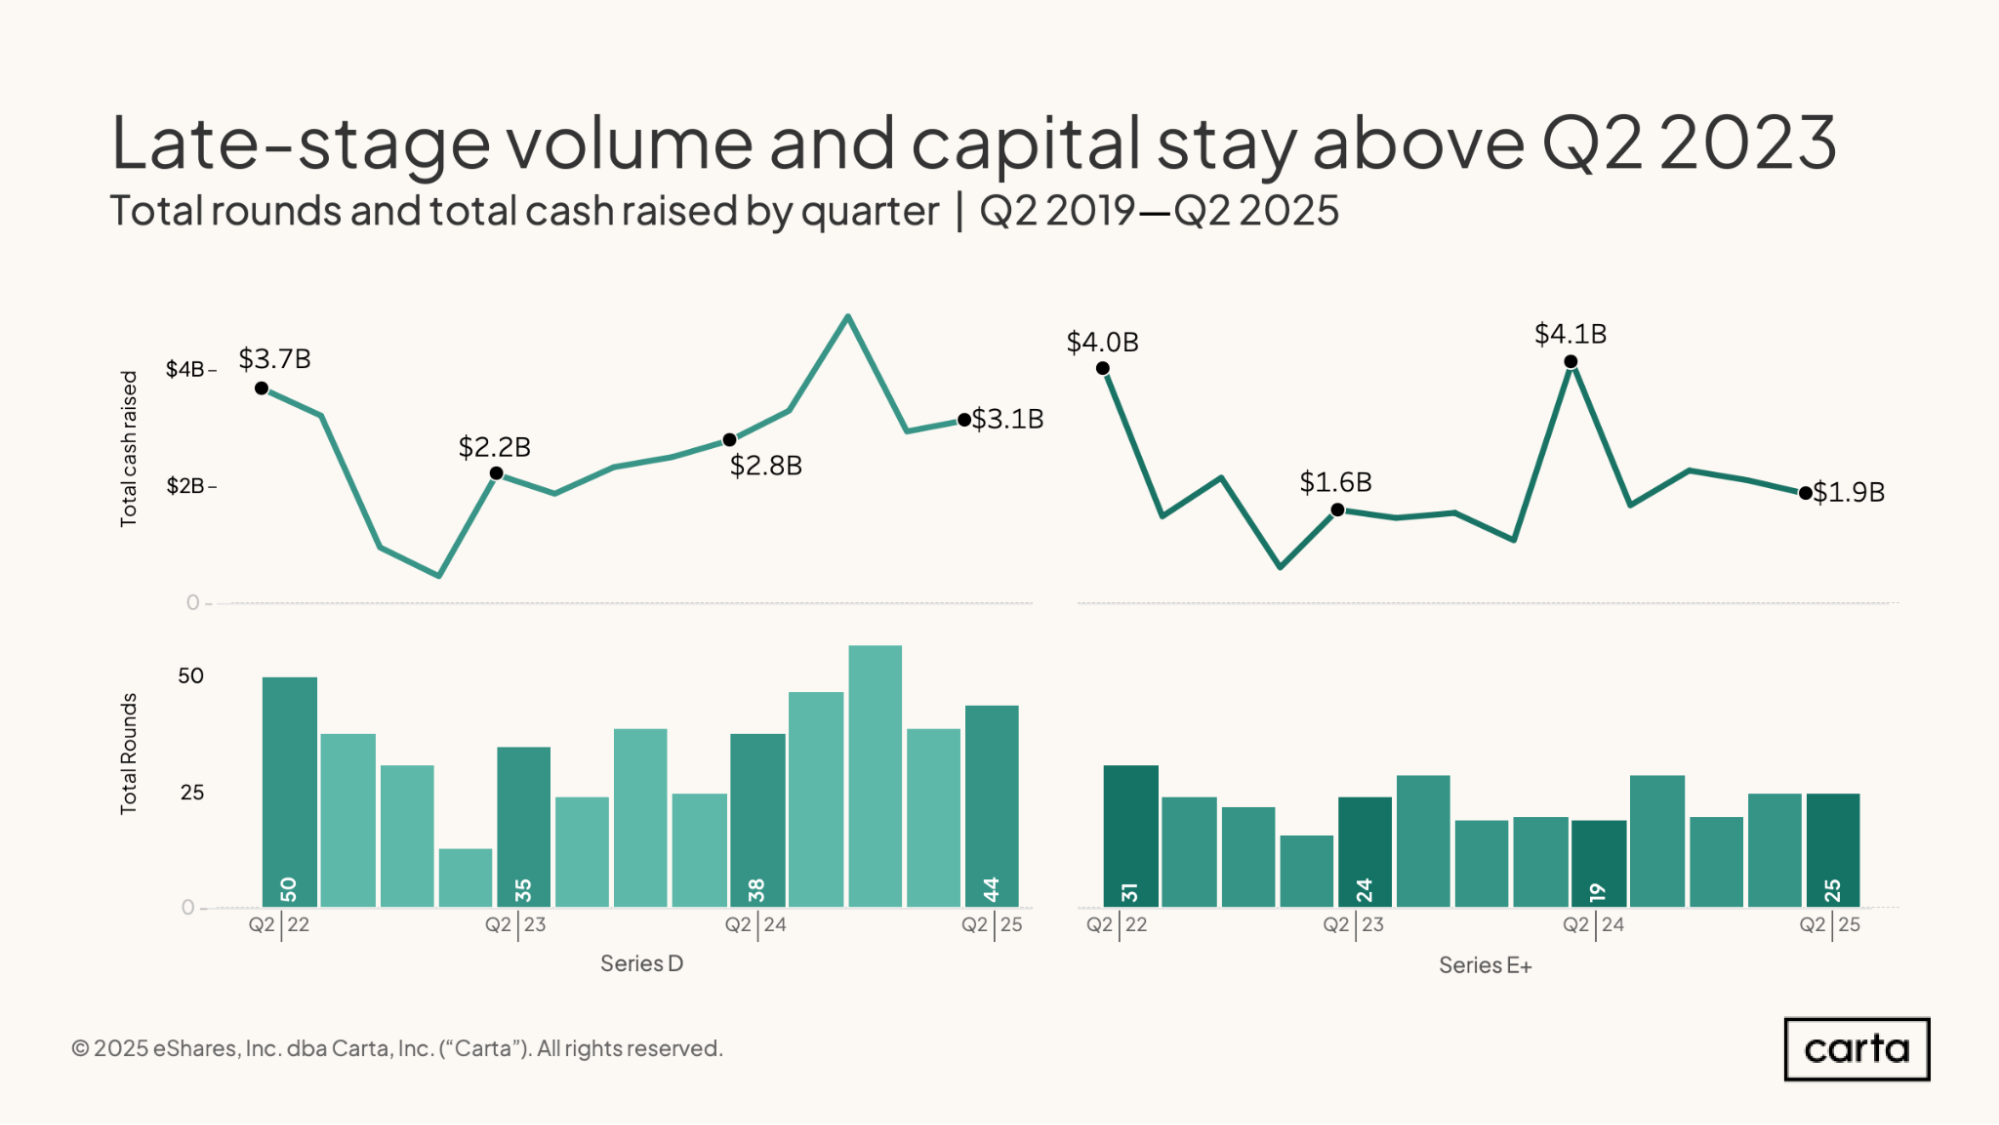
Year over year, the number of new investments logged on Carta climbed by 16% at Series D during Q2 and by 32% at Series E and beyond. At Series D in particular, quarterly deal counts have been noticeably higher over the past year, reflecting a significant uptick in activity after a slowdown in Series D dealmaking that occurred in 2022 and early 2023.
The amount of cash raised by Series D startups on Carta has also been trending up. Compared to last year, total investment in Series D startups rose by 11% in Q2. Compared to two years ago, it rose by 41%. Cash raised at Series E, meanwhile, is down 54% year over year—but the sum of $4.1 billion raised back in Q2 2024 is looking more and more like a recent outlier.
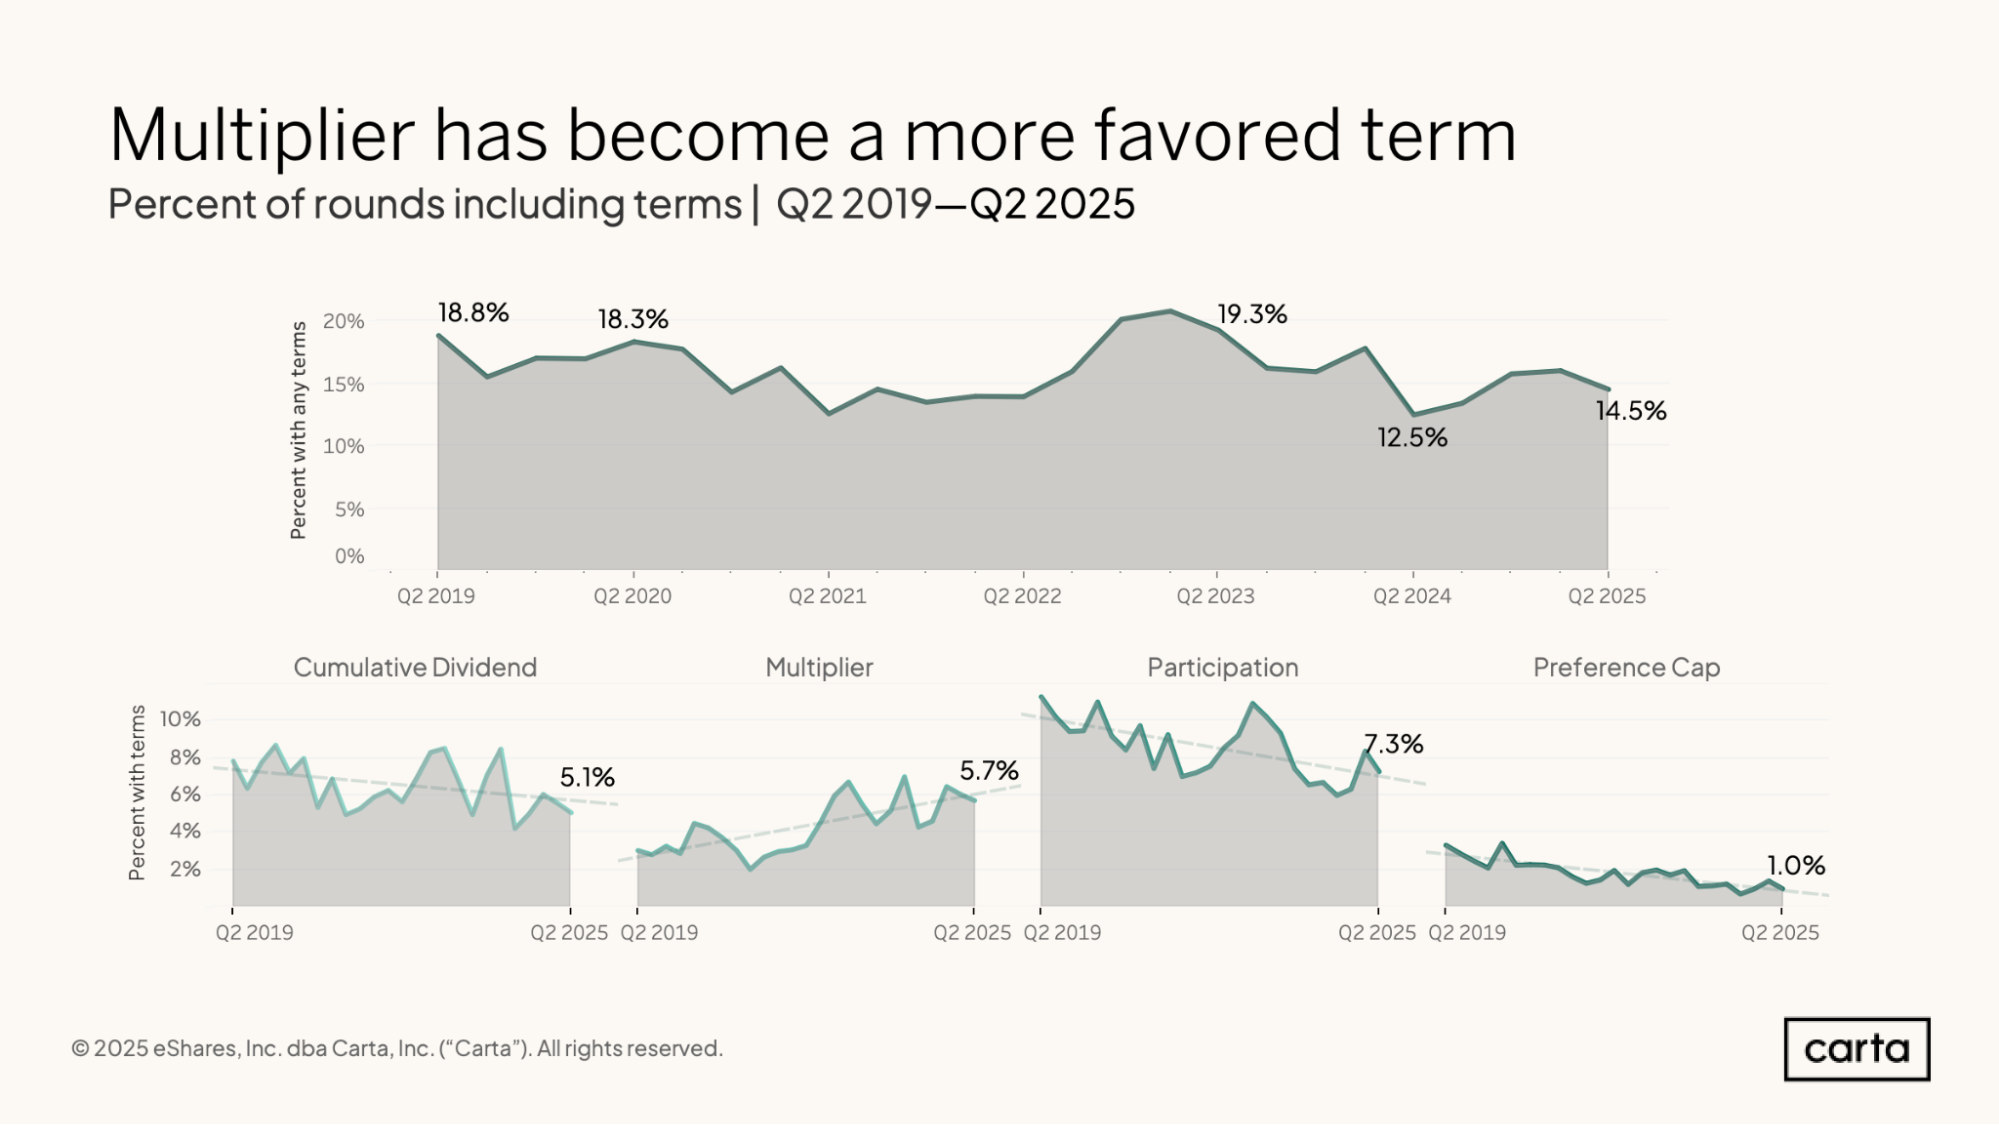
In Q2, about 5.1% of all funding rounds on Carta included a cumulative dividend as one of the deal terms. Some 5.7% of venture rounds came with a multiplier, 7.3% included participating preferred shares, and 1% included preference shares.
Combined, 14.5% of rounds on Carta included at least one of these various deal terms, all of which are typically seen as ways for investors to gain downside protection. That’s up from a 12.5% frequency of such terms a year ago. On a longer timeline, however, these four deal terms have grown a little less common. Two years ago, 19.3% of venture rounds on Carta included one or more of these terms. Back in 2019 and 2020, the rate was around 18% or 19%.
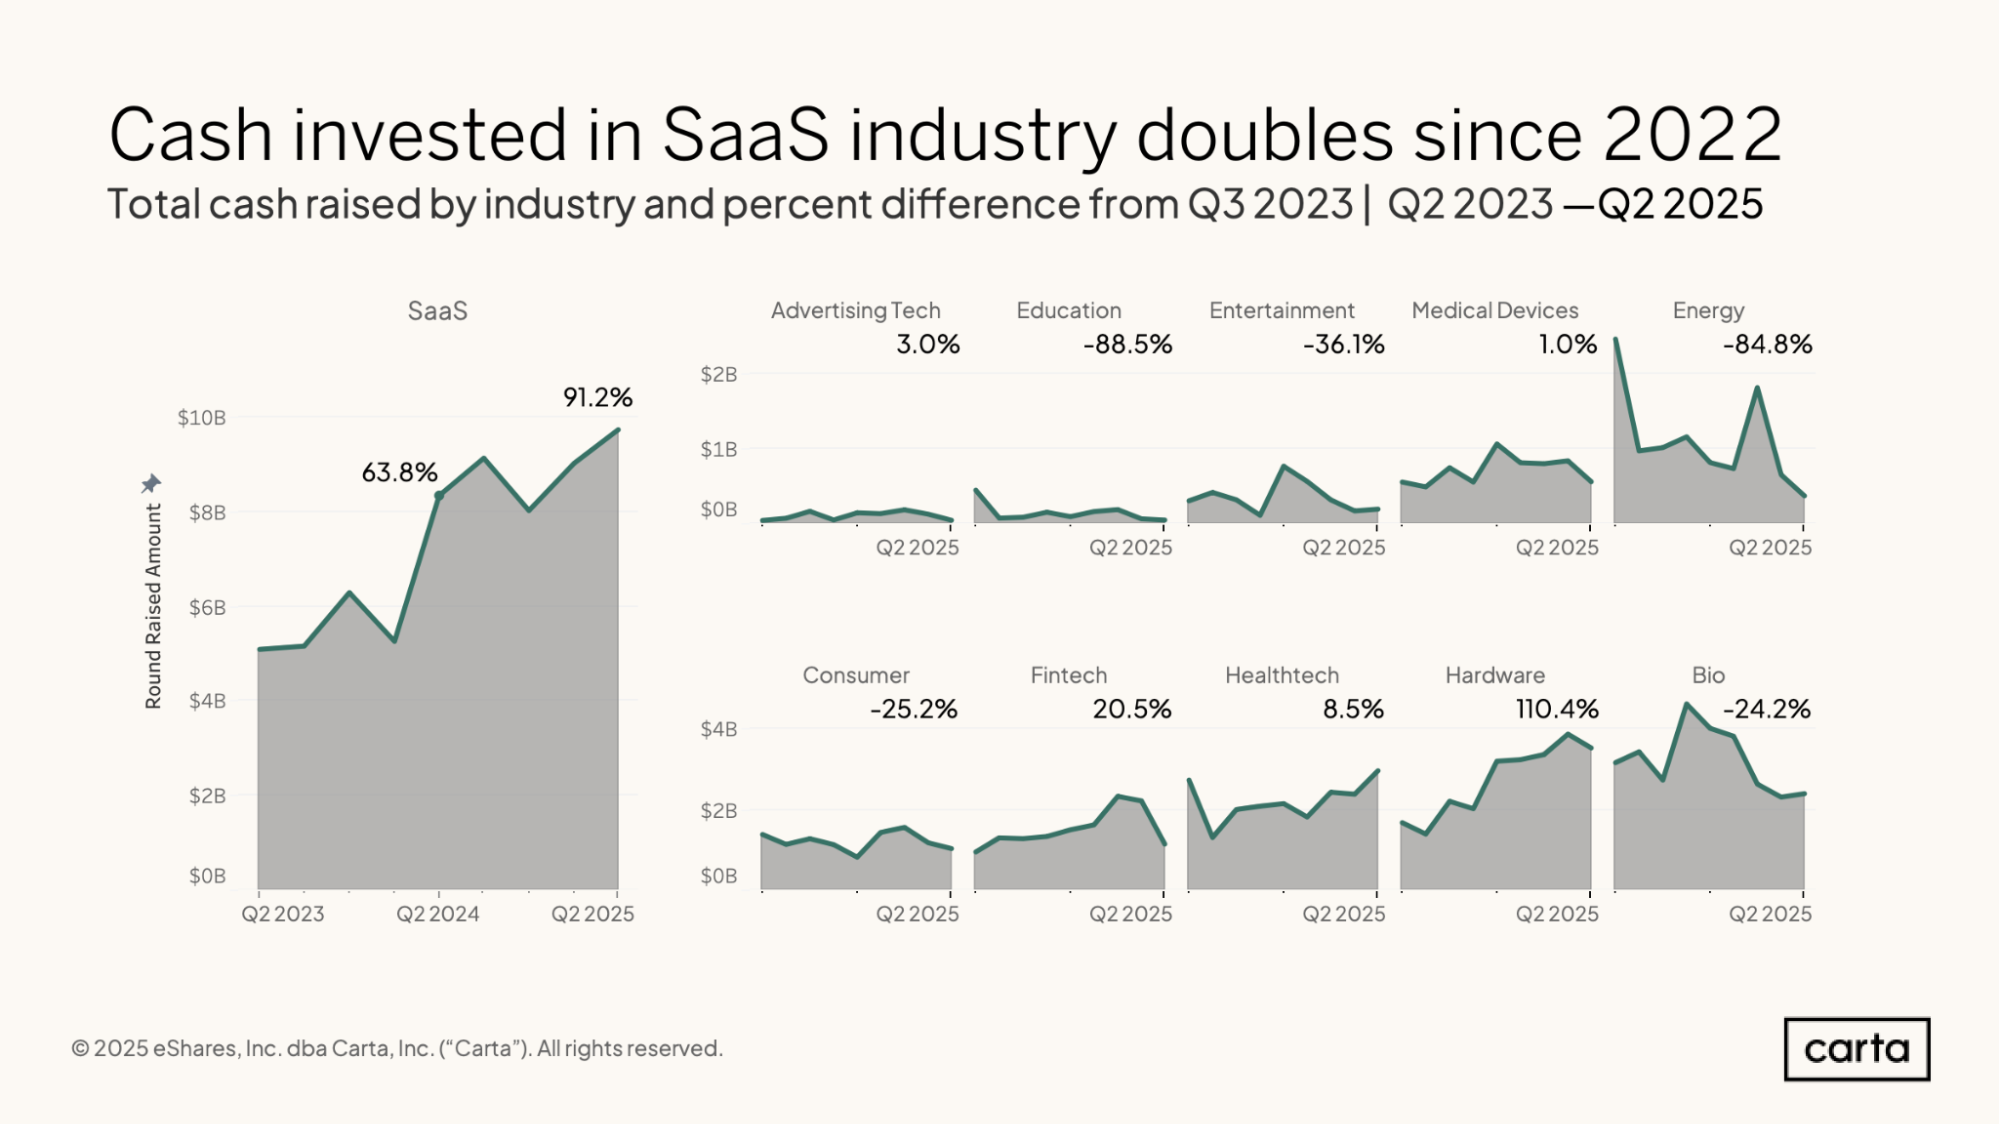
SaaS startups on Carta combined to raise $9.7 billion in new funding in Q2 2025, far more than any other industry. Compared to two years ago, funding in the SaaS space is up 91.2%, reflecting the explosion of interest in AI as a tool with transformative potential for many companies that make and sell software.
The only industry that’s seen faster growth in funding totals over the past two years is hardware, where startups raised 110.4% more capital in Q2 2025 than they did two years previously. Again, this is likely influenced by the full-fledged arrival of AI and the powerful new chips needed to train and run new models. Several other sectors have seen a significant dropoff in venture funding over the past two years, including education (an 88.5% decline), energy (84.8%), and consumer (25.2%).
Fundraising and valuations
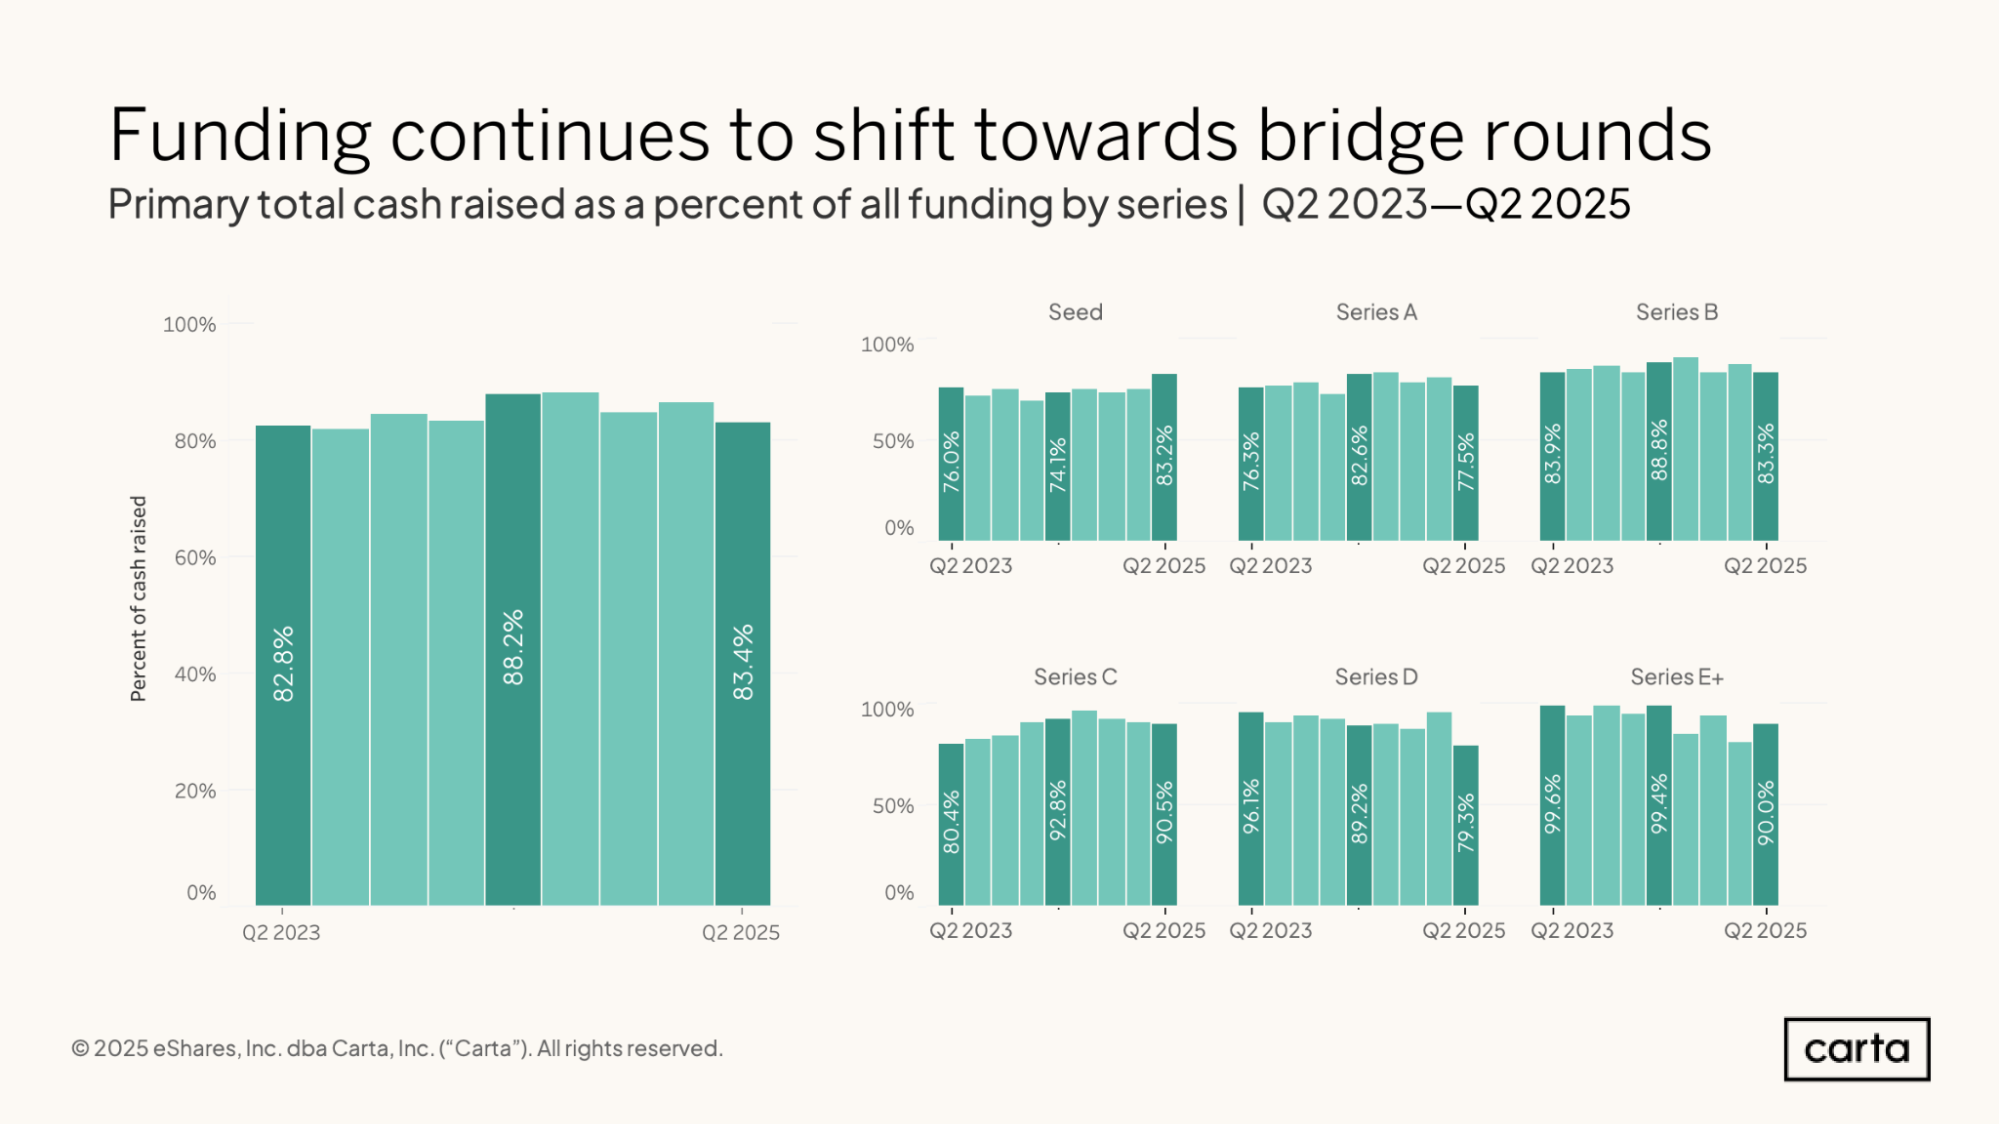
Over the past year, more startup fundraising is occurring through bridge rounds. Across all stages, primary funding rounds were responsible for 83.4% of all venture capital raised by startups on Carta in Q2 2025, with the other 16.6% coming from bridge rounds. That’s a shift of nearly five percentage points from a year ago, when just 11.8% of fundraising came from bridge rounds (and the other 88.2% from primary rounds).
In Q2, primary rounds were the source of 90.5% of all cash raised by startups at Series C and 90% of cash raised at Series E+. At these stages, in other words, bridge rounds accounted for 10% or less of all fundraising. Bridge rounds were most common in Q2 at Series A, where 22.5% of all cash raised came from bridge investments.
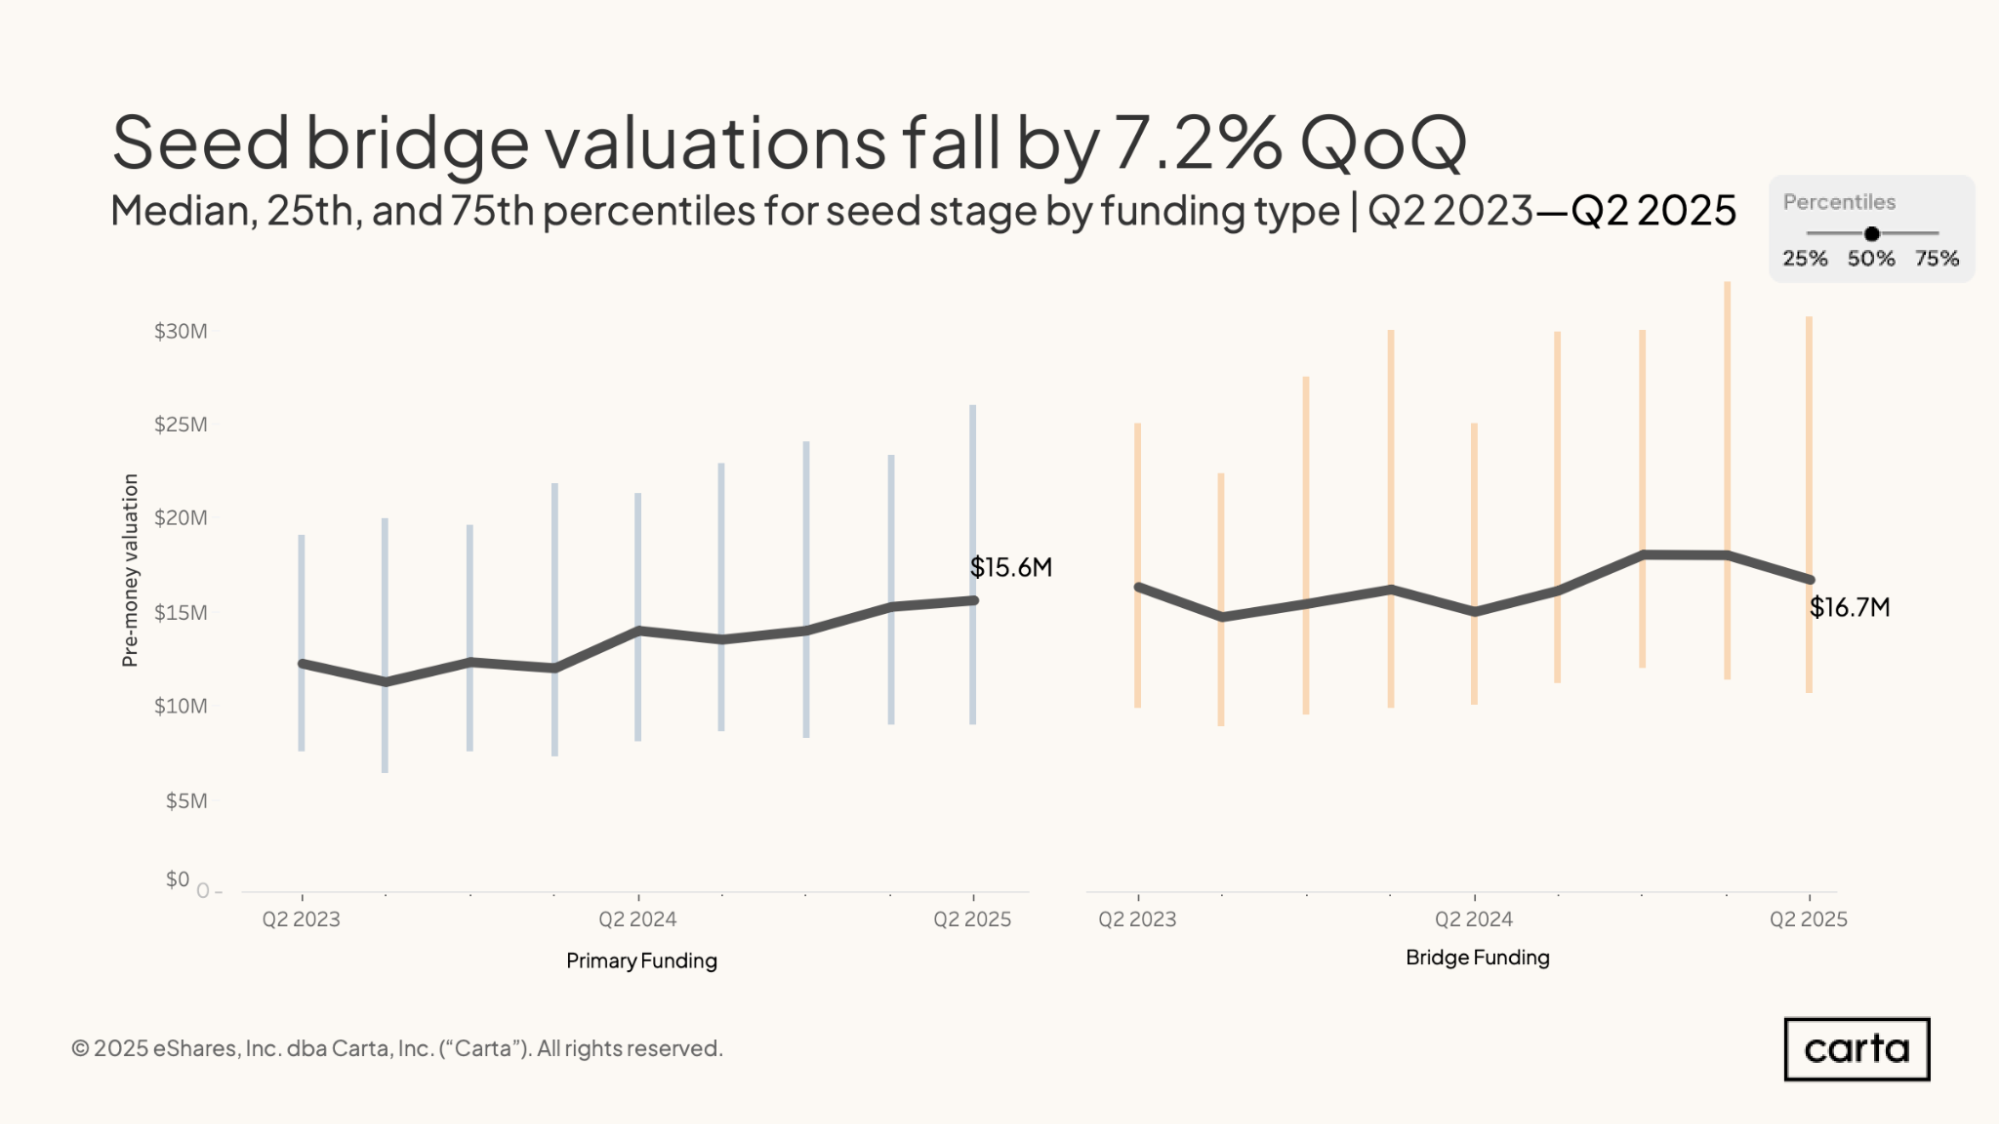
The median pre-money valuation on primary seed rounds continued to climb in Q2, reaching a new high of $15.6 million. That’s up from $15.2 million the previous quarter and $14 million a year earlier. Both the 25th percentile and 75th percentile for primary seed valuations also remain on the rise, with the 75th percentile reaching $26.1 million in Q2.
In bridge rounds at the seed stage, the median pre-money valuation declined by 7.2% in Q2, falling to $16.7 million. The 25th percentile and 75th percentile for bridge valuations also fell in Q2. Year over year, however, bridge valuations at the seed stage are still trending up.
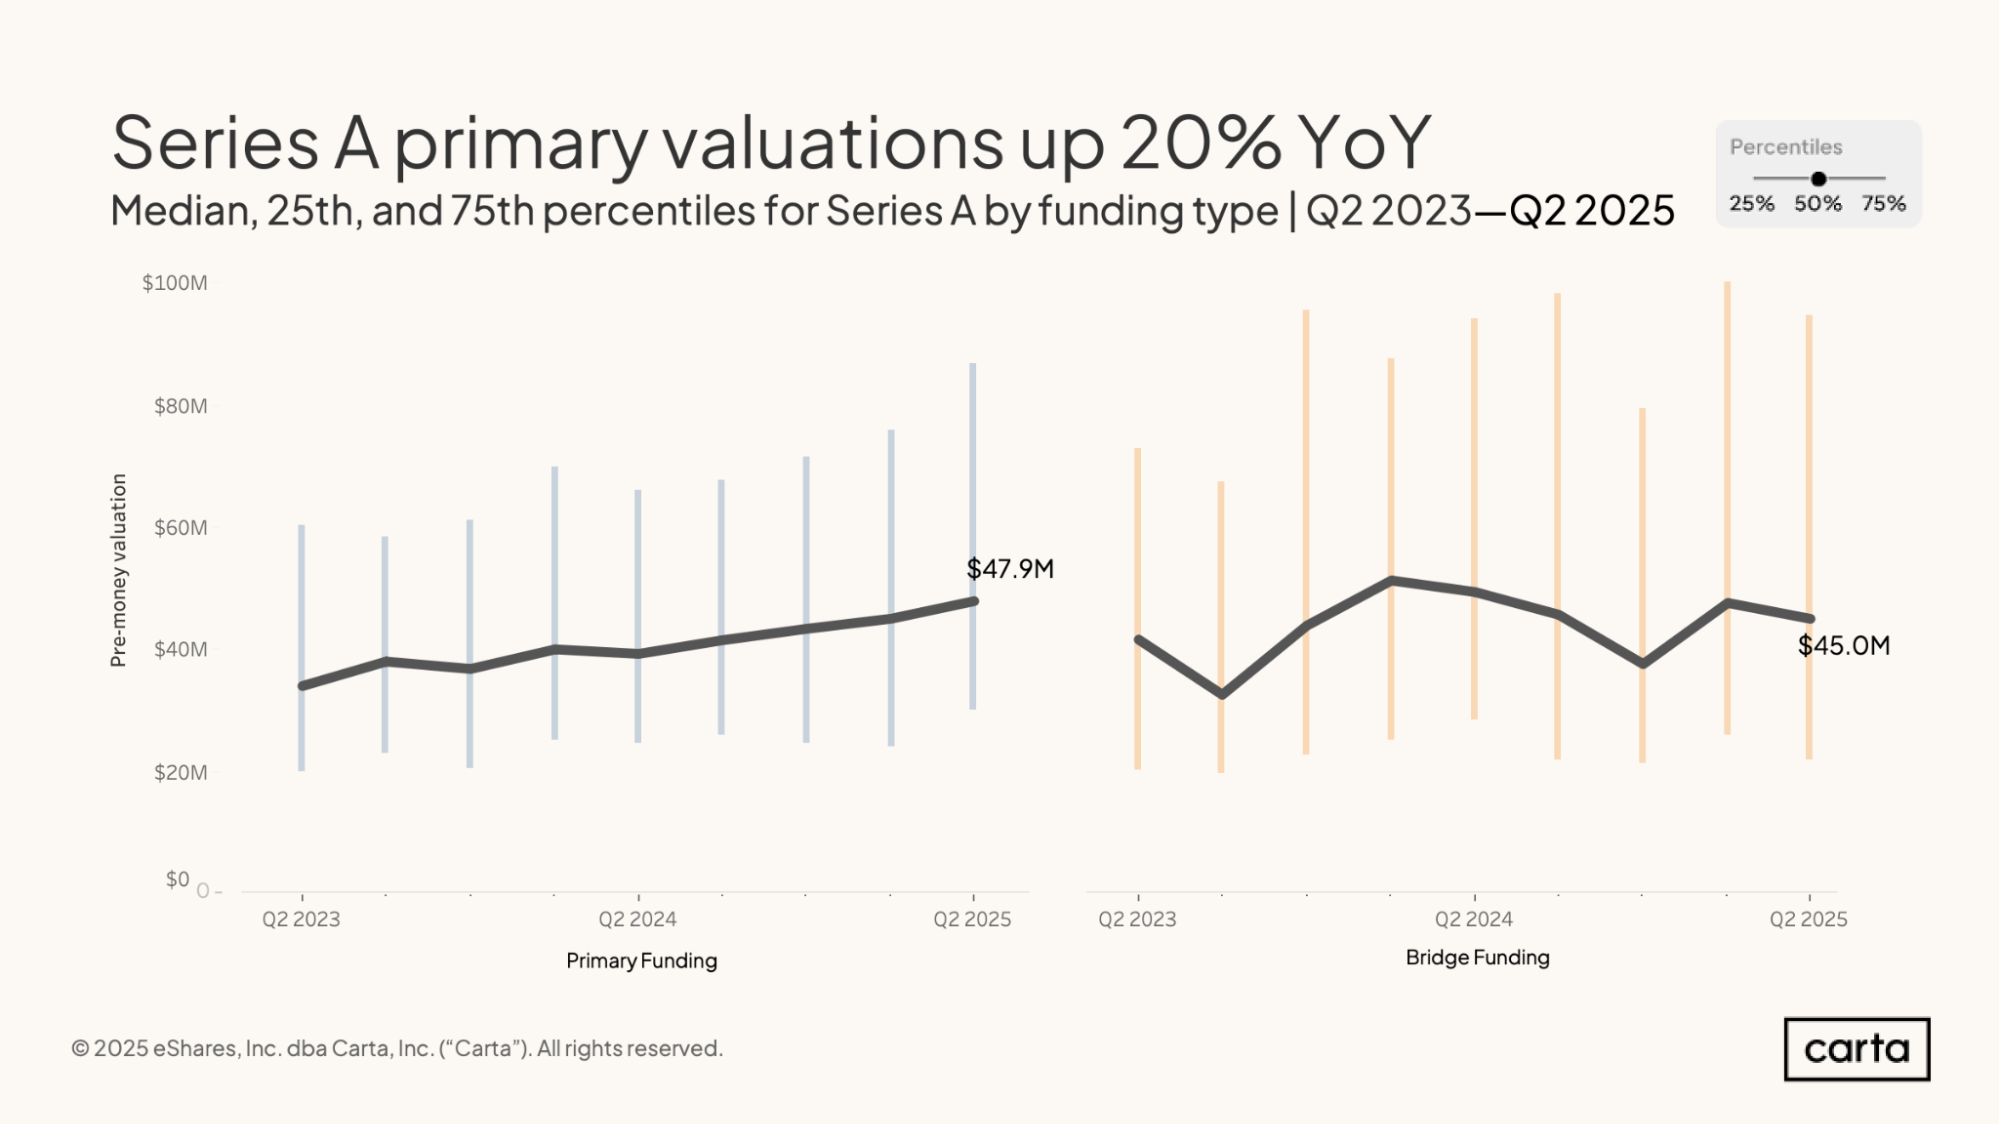
The median pre-money valuation in Series A rounds on Carta has been rising steadily for the past two years. It reached a new high of $47.7 million in Q2, up 20% on an annual basis. The 75th percentile for Series A valuations also shot to a new high in Q2, landing at $87.5 million.
While primary valuations at Series A have been consistently trending up the past two years, bridge valuations at Series A have been more unpredictable. In Q2, the median pre-money Series A bridge valuation was $42.3 million, down 11% quarter over quarter and 14% year over year.
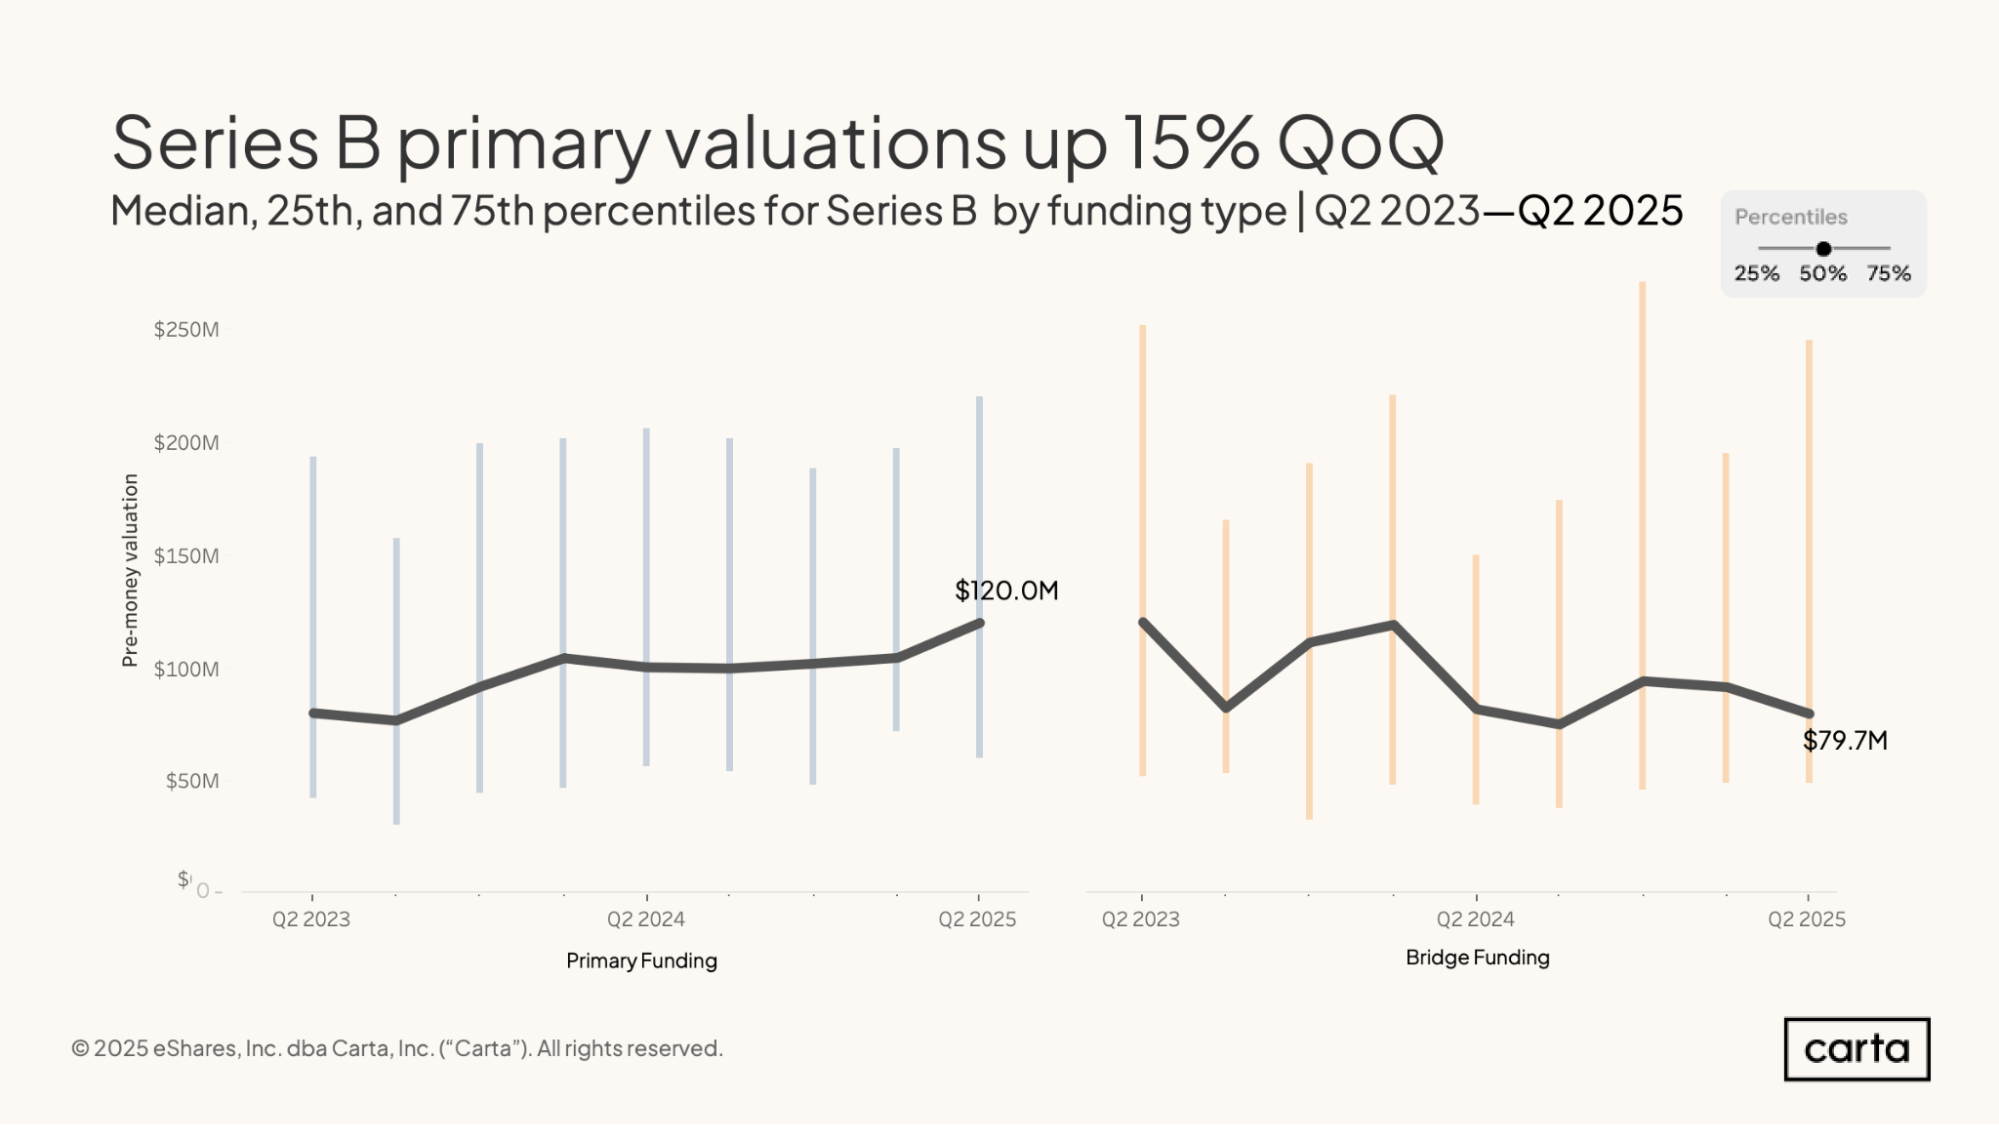
At Series B, median primary and bridge valuations are moving in different directions. In primary rounds, the median pre-money valuation on Carta climbed to $120 million in Q2, a 15% quarter-over-quarter increase. On bridge rounds, the median pre-money valuation dropped to $79.7 million, a 13% QoQ decline. The median Series B primary valuation is 50% higher today than it was two years ago, while the median Series B bridge valuation has fallen by 34% over that same period.
Even as the median has declined, however, there remains significant variation in pre-money bridge valuations at Series B. In other words, some companies at this stage are still able to attain relatively lofty valuations. In Q2, the 75th percentile for bridge valuations at Series B was $245 million, nearly three times higher than the median.
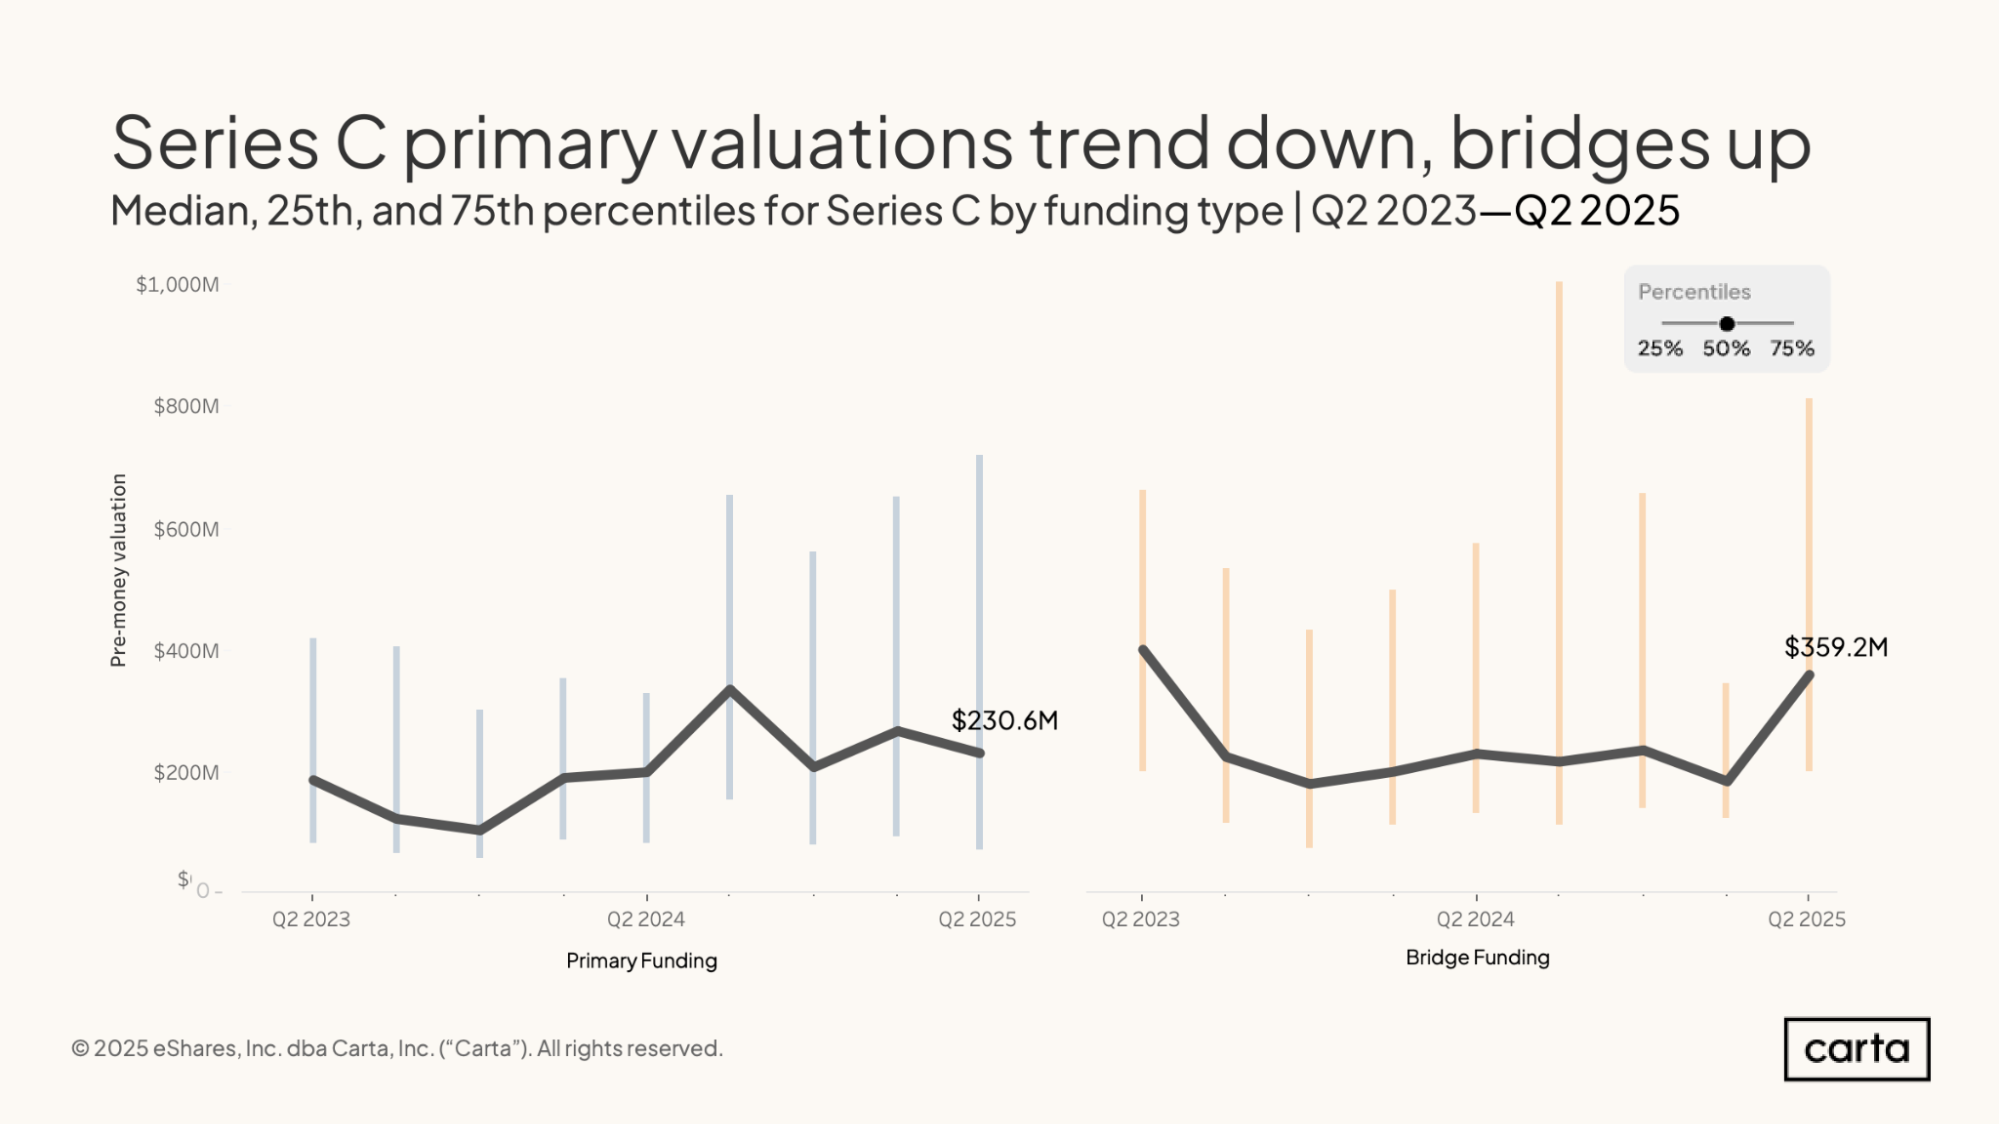
At both Series A and Series B, the median pre-money valuation on primary rounds was higher than the median pre-money valuation on bridge rounds. That’s certainly not the case at Series C. Here, the median primary valuation fell to $230.6 million in Q2, an 11% quarter-over-quarter decline, while the median bridge valuation soared to $359.2 million, a whopping 95% QoQ increase.
For both primary and bridge rounds, those median figures sit at the middle of a wide spectrum. On primary deals, the 25th percentile for pre-money valuation at Series C was $70 million in Q2. The 75th percentile was a full order of magnitude larger, at $718 million. On bridge deals, the 25th percentile valuation was $201 million, and the 75th percentile was $812 million.
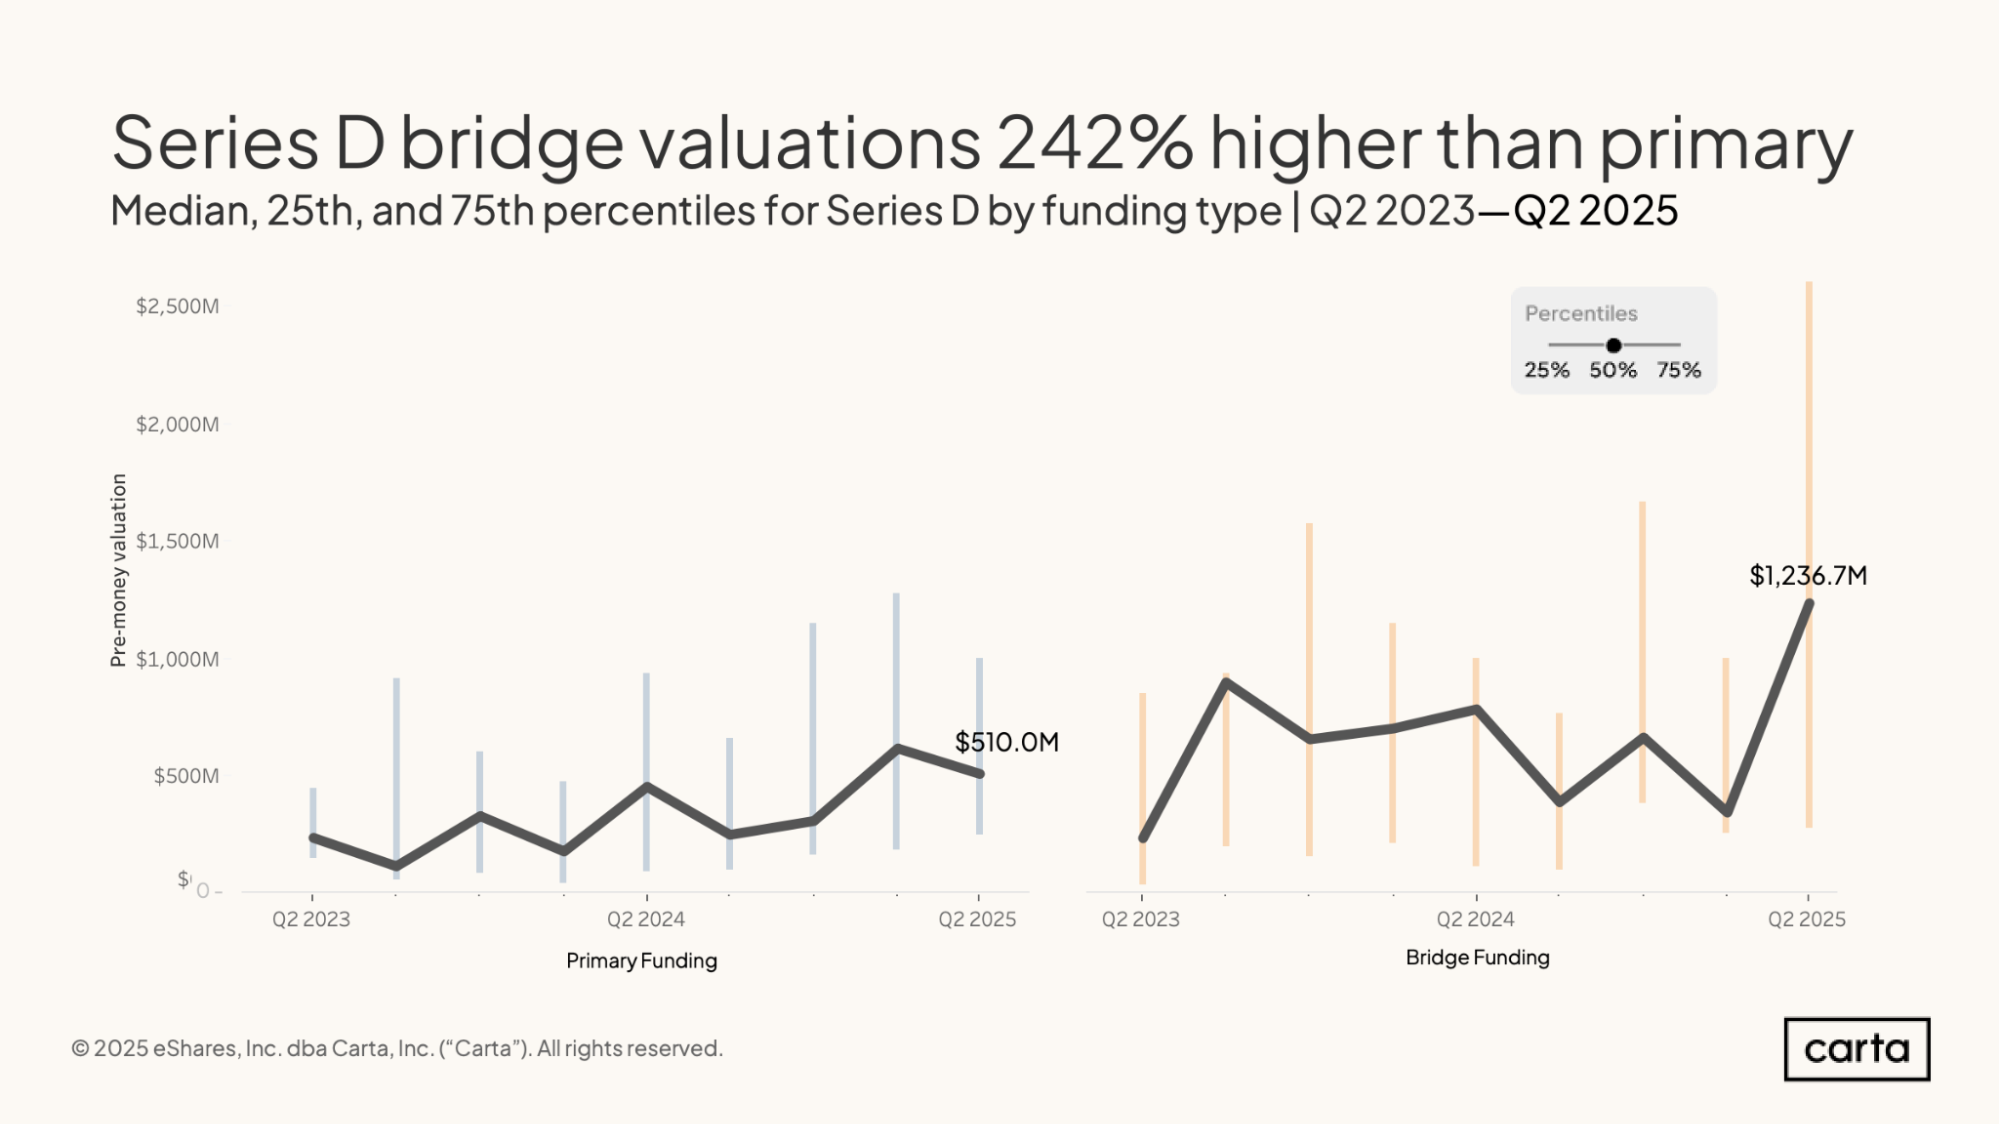
The median pre-money valuation in Series D bridge rounds on Carta was about $1.24 billion in Q2, while the median valuation in primary rounds was just $510 million. These figures represent a sharp reversal from the previous quarter: In Q1, the median primary valuation ($659 million) was substantially higher than the median bridge valuation ($345 million).
In Q2, the median bridge valuation at Series D was pulled higher by some multibillion-dollar valuations; the 75th percentile valuation rose all the way to $2.6 billion, its highest point in the past two years. Some unicorn startups at this stage may be returning to market and opting for bridge rounds after waiting out a chillier fundraising and exit environment over the past three years.
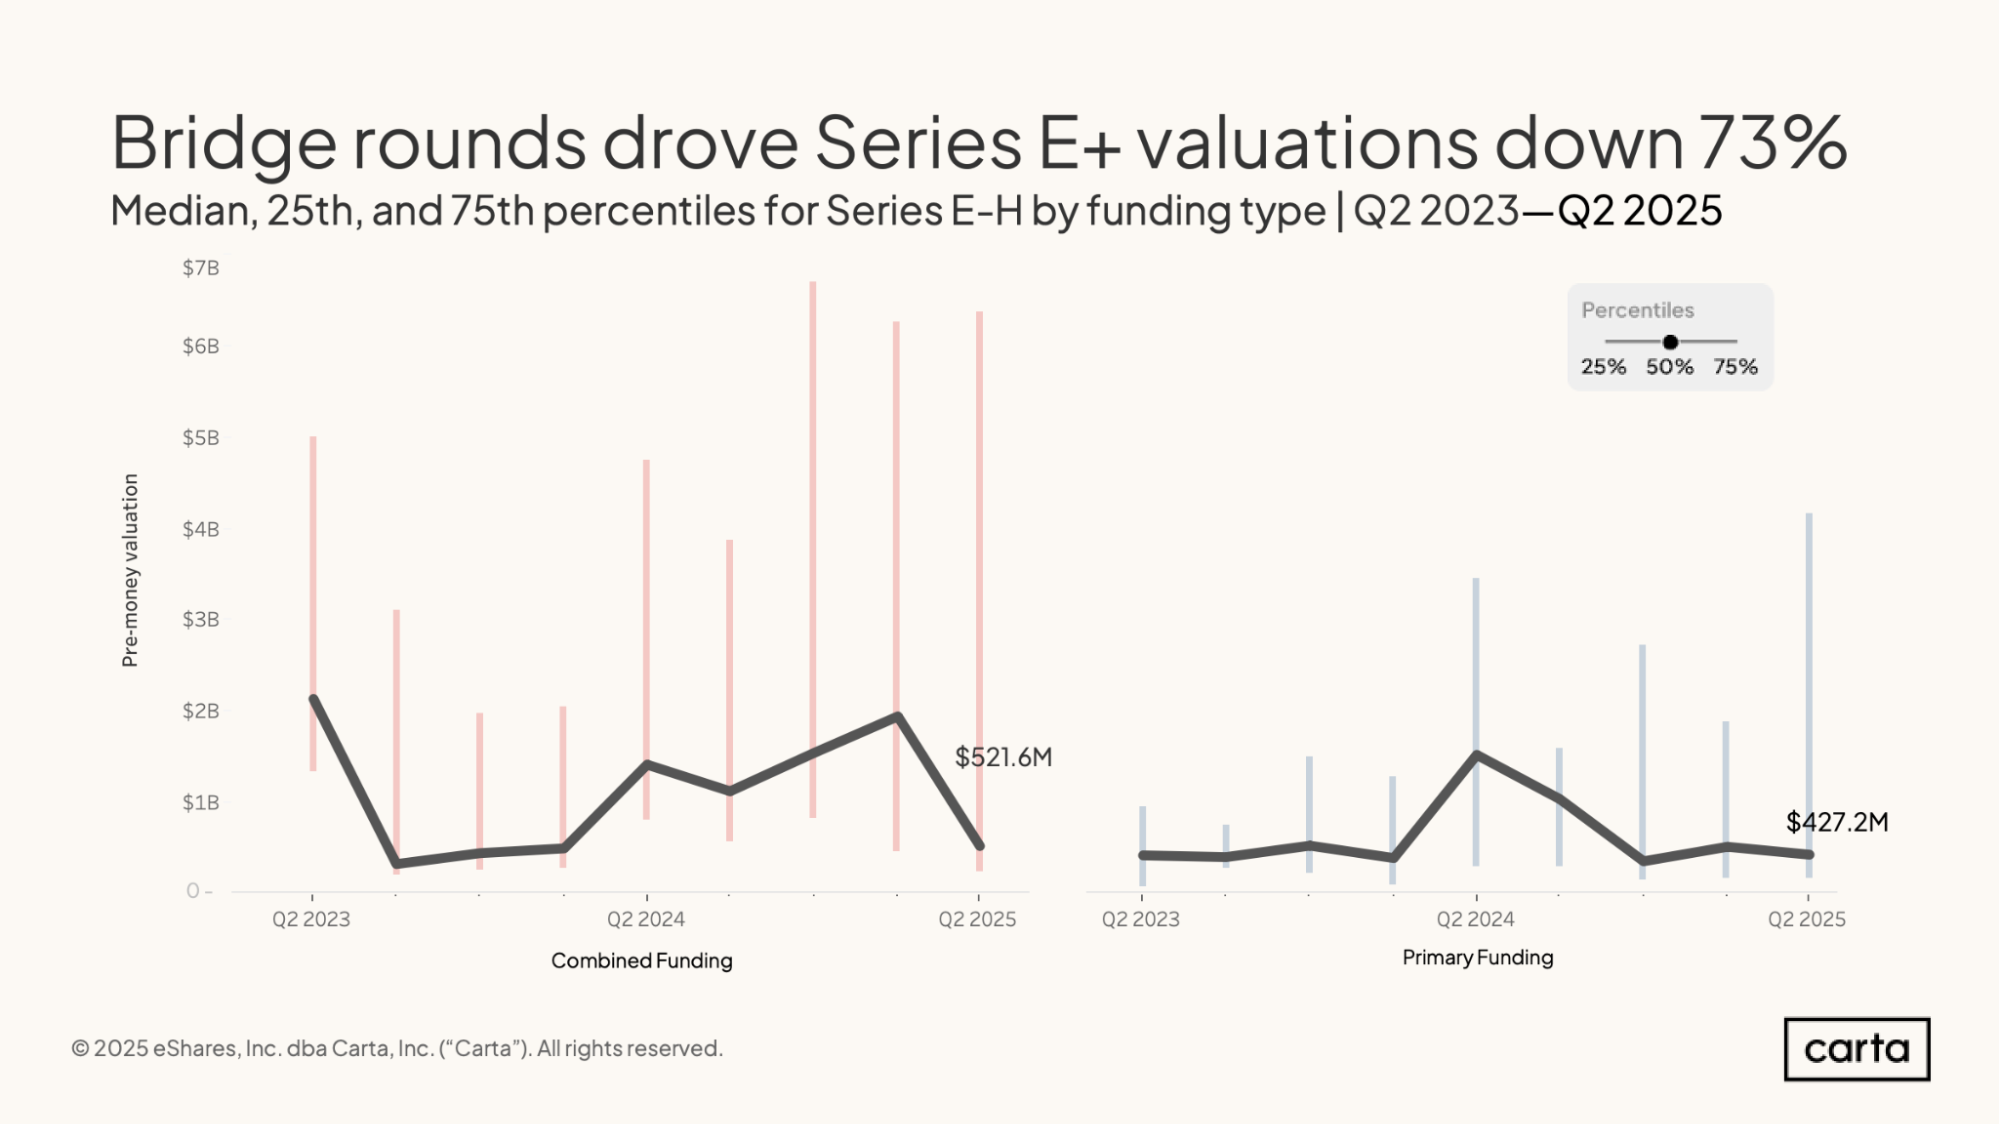
The median pre-money valuation across all types of funding rounds at Series E and beyond in Q2 was $521.6 million, a significant dropoff from Q1. The median pre-money valuation in just primary funding rounds, meanwhile, only declined slightly in Q2, falling to $427.2 million.
For both combined and primary rounds, valuations tend to fall in a right-tail distribution, with the 75th percentile landing many times higher than the median.
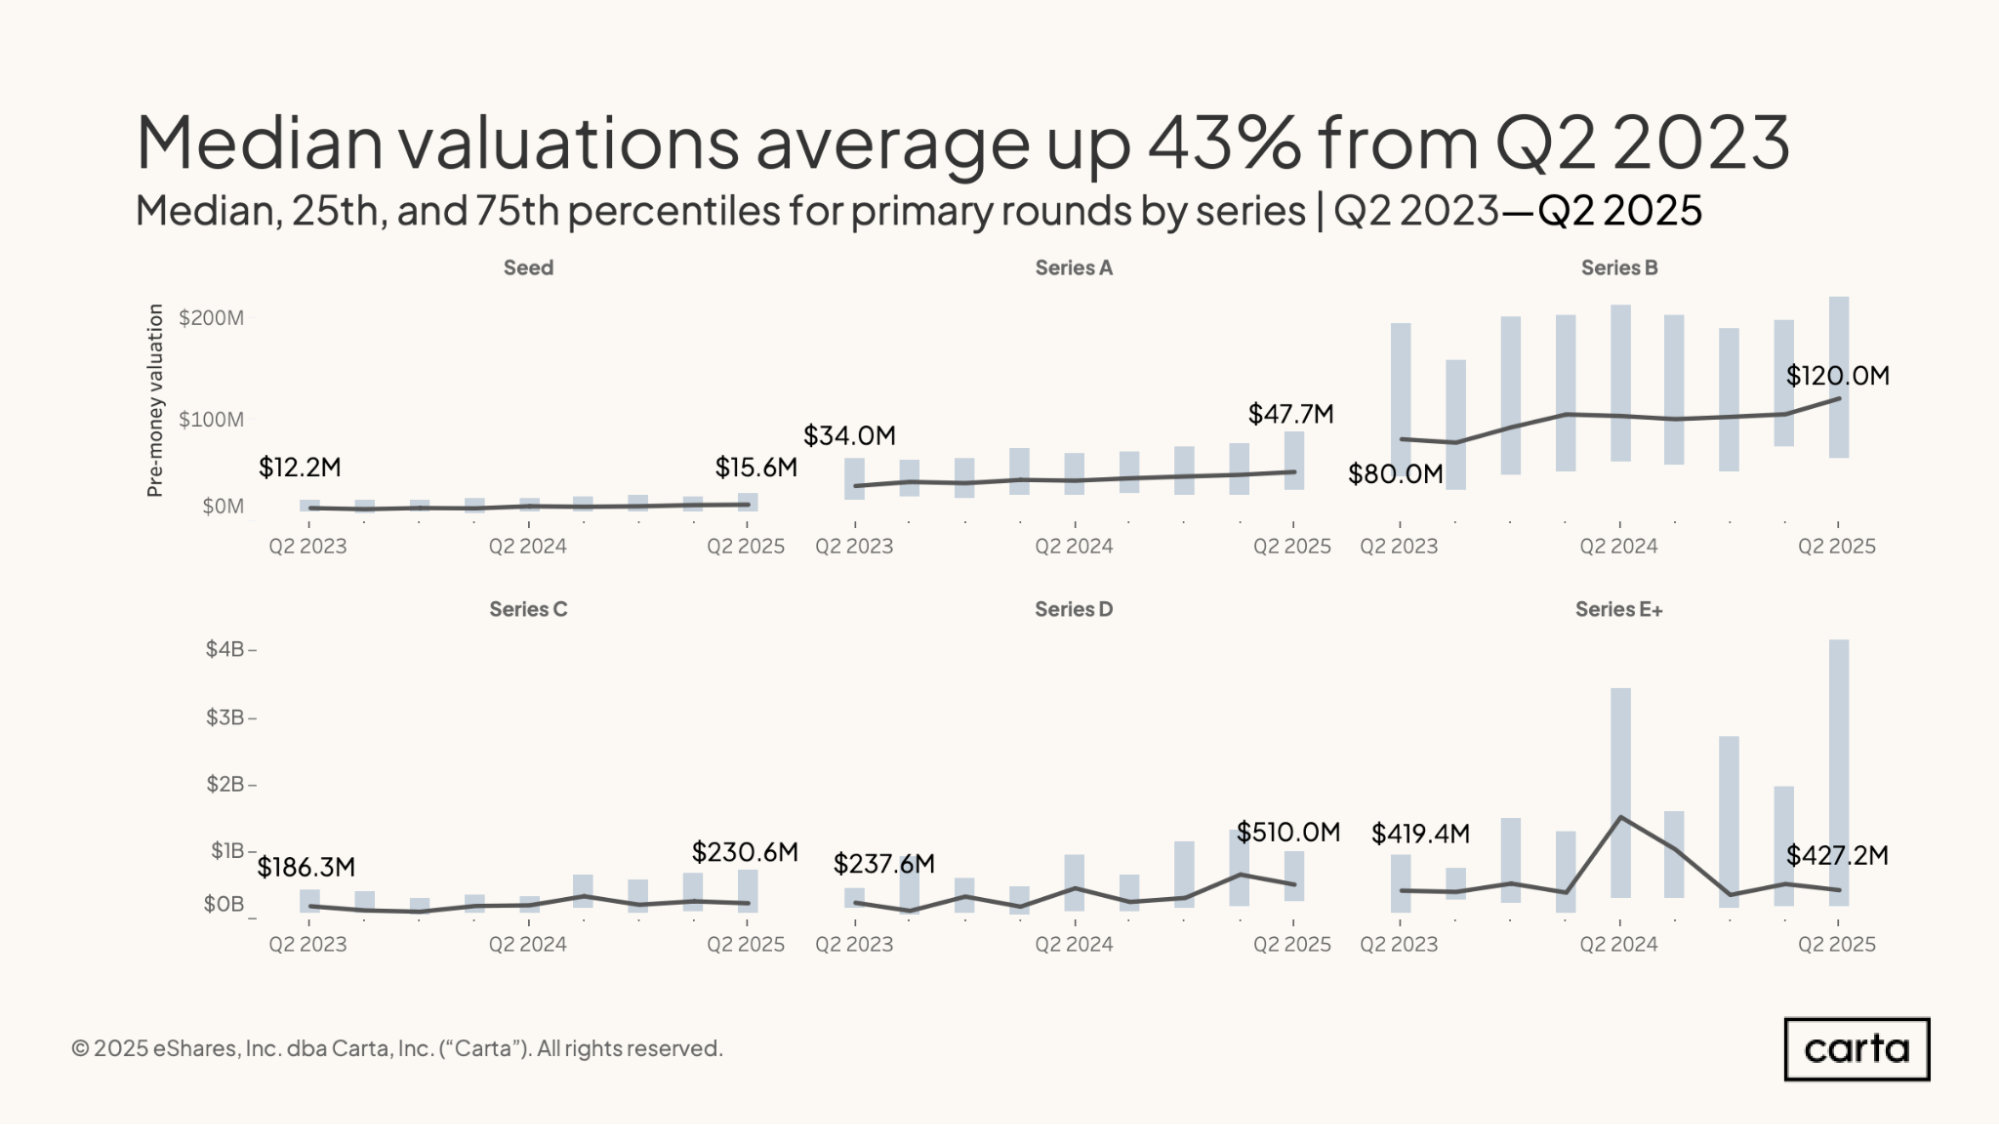
At every stage of startup life, the median pre-money valuation was higher in Q2 2025 than it was two years ago. Across all stages combined, that median valuation rose by 43% over that span.
The largest increase comes at Series D, where the median primary valuation was 115% higher in Q2 2025 than it was in Q2 2023. The smallest increase comes at Series E+, where the median valuation is up by just 2% over the past two years.
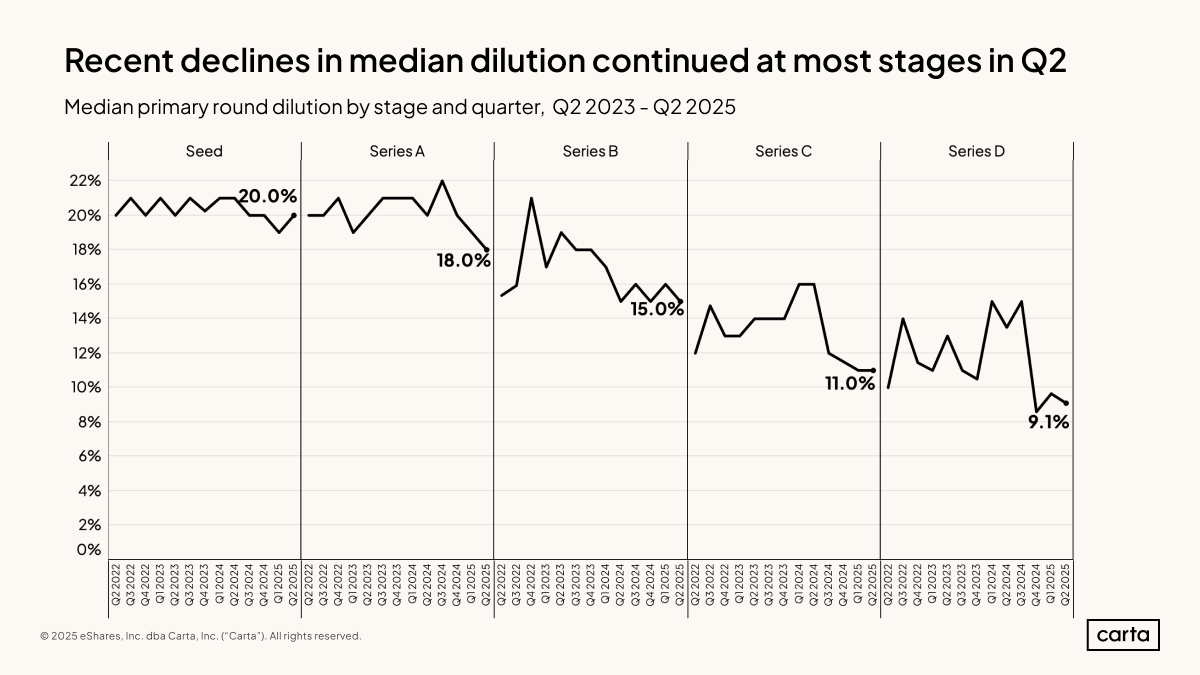
Median dilution in new seed rounds on Carta was 20% in Q2, a slight uptick from Q1 and mostly in line with the past two years of data. At other stages, though, dilution mostly trended down in Q2. On a quarterly basis, median dilution declined last quarter at Series A, Series B, and Series D.
This continues a general trend of declining dilution in recent years. At each stage from Series A on, median dilution was lower in Q2 2025 than it was in Q2 2022.
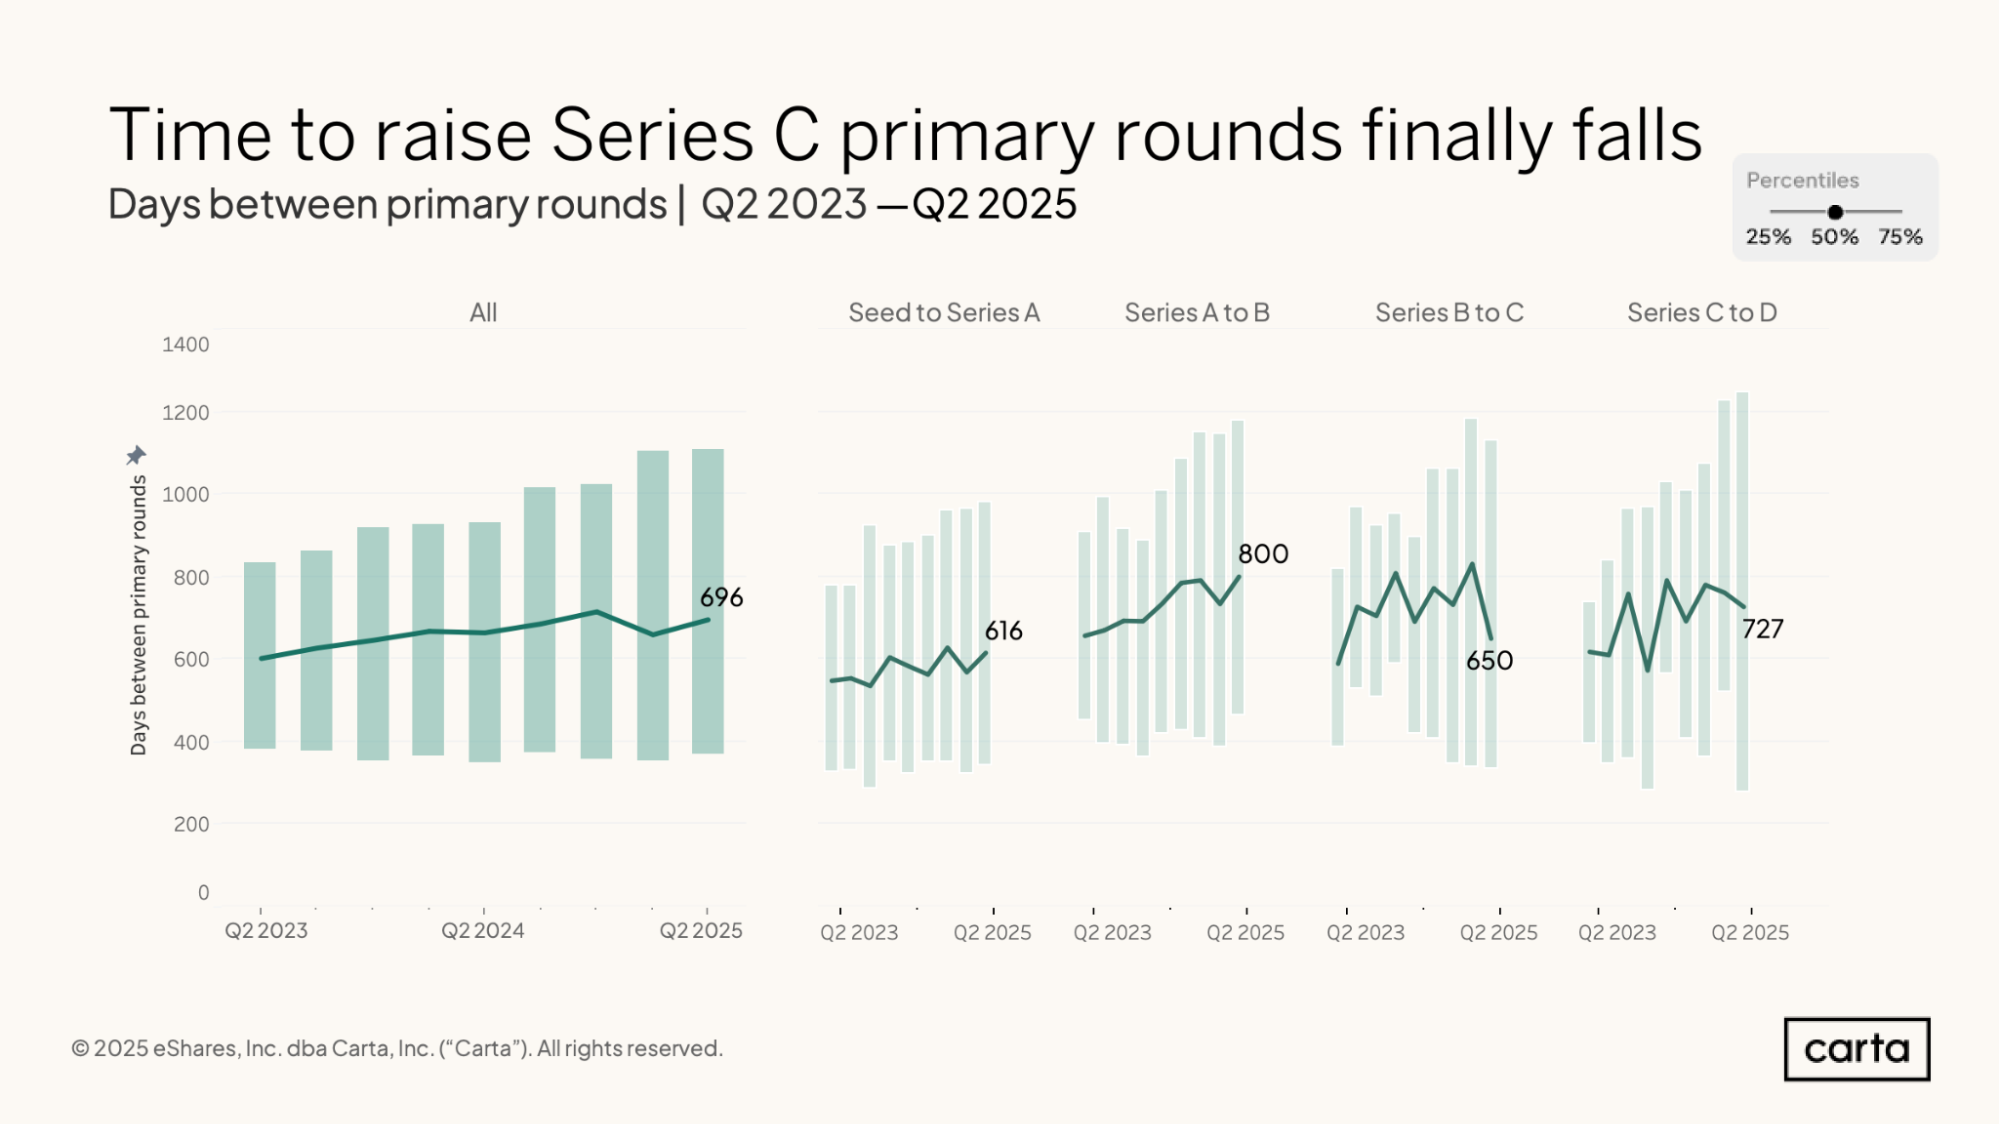
Across all fundraising stages, the median time between primary funding rounds rose to 696 days in Q2, or just shy of 23 months. That’s an increase of about a month from Q1, when the median time between rounds was 660 days. Over the past two years, there’s been a general trend of longer intervals between new rounds.
In Q2, the longest gap between rounds was found at Series B, where the median startup had waited 800 days (about 26 months) since its Series A. Meanwhile, the median time between a Series B and Series C fell by nearly six full months in Q2 compared to the previous quarter, landing at 650 days.
Geographical trends
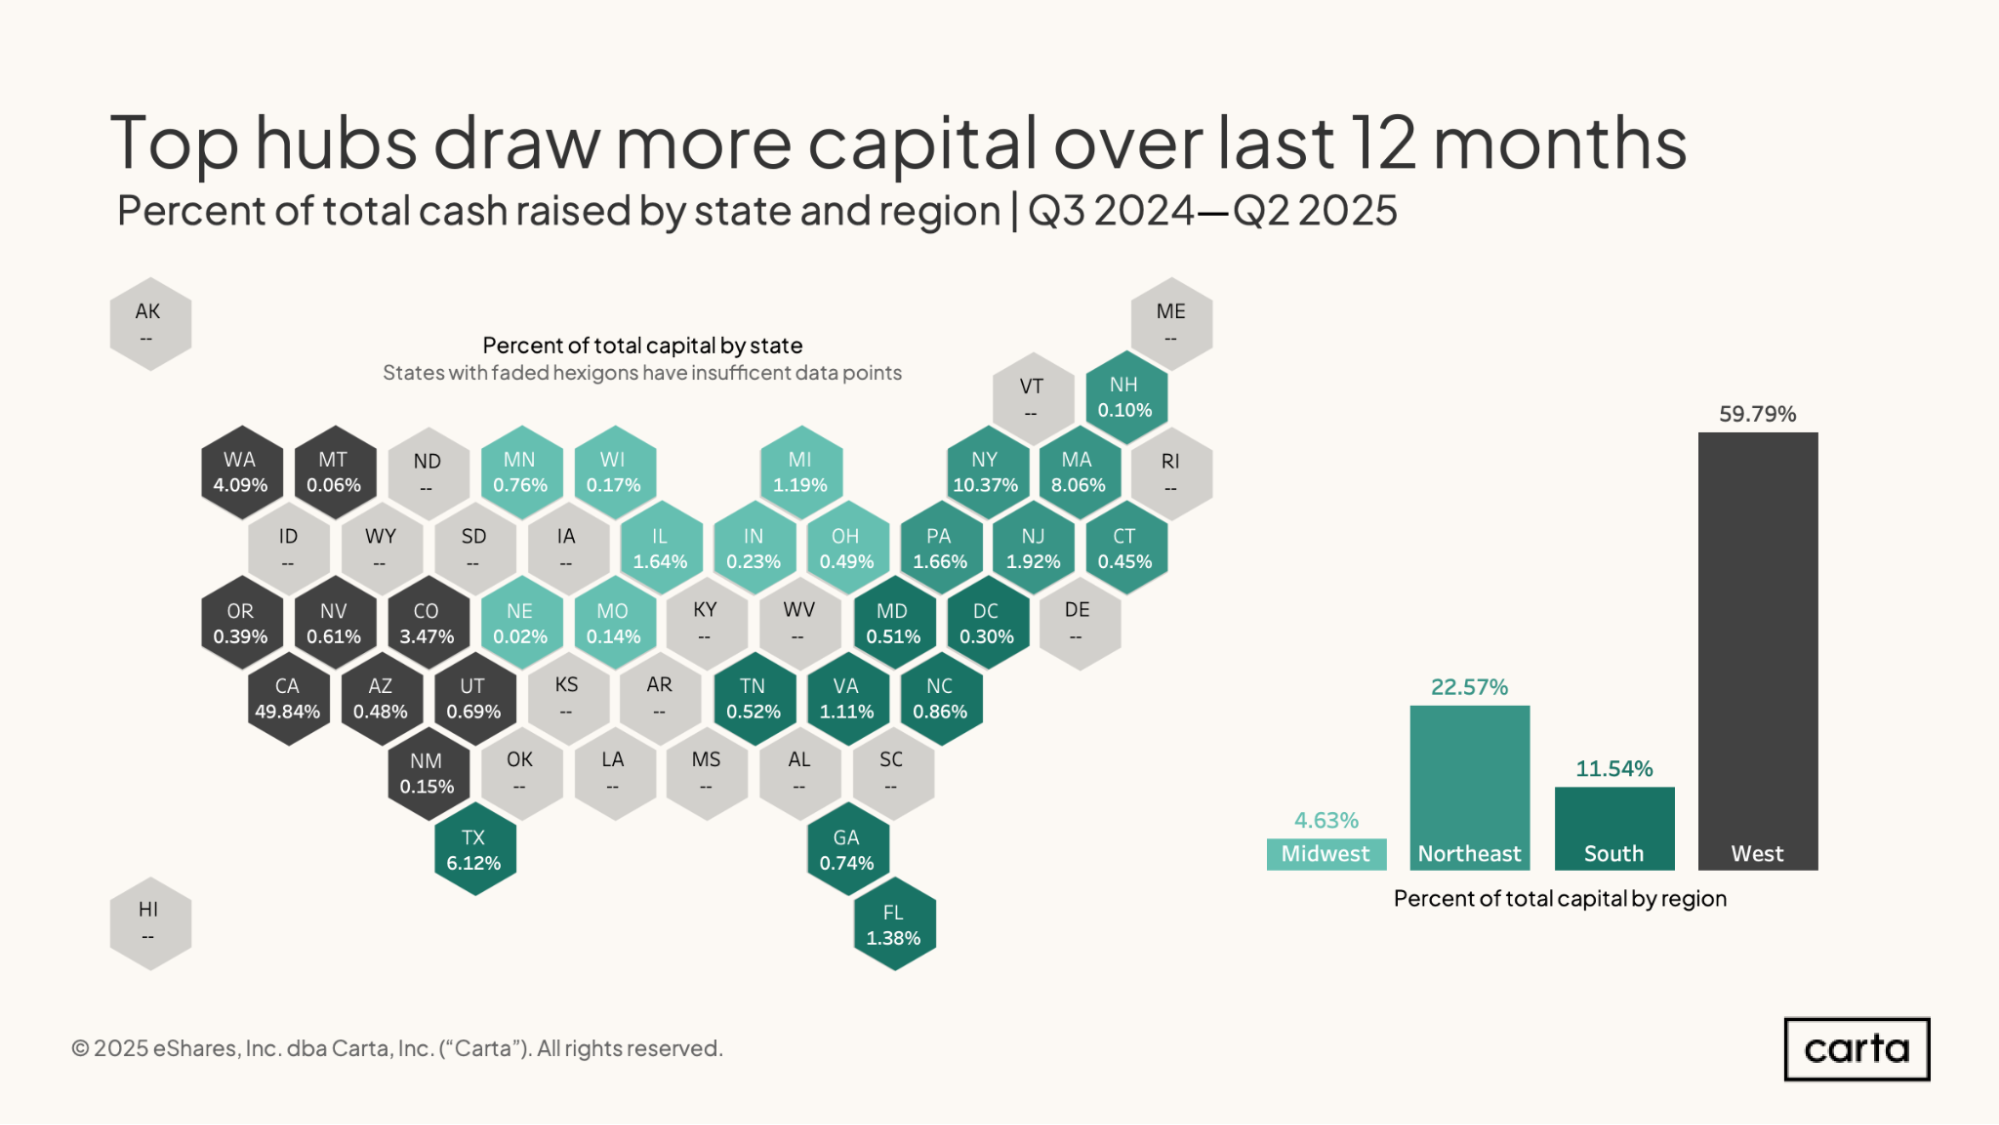
It’s been a lucrative last 12 months for some of the startup industry’s traditional fundraising hubs. Exactly 50% of all venture capital raised on Carta from Q3 2024 through Q2 2025 went to startups based in California. Another 10.3% of all VC funding went to New York-based startups, and 8.1% to startups from Massachusetts.
Overall, among states with enough deal activity to qualify, the five states with the largest shares of VC funding over the past 12 months—California, New York, Massachusetts, Texas, and Washington—combined to account for 78.5% of all cash raised.
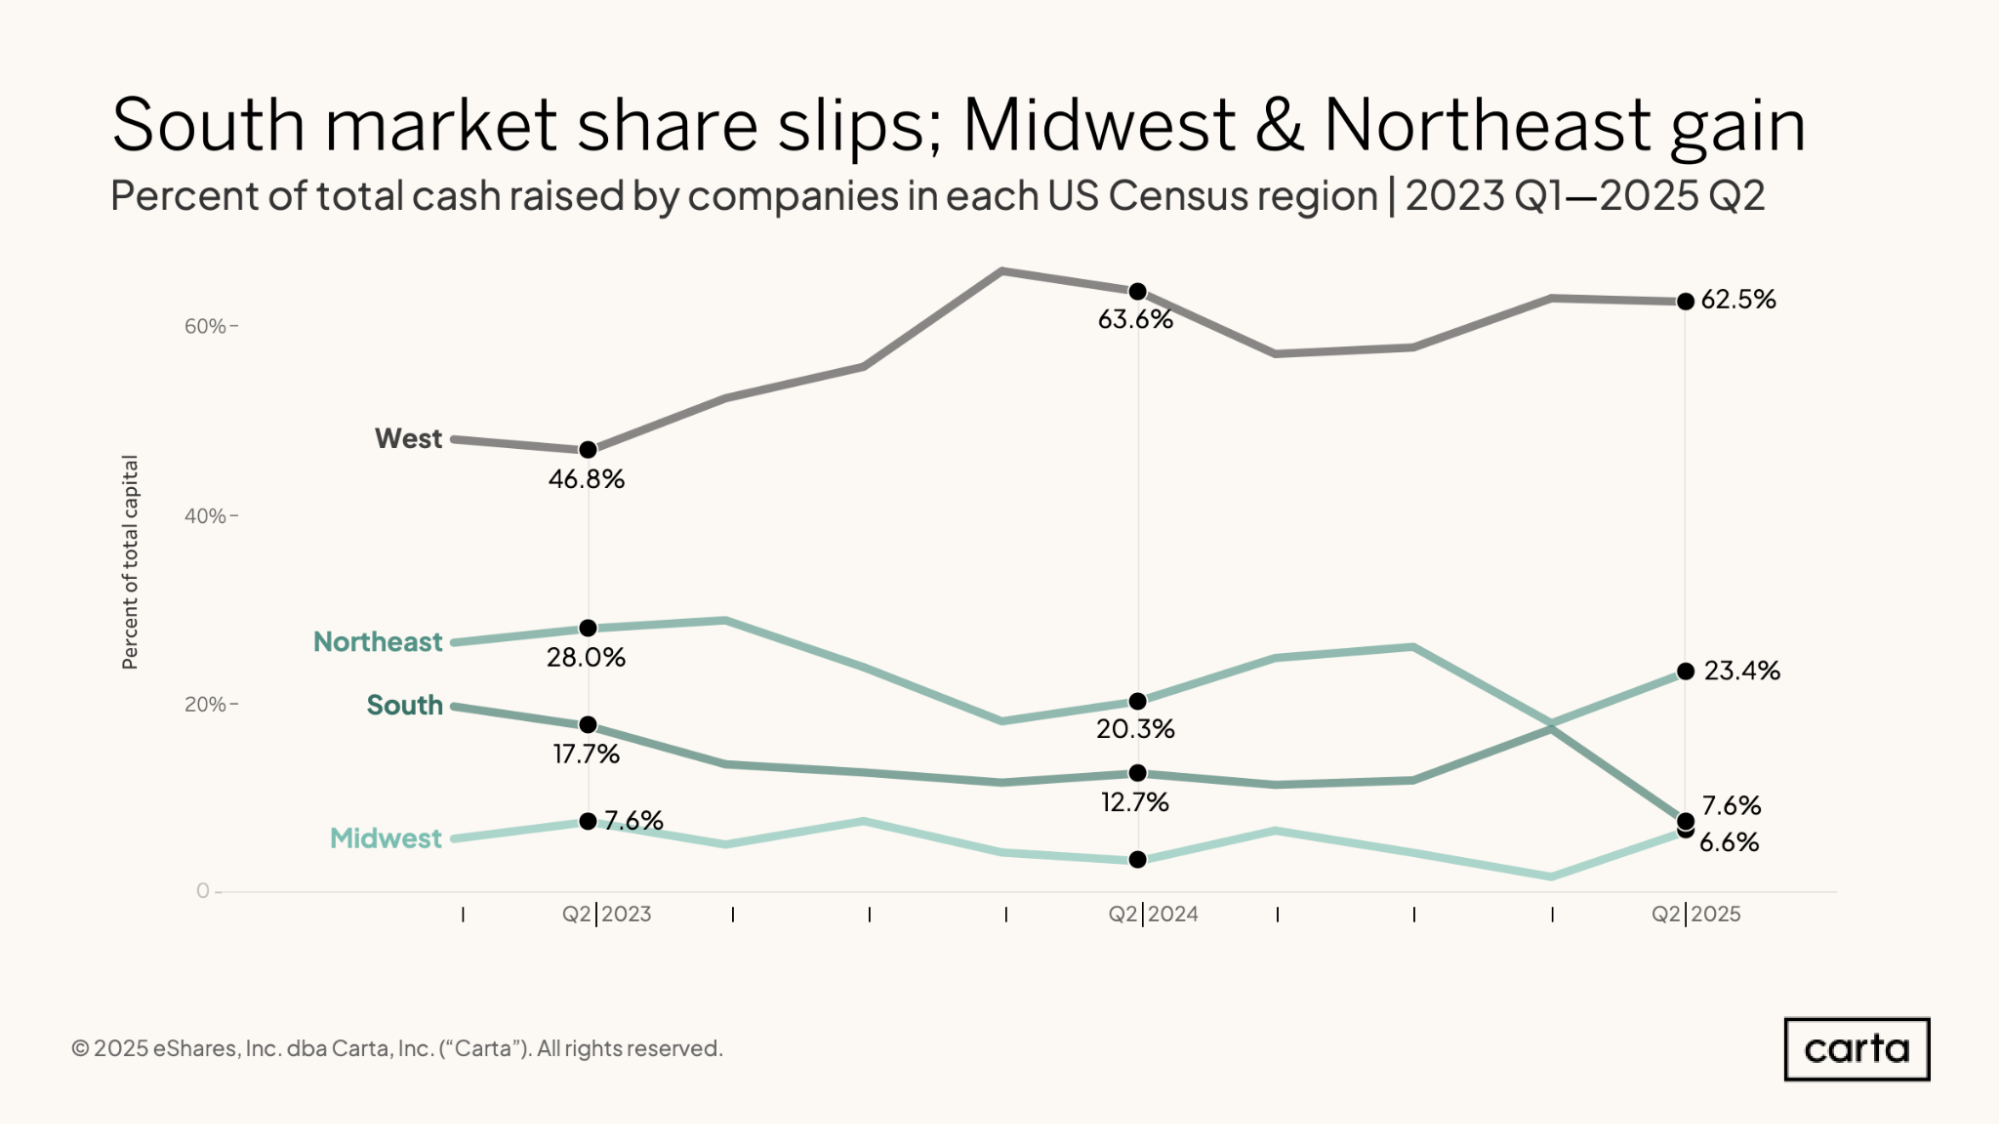
Startups based in the South census region combined to raise just 7.4% of all VC funding logged on Carta in Q2 2025, down from 12.7% during the same period a year earlier. That’s the smallest percentage of funding that’s gone to southern startups in any quarter during the past two years.
The Northeast and Midwest regions, meanwhile, both increased their share of all VC raised in Q2. But they’re still a very long way from catching the West, which has now been home to at least 60% of all funding raised in four of the past six quarters.
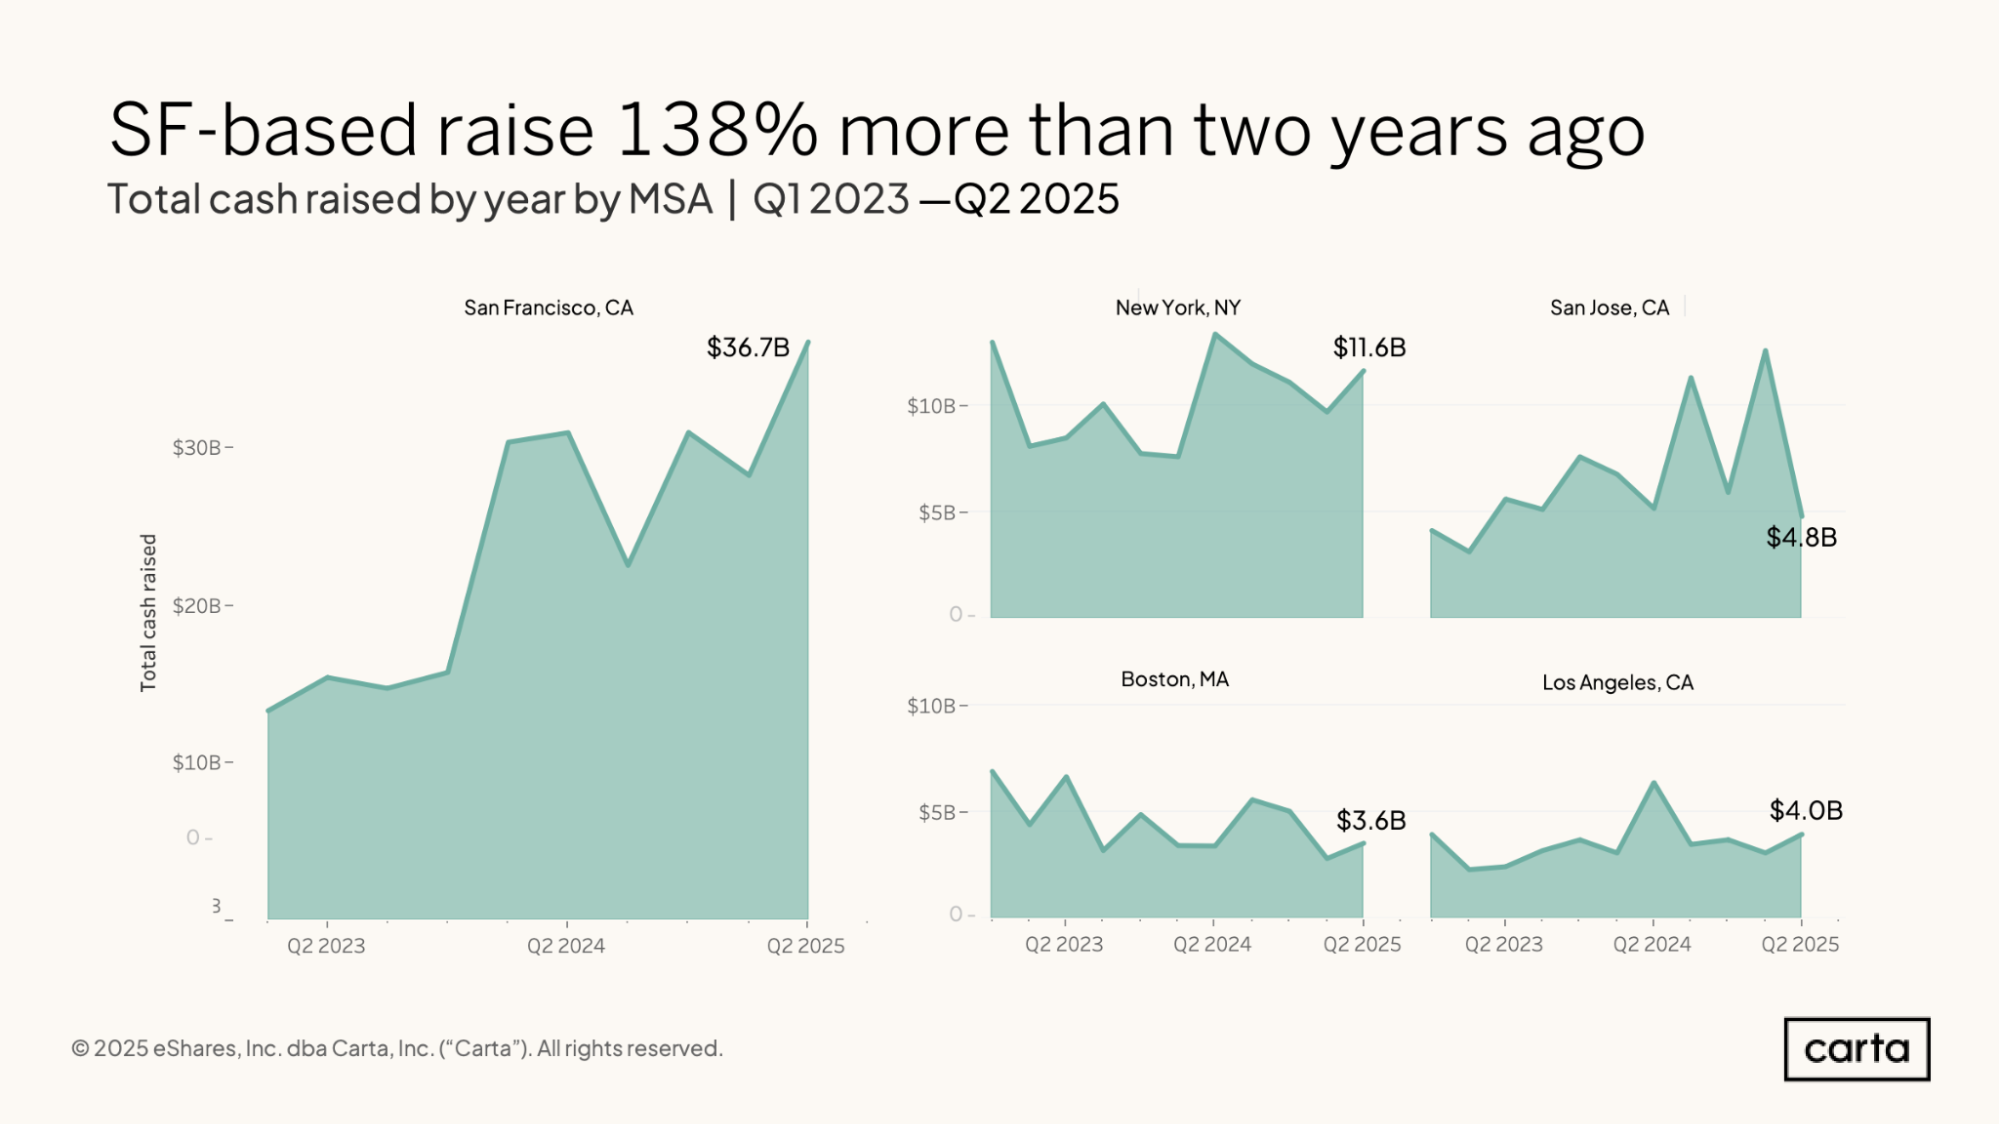
The age of AI has been good to the Bay Area. Startups located in San Francisco combined to raise $36.7 billion in total funding during Q2 2025, which represents a 138% increase over the same period two years ago. That figure is also 35% higher than the amount of venture funding raised in Q2 across New York, San Jose, Los Angeles, and Boston combined.
New York and Los Angeles were also home to more startup fundraising in Q2 2025 than they were in Q2 2023, with two-year increases of 36% and 58%, respectively. Boston and San Jose, on the other hand, have seen funding decline over that span, with respective two-year decreases of 48% and 14%.
Methodology
Carta helps more than 45,000 primarily venture-backed companies and 2.4 million security holders manage over $3.0 trillion in equity. We share insights from this unmatched dataset about the private markets and venture ecosystem to help founders, employees, and investors make informed decisions and understand market conditions.
Overview
This study uses an aggregated and anonymized sample of Carta customer data. Companies that have contractually requested that we not use their data in anonymized and aggregated studies are not included in this analysis.
The data presented in this private markets report represents a snapshot as of August 12 , 2025. Historical data may change in future studies because there is typically an administrative lag between the time a transaction took place and when it is recorded in Carta. In addition, new companies signing up for Carta’s services will increase historical data available for the report.
Financings
Financings include equity deals raised in USD by U.S.-based corporations. The financing “series” (e.g. Series A) is taken from the share class name in their applicable certificate or articles of incorporation. Financing rounds that don’t follow this standard are not included in any data shown by series but are included in data not shown by series. Primary rounds are defined as the first equity round within a series. Bridge rounds are defined as any round raised after the first round in a given series.
In some cases, convertible notes are raised and converted at various discounted prices within a series (e.g. Series A-1, Series A-2, Series A-3). In these cases, converted securities are not included in cash raised, and only the post-money valuation of the new money is included.


DISCLOSURE: This communication is on behalf of eShares, Inc. dba Carta, Inc. ("Carta"). This communication is for informational purposes only, and contains general information only. Carta is not, by means of this communication, rendering accounting, business, financial, investment, legal, tax, or other professional advice or services. This publication is not a substitute for such professional advice or services nor should it be used as a basis for any decision or action that may affect your business or interests. Before making any decision or taking any action that may affect your business or interests, you should consult a qualified professional advisor. This communication is not intended as a recommendation, offer or solicitation for the purchase or sale of any security. Carta does not assume any liability for reliance on the information provided herein. © 2026 Carta. All rights reserved. Reproduction prohibited.