Nearly all of the venture capital funds that formed between 2017 and 2024 are still actively managing their portfolio companies, and most are still seeking their first successful exit. It’s still far too early to draw confident conclusions about what the final performance of these various fund vintages will look
But with data from more than 2,500 venture funds that currently use Carta Fund Administration, we can examine a current snapshot of fund performance for these latest VC vintages for signs of where they might be headed.
Across funds in the 2017 vintage, for instance, the median IRR was 11.5% at the end of Q1 2025. The median TVPI—a metric that tracks the total growth of a fund’s value—was 1.72x. And the median DPI—which tracks returns distributed back to LPs—was 0.27x.
But within this cohort of funds, there is substantial variation. At the 25th percentile of performance, median IRR for the 2017 vintage is just 5%. At the 75th percentile, it’s 18.7%. Up at the 90th percentile, where the best performing funds reside, the median IRR for 2017 funds is 28.3%.
Some of these recent vintages are at very different points in their fund lifecycles than others and have had the opportunity to invest in very different market climates. This report aims to explore the impact these variables have had so far on each vintage’s performance metrics.
Only U.S. funds are included in this analysis, and all included funds are direct venture investors, as opposed to funds of funds. Funds must be in vintage years 2017 through 2024. More detail on our methodology can be found at the end of this report.
Highlights
For recent funds, DPI is hard to find: Just 37% of funds in the 2019 vintage and 30% of funds from 2020 had generated any amount of distributions for their LPs by the end of Q1 2025.
Smaller funds have grown more common: Back in the 2020 vintage, 25% of closed venture funds in this sample were between $1 million and $10 million in size, and 36% were between $25 million and $100 million. In the 2024 vintage, the scales flipped: 42% of funds were between $1 million and $10 million, and 22% were between $25 million and $100 million.
TVPI figures show slight positive momentum: The median TVPI increased in Q1 for each of the 2017, 2018, and 2020 vintages. Before this, the TVPIs for these vintages had been steadily trending down. Median TVPI for the 2018 vintage, for instance, had declined in each of the past five quarters.
Fund details
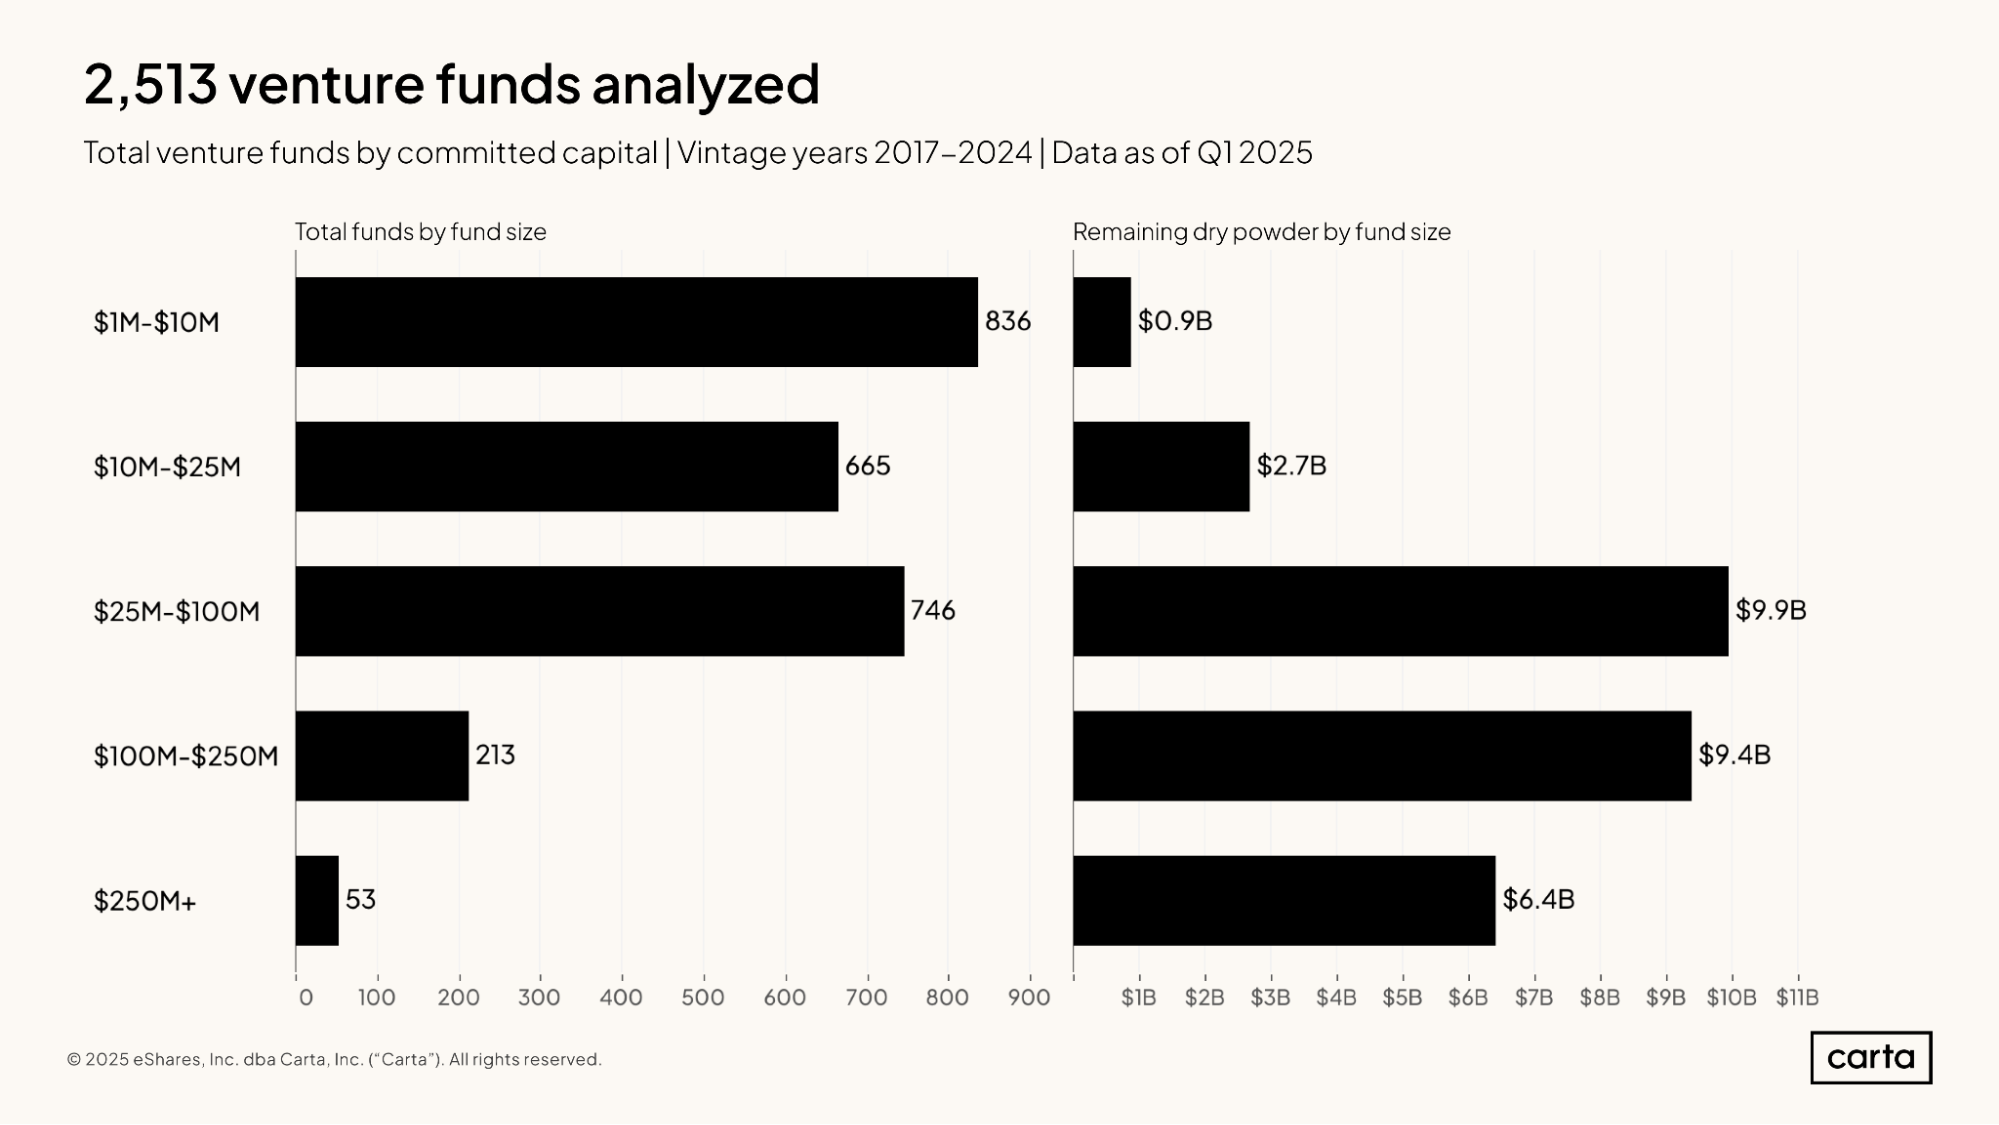
This analysis includes data from 2,513 venture funds with vintage years ranging from 2017 through 2024. A large majority of these funds—about 89%—have less than $100 million in committed capital, while about 11% are larger than $100 million.
This 11% of $100 million-plus funds, however, combine to account for 54% of all dry powder currently committed to funds in this sample. In venture capital, as in much of the private markets, a relatively small minority of funds typically maintains an outsized portion of the buying power.
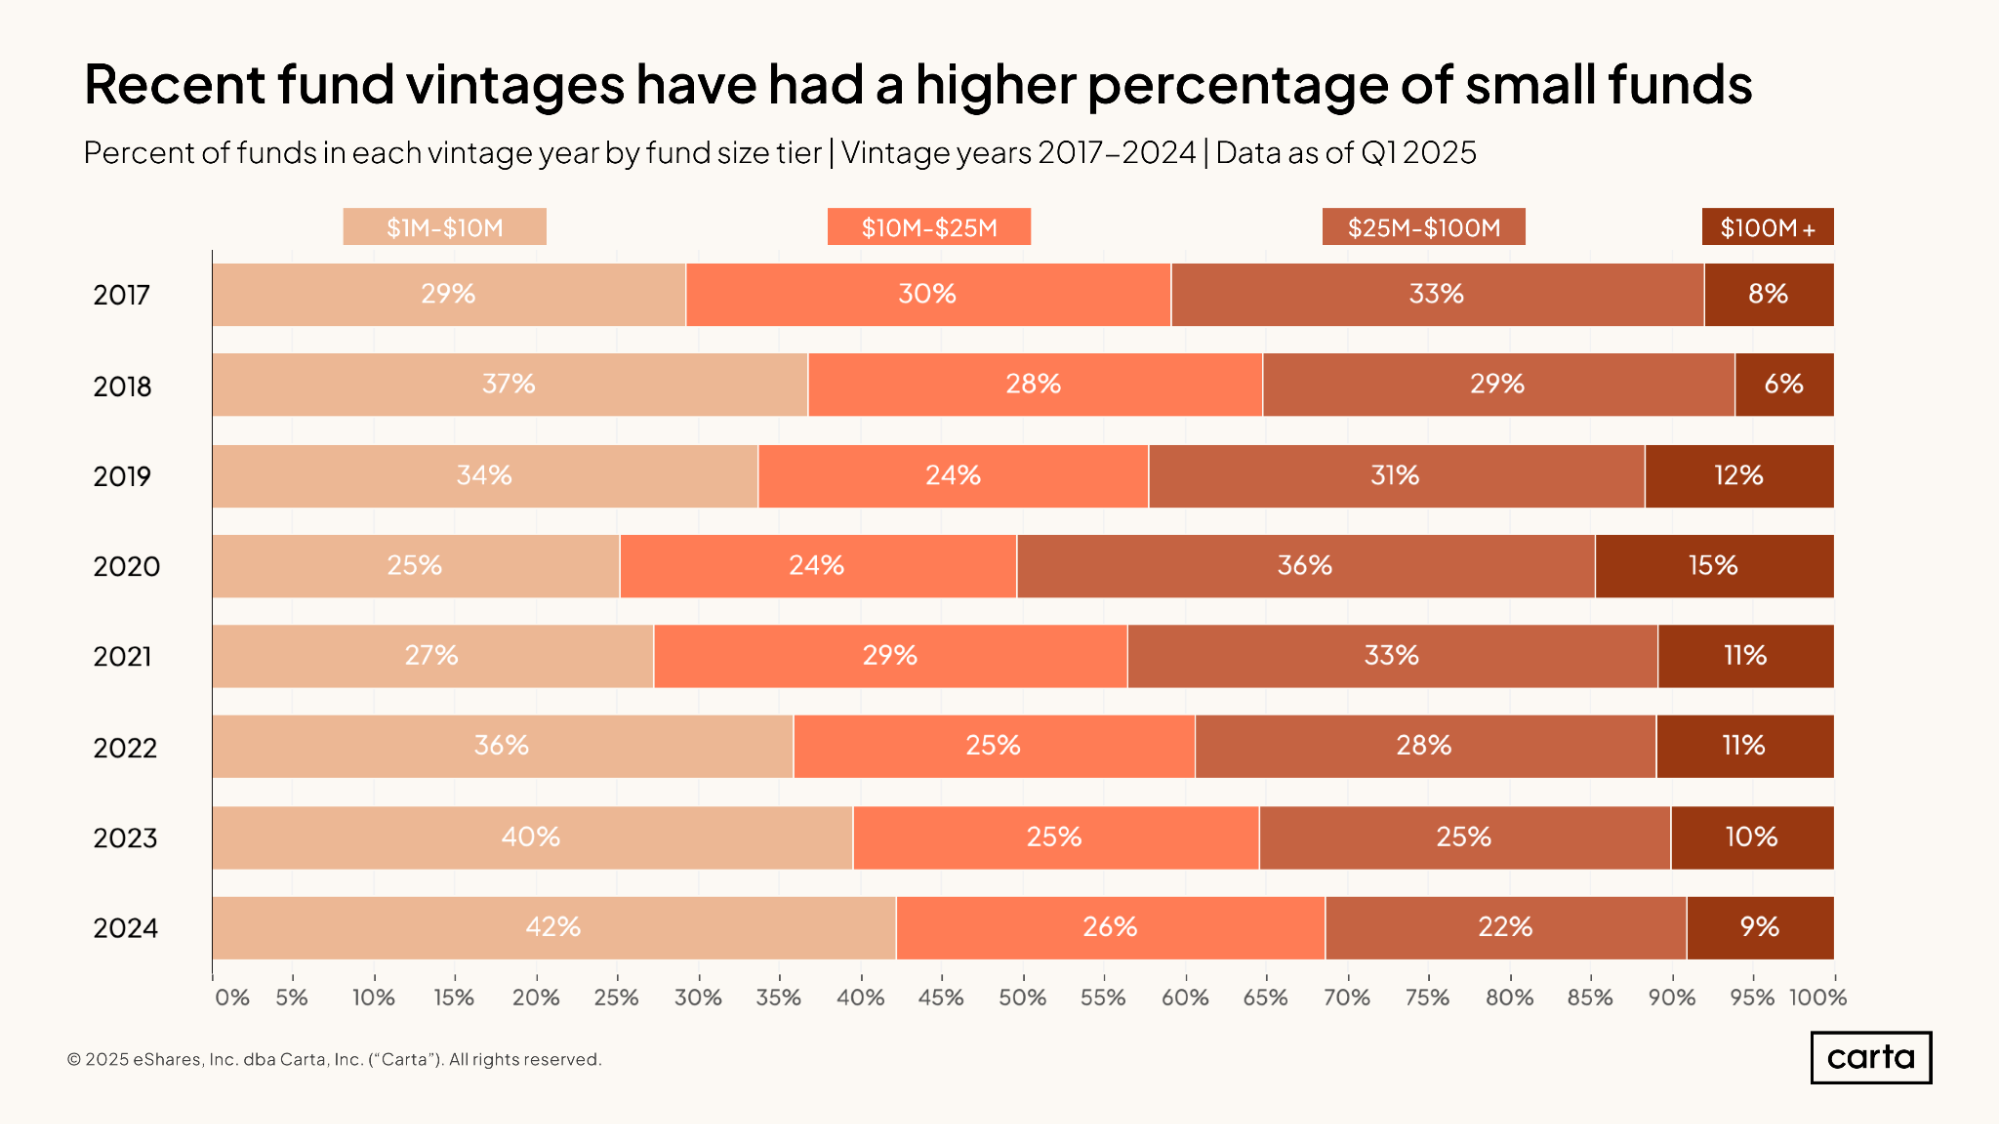
Throughout the 2020s, the percentage of venture funds that have less than $10 million in committed capital has been steadily increasing with each new vintage. In the 2024 vintage, 42% of all funds were between $1 million and $10 million in size, compared to 25% of funds at the start of this decade.
The percentage of funds larger than $100 million declined some over this span, falling from 15% in 2020 to 9% in 2024. But the larger change has come in the cohort of funds that are between $25 million and $100 million in size. These accounted for 22% of the 2024 fund vintage, down from 36% in 2020.
To at least some degree, this tilt of the market toward smaller funds is likely symptomatic of some LPs cutting their contributions to the venture capital asset class. In a less frothy venture ecosystem, smaller funds may become more common.
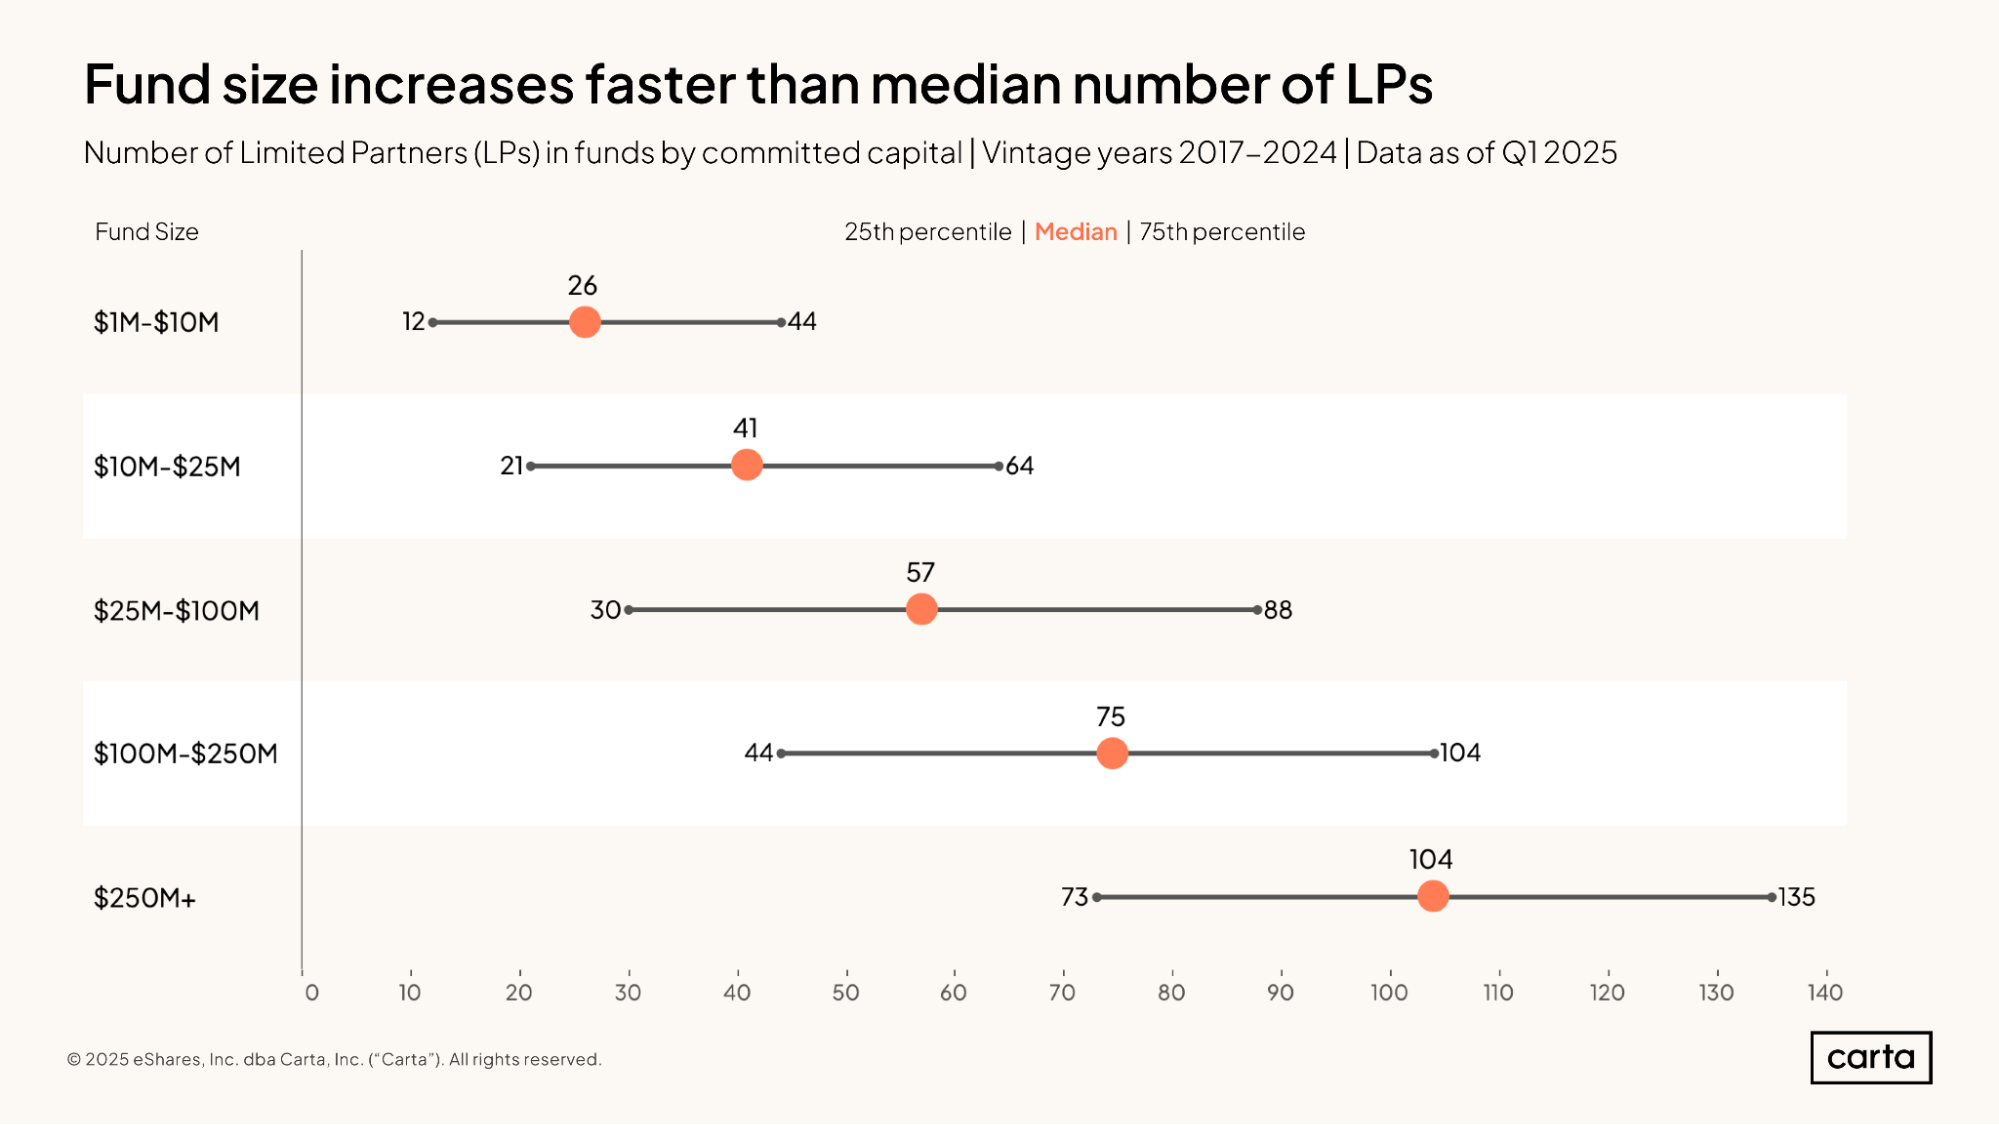
With more capital comes more LPs. Among funds between $1 million and $10 million in size, the median new fund raised between 2017 and 2024 had 26 different LPs. For funds larger than $250 million raised over that span, the median LP count was four times higher, at 104.
Funds of similar sizes can structure their LP bases in very different ways, however. The range between the 25th percentile and 75th percentile for the number of LPs can give a better idea for the norms within a cohort. For instance, half of all funds in the $1 million to $10 million cohort have somewhere between 12 and 44 LPs.
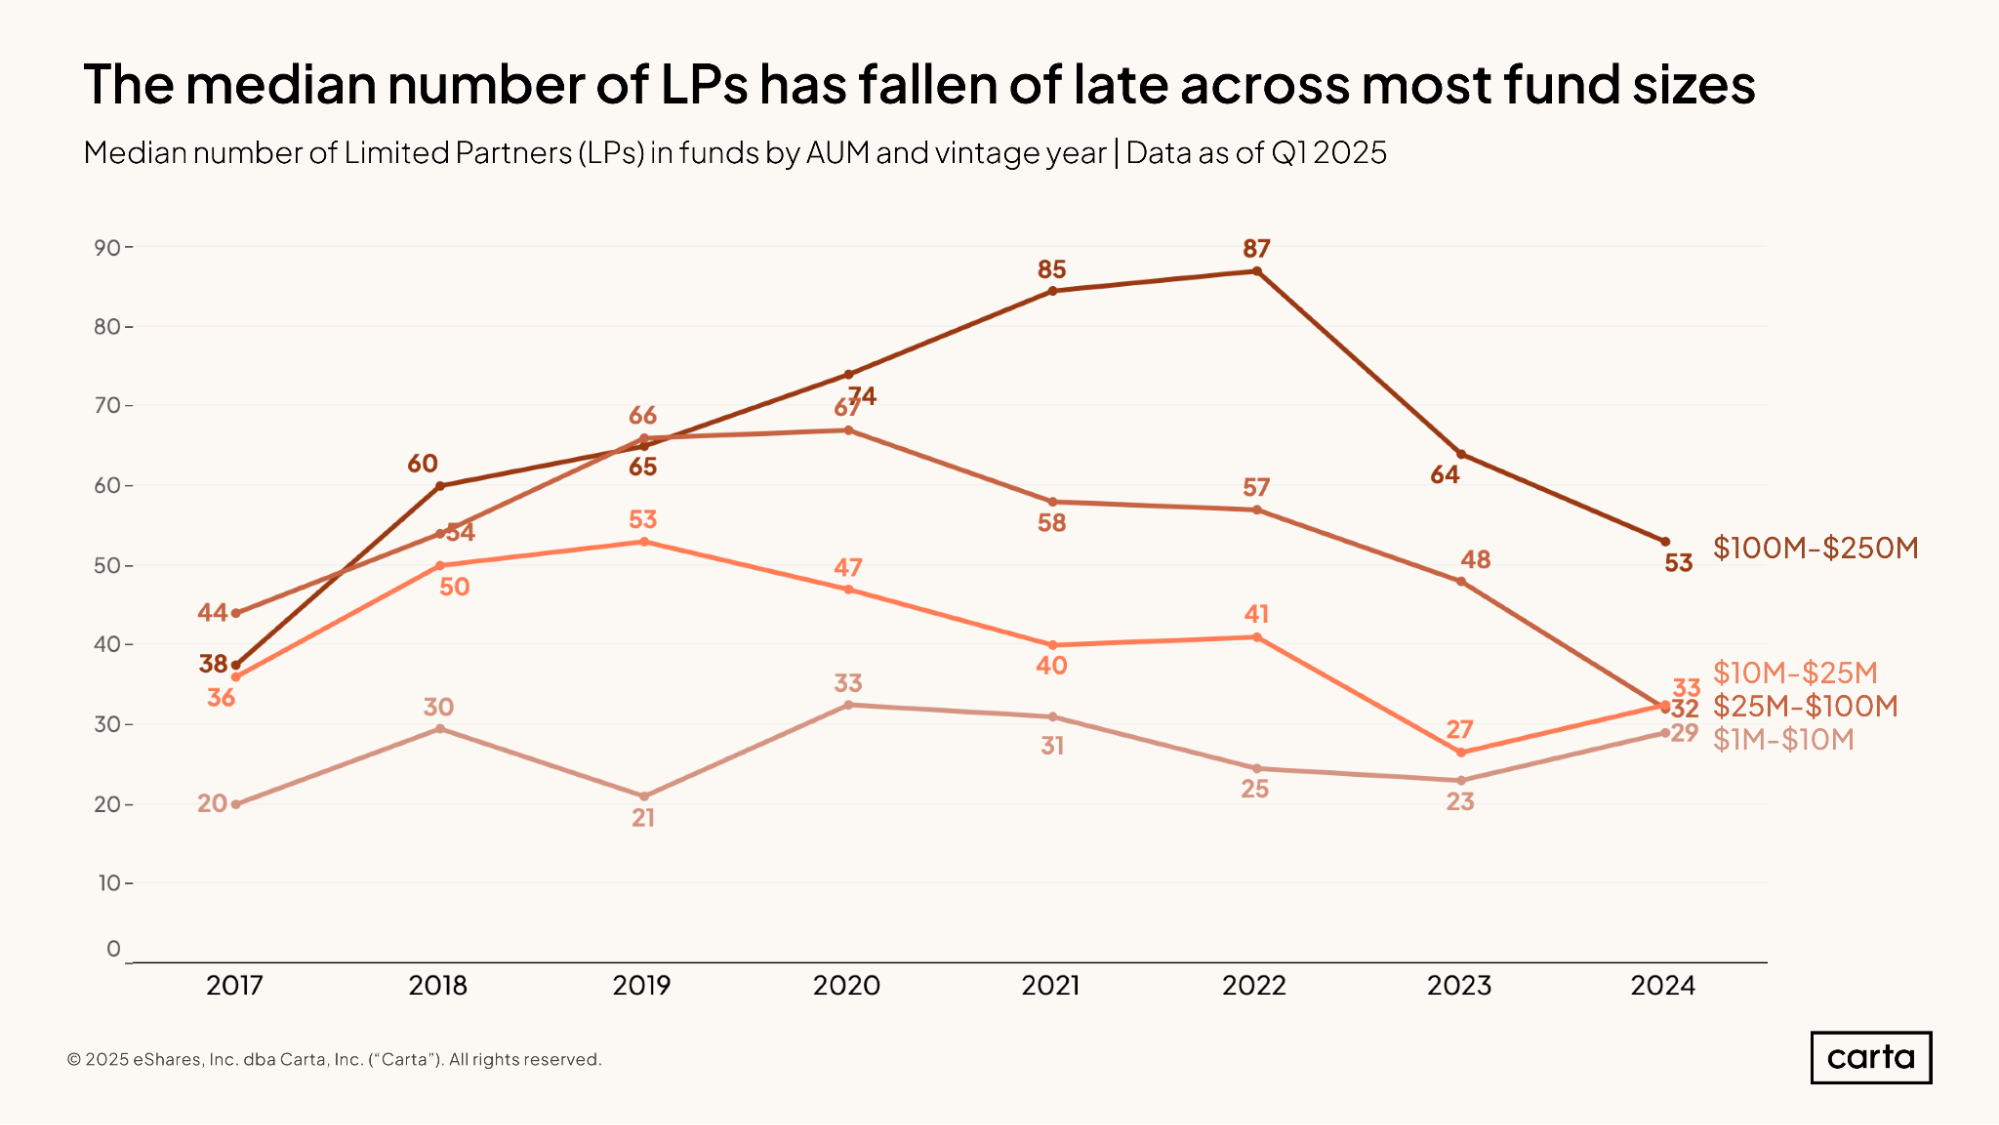
In 2024, the median VC fund with between $100 million and $250 million in commitments had 53 LPs, down from 87 for the 2022 fund vintage. The median fund between $1 million and $10 million, meanwhile, had 29 LPs in 2024, up from 25 in 2022. The typical number of LPs has been declining for the largest funds in this analysis and rising for the smallest.
As a result, the gap in the median number of LPs between the smallest and largest funds has been narrowing. Back in 2022, the median fund between $100 million and $250 million had 3.5x more LPs than the median fund between $1 million and $10 million. In 2024, that ratio dropped all the way to 1.8x.
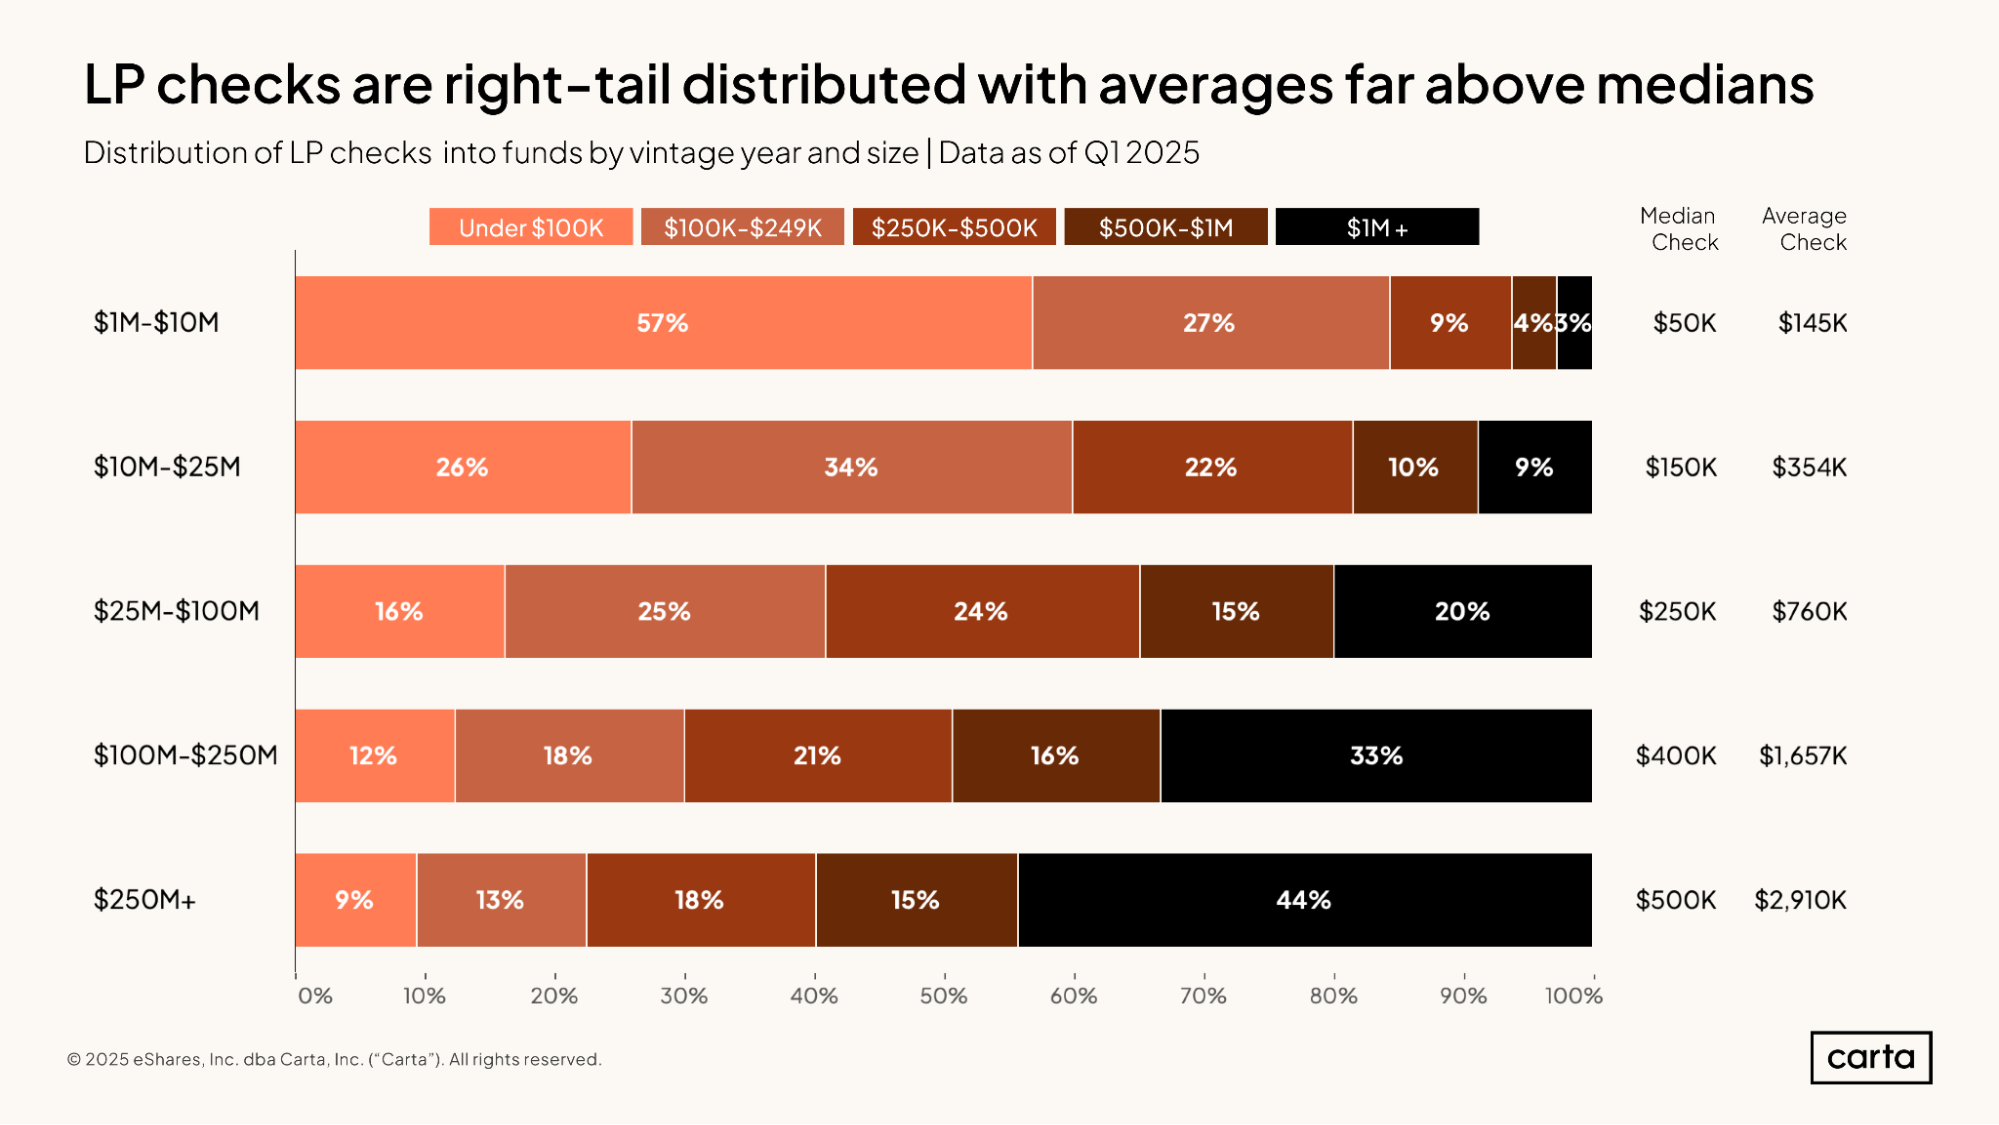
Across all fund sizes, the average LP check size is significantly larger than the median LP check size. This indicates that the sample of LP check sizes tends to be right-tail distributed, with some large outliers on the upper end pulling the average higher.
The cohort of funds with between $25 million and $100 million in commitments gives us one example of this phenomenon. The median check size among this group is $250,000. But 20% of LP checks in this cohort are $1 million or more, which is at least four times larger than the median. Thanks to the presence of these larger contributions, the average LP check for this cohort is up to $760,000.
IRR
IRR (Internal Rate of Return) performance for an active venture fund often follows a pattern called the J-curve. In the earliest years, IRR tends to be negative due to a lack of distributions along with administrative expenses, such as management fees. In the middle years of a fund’s lifespan, IRR typically begins to rise and passes back above 0%. In the final years of a typical fund’s activity, IRR continues to climb.
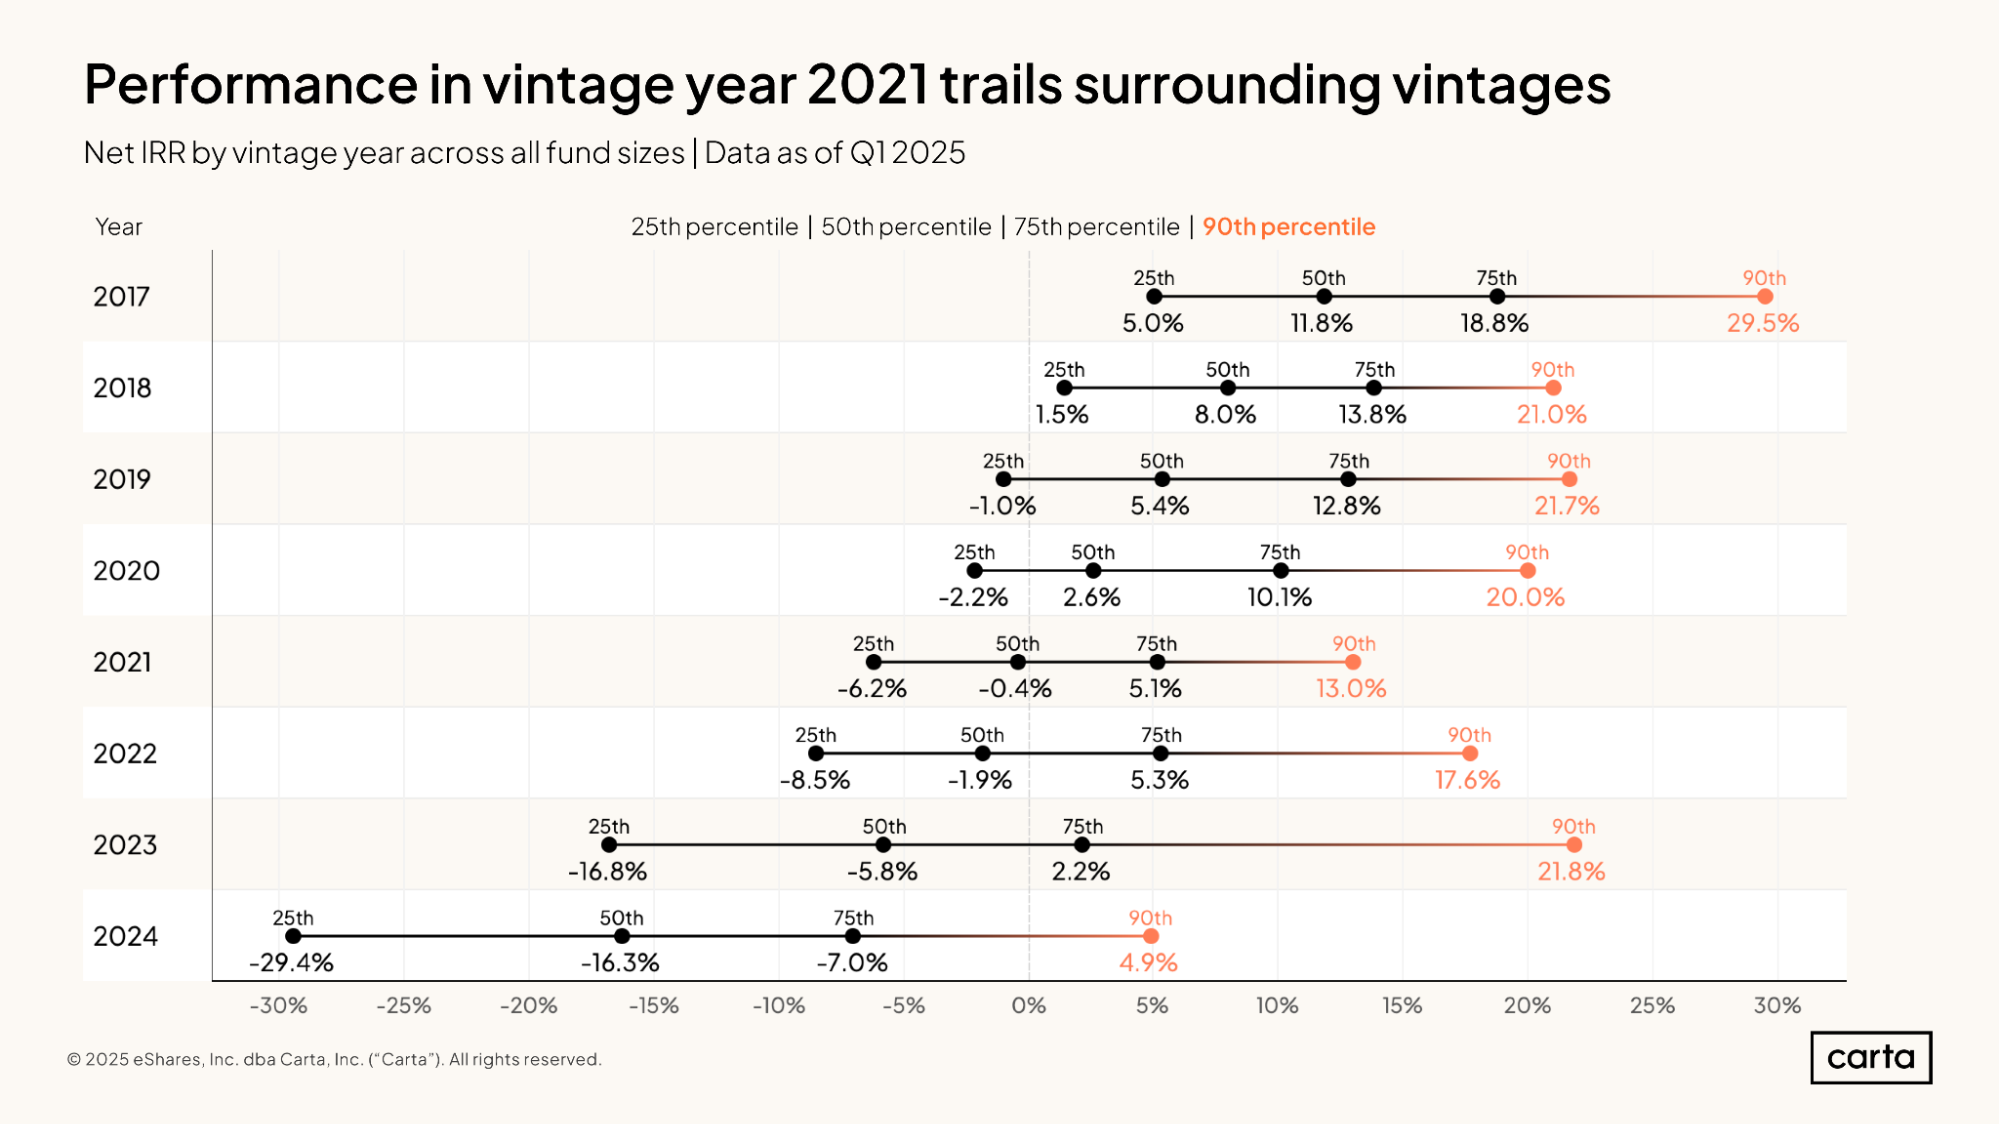
The IRRs for each of these fund vintages from 2017 through 2024 are still very much moving targets. But this current snapshot can function as an apt demonstration of the J-curve. For fund vintages from 2021 onward, the median net IRR is still negative. From that point moving backward in time, median IRRs steadily rise, with the 2017 vintage currently boasting the best performance.
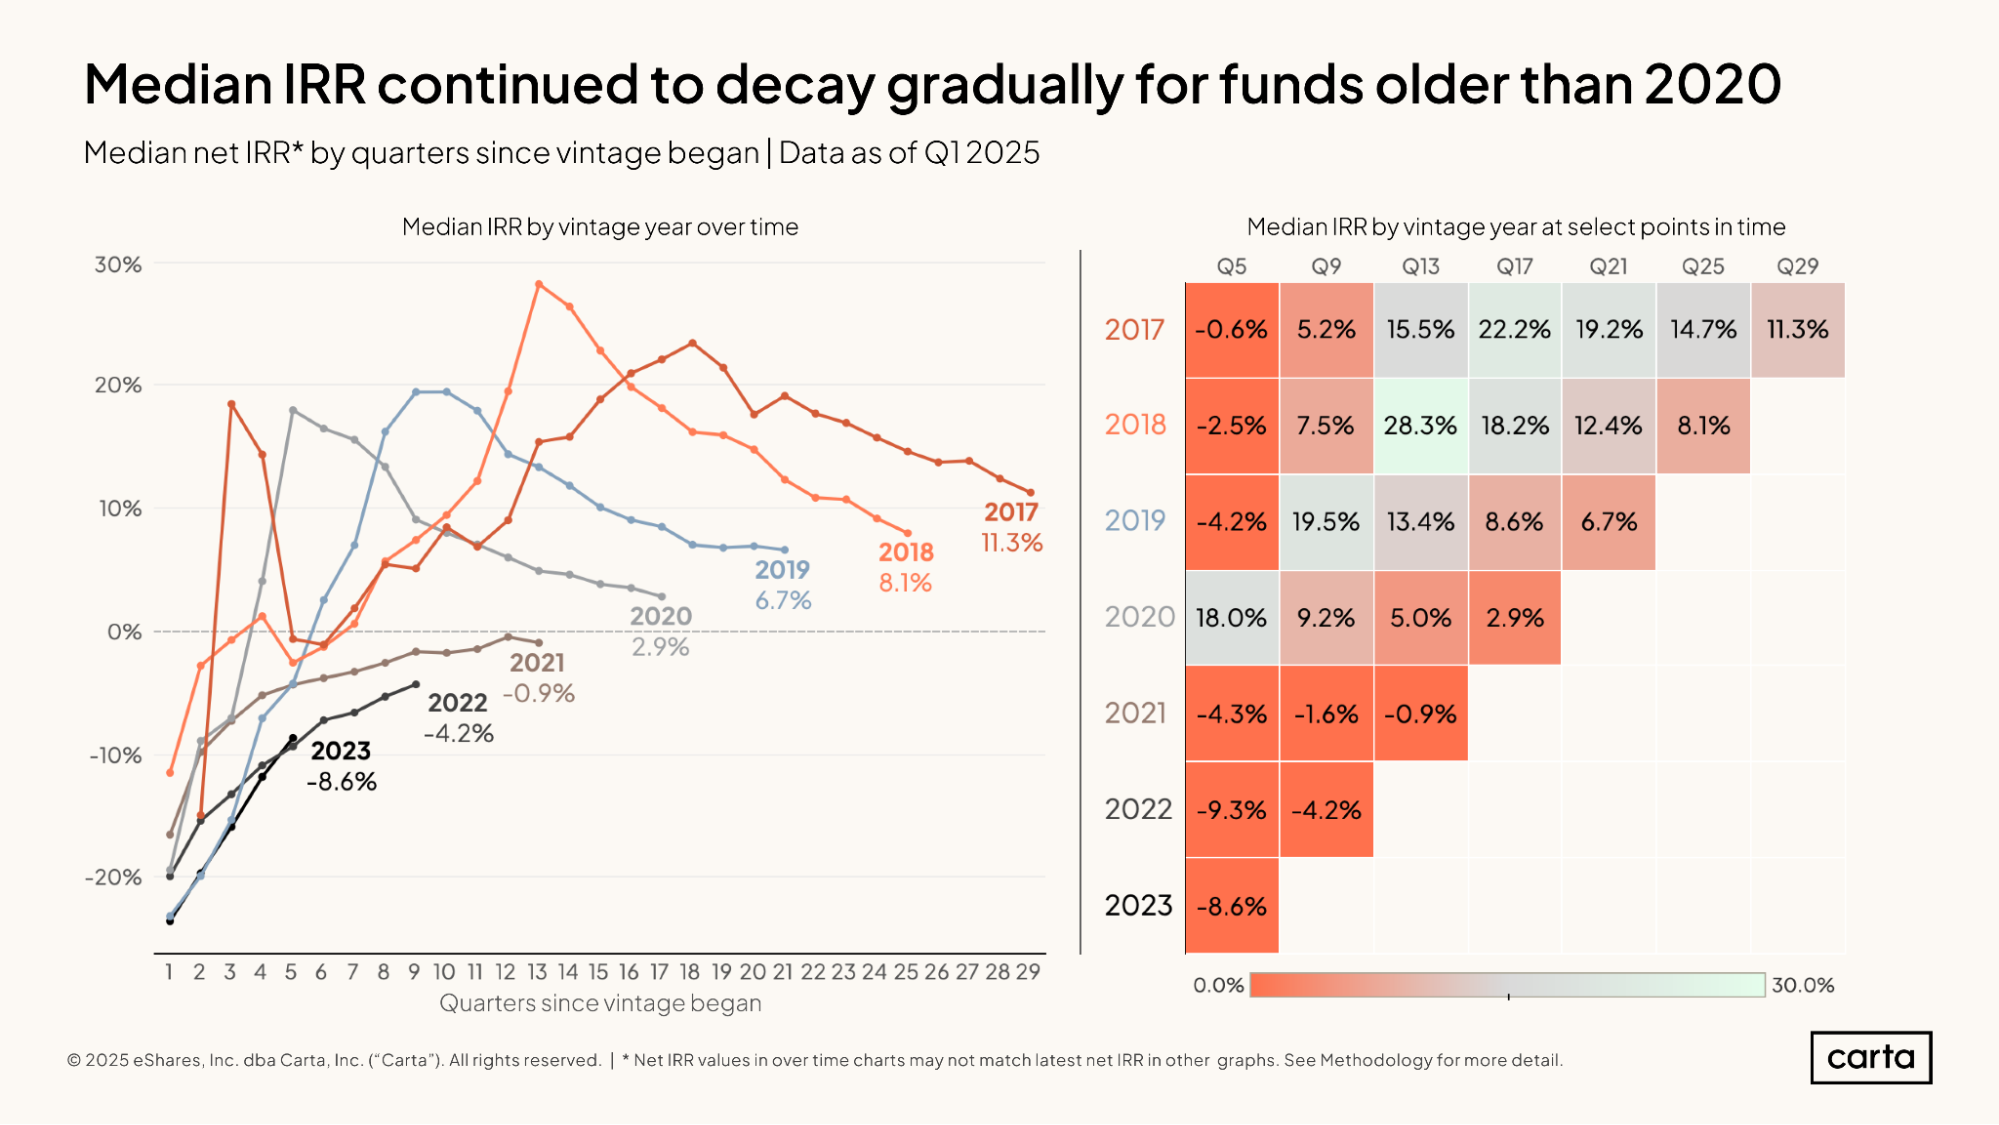
Since IRR is so sensitive to the age of a fund, we can better compare active funds from different vintages by looking at performance at certain time milestones in a fund’s lifespan.
Among the 2017 vintage, for instance, the median fund had an IRR of -0.6% at five quarters after closing. That figure rose to 5.2% by the ninth quarter after closing (a little more than two years) and 15.5% by the 13th quarter.
Early performance has generally been worse among more recent vintages that were not actively investing during the bull market of 2020 and 2021. At 13 quarters, the median fund in the 2021 vintage had an IRR of -0.9%. At the same point in time, every vintage from 2017 through 2019 had a median IRR of at least 13.4%.
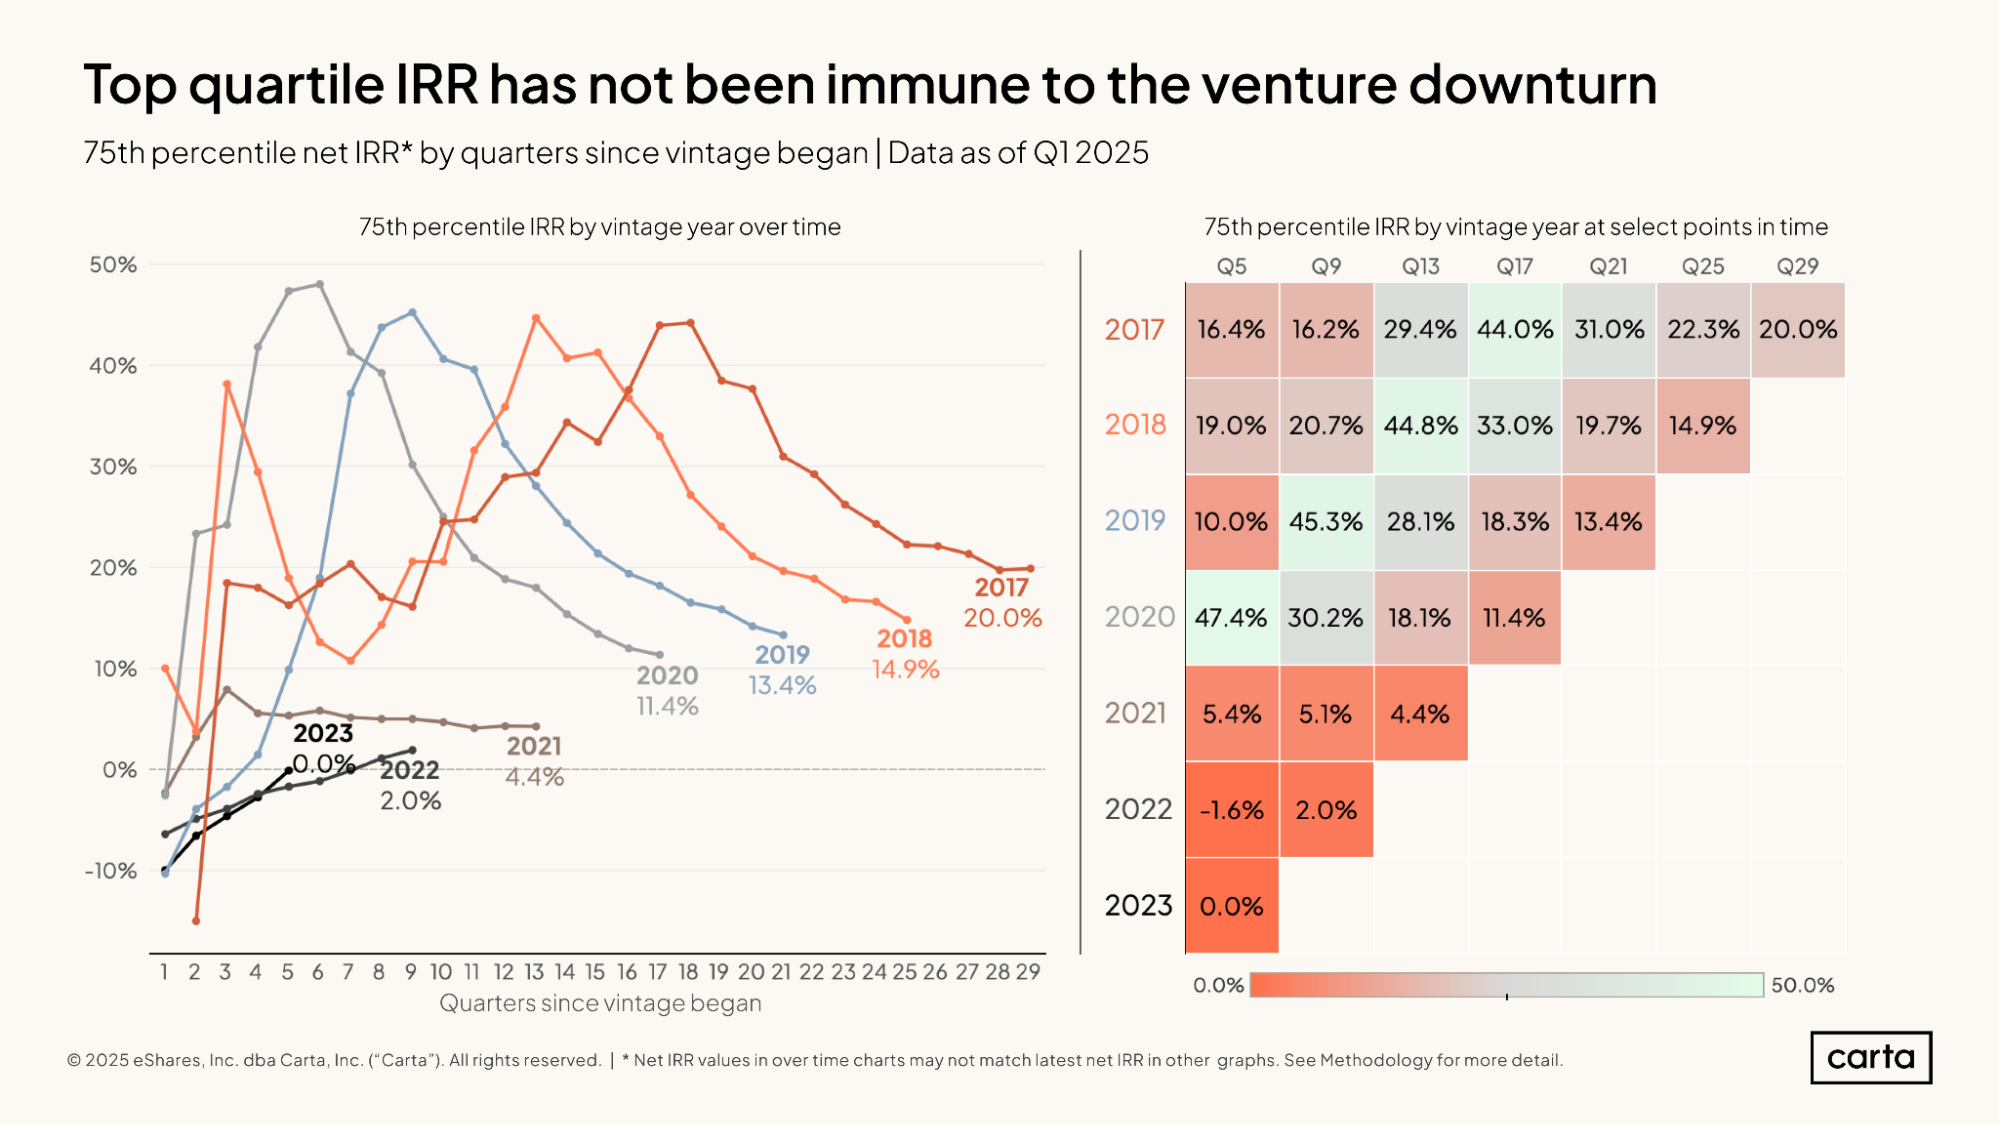
The IRR numbers are directionally similar—but of course slightly better—if we look at the 75th percentile of performance for each recent vintage.
Again, vintages from 2020 and earlier seem to have a clear advantage over later vintages. But for those earlier vintages, performance has fallen off considerably over the past three years. For the 2018 vintage, the 75th percentile for IRR was 14.9% after 25 months (about six years), compared to a 75th percentile IRR of 44.8% three years prior.
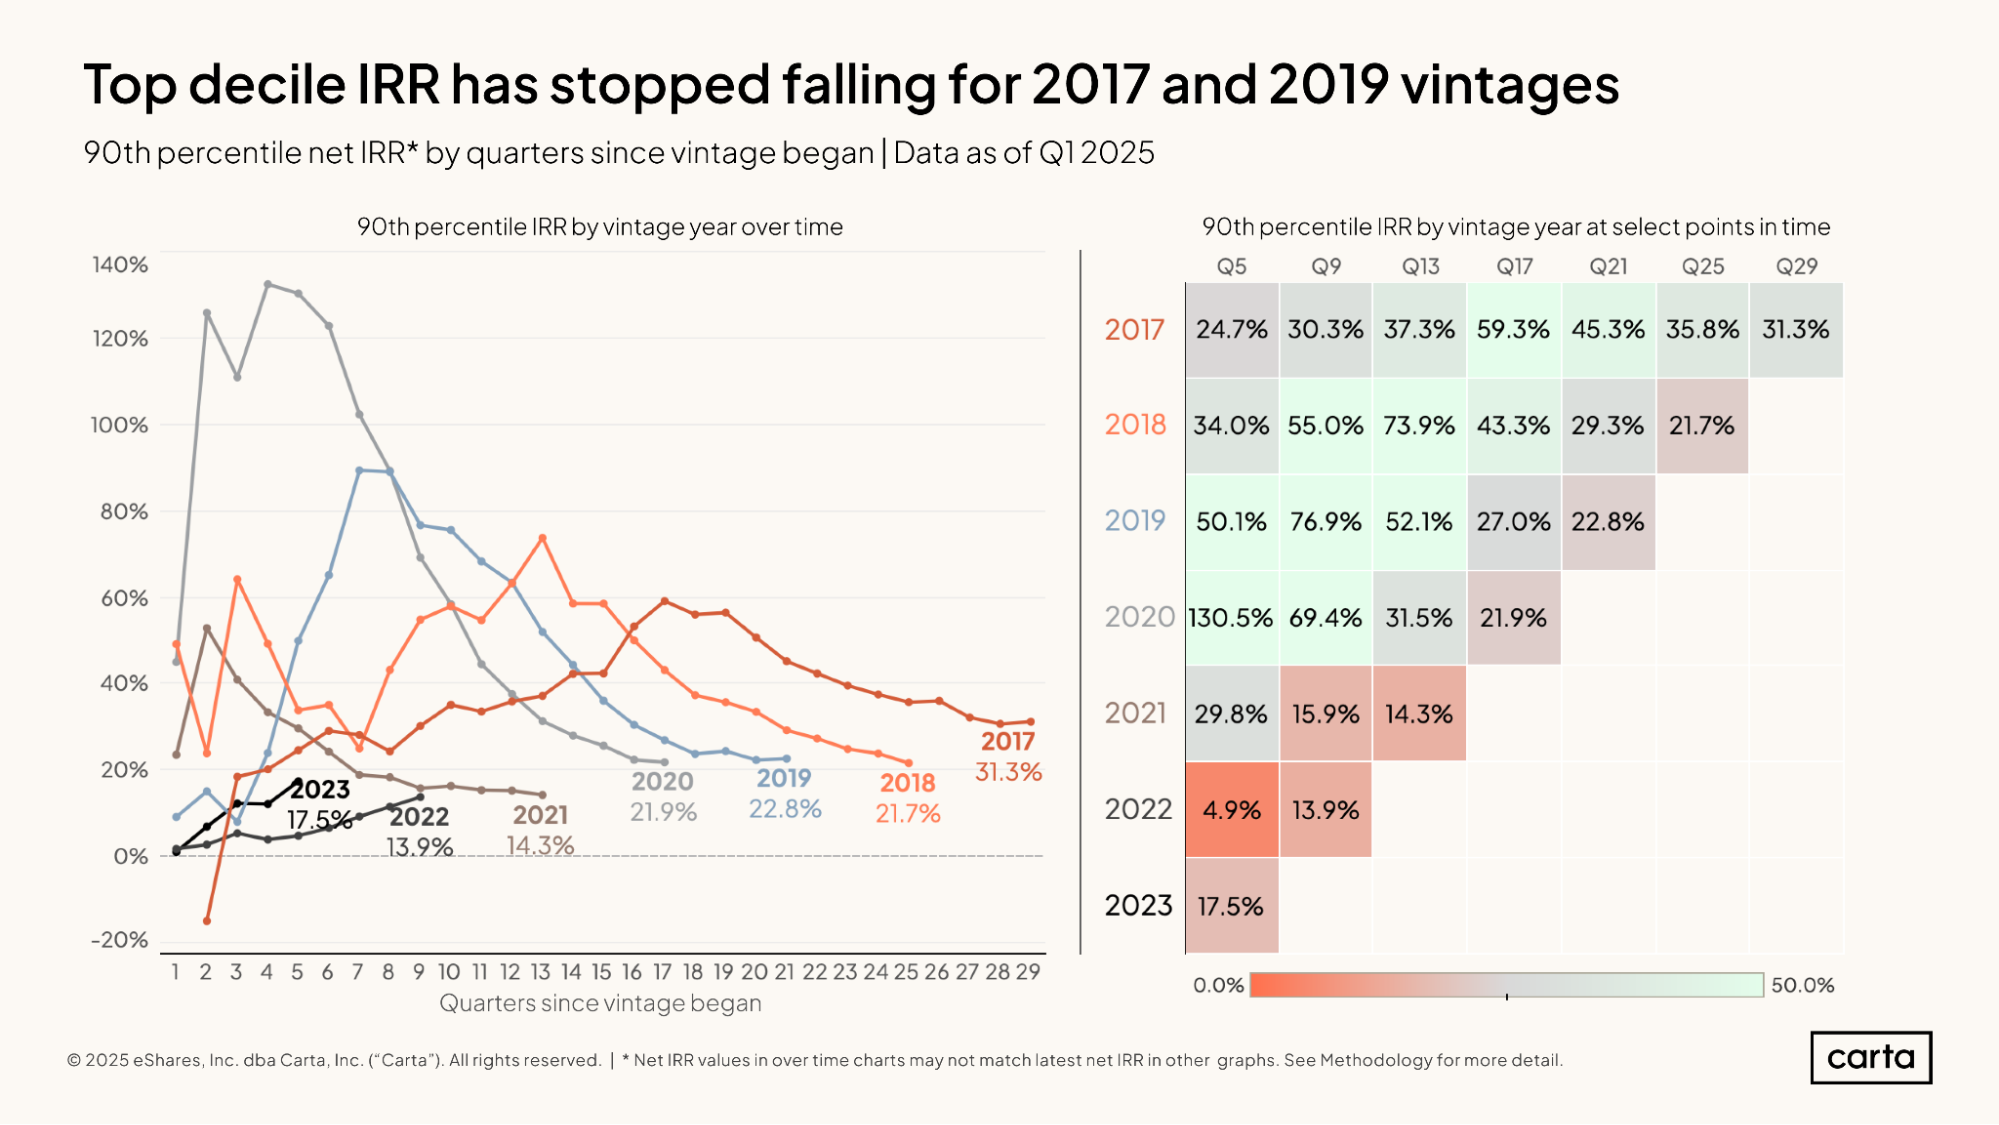
The best-performing funds from 2017 through 2021 have all seen their IRRs tail off considerably over the past three years. But the most recent quarter brought signs of an end to this downward momentum.
In the 2017 vintage, the 90th percentile IRR ticked up during the latest quarter, reaching 31.3%. The 2019 vintage also saw an increase in its 90th percentile IRR, rising to 22.8%.
Funds in these two vintages have now been active for eight years and for six years, respectively. Theoretically, the past few years should have been times of IRR gains. But the J-curve has been overpowered by a wider downturn in the venture market, with a valuation reset and a lack of exits driving down distributions. These recent upticks could be signs of the math starting to move in an investor-friendly direction.
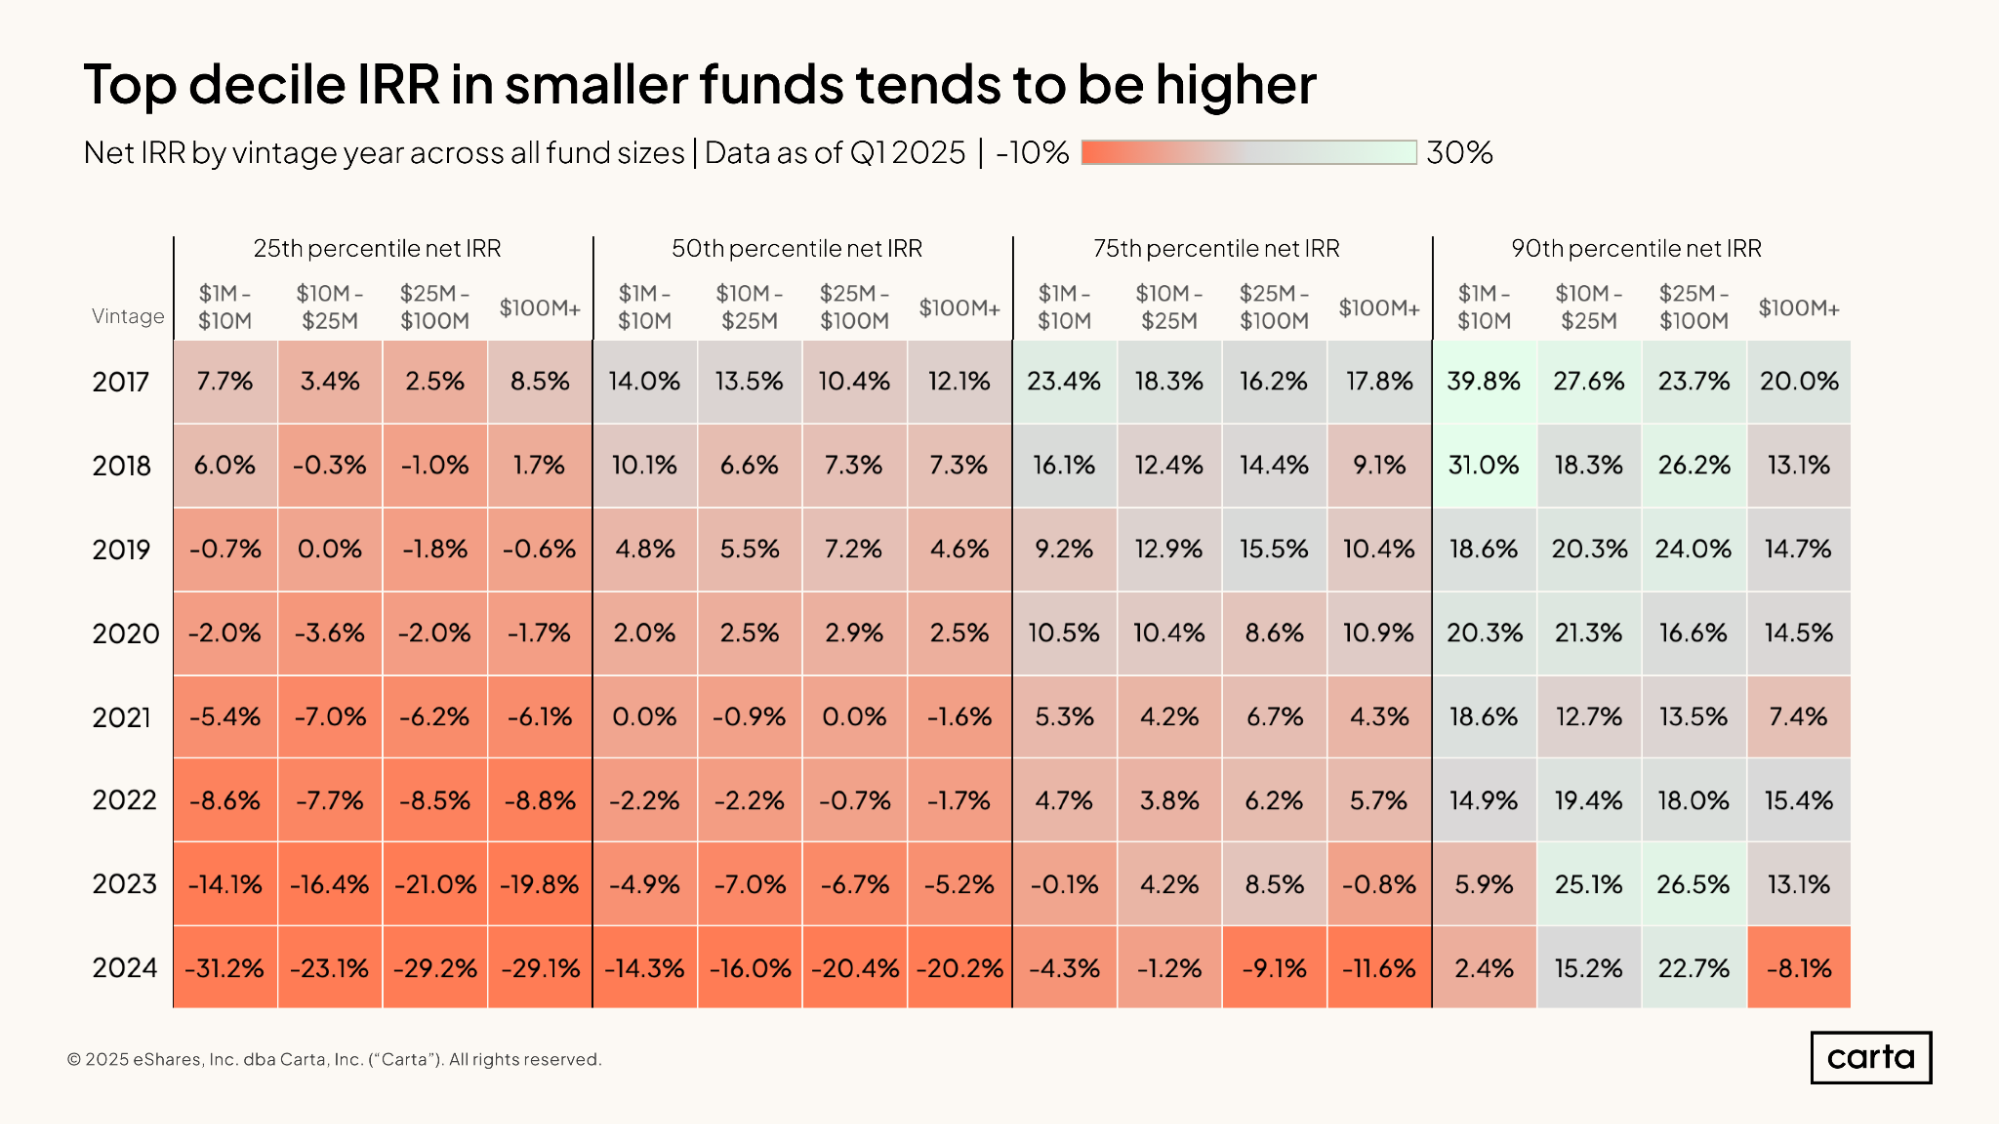
As a rule of thumb, smaller funds tend to post higher IRRs than larger funds. This is due to a mathematical principle called the law of large numbers. It will be more difficult for the manager of a $100 million fund to achieve the same multiple as a similar $1 million fund, because for a larger fund, that same multiple requires a much larger raw return.
Take the 2018 fund vintage, for instance. The median IRR for a fund between $1 million and $10 million in size is 14%, a little higher than the 12.1% median for funds with more than $100 million in assets. The same holds true for the 25th percentile, the 75th percentile, and the 90th percentile: In each instance, IRRs are higher in the cohort of the smallest funds.
TVPI
Like IRR, TVPI (Total Value to Paid-In Capital) is a key metric used to measure fund performance. And like IRR, the median TVPI within a given fund vintage typically improves over time. This is due primarily to the rising value of investments and distributions: Unlike IRR, the formula for TVPI does not account for the time value of money.
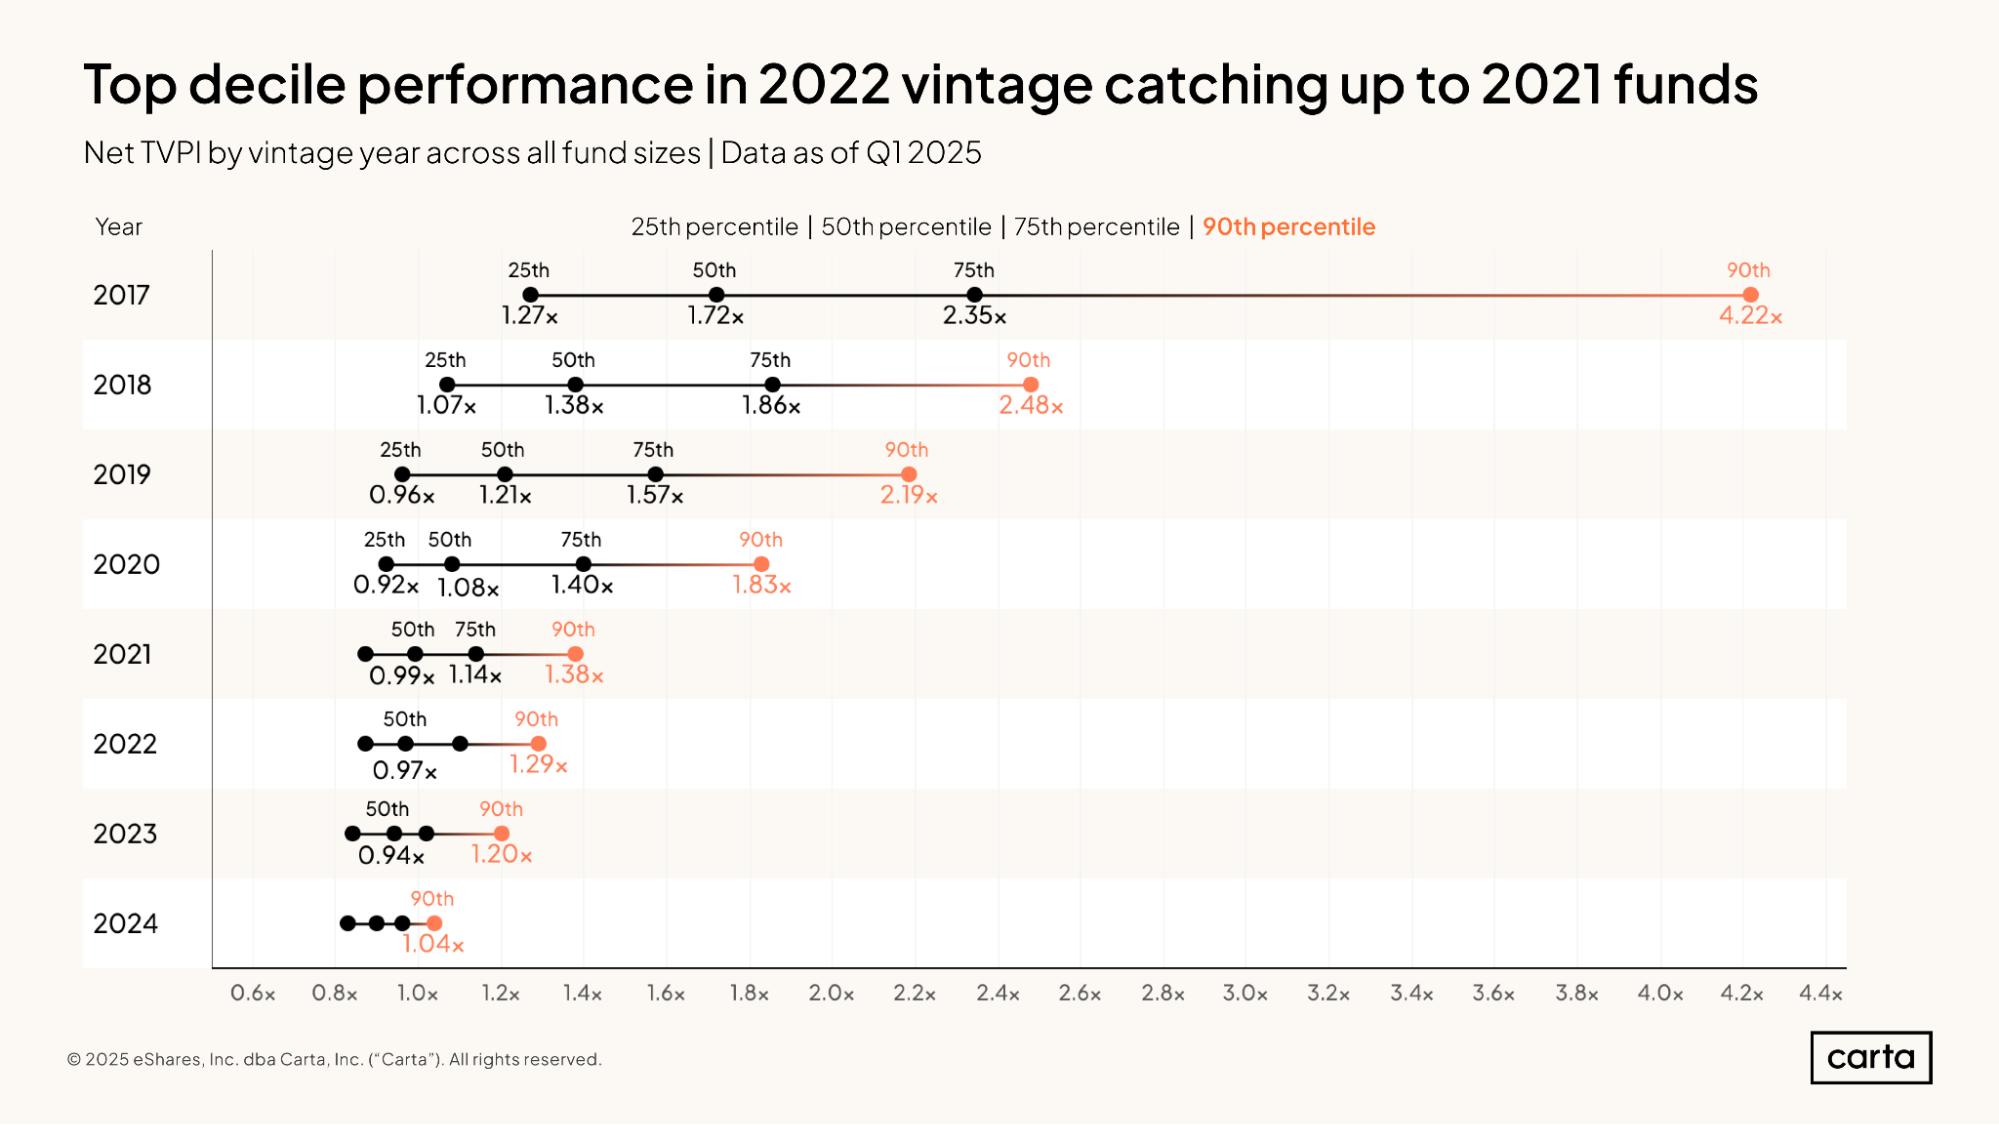
Median TVPIs are 1x or higher for every vintage from 2020 and earlier. At the upper end of the performance spectrum, there are some clear differences between vintages, with the 90th percentile for TVPI in the 2017 vintage rising all the way to 4.22x.
The difference in the top-performing funds across more recent vintages is narrowing. The 90th percentile TVPI for funds in the 2022 vintage is 1.29x, which is approaching the 90th percentile TVPI of 1.38x for the 2021 vintage.
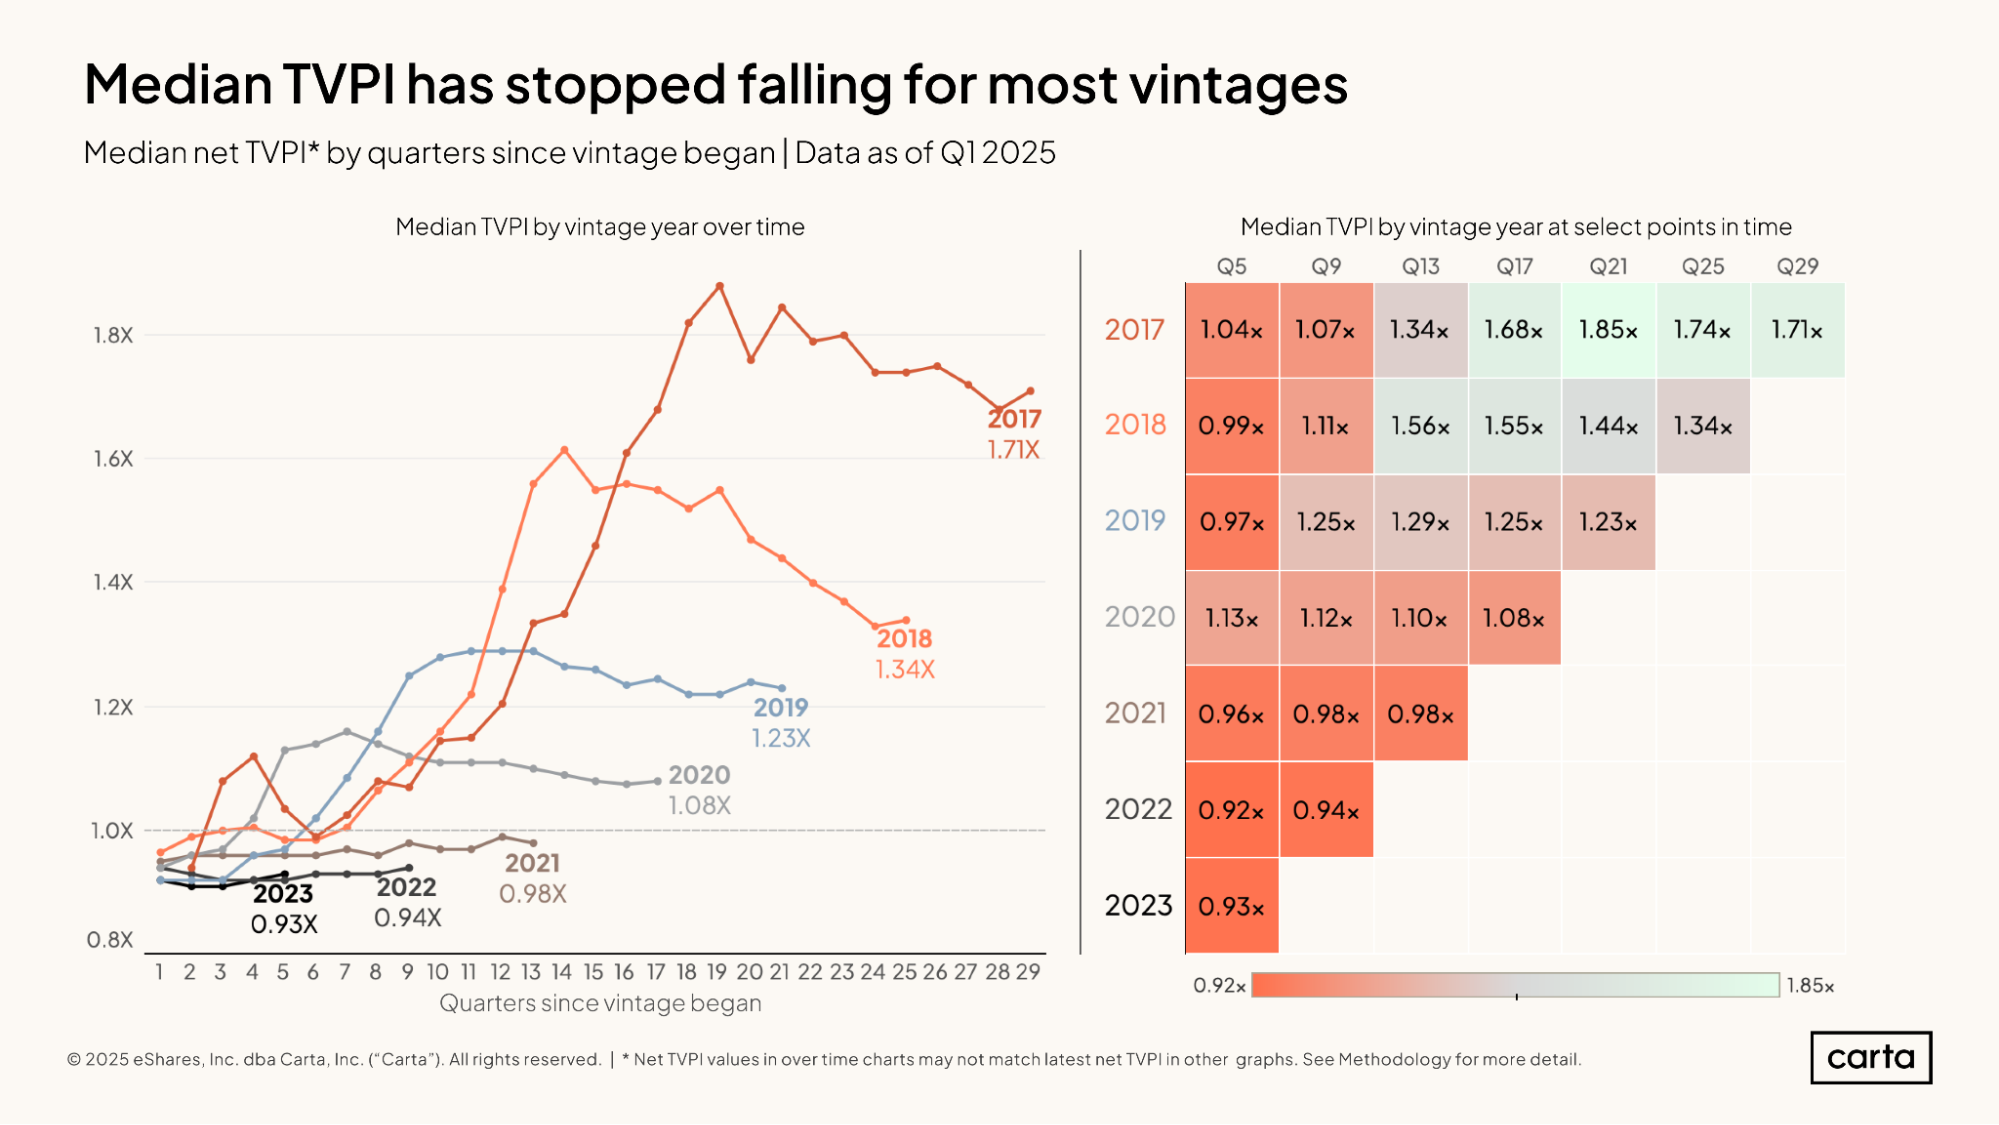
For five of the seven vintages shown here, the median TVPI increased in the most recent quarter, arresting a recent trend of gradually declining performance. The 2017 vintage saw the biggest spike, with the median TVPI rising to 1.71x. That’s higher than it was three years ago.
As is the case with IRR, median TVPIs for more recent vintages are lagging behind those from older vintages at the same point in time. After about three years and one quarter (the Q13 column shown above), the median TVPI was 1.1x or higher for every fund vintage from 2017 through 2020. For the 2021 vintage, however, the median TVPI is 0.98x at the same point.
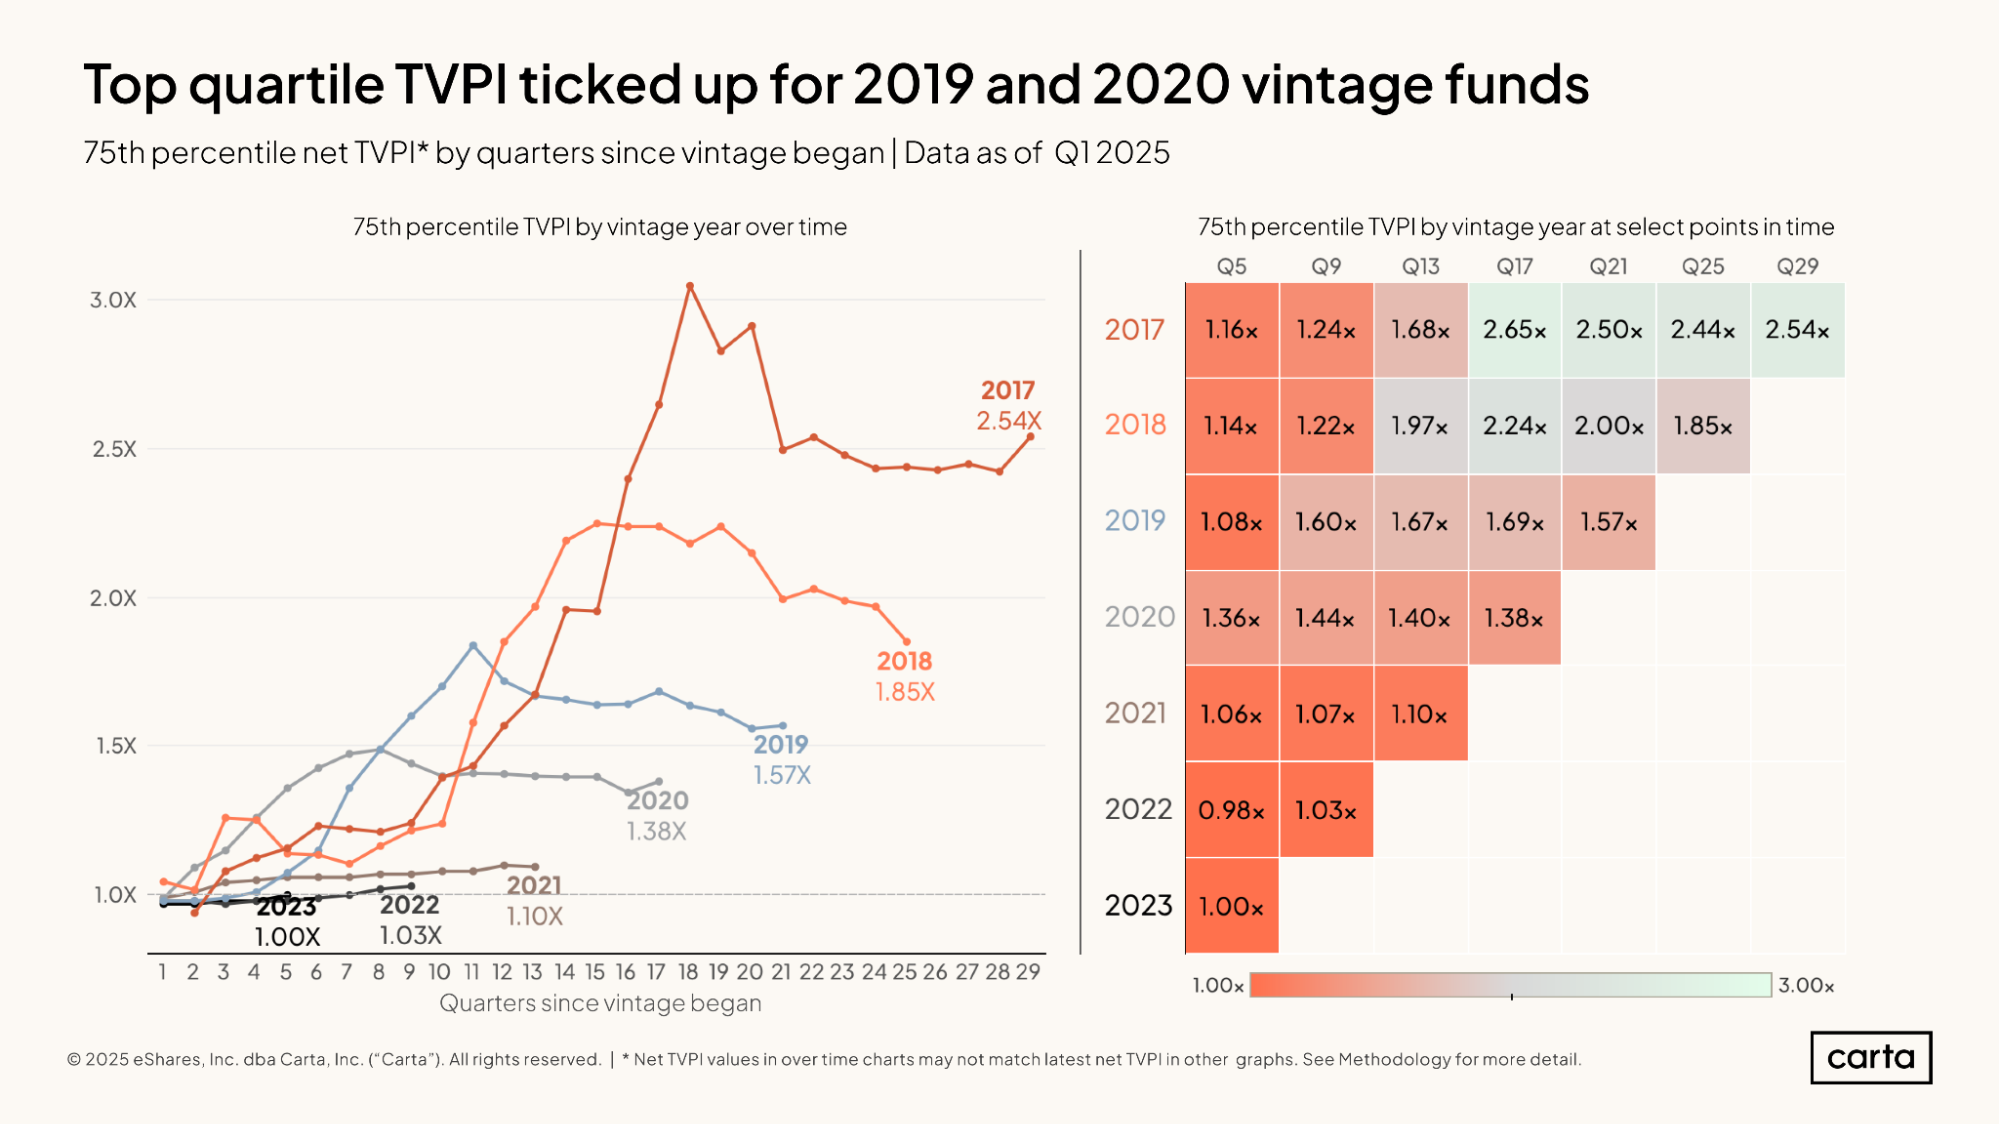
The 2017 vintage also saw a recent uptick in top quartile TVPI, as the 75th percentile for TVPI performance rose to 2.54x in the latest quarter. Figures at the 75th percentile also picked up for the 2019 and 2020 vintages.
In the 2023 vintage, the 75th percentile for TVPI sits at an even 1.00x. This means that about a quarter of the funds at this most recent vintage have begun to create positive value. Nearly all of these gains are unrealized.
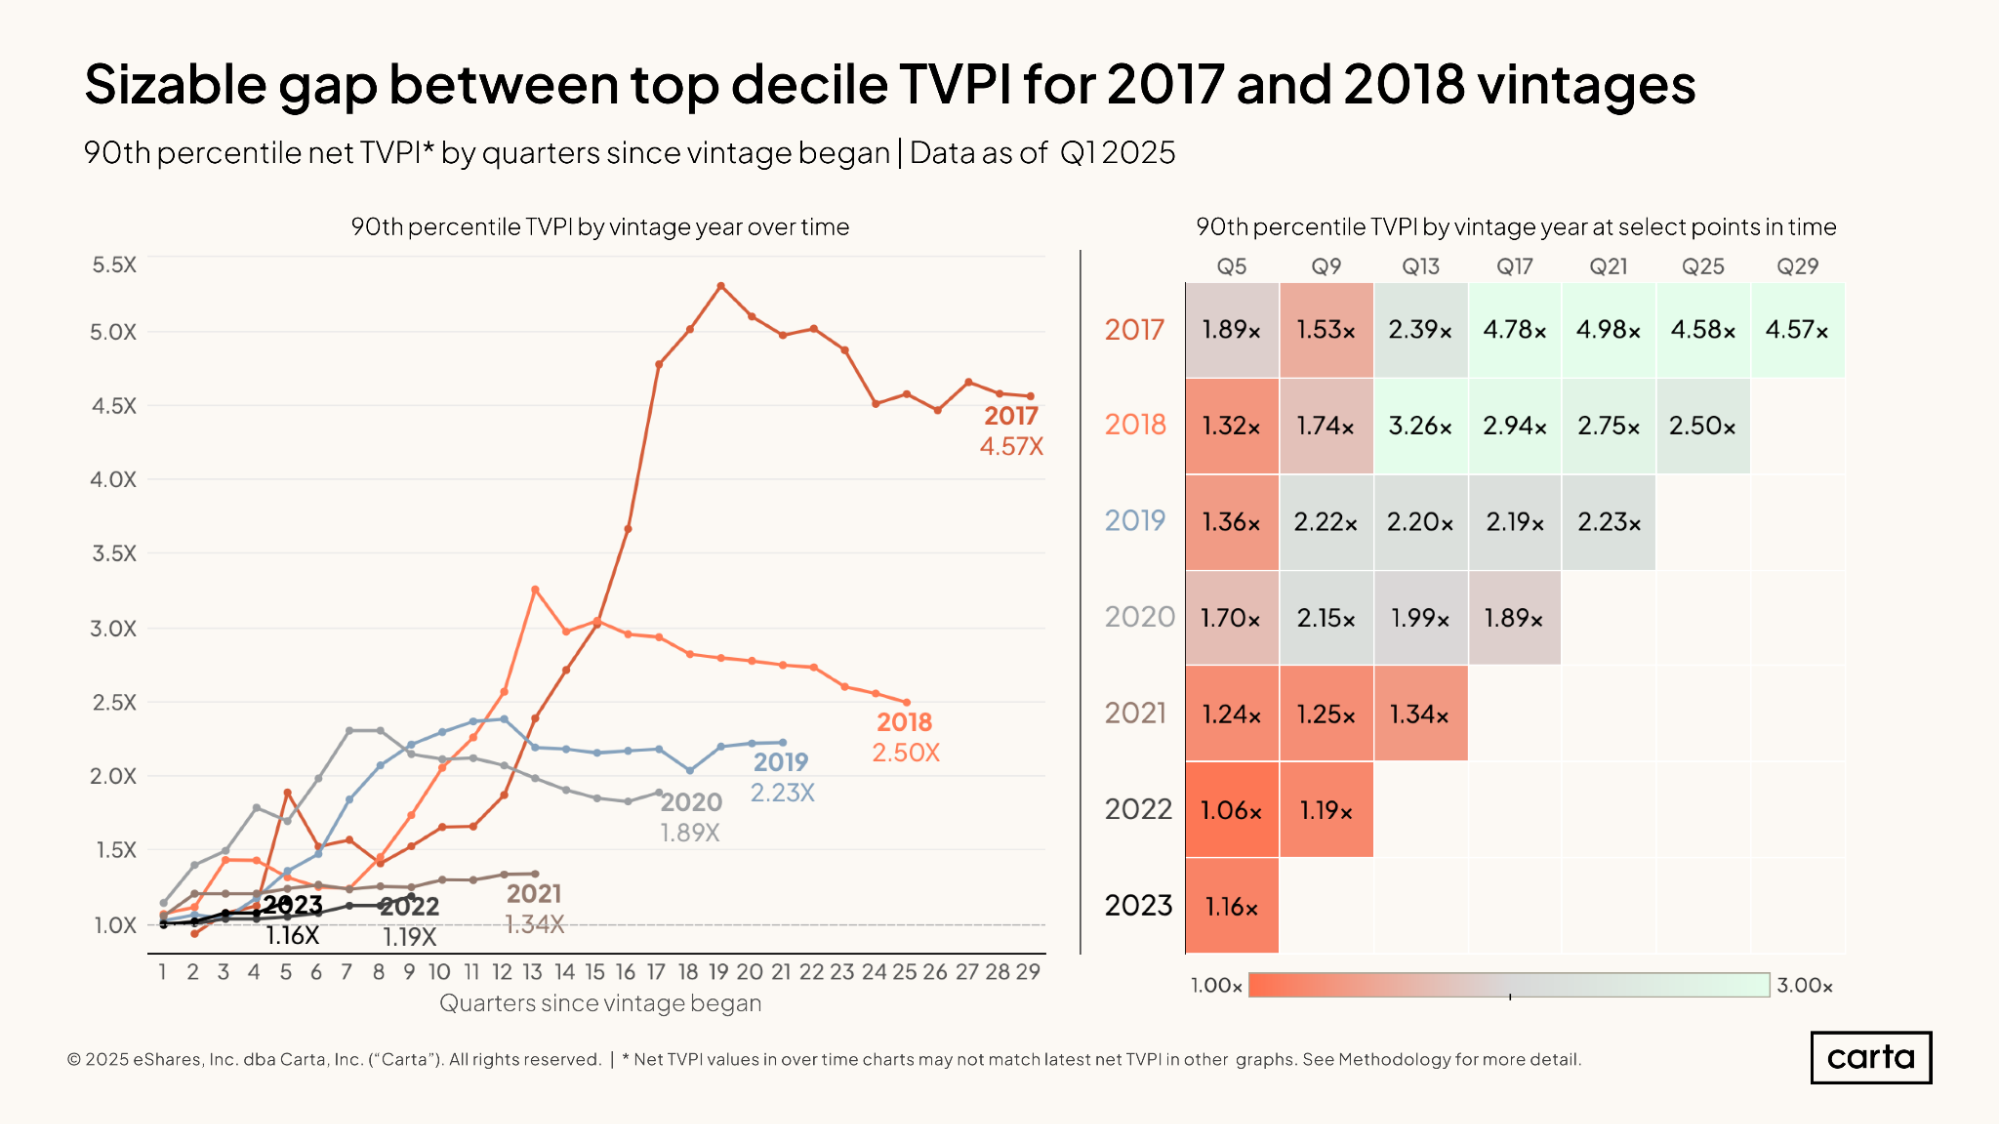
The gap in performance between the 2017 vintage and these other recent vintages grows even wider at the top decile. The 90th percentile for TVPI among 2017 funds currently stands at 4.57x, nearly twice as high as the 90th percentile for any other vintage from 2018 onward.
To some degree, this likely reflects the fact that 2017 funds had more time to invest (and, in some cases, achieve some early exits) during the historically strong venture market of the late 2010s and early 2020s. The 90th percentile IRR for the 2017 vintage skyrocketed in the stretch between 12 quarters and 18 quarters since conception, which loosely correlates to the period in 2020 and 2021 when the VC market was at its hottest.
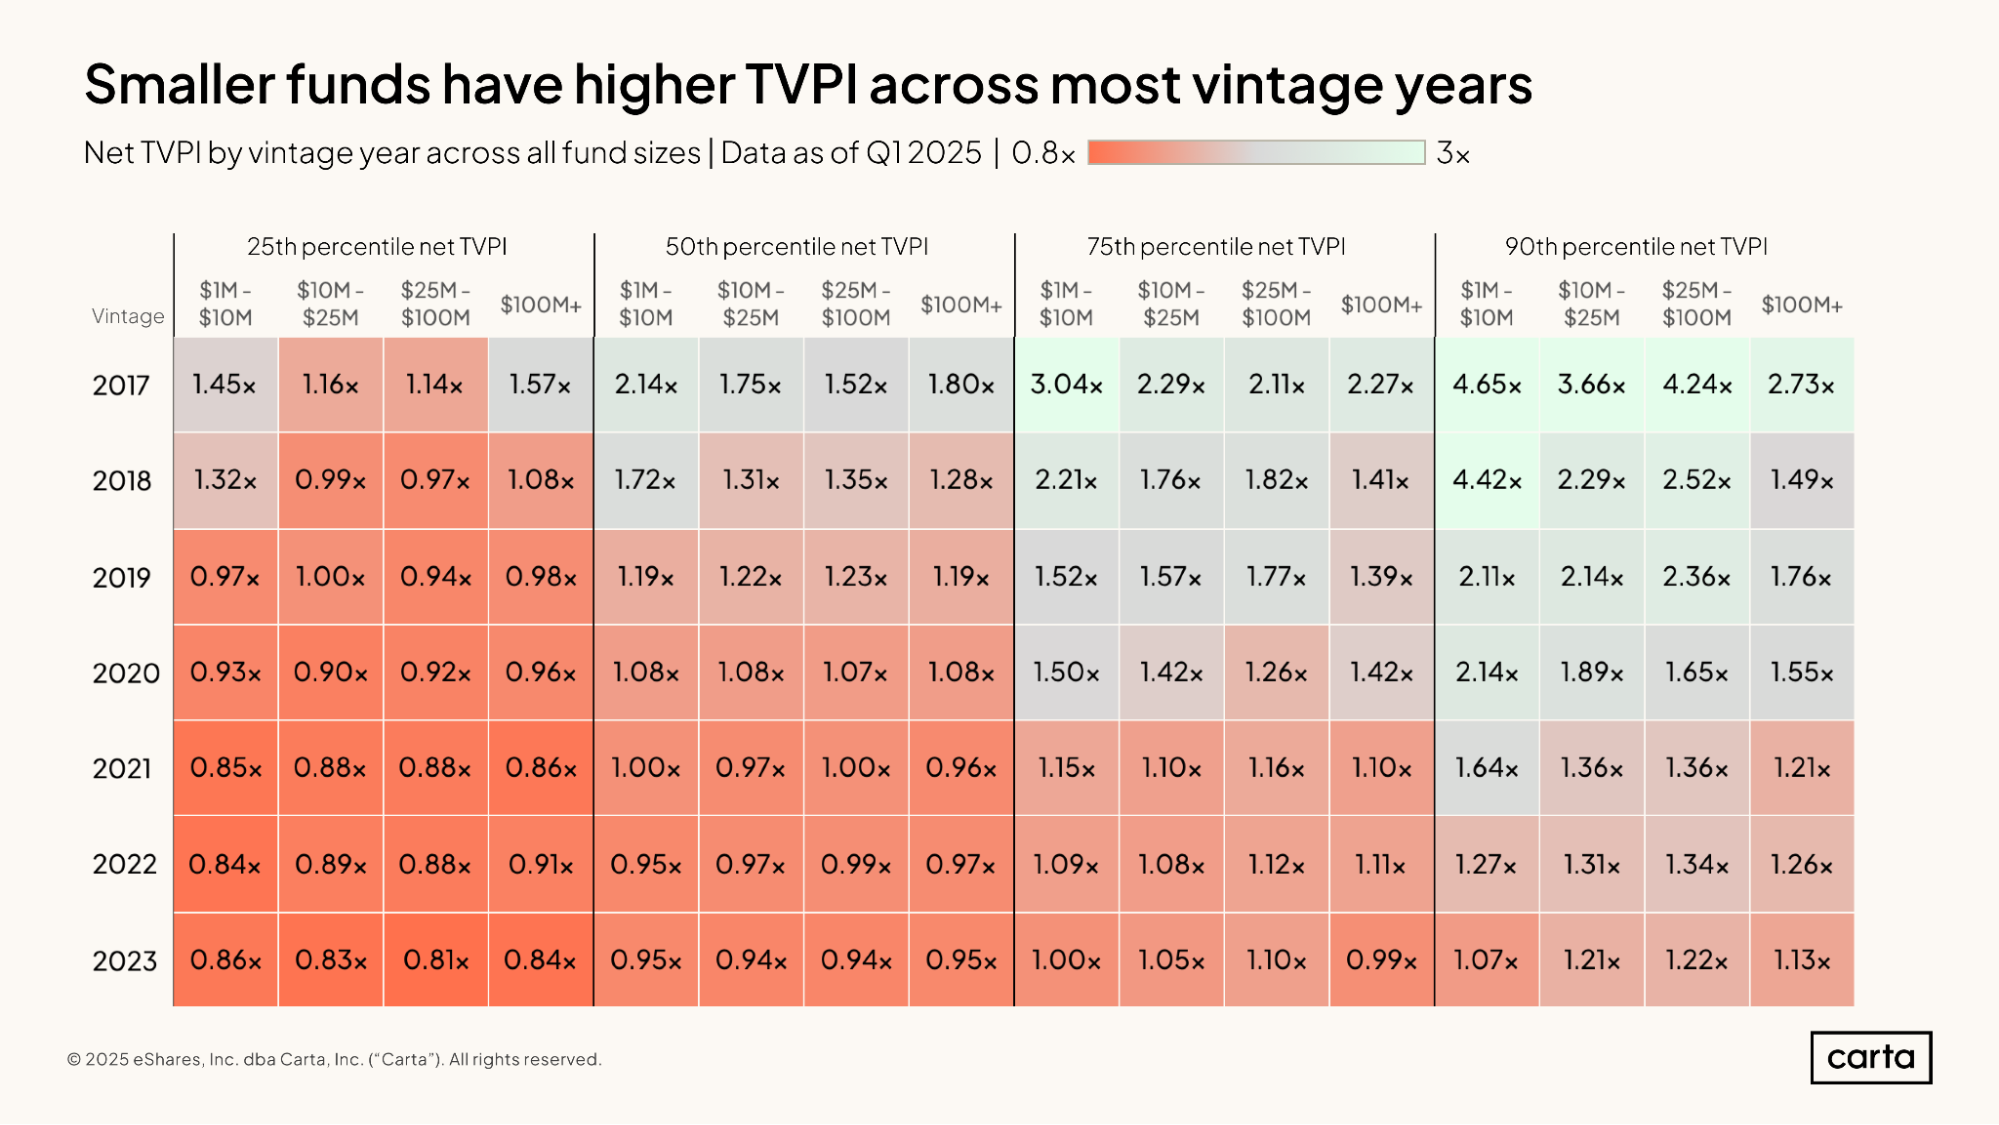
For the more recent fund vintages, there’s relatively little difference between the 25th percentile and the 90th percentile of TVPI performance. In the 2022 vintage, for instance, a bottom-quartile TVPI for a fund between $1 million and $10 million in size was 0.84x, while a top decile TVPI for a fund of the same size was 1.27x. Better, but not by a tremendous margin.
Compare those figures to five years earlier. For a fund in the 2017 vintage with between $1 million and $10 million in committed capital, a 25th percentile TVPI was 1.45x. A 90th percentile TVPI was more than three times higher, at 4.65x.
DPI
While both IRR and TVPI include some consideration of unrealized gains within a portfolio, DPI (Distributions to Paid-In) is a measurement solely of the distributions that a fund has made to its LPs. Once a fund’s DPI reaches 1x, it has returned to those LPs an amount equal to the initial capital that those LPs paid in.
DPIs for these fund vintages from the last eight years are almost all below 1x. This is for two main reasons. The first is that these vintages are all still relatively young and have had limited time to generate exits. DPI is typically expected to accelerate as time goes on. The second is that, over the past three years, exits have been relatively difficult to find. In the scant time that some of these fund vintages would have theoretically been able to start returning capital, the exit environment has been chilly.
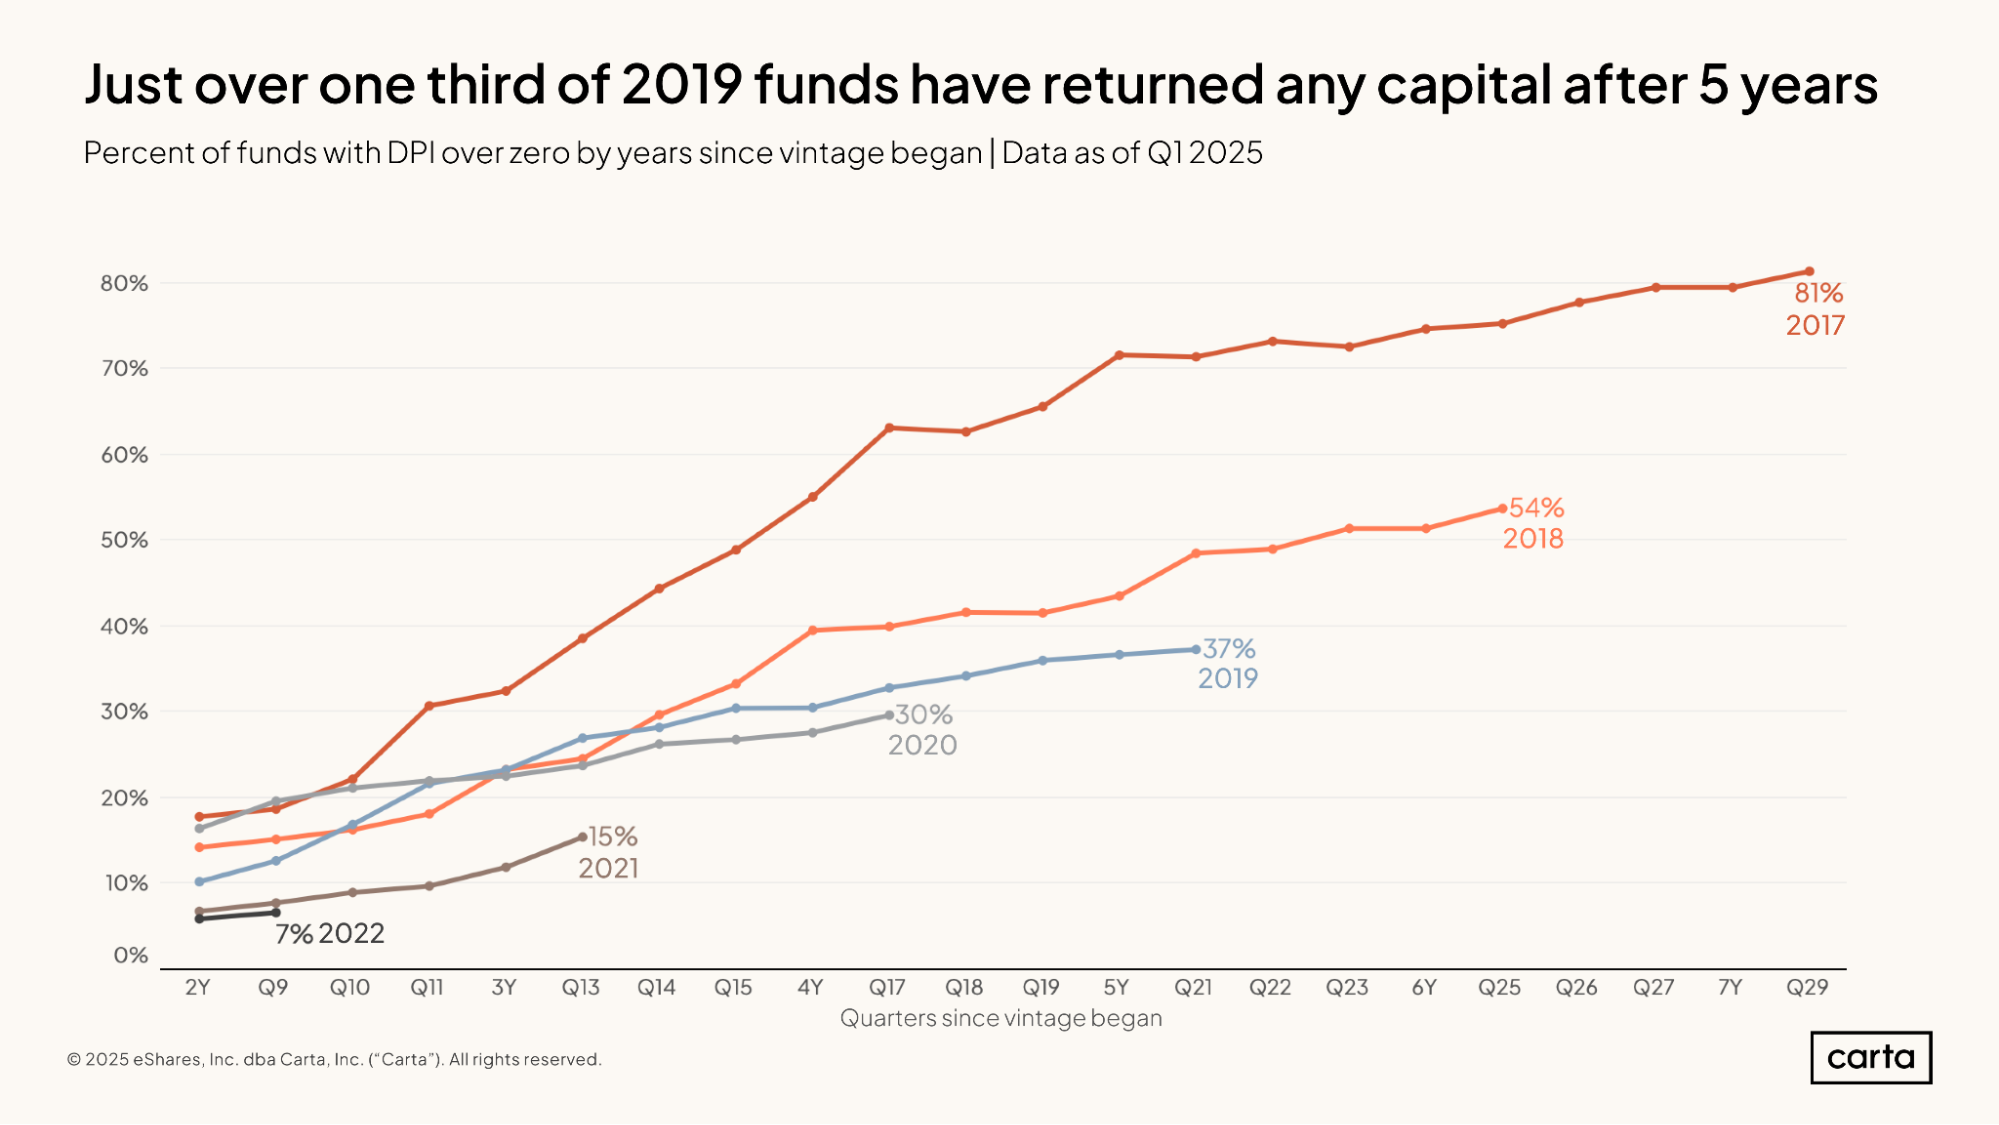
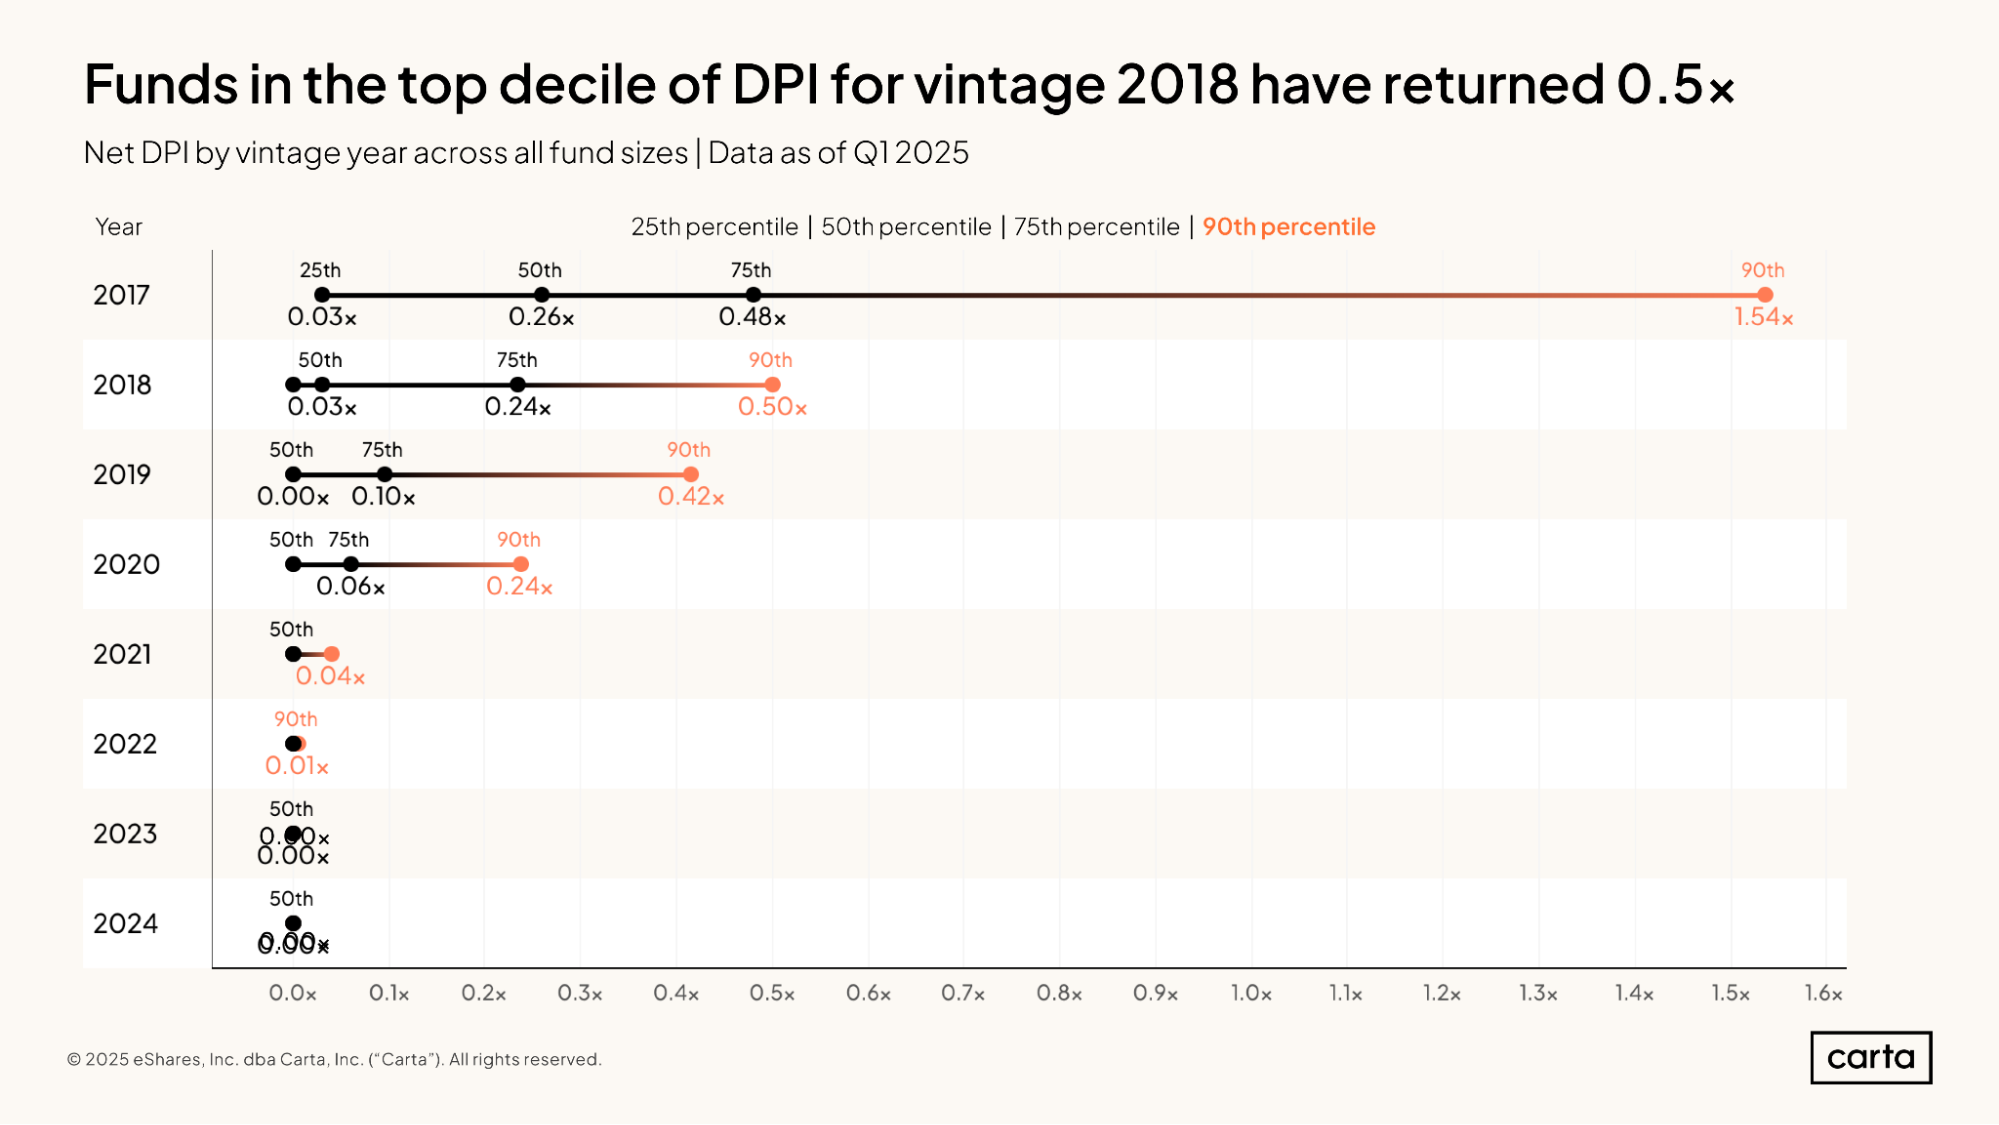
After eight years, more than 80% of funds from the 2017 vintage have a DPI greater than zero, meaning they have distributed at least some capital back to their LPs. For more recent vintages, however, distributions grow increasingly uncommon.
About 54% of funds from 2018 have any DPI to speak of. That figure dips to 37% for 2019 funds, 30% for 2020 funds, and just 15% for 2021 funds. Several funds from that 2021 cohort generated their first returns in Q1, however, as the rate of funds with positive DPIs jumped from 12% the previous quarter.
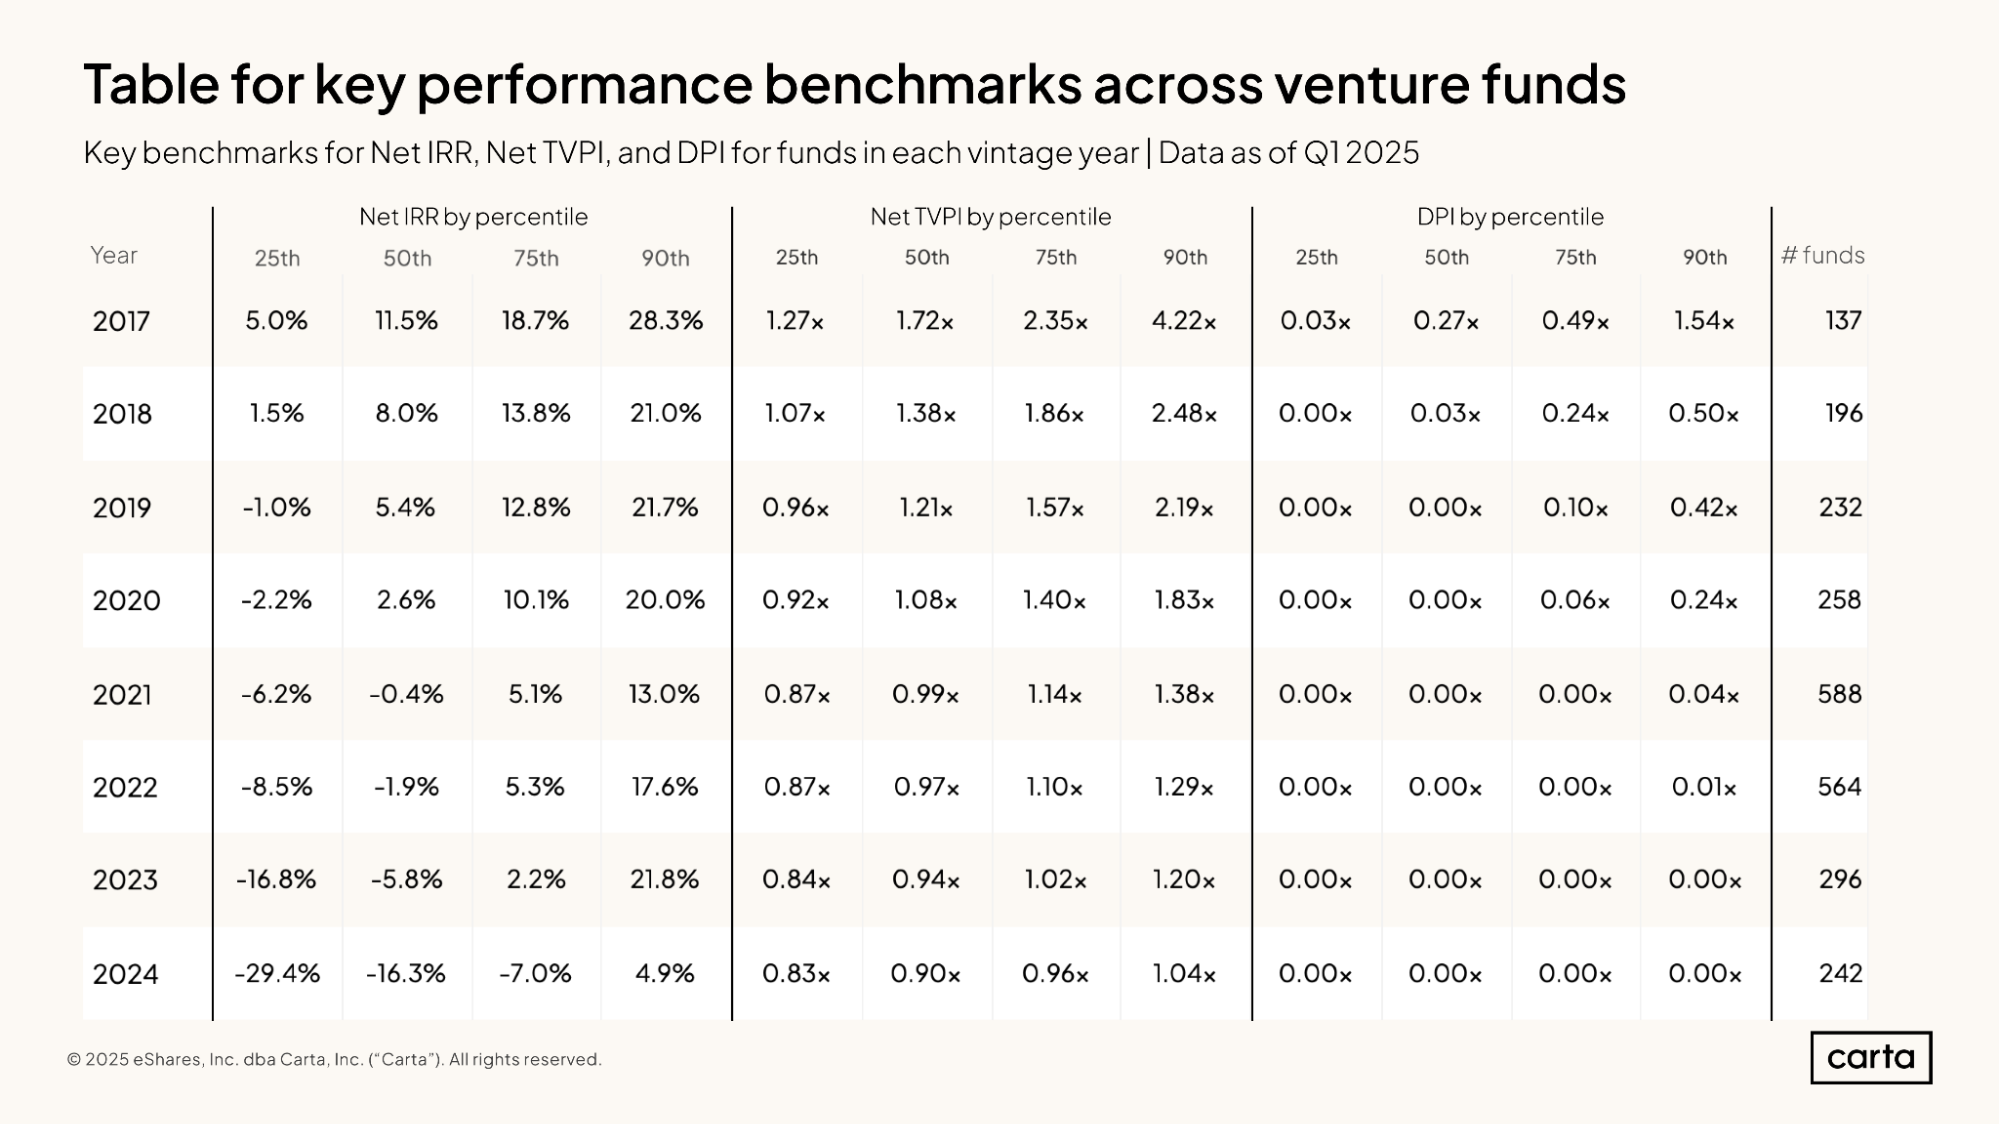
The above chart summarizes some of the key statistics around IRR, TVPI, and DPI across funds of all sizes within a given metric. For each metric, you can see what performance looks like at the 25th, 50th, 75th, and 90th percentiles for each vintage from 2017 through 2024.
The largest cohort in this sample is the 2021 vintage, with 588 funds, followed closely by the 2022 sample, at 564 funds. These two largest vintages overlap with the two busiest years in recent history on the venture market, when LPs were eagerly seeking new funds to back as a way to gain exposure to an attractive asset class that was growing in popularity.
Market context
The performance of the fund vintages covered in this report has depended heavily on recent conditions across the broader private markets. Carta’s database of cap tables from more than 45,000 startups across the ecosystem can reveal some trends that have had a particular impact on VC portfolios.
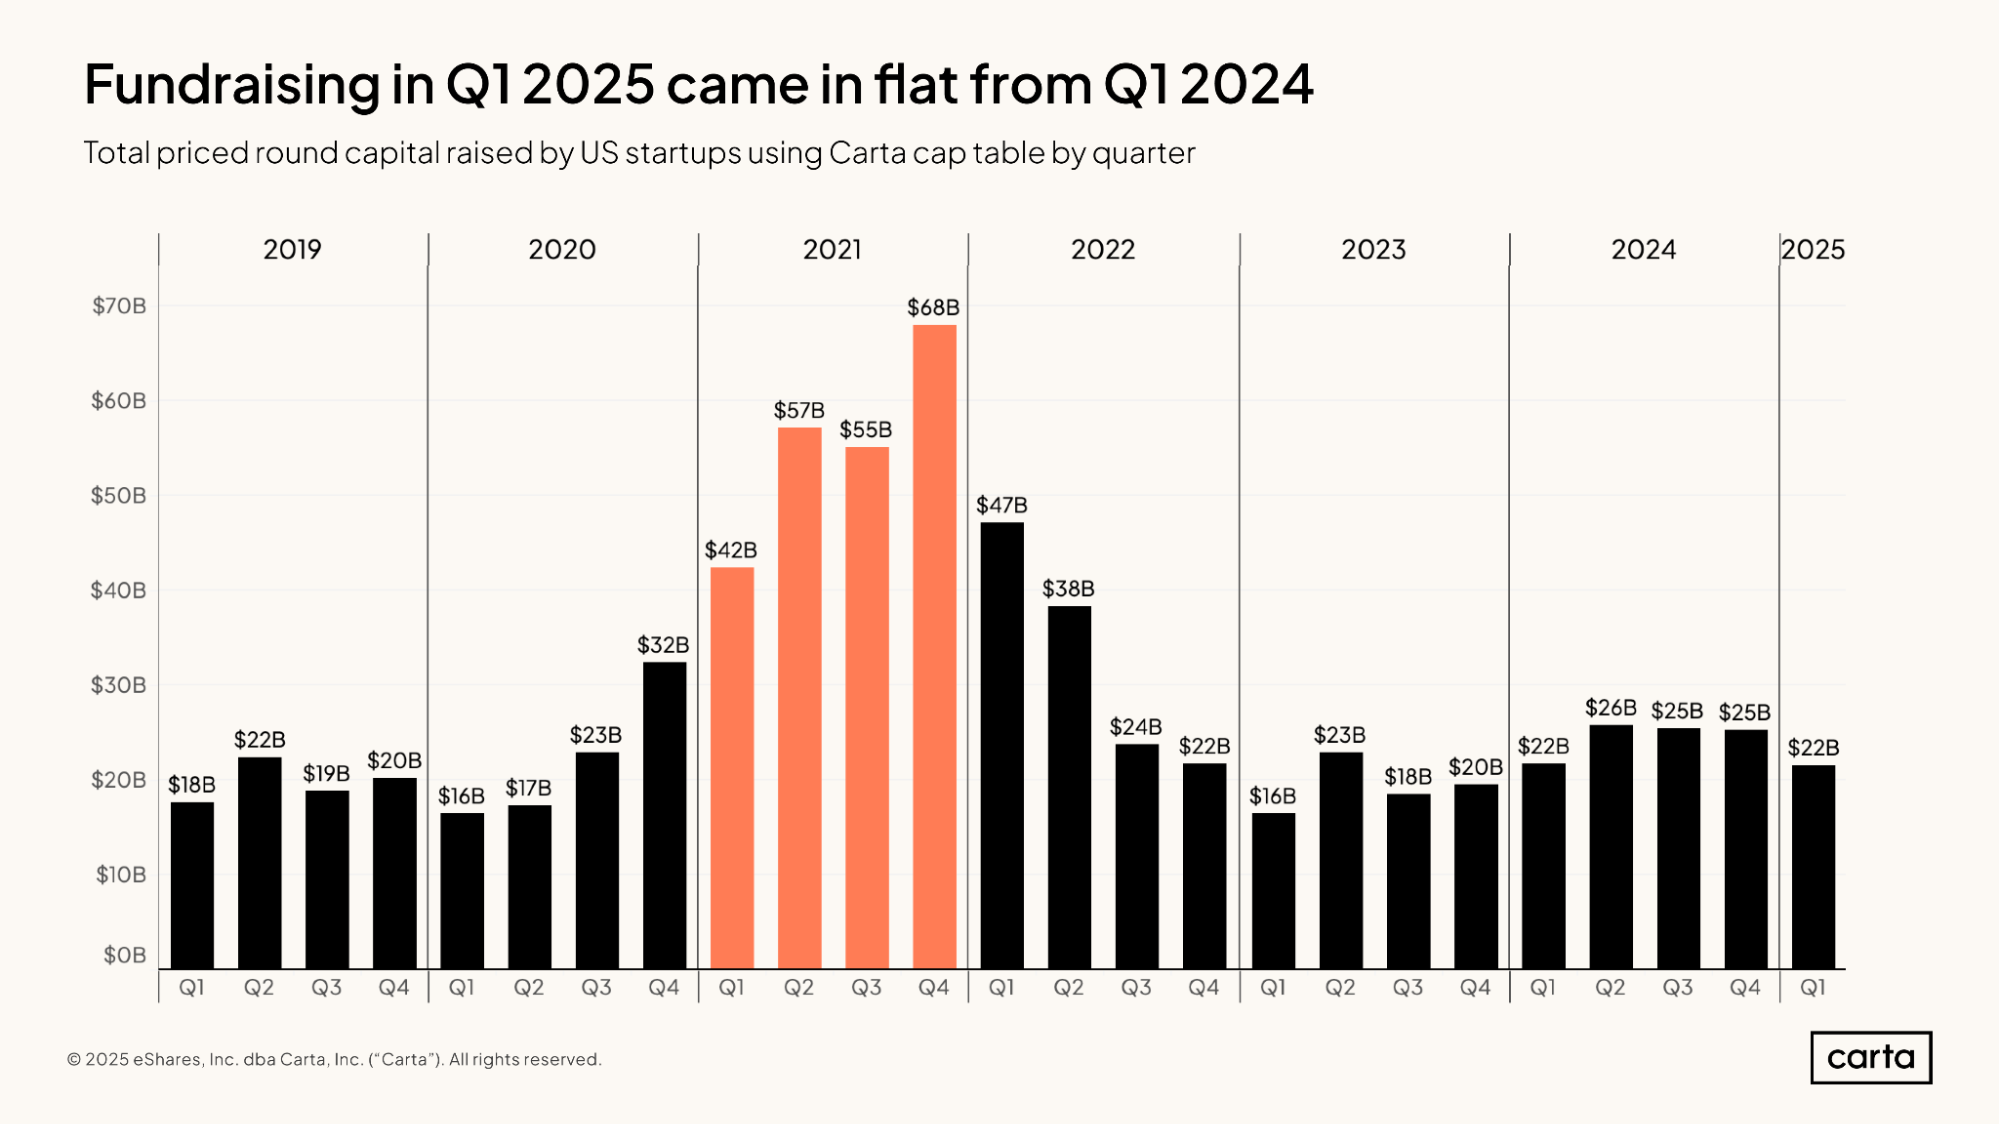
In the big picture, startups on Carta have now raised somewhere between $18 billion and $26 billion in funding in each of the past eight quarters. Last quarter’s total of $22 billion landed right in the middle. Ever since the huge spike in activity that occurred in 2021 and the ensuing slowdown in 2022, quarterly totals for capital raised across the U.S. venture ecosystem have settled into a steady rhythm.
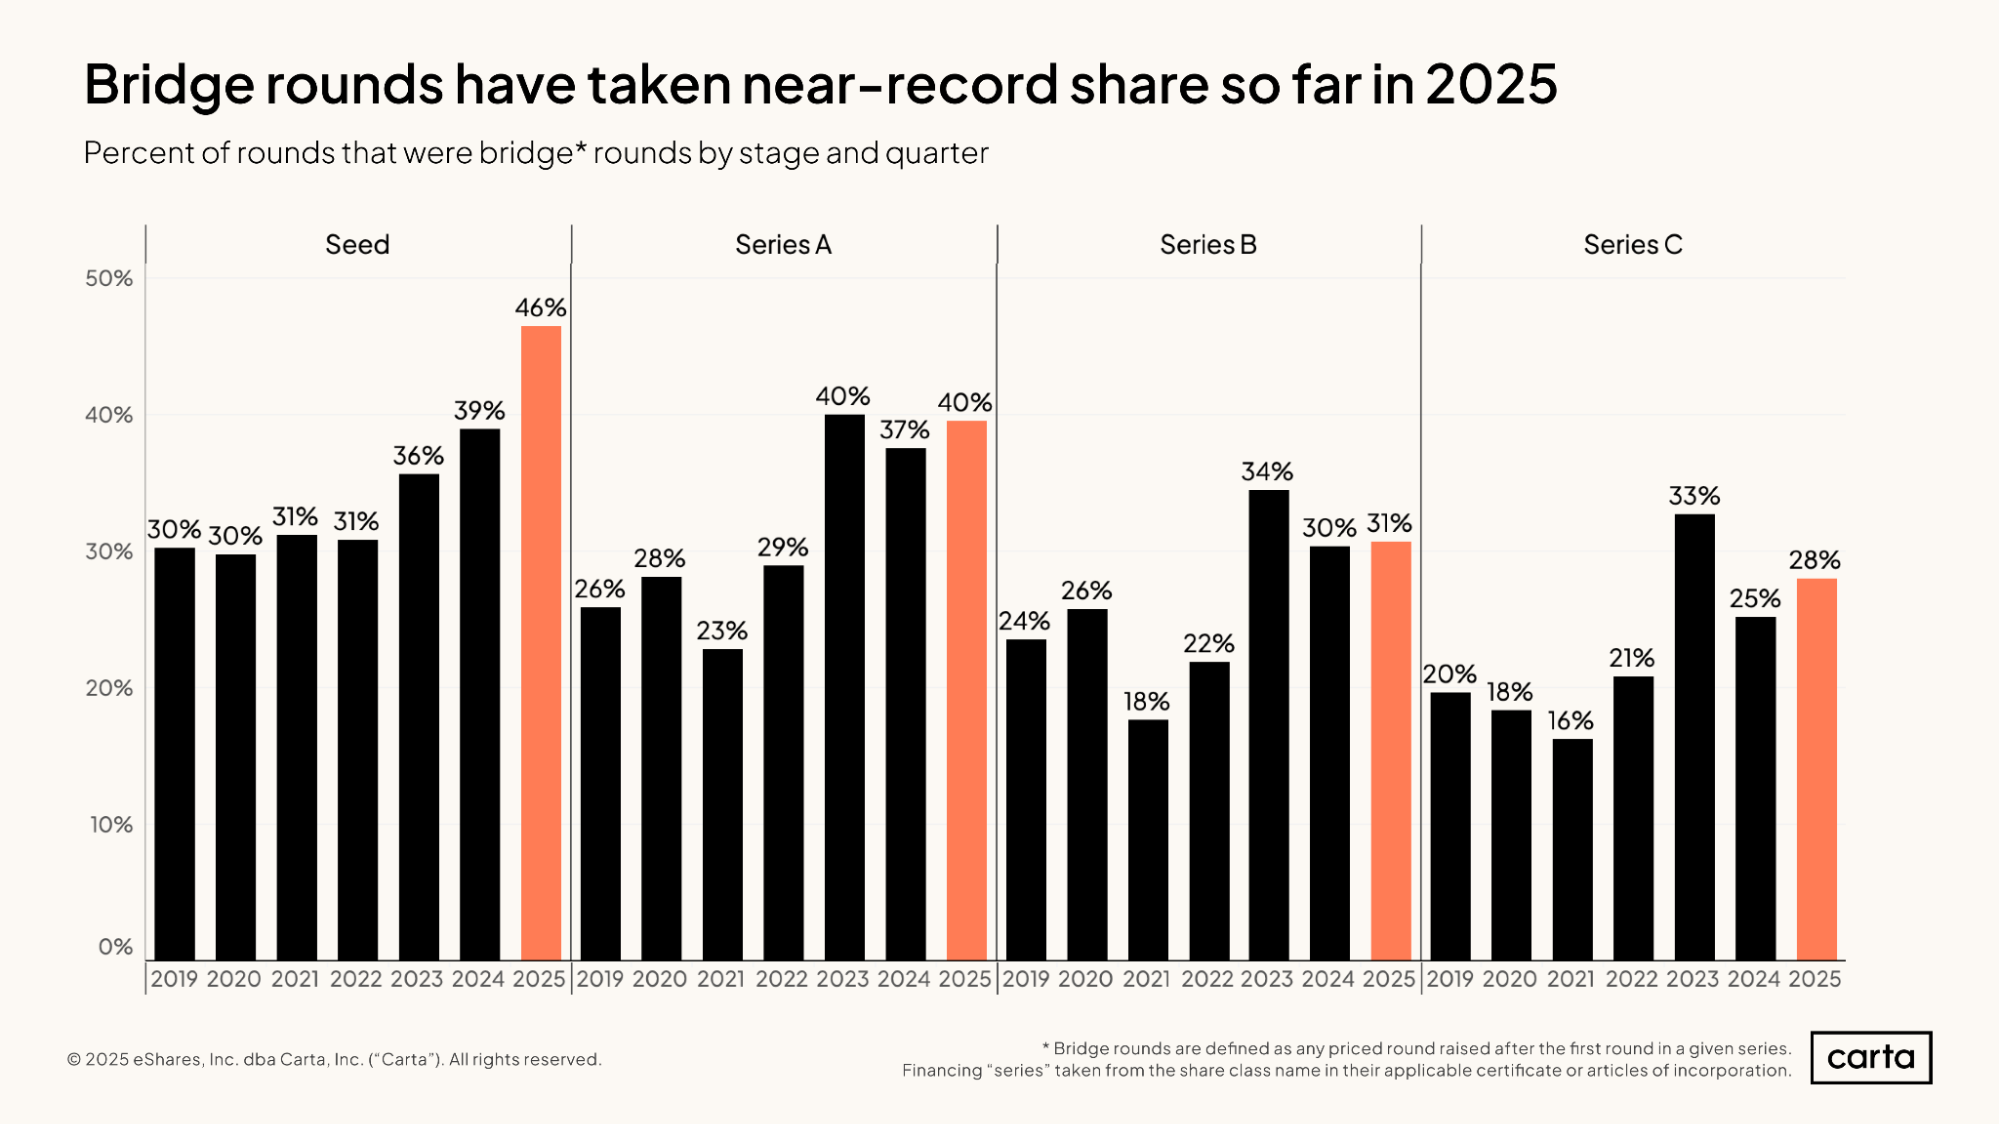
The rate of bridge rounds as a percentage of all startup funding events remains stubbornly high. At the seed stage, it’s as high as it’s ever been: About 46% of all rounds raised on Carta so far this year by seed-stage startups were bridge rounds.
In many cases, a company turns to a bridge round as an alternative to a new primary round, particularly if it may be struggling to meet the performance targets that investors have set. More frequent bridge rounds means a higher percentage of companies are veering from what was likely their preferred path, which can have a negative impact on investor portfolios.
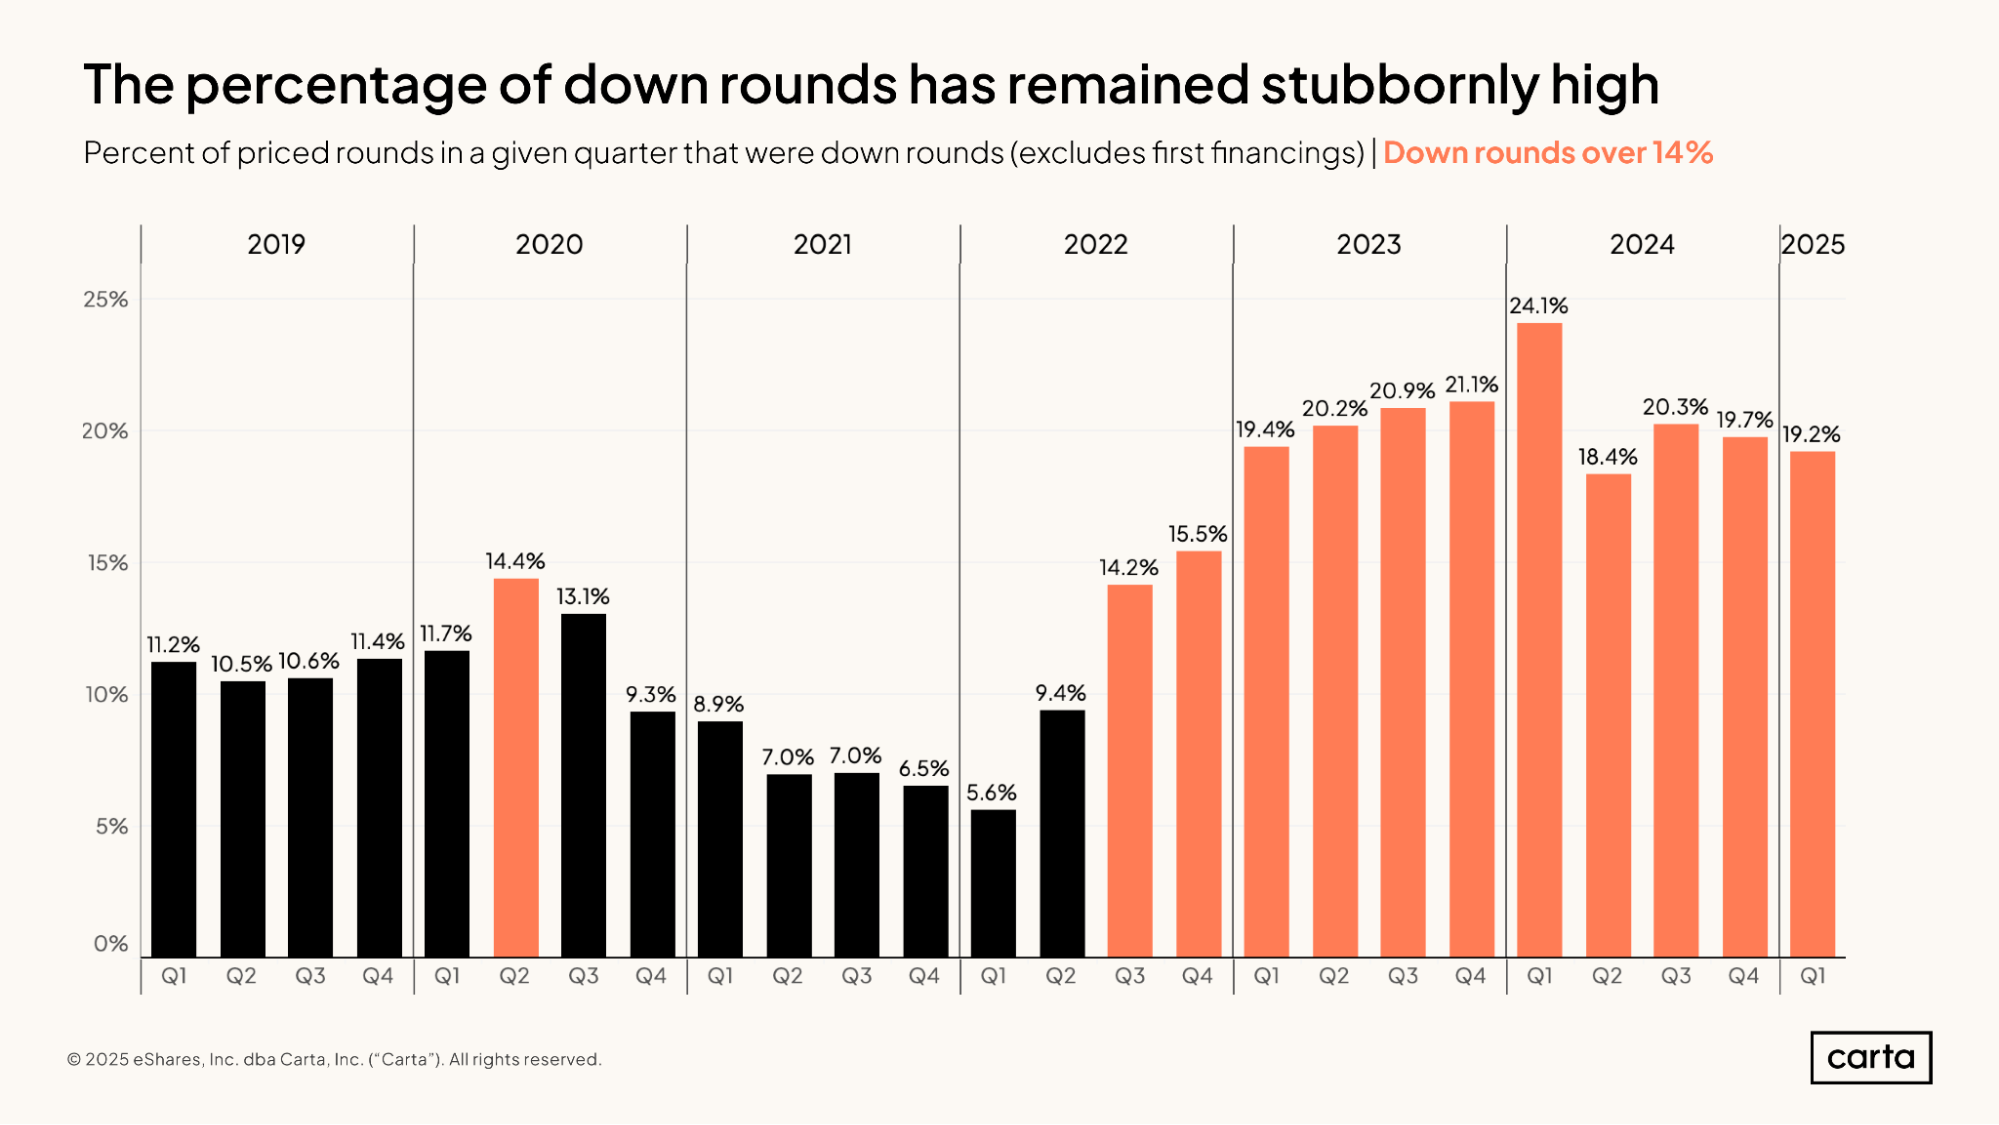
Down rounds have also grown more frequent in the past two years. In each of the past nine quarters, at least 18.4% of all new priced rounds raised by startups on Carta were down rounds.
A down round means that a company’s valuation in its new priced round is lower than the valuation in its previous round. This reduction in the valuation of an owned asset can have a material impact on the IRR and TVPI of a fund.
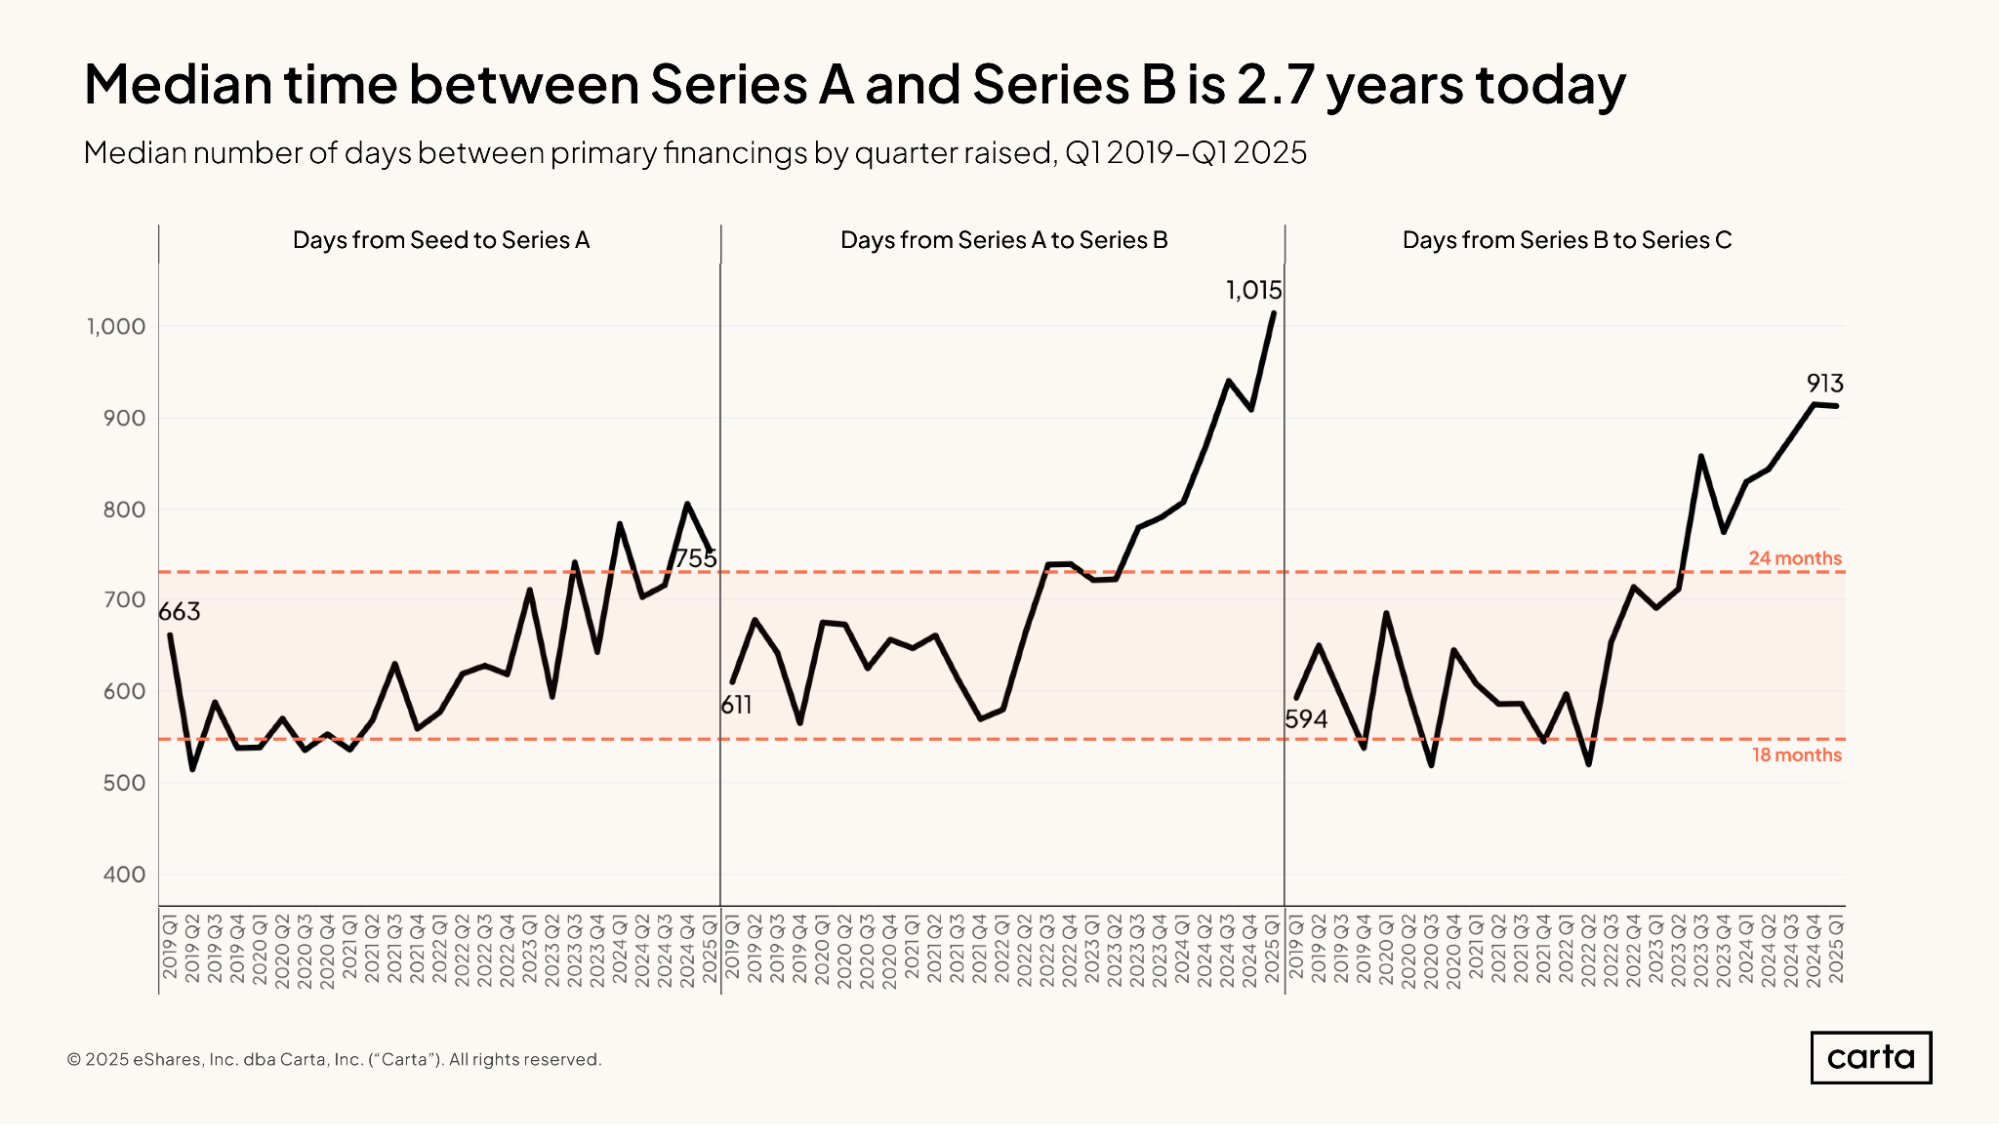
When companies raise new primary rounds at the early and middle stages of startup life, those rounds are getting farther apart. For instance, the median company that raised a Series C in Q1 2025 had waited 913 days since their Series B, the equivalent of about two and a half years. That figure has climbed considerably since the middle of 2022, when it was less than 18 months.
These concurrent trends of more bridge rounds, more down rounds, and more time in between priced rounds point to congestion within the venture capital ecosystem, with companies finding it harder to move from one traditional stage of startup life to the next while still attaining the sort of valuation growth that they and their investors expected. From a fund performance perspective, congestion can contribute to fewer distributions and lower returns.
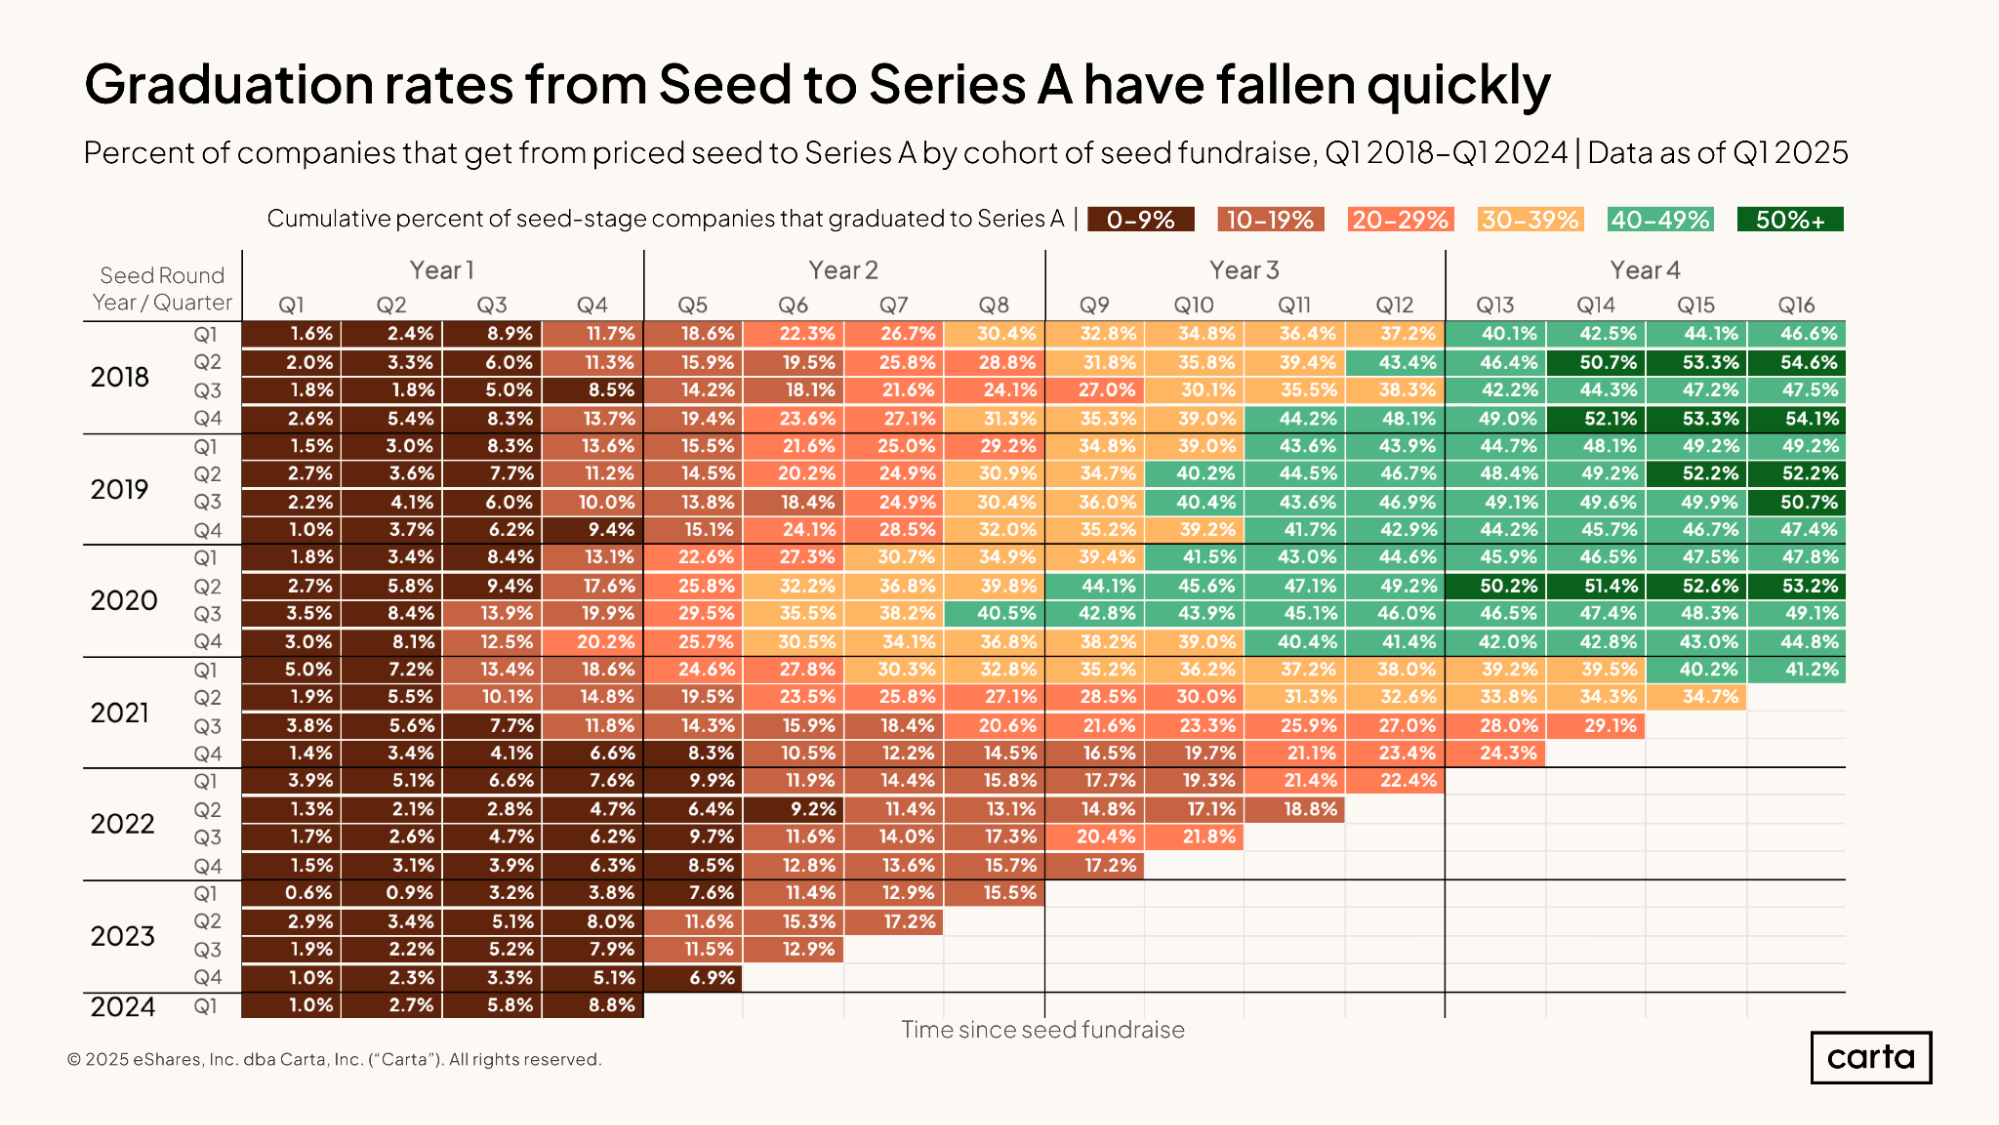
This chart shows the graduation rates for companies moving from the seed stage to Series A at various milestones in time, grouped together by the quarter in which they raised their seed round. For example, the cell at the very top right shows that 46.6% of startups that raised a seed round in Q1 2018 had raised a seed round within the next four years.
For the most part, companies that raised their seed rounds more recently are finding it far more difficult to graduate to Series A. Of the companies that raised a seed round in Q1 2023, just 15.5% raised a Series A in the next two years. Compare that to the group of companies that raised a seed round back in Q3 2020: Among this cohort, the graduation rate to Series A after two years was 40.5%.
Methodology
Carta helps over 2,500 venture firms administer more than $150 billion in capital. We're setting a new standard in fund administration by sharing insights from our unmatched dataset about the private markets and venture ecosystem to help investors and limited partners make informed decisions and understand market conditions.
Overview
This study uses an aggregated and anonymized sample of Carta fund customer data. Funds that have contractually requested that we not use their data in anonymized and aggregated studies are not included in this analysis.
We use data through the end of Q1 2025. Historical data may change in future studies because there is typically an administrative lag between the time an event took place and when it is recorded in Carta. In addition, new funds signing up for Carta’s services will increase historical data available for the report.
Fund details
This report only includes funds domiciled in the United States. All funds must have reliable performance data dating back to fund inception and/or when they joined the Carta platform. Included funds are direct investors into startups and do not pursue fund of funds or other strategies. Only funds in vintage years between 2017 and 2024 were included. Funds must have at least $1M in AUM to be included.
We define vintage year as the year in which the first cost basis (either conversion or new investment) for a fund occurred.
Performance over time
In charts that use the framing of "quarters since vintage began," we limited the analysis to the most recent quarter in which all funds in a given vintage year had valid performance data. As such, these figures may not match exactly to the performance data displayed in charts without a similar time series framing.
Financings
Financings include equity deals raised in USD by U.S.-based corporations. The financing “series” (e.g. Series A) is taken from the share class name in their applicable certificate or articles of incorporation. Financing rounds that don’t follow this standard are not included in any data shown by series but are included in data not shown by series. Primary rounds are defined as the first equity round within a series. Bridge rounds are defined as any round raised after the first round in a given series.


DISCLOSURE: This communication is on behalf of eShares, Inc. dba Carta, Inc. ("Carta"). This communication is for informational purposes only, and contains general information only. Carta is not, by means of this communication, rendering accounting, business, financial, investment, legal, tax, or other professional advice or services. This publication is not a substitute for such professional advice or services nor should it be used as a basis for any decision or action that may affect your business or interests. Before making any decision or taking any action that may affect your business or interests, you should consult a qualified professional advisor. This communication is not intended as a recommendation, offer or solicitation for the purchase or sale of any security. Carta does not assume any liability for reliance on the information provided herein. © 2026 Carta. All rights reserved. Reproduction prohibited.