Among venture fund managers and their LPs, a TVPI of 3x is often seen as a threshold for exemplary performance. For funds raised in the late 2010s, however, it remains a challenging benchmark to achieve.
For the uninitiated, TVPI (total value to paid-in capital) is a multiple that expresses the relationship between the total present value of a fund—including both realized and unrealized gains—and the amount of capital that LPs initially paid in. In simple terms, a fund with a TVPI of 3x is on pace to provide its backers with at least a 3x return.
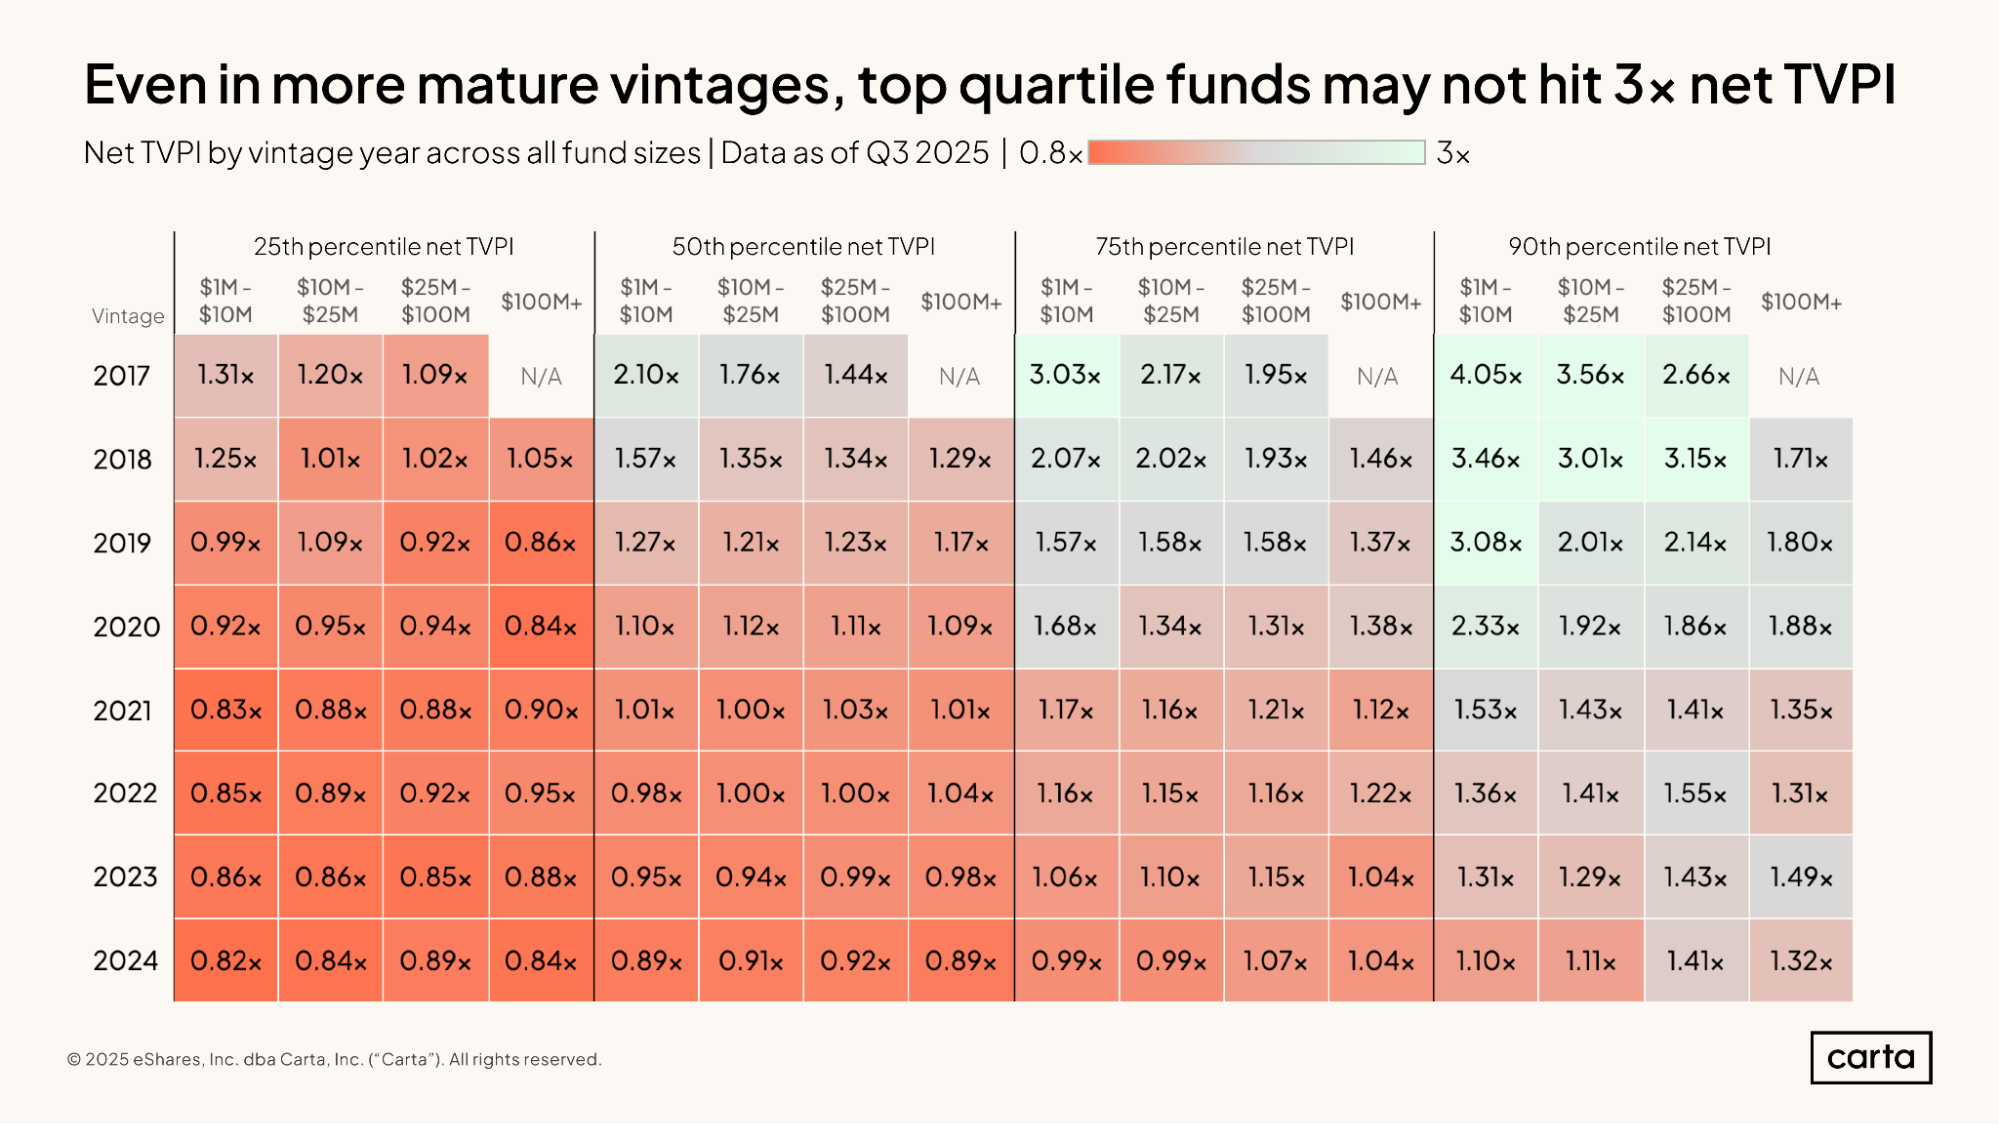
In the 2017 vintage of venture funds on Carta, the current 90th percentile for net TVPI sits at 3.52x, well above this 3x threshold. In the 2018 vintage, the 90th percentile figure is 3.07x. The top-tier funds from these years are on track to provide their LPs with the sort of return they likely expected—one that will outpace the gains they might have achieved by investing in the public markets over the same period of time.
Yet most recent funds currently sit well below this mark. In the 2017 vintage, the median net TVPI through the end of Q3 is 1.76x, and the 75th percentile is 2.27x. The median fund from 2018 has a net TVPI of 1.38x, while the 75th percentile is 1.97x. Among fund vintages from 2019 through the present, a TVPI of 3x—or even 2x—is even harder to find. To a large extent, these sorts of figures are to be expected. Nearly every venture fund raised since 2017 is still being actively managed, with plenty of time in the future for gains to accumulate. This is particularly true as venture-backed companies continue to stay private for longer, extending the expected lifespan of many VC vehicles.
Performance multiples for these recent VC fund vintages will almost surely continue to improve in the years to come. Many of the funds raised since 2017 will eventually reach a TVPI of 3x. But many of them will not. As these funds continue to mature in the years to come, managers and LPs alike will be watching their TVPIs closely.
Highlights
More recent funds are starting to realize gains: About 14% of all VC funds in the 2020 vintage made their first distributions to LPs in the past year. Overall, 42% of 2020 funds now have a DPI over zero, compared to 28% a year ago. In the 2021 vintage, some 25% of funds have begun to distribute returns, up from 14% as of Q3 2024.
Median IRRs are now positive for 2021, 2022 funds: The median IRR rose to 0.5% in Q3 for funds in the 2021 vintage and to 0.1% for the 2022 vintage. At the upper end of performance, though, the 2021 vintage continues to lag: It has a top-decile IRR of 14.8%, compared to 19% for 2022.
Pre-2021 funds are almost fully deployed: Funds in every vintage from 2017 through 2020 have now invested at least 89% of their available capital, with 11% or less remaining as dry powder. The 2021 vintage isn’t far behind, with 83% of available capital now deployed.
Fund details
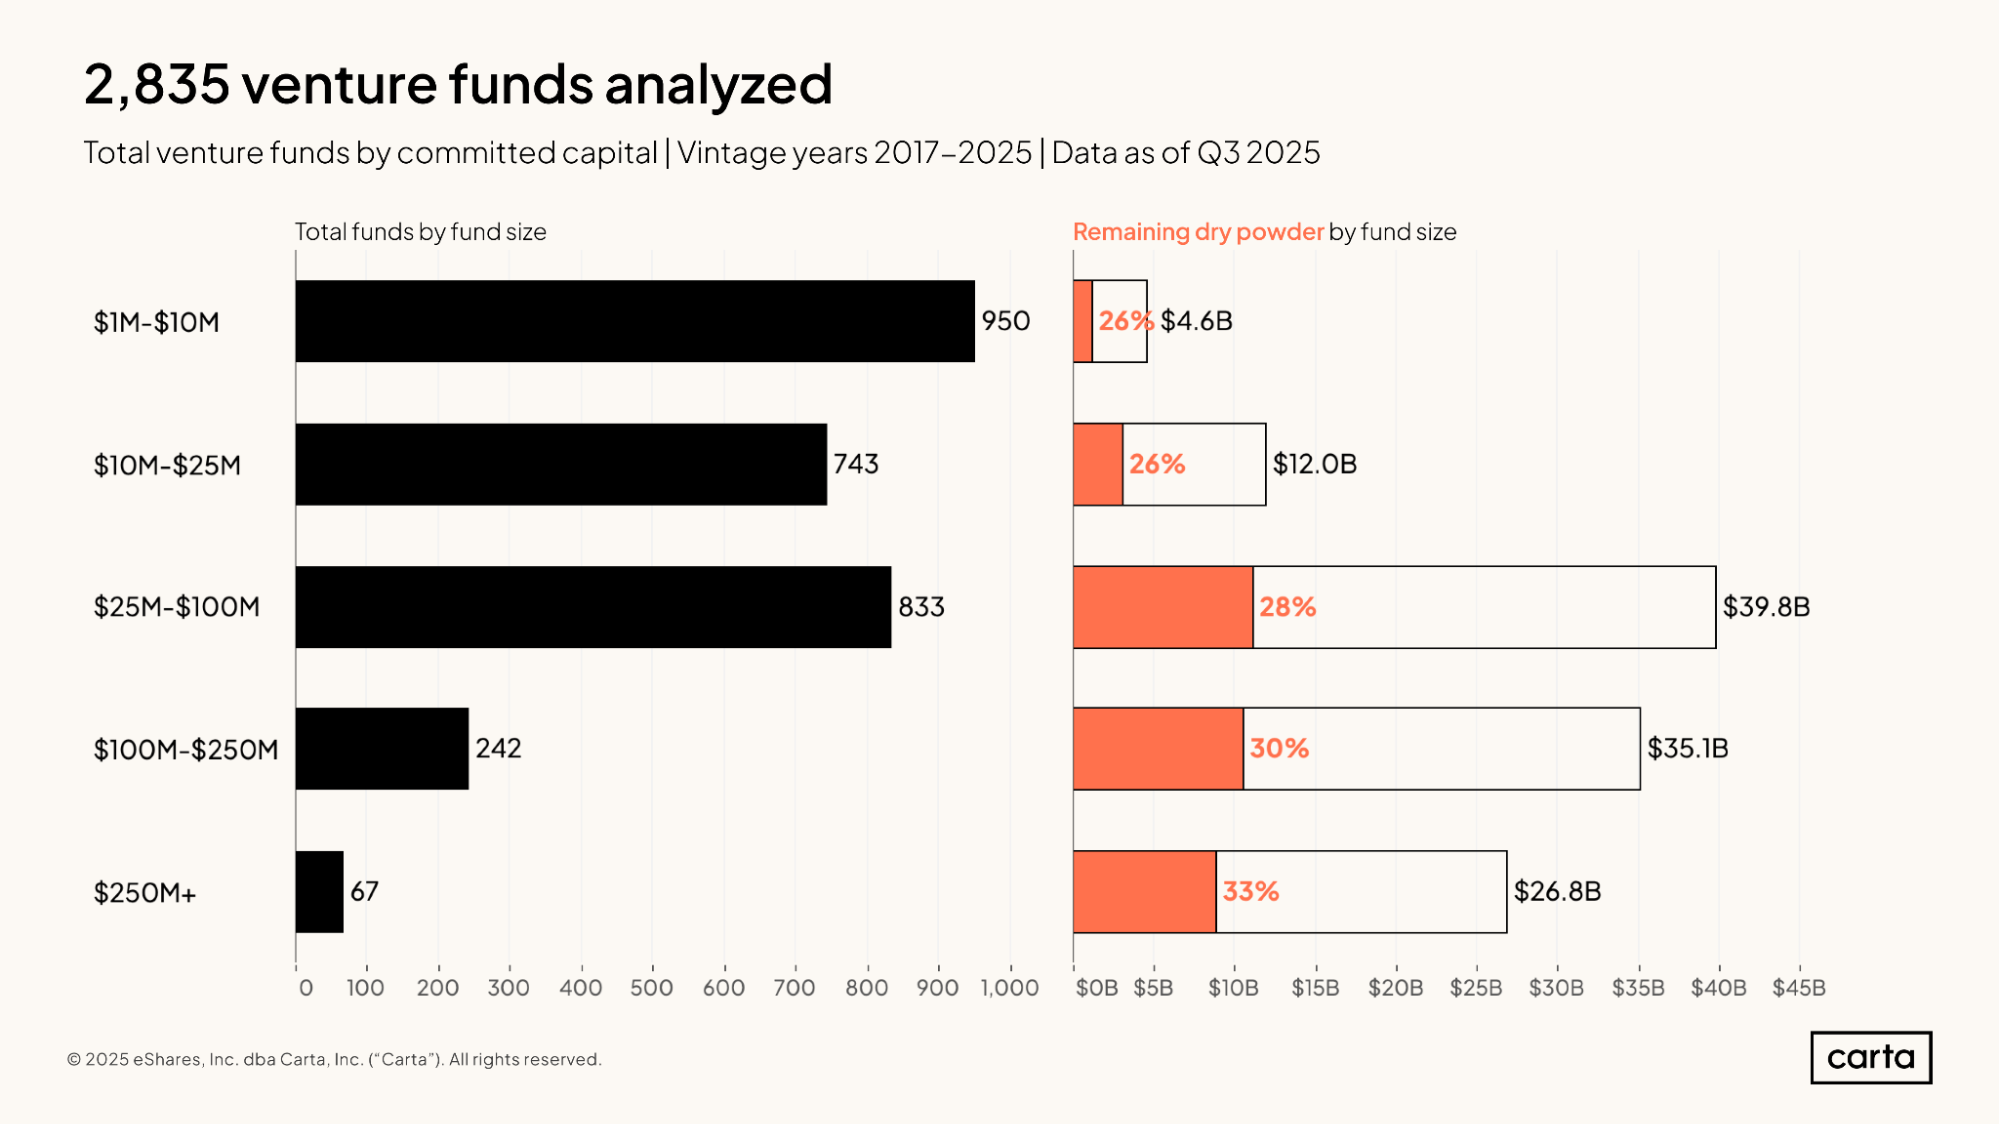
This report examines data from 2,835 different venture funds from the 2017 through 2025 vintages, the majority of which are smaller than $100 million in size. However, this sample also includes more than 300 funds that are larger than $100 million, and these are where the majority of all capital is concentrated. Combined, these $100 million-plus funds claim about $61.9 billion in capital commitments, out of a total of $118.3 billion in commitments across the full sample of all fund sizes.
Across all five intervals of fund size shown, somewhere between 26% and 33% of all initial capital commitments remains undeployed. Larger funds tend to have a slightly higher percentage of dry powder than smaller funds.
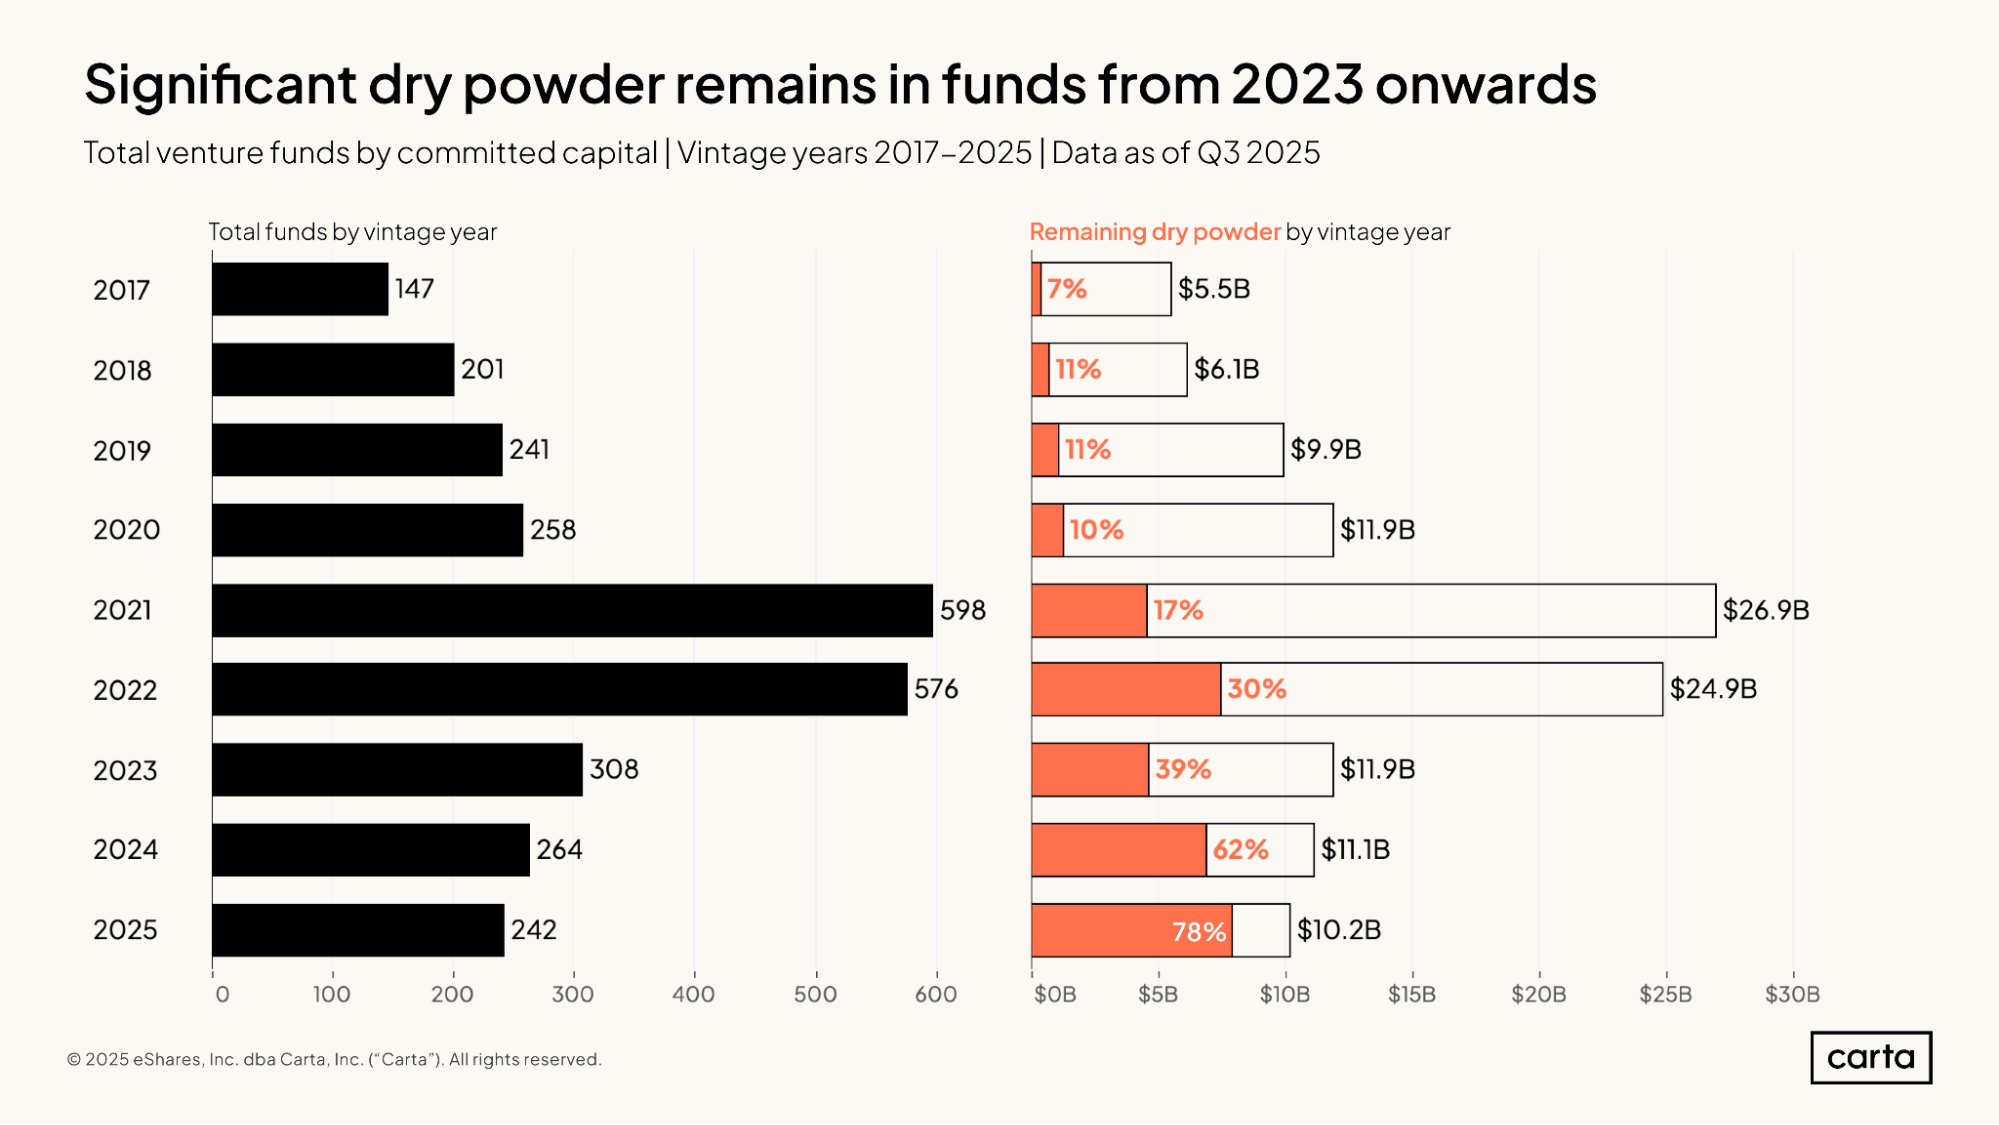
As expected, newer fund vintages have more remaining dry powder than older vintages. On one end of the spectrum, funds from the 2017 vintage have just 7% of their total committed capital still unspent, compared to a 78% portion of dry powder for funds from the 2025 vintage.
The gaps from one vintage to the next in the percentage of dry powder remaining tend to be significantly larger for newer vintages, evidence that the majority of a VC fund’s spending tends to take place in its first few years of management. For example, the share of remaining dry powder drops from 78% for the 2025 vintage down to 39% for the 2023 vintage, a difference of 39 percentage points across a two-year span. The dropoff in remaining dry powder between the 2021 and the 2019 vintages, say, is much smaller.
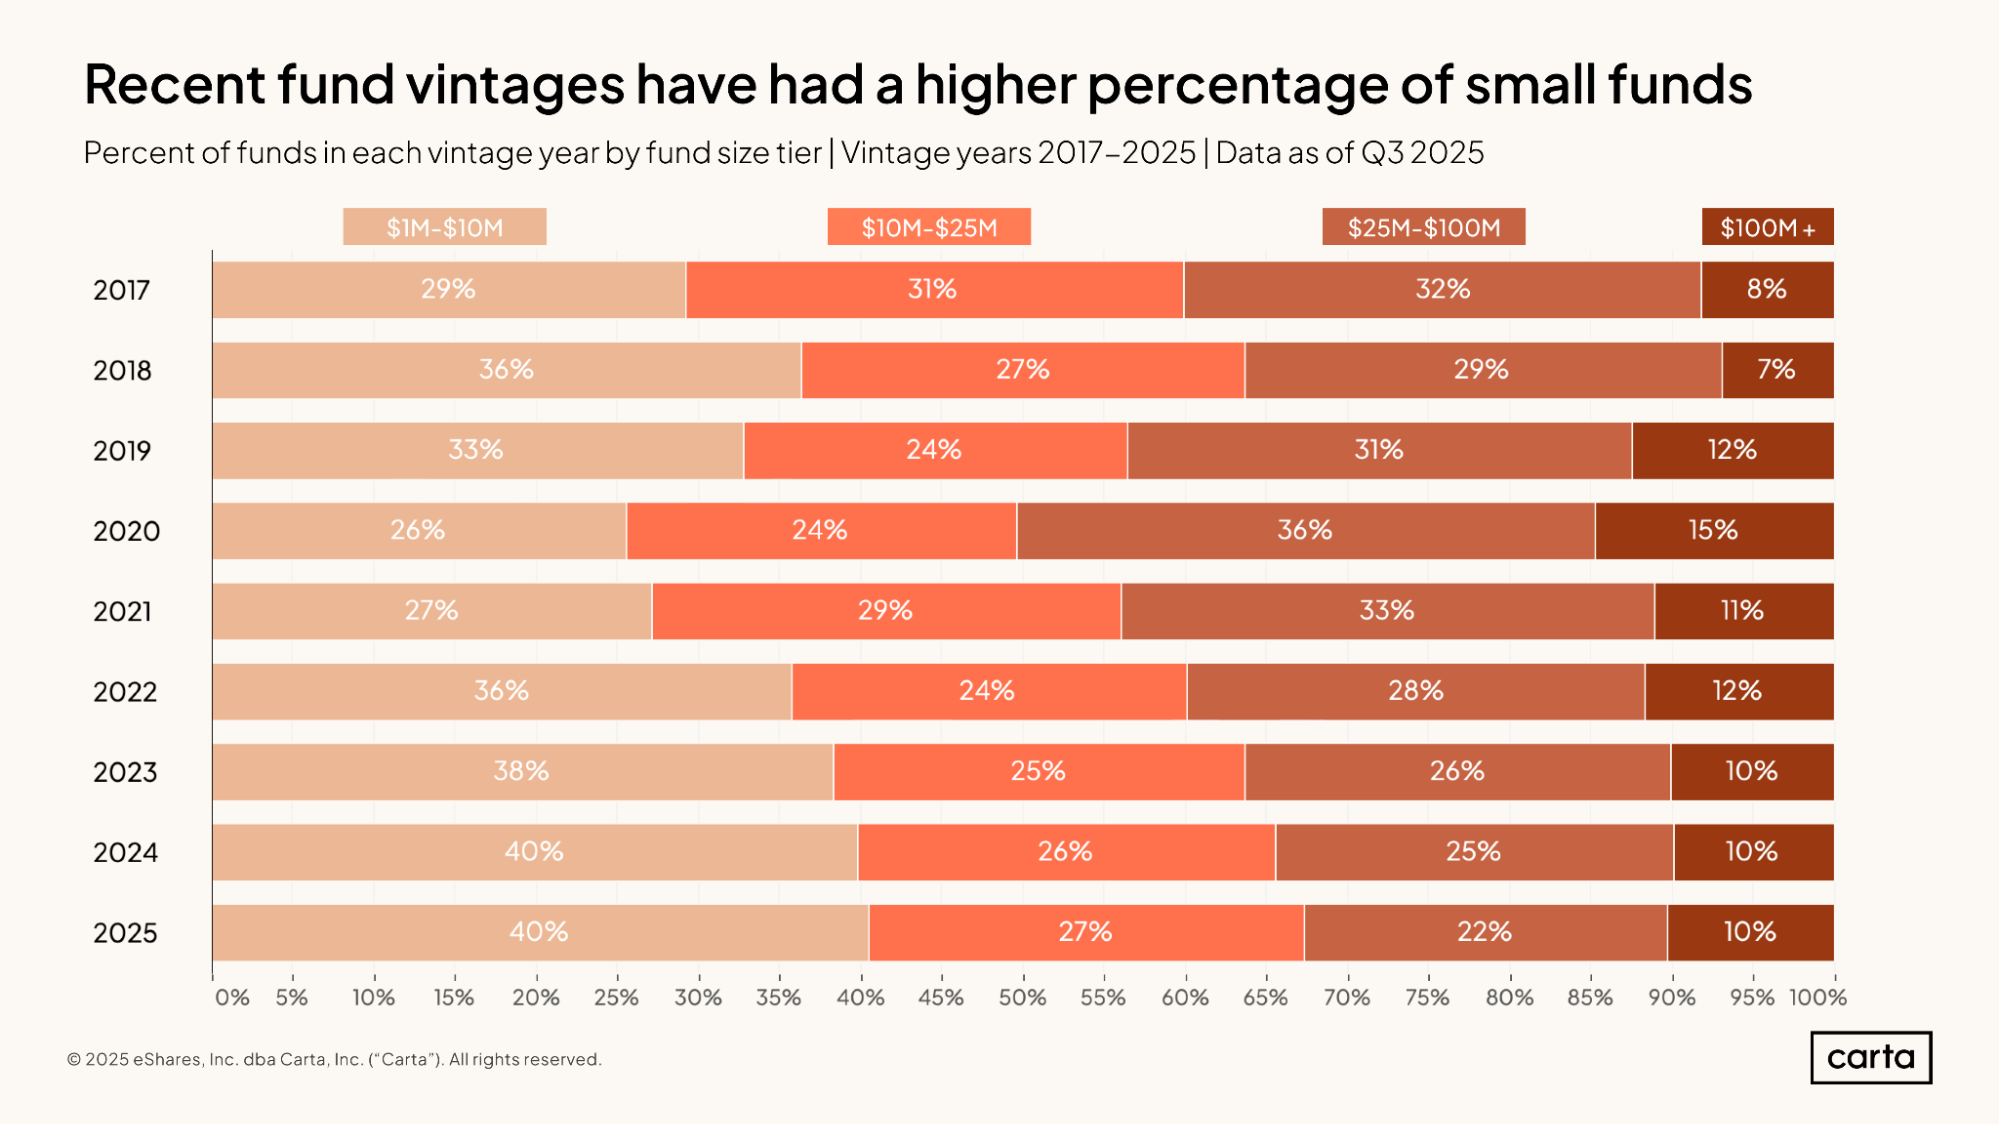
Over the course of the 2020s, smaller venture funds have grown increasingly common. Some 40% of funds from the 2025 vintage are between $1 million and $10 million in size, and 67% have $25 million or less in capital commitments. Back in the 2020 vintage, about 26% of funds are between $1 million and $10 million, and 50% are smaller than $25 million.
The reverse side of this coin is that larger funds have become less common. But this trendline has flattened out in recent years. The portion of new VC funds with $100 million or more in commitments has held steady at 10% across each of the three most recent vintages.
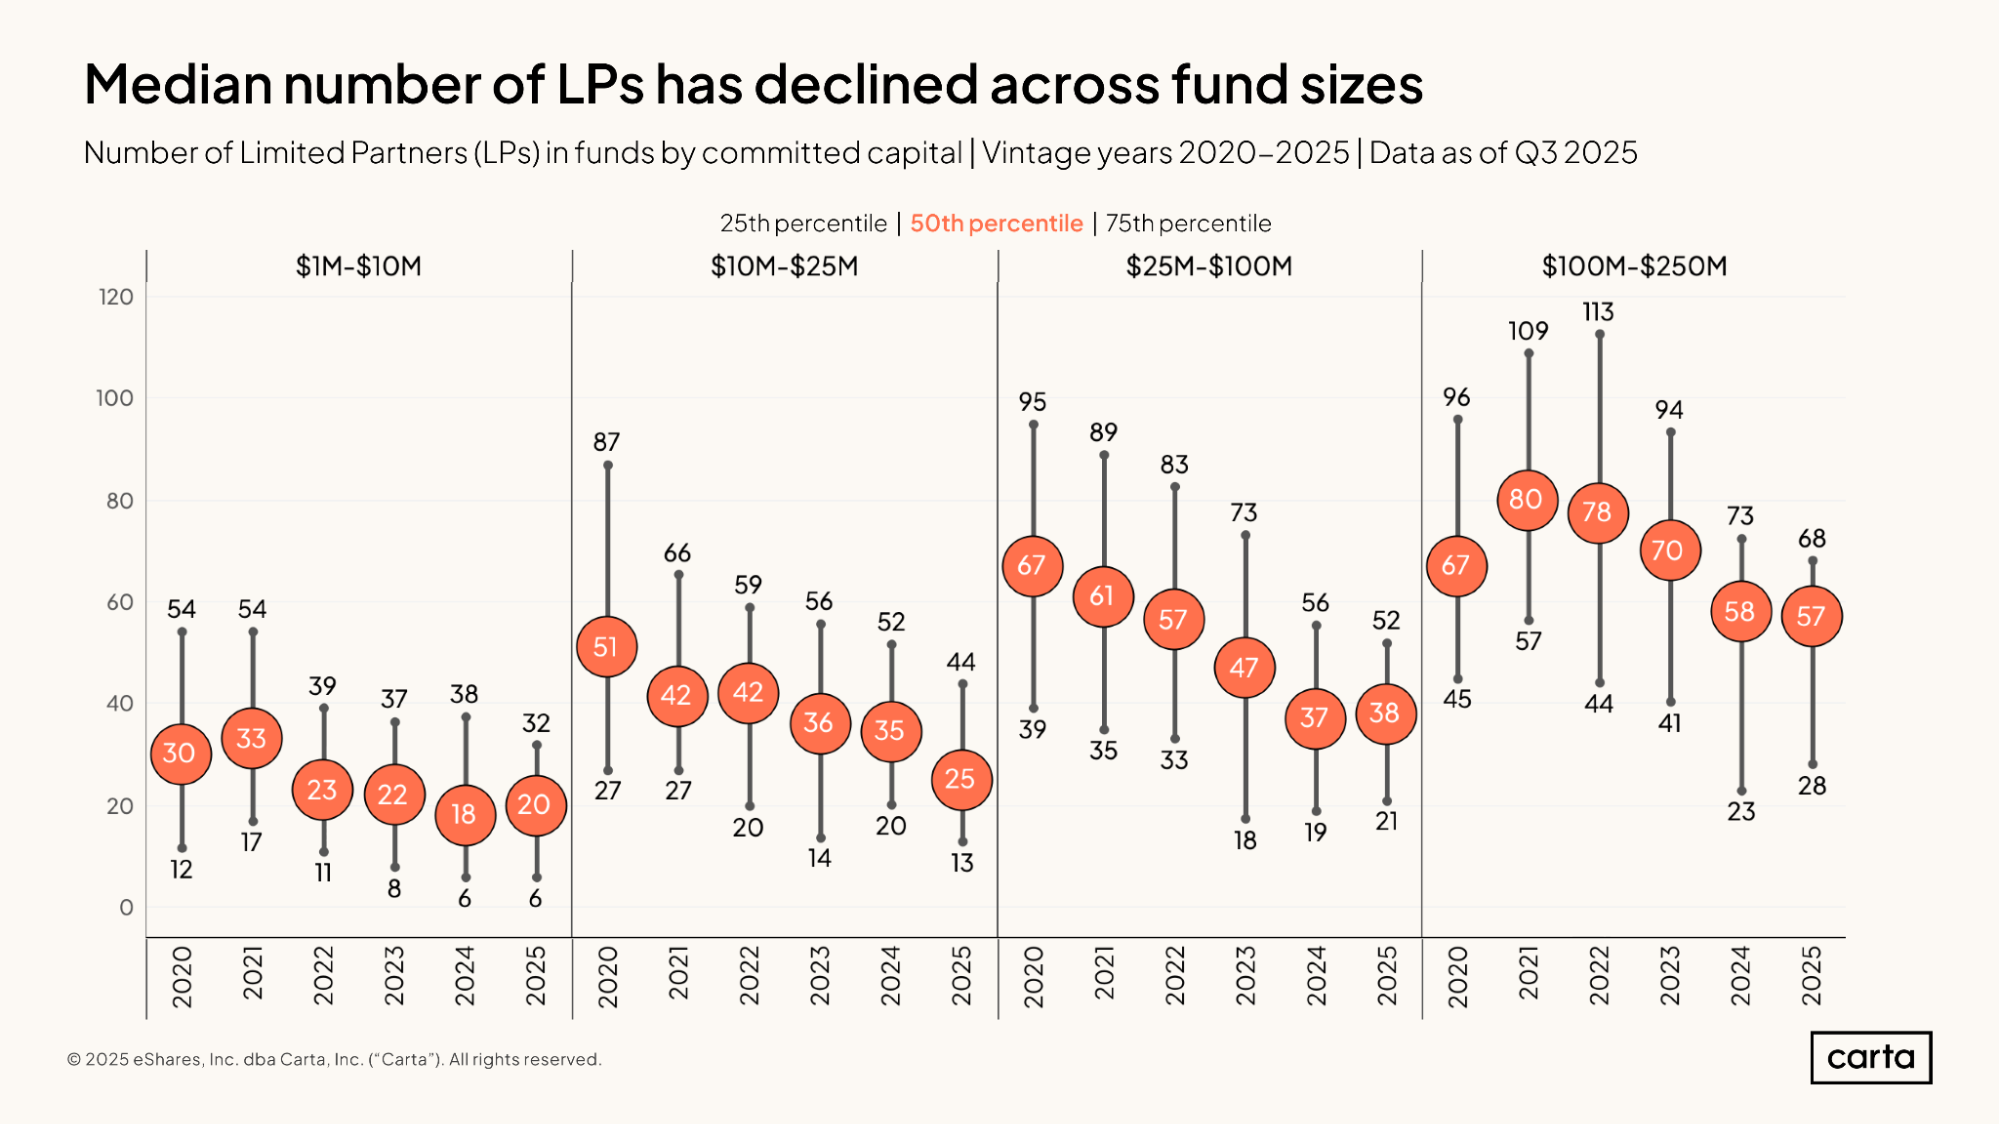
Across all fund sizes, the typical new venture fund today has fewer LPs than the typical fund during the early part of the decade.
For instance, the median fund from the 2020 vintage with between $25 million and $100 million in commitments had 67 different LPs. The median LP count for funds of this size from the 2025 vintage is 38—a decline of 43% over the past five years. The median LP count for funds between $25 million and $100 million from the 2025 vintage is actually lower than the 25th percentile for LP count from the 2020 vintage.
While the median number of LPs in new funds has declined, the gap between the 25th percentile and 75th percentile for LP count has remained relatively wide across all fund-size intervals, demonstrating some notable variety in the investor makeup of new funds. Among vehicles from the 2025 vintage between $1 million and $10 million in size, a fund at the 75th percentile has 32 LPs; a fund at the 25th percentile has just six LPs.
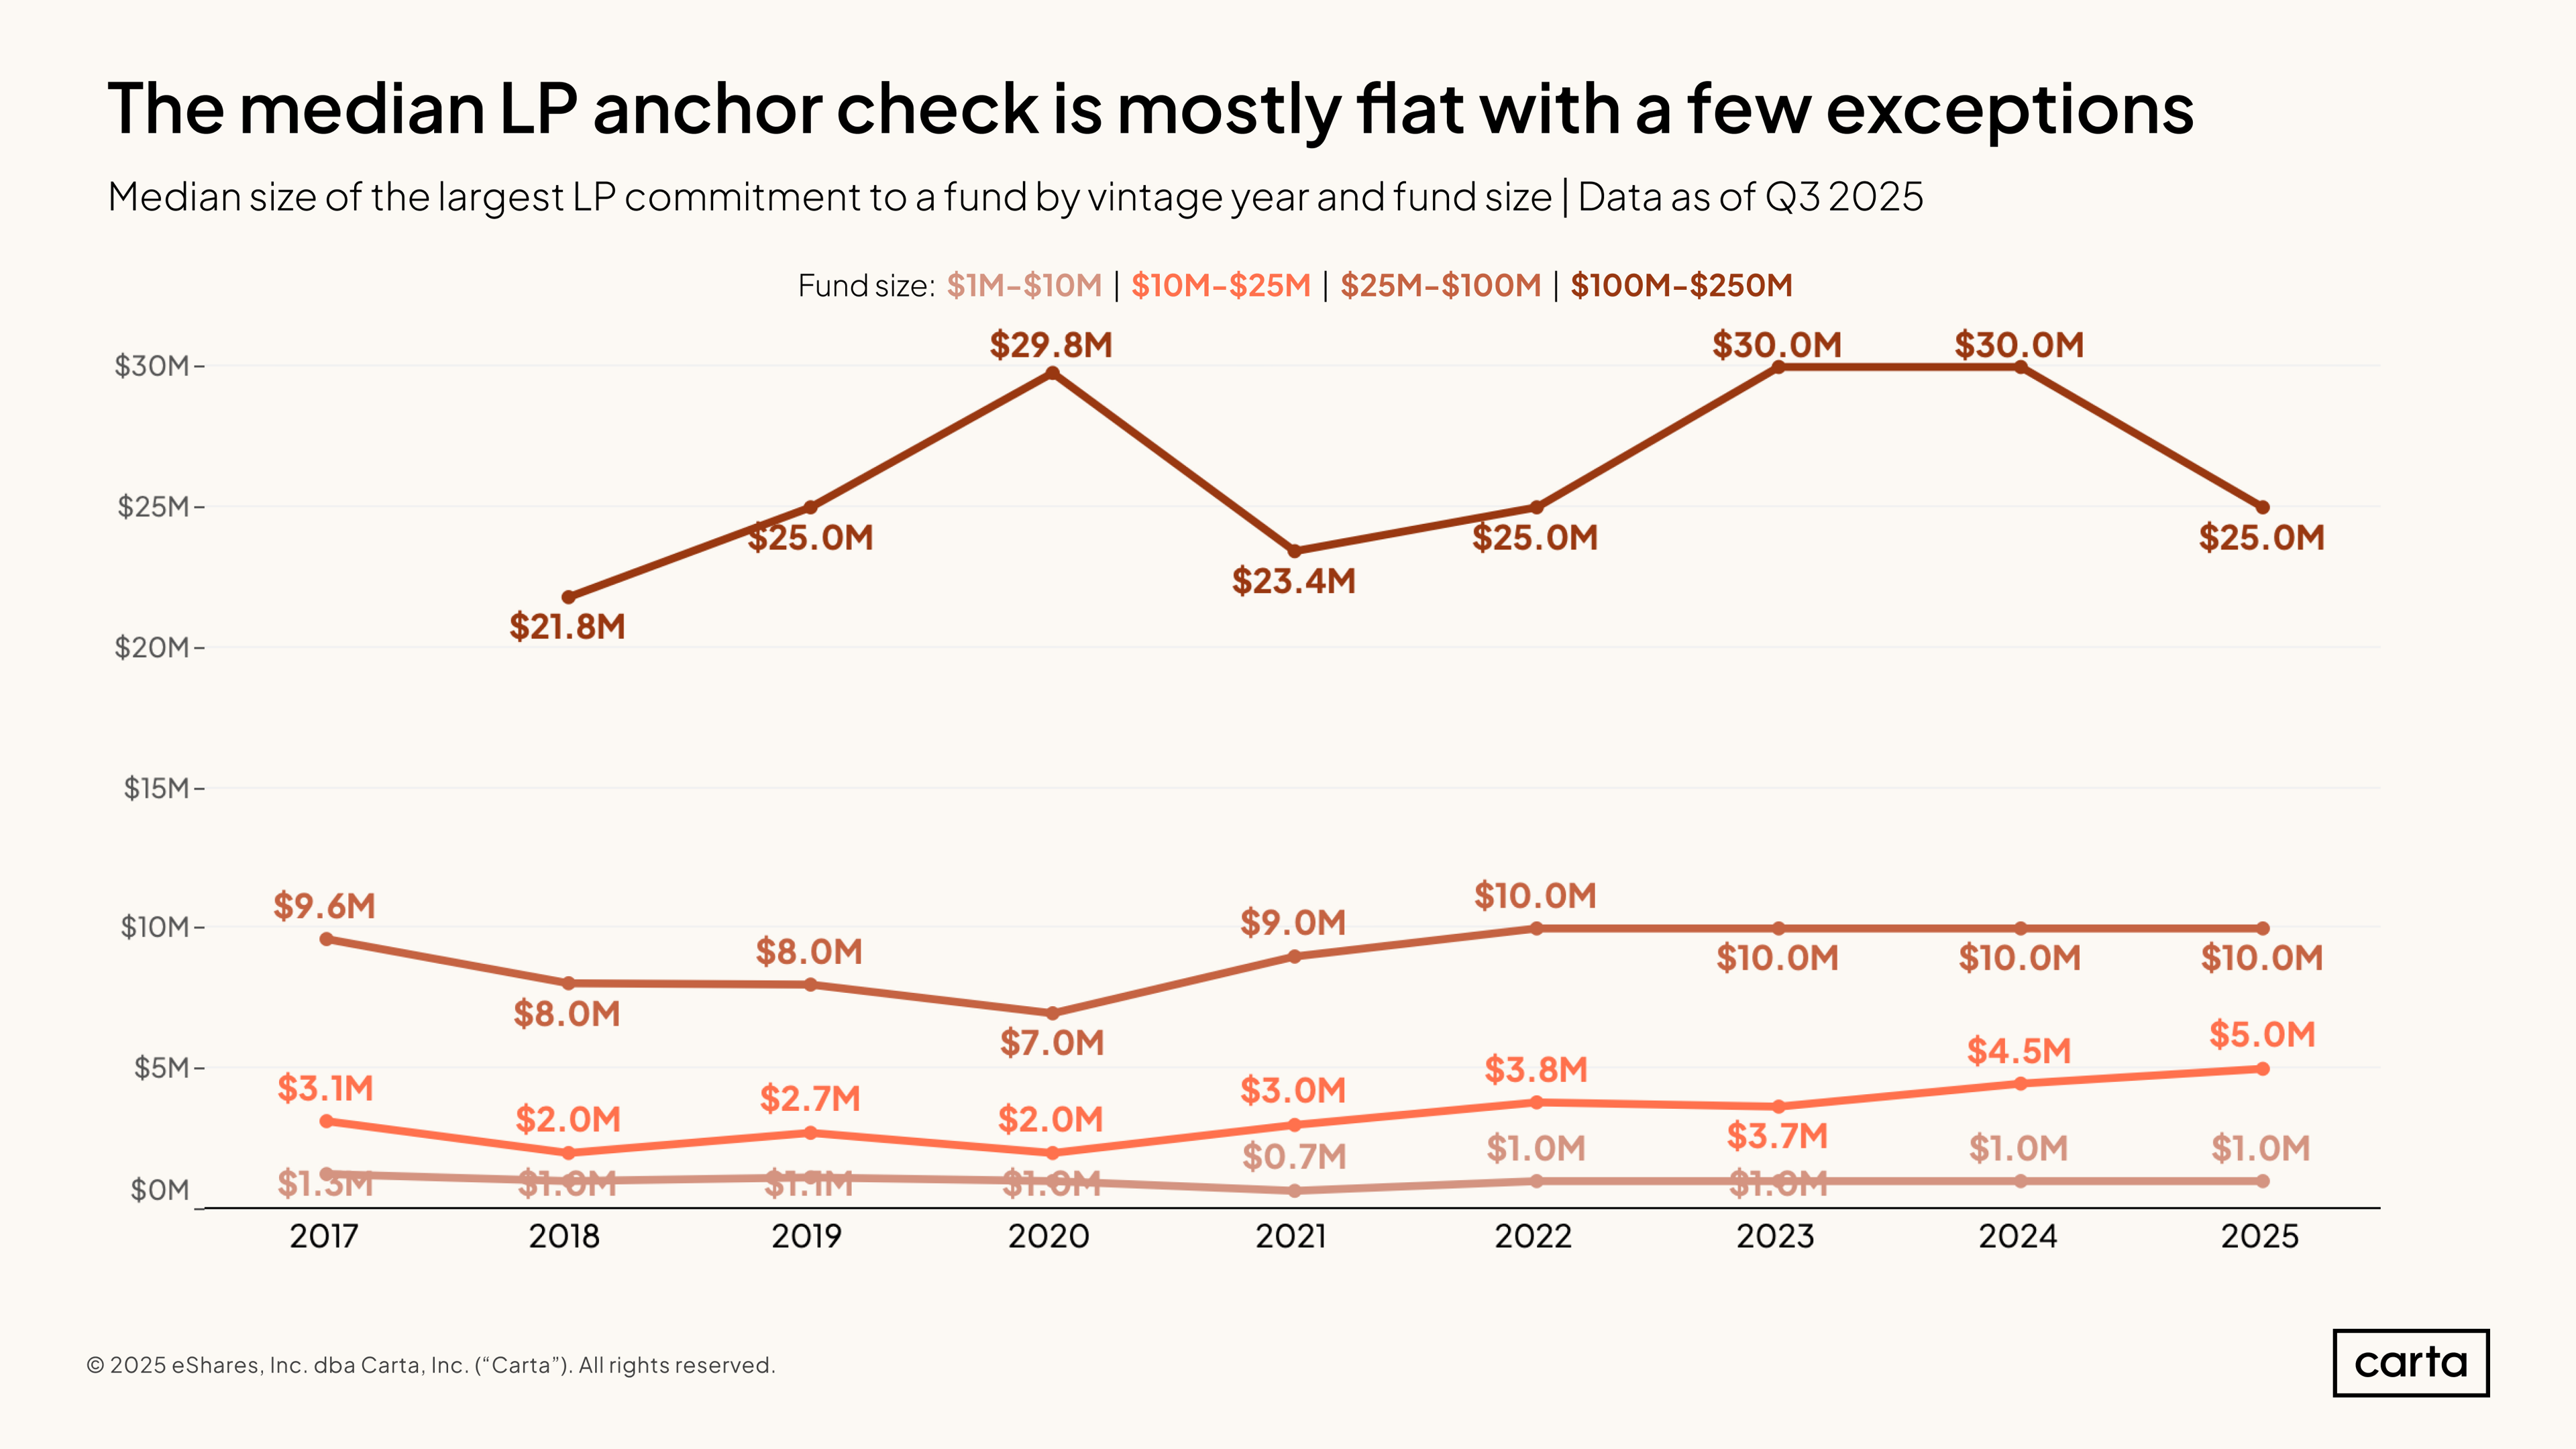
While the typical number of LPs in new venture funds has declined, the median size of the anchor check—defined as the largest contribution from any single LP—has mostly held steady. For funds with between $25 million and $100 million in commitments, the median anchor check has landed at $10 million across each of the past four vintages. For funds between $1 million and $10 million, the median anchor check has remained consistent at $1 million.
Other fund size intervals, though, have seen a little more variation. In particular, a trend of larger anchor checks has emerged among funds between $10 million and $25 million. For the 2025 vintage, the median anchor check in this group was $5 million, up from $3.7 million two years ago and $2 million five years ago.
IRR
Where C(t) = net cash flow at a given time t
And C(0) = total initial cost of investments
And NPV = net present value of the fund’s future cash distribution (set to 0 to numerically solve for IRR)
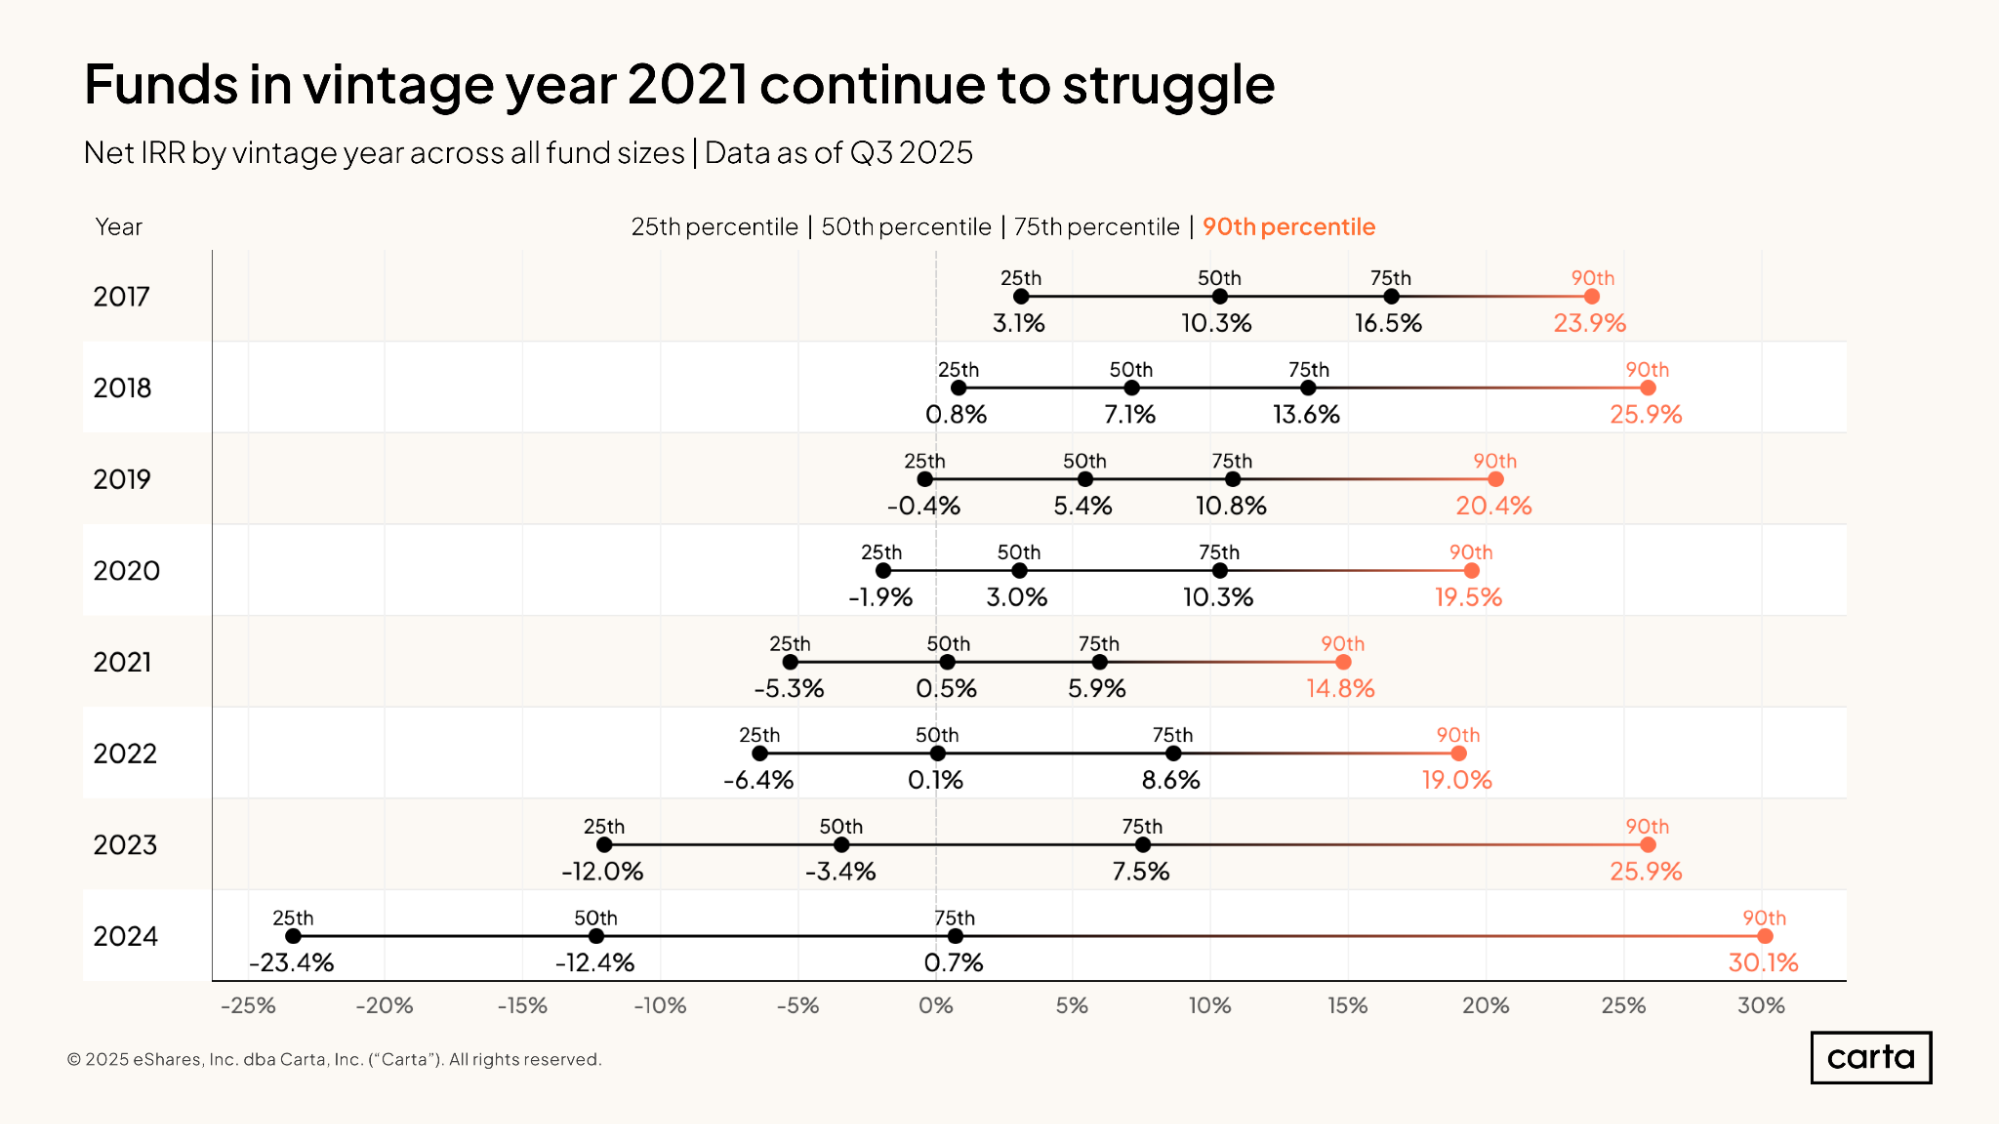
The 2021 fund vintage is lagging behind its recent peers in terms of high-end IRR performance. The 75th percentile of IRR for the 2021 vintage is just 5.9%, and the 90th percentile is 14.8%, both of which are lower than any other vintage from 2017 through 2023.
Many of these 2021 funds began investing at the height of the recent bull market, after which the venture market underwent a widespread valuation reset that constricted the immediate upside for some of these bull-market deals. This timing is likely a significant factor in the vintage’s relative underperformance.
In general, older VC vintages tend to have better IRR metrics: The 2017 vintage has a higher median IRR than the 2018 vintage, which in turn has a higher median IRR than the 2019 vintage. This is because typical VC fund performance follows a J-curve, with returns continuing to improve as a fund matures.
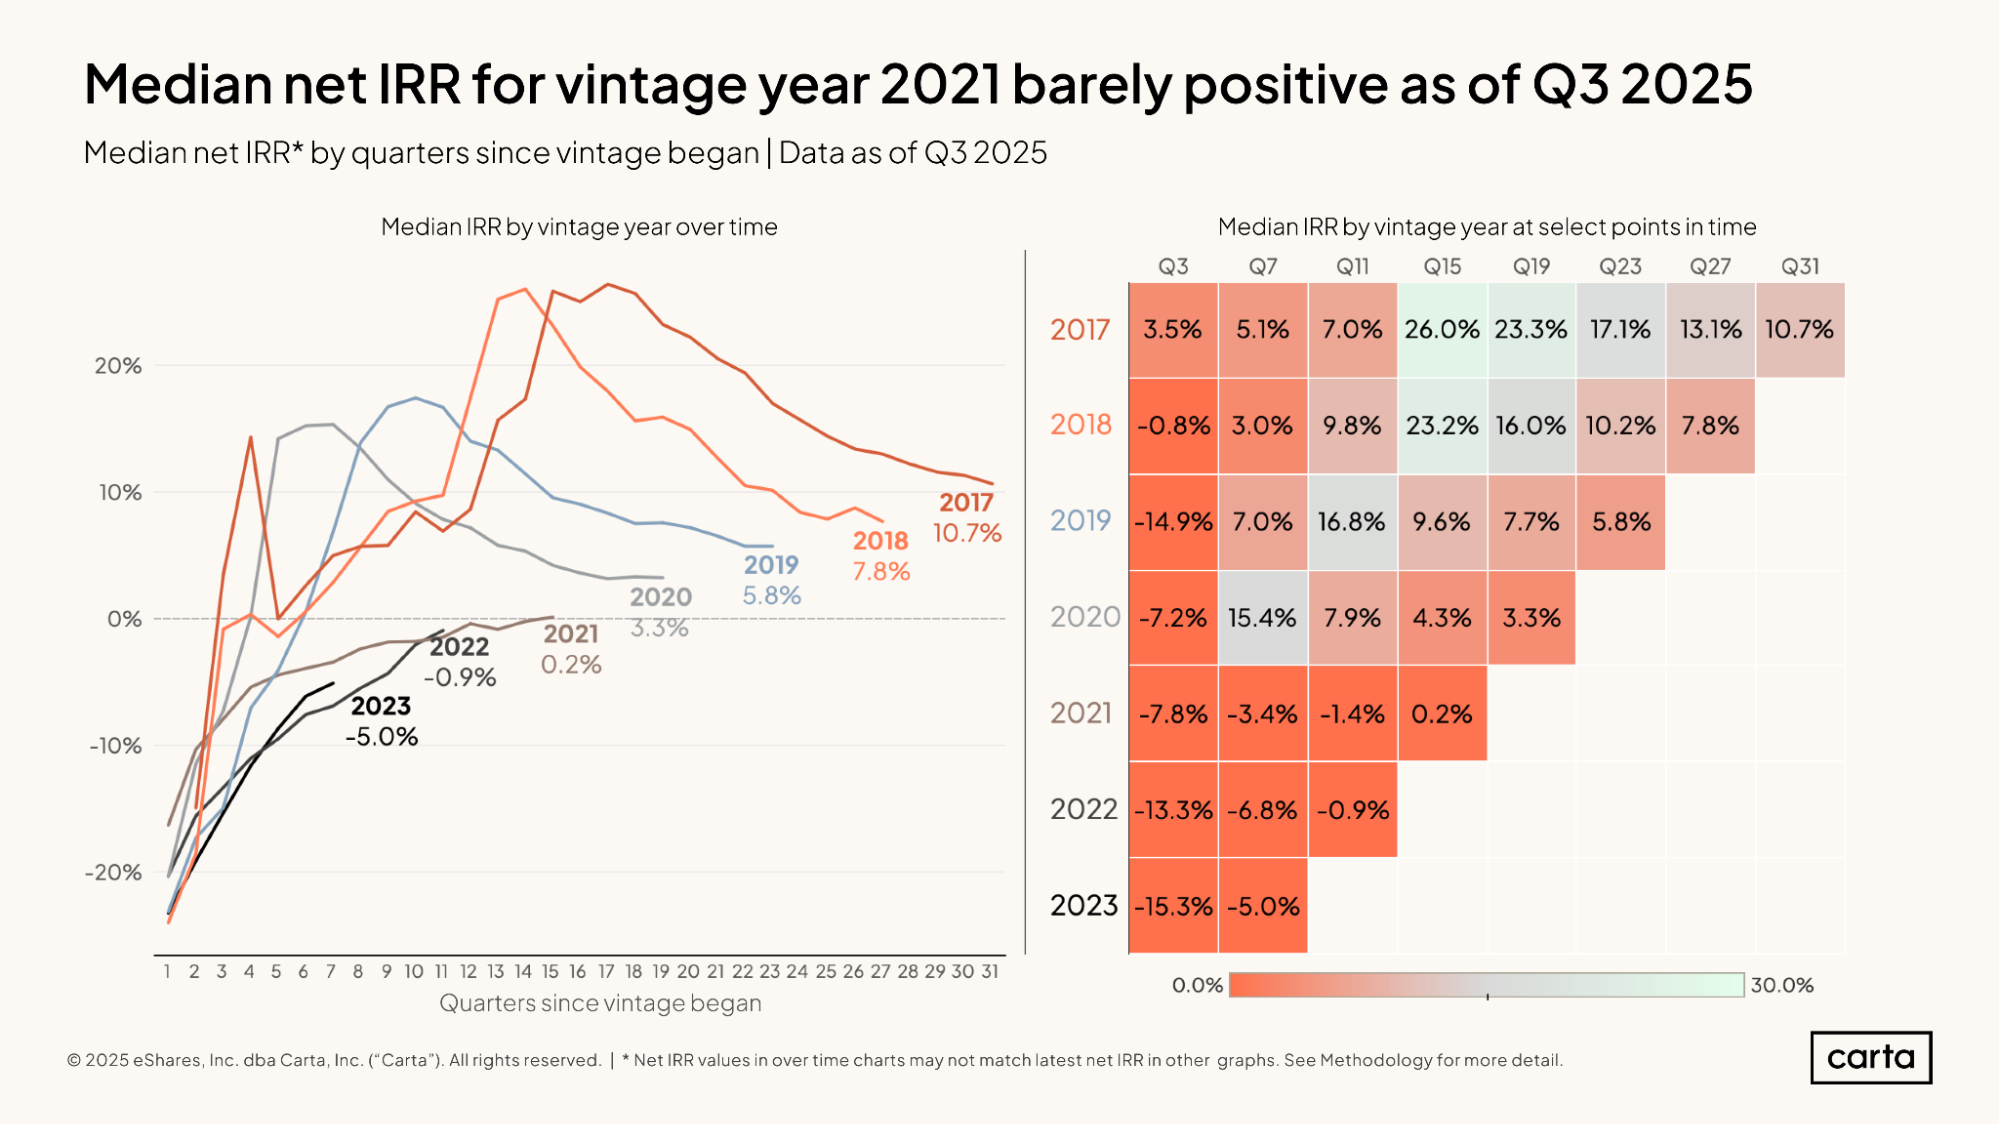
Median IRRs for the 2021, 2022, and 2023 fund vintages all continue to lag well behind the performance of slightly older fund vintages at the same point in time. After 15 quarters of management—just shy of four years—the median IRR for the 2021 vintage sits at 0.2%. At this same signpost in time, the median IRR for the 2020 vintage was 4.3%. For the 2017 vintage, it was 26%.
Here we can see a neat demonstration of the typical J-curve return profile that venture funds demonstrate. During initial quarters of management, median fund IRRs tend to be negative, as is still the case for the 2022 and 2023 vintages. Over time, however, IRRs return to positive territory and continue to rise. Through the end of Q3 2025, each newer vintage shown here had a lower median IRR than all of the older vintages that preceded it.
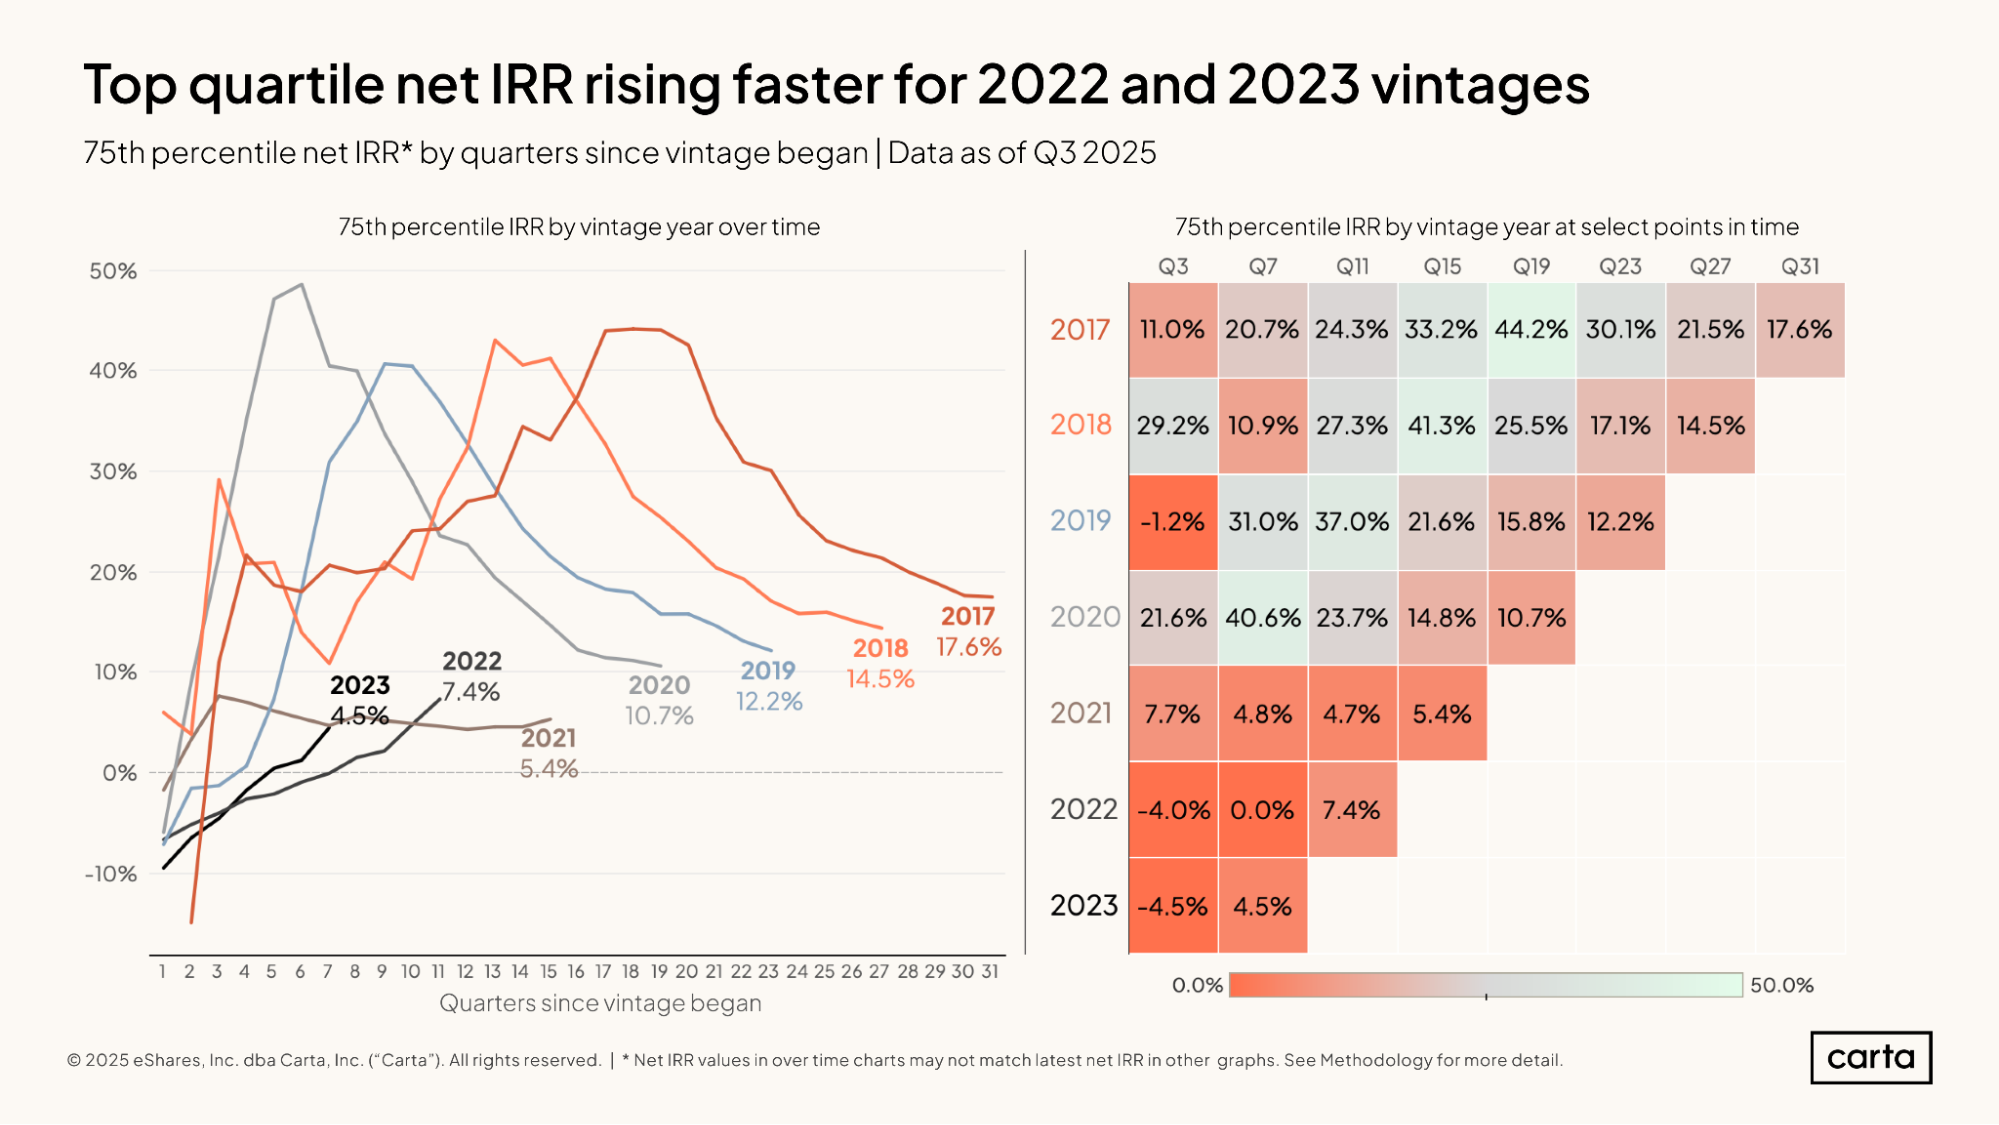
At the 75th percentile of IRR, the 2022 fund vintage is outperforming the 2021 vintage at the same point in time, and the 2023 vintage is outperforming 2022. In the upper quartile, at least, these are signs that the market for VC fund performance is trending in a positive direction.
Through 11 quarters, the 75th percentile for IRR among the 2022 vintage is 7.4%, compared to 4.7% for the 2021 vintage at that juncture. And through seven quarters, the 75th percentile IRR for the 2023 vintage sits at 4.5%, compared to 0% for 2022.
Still, these figures lag well behind the performance of slightly older vintages at the same point in time—but, then again, the current performance of these slightly older vintages also lags well behind their past performance. Across all vintages from 2017 through 2020, a top-quartile return profile today is less attractive than it was three or four years ago.
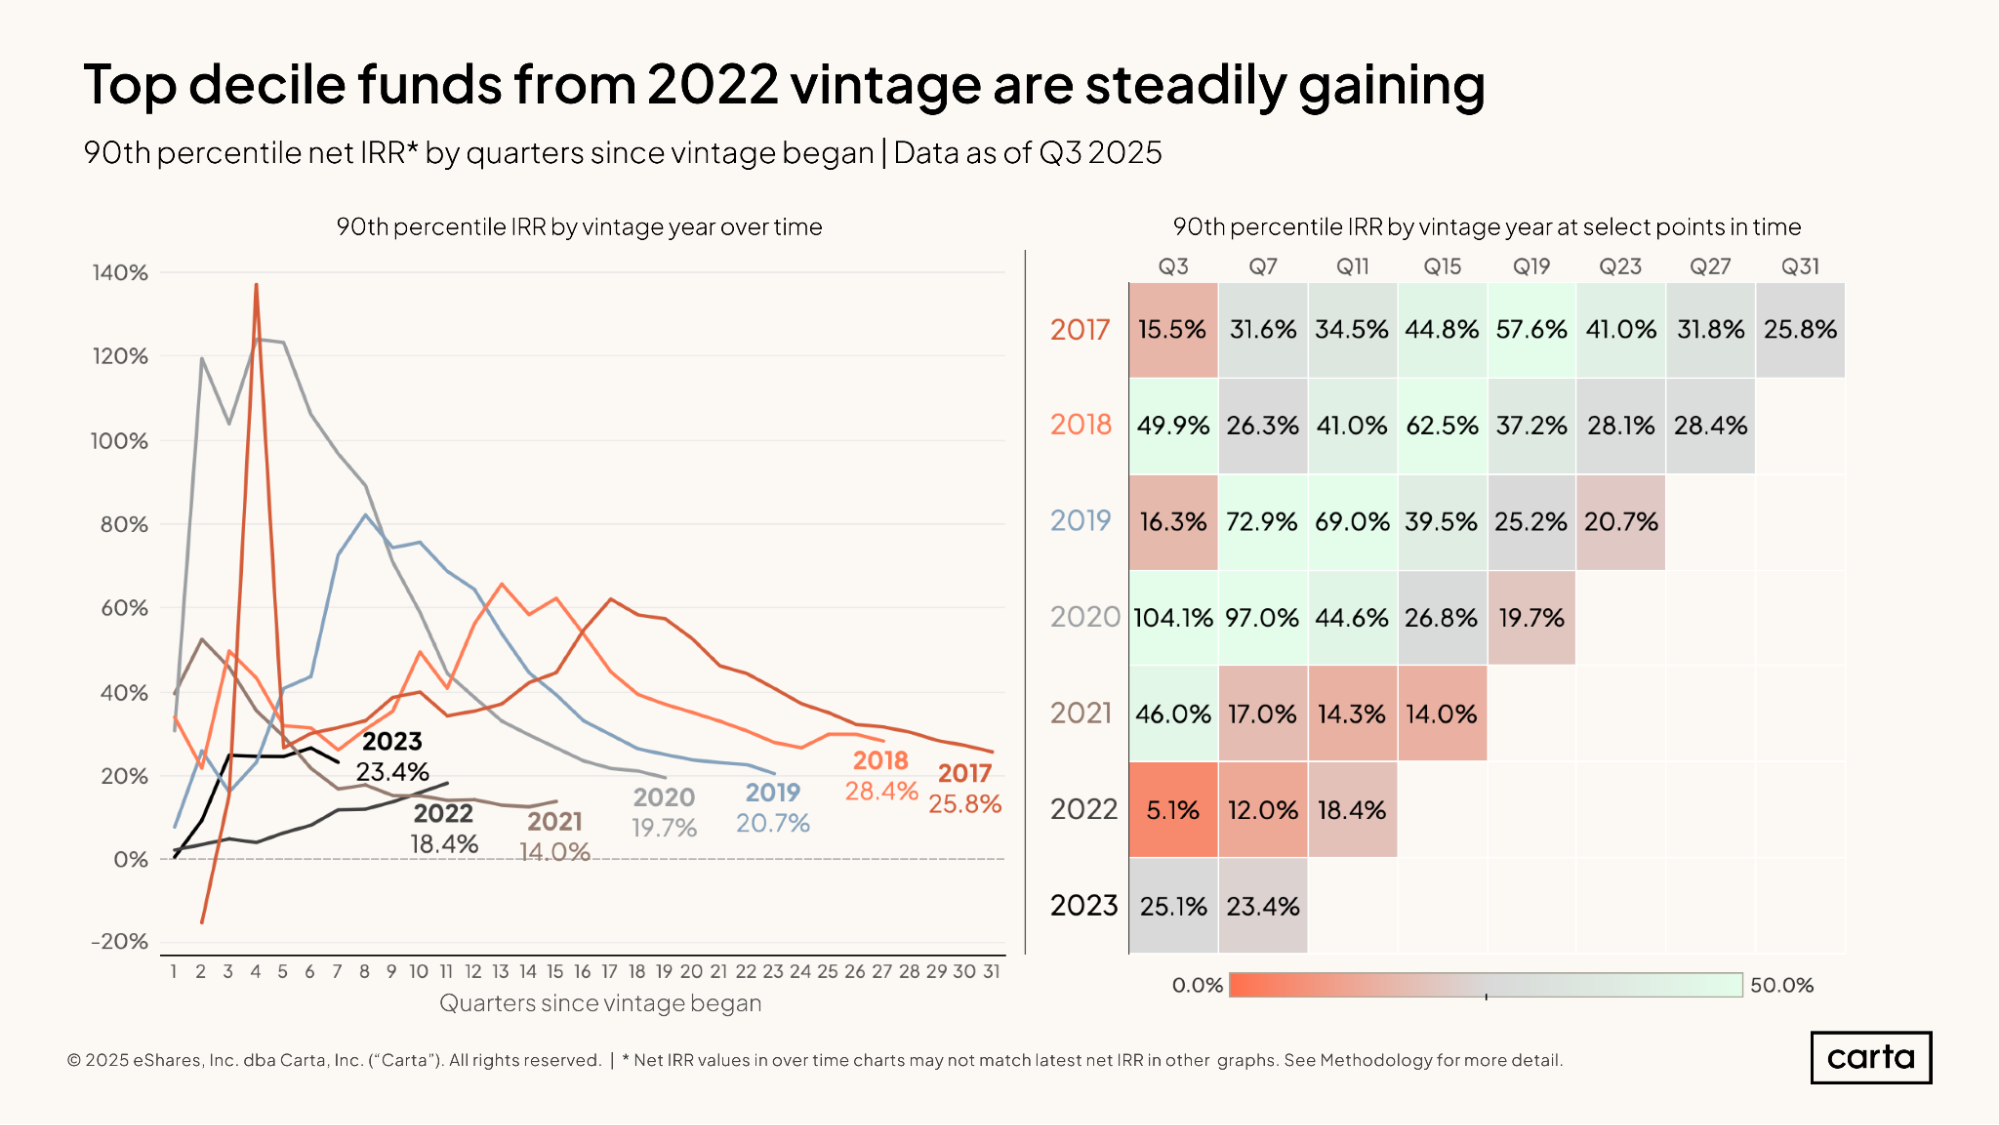
For each vintage from 2017 through 2021, the 90th percentile for IRR has been steadily declining over the past 10 or so quarters. For the 2022 vintage, on the other hand, the 90th percentile for performance has been steadily trending up. After 11 quarters of management, the 90th percentile for 2022 IRR performance is at 18.4%, higher than the 2021 vintage at the same juncture.
The 90th percentile for IRR among the 2023 VC vintage has also been on the rise. It sits at 23.4% after seven quarters of management, which is significantly higher than the present top-decile IRR for both the 2021 and 2022 vintages; it’s also not far off from the 90th percentile of IRR for both the 2017 and 2018 vintages at the same point in time.
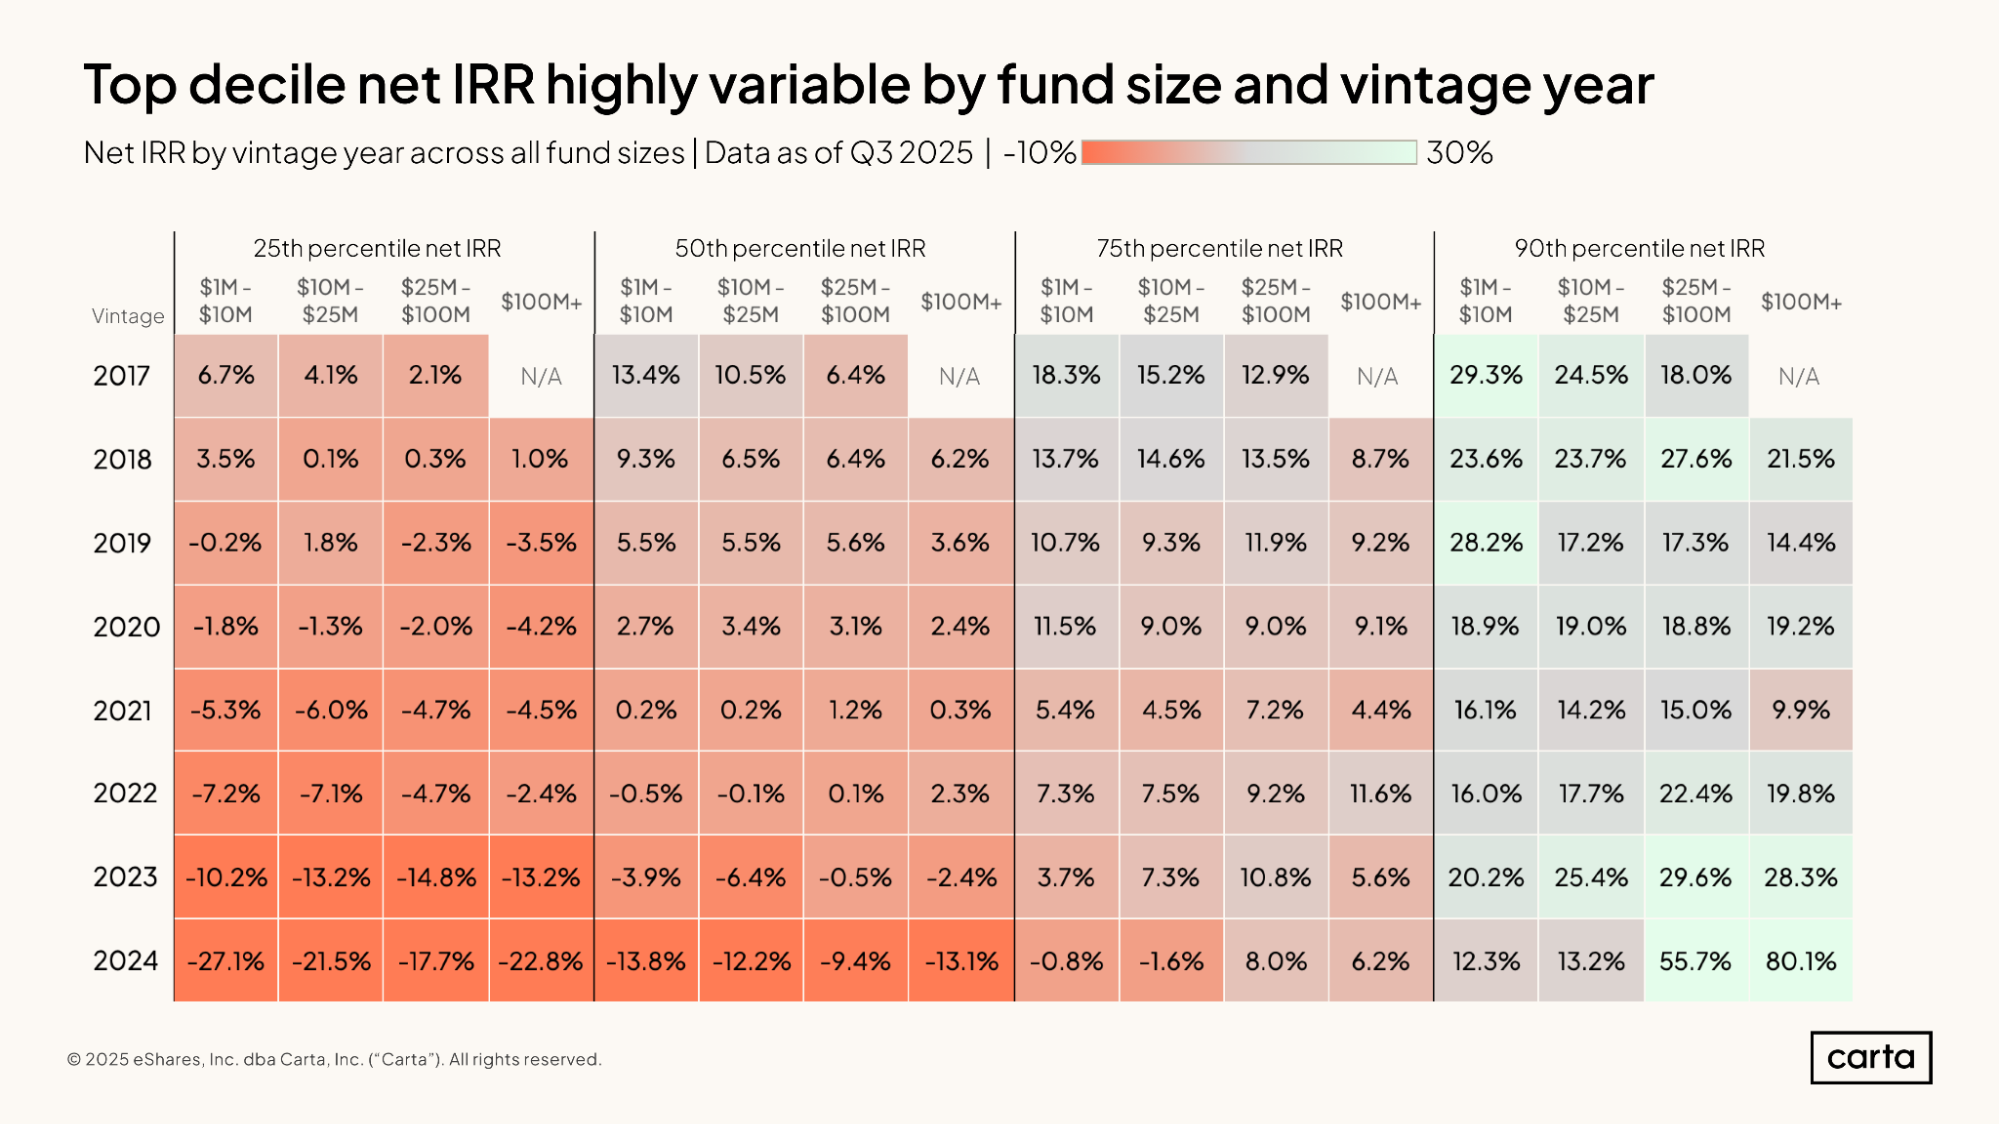
The above table presents a comprehensive comparison of various IRR performance thresholds across both fund size and fund vintage. There are plenty of exceptions, but as a rule of thumb, smaller funds tend to outperform larger funds, and older vintages of still-active funds tend to outperform newer vintages.
The first of these trends—the superior performance of smaller funds—is a longstanding reality of investing that tends to hold true even as funds mature and begin to realize more of their portfolio (with some exceptions to be sure). Conversely, the second trend—the superior performance of older vintages—is due in large part to the fact that these funds are still being actively managed. The older vintages shown here have had more time to realize returns and for the value of their investments to grow, creating an unlevel playing field when compared to newer vintages.
TVPI
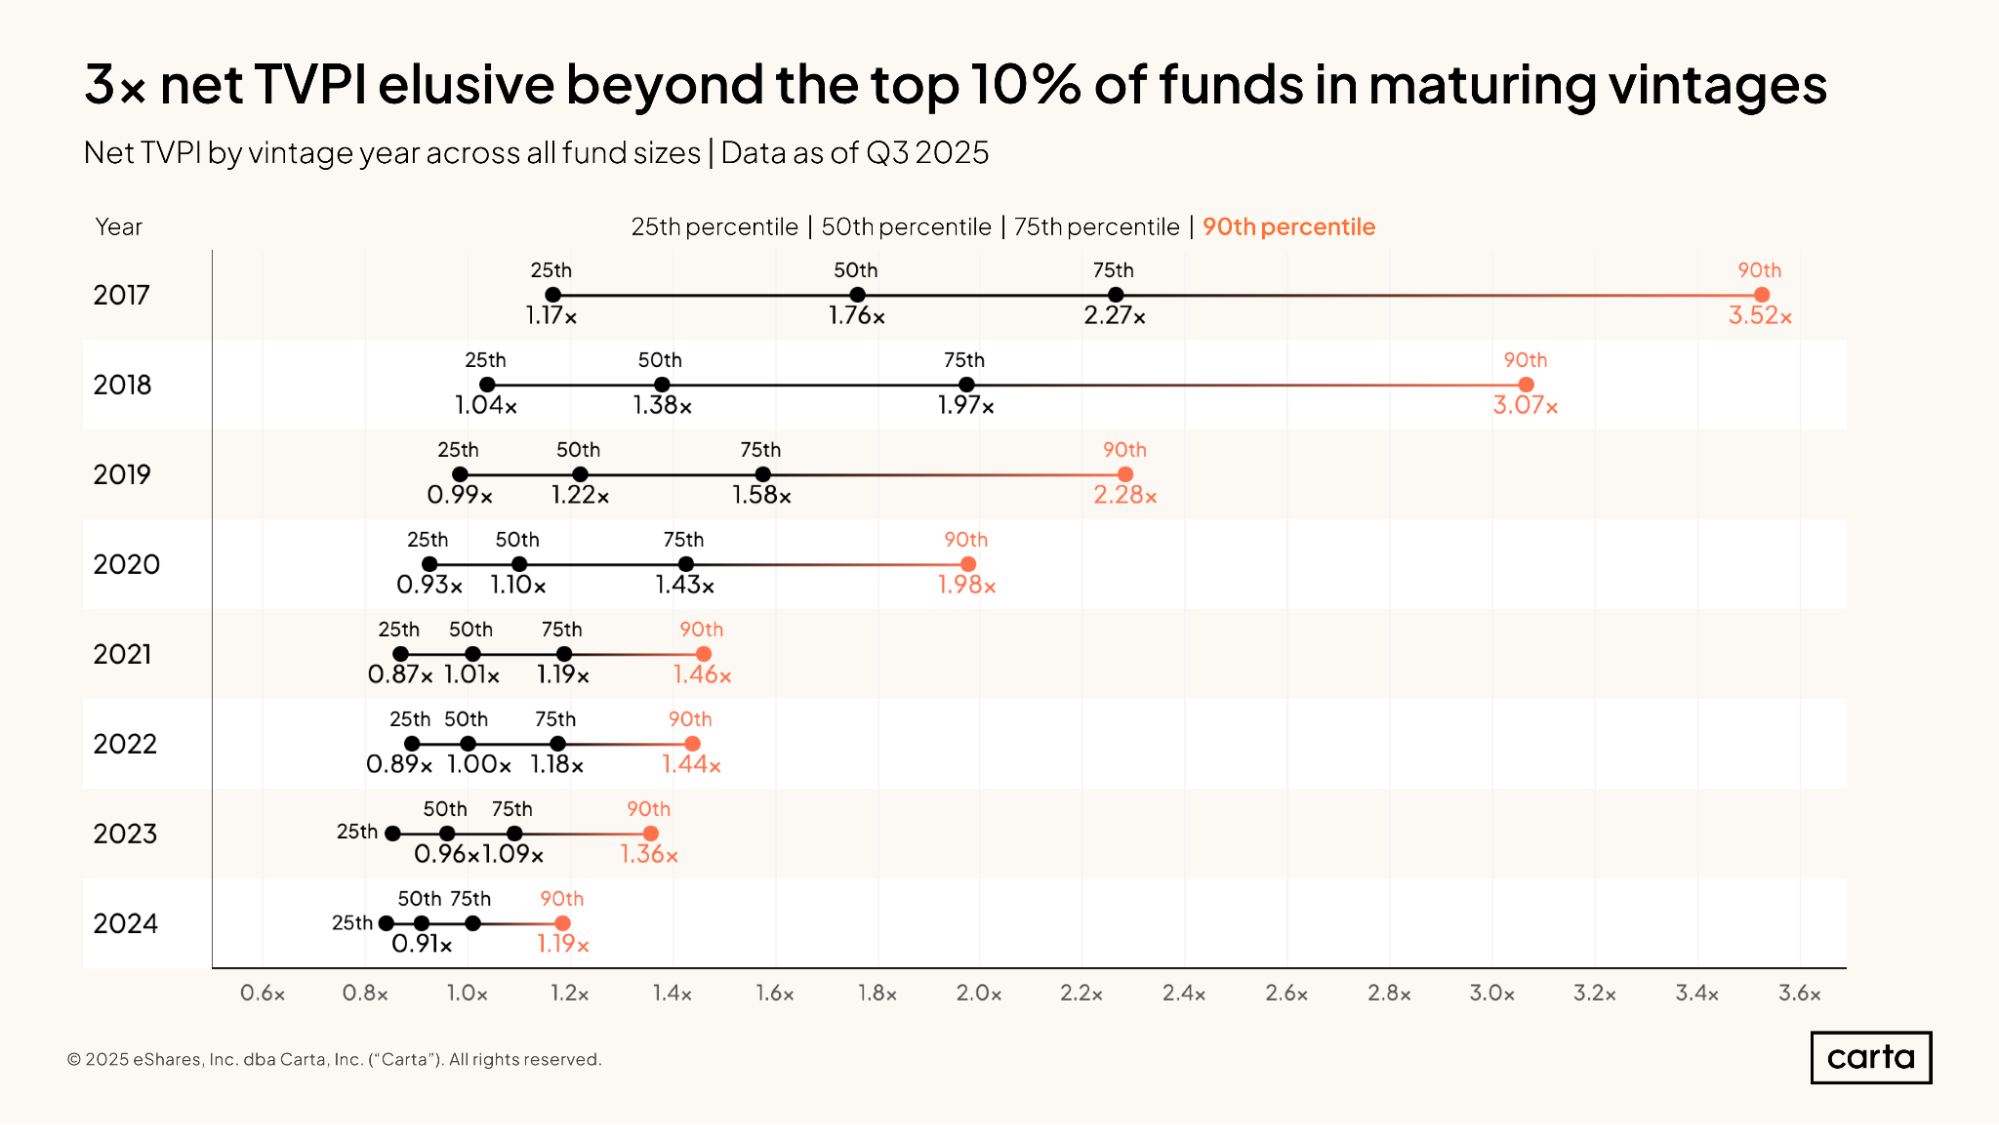
Eight years into its lifespan, the 2017 vintage of venture funds has a median net TVPI of 1.76x. At the high end of this vintage, some funds are producing substantially better results: The 75th percentile for TVPI in the 2017 vintage is 2.27x, and the 90th percentile is 3.52x. Even funds at the lower quartile of 2017 vintage performance are producing positive value, with a 25th percentile TVPI of 1.17x.
At all four of these statistical thresholds, the 2017 vintage is generating better performance multiples than any other vintage from 2018 through 2024. This makes sense: As is the case with IRR, TVPI tends to follow a J-curve, with performance improving as time goes on.
For vintages from 2021 through 2024, the spectrum of current TVPI is much narrower. The 90th percentile TVPI for all four of these most recent vintages remains below 1.5x, while the 25th percentiles lie somewhere between 0.8x and 0.9x.
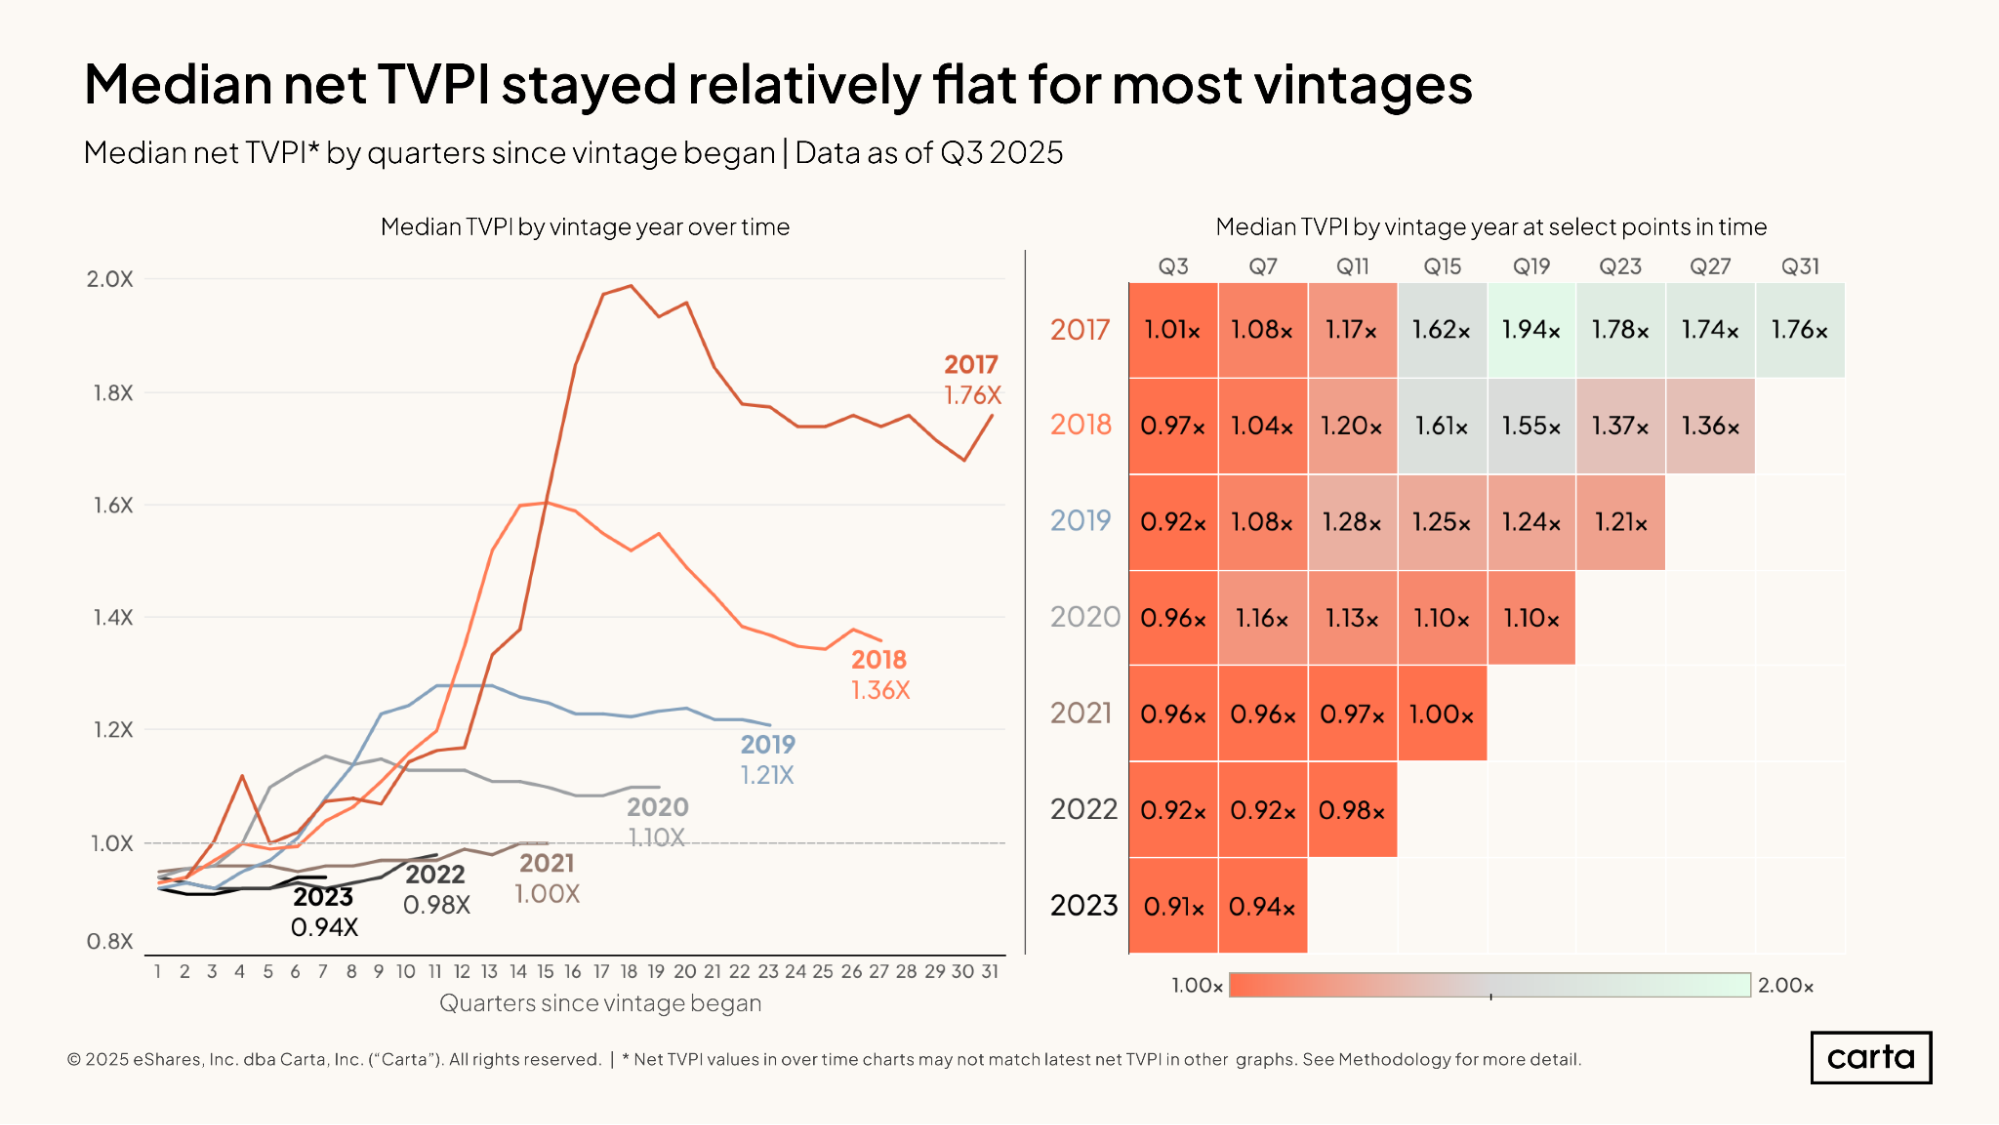
The median net TVPI for the 2017 vintage has fallen off somewhat from its heights of three years ago. But performance has largely evened out in more recent quarters—and it even experienced a spike last quarter, bouncing back to a current standing of 1.76x. The median TVPIs for the 2018, 2019, and 2020 vintages have followed a roughly similar trend in recent years, with gentle declines from recent high points earlier in the decade.
Median TVPIs for vintages from 2021 through 2023, meanwhile, have been gently trending up in recent quarters, approaching—or in the case of the 2021 vintage, reaching—a breakeven point of 1x. Even with these recent gains, however, median TVPIs for all three of these vintages remain well behind the performance of vintages from 2017 through 2020 at the same point in time.
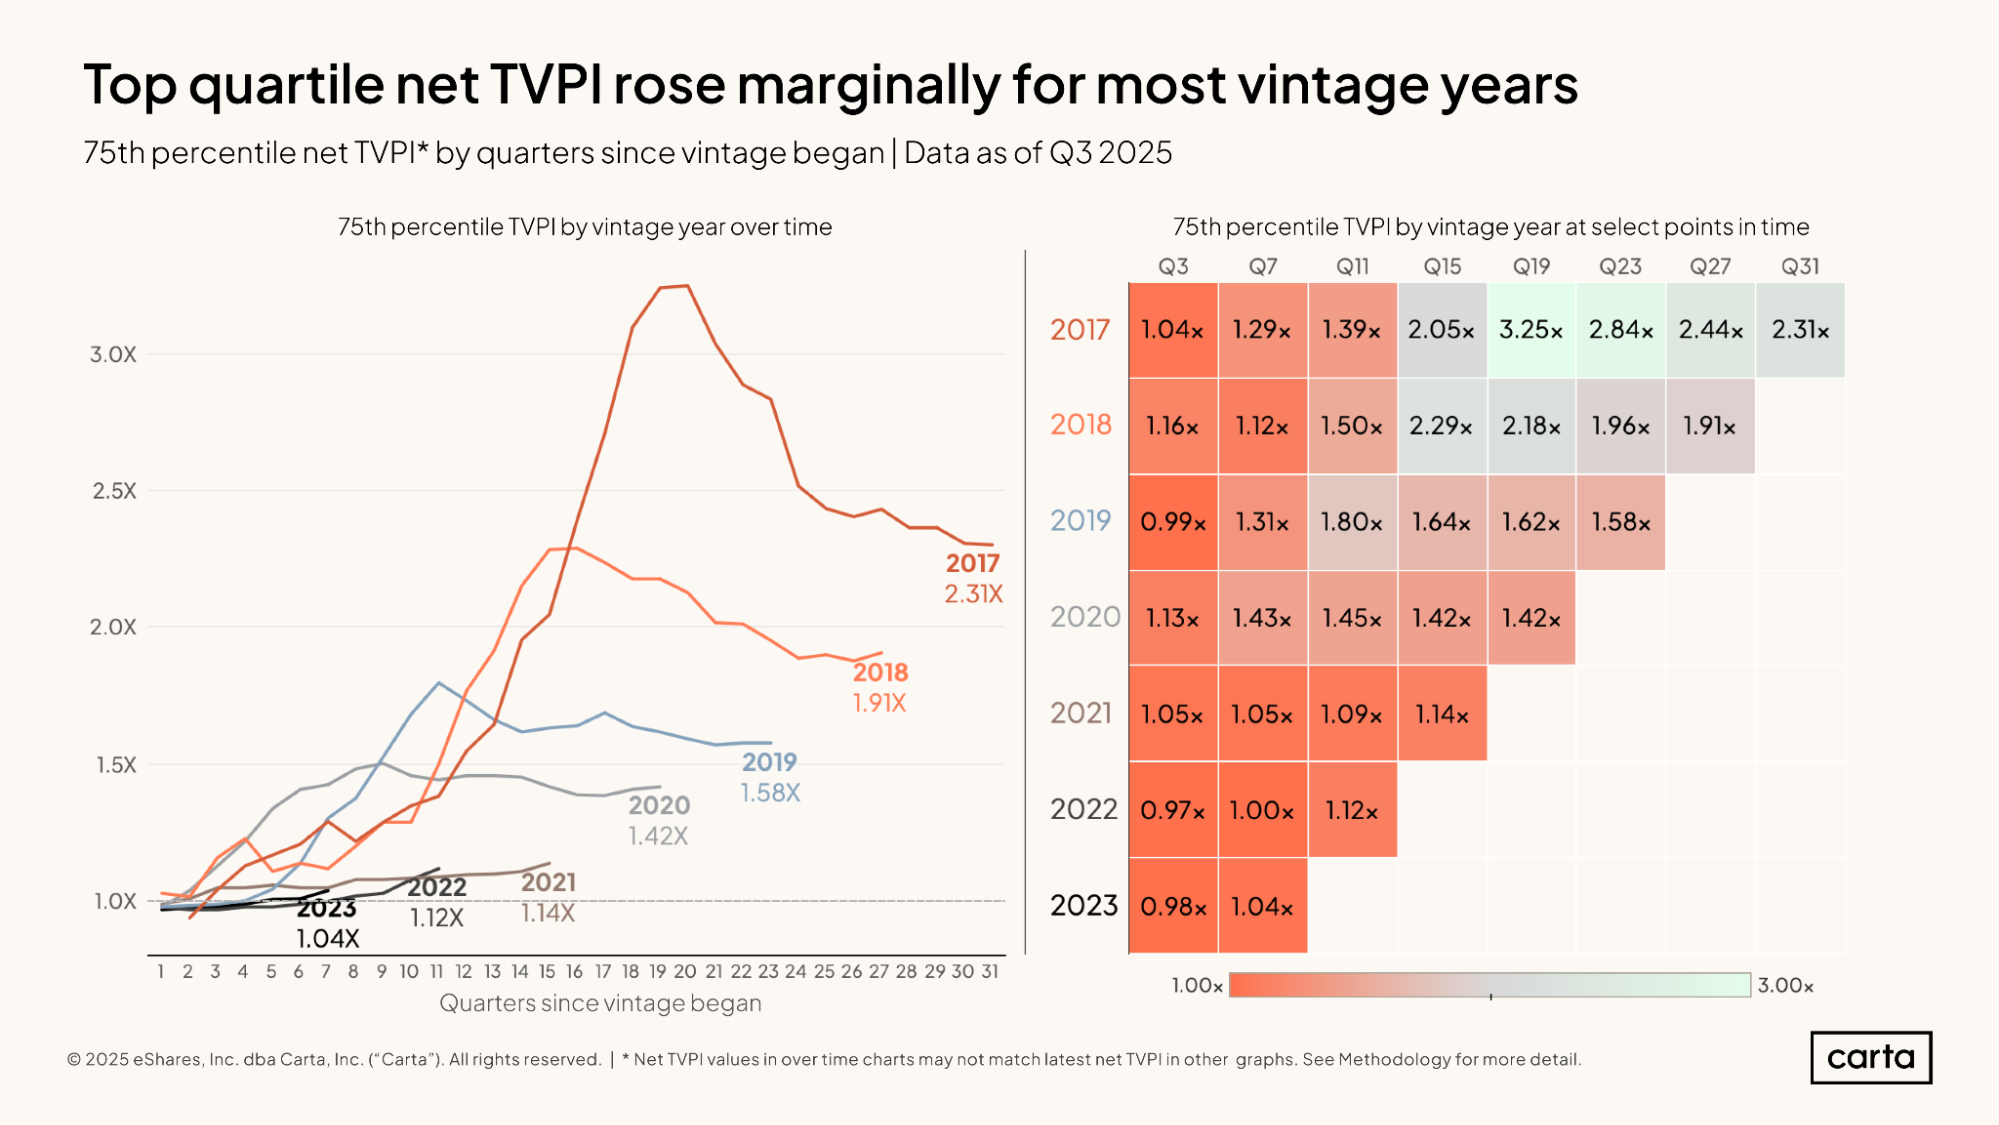
The top quartile for performance for the 2017 vintage has fallen off more sharply in recent years than the median, signaling that some of the best performing funds have felt more of an impact from the post-bull run market reset. Over the past 12 quarters, the 75th percentile for net TVPI among the 2017 vintage has fallen from 3.25x to 2.31x.
Still, that present figure of 2.31x is much higher than the 75th percentile of TVPI for any other recent vintage. As is the case with the medians, top-quartile figures have been gradually declining for vintages from 2018 through 2020 and gradually increasing for vintages from 2021 through 2023.
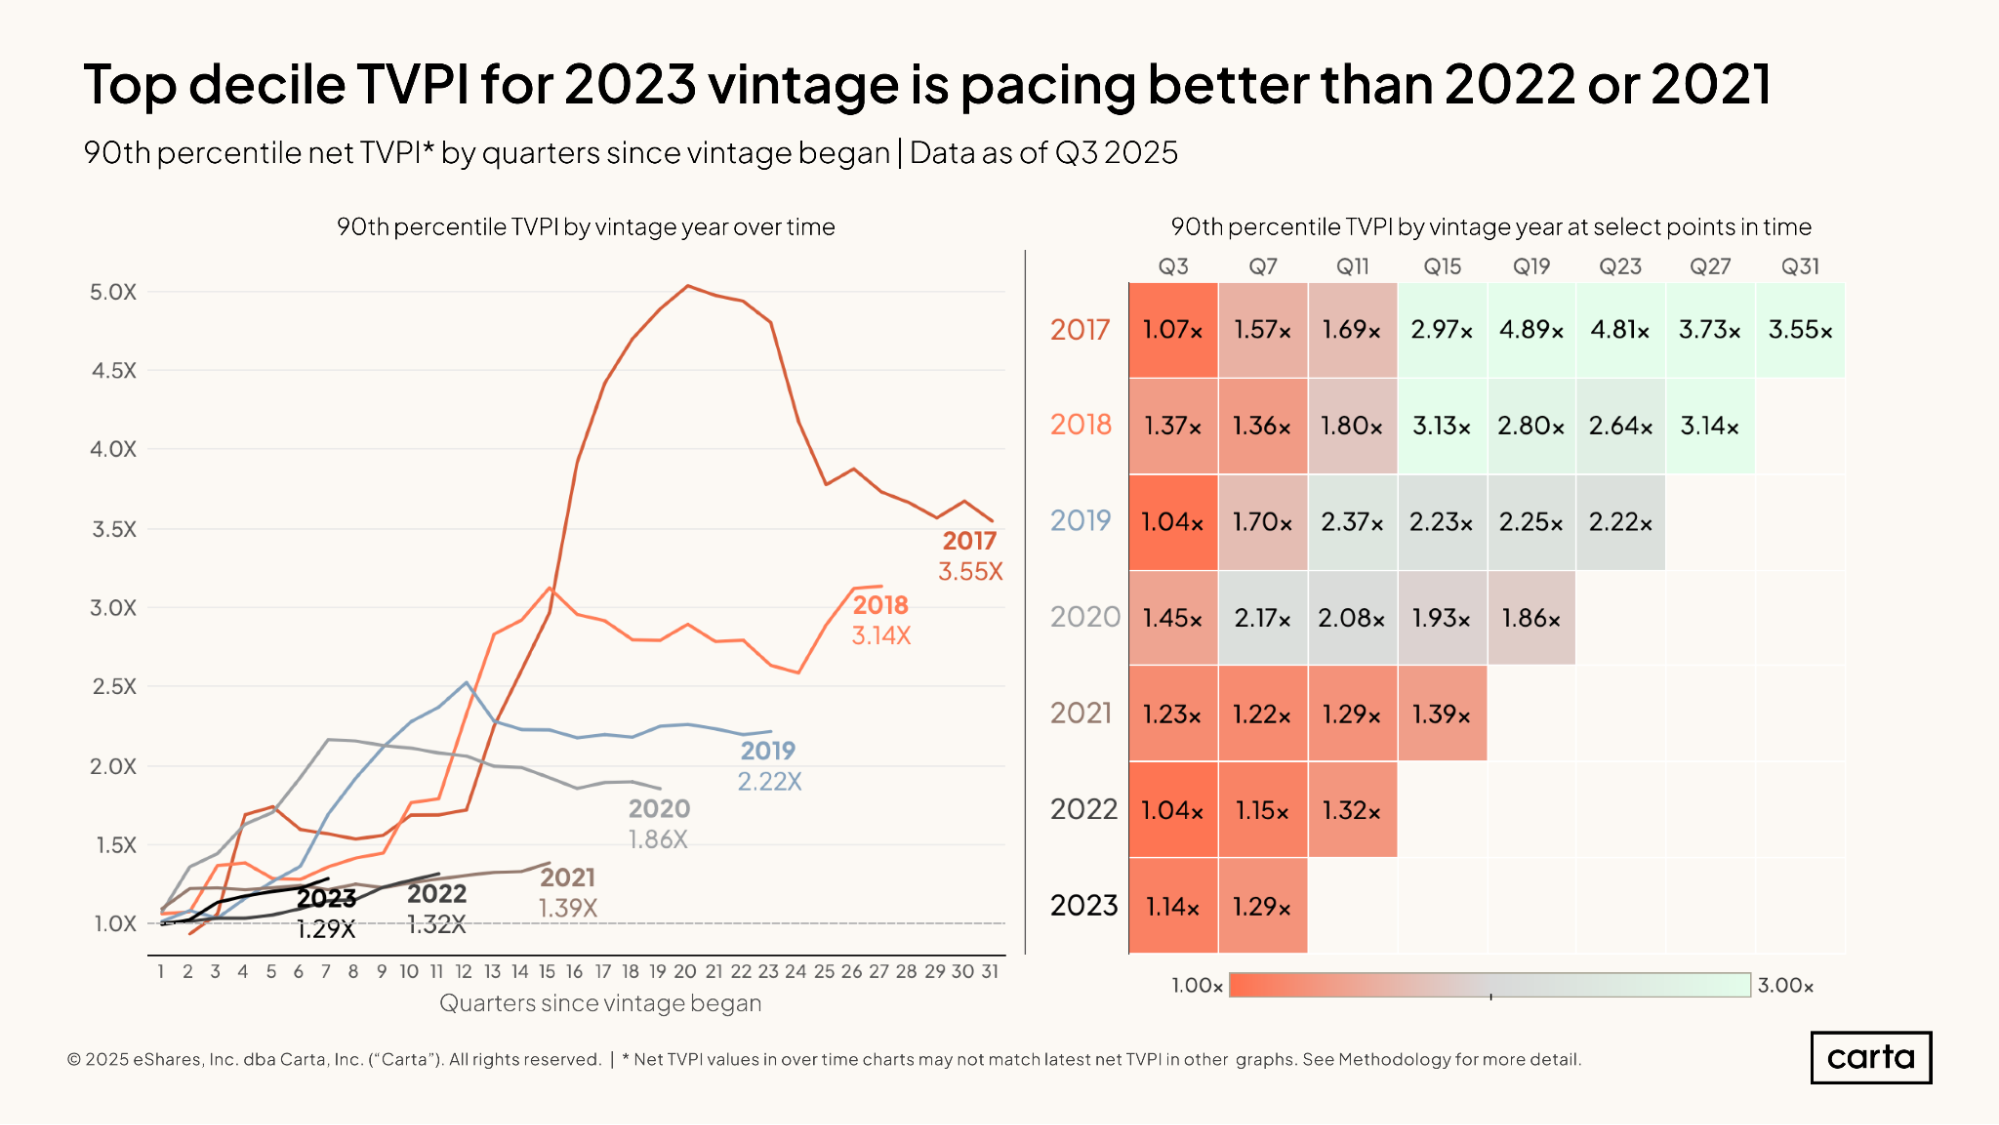
The best-performing funds from the 2018 vintage have had a strong last few quarters. The 90th percentile for net TVPI among 2018 venture funds currently stands at 3.14x, up from 2.64x four quarters ago. This is in contrast to the recent trends for the 50th and 75th percentiles of TVPI for the 2018 vintage, both of which have been trending slightly down.
For the other vintages shown here, the trendline of top-decile performance looks similar to recent movement at the 75th percentile and the median. Even at the 90th percentile, funds from 2021 through 2023 are lagging well behind where funds from earlier vintages stood at the same threshold in time.
DPI
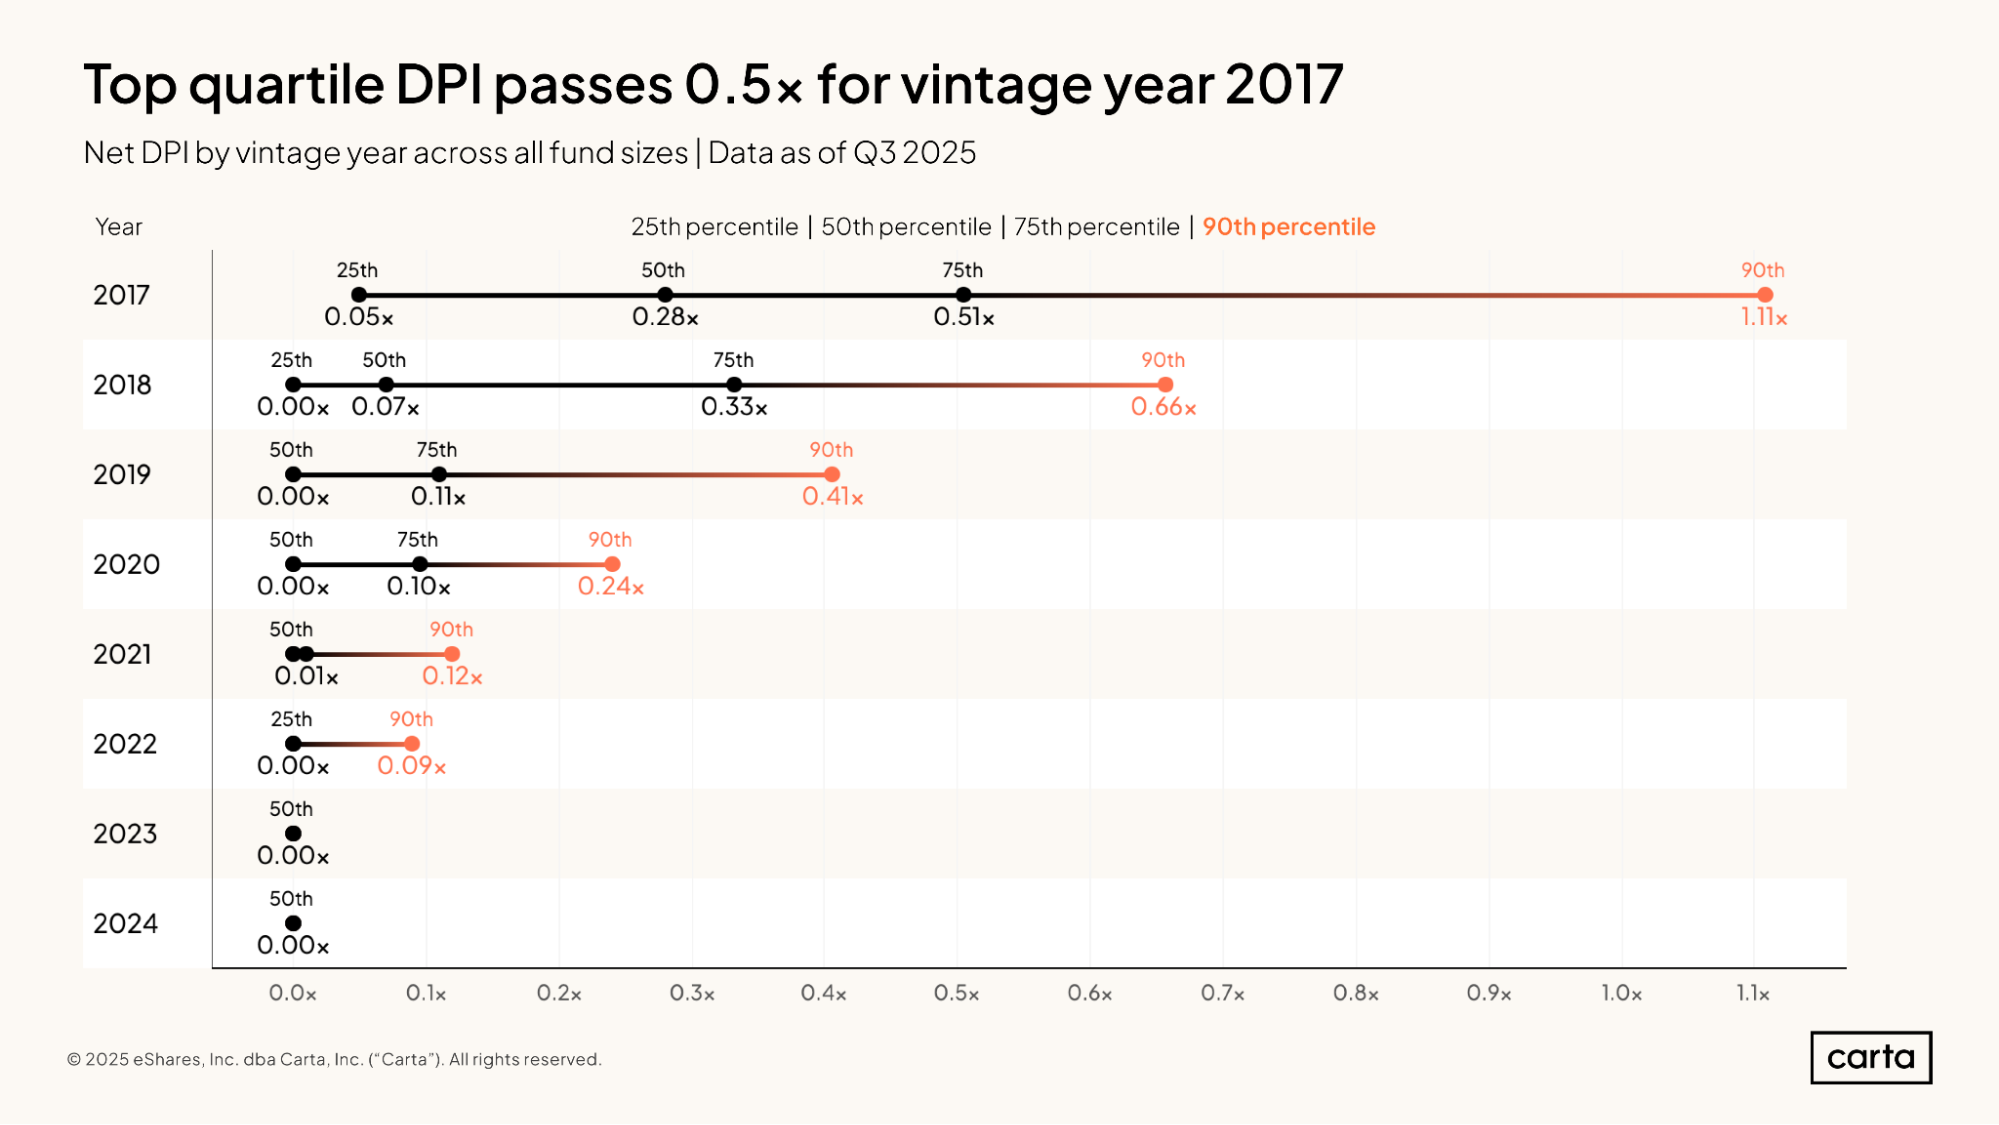
While TVPI accounts for both realized and unrealized gains within a fund portfolio, DPI measures only realized returns that have been distributed back to LPs. Amid the relatively chilly exit environment of the past few years, distributions remain few and far between for some of the most recent venture funds: At least half of all funds in each vintage from 2019 on have a DPI of zero, meaning they’ve yet to begin generating any net DPI.
The 2017 vintage stands out as a clear exception. The median DPI for 2017 funds sits at 0.28x, which means the median fund in this vintage has distributed returns equivalent to about one-quarter of the initial capital that LPs paid in. The 75th percentile for DPI in the 2017 vintage rises to 0.51x, and the 90th percentile to 1.11x—meaning that these top-decile funds have begun to generate net-positive value for their LPs.
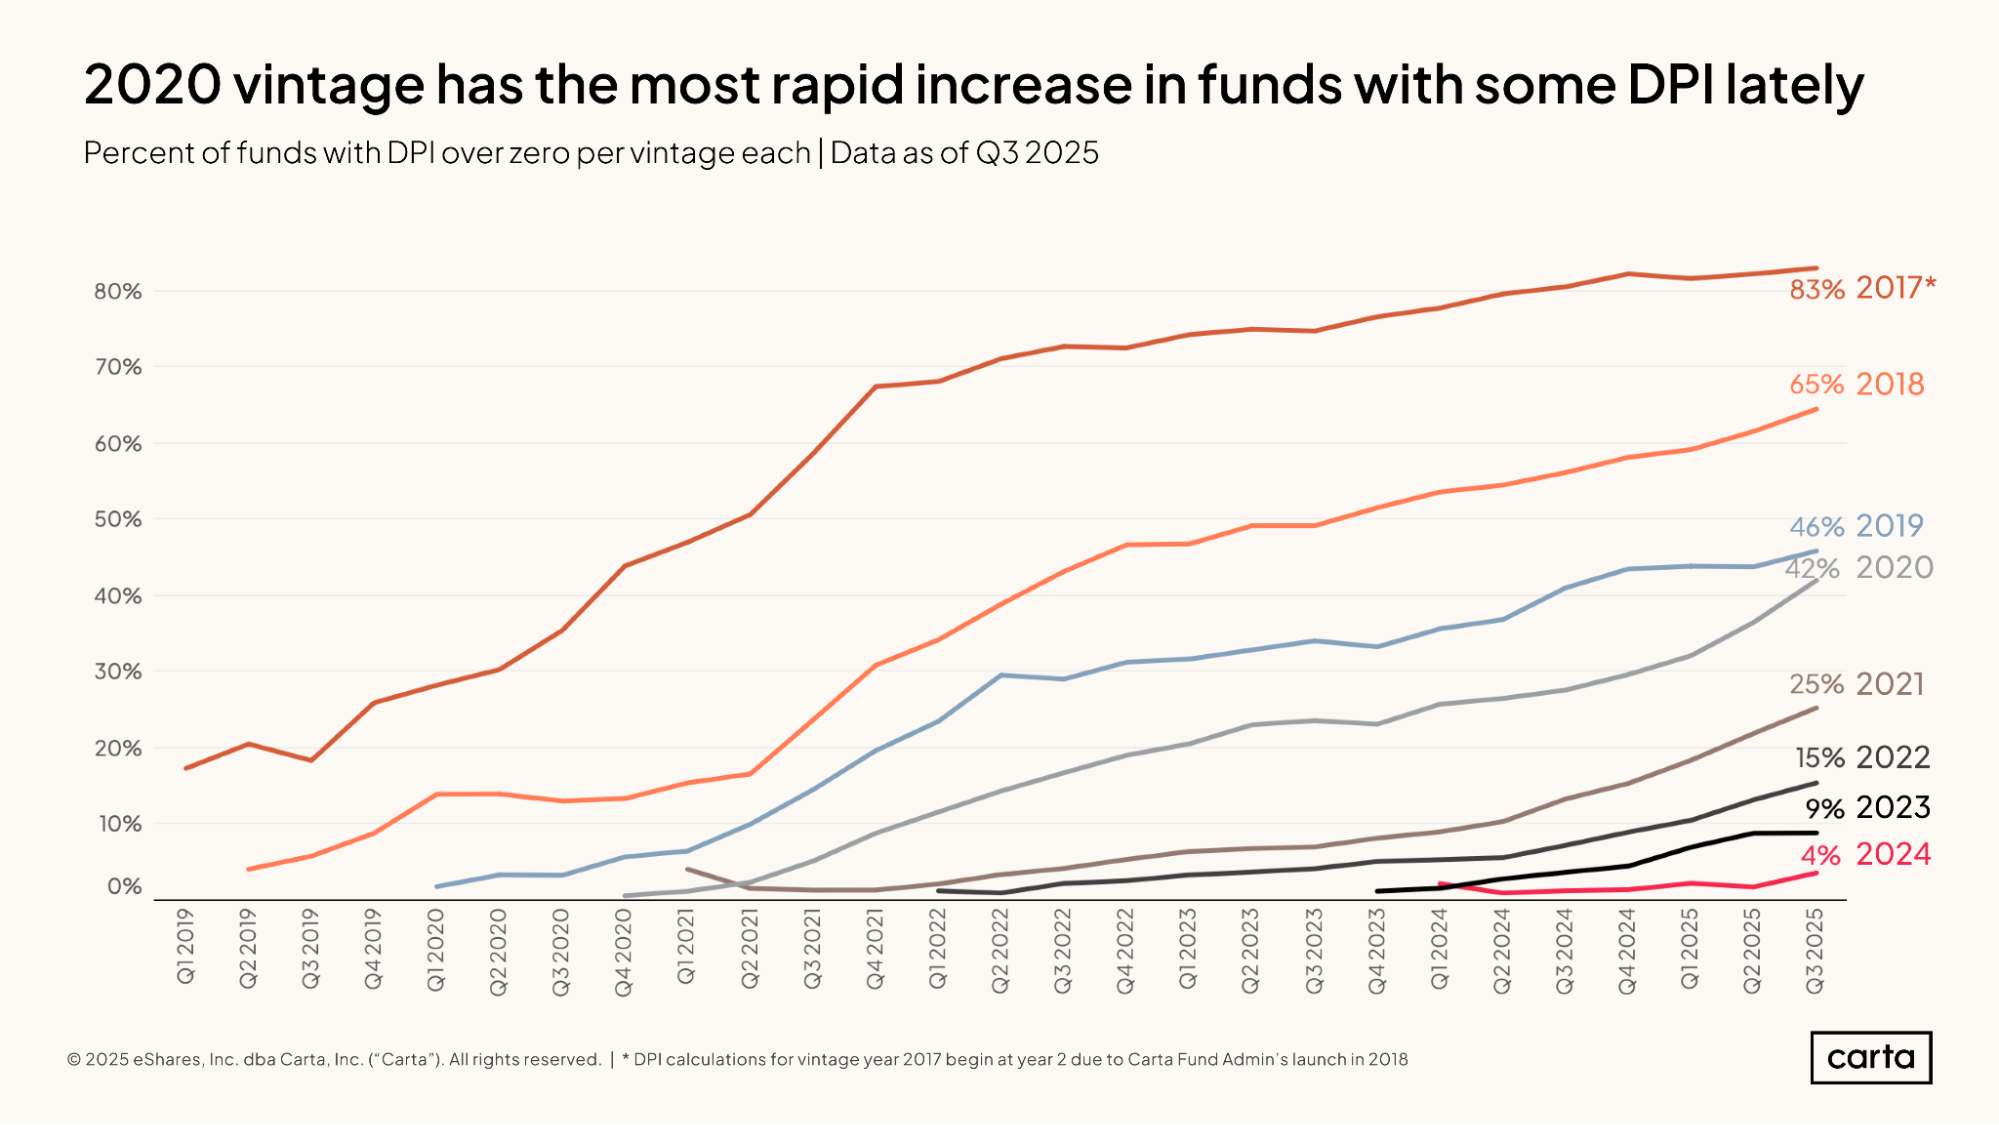
Overall, 83% of funds from the 2017 vintage have a current DPI above zero. Each successive vintage shown here has a lower percentage of funds with a positive DPI, all the way down to the 2024 vintage, among which just 4% of funds have begun to issue distributions to their investors.
The 2020 vintage has seen a notable recent uptick in the percentage of funds that have started generating DPI, climbing from 28% to 42% over the past year. The 2021 vintage has also seen many funds issue distributions for the first time over the past 12 months, with the portion of funds with positive DPI rising from 14% to 25% year over year.
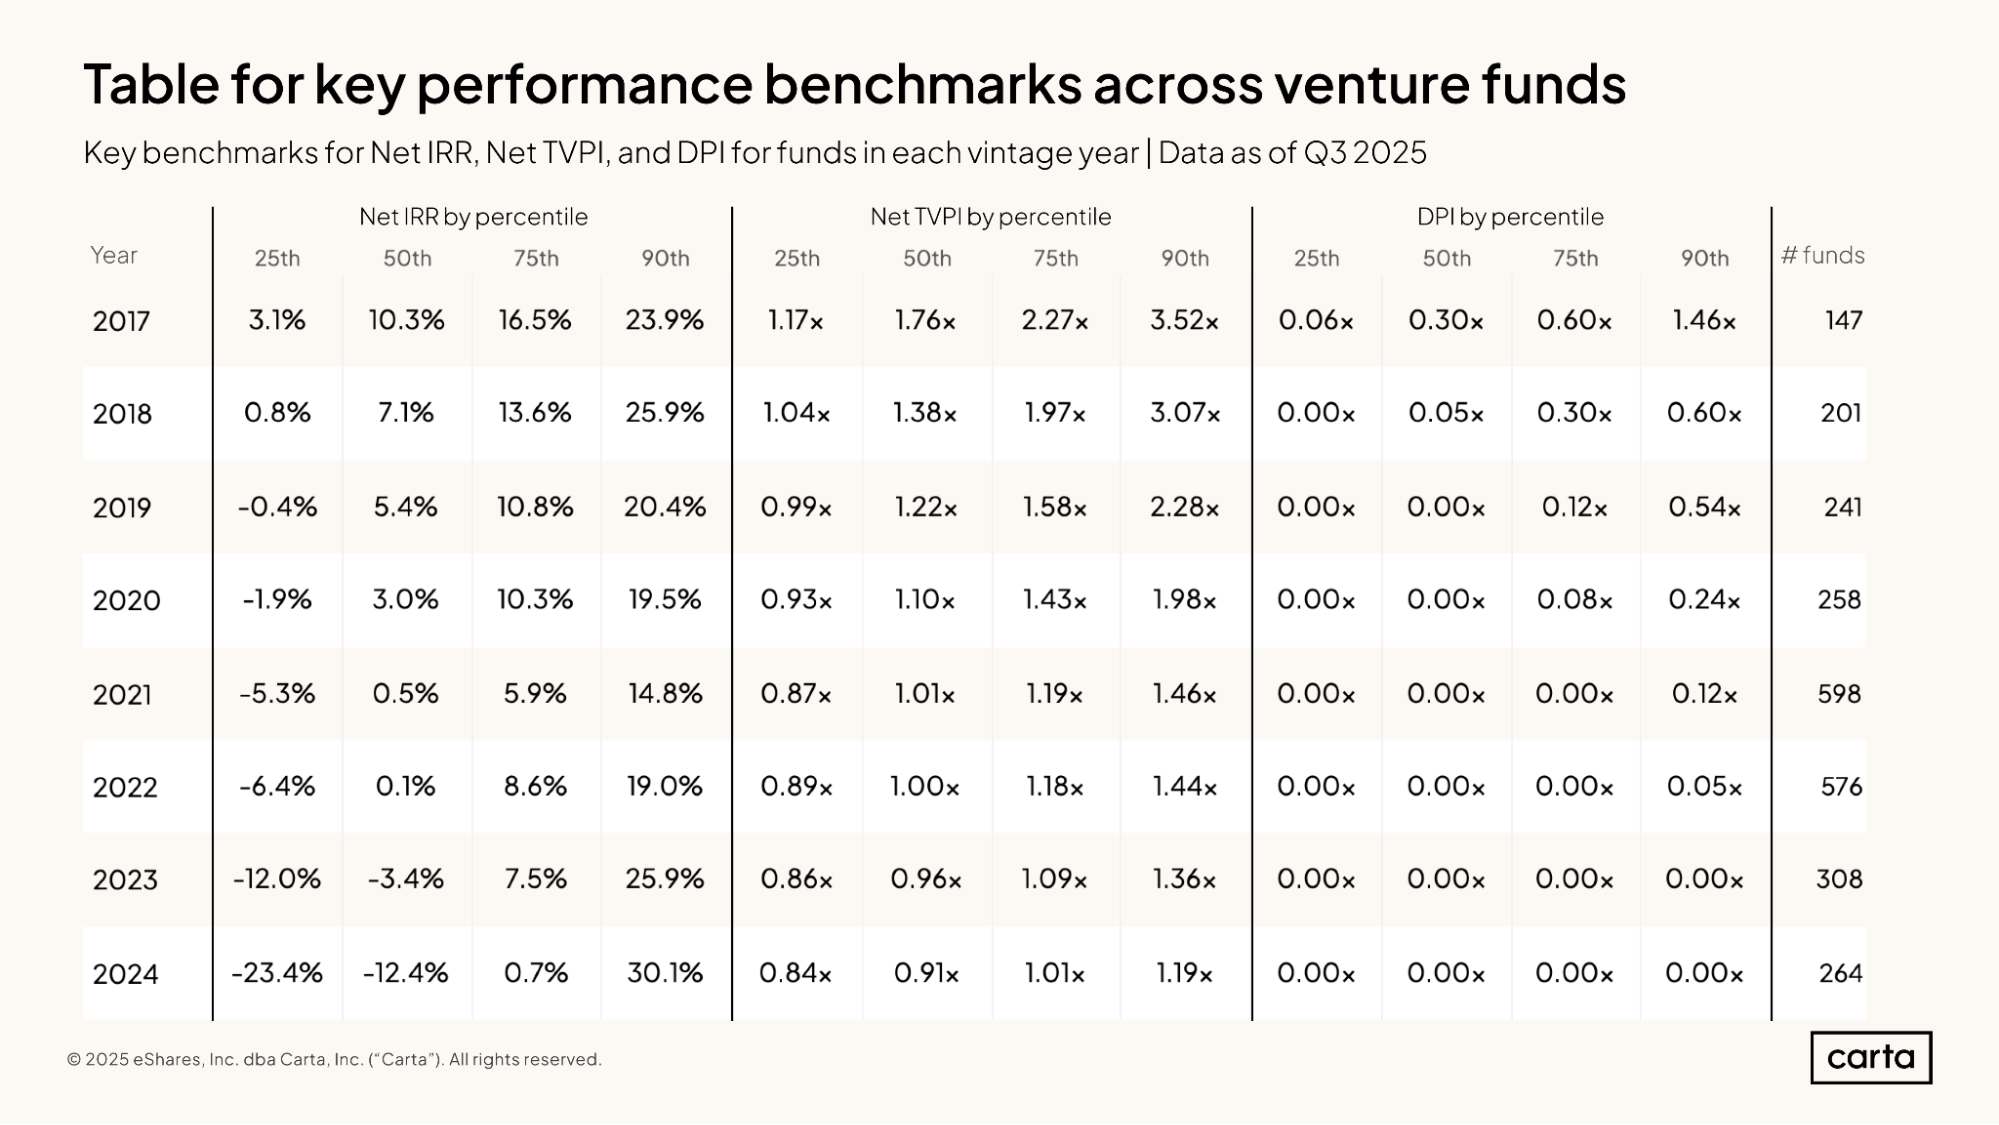
The above table compiles the latest Carta data on IRR, TVPI, and DPI in a single view, offering an easy way to compare different performance metrics within the same fund vintage and across different vintages.
A median venture fund from the 2017 vintage, for example, has a net IRR of 10.3%, a net TVPI of 1.76x, and a net DPI of 0.30x. A top-decile fund from 2017 easily outpaces those median numbers, with an IRR of 23.9%, TVPI of 3.52x, and DPI of 1.46x.
Market context
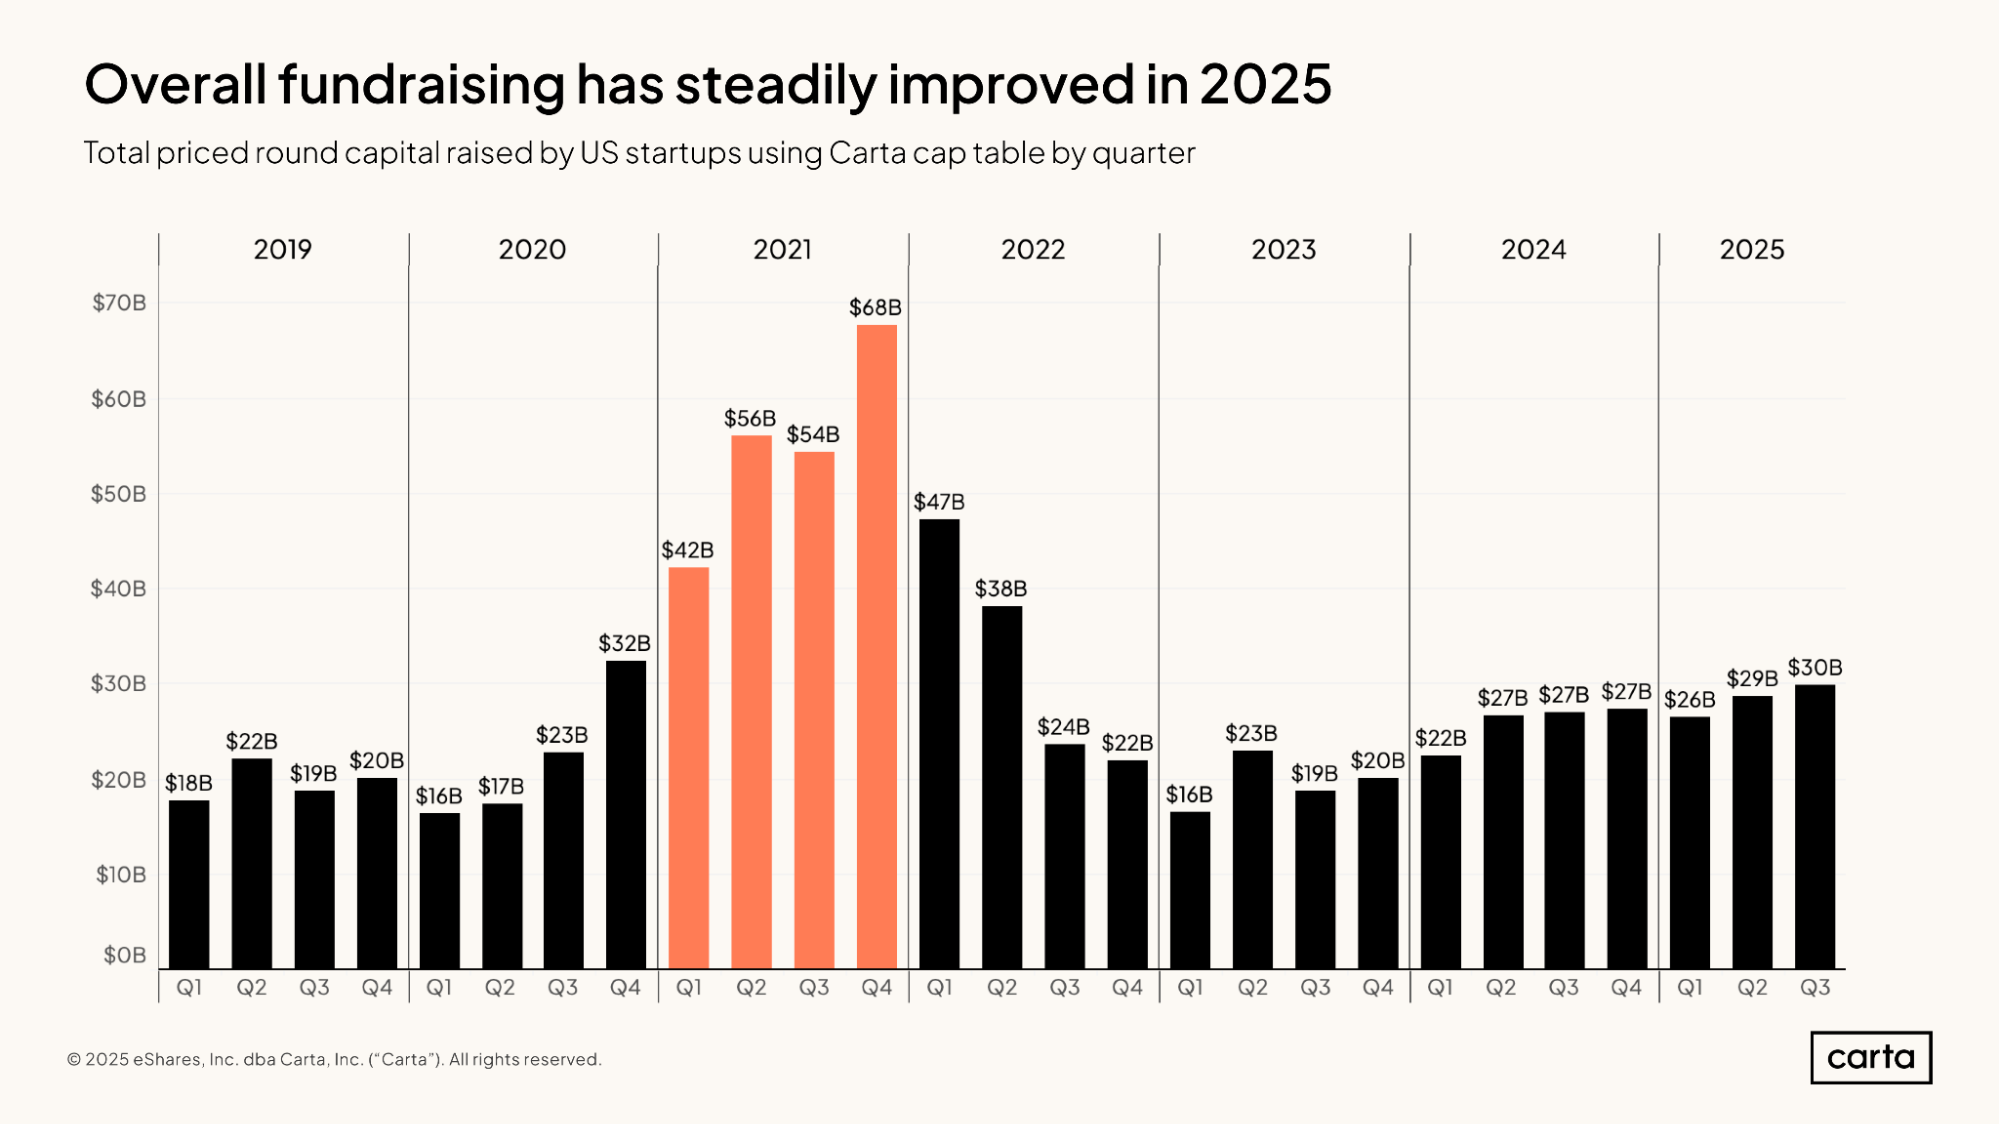
Overall venture fundraising totals keep trending up. Startups on Carta combined to raise about $30 billion in new capital in Q3 2025, the highest quarterly total since Q2 2022, at the tail end of the industry’s pandemic-era bull market. Quarterly cash raised has now nearly doubled since Q1 2023, the market’s recent low point.
While the latest totals still lag well behind the record-breaking fundraising sums seen in 2021 and early 2022, they’re also easily surpassing totals from 2019 and most of 2020. Compared to anything other than what was the busiest stretch in VC history, the current fundraising market looks robust.
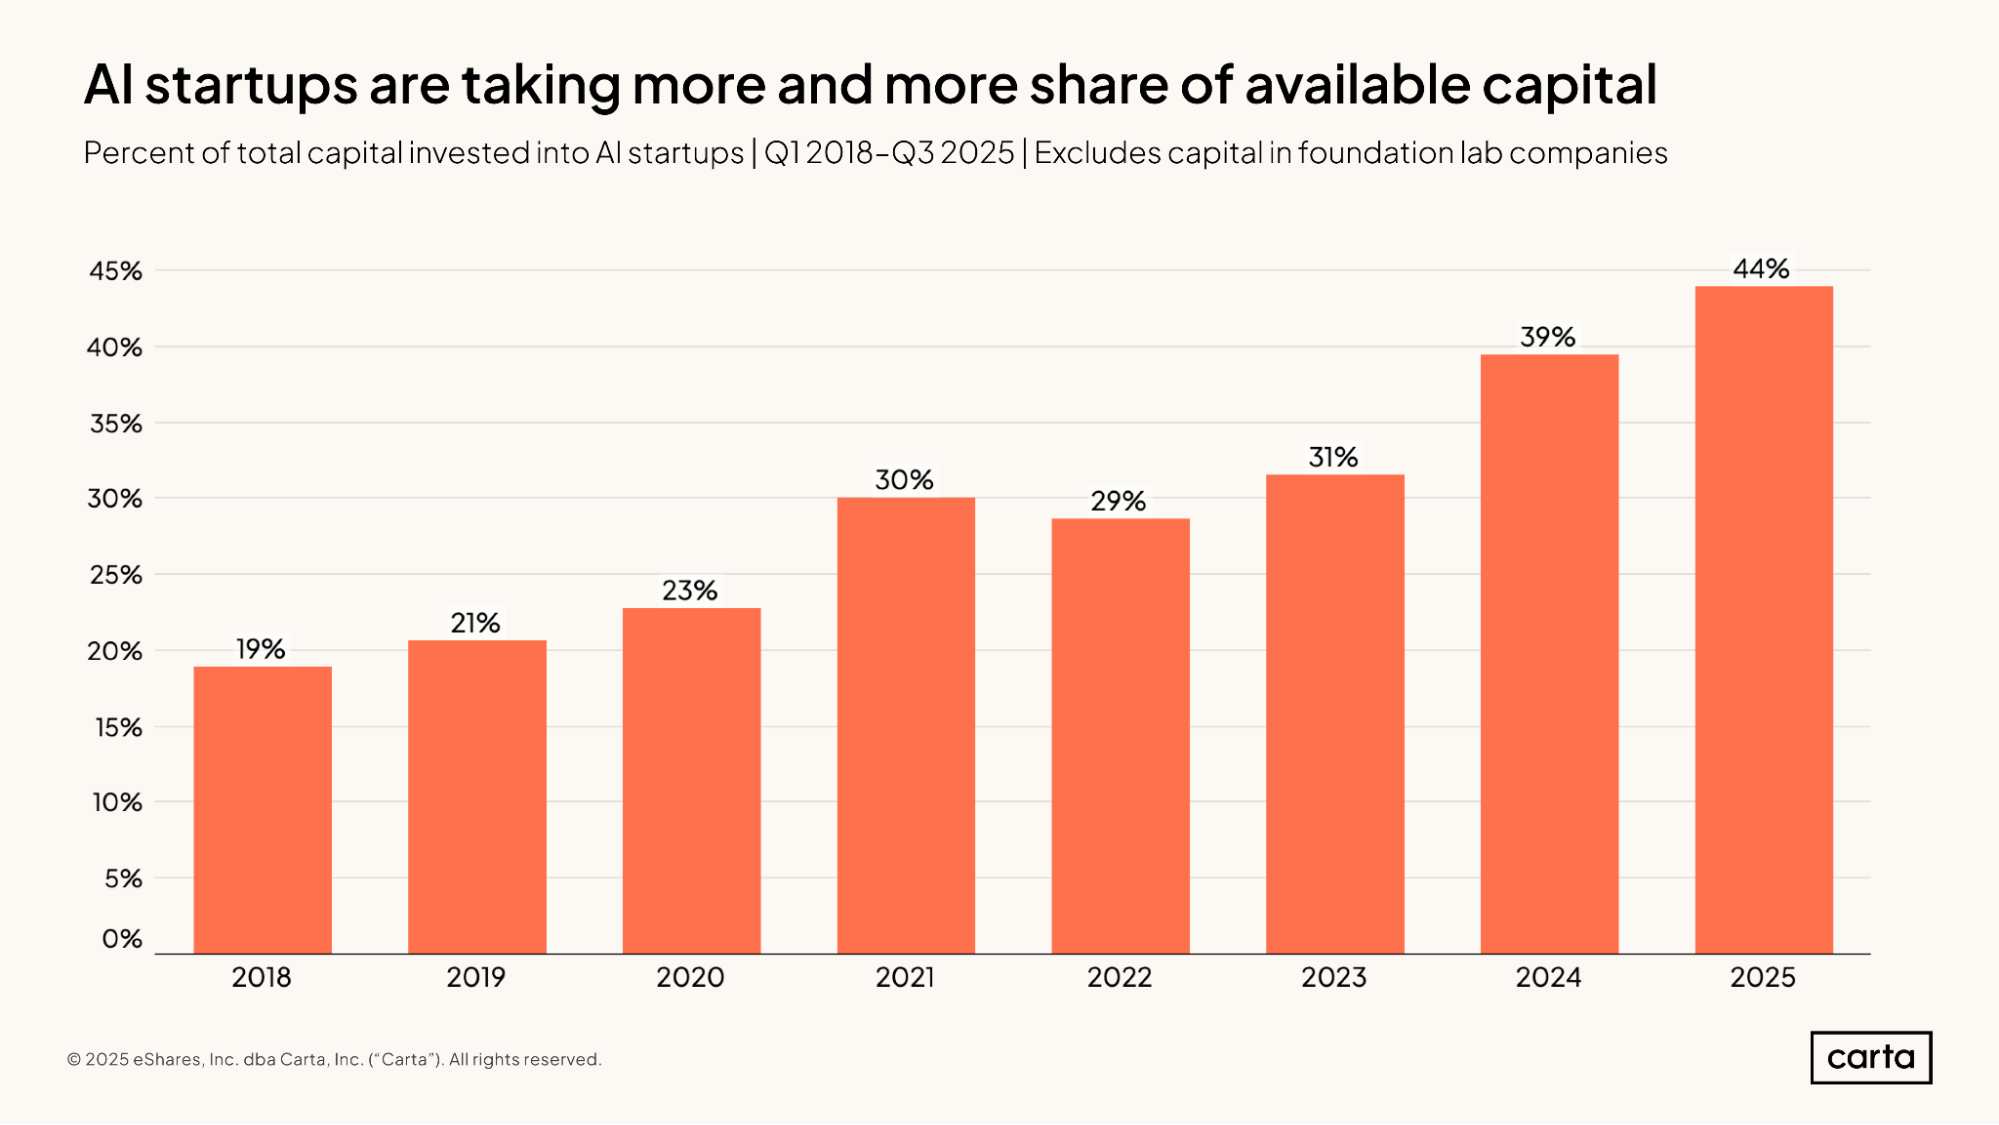
This current robustness in the VC market is due in large part to the rise of AI. Even excluding the mega-sums raised by companies building the largest foundational models, AI startups have accounted for 44% of all cash raised on Carta so far in 2025, up from 39% in 2024. Five years ago, just 23% of cash raised went to AI startups.
The investors pouring cash into the AI industry are hunting for targets that are well positioned to capitalize on what most feel will prove to be a generation-defining set of new technologies and tools. If this trend continues, AI startups may soon be responsible for an outright majority of all venture fundraising.
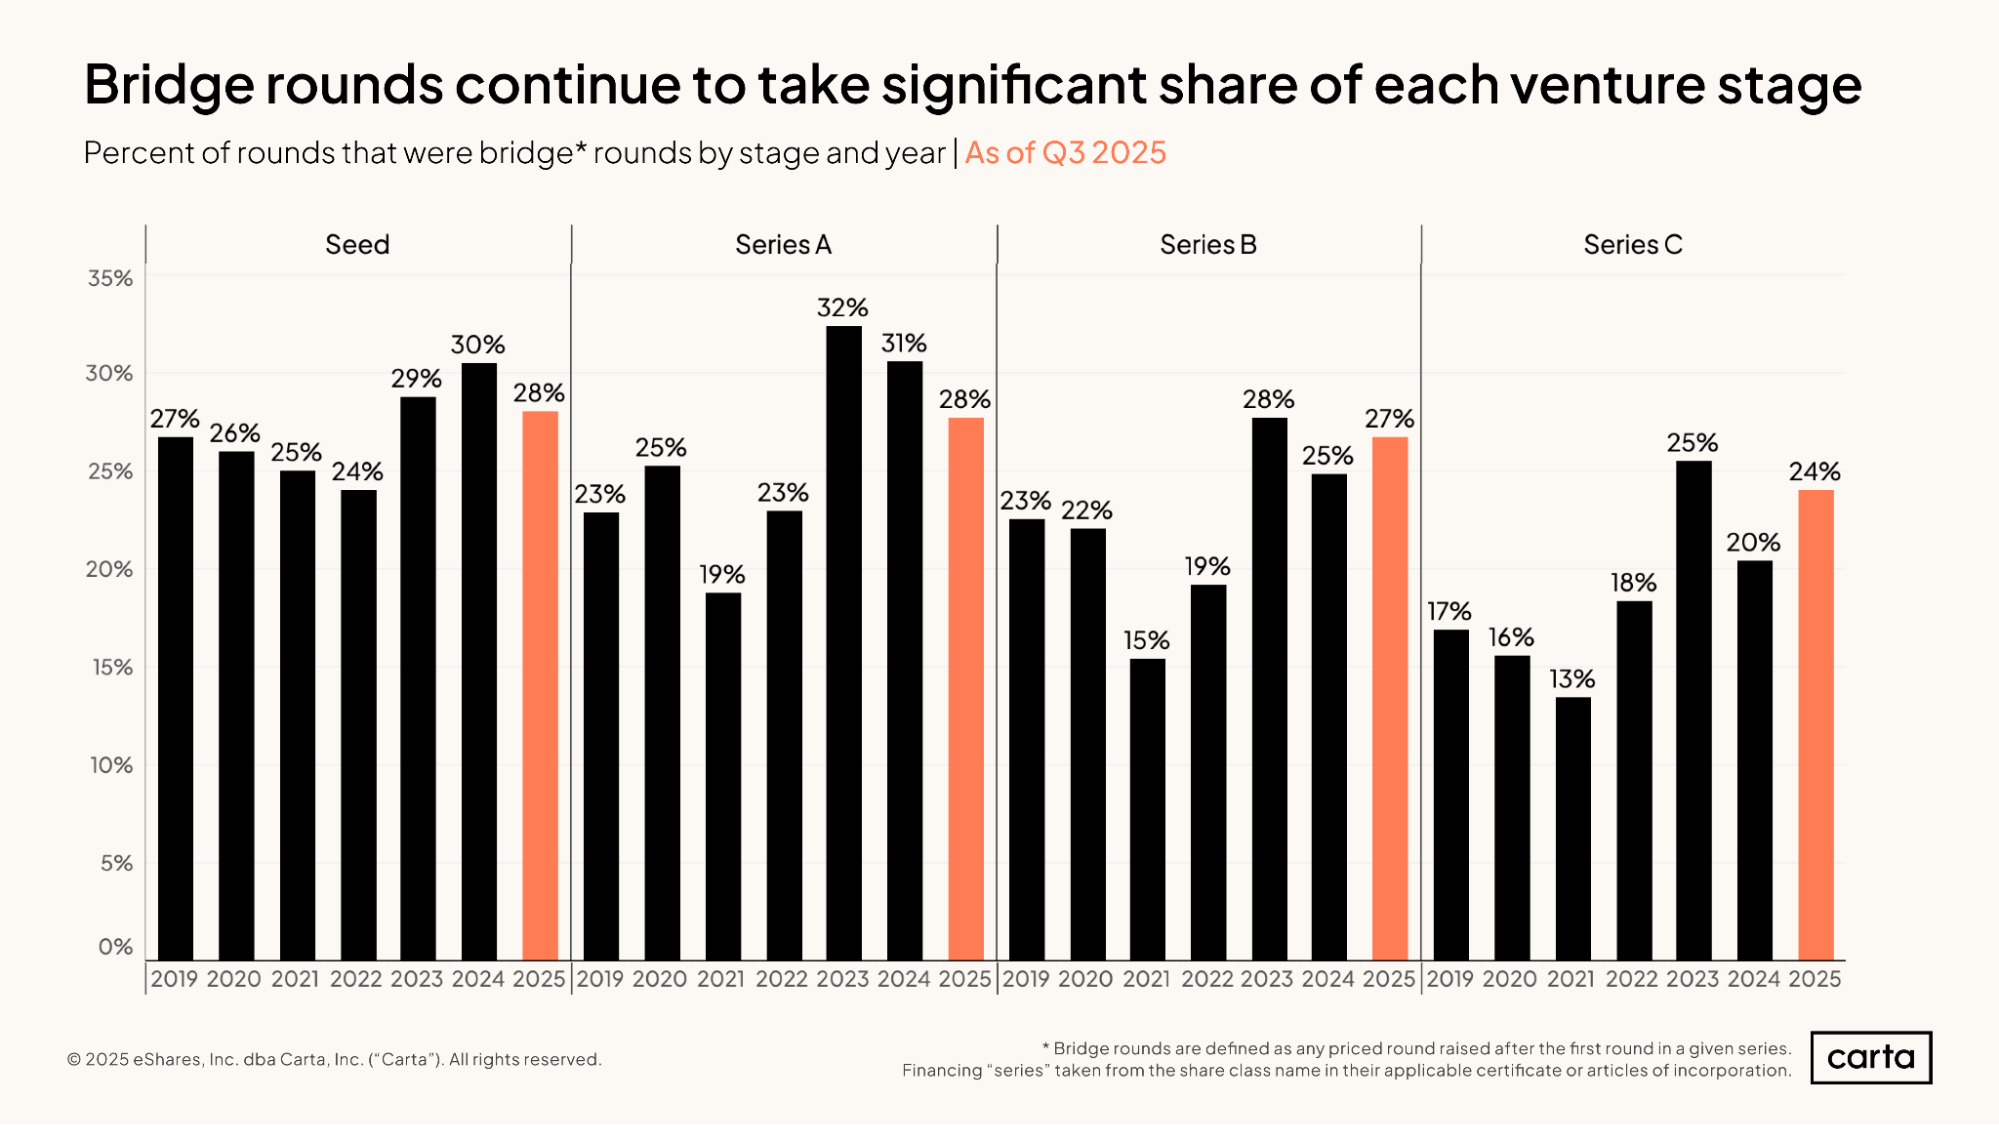
At every stage from seed through Series C, the percentage of all new funding events that are bridge rounds has begun to decline in the past two years from recent highs. Yet at both Series B and Series C, the frequency of bridge rounds has again ticked up in 2025. And compared to the previous six years, the frequency of bridge rounds at all four of these stages remains relatively high.
At Series A, for instance, about 28% of rounds raised so far in 2025 were bridge rounds. That’s lower than the bridge-round rates from either 2023 or 2024, but higher than the rate in any year from 2019 through 2022. At both Series B and Series C, 2025 has seen the second-highest rate of bridge rounds for any year since 2019.
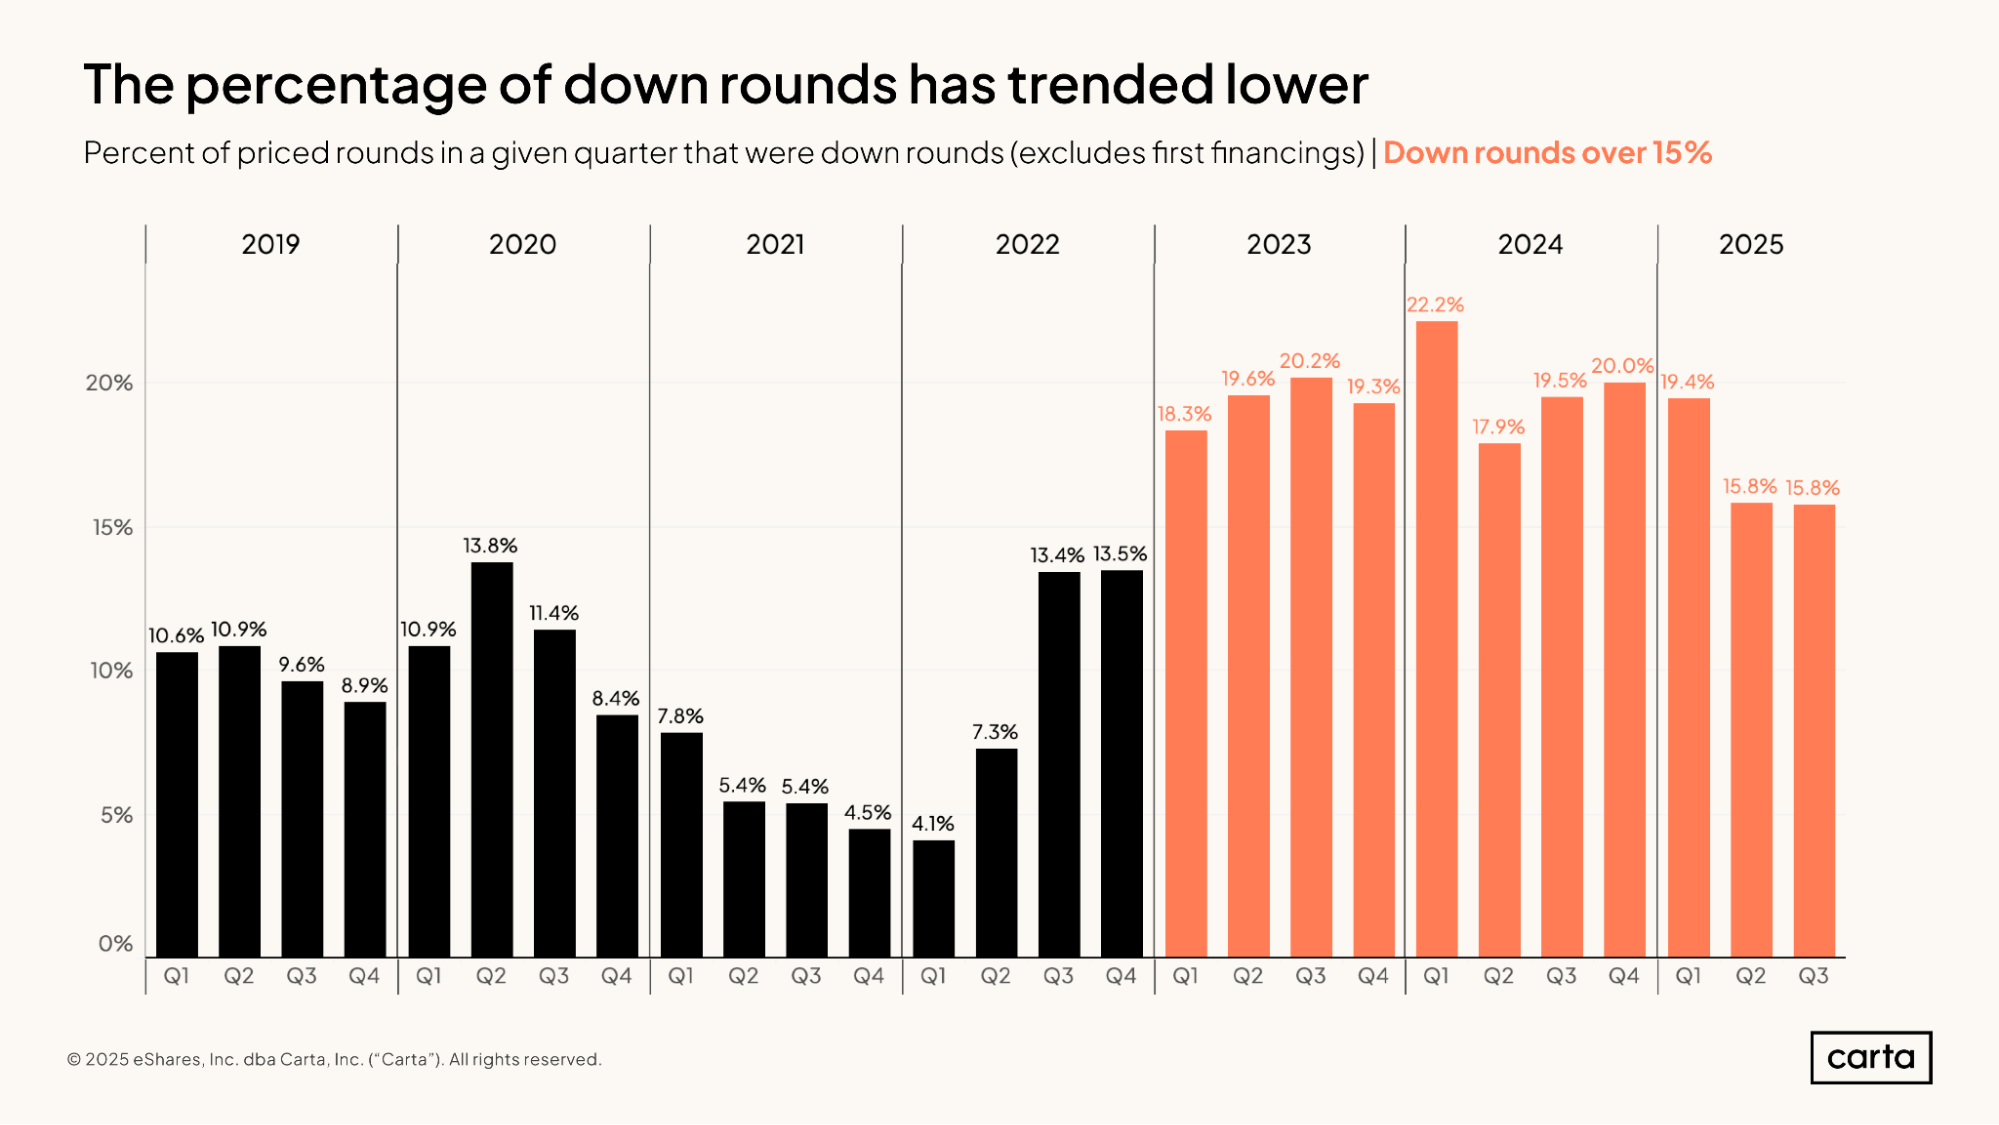
In each of the past two quarters, fewer than 16% of all priced funding rounds on Carta were down rounds—the lowest percentage since 2022. Before Q2 of this year, the down-round rate had landed at 19% or higher in seven of the previous eight quarters.
In the past two-plus years, the rate of down rounds soared as a response to the broader valuation reset that took place in the venture market, with many startups struggling to live up to the prices they were able to garner amid the white-hot funding landscape of 2020 and 2021. Now, this new valuation climate has been in place long enough that the market is beginning to adjust.
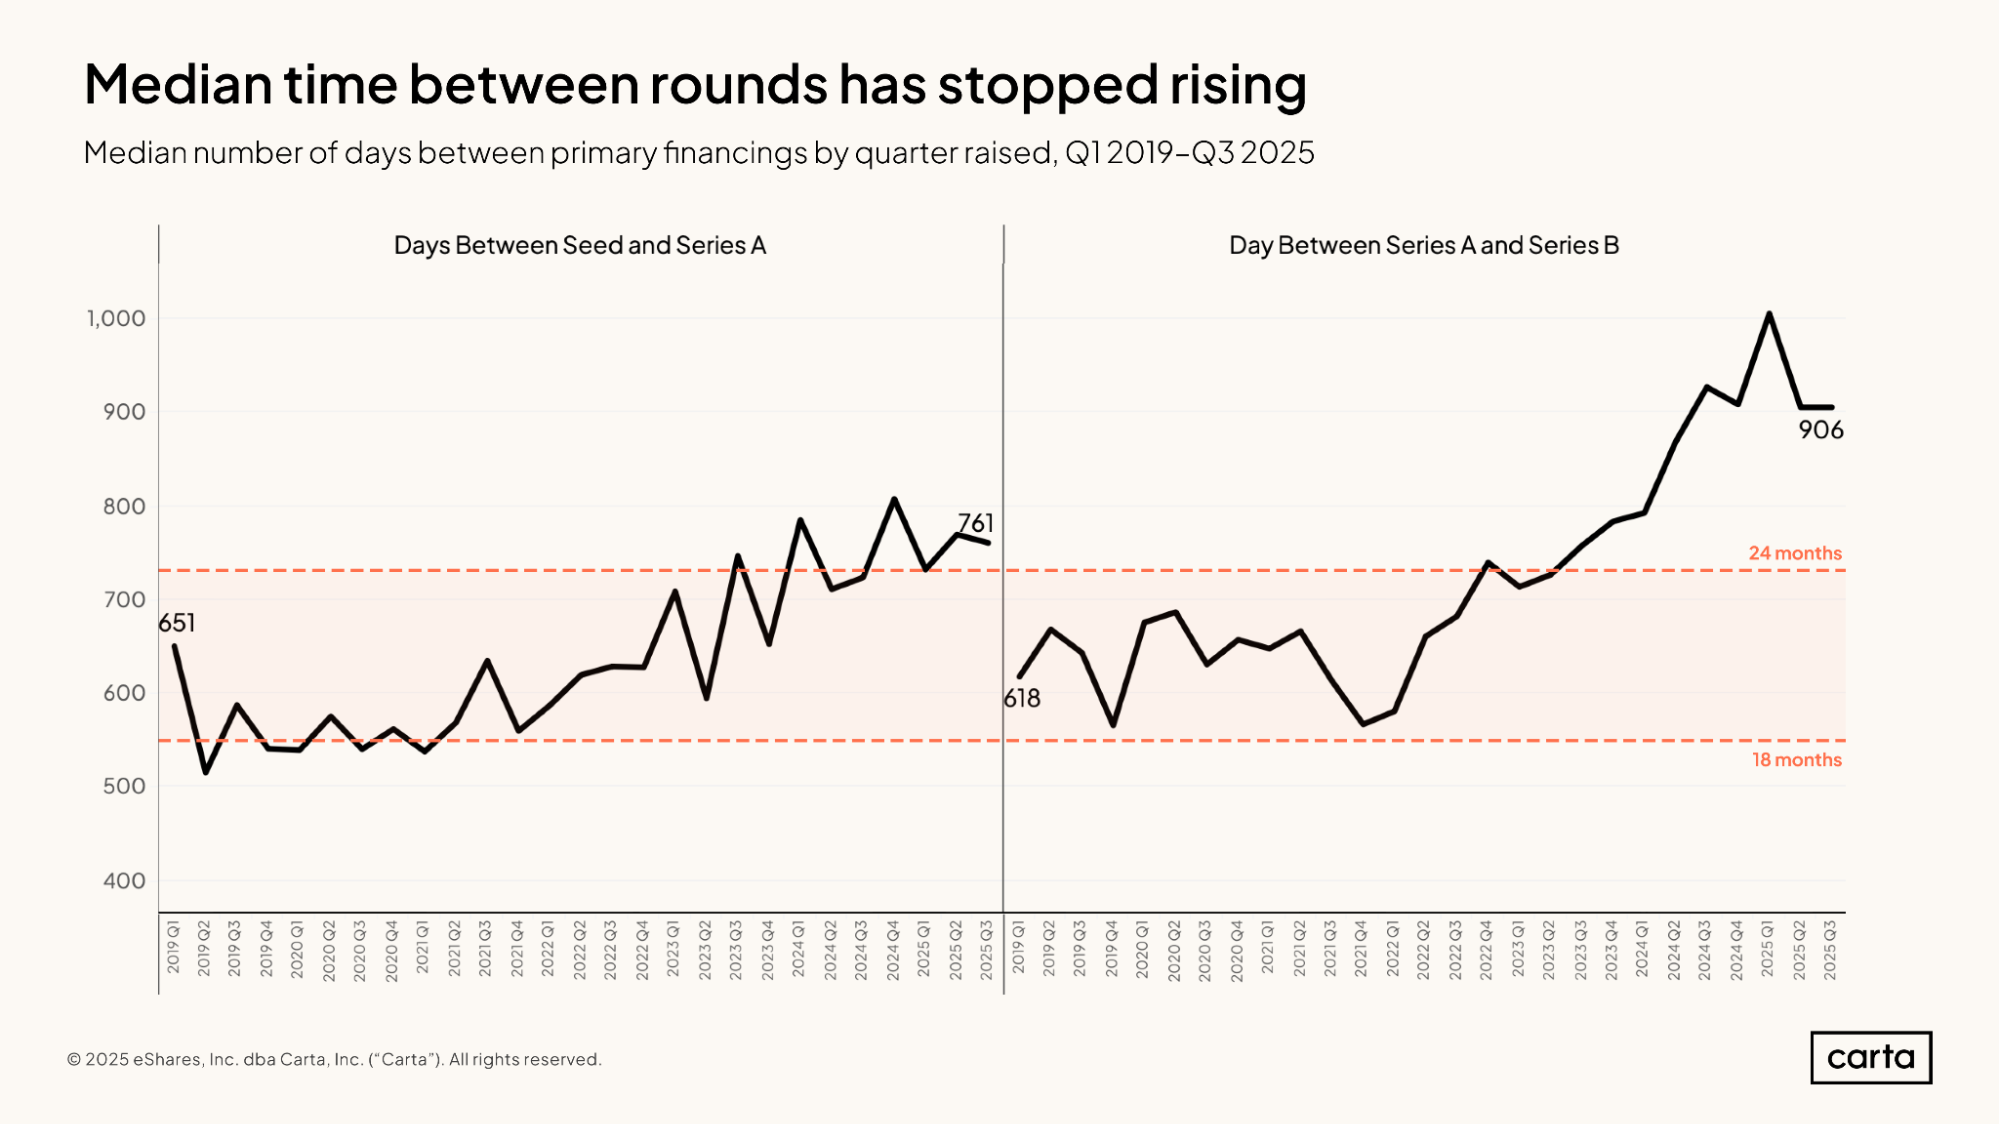
Among startups that raised a Series A round in Q3 2025, the median interval since the company’s seed round was 761 days, or about 25 months. This marked the second time in the past three quarters that the median time between these two fundraising stages has declined.
Among startups that raised a Series B last quarter, the median period since a Series A round landed at 906 days, or about 30 months. This was the second straight quarter in which the typical gap between these two fundraising stages has either declined or held steady.
The typical times between a seed and a Series A and between a Series A and a Series B have both risen significantly over the past four years. Two quarters alone don’t make a trend, but this most recent data could be a sign that this period of steadily lengthening intervals between funding rounds is coming to an end.
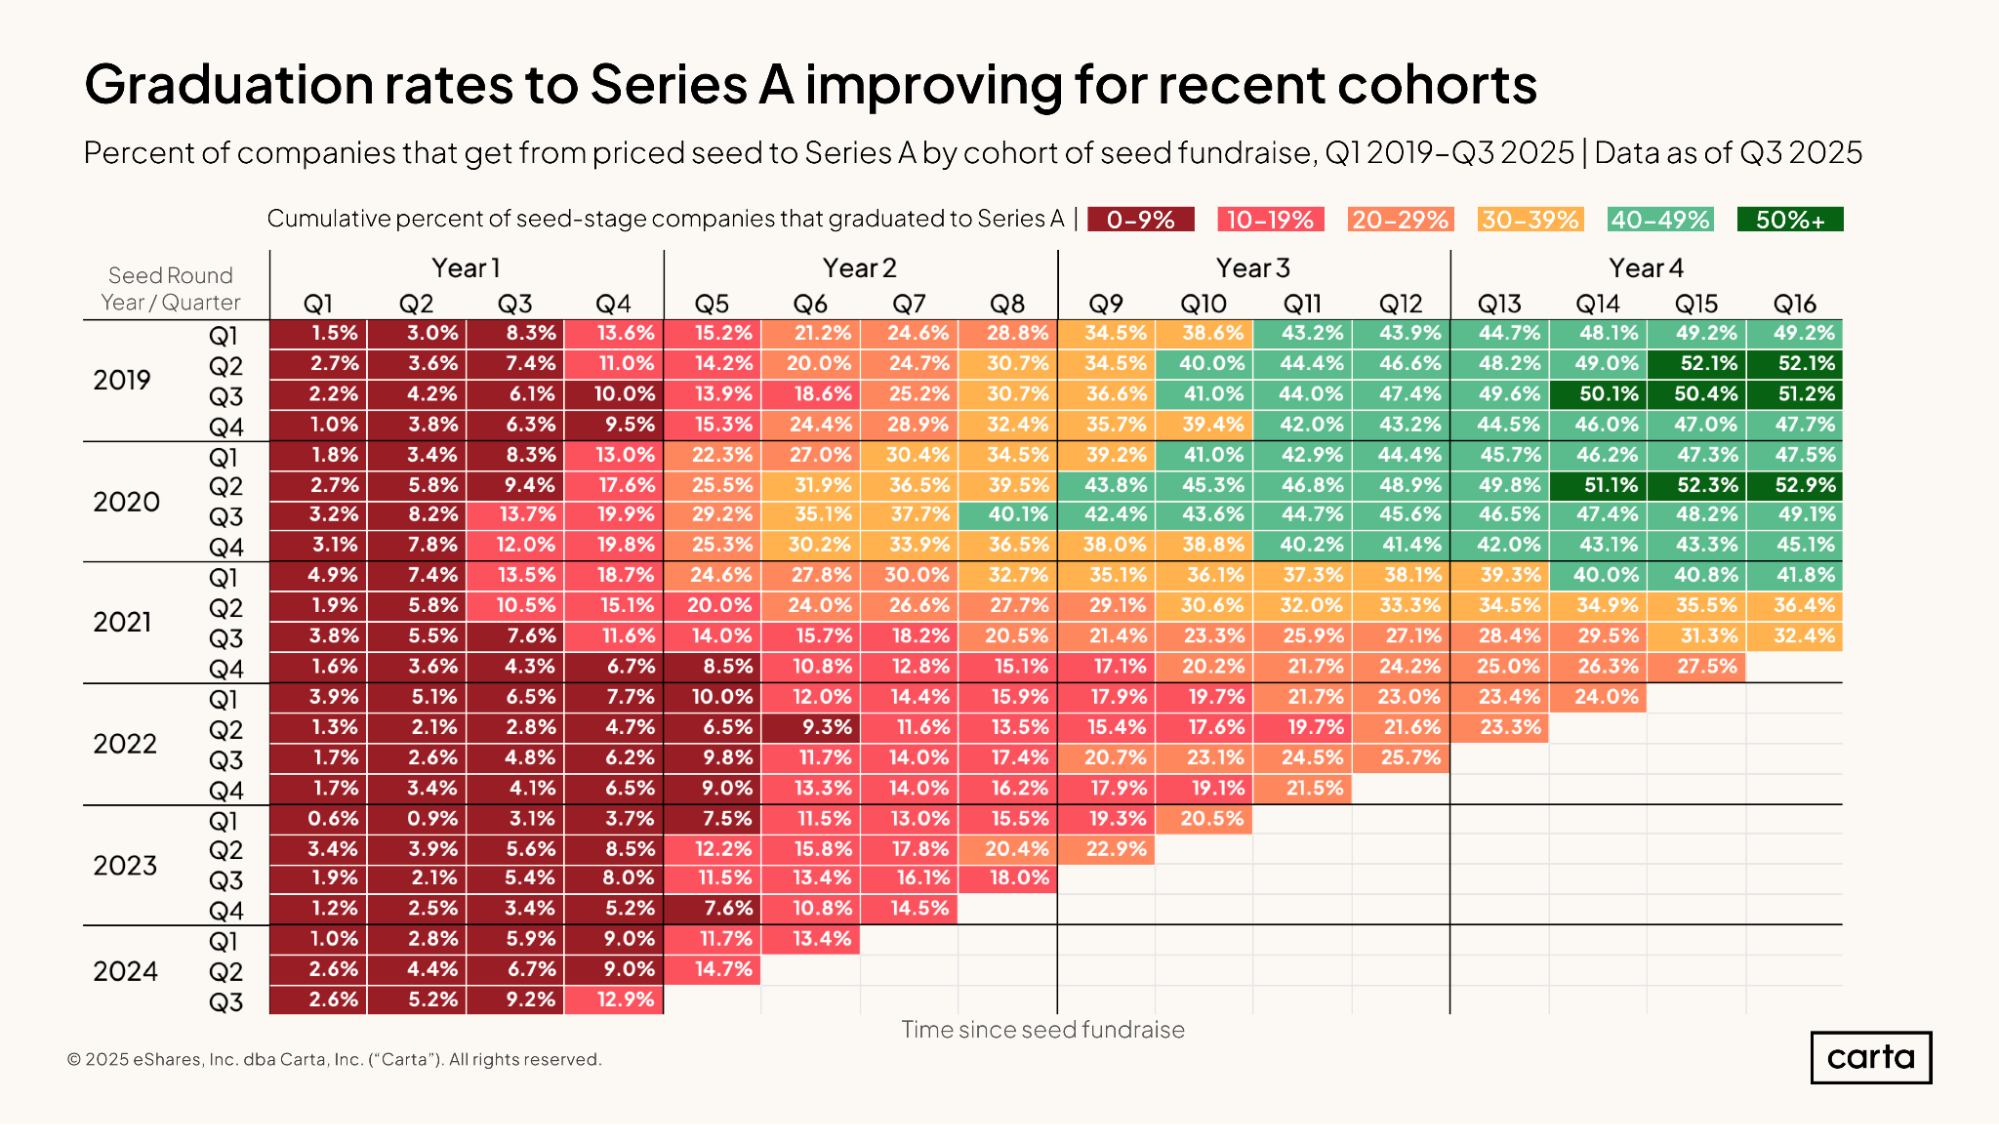
The above table shows the percentage of startups that raised a seed round in a given quarter that went on to raise a Series A round by certain thresholds in time. In the top row, for instance, we can see that 1.5% of all startups on Carta that raised a seed round in Q1 2019 went on to raise their Series A round within one quarter. About 28.8% of the companies in this cohort raised a Series A within eight quarters, and 49.2% did so within 16 quarters.
In general, companies that raised seed rounds in 2019 and 2020 proved much more likely to raise a Series A within two or three years than companies that raised a seed round in 2021 or 2022. This aligns with the preceding data on time between rounds, with the typical startup waiting longer to raise a Series A than it used to.
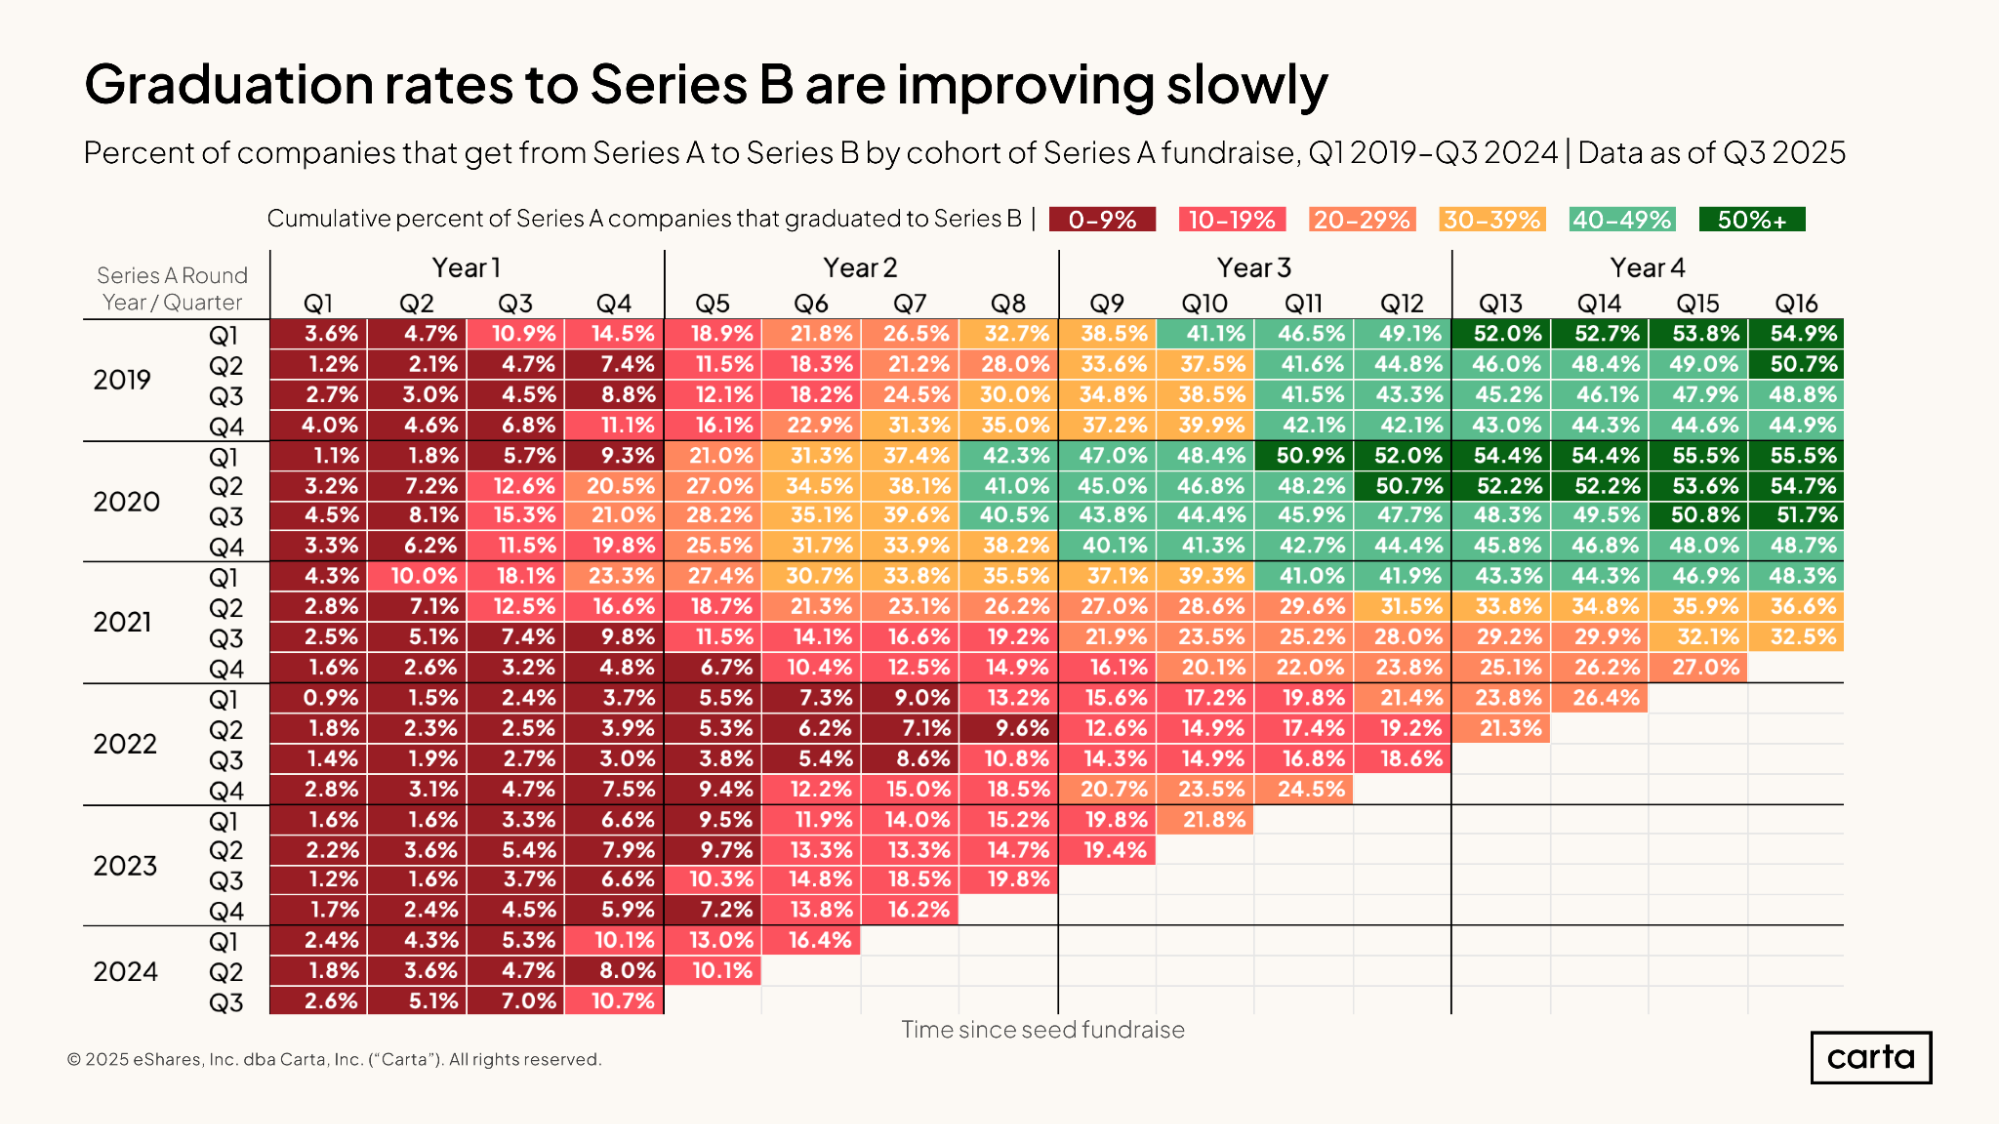
This same trend can be found among startups moving from Series A to Series B: Startups that raised a Series A in 2019 or 2020 were much more likely to raise a Series B within two or three years than startups that raised a Series A in later years.
More recently, however, this trend has perhaps begun to shift back in the opposite direction, at least in some cohorts. For example, about 24.5% of companies that raised a Series A in Q4 2022 had raised a Series B within 11 quarters, compared to just 16.8% of companies that raised a Series A in Q3 2022 or 17.4% of companies that did so in Q2 2022.
Methodology
Carta helps over 2,500 venture firms administer more than $150 billion in capital. We're setting a new standard in fund administration by sharing insights from our unmatched dataset about the private markets and venture ecosystem to help investors and limited partners make informed decisions and understand market conditions.
Overview
This study uses an aggregated and anonymized sample of Carta fund customer data. Funds that have contractually requested that we not use their data in anonymized and aggregated studies are not included in this analysis.
We use data through the end of Q3 2025. Historical data may change in future studies because there is typically an administrative lag between the time an event took place and when it is recorded in Carta. In addition, new funds signing up for Carta’s services will increase historical data available for the report.
Fund details
This report only includes funds domiciled in the United States. All funds must have reliable performance data dating back to fund inception and/or when they joined the Carta platform. Included funds are direct investors into startups and do not pursue fund of funds or other strategies. Only funds in vintage years between 2017 and 2025 were included. Funds must have at least $1M in AUM to be included.
We define vintage year as the year in which the first cost basis (either conversion or new investment) for a fund occurred.
Performance over time
In charts that use the quarters since vintage began framing, we limited the analysis to the most recent quarter in which all funds in a given vintage year had valid performance data. As such, these figures may not exactly match the performance data displayed in charts without a similar time-series framing.
Financings
Financings include equity deals raised in USD by U.S.-based corporations. The financing “series” (e.g., Series A) is taken from the share class name in their applicable certificate or articles of incorporation. Financing rounds that don’t follow this standard are not included in any data shown by series but are included in data not shown by series. Primary rounds are defined as the first equity round within a series. Bridge rounds are defined as any round raised after the first round in a given series.


DISCLOSURE: This communication is on behalf of eShares, Inc. dba Carta, Inc. ("Carta"). This communication is for informational purposes only, and contains general information only. Carta is not, by means of this communication, rendering accounting, business, financial, investment, legal, tax, or other professional advice or services. This publication is not a substitute for such professional advice or services nor should it be used as a basis for any decision or action that may affect your business or interests. Before making any decision or taking any action that may affect your business or interests, you should consult a qualified professional advisor. This communication is not intended as a recommendation, offer or solicitation for the purchase or sale of any security. Carta does not assume any liability for reliance on the information provided herein. © 2026 Carta. All rights reserved. Reproduction prohibited.