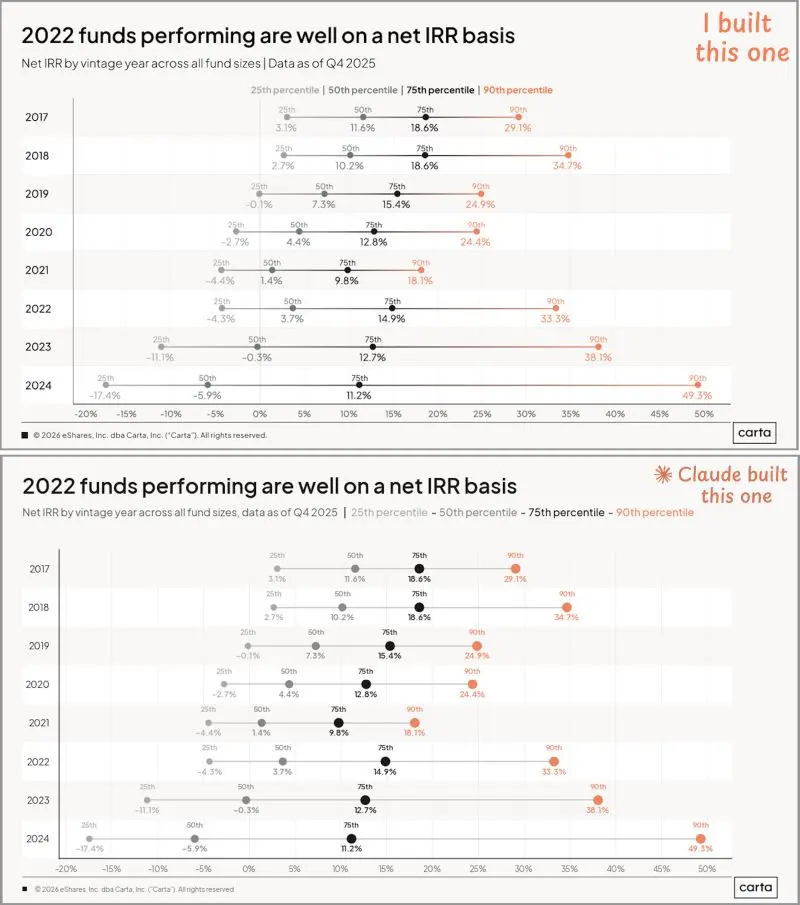
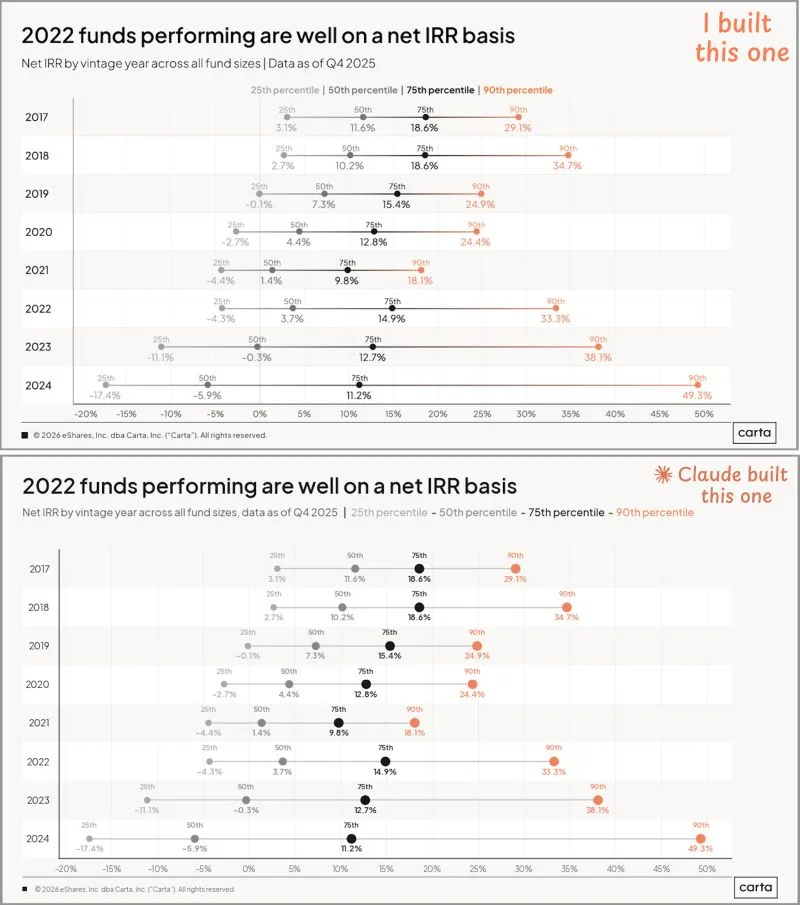
I built the top chart: Snowflake --> Tableau --> Figma --> Publish
Claude built the bottom chart: ...with Claude.
I've been fighting with the model to build a version of our data insights content I'd be proud to publish without a lot of back and forth.
Soon it will be ready. And then quickly after that we'll see an explosion of quality data storytelling on startup data at the speed of ideas.
And then we can build you data for your pitch meeting or your AGM or your market update or your LP presentation, custom to your world, effectively on demand.
Psyched.

DISCLOSURE: This communication is on behalf of eShares, Inc. dba Carta, Inc. ("Carta"). This communication is for informational purposes only, and contains general information only. Carta is not, by means of this communication, rendering accounting, business, financial, investment, legal, tax, or other professional advice or services. This publication is not a substitute for such professional advice or services nor should it be used as a basis for any decision or action that may affect your business or interests. Before making any decision or taking any action that may affect your business or interests, you should consult a qualified professional advisor. This communication is not intended as a recommendation, offer or solicitation for the purchase or sale of any security. Carta does not assume any liability for reliance on the information provided herein. © 2026 Carta. All rights reserved. Reproduction prohibited.