How to build insights content that goes viral.
𝗖𝗼𝗹𝗹𝗲𝗰𝘁, 𝗰𝗹𝗲𝗮𝗻, 𝗮𝗻𝗱 𝗺𝗼𝗱𝗲𝗹 𝘆𝗼𝘂𝗿 𝗱𝗮𝘁𝗮 𝘁𝗵𝗲𝗻 𝗽𝗶𝗽𝗲 𝗶𝗻𝘁𝗼 𝘆𝗼𝘂𝗿 𝘃𝗶𝘀𝘂𝗮𝗹𝗶𝘇𝗮𝘁𝗶𝗼𝗻 𝘁𝗼𝗼𝗹.
So clearly not actually one step. In many companies this will not be the exclusive role of the Insights team. Become friends with the Data team!
𝗕𝘂𝗶𝗹𝗱 𝘆𝗼𝘂𝗿 𝘃𝗶𝘇 (𝗜 𝘂𝘀𝗲 𝗧𝗮𝗯𝗹𝗲𝗮𝘂, 𝗯𝘂𝘁 𝗙𝗹𝗼𝘂𝗿𝗶𝘀𝗵 𝗶𝘀 𝗴𝗼𝗼𝗱 𝗼𝗿 𝗗𝗮𝘁𝗮𝘄𝗿𝗮𝗽𝗽𝗲𝗿)
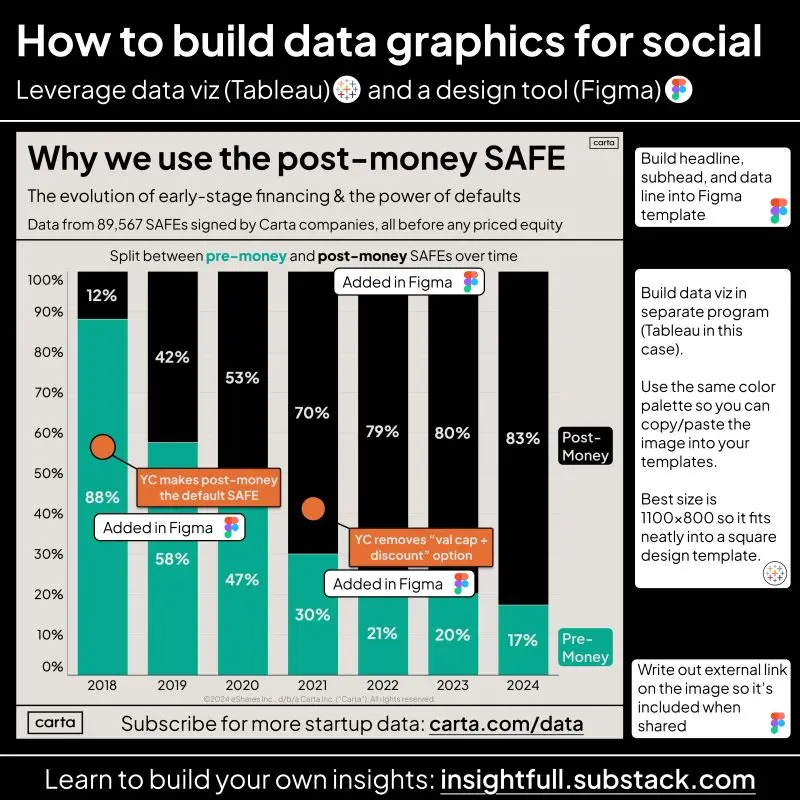
Make strong choices about design, in particular font and color, before building any visual. At Carta, we work primarily in a two-tone color scheme where either could be the background or foreground colors. Pick a font where numbers are easy to read and condensed.
Reminder - there’s absolutely nothing wrong with the bar chart! In fact, I’d say 50% of the graphics I create for Carta use some form of bar or line chart. Simple, clear, compelling.
𝗧𝗿𝘆 𝗺𝘂𝗹𝘁𝗶𝗽𝗹𝗲 𝘃𝗶𝘇 𝗶𝗱𝗲𝗮𝘀 𝗯𝗲𝗳𝗼𝗿𝗲 𝗽𝘂𝗯𝗹𝗶𝘀𝗵𝗶𝗻𝗴.
You are building a graphic to attract attention online, not to follow all best practices in data visualization.
Building multiple charts with the same data over time will sharpen your sense of data viz aesthetics and allow you to create better stuff faster.
𝗣𝗮𝘆 𝗮𝘁𝘁𝗲𝗻𝘁𝗶𝗼𝗻 𝘁𝗼 𝘁𝗵𝗲 𝘀𝗺𝗮𝗹𝗹 𝘀𝘁𝘂𝗳𝗳.
Does your chart need axis values and labels? Is it clear that the reader should sum percentages across a row or a column? Should every data point have a label or just the first and last? Good data viz is all about the details.
𝗔𝗱𝗱 𝗽𝗼𝗹𝗶𝘀𝗵 𝗯𝘆 𝗲𝘅𝗽𝗼𝗿𝘁𝗶𝗻𝗴 𝘆𝗼𝘂𝗿 𝗰𝗵𝗮𝗿𝘁 𝗶𝗻𝘁𝗼 𝗮 𝗱𝗲𝘀𝗶𝗴𝗻 𝘁𝗼𝗼𝗹 (𝗜 𝘂𝘀𝗲 𝗙𝗶𝗴𝗺𝗮)
Building standard templates in Figma gives your graphics a sense of consistency - you want your audience to understand at a glance, “oh that’s a Carta data graphic”.
Be sure to direct attention to the web URL you care about within the graphic itself, so if other people share it you still have the potential to add subscribers to your newsletter or traffic to the correct landing page.
𝗪𝗿𝗶𝘁𝗲 𝘆𝗼𝘂𝗿 𝗰𝗮𝗽𝘁𝗶𝘃𝗮𝘁𝗶𝗻𝗴 𝘁𝗲𝘅𝘁 𝗶𝗻 𝗟𝗶𝗻𝗸𝗲𝗱𝗜𝗻
Take the time to make your writing clear, concise, and authentic. Spend more time than you think your should on the first line.
Rinse and repeat (and don't worry if no one reads them for the first few months - keep posting).
More info on building Insights graphics and Insights teams here: https://lnkd.in/gUSE6UBX

DISCLOSURE: This communication is on behalf of eShares, Inc. dba Carta, Inc. ("Carta"). This communication is for informational purposes only, and contains general information only. Carta is not, by means of this communication, rendering accounting, business, financial, investment, legal, tax, or other professional advice or services. This publication is not a substitute for such professional advice or services nor should it be used as a basis for any decision or action that may affect your business or interests. Before making any decision or taking any action that may affect your business or interests, you should consult a qualified professional advisor. This communication is not intended as a recommendation, offer or solicitation for the purchase or sale of any security. Carta does not assume any liability for reliance on the information provided herein. © 2026 Carta. All rights reserved. Reproduction prohibited.