Why do the AI labs do so many chart crimes?
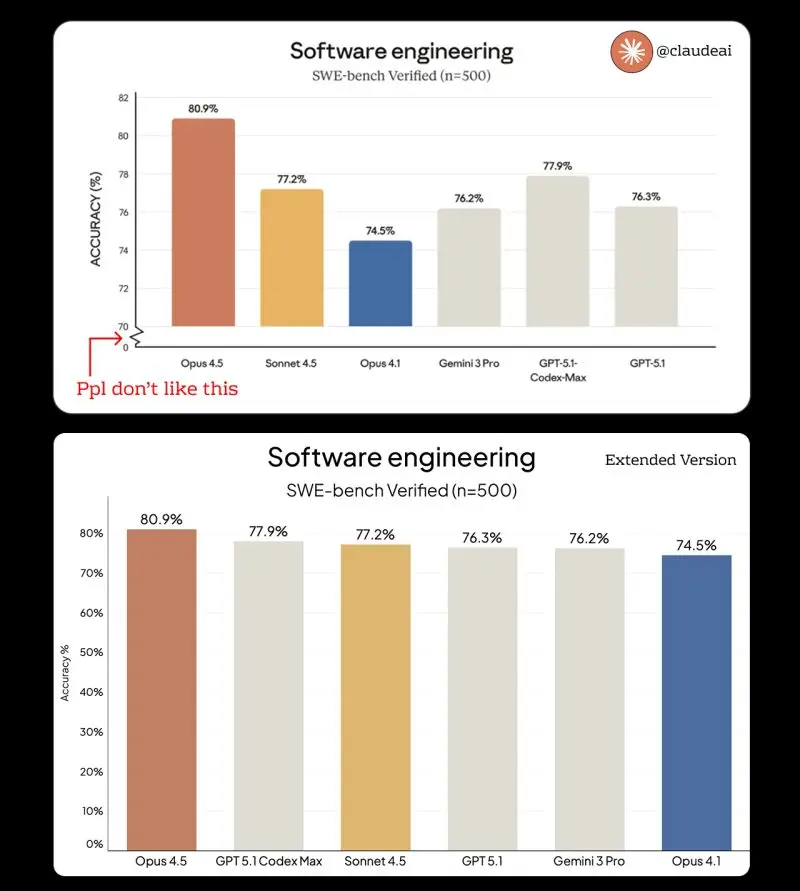
Messing with the y-axis is the easiest way to make people distrust your results.
It's the most common chart crime and it has a near universal annoyance rate.
(Personally I think there are some instances where starting the y-axis at something other than zero can make sense but...this wasn't one of them).
The other basic thing the Claude folks got wrong here is the bar ordering. Obviously they placed the three model results from their own company together, but it detracts from the ability to understand the relative placement of each model.
Just order them by accuracy %, simple.
Now does any of this truly matter? Maybe not. The results are the results.
But screwing up the graphic automatically introduces other narratives into the debate.
The point from the Claude team was "look how great our model is compared to the competition".
By adjusting the chart, they allowed folks to say "look how hard the Claude team had to work to make it appear as though their model is far ahead".
Charts = comms, don't muddle the message.

DISCLOSURE: This communication is on behalf of eShares, Inc. dba Carta, Inc. ("Carta"). This communication is for informational purposes only, and contains general information only. Carta is not, by means of this communication, rendering accounting, business, financial, investment, legal, tax, or other professional advice or services. This publication is not a substitute for such professional advice or services nor should it be used as a basis for any decision or action that may affect your business or interests. Before making any decision or taking any action that may affect your business or interests, you should consult a qualified professional advisor. This communication is not intended as a recommendation, offer or solicitation for the purchase or sale of any security. Carta does not assume any liability for reliance on the information provided herein. © 2026 Carta. All rights reserved. Reproduction prohibited.