Netflix dropped a cool new dataset yesterday showing exactly which shows drive viewing on the platform.
It's called What We Watched: A Netflix Engagement Report.
Covers 18,000+ shows and movies which collectively got viewed for over 100 billion hours.
The report got picked up in Ben Thompson's Stratechery newsletter (an absolute must-read for everyone in tech). Ben commented on how this data is just another example of the power-law scaling that dominates the Internet.
So had to take a quick pause from startup data and chart it.
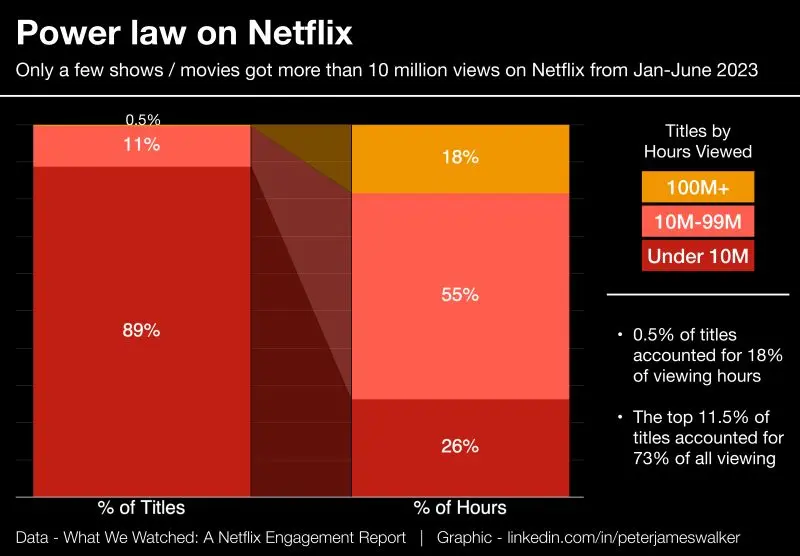
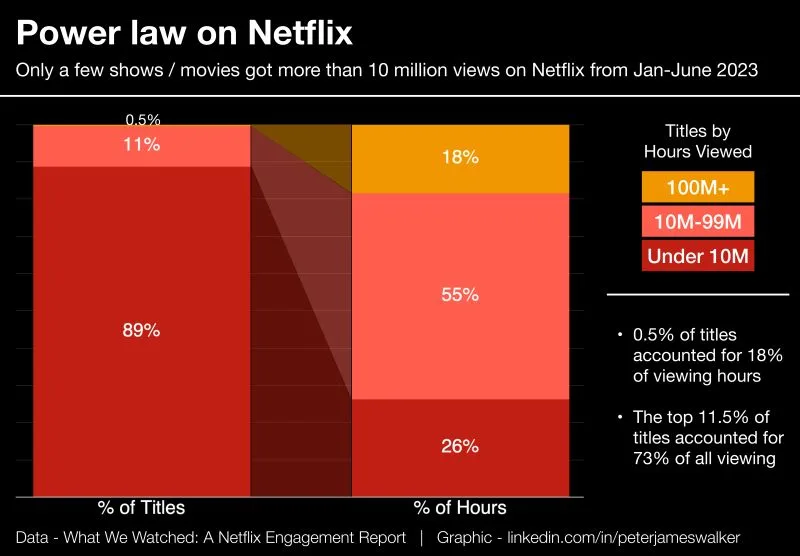
89% of titles (shows & movies) on the service get less than 10 million hours of viewing.
11% of titles were watched between 10 and 99 million hours
0.5% were watched 100M hours or more
10 million hours may seems like a lot, but with ~250 million global subscribers on Netflix it's really quite a small figure.
Consistent creation with the hopes that 1 in 10 hits big—works for LinkedIn, works on Netflix.

DISCLOSURE: This communication is on behalf of eShares, Inc. dba Carta, Inc. ("Carta"). This communication is for informational purposes only, and contains general information only. Carta is not, by means of this communication, rendering accounting, business, financial, investment, legal, tax, or other professional advice or services. This publication is not a substitute for such professional advice or services nor should it be used as a basis for any decision or action that may affect your business or interests. Before making any decision or taking any action that may affect your business or interests, you should consult a qualified professional advisor. This communication is not intended as a recommendation, offer or solicitation for the purchase or sale of any security. Carta does not assume any liability for reliance on the information provided herein. © 2026 Carta. All rights reserved. Reproduction prohibited.