
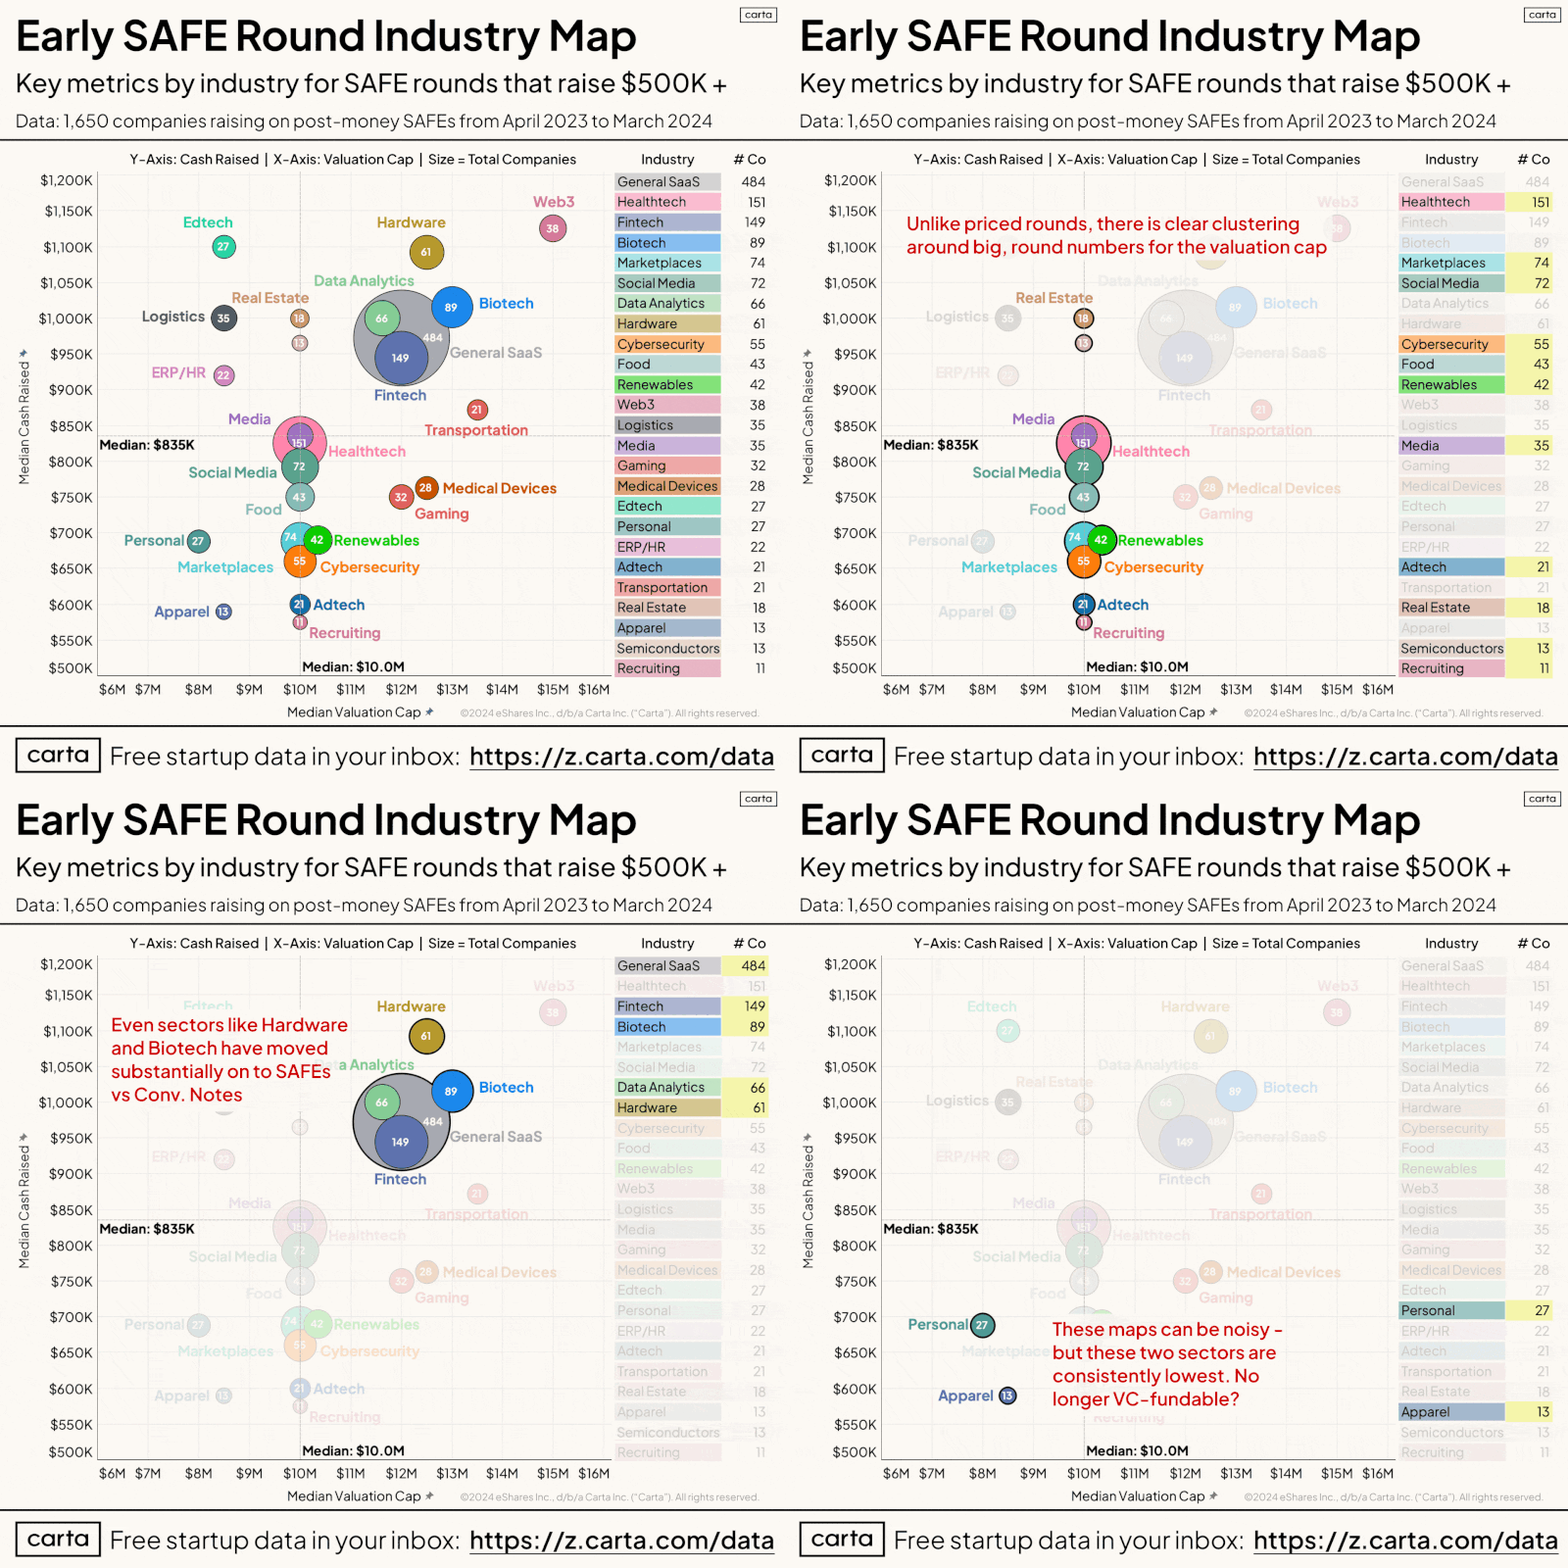
Fundraising on SAFEs has made early-stage startup analysis super messy. But here are 3 key takeaways from the SAFE industry map below.
Notes upfront on the data - it's all US companies raising SAFE rounds on Carta with round sizes from $500K-$5M over the past 12 months. Is that a wide range? Definitely! It's what makes the SAFE arena so confusing.
Okay, to the insights:
𝟭) 𝗩𝗮𝗹𝘂𝗮𝘁𝗶𝗼𝗻 𝗖𝗮𝗽𝘀 𝗱𝗲𝗳𝗮𝘂𝗹𝘁 𝘁𝗼 𝗯𝗶𝗴, 𝗿𝗼𝘂𝗻𝗱 𝗻𝘂𝗺𝗯𝗲𝗿𝘀
There's really no good reason why so many industries would simply align to the $10M valuation cap as they do in the chart below. Suggests that the val cap basically hops from round number to round number ($8M to $10M to $12M, etc).
I get that the funding dynamics here are mostly about supply and demand, not a company's inherent value, but some of these rounds are really large at this point!
𝟮) 𝗦𝗔𝗙𝗘𝘀 𝗮𝗿𝗲 𝗲𝗮𝘁𝗶𝗻𝗴 𝗖𝗼𝗻𝘃𝗲𝗿𝘁𝗶𝗯𝗹𝗲 𝗡𝗼𝘁𝗲𝘀' 𝗹𝘂𝗻𝗰𝗵
The convertible note has been eroded from the early venture funding landscape bit by bit. The last holdouts were hard science and real-world industries like Hardware and Biotech...but by the look of things, those are getting SAFE-ified as well.
Is this a good thing? Hmmm. Of late I've been reading some objections to the SAFE that I find more persuasive than I had expected. More on this subject later.
𝟯) 𝗘𝘃𝗲𝗻 𝗮𝘁 𝘁𝗵𝗲 𝗲𝗮𝗿𝗹𝗶𝗲𝘀𝘁 𝘀𝘁𝗮𝗴𝗲𝘀, 𝗰𝗲𝗿𝘁𝗮𝗶𝗻 𝗰𝗮𝘁𝗲𝗴𝗼𝗿𝗶𝗲𝘀 𝗮𝗿𝗲 𝗳𝗮𝗹𝗹𝗶𝗻𝗴 𝗯𝗲𝗵𝗶𝗻𝗱
In 2021 and 2022, DTC retail categories like Apparel and Personal Products were right in the mix with other VC-backed rounds. But over the past couple years they have drifted towards lower valuations, lower cash raises, and just fewer rounds overall.
We may be seeing some sectors become effectively "no-go" areas for VCs. Not to say there won't be amazing businesses built in those categories moving forward! They are just less likely to do so with VC cash.
And yes - the map below doesn't have an AI bubble. If it did, it would be quite large and live just to the left of the Web3 circle. But AI is diffused among all of these categories (recently had a VC tell me that 95% of pitches she hears these days have an AI component). The hype cycle continues!
Happy to send you the first graphic as a static image if you need it, just comment below.
#cartadata #preseed #SAFEs #founders #startups

DISCLOSURE: This communication is on behalf of eShares, Inc. dba Carta, Inc. ("Carta"). This communication is for informational purposes only, and contains general information only. Carta is not, by means of this communication, rendering accounting, business, financial, investment, legal, tax, or other professional advice or services. This publication is not a substitute for such professional advice or services nor should it be used as a basis for any decision or action that may affect your business or interests. Before making any decision or taking any action that may affect your business or interests, you should consult a qualified professional advisor. This communication is not intended as a recommendation, offer or solicitation for the purchase or sale of any security. Carta does not assume any liability for reliance on the information provided herein. © 2026 Carta. All rights reserved. Reproduction prohibited.