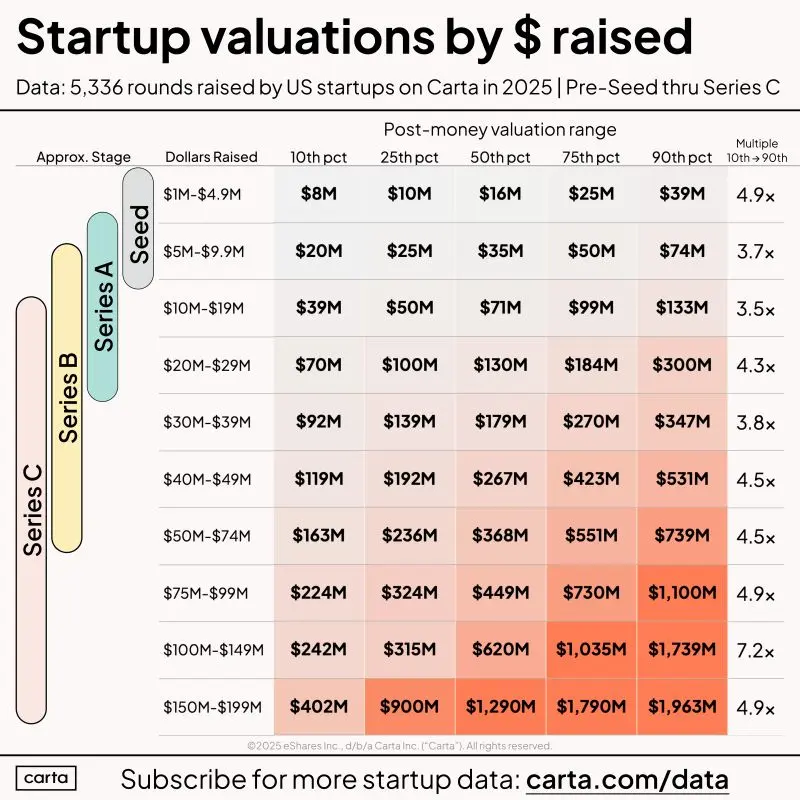
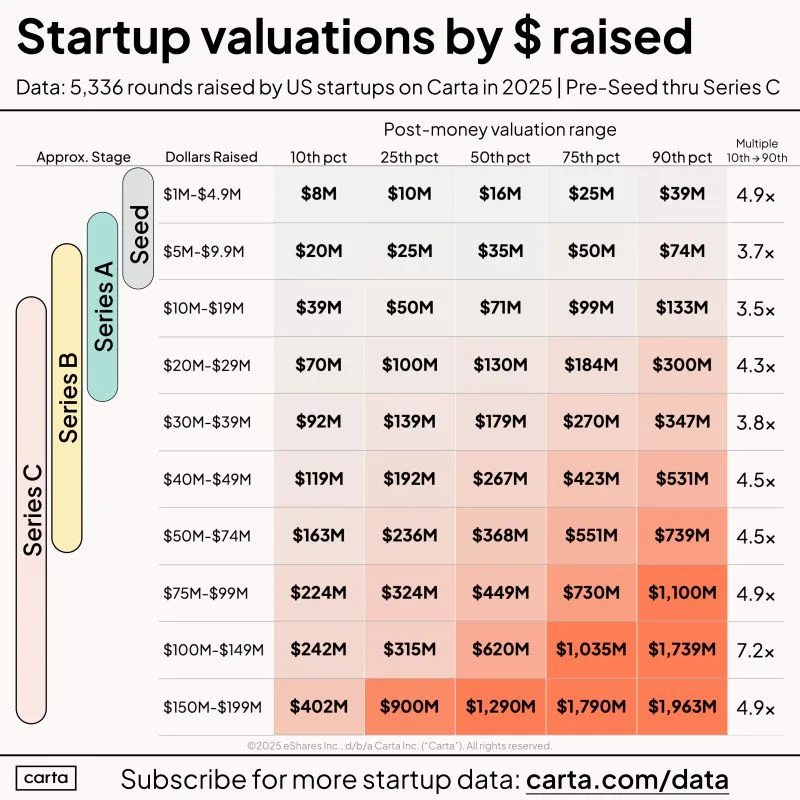
A table to help founders visualize how the money they raise translates into company valuation for Seed rounds through Series C.
𝗛𝗼𝘄 𝘁𝗼 𝗿𝗲𝗮𝗱 𝘁𝗵𝗲 𝗴𝗿𝗮𝗽𝗵𝗶𝗰
Stage names cover a range of round sizes. The labels should encompass about 90% of the rounds in that stage for 2025.
Dollars raised is the key column. You go from the amount of cash to the ranges for valuation. Oftentimes startups can be valued very differently even though they are raising the same $.
Example:
Seed companies often raise about $4M. The median valuation for companies raising between $1M and $5M is 16 million post-money.
This table tells me two things
1) Round names are just slightly useful
2) Valuations and cash raised are correlated but hardly 1:1
It also tells me people are doing some WILD deals in 2025, but we all kinda knew that 😁

DISCLOSURE: This communication is on behalf of eShares, Inc. dba Carta, Inc. ("Carta"). This communication is for informational purposes only, and contains general information only. Carta is not, by means of this communication, rendering accounting, business, financial, investment, legal, tax, or other professional advice or services. This publication is not a substitute for such professional advice or services nor should it be used as a basis for any decision or action that may affect your business or interests. Before making any decision or taking any action that may affect your business or interests, you should consult a qualified professional advisor. This communication is not intended as a recommendation, offer or solicitation for the purchase or sale of any security. Carta does not assume any liability for reliance on the information provided herein. © 2026 Carta. All rights reserved. Reproduction prohibited.