
Executive summary
For venture fund managers, it was a promising start to the year. In Q1 2026, median net TVPI increased for nearly every recent vintage of VC funds tracked on Carta. On a slightly longer timeframe, the picture is even clearer: Over the past six quarters, median TVPIs have climbed steadily for every vintage from 2017 through 2024.
This represents a welcome reversal for GPs. Three years ago, a troubling trend had started to emerge: After having skyrocketed in the previous several quarters, the median net TVPI for every vintage from 2017 through 2020 began to decline. In some cases—such as for the 2018 vintage—the drop-off was perilously steep.
But from today’s vantage, it appears the VC market has turned the page. Recent declines in TVPI have come to an end, and a new phase of up and to the right has begun.
The reasons for the initial downward momentum are no secret. TVPI measures the value of both the realized and unrealized assets held by a VC fund. During the early 2020s, when valuations across the startup universe were experiencing a phase of explosive growth, the value of the assets held by these recent vintages mostly went up. In 2022, the music stopped. A reset in valuations began. And in many cases, the valuations of assets held in VC funds from the late 2010s started to decline.
The factors driving the recent reversal are also clear enough: Valuations have been rising once again. At most stages of VC fundraising, median valuations are significantly higher today than they were six quarters ago. At every stage, 90th percentile valuations have surged. As the value of assets goes up, the value of the funds that hold those assets go up, too.
Yet this only tells half the story. And, for fund managers and their LPs, it’s the less important half. Unrealized valuations of VC-owned assets may be trending up. But realized gains—the deals that actually put cash in investors’ pockets—are still relatively few and far between.
This is best demonstrated by the paucity of DPI that has been generated by most recent fund vintages. In each of the 2019 and 2020 vintages, for instance, median DPIs are still barely over zero, and less than half of all funds have begun to return any capital at all to their LPs. The 2017 and 2018 cohorts are the only recent vintages with much DPI to speak of, and even then, the return profiles remain relatively slight. Across those two vintages, less than 20% of funds have yet reached a 1x DPI, marking the point at which fund LPs start to earn a profit, rather than simply getting back the capital that they initially paid in.
In the big picture, the latest data shows promising signs for the performance of recent VC funds. But the challenge for the investors managing those funds is clear. Eventually, they will need to convert the unrealized gains that these vehicles are experiencing into concrete returns, producing profits for themselves and their LPs that will allow the flywheel of venture capital fundraising to keep on spinning.
Q1 highlights
Top-decile IRRs top 20%: For every fund vintage from 2017 through 2024 (with the exception of 2021), the 90th percentile for net IRR is currently higher than 20%. In none of these vintages is the 75th percentile for IRR above 15.5%. At least among these funds, most of which are still being actively managed, only a small minority of vehicles are achieving the sorts of performance that many LPs expect.
Fundraising starts strong in 2026: Investors on Carta raised $3.9 billion across 86 new venture funds in Q1, with the latter figure representing the most funds closed in any Q1 since 2022. The year is still young, but for now, 2026 is on pace for the most new funds and most cash raised in any full year since 2022.
VC fundraising keeps getting more concentrated: About 57% of all cash raised by new funds on Carta in 2025 went to vehicles with at least $100 million in commitments. Eight years ago, that figure was just 31%. The majority of all funds closed are smaller than $25 million. But the few large funds that do close are gobbling up more and more of the total fundraising pie.
Fund details
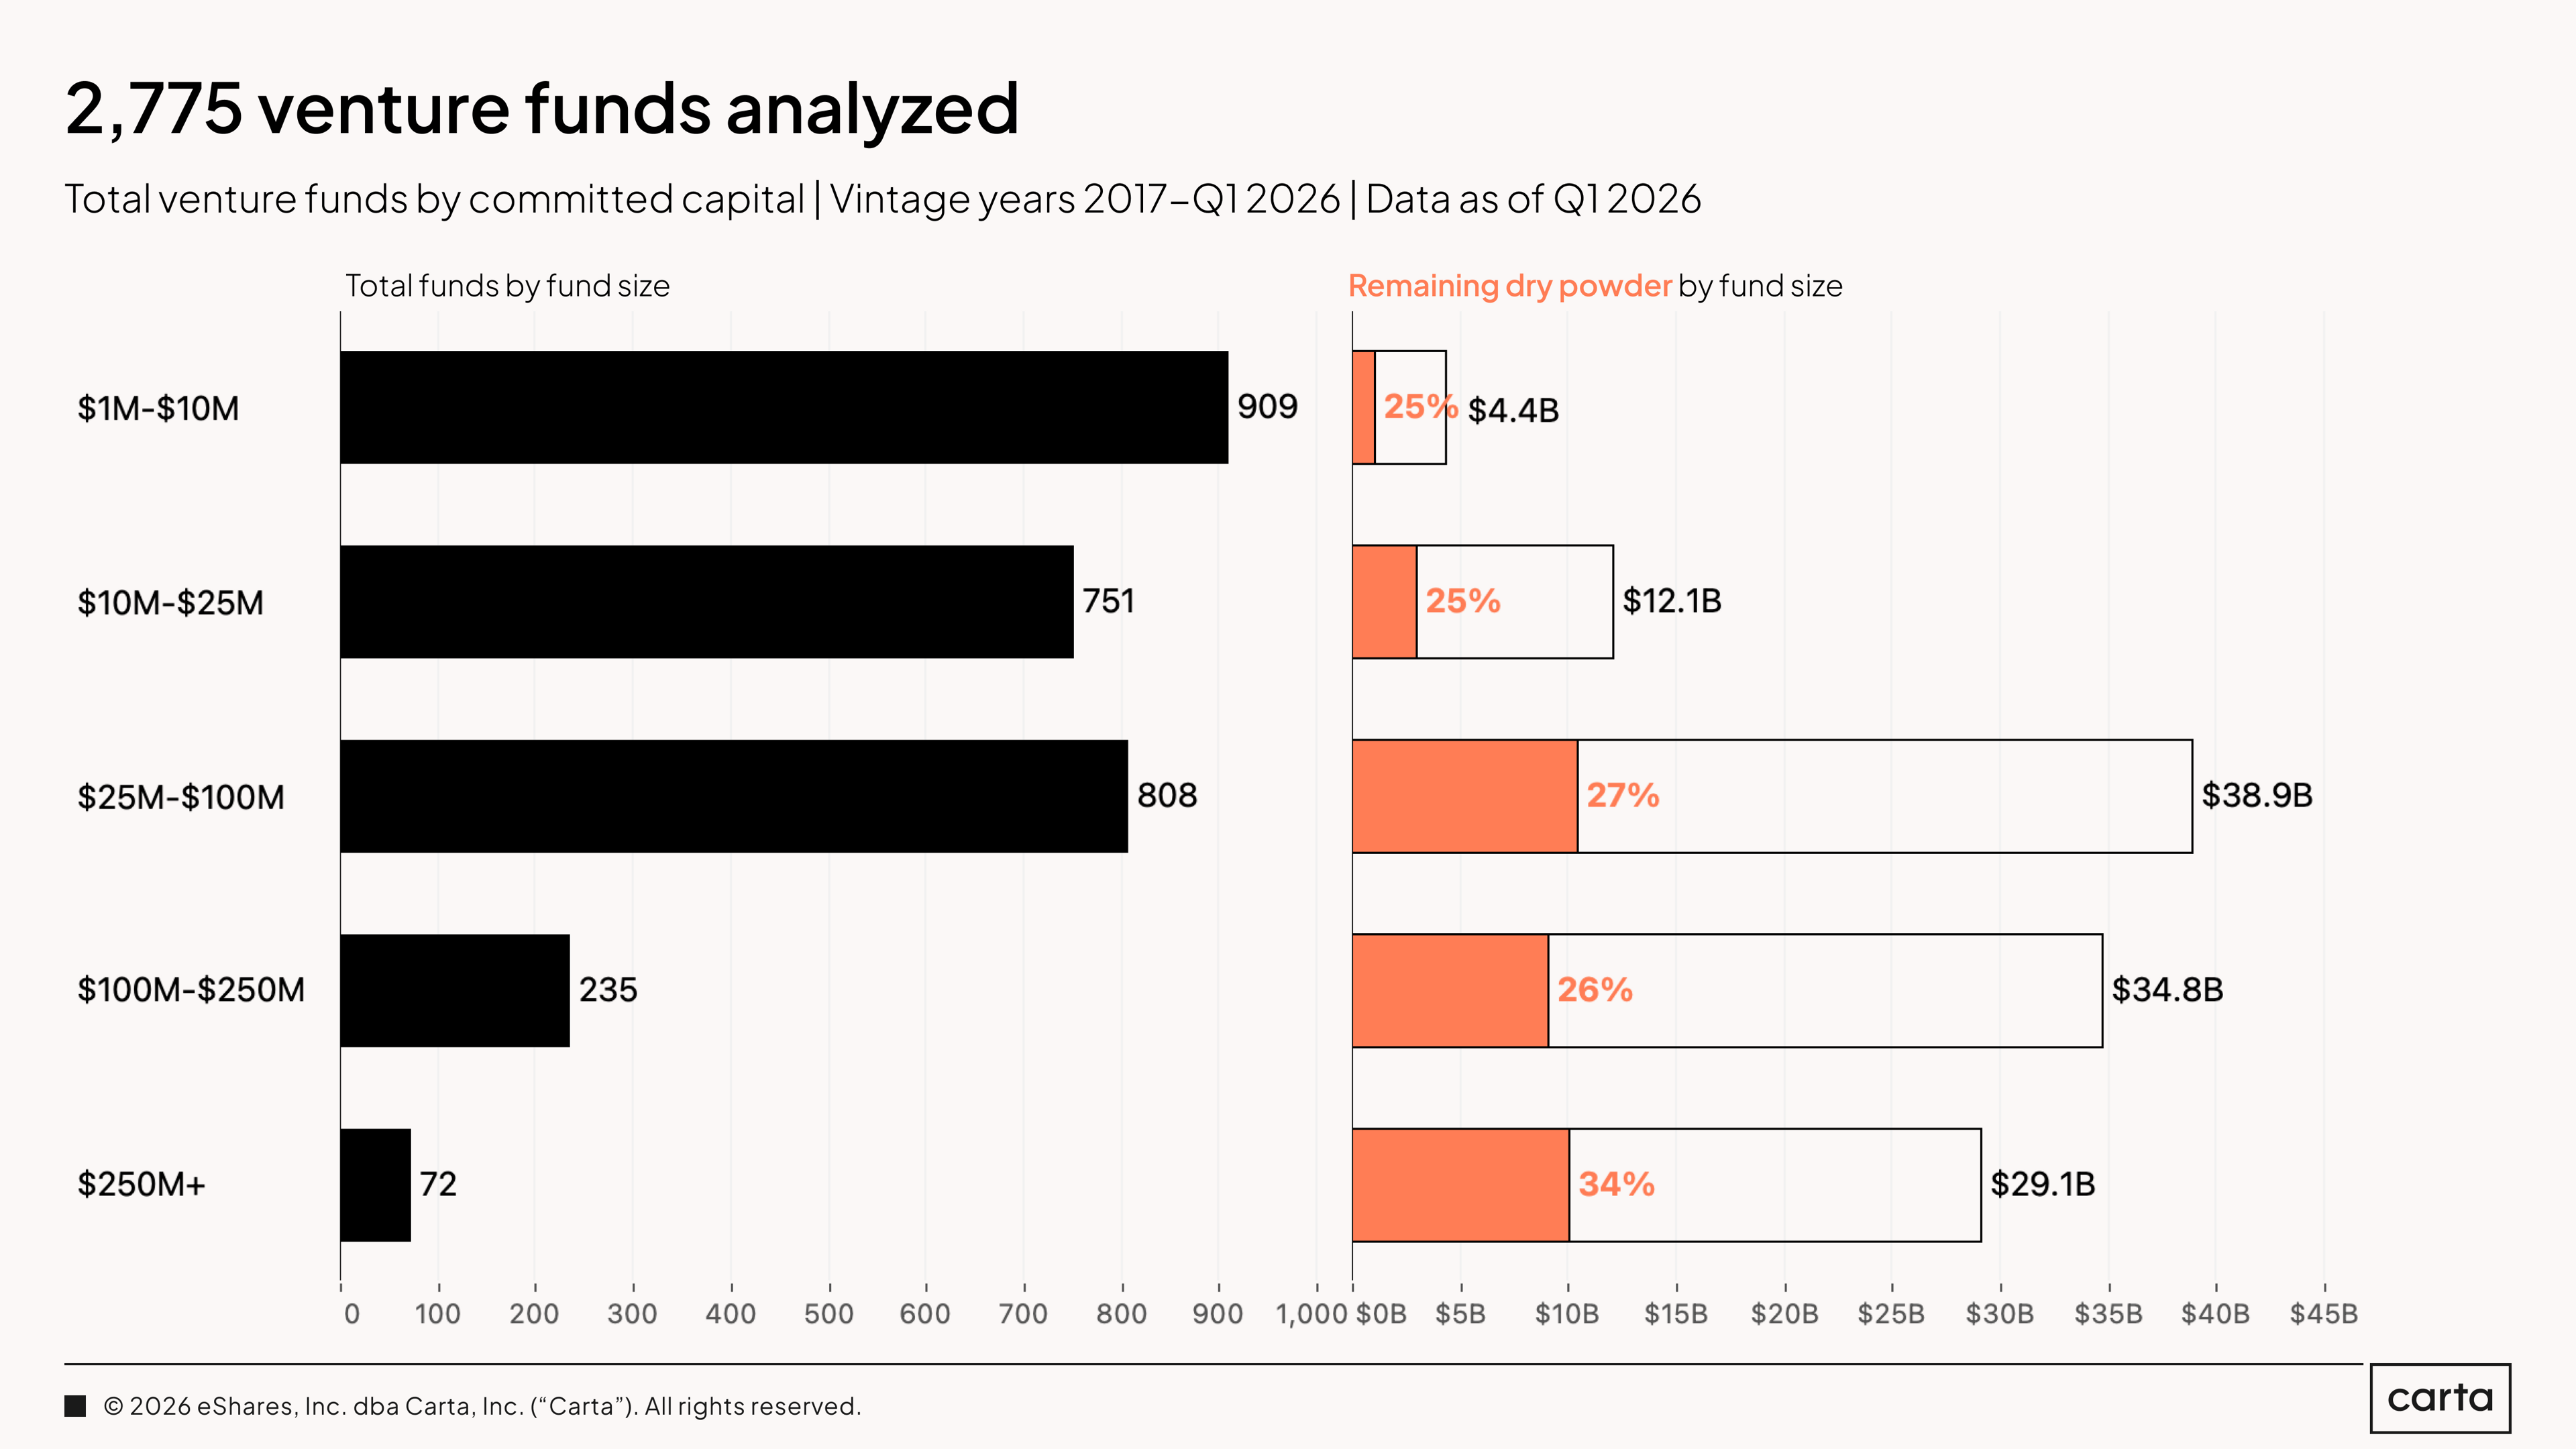
This report is based on data from 2,775 venture funds on Carta closed from the start of 2017 through the end of Q1 2026. Combined, these funds raised about $119.3 billion in total capital.
The bulk of these funds—about 89%—are smaller than $100 million in size. However, the majority of all capital in this sample—about 54%—resides in funds larger than $100 million. These contrasting figures demonstrate a baseline fact about venture capital fundraising: Small funds are far more common than large funds, but those relatively scarce large funds maintain an outsized degree of buying power.
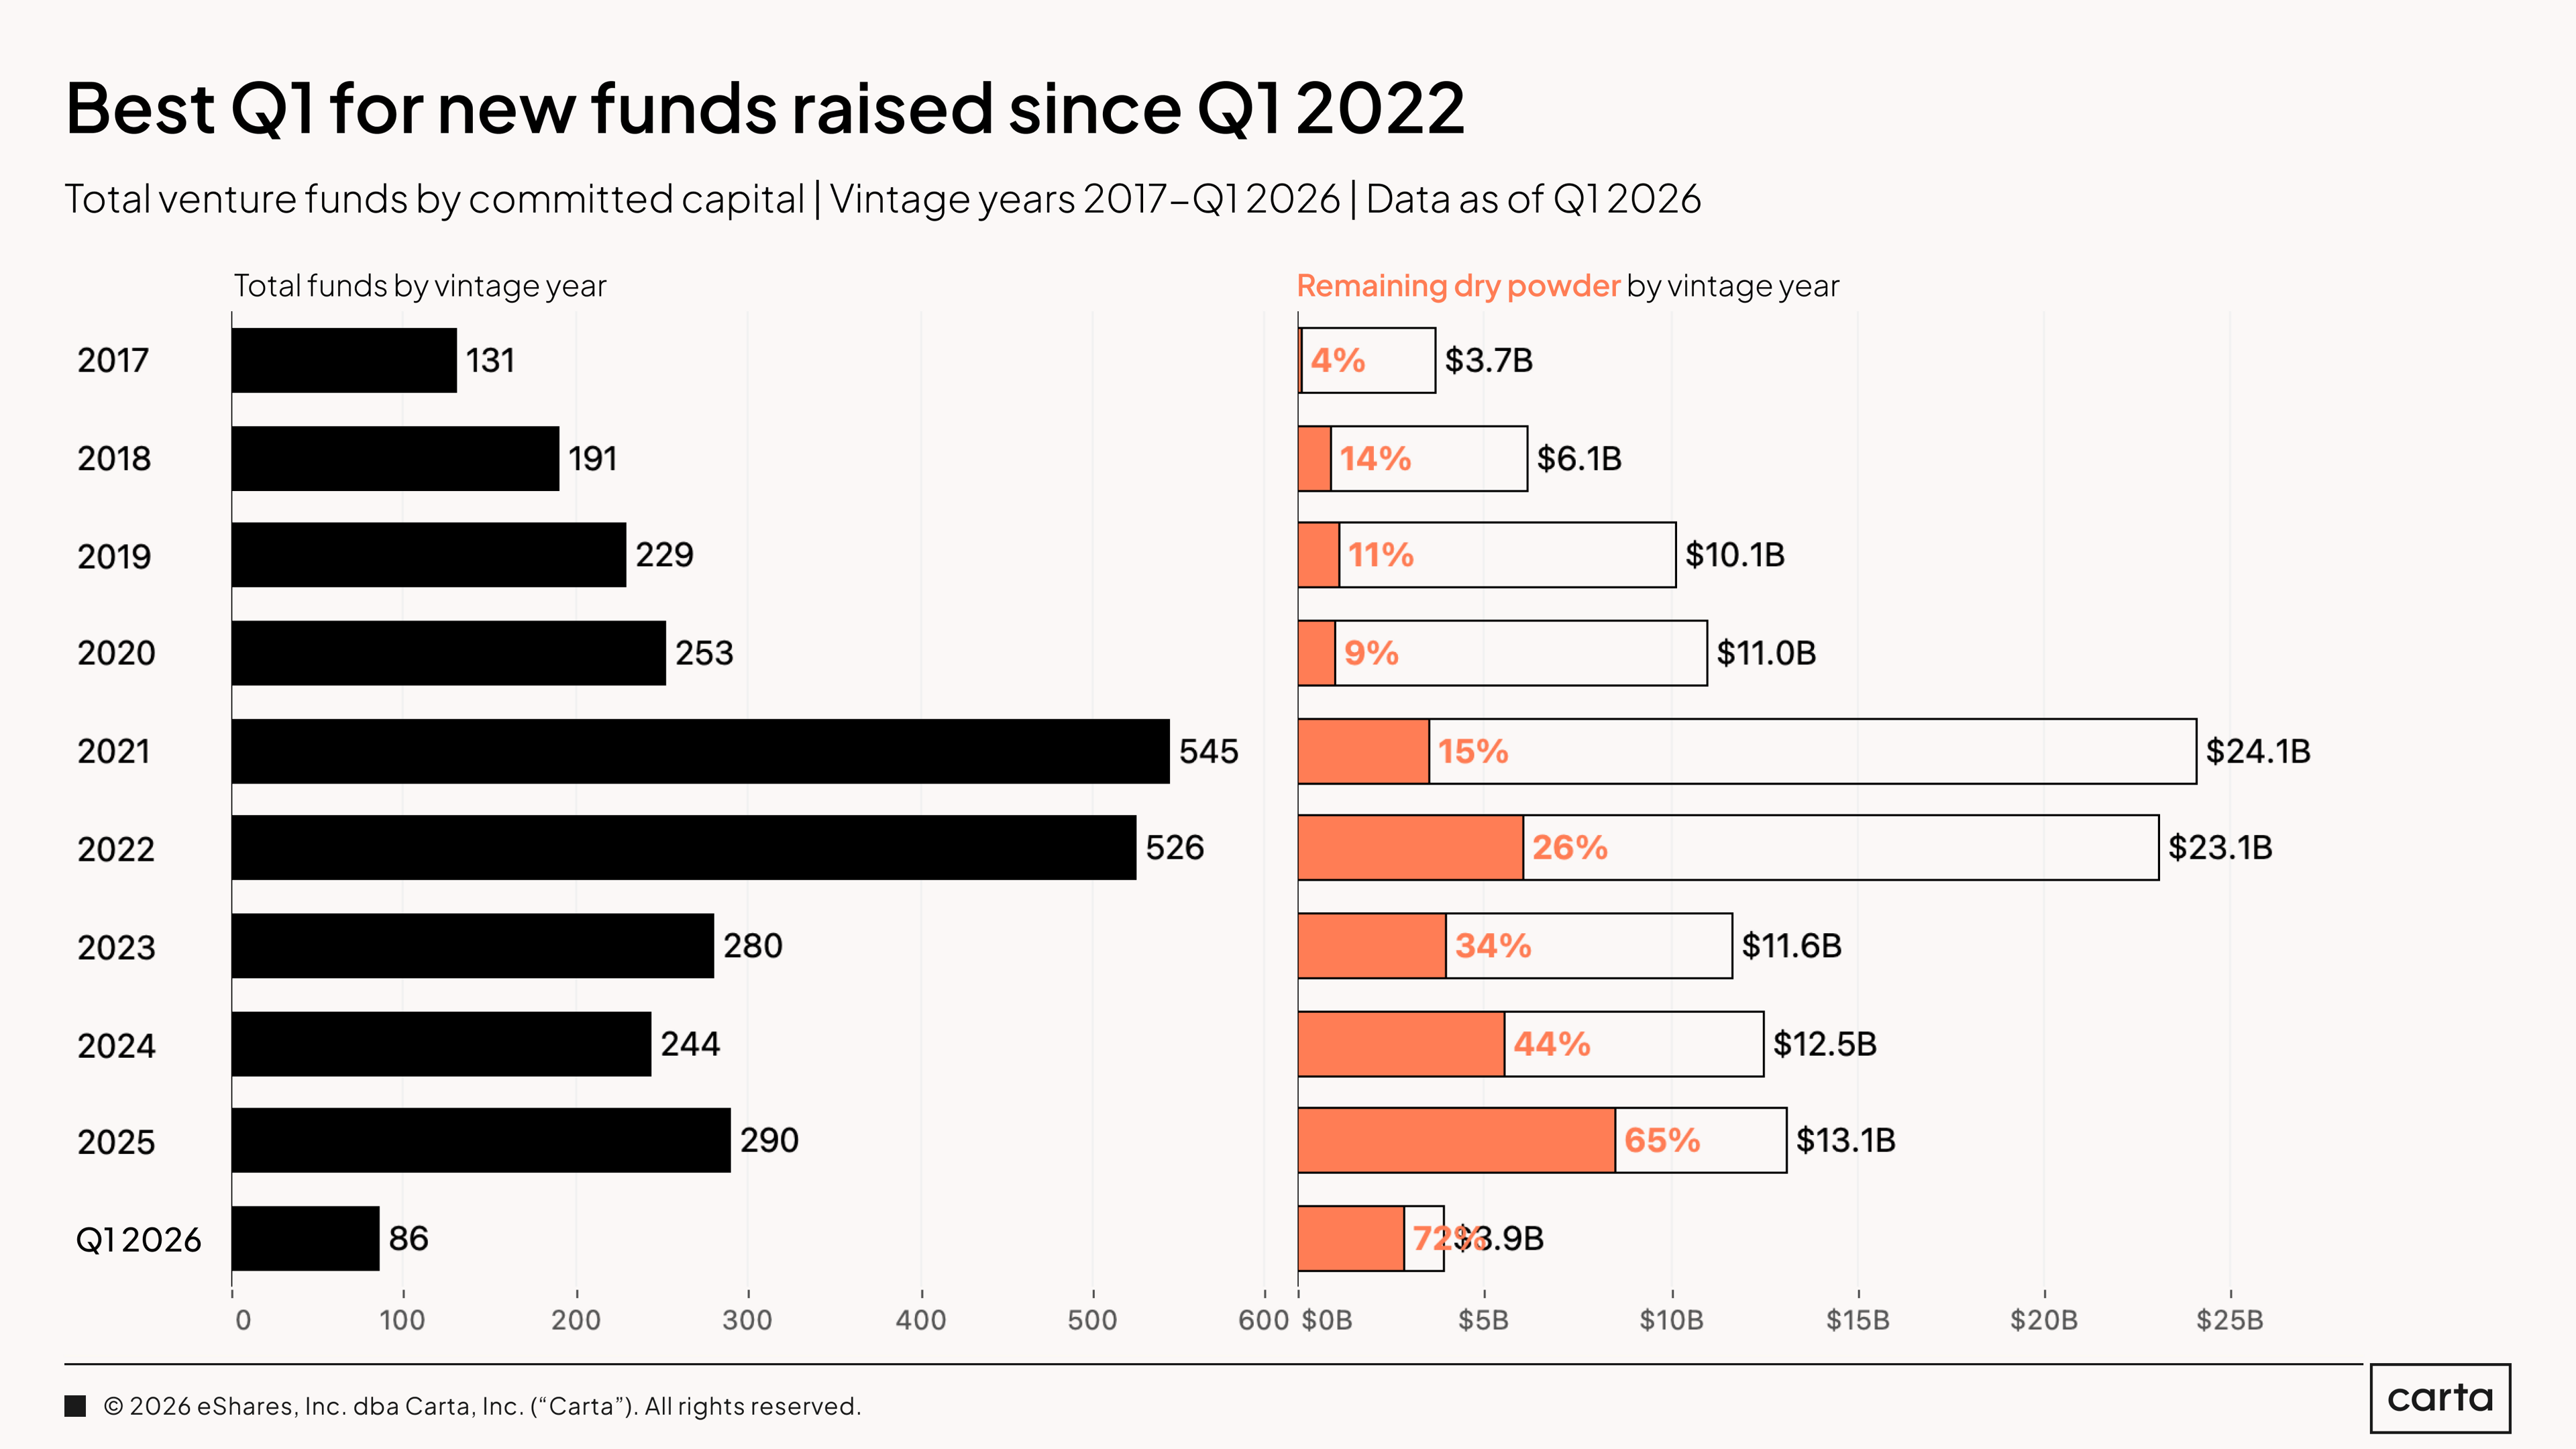
Investors on Carta closed 86 new VC funds during Q1 2026, marking the strongest start to a year for GP fundraising since 2022, when the post-pandemic bull market was still going strong. Total cash raised by new VC funds has ticked up steadily each of the past two years, and while it’s still early, 2026 is on pace to continue the trend.
These funds closed in Q1 have already deployed about 28% of their committed capital, with the other 72% remaining as dry powder. The 2025 vintage of funds, meanwhile, has already invested about 35% of its capital. Recently closed VC funds typically aren’t wasting any time in putting their capital to work.
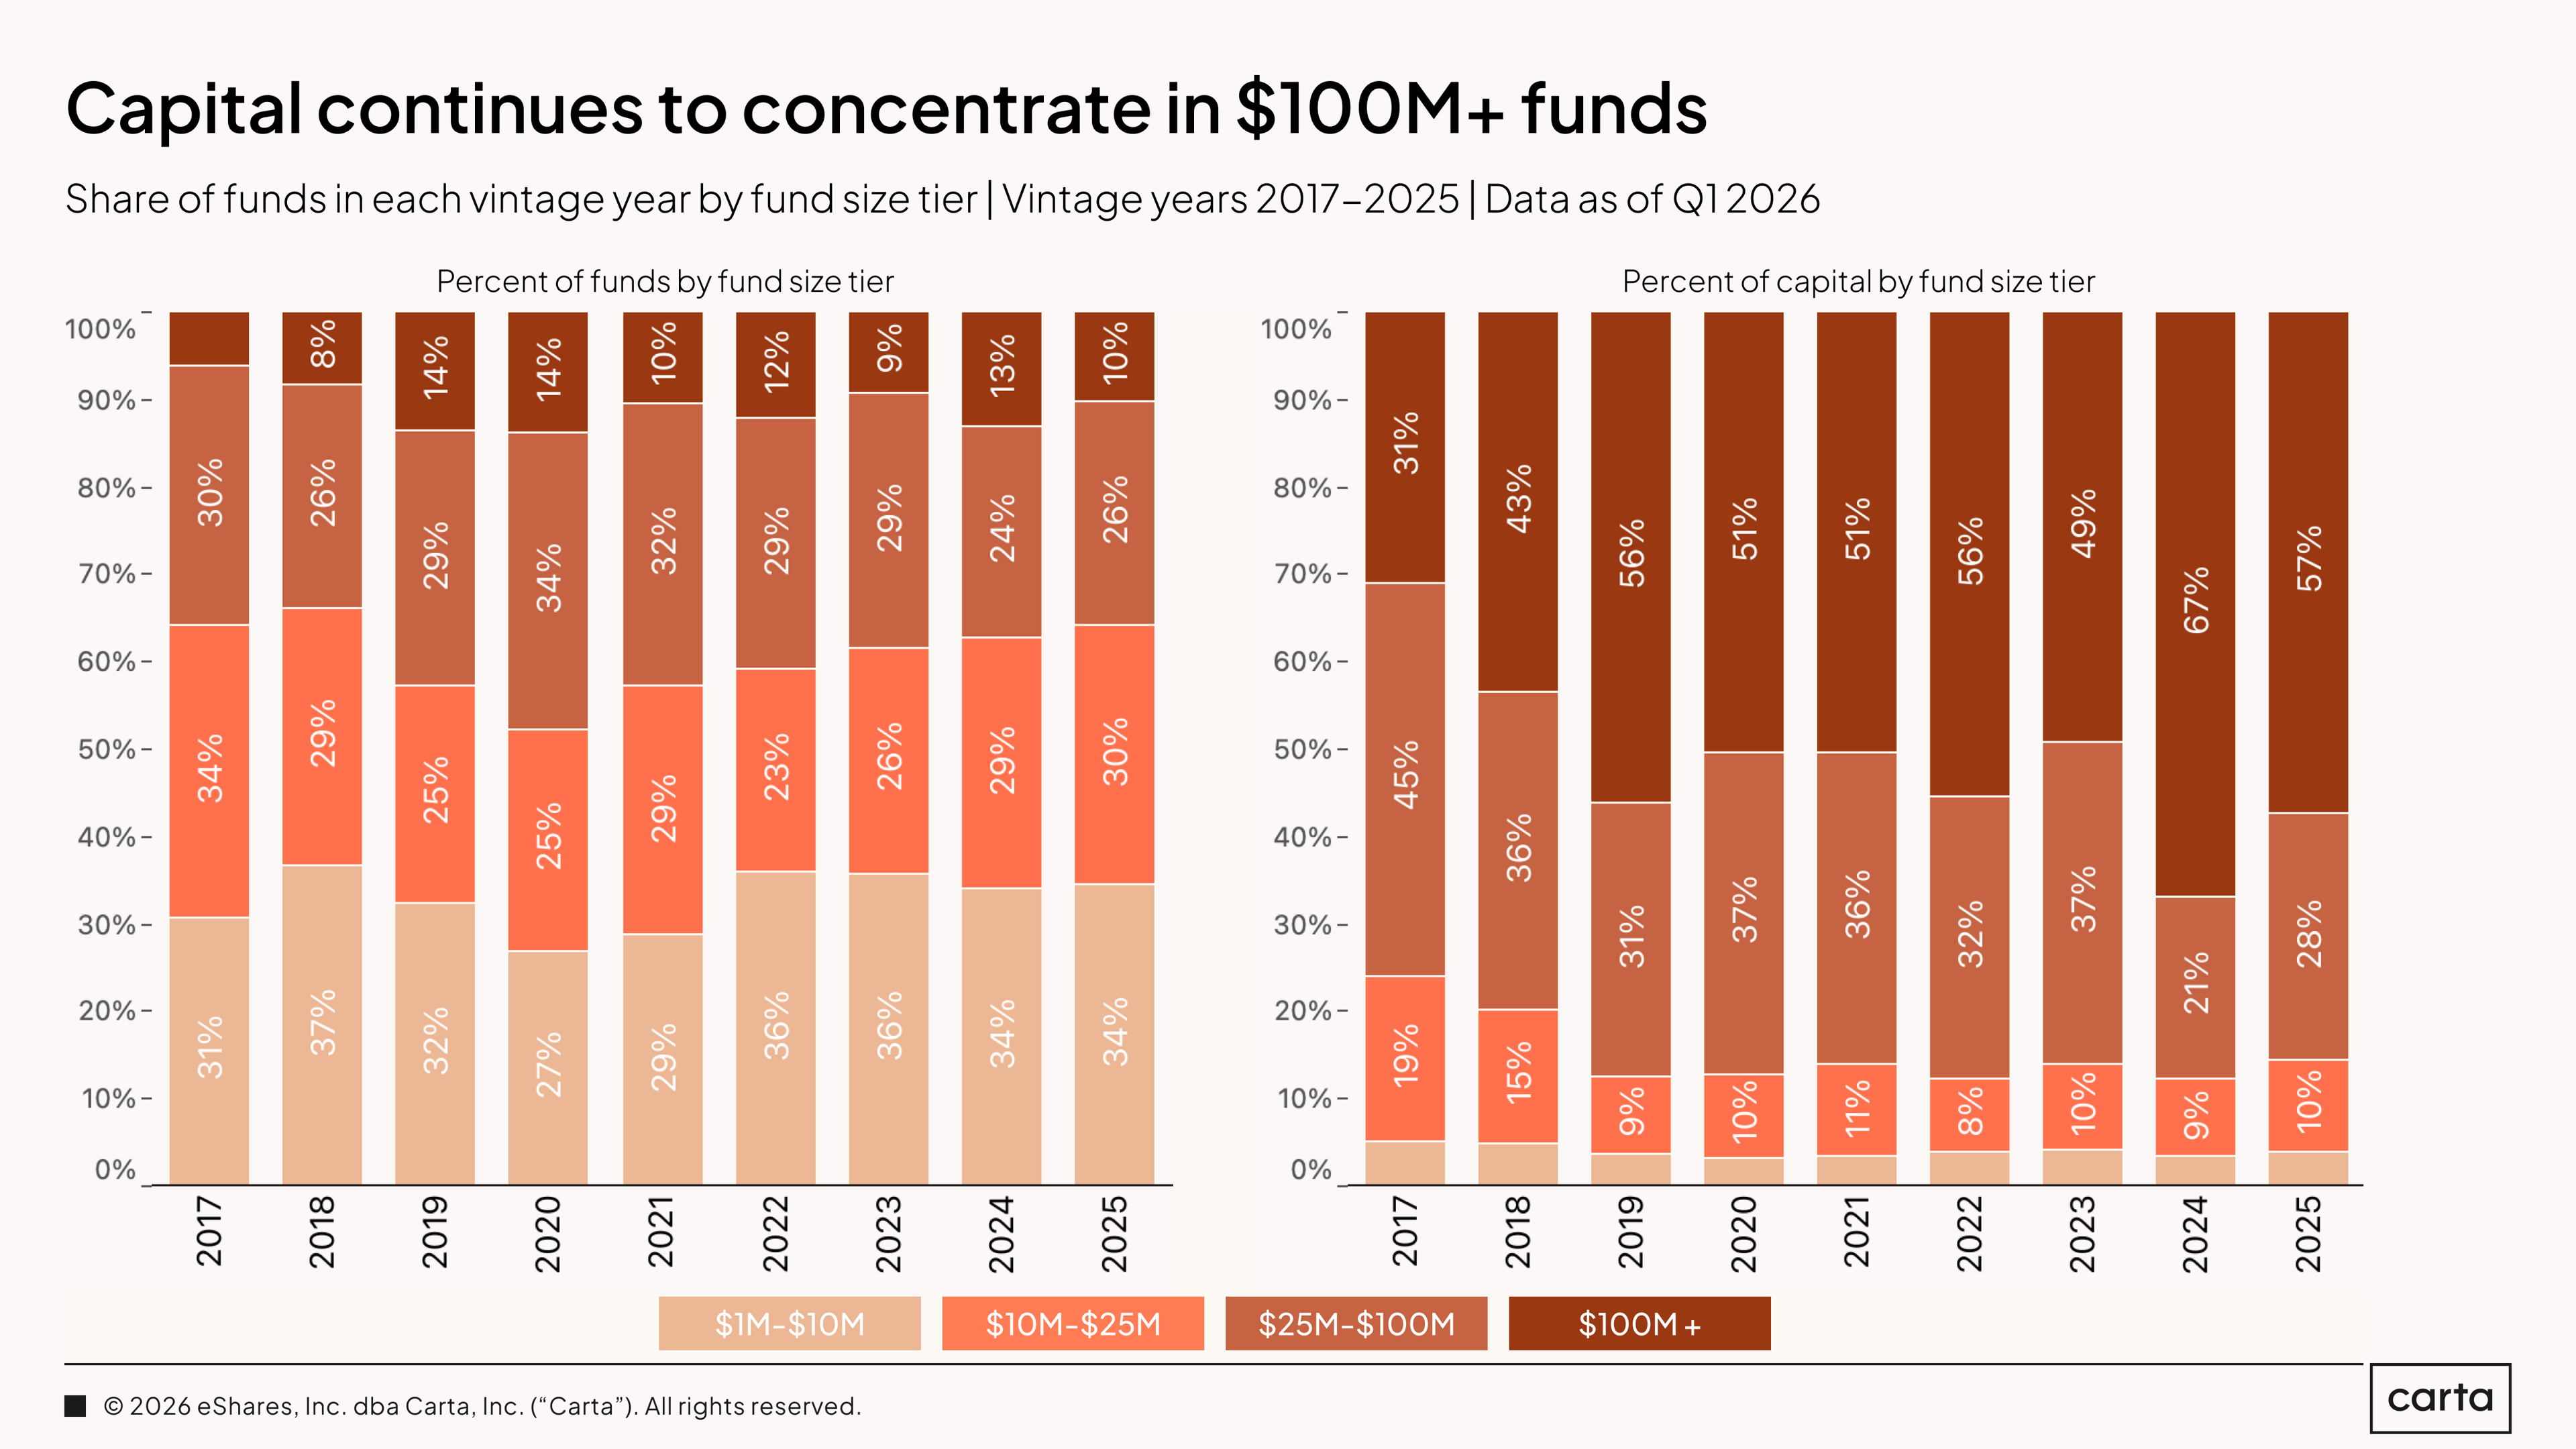
In the past nine years, the concentration of capital among the largest VC funds has grown much more extreme. Back in 2017, some 31% of all cash raised by funds on Carta went to vehicles larger than $100 million, while 24% went to funds smaller than $25 million. By 2025, 57% of all fund commitments were directed to $100 million-plus funds, and just 15% was committed to sub-$25 million funds.
Over this same period, the percentage of new funds raised by size has mostly held steady, with much smaller shifts compared to those seen in the share of capital raised. Relatively speaking, there aren’t more large VC funds than they used to be, but those large funds keep getting larger. Put more pithily, the rich are getting richer.
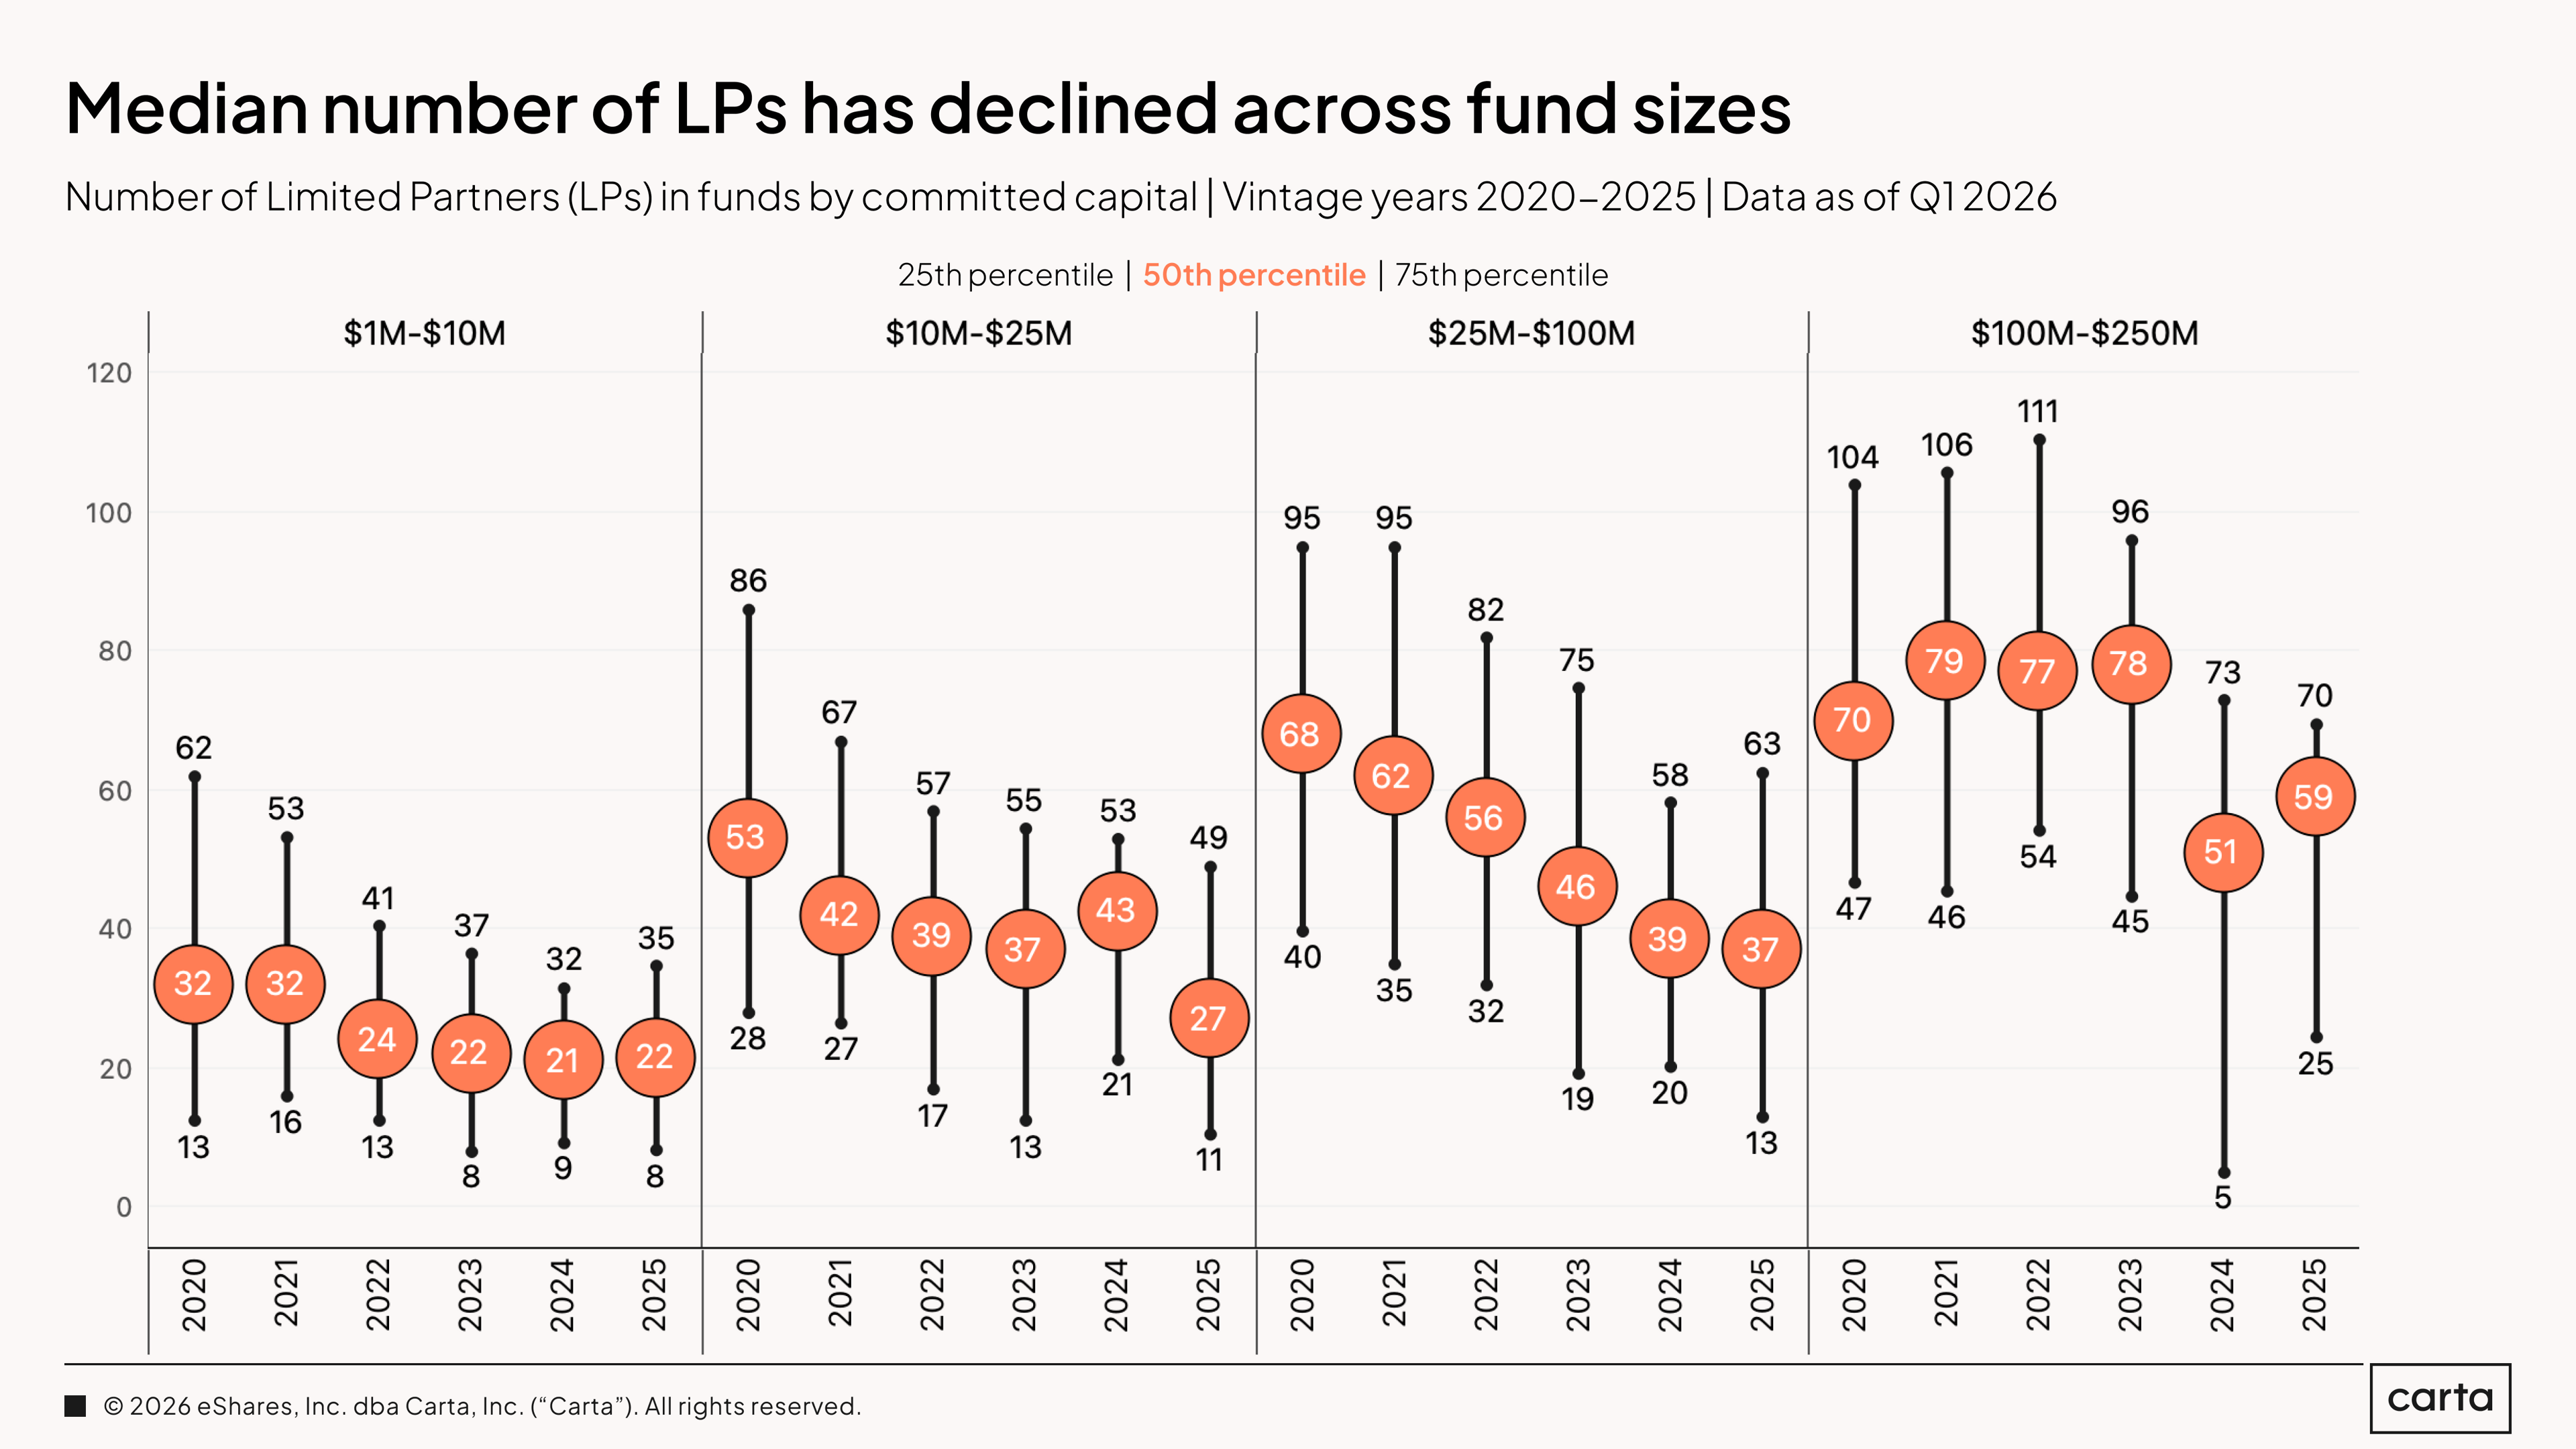
Compared to the early years of the 2020s, the median number of LPs committing capital to new VC funds has declined among vehicles of every size. In the cohort of funds between $10 million and $25 million, for instance, median LP count has nearly halved, falling from 53 in 2020 to 27 in 2025.
The upper and lower quartiles for LP count in new funds have also fallen across funds of all sizes, suggesting a broad-based shift in the market. For mid-sized funds, the lower quartile in particular has experienced a significant decline. In the $25 million to $100 million cohort, the 25th percentile for LP count was just 13 last year. That’s down 68% compared to five years earlier, and it’s not too different from the 25th percentile figures for much smaller funds.
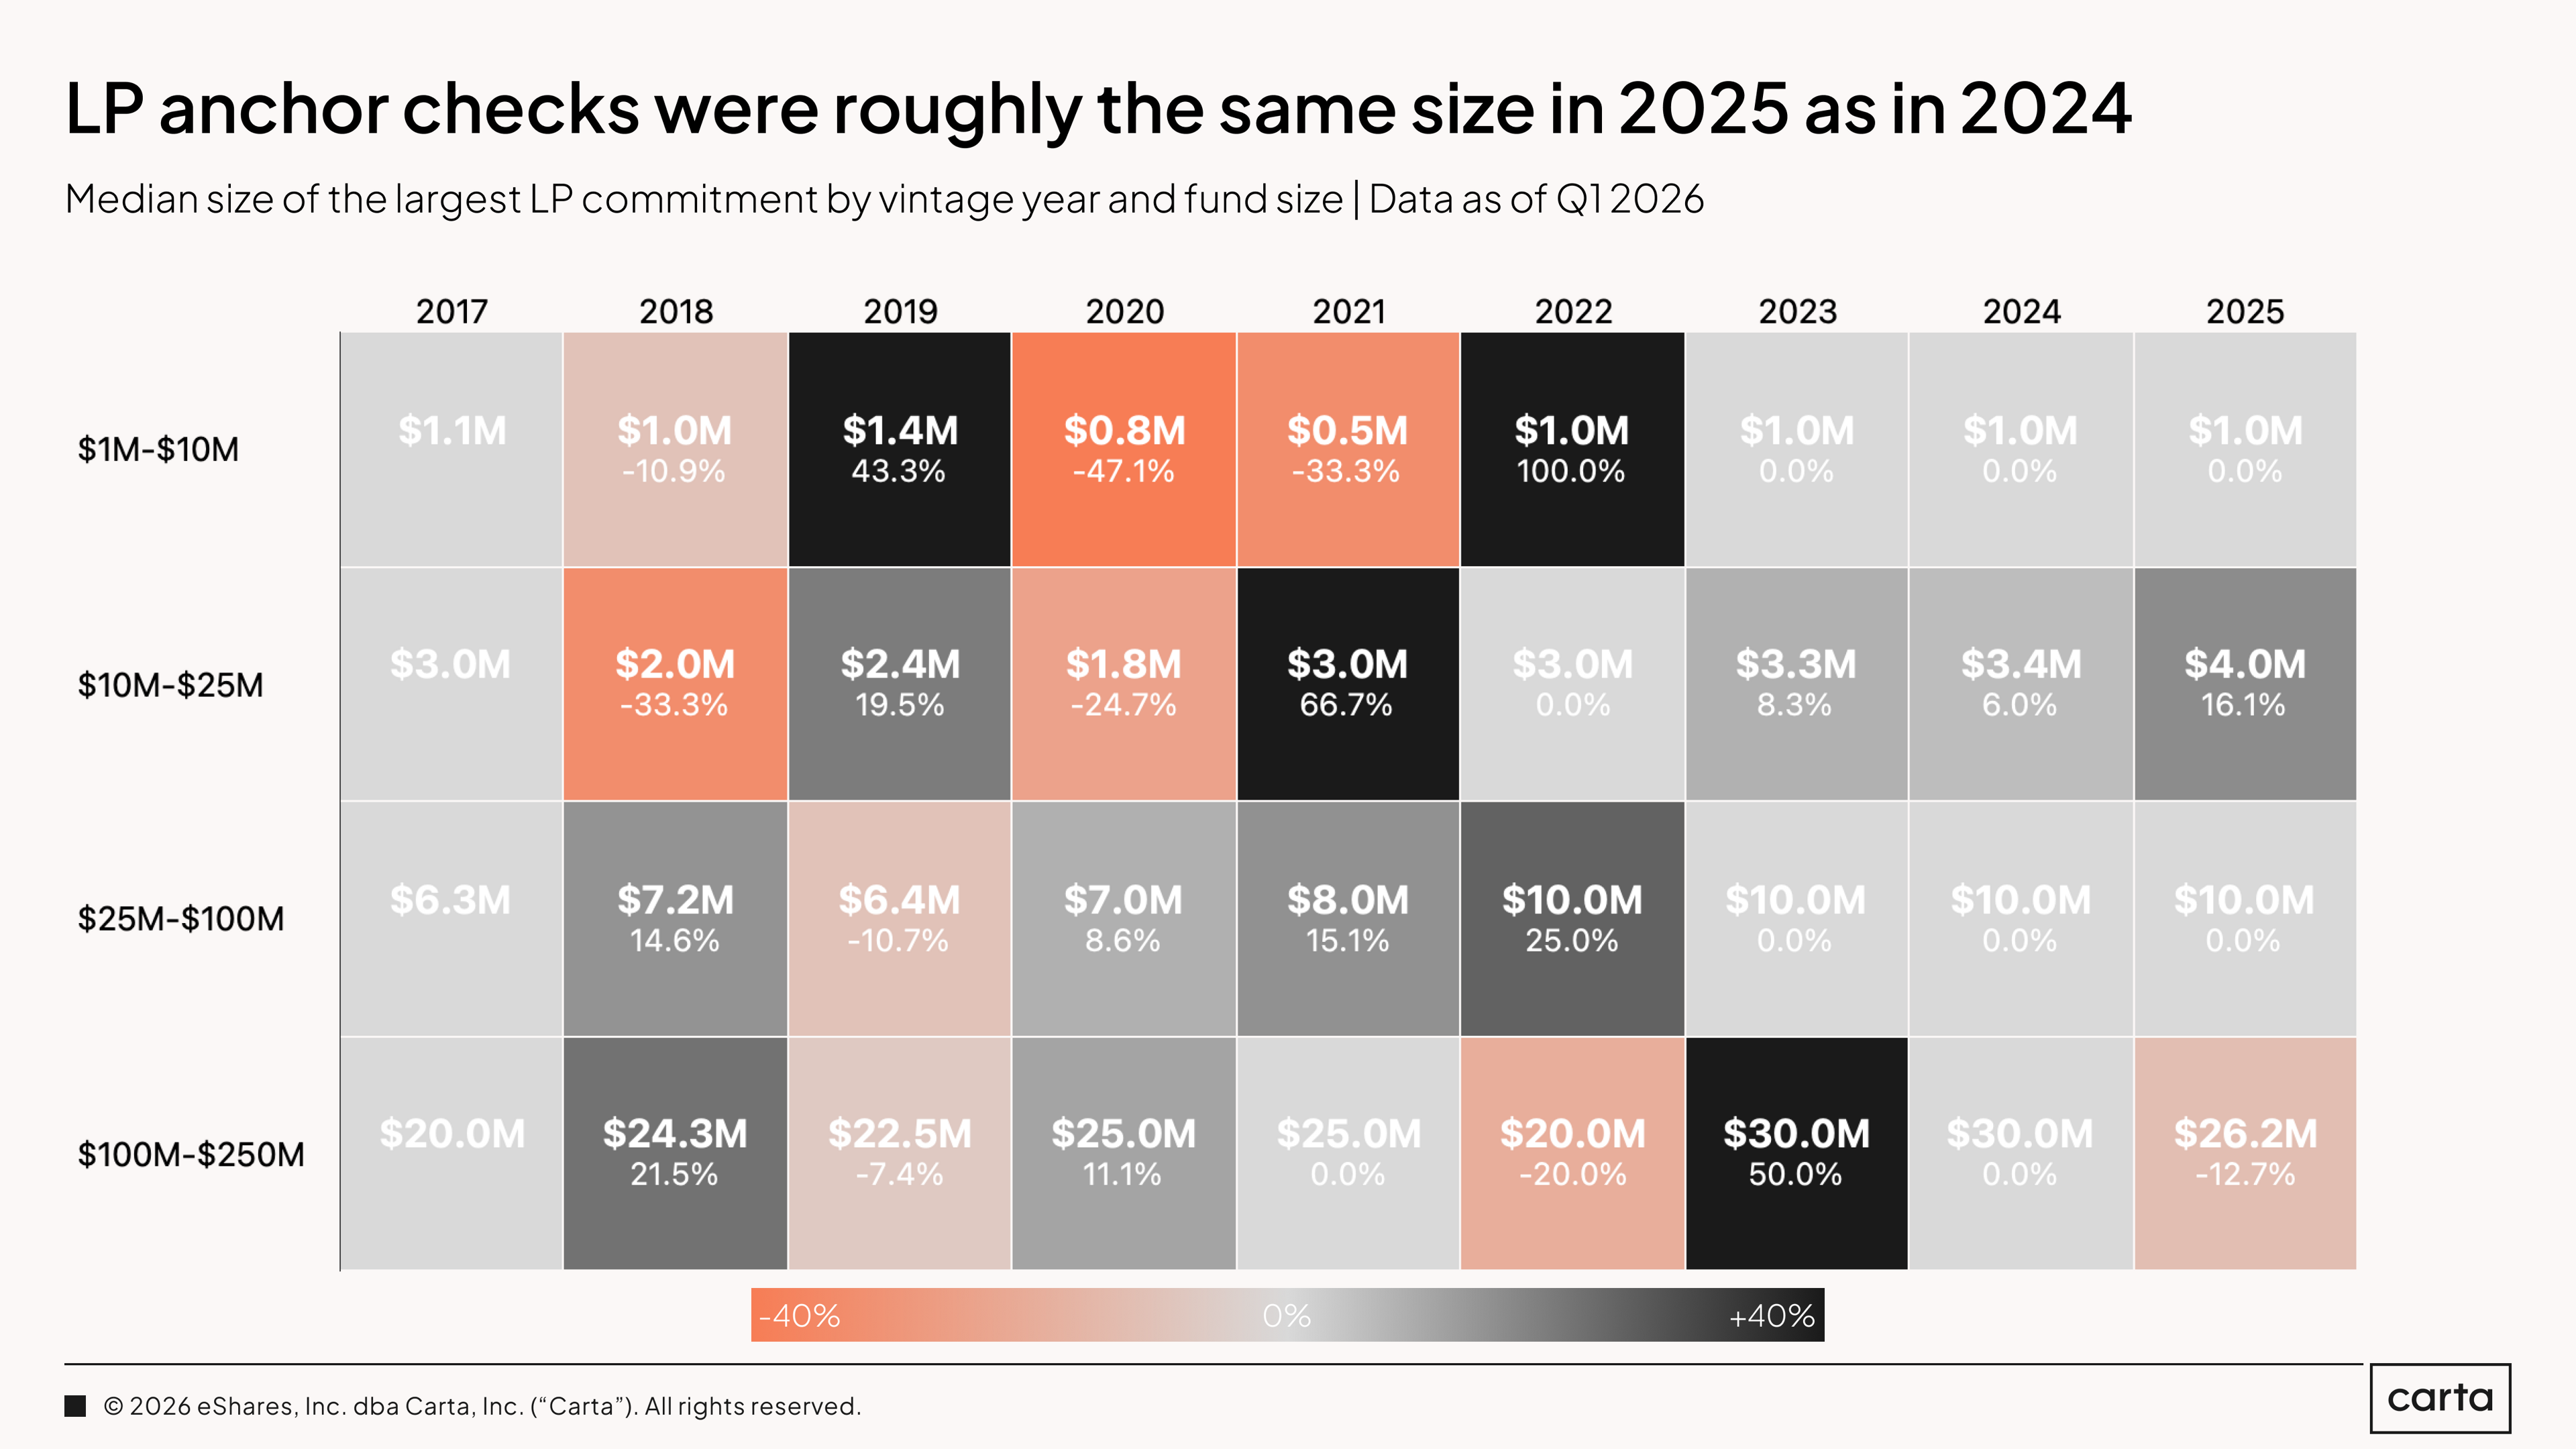
As the number of LPs contributing capital to mid-sized VC funds has shrunk, the size of the typical anchor check written for these funds has grown proportionately larger. Among funds from $10 million to $25 million, the median anchor check was $4 million in 2025, up from $1.8 million in 2020. For funds from $25 million to $100 million, the median anchor check has grown from $7 million to $10 million over the same span.
On a shorter timeline, however, the data has been more consistent. For funds from $1 million to $10 million and from $25 million to $100 million, the size of the median anchor check was unchanged from 2024 to 2025. The biggest year-over-year change came in the cohort of funds between $10 million and $25 million, which saw the median anchor check grow by 16.1%.
IRR
Where C(t) = net cash flow at a given time t
And C(0) = total initial cost of investments
And NPV = net present value of the fund’s future cash distribution (set to 0 to numerically solve for IRR)
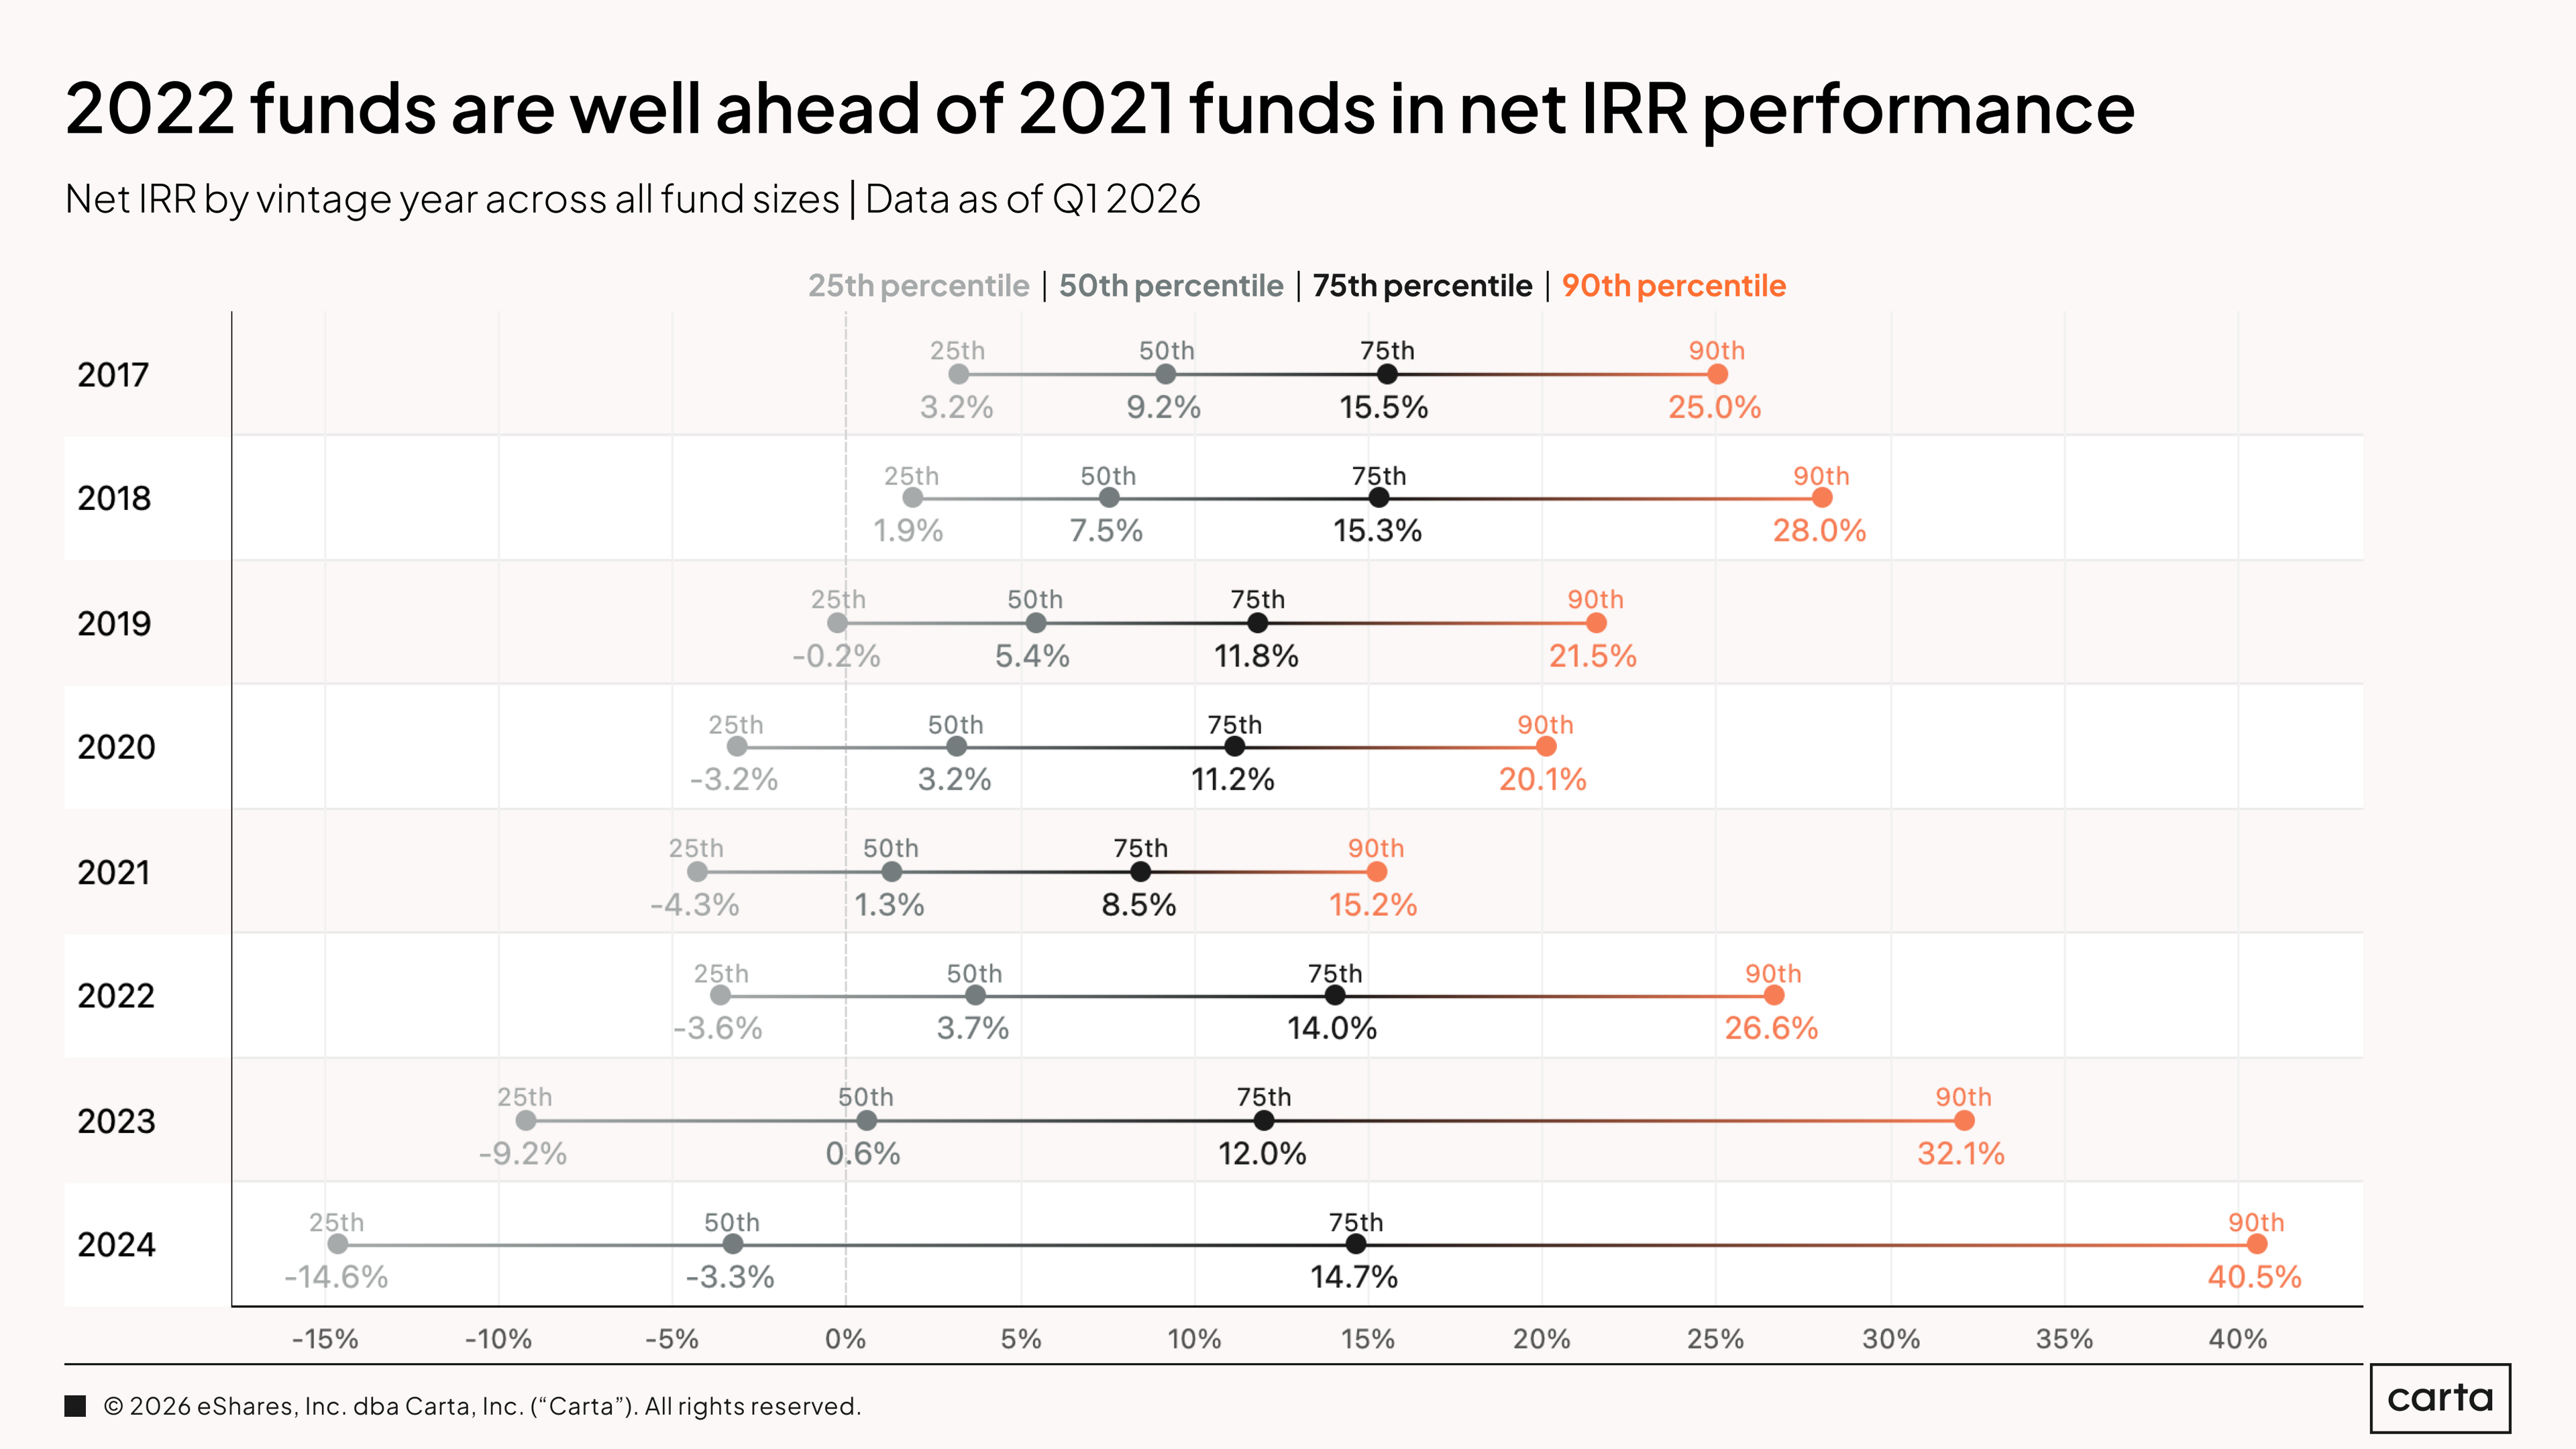
At each performance threshold shown here, the 2022 vintage of VC funds is outperforming the 2021 vintage. To at least some degree, this reflects a unique combination of factors swirling around that 2021 vintage. Most significantly, funds from that year were raised and began to deploy capital during the tail end of the recent VC bull market, when the market for venture-backed valuations soared to new highs. After the reset in VC valuations that ensued, many 2021 funds were left holding assets that had been priced amid a very different economic landscape.
Most funds from the late 2010s are still far from being fully realized, but after seven to nine years of active management, they’re moving much closer to maturity. As this happens, a significant gap remains between IRRs at the median and those at the 90th percentile. Only a small portion of VC vehicles from 2017, 2018, and 2019 have been able to reach the 20% mark for net IRR.
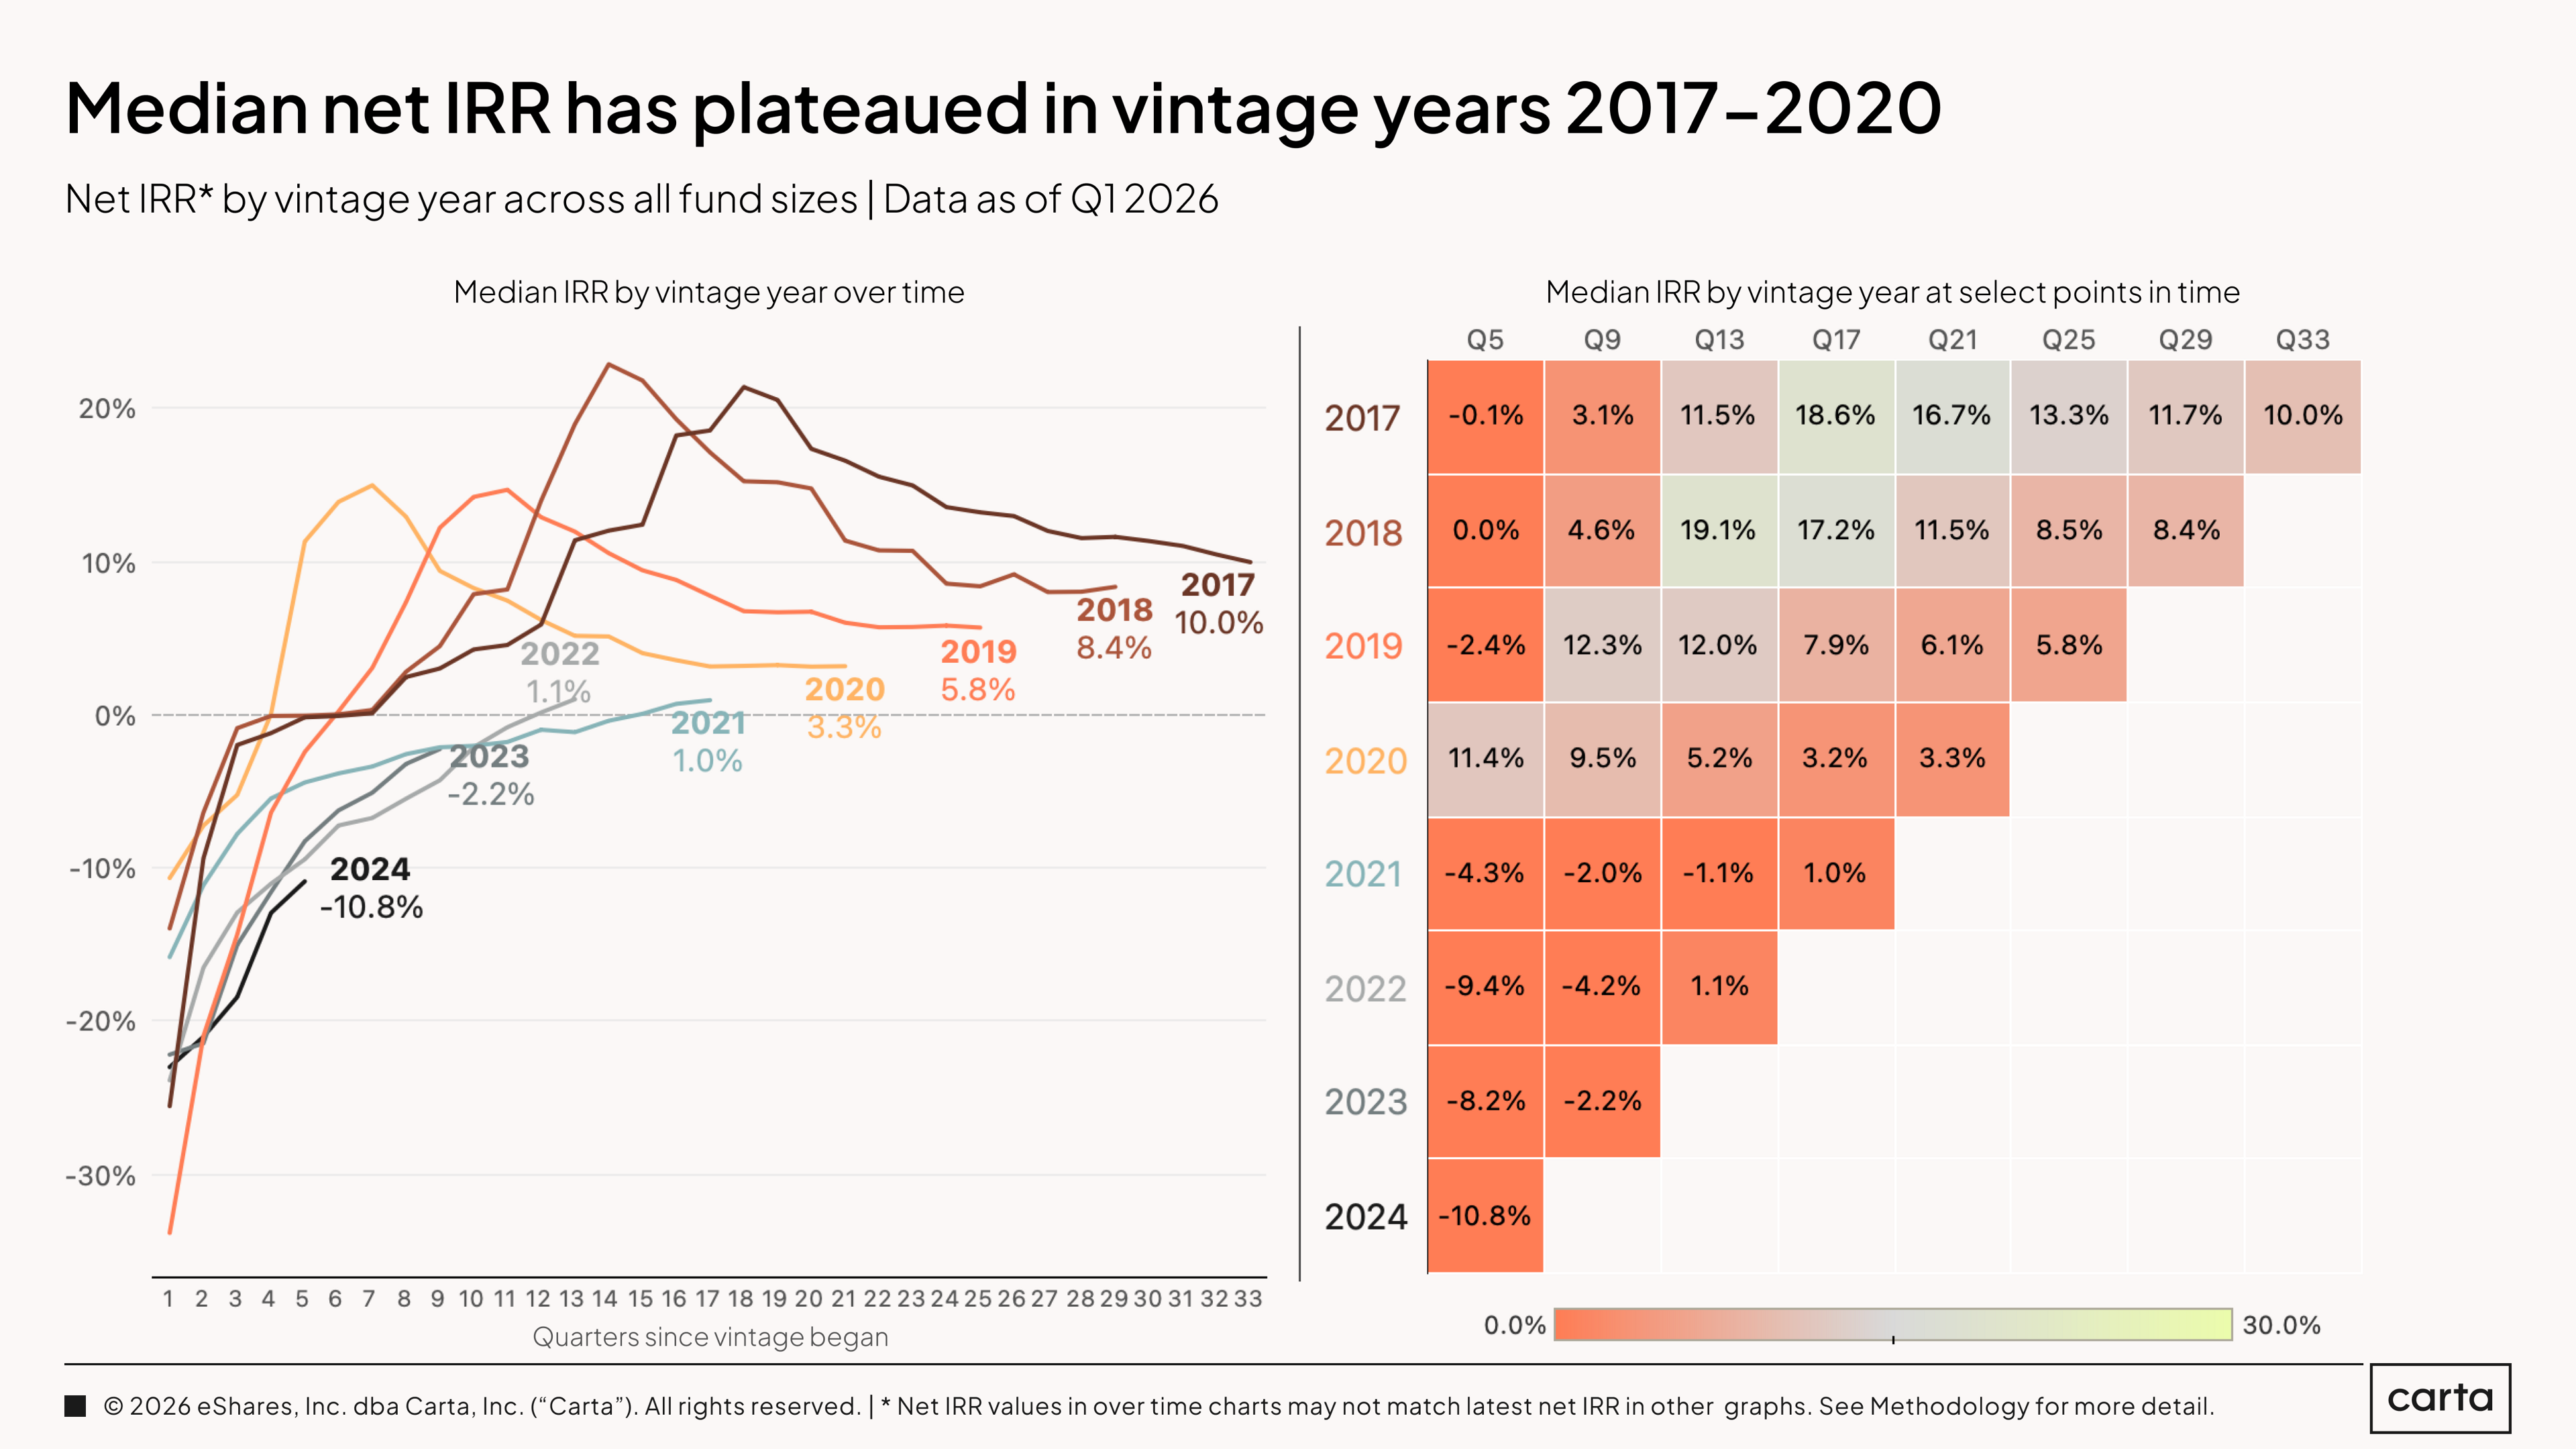
For the past few quarters, median net IRRs have remained mostly unchanged for each VC fund vintage from 2017 through 2020. In general, median IRRs for all four of these vintages have been on a downward trend for the past three to four years, a side effect of the valuation reset in 2022 . But the severity of that trend has lessened in more recent quarters, and for some vintages, the trend has flattened entirely.
Median net IRRs for more recent vintages, meanwhile, remain on a steady upward progression. This is to be expected, given the typical J-curve nature of IRR over time. For the most part, it’s still too early in the lifecycle of these post-2020 vintages to read anything too significant into their latest IRRs.
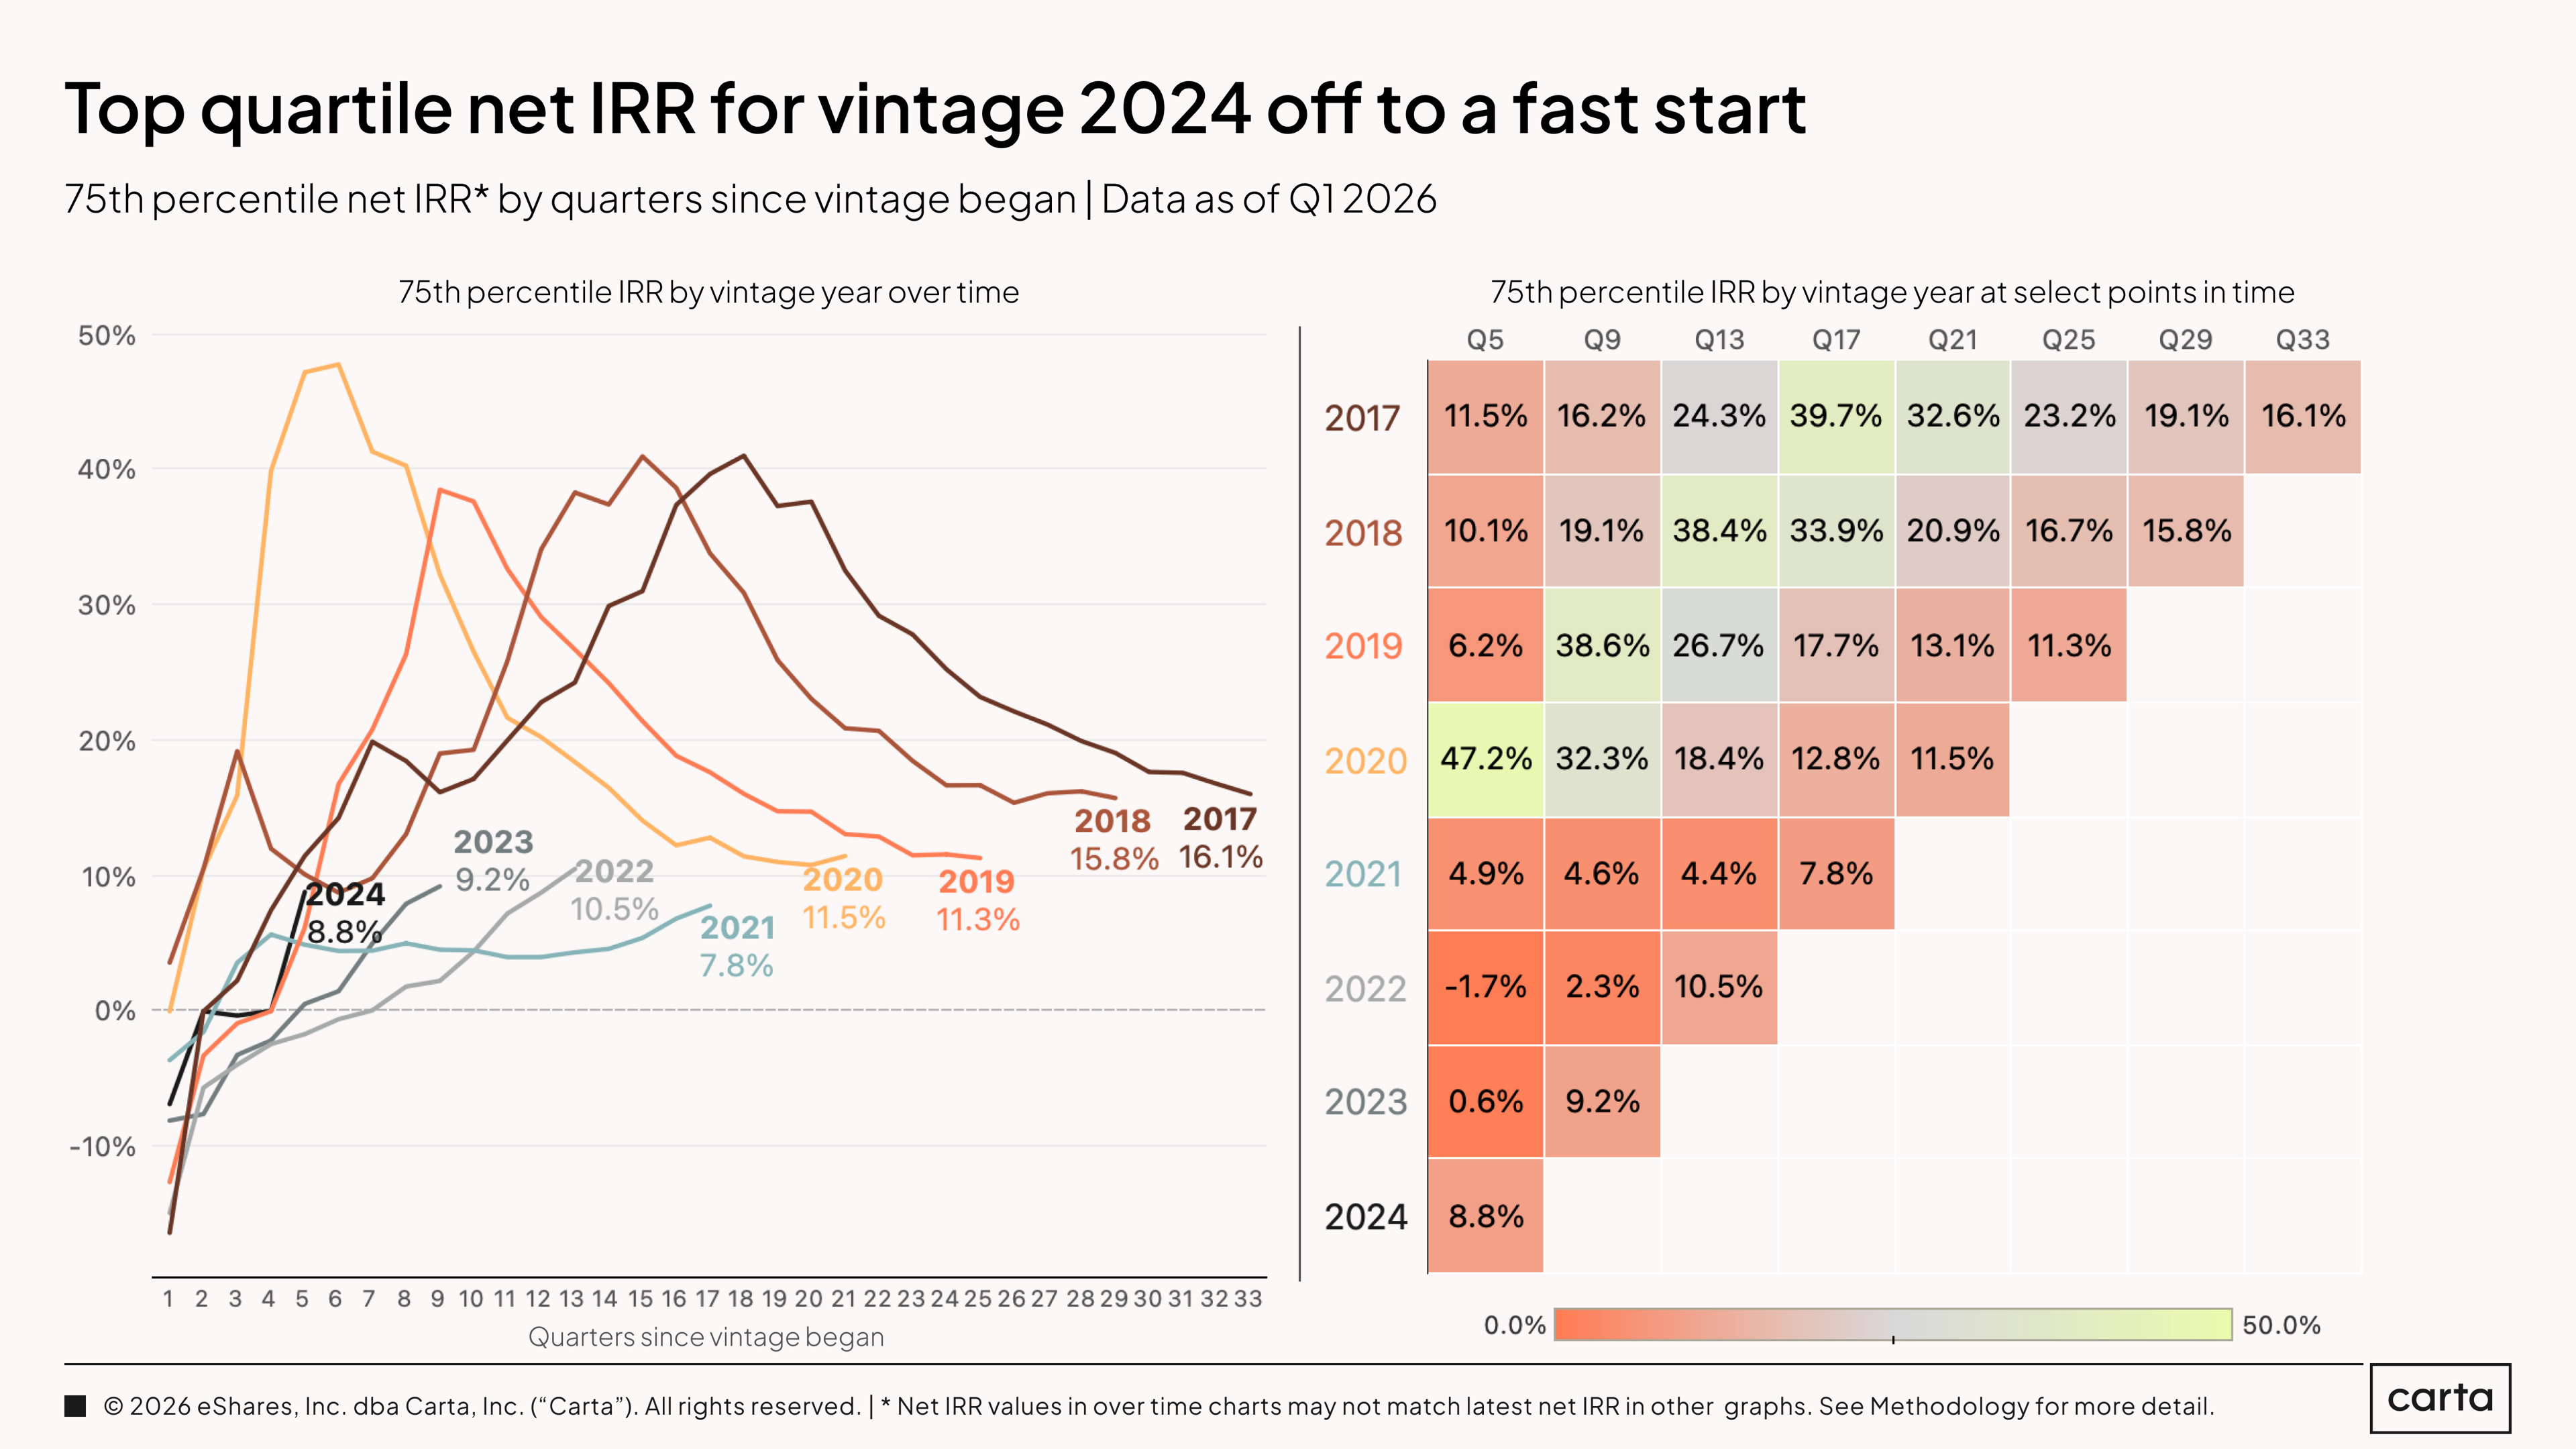
There’s still plenty of time for results to improve for the 2021 vintage of venture funds. At the moment, though, the 75th percentile for net IRR among 2021 funds is the lowest of any of the eight vintages shown here. While funds are still being actively managed, it’s typical for each vintage to have higher IRR than any younger, newer vintages that came after it. Yet in this case, the 2022, 2023, and 2024 vintages each have higher top-quarter IRRs than 2021, once again reflecting the less-than-promising start for 2021 funds as a whole.
Top-quartile IRRs increased last quarter for every vintage from 2020 through 2024, and they decreased for each vintage from 2017 through 2019. The 75th percentile for IRR among the 2017 and 2018 vintages both continue to fall after rising above 40% around three years ago.
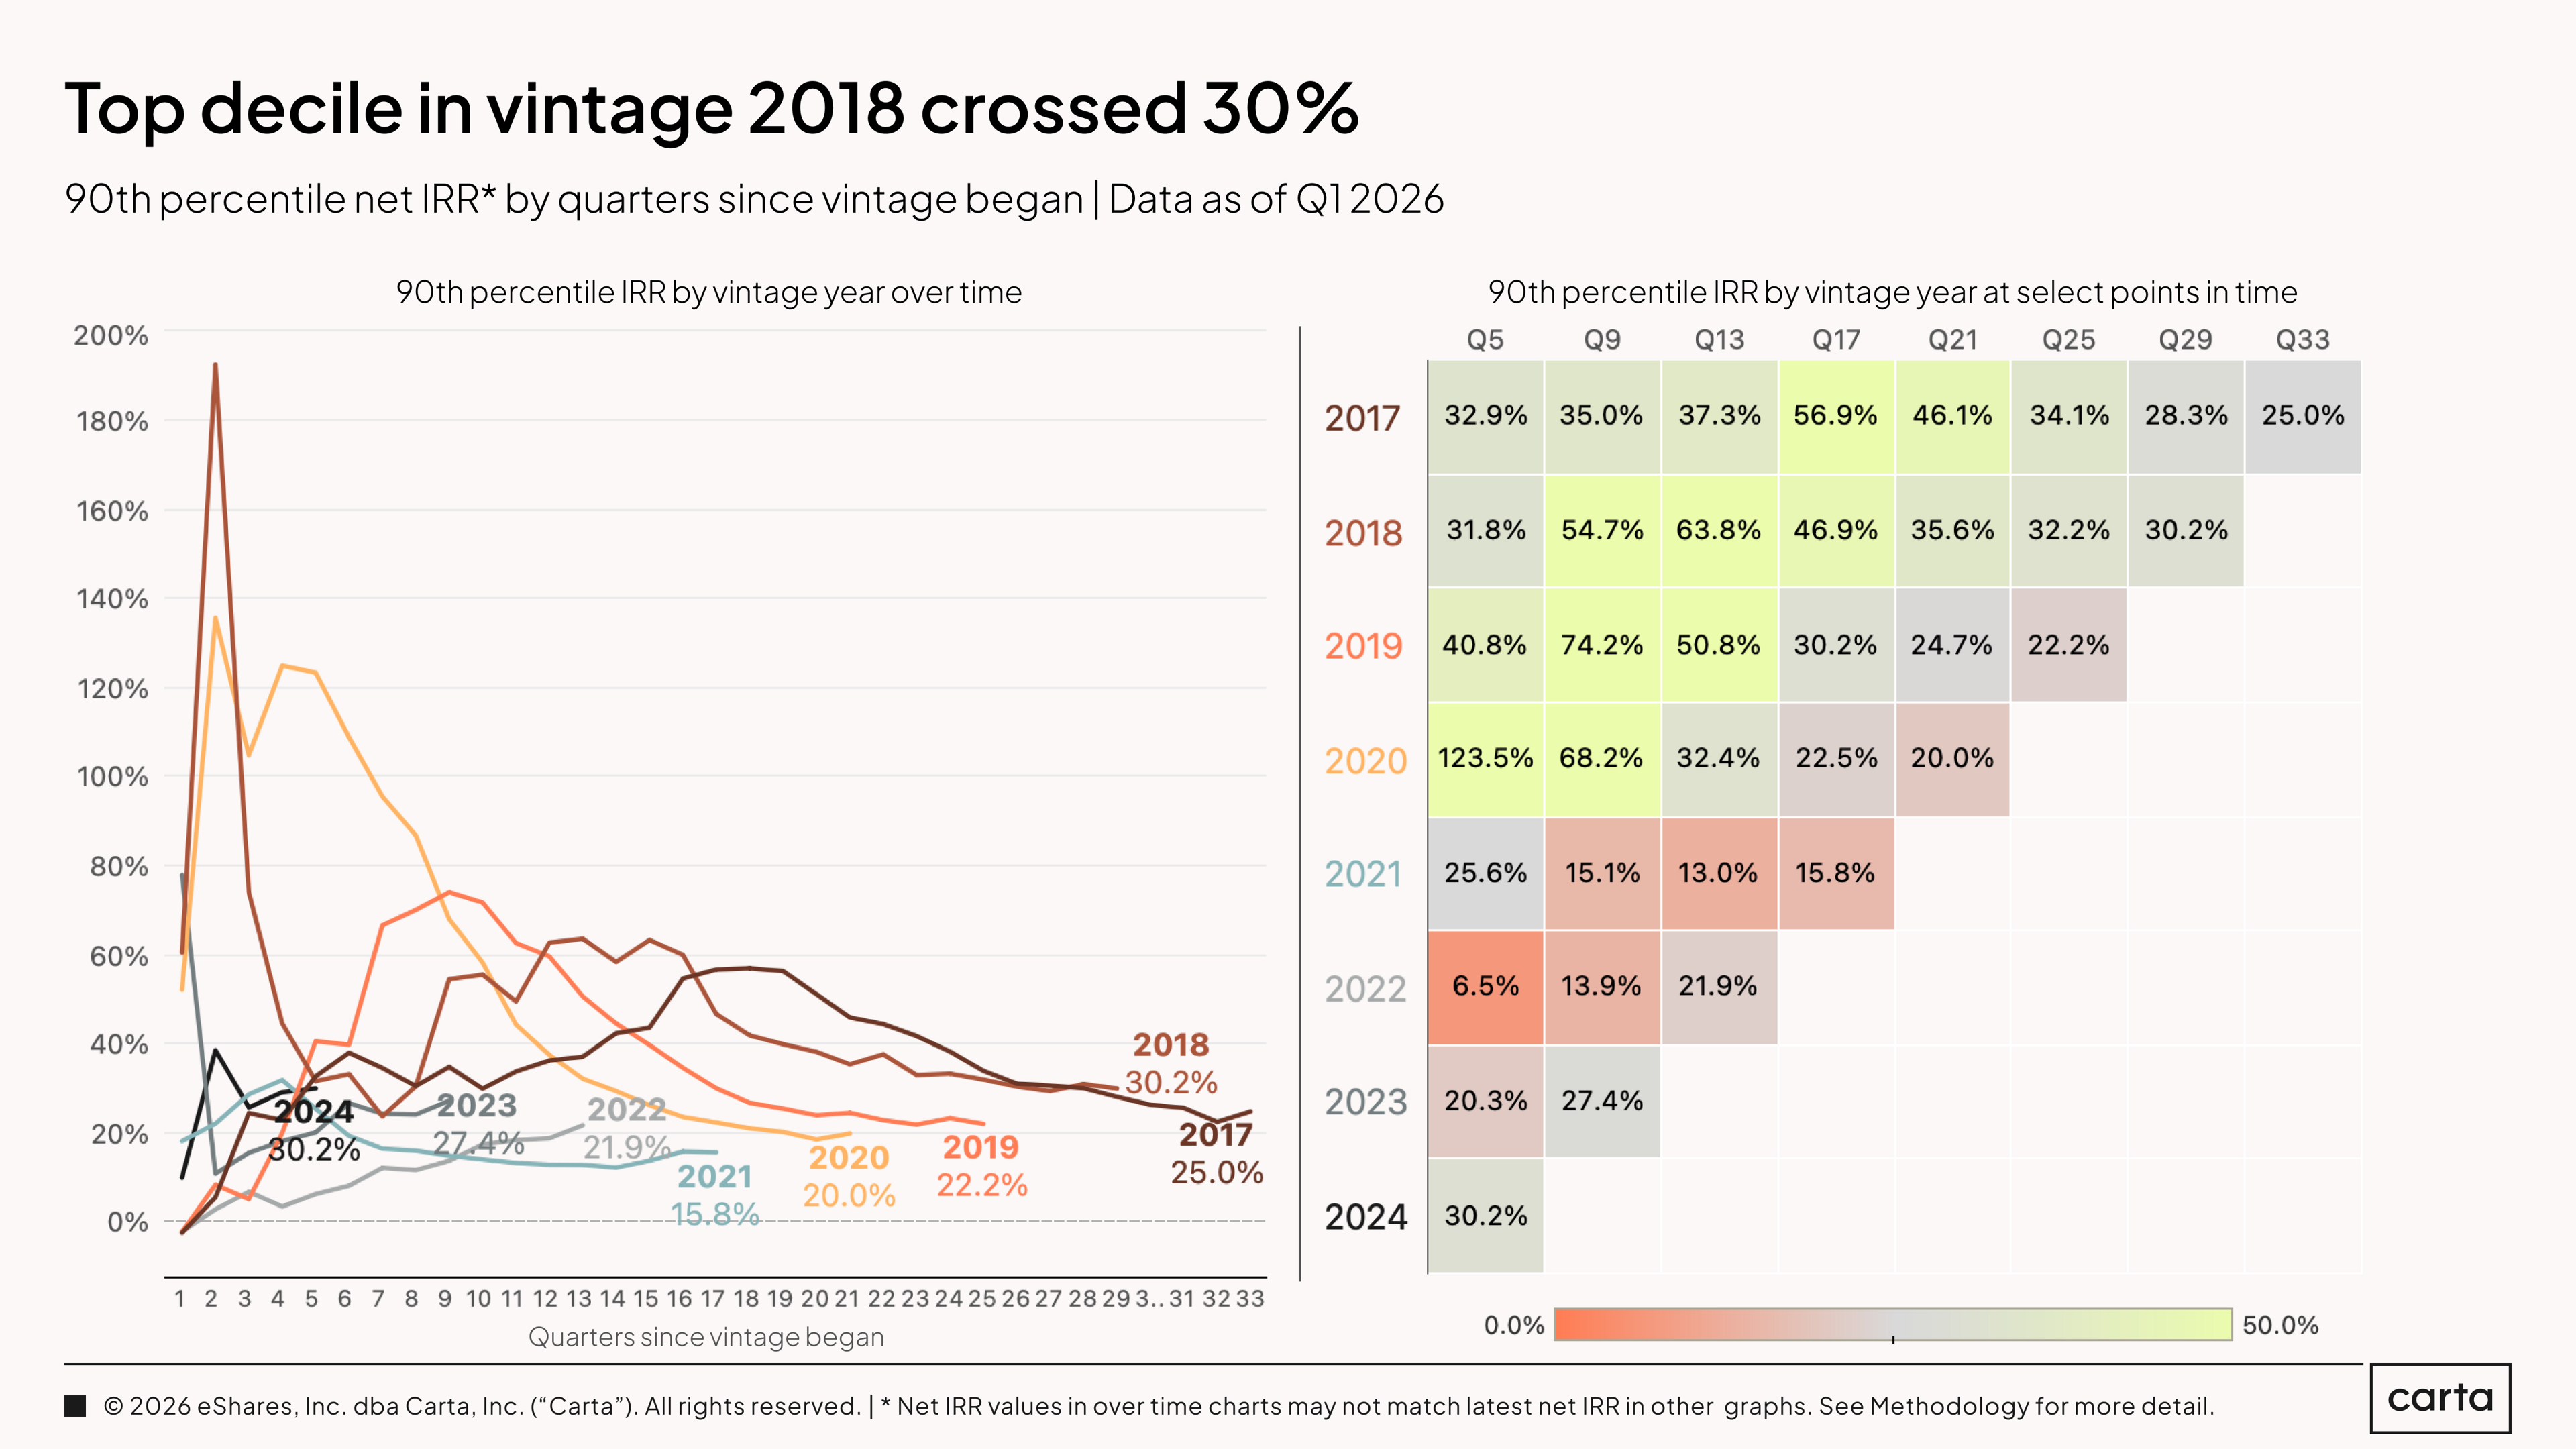
The 90th percentile for net IRR among the 2018 vintage of VC funds currently sits at 30.2% after 29 quarters of active management, surpassing where the top-decile performance for the 2017 vintage sat at the same point in time. As is the case at other performance thresholds, 90th percentile IRRs for the older vintages shown here have largely flattened out in recent quarters after sharper declines in 2022 and 2023.
The best-performing funds from the 2024 vintage are off to a sizzling start, with a current 90th percentile net IRR of 30.2%, matching the current highest figure from any of the eight vintages shown here. It’s an impressive mark, but it’s still a far cry from the early results previously seen from the 2018 and 2020 vintages, each of which saw top-decile IRRs soar above 100% during their first few quarters of management.
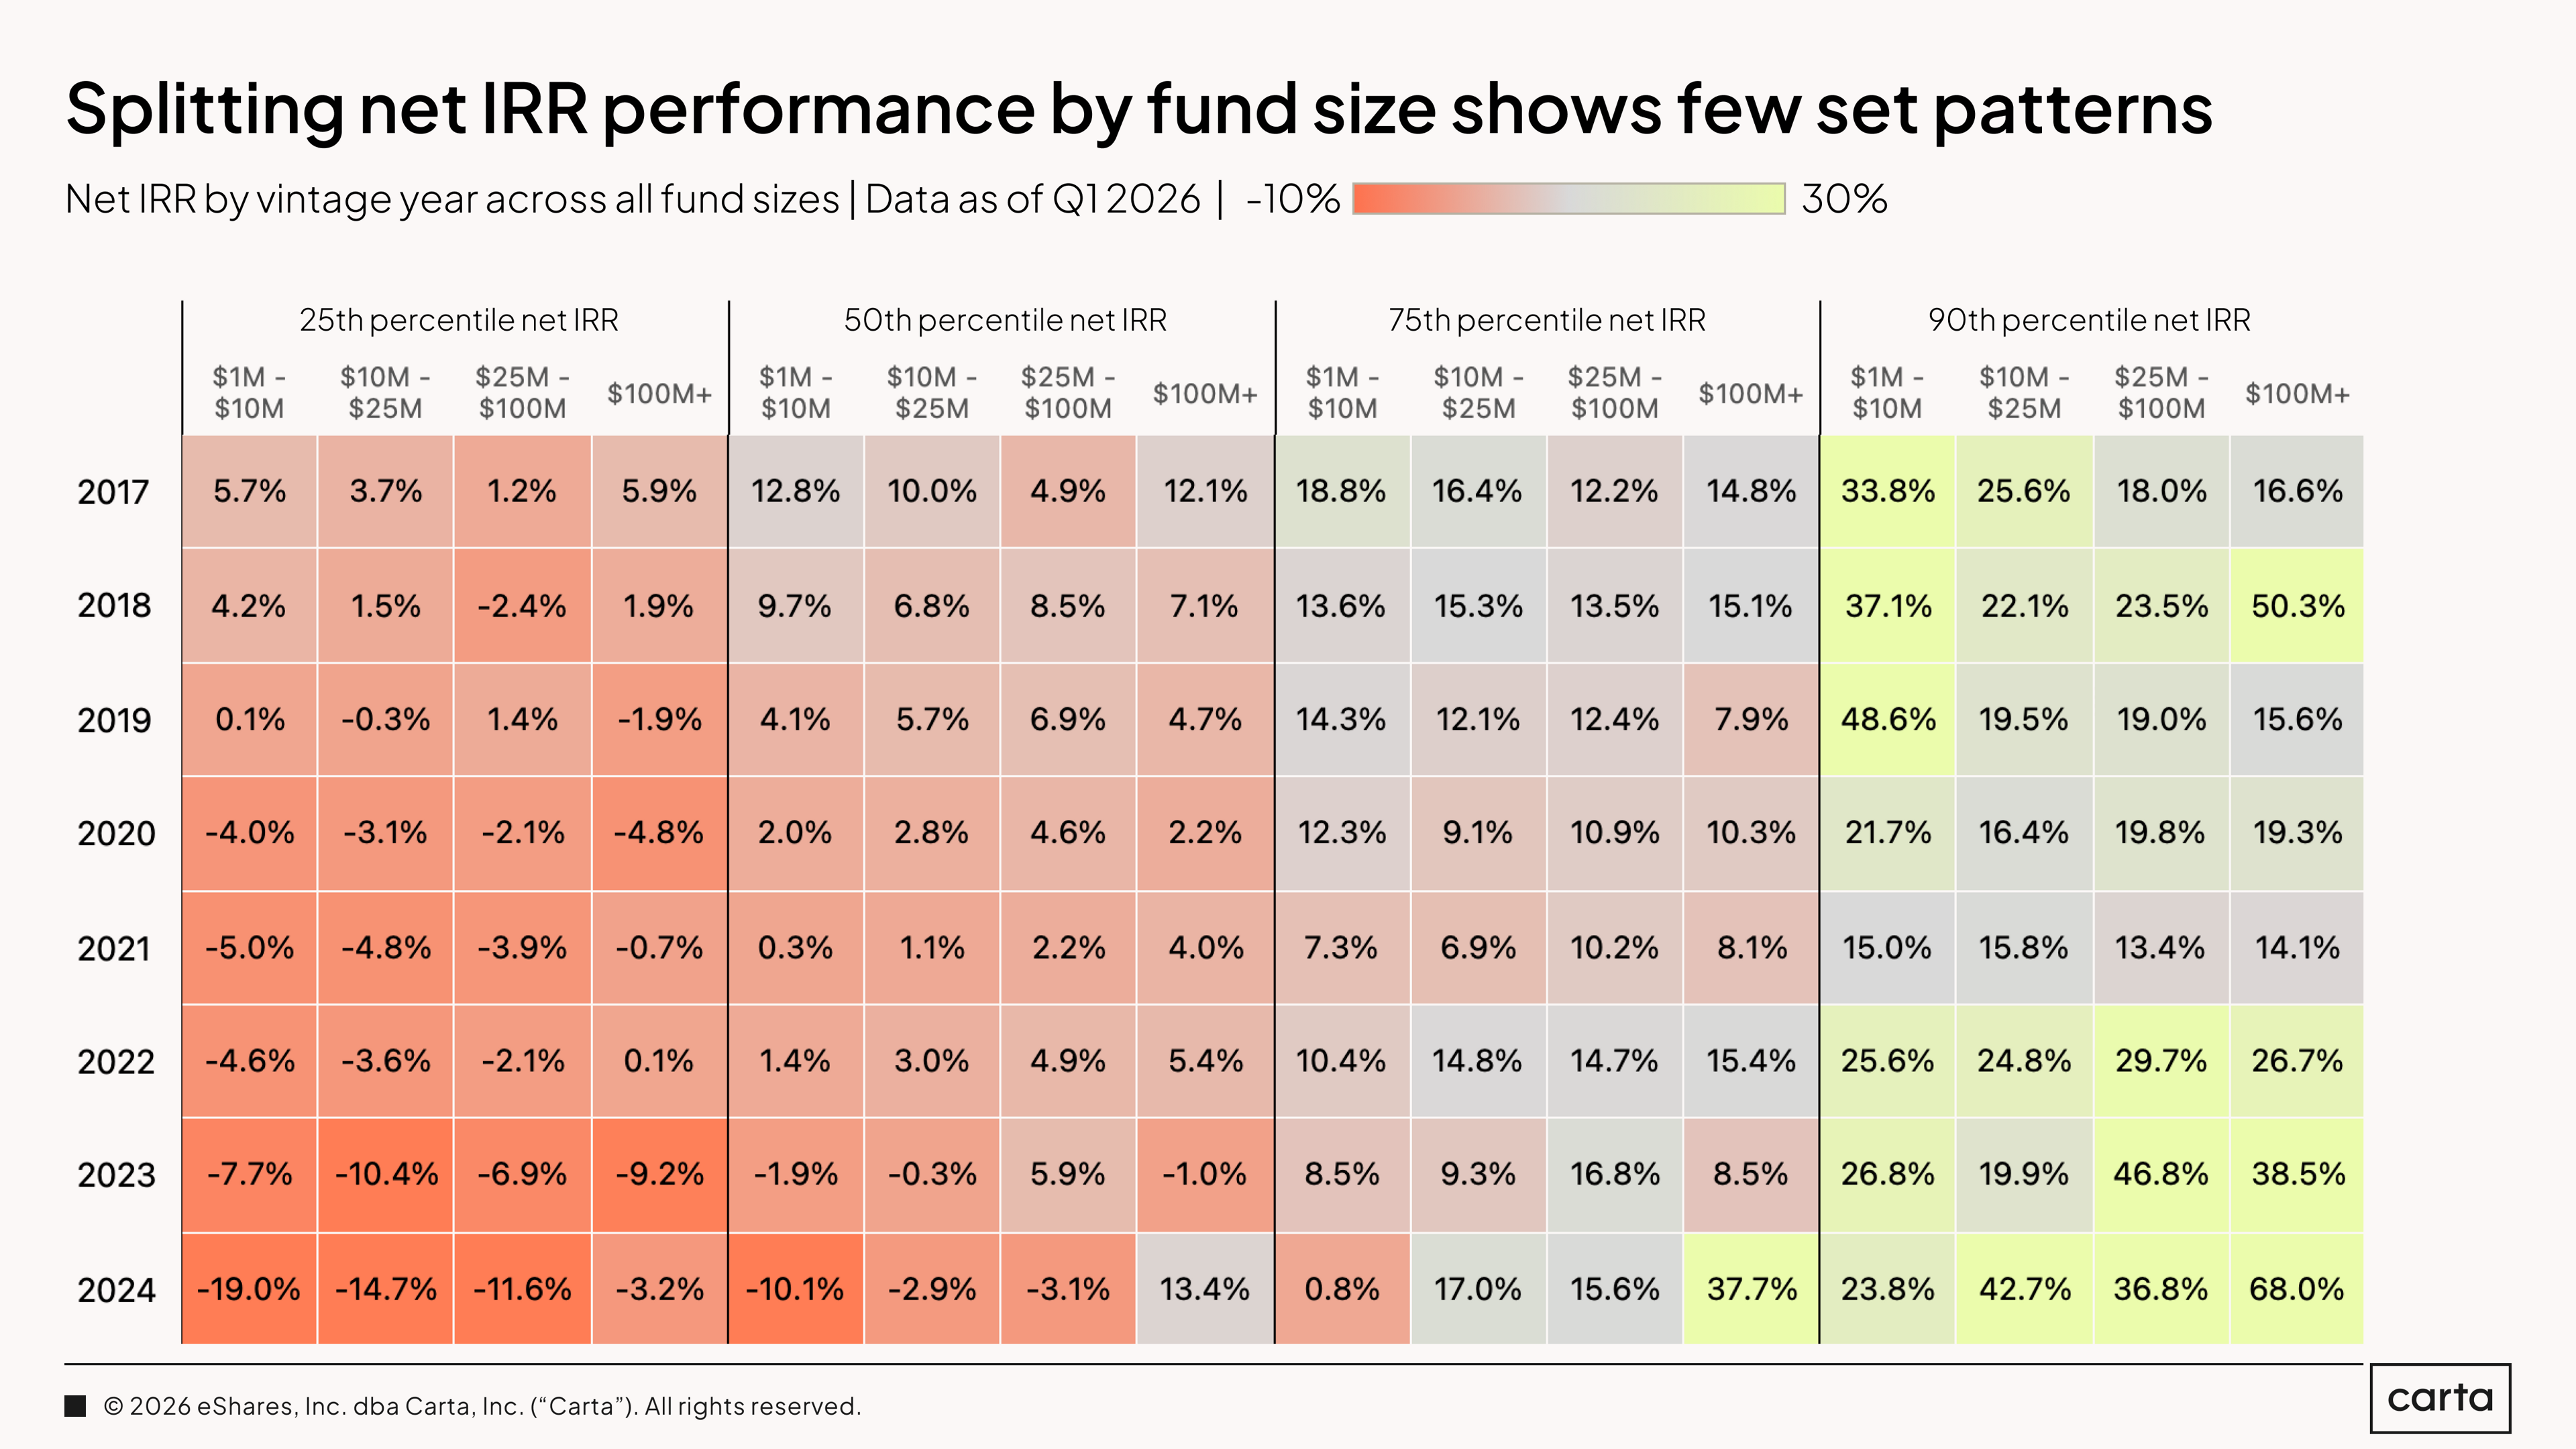
The above table breaks down the latest IRR figures across various key performance thresholds for each VC vintage from 2017 through 2024. The data reveals few consistent patterns. For example, in the 2017 vintage, the 90th percentile IRR for the smallest funds ($1 million to $10 million in size) is more than twice as high as the 90th percentile IRR for the largest funds (over $100 million). In the 2018 vintage, on the other hand, the 90th percentile IRR is substantially higher for the largest funds (50.3%) than for the smallest (37.1%).
For funds of most sizes across most of these vintages, the upper quartile of vehicles can claim net IRRs higher than 10%. For the bottom half of all funds, single-digit IRRs are the norm.
TVPI
TVPI is calculated by a relatively simple formula: Add up the latest value of the fund’s realized investments and its current holdings, and divide that combined value by the sum of the total capital paid into the fund. A 2x TVPI, for instance, means the current value of the fund is two times higher than the amount of capital its investors originally paid in.
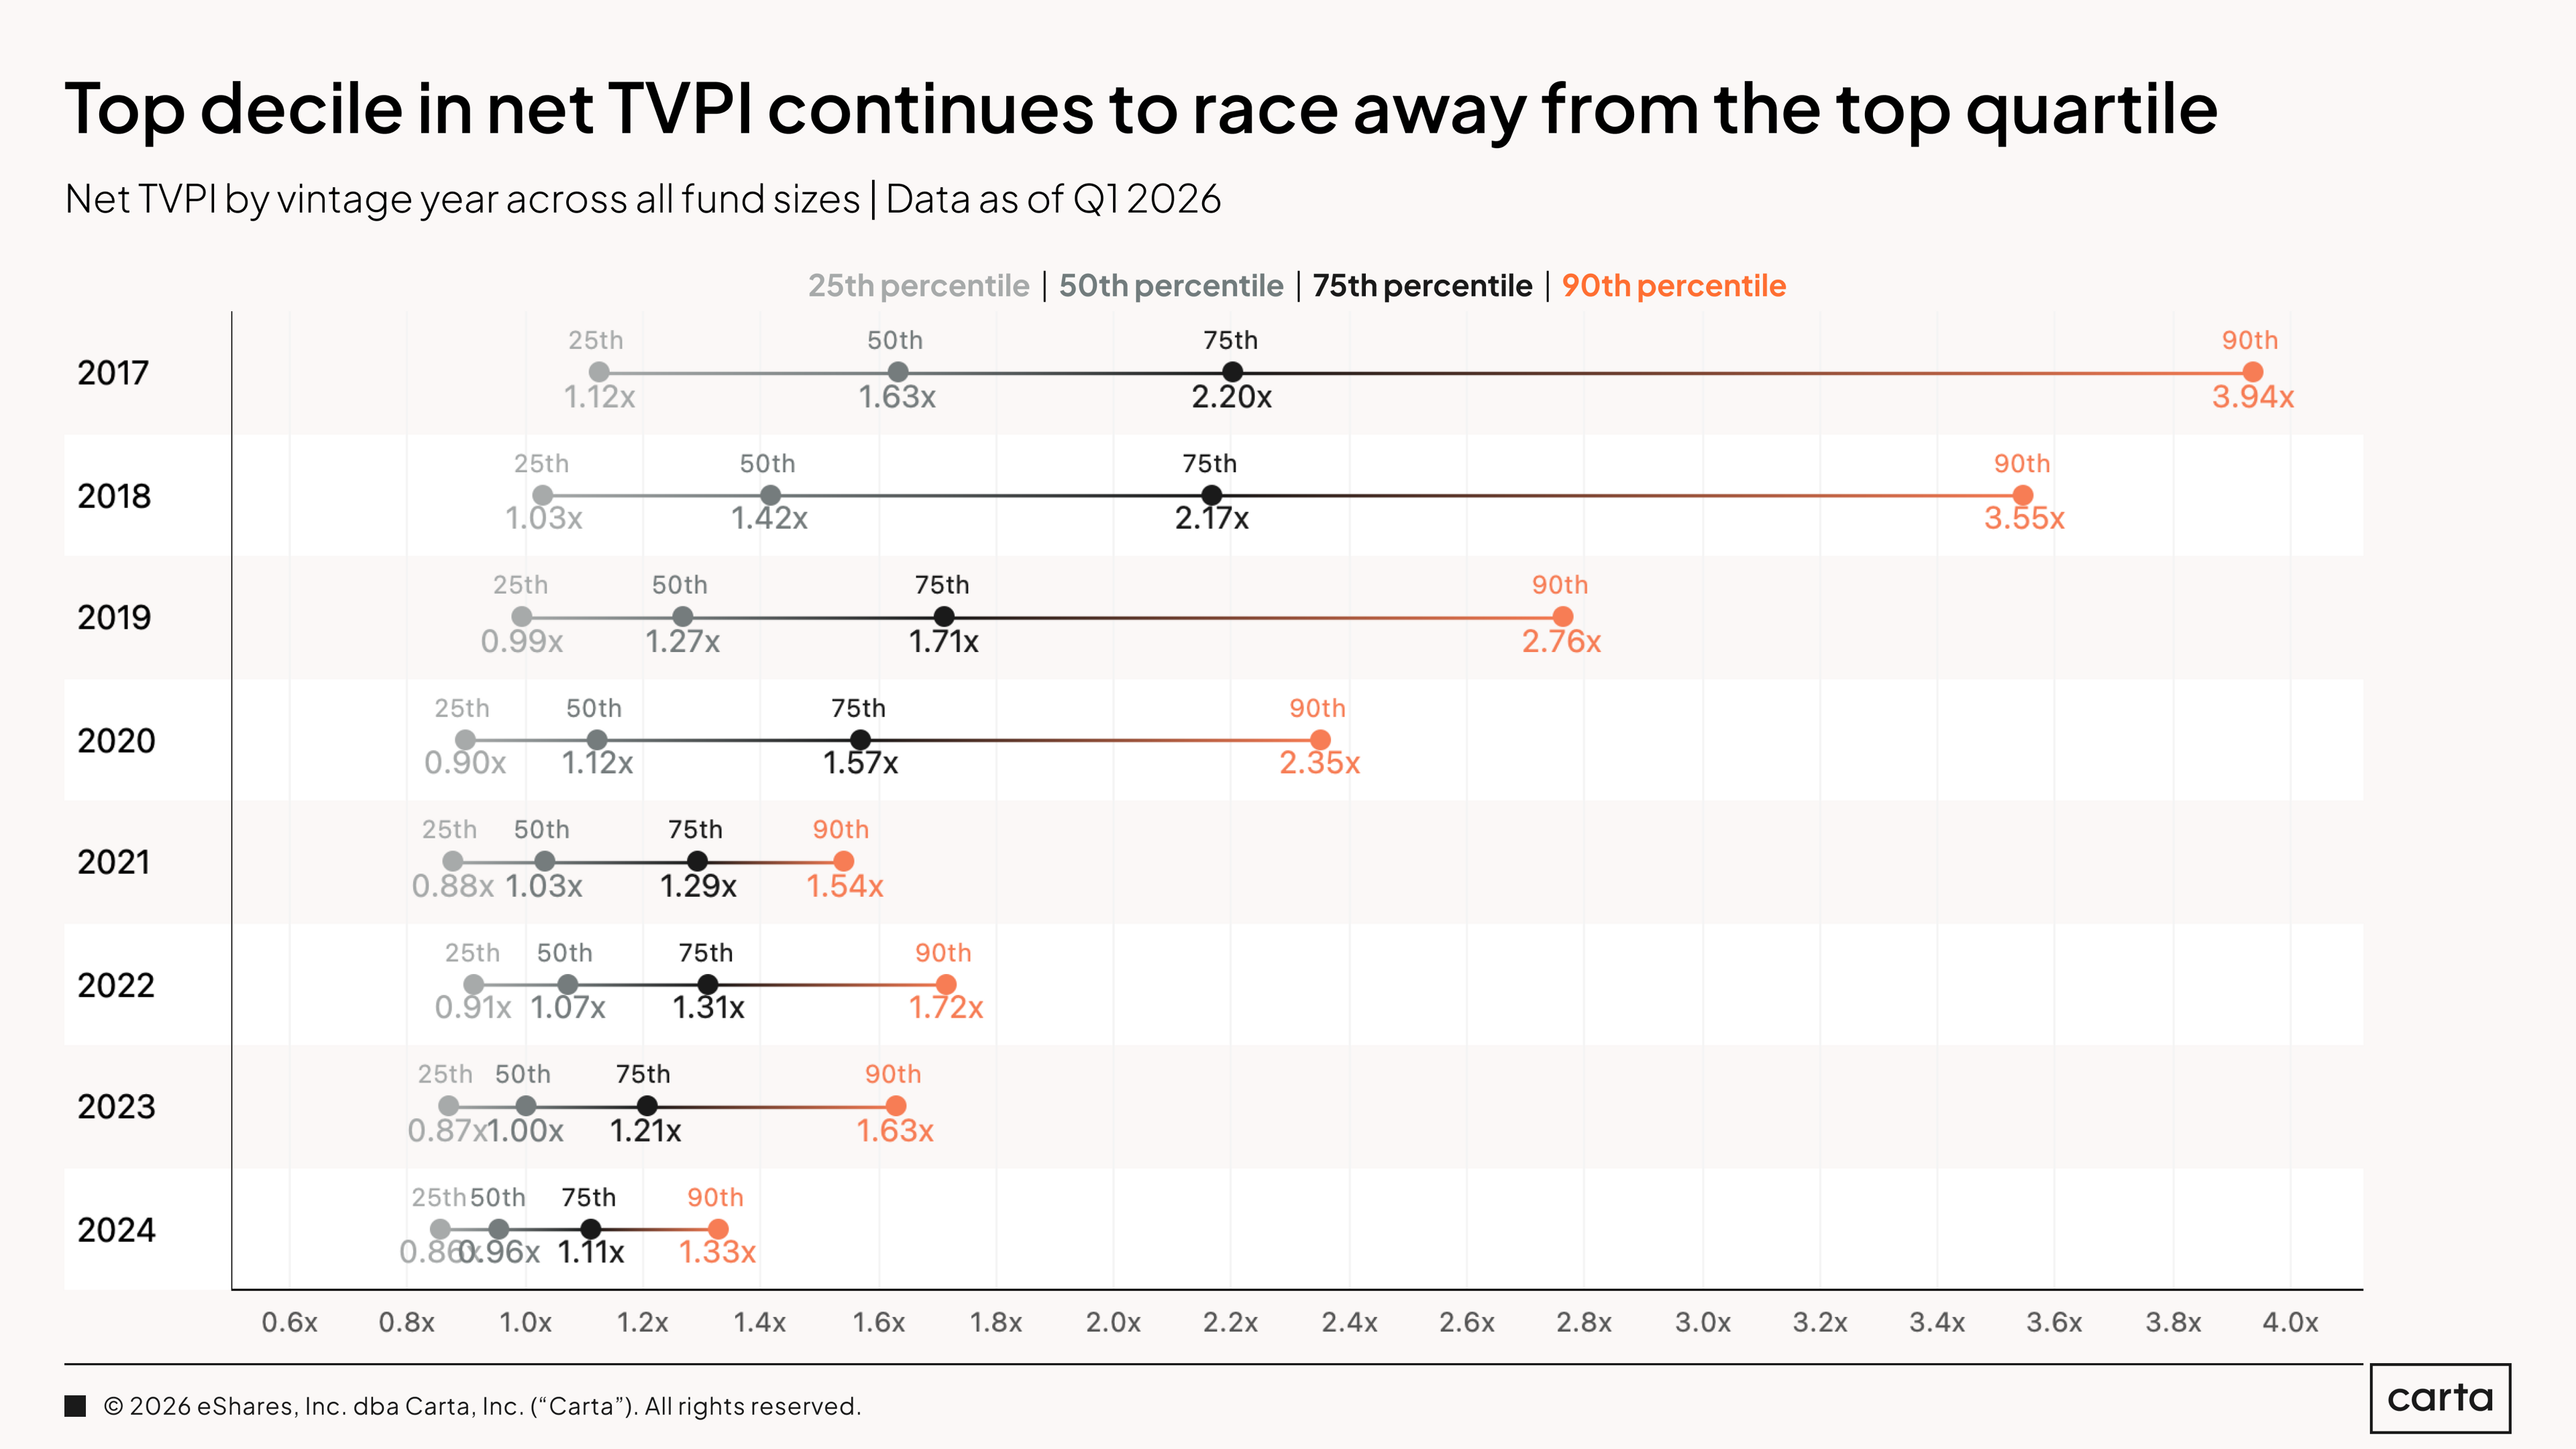
There’s a clear divide in current TVPI statistics between VC vintages from 2020 and earlier and those from 2021 and later. In the earlier vintages, medians are substantially above 1x, and top-decile TVPIs are well over 2x. In the case of the 2017 and 2018 vintages, the 90th percentiles are approaching 4x. In the vintages from 2021 through 2024, on the other hand, results are much more clustered, reflecting the fact that funds in these cohorts have had far less time for their portfolios to appreciate.
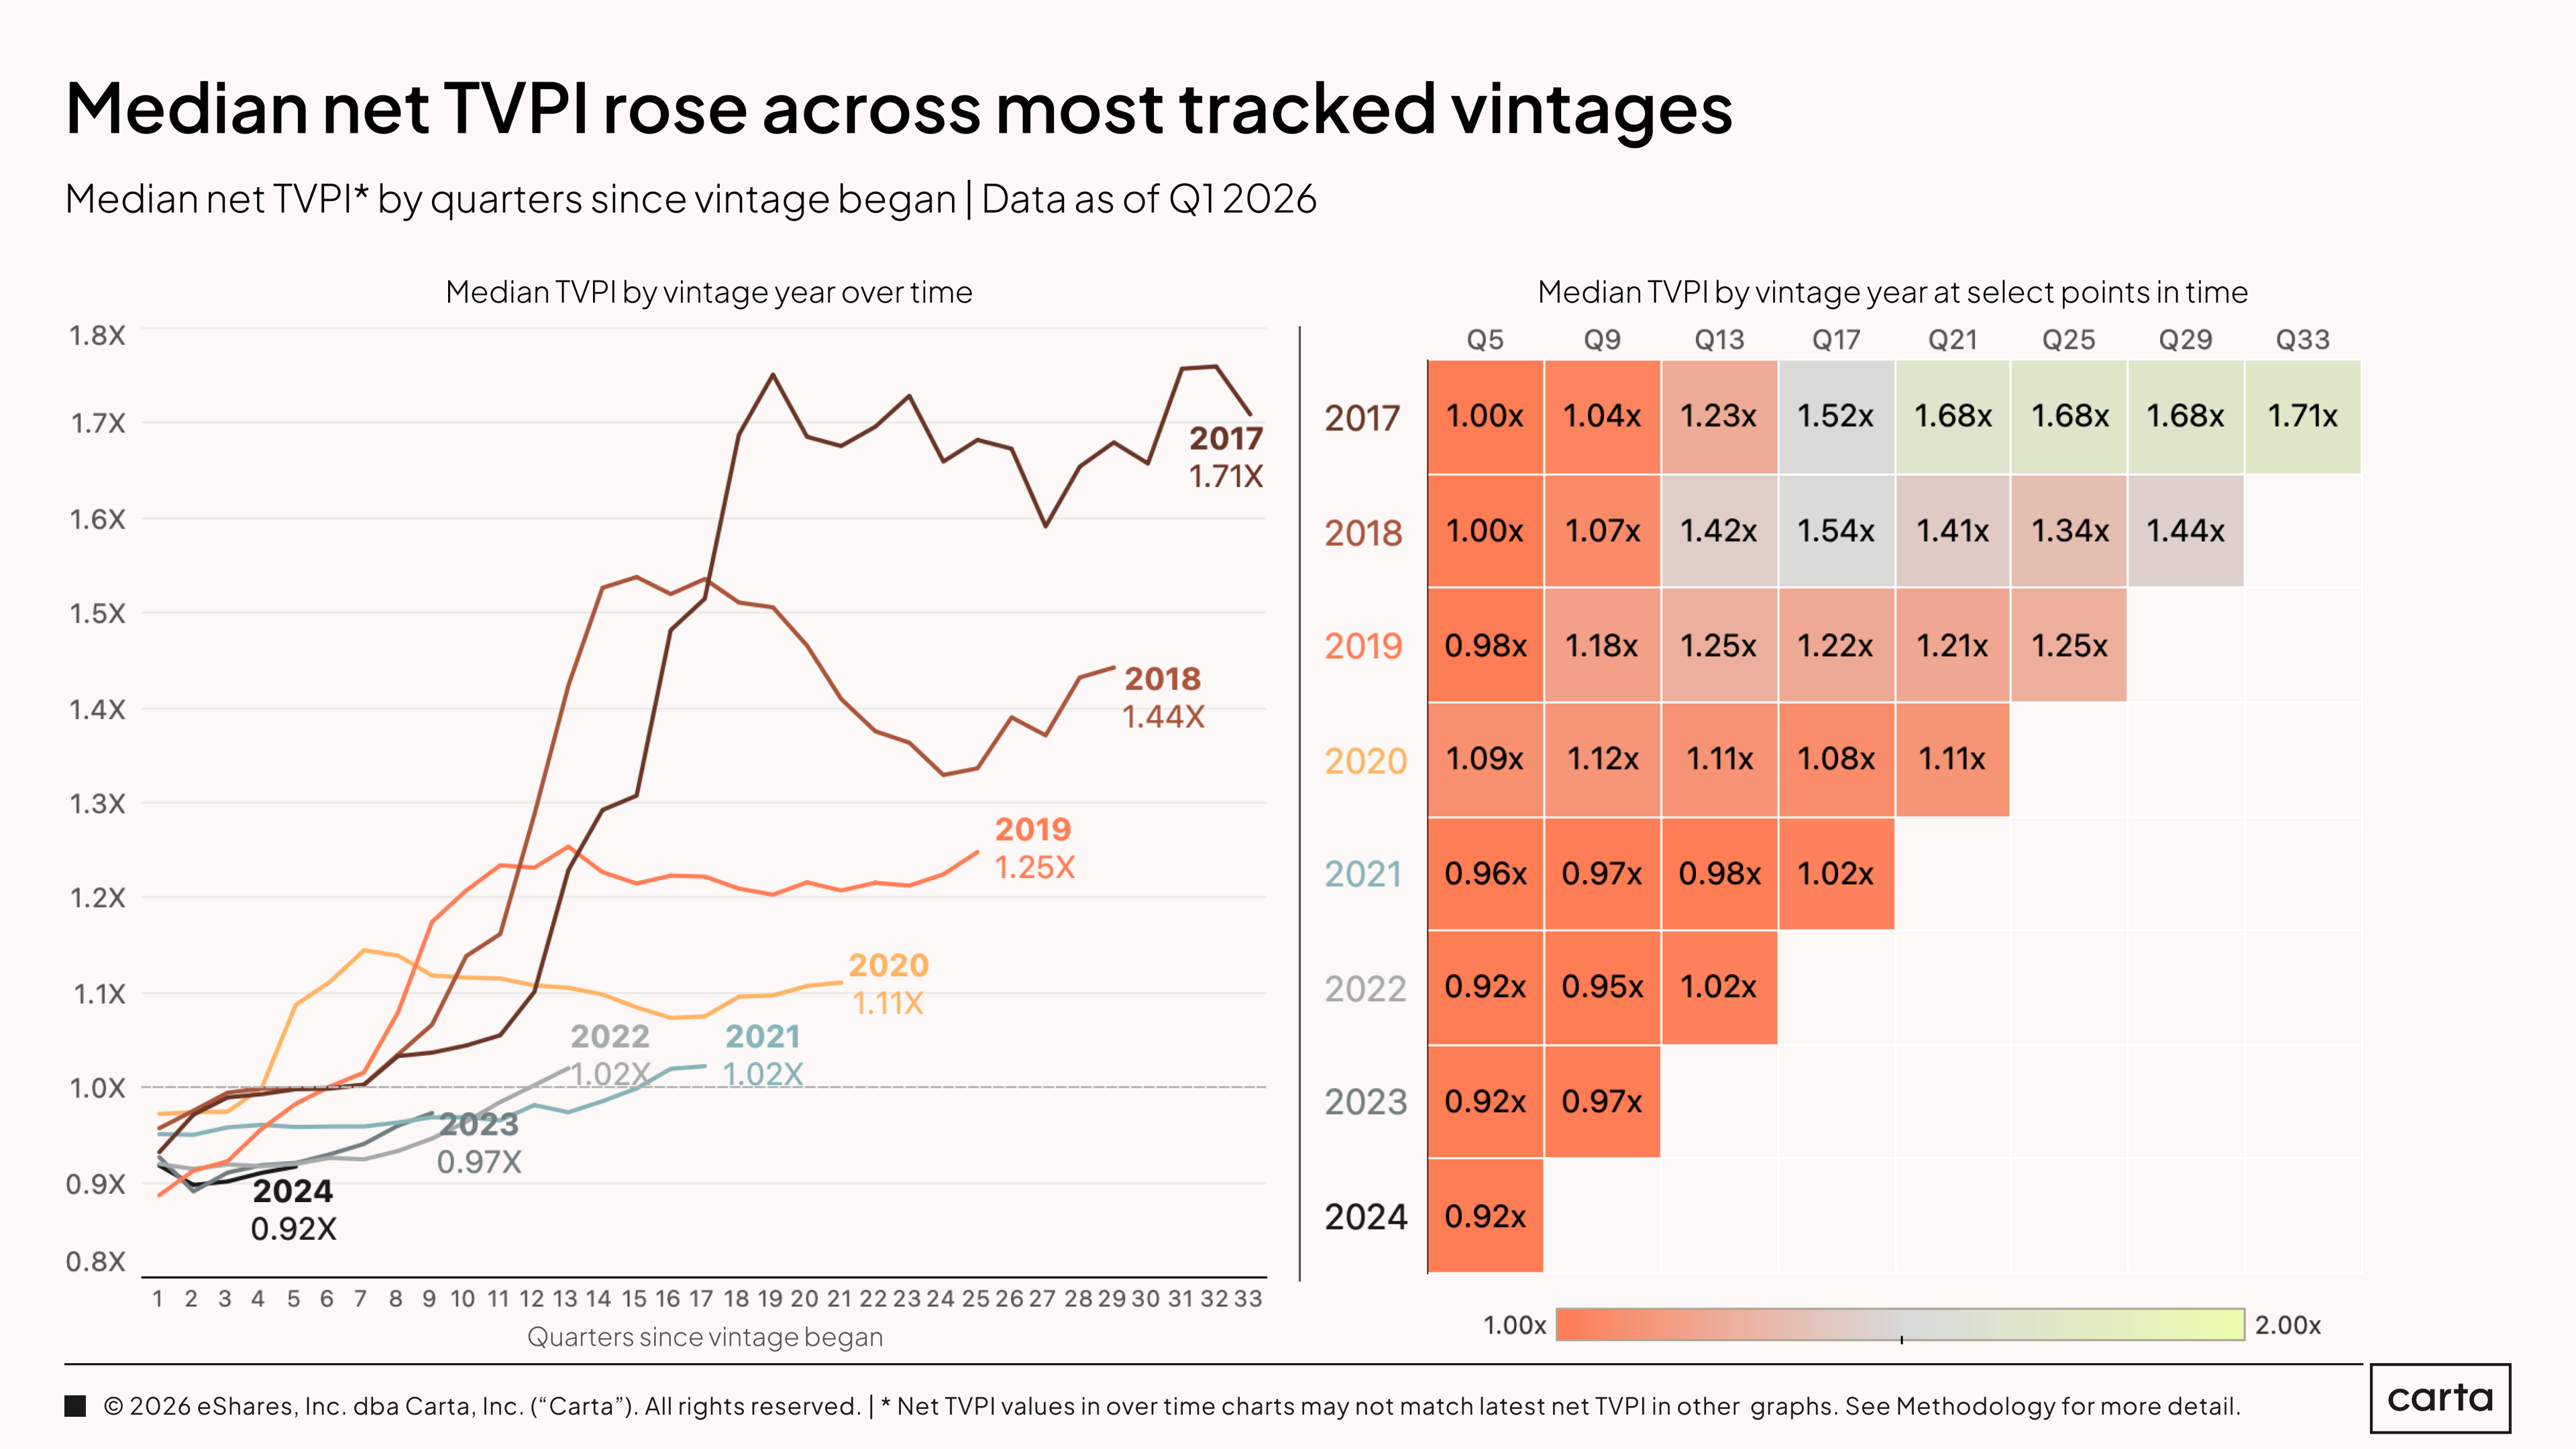
The median net TVPI increased in Q1 2026 for each vintage shown here except for 2017—and the 2017 vintage has still trended up notably over the past six quarters. In general, the overall values of median funds from these recent vintages have been climbing steadily over the past year and half, although it’s worth emphasizing that most of these gains are still on paper.
Median TVPIs for both the 2021 and 2022 vintages recently crossed into positive territory, with both currently sitting at 1.02x. Current median performance for each vintage from 2021 through 2024 is still lagging well behind where vintages from 2017 through 2020 sat at the same points in time.
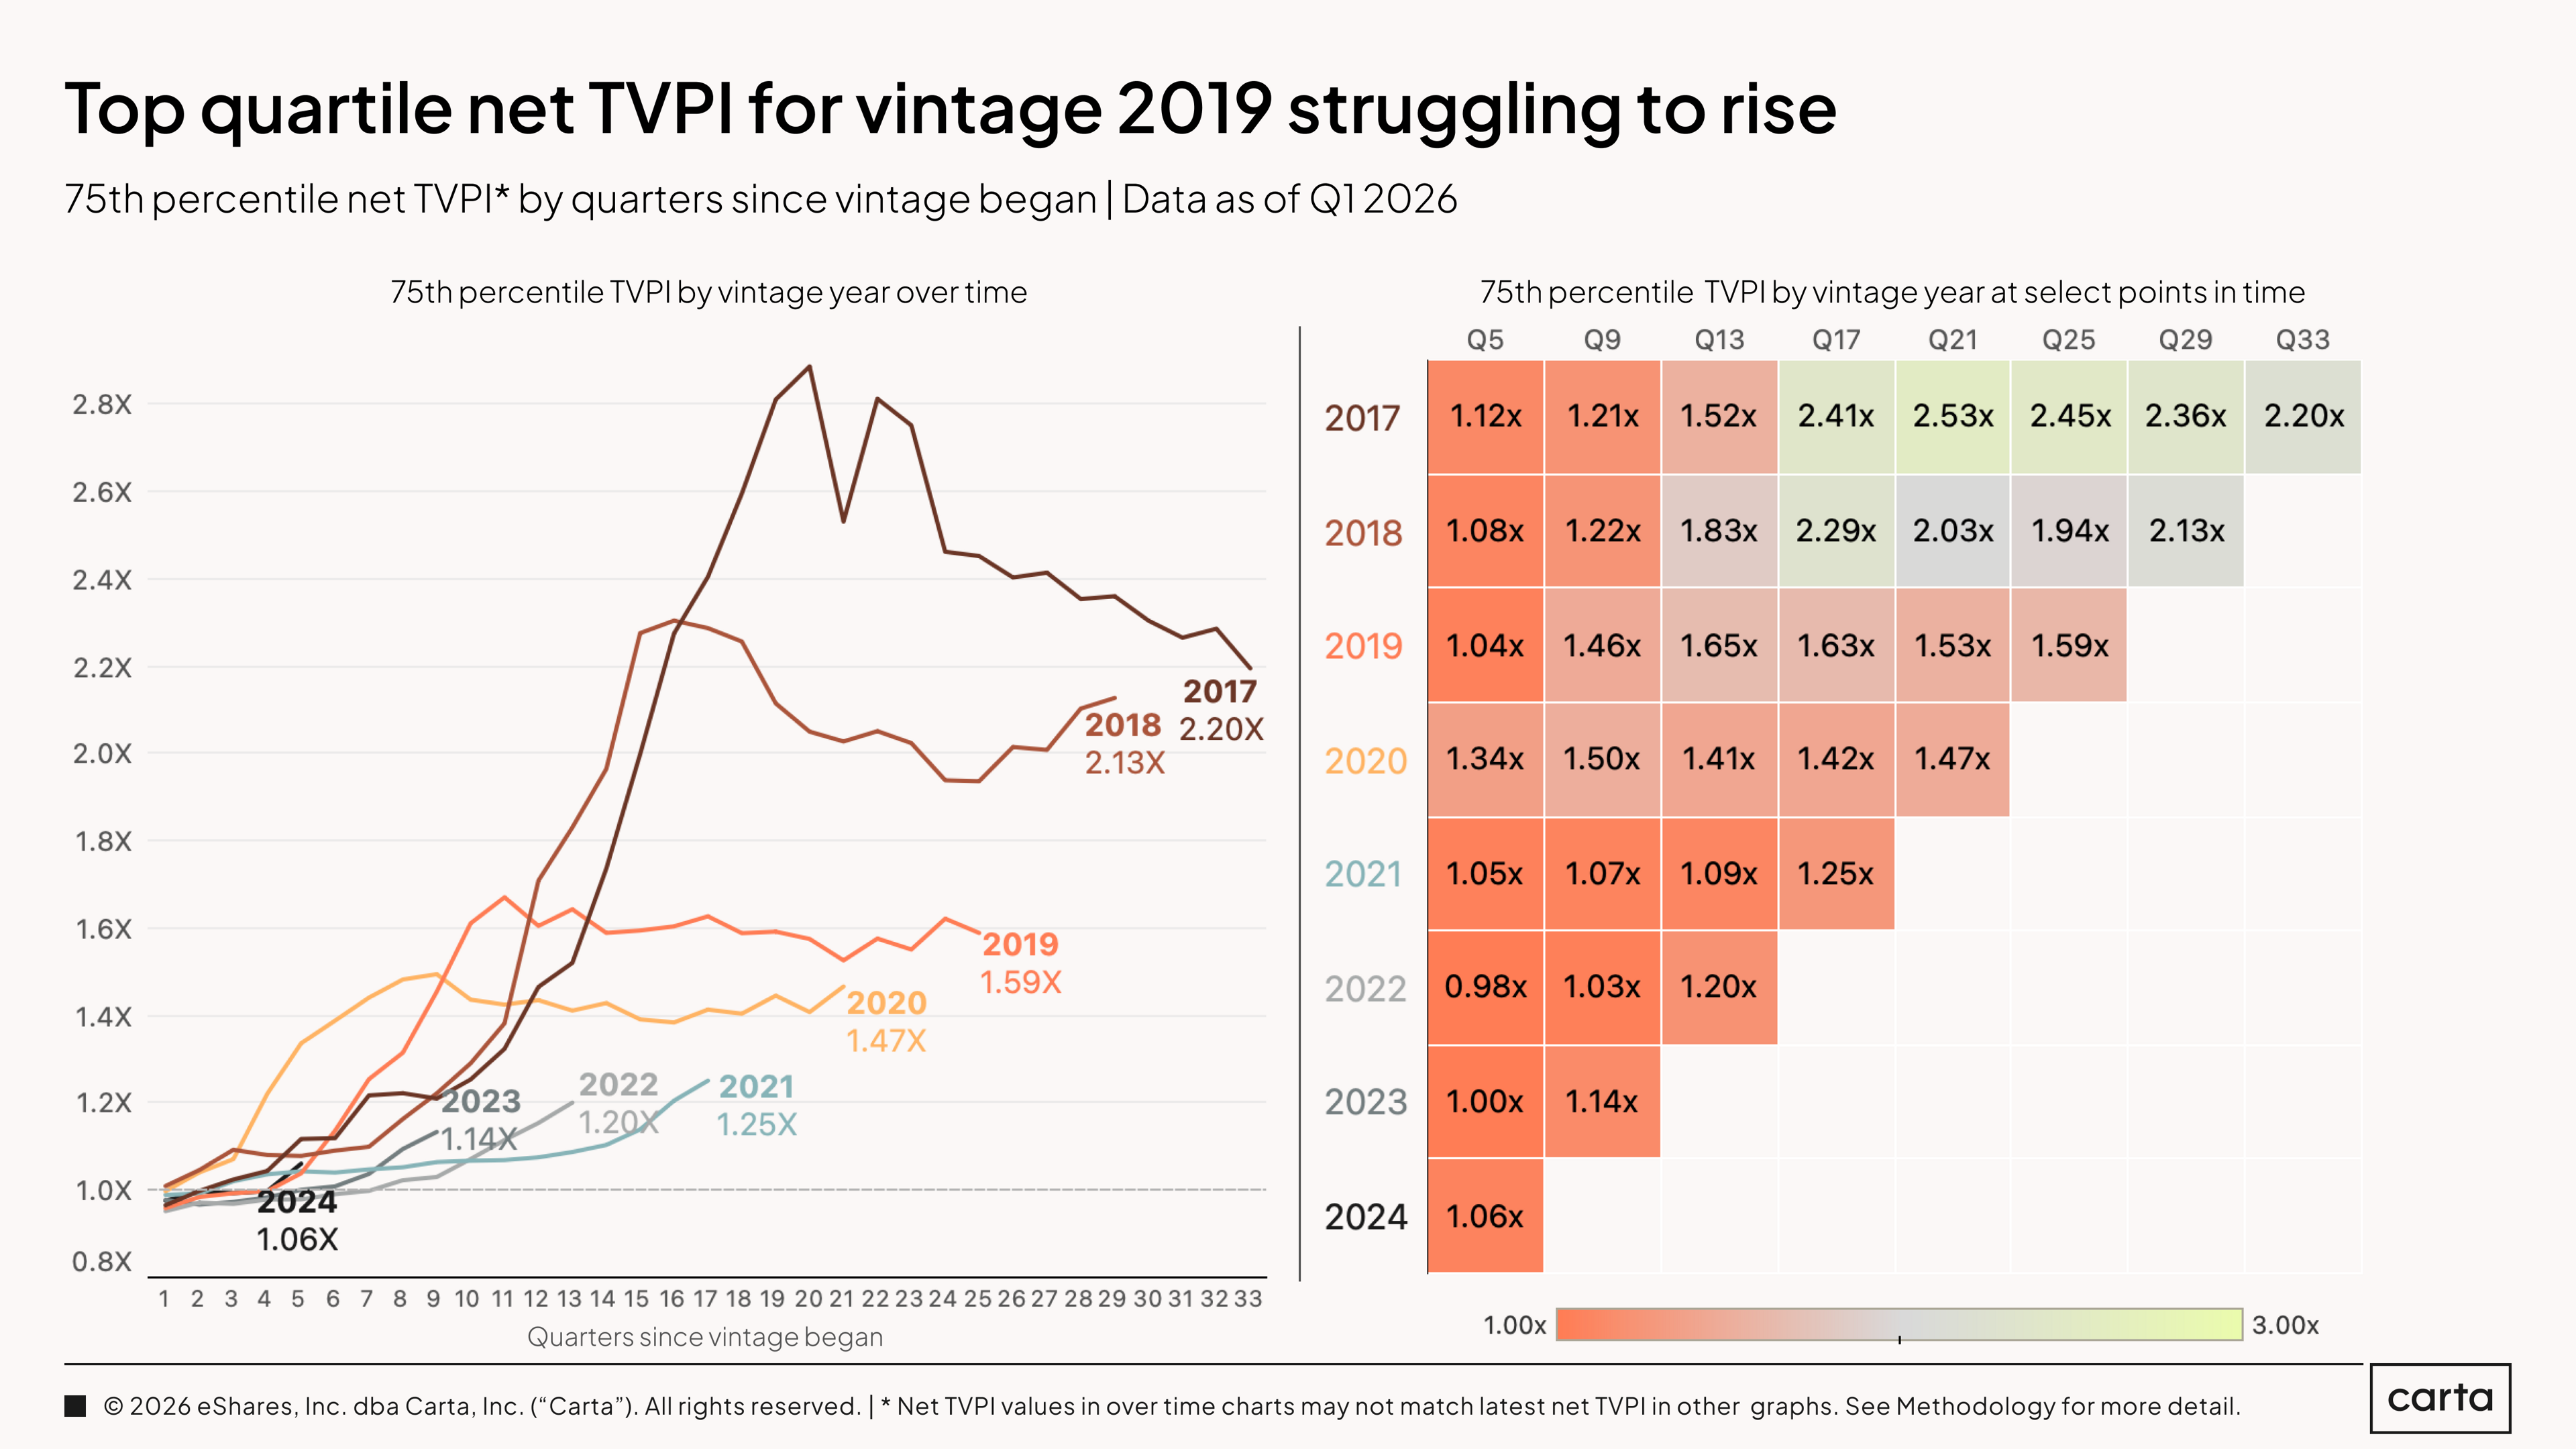
Top-quartile net TVPIs are also moving in the right direction for most recent vintages. But the 2017 and 2019 cohorts are notable exceptions.
In the case of 2017, the 75th percentile for net TVPI has now been trending downward for three consecutive years, with no end in sight. In fact, the negative slope of the trendline grew even steeper in Q1 2026. In the case of 2019, top-quartile TVPI has been rising one quarter and falling the next for much of the past four years, to minimal net effect.
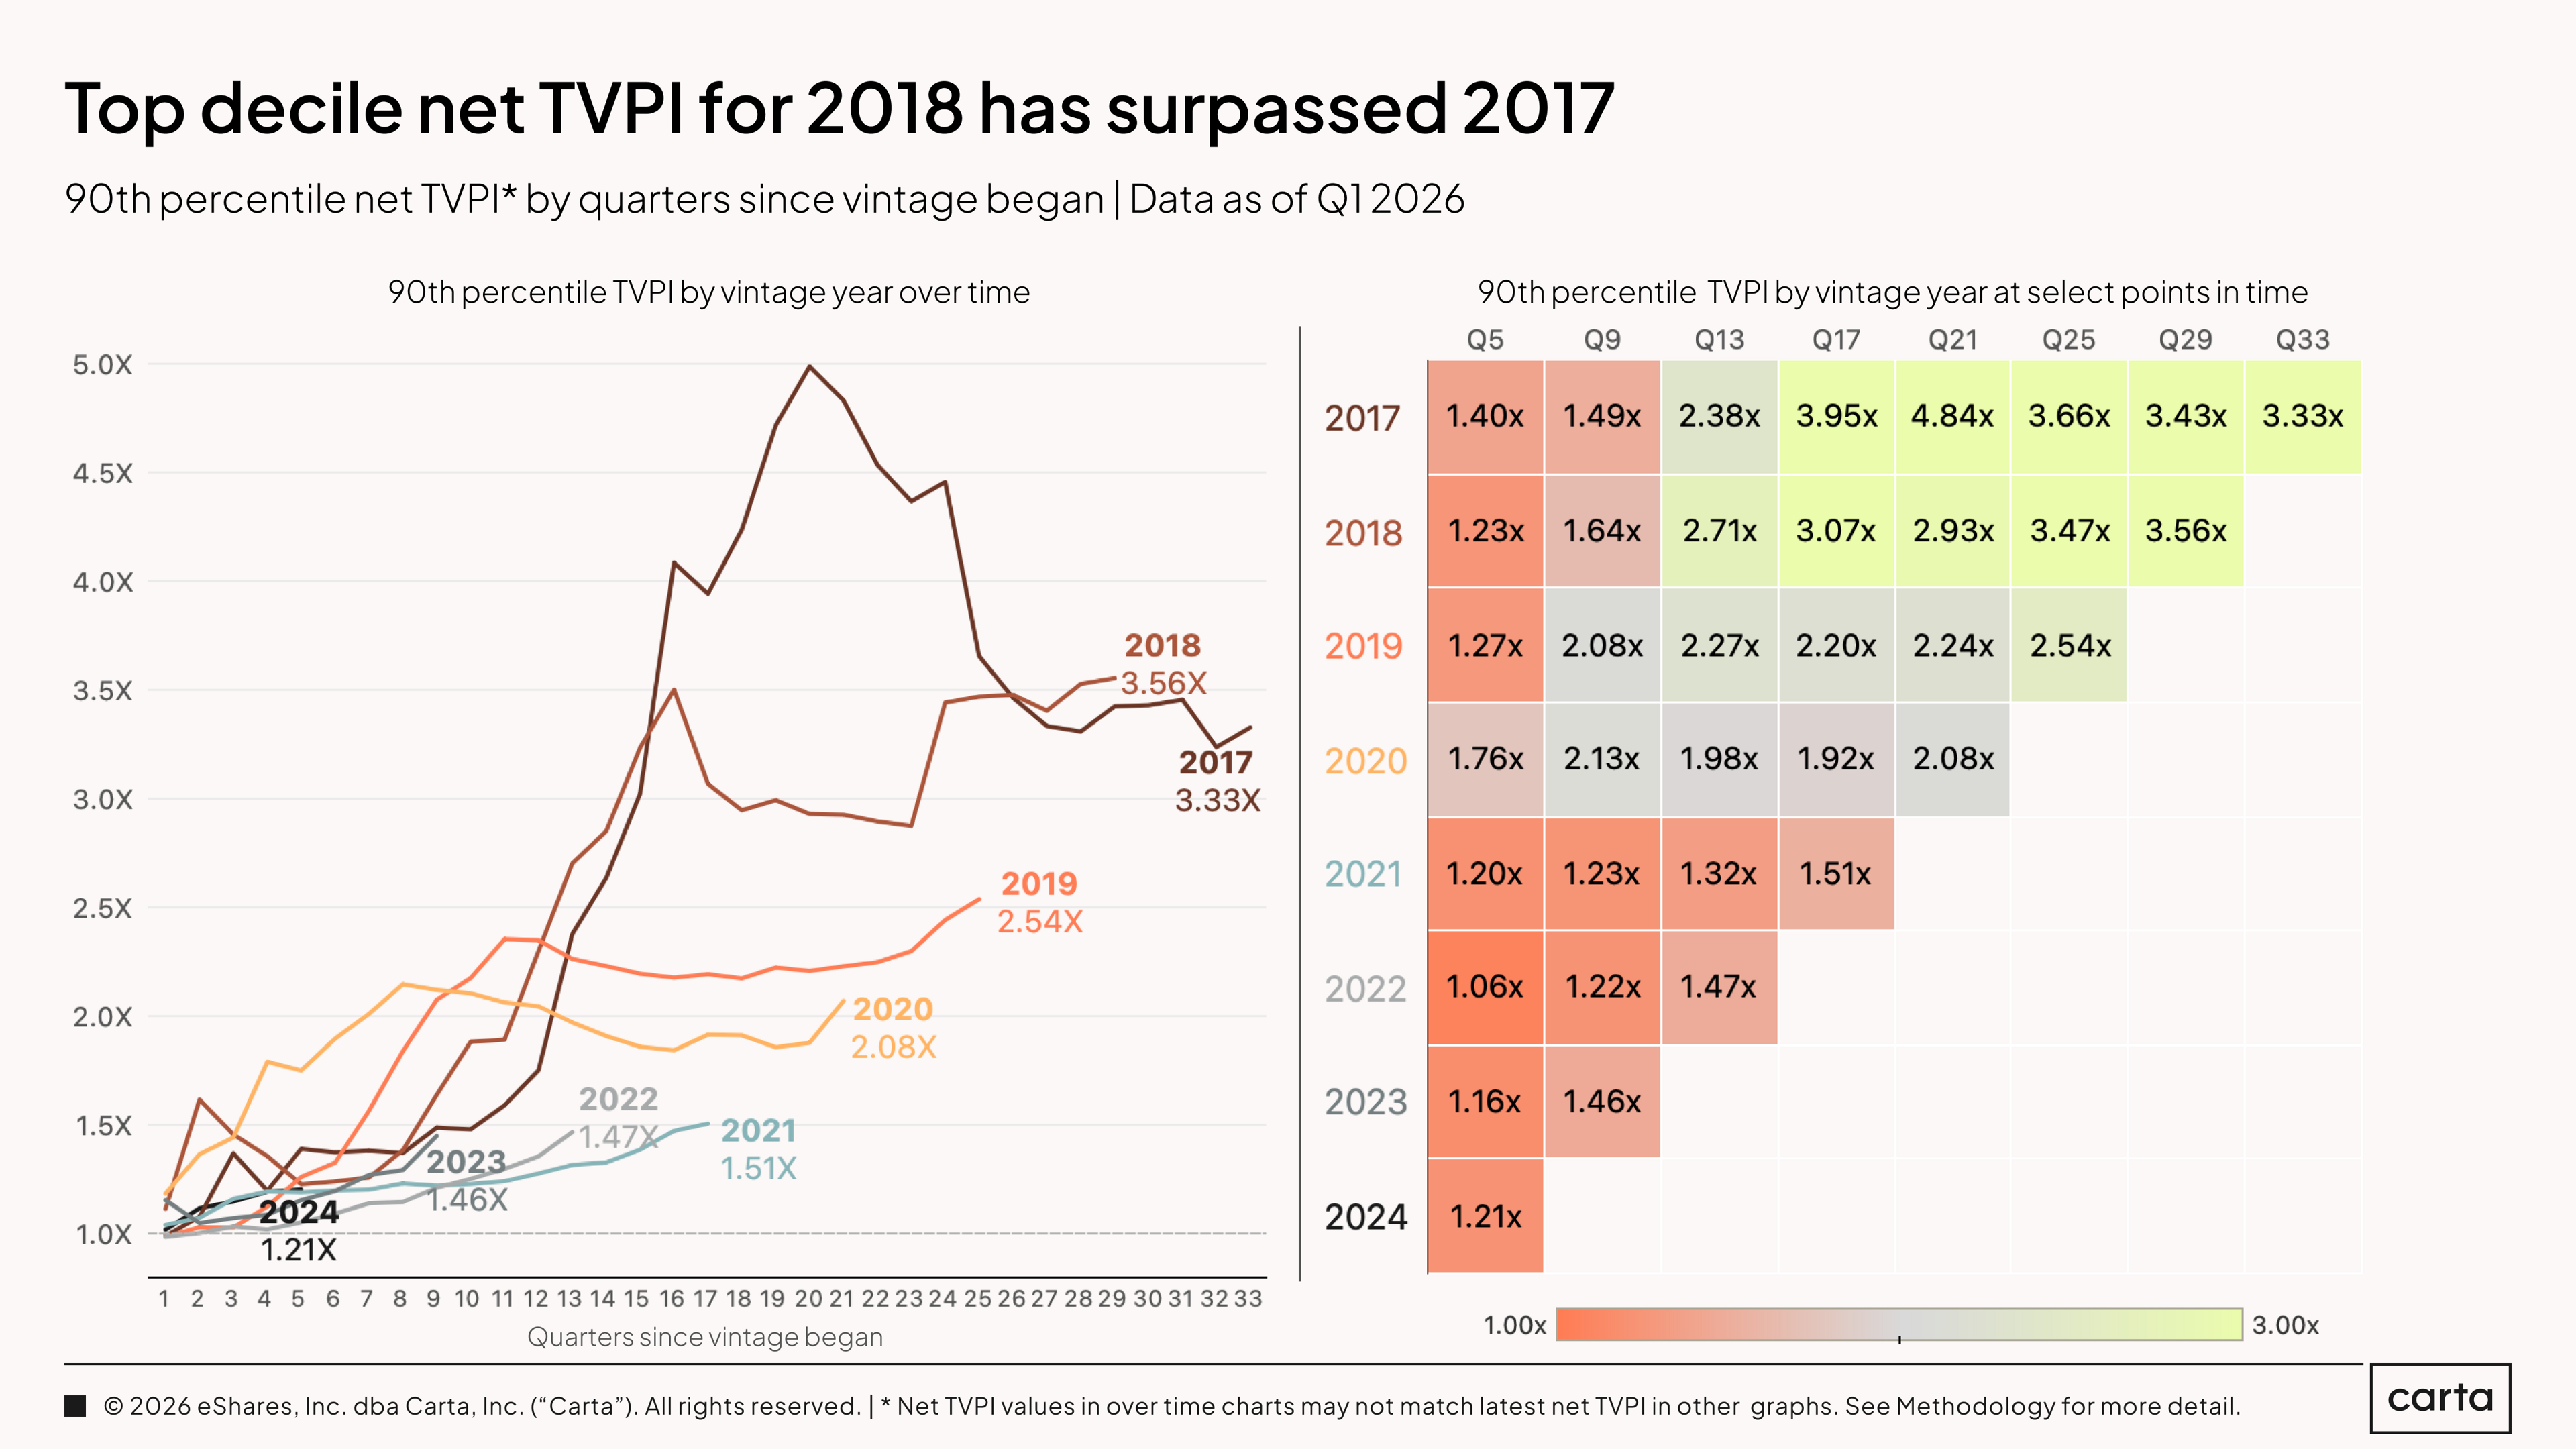
At both the top decile and the top quartile, recent TVPIs for the 2017 vintage and the 2018 vintage have been moving in opposite directions. Ten quarters ago, the 90th percentile for IRR was approaching 4.5x for 2017 VC funds and was hovering near 3x for 2018 funds. As of the end of Q1 2026, that 2017 figure had fallen to 3.33x, while the 2018 multiple had risen to 3.56x.
Besides 2017, the 90th percentiles for TVPI are on the rise for every other vintage shown here, with 2019, 2022, and 2023 showing particular upward momentum. But it’s still early in the lifespan of most of these vintages, and even at the top decile, they have a ways to go to reach the 3x mark that is commonly viewed as the threshold for true success among mature VC funds.
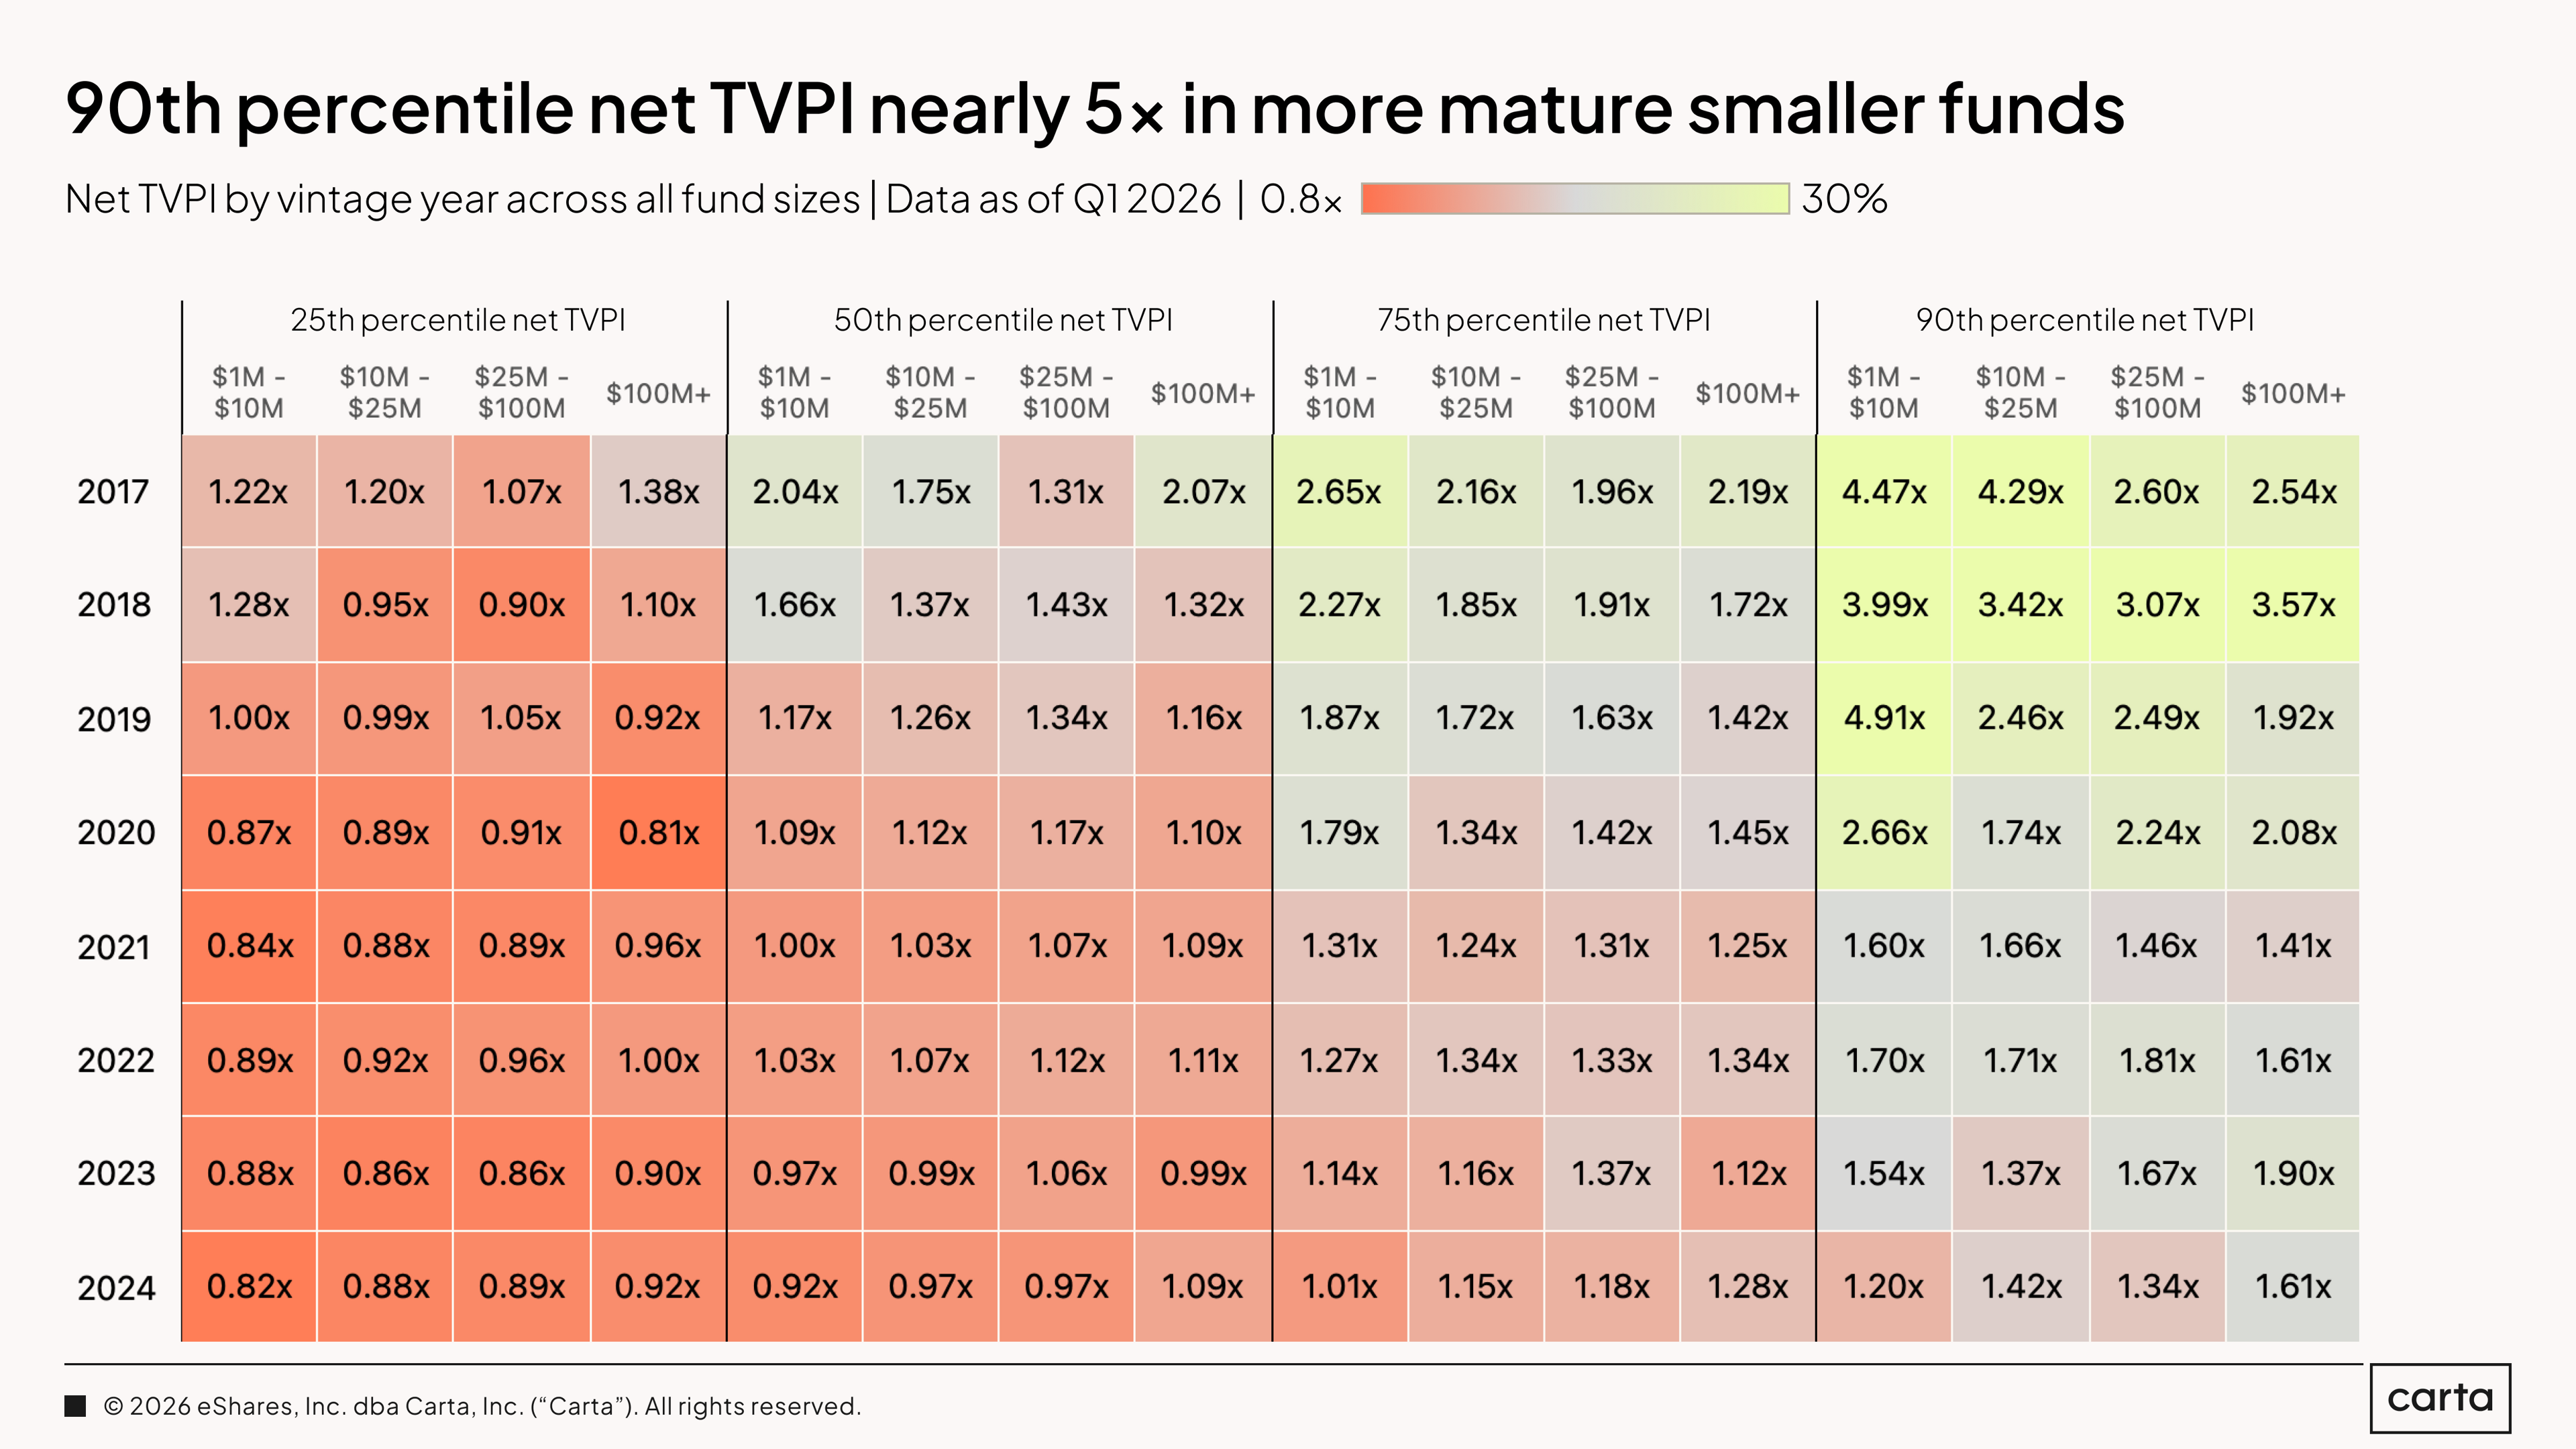
For vintages from the late 2010s, the gulf in TVPI between the best-performing funds and the rest of the pack is starting to widen. In the 2018 vintage, for instance, a median fund between $10 million and $25 million has a current TVPI of 1.37x. A 90th percentile TVPI from the same vintage is 3.42x. For a hypothetical $20 million fund in that cohort, that’s a difference in present fund value of about $27 million versus about $68 million.
As a rule of thumb, smaller vehicles tend to post better IRRs than larger vehicles, because it’s mathematically easier to produce a high multiple on a smaller sum of capital than on a larger sum. For recent vintages like 2023 and 2024, however, this trend is reversed, with larger funds claiming higher TVPIs. This could be a result of these larger funds being more likely to gain access to recent rounds raised by major AI startups, which are driving much of the recent valuation growth in the current market.
DPI
While TVPI assesses both the realized and unrealized value of a fund, DPI measures only gains that have been realized through an exit or some other liquidity event. As such, DPIs are almost always lower than TVPIs for vehicles that are still being actively managed, which is the case for almost every fund analyzed here.
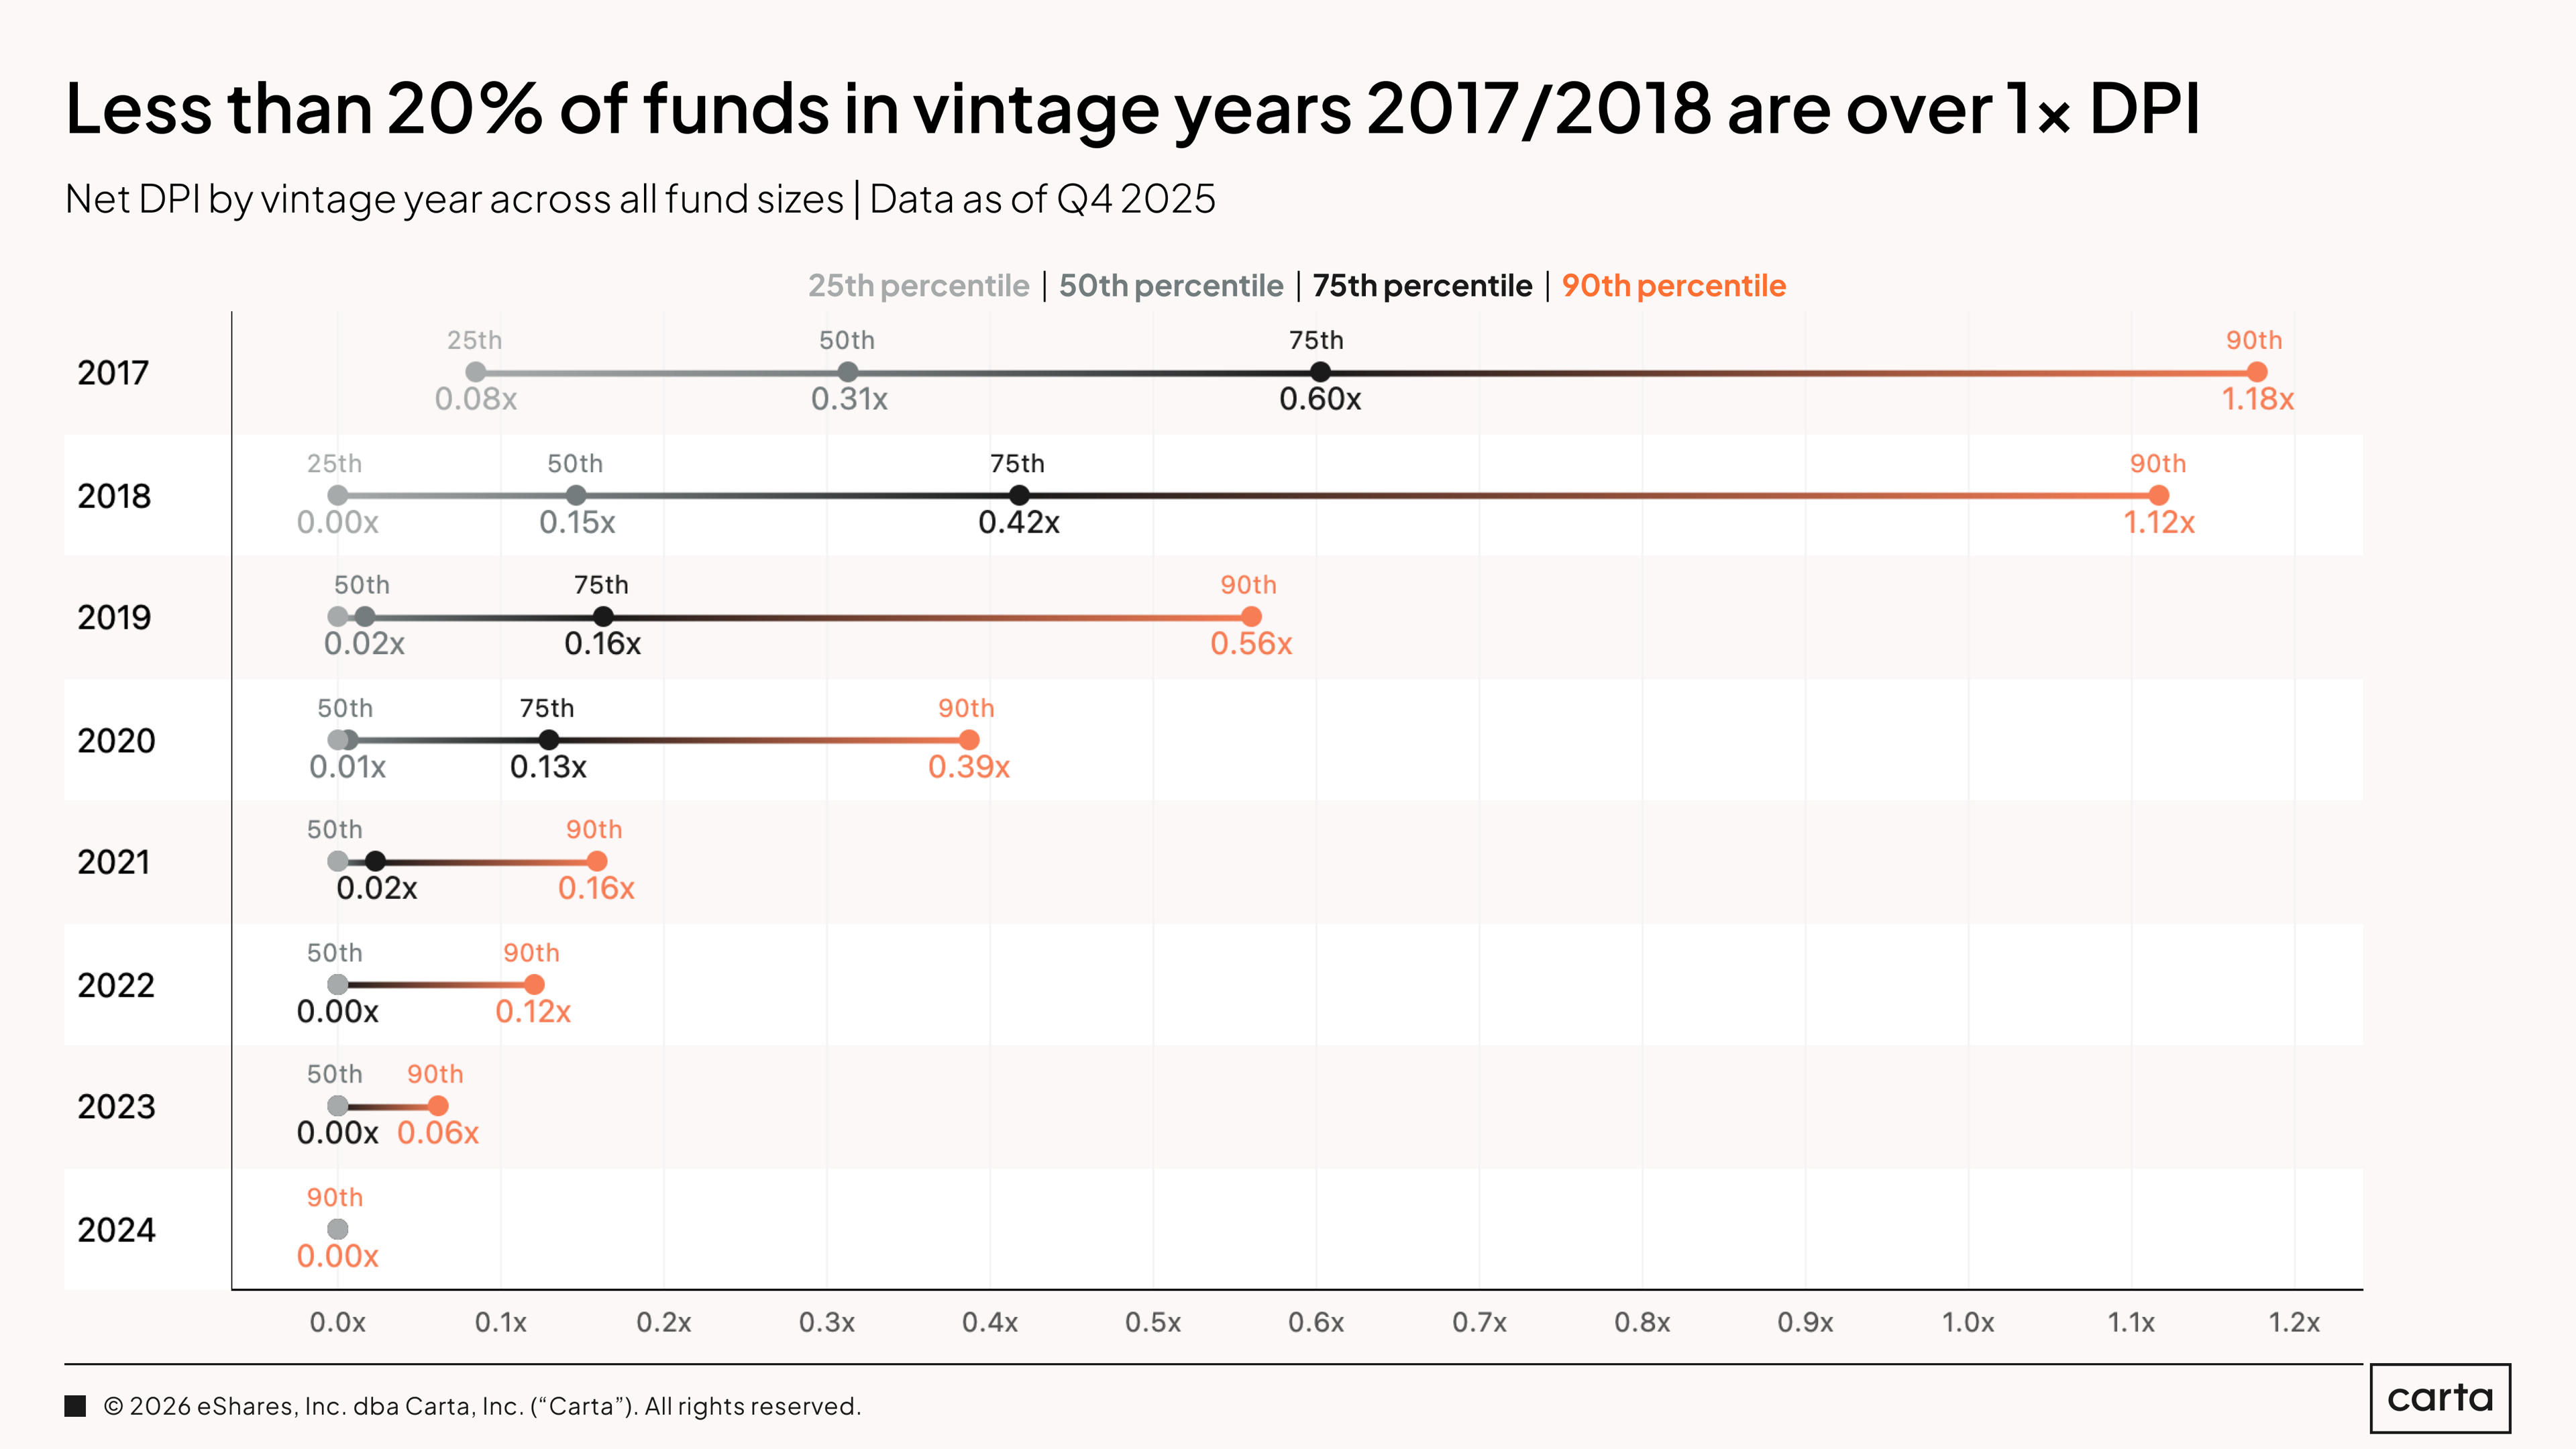
The only vintages where the typical fund has begun to return any real DPI to speak of are 2017, where the median DPI currently sits at 0.31x, and 2018, where the median DPI is 0.15x. These are also the only two vintages where top-decile DPIs are currently above 1x. Still, less than 20% of funds in each of these two vintages have a current DPI of at least 1x, meaning that more than four out of every five funds from these years still have work to do before LPs will have made their money back.

By the end of Q1 2026, just shy of 50% of all funds on Carta from both the 2019 vintage and the 2020 vintage had begun to record some measure of DPI. As expected, the 2017 vintage has the most funds that have begun to return capital to LPs, with a rate of 84%. Older funds are generally more likely to have started recording DPI than newer funds, simply because they have had more time to generate liquidity and realize returns from their portfolios.
DPIs are trending up for newer vintages, too. But vintages from the 2020s are lagging behind those from the late 2010s in terms of the percentage of vehicles that have at least a dollar of DPI. For instance, after about two years of management, about 11% of funds from the 2024 vintage had begun to log DPI. At that same signpost in time, more than 25% of funds from the 2017 vintage had begun to record DPI.
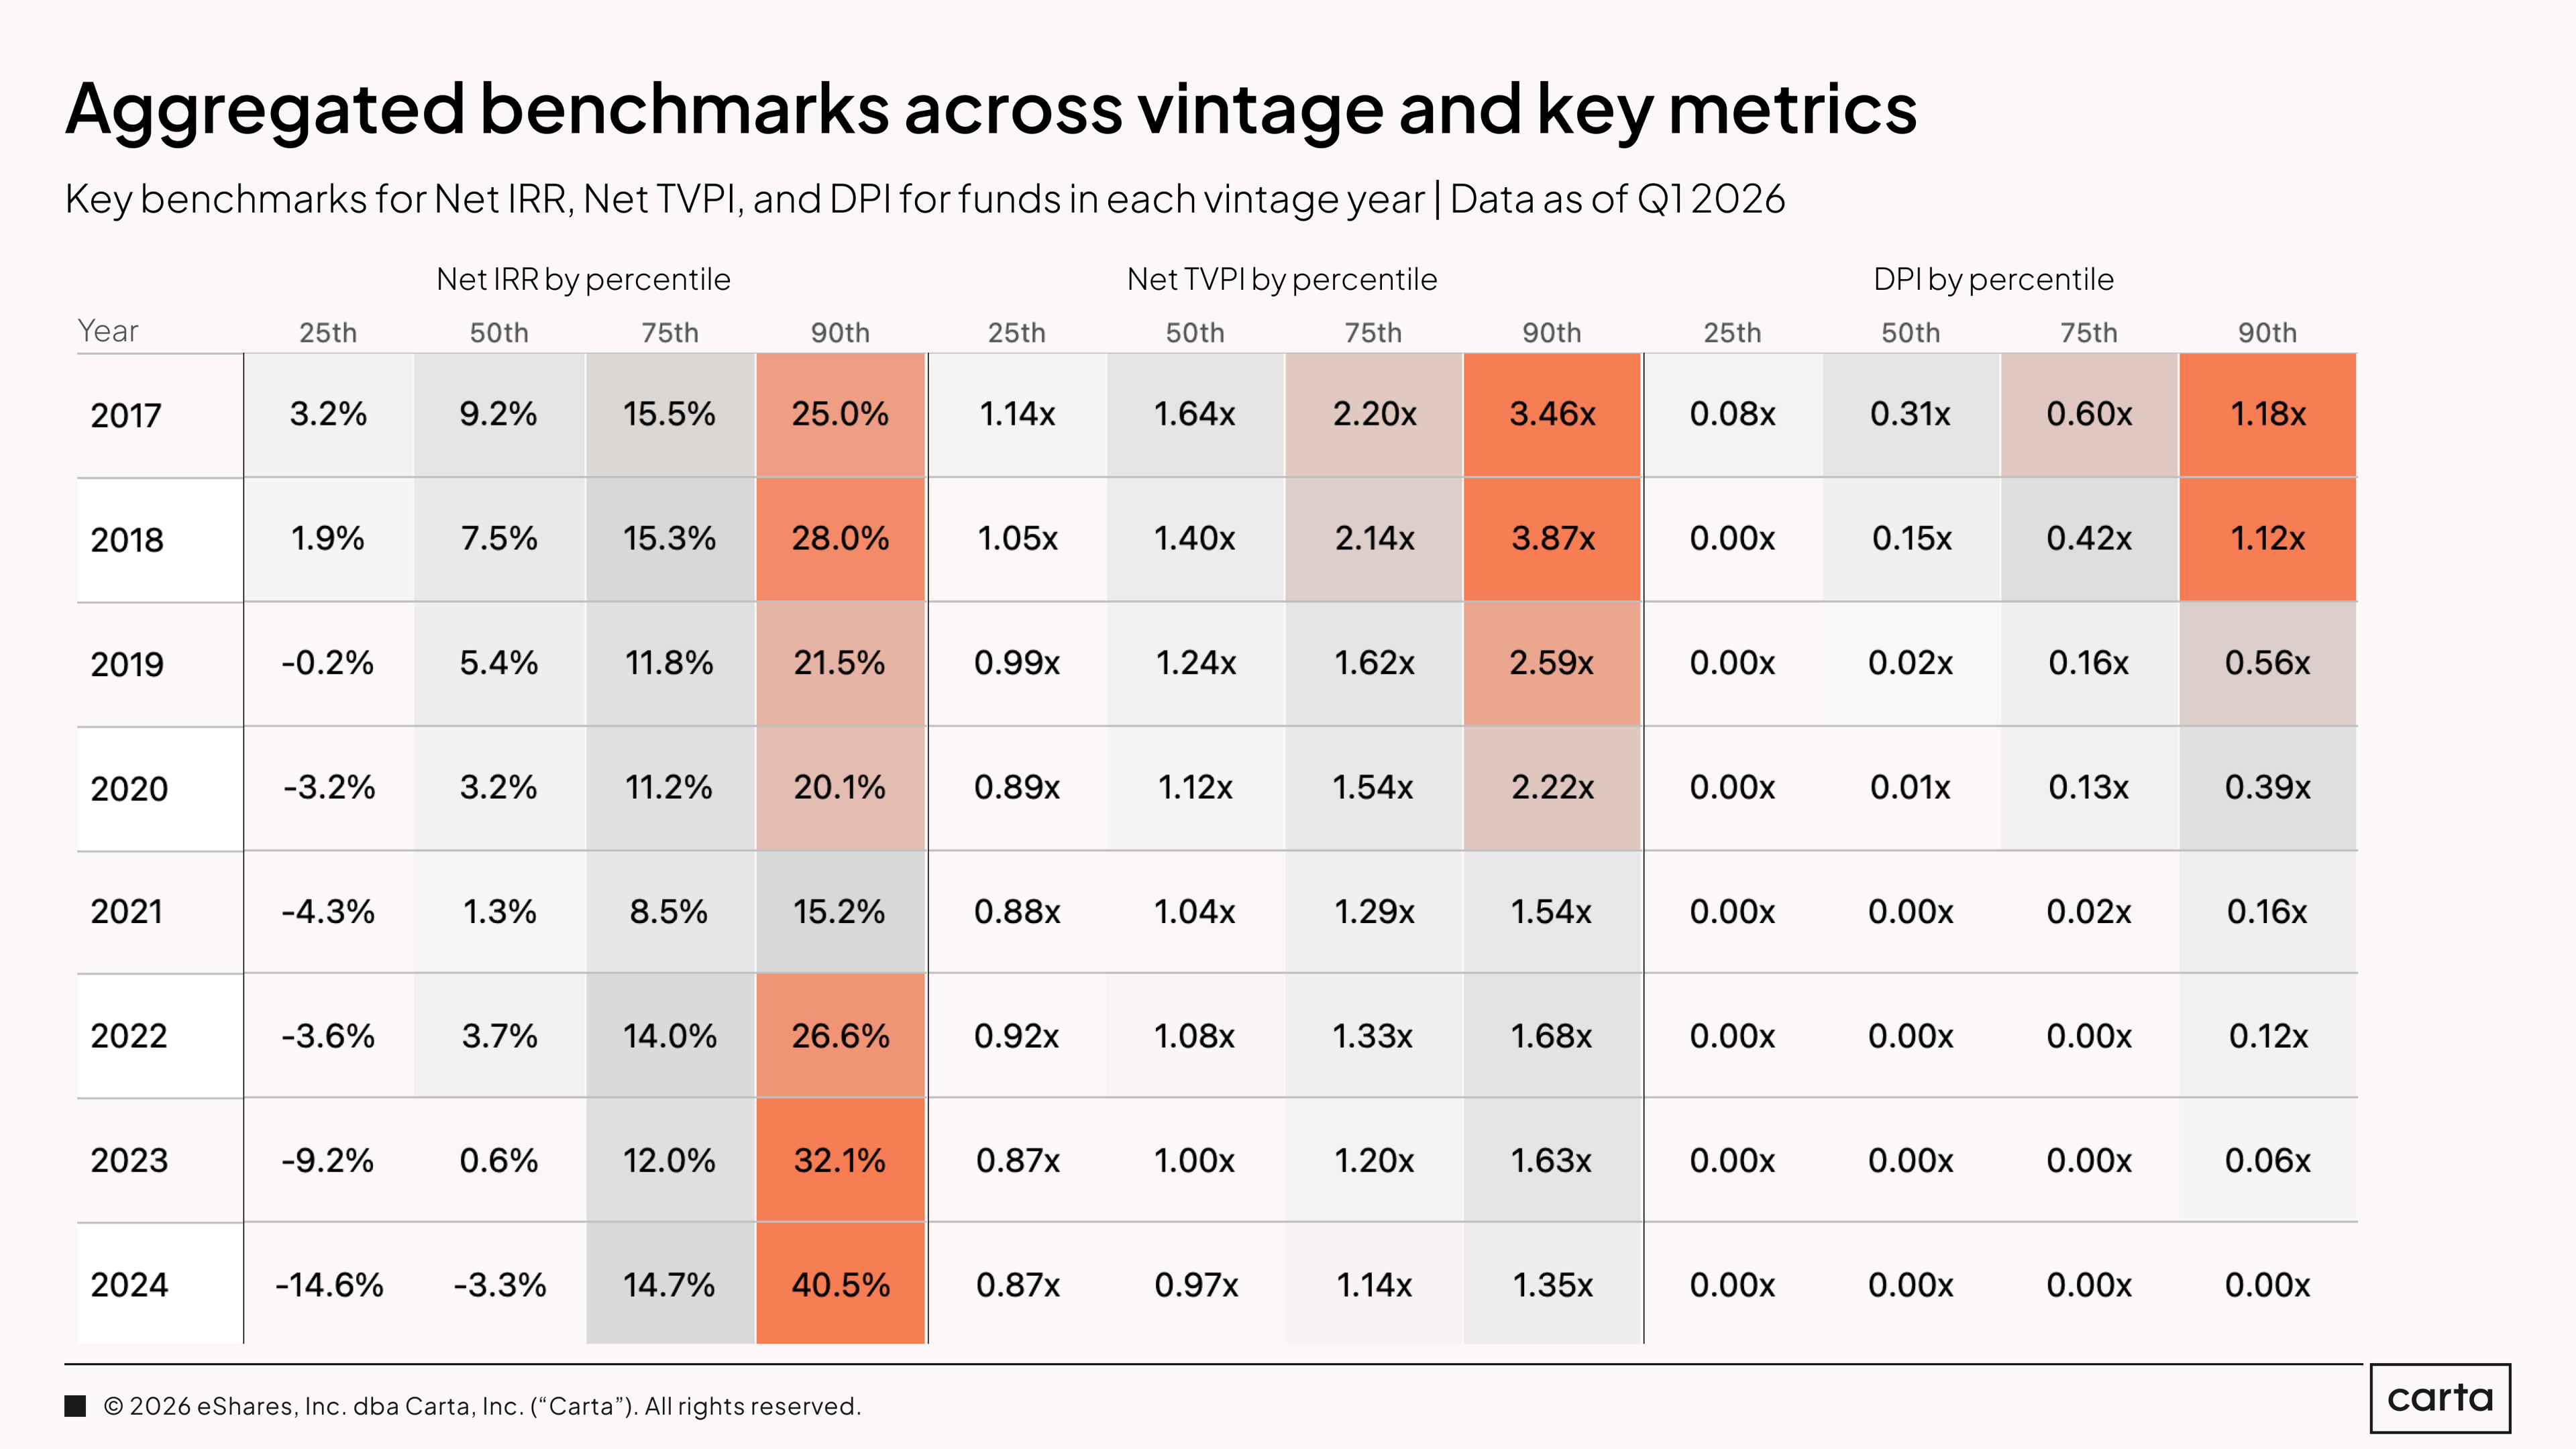
The above table presents a full summary of the statistics discussed throughout this report, breaking the data down by fund metric, performance threshold, and vintage. You can use this data to assess how your own fund compares against its peers, or to simply gain a better understanding of how these key metrics can differ across the breadth of the VC landscape.
For instance, across all fund sizes, a median fund from the 2017 vintage currently has a net IRR of 9.2%, net TVPI of 1.64x, and DPI of 0.31x. At the 90th percentile, a fund from that same year has an IRR of 25%, TVPI of 3.46x, and DPI of 1.18x. We can see here that, at the median, the 2017 vintage has posted stronger IRR and TVPI than the 2018 vintage. At the 90th percentile, on the other hand, the 2018 vintage is outpacing 2017.
Methodology
Carta helps over 2,500 venture firms administer more than $150 billion in capital. We're setting a new standard in fund administration by sharing insights from our unmatched dataset about the private markets and venture ecosystem to help investors and limited partners make informed decisions and understand market conditions.
Overview
This study uses an aggregated and anonymized sample of Carta fund customer data. Funds that have contractually requested that we not use their data in anonymized and aggregated studies are not included in this analysis.
We use data through the end of Q1 2026. Historical data may change in future studies because there is typically an administrative lag between the time an event took place and when it is recorded in Carta. In addition, new funds signing up for Carta’s services will increase historical data available for the report.
Fund details
This report only includes funds domiciled in the United States. All funds must have reliable performance data dating back to fund inception and/or when they joined the Carta platform. Included funds are direct investors into startups and do not pursue fund of funds or other strategies. Only funds in vintage years between 2017 and 2025 were included. Funds must have at least $1 million in AUM to be included.
We define vintage year as the year in which the first cost basis (either conversion or new investment) for a fund occurred.
Performance over time
In charts that use the quarters since vintage began framing, we limited the analysis to the most recent quarter in which all funds in a given vintage year had valid performance data. As such, these figures may not exactly match the performance data displayed in charts without a similar time-series framing.


DISCLOSURE: This communication is on behalf of eShares, Inc. dba Carta, Inc. ("Carta"). This communication is for informational purposes only, and contains general information only. Carta is not, by means of this communication, rendering accounting, business, financial, investment, legal, tax, or other professional advice or services. This publication is not a substitute for such professional advice or services nor should it be used as a basis for any decision or action that may affect your business or interests. Before making any decision or taking any action that may affect your business or interests, you should consult a qualified professional advisor. This communication is not intended as a recommendation, offer or solicitation for the purchase or sale of any security. Carta does not assume any liability for reliance on the information provided herein. © 2026 Carta. All rights reserved. Reproduction prohibited.