
Overview
Equity ownership is a powerful way of recycling capital. If you own equity in a company today, it’s possible that in a year or two you could use your payout to start a business yourself—or invest in someone else’s. That money gets reinvested to support more companies, more jobs, more chances for ownership, more innovation. That’s why we often refer to the startup economy as an “ecosystem.”
We have an opportunity to expand that ecosystem, together—to bring more ownership opportunities to more people. Every year since 2018, Carta has partnered with #ANGELS to report on equity distribution and gather the brightest minds in the venture ecosystem around the need to close those gaps.
Every year, we work to expand this analysis. We started by exploring the gender equity gap for employees and founders. The following year, we expanded our analysis to look at equity allocation by role and company size. In 2020, we expanded our scope again to include equity ownership by race and ethnicity.
As Carta grows, our dataset expands and helps us learn more. For the first time, we have enough data to report on the intersection of gender, race, and ethnicity for certain questions. In a year that’s seen huge social changes—including the Great Resignation and the outsized impact of COVID on women and people of color—intersectionality is a critical focus.
This year, we’re looking at two main questions. First, how much equity do employees hold—and how does that differ by gender, race and ethnicity, and the intersection of the two? And second, who is founding companies—where have we seen progress this year, and where do we need more focus?
As we grow and are able to use our data in new ways, we continue our obligation to use it responsibly. This means following strict commitments to data privacy—all of our data is anonymized and aggregated, and any Carta customer may opt out of analysis. We also need to note where our data is not sufficient to represent groups of people. We don’t yet have enough data to speak with confidence about the experience of every ethnicity, or of non-binary people, or of people with disabilities. We’ll include more specificity in future reports as soon as we can.
We found significant differences in data around the employment and equity of people of Asian backgrounds. In discussions of employee equity, we include East Asians and South Asians separately , and include the smaller demographics of Southeast Asians and Pacific Islanders in the “Other” group. We’ve chosen to use “Black/African-American” and “Latinx/Hispanic” as broad categories, shortened to “Black” and “Latinx” in charts for readability—though we know that those groups and their experiences aren’t identical. You can look at the methodology section at the end of the report for an overview of our data and the decisions we’ve made.
Employees
Employees are the largest dataset on the Carta platform. This year, we’re able to report on employee ownership of equity intersectionally. We’ll first look at ownership by race and ethnicity, then by gender identity, then we’ll look at the two together.
By race and ethnicity, who has employee equity?

Together, Black and Latinx people make up 29% of the U.S. labor force—that is, Americans who are working or available to work. But they make up only 16% of employees who hold equity. What’s more, these 16% of employees collectively hold only 9% of the total value of employee equity. Twenty-nine percent of America’s workers holding only 9% of employee equity is concerning. We’ll dig into possible reasons in the next few charts.
White people are very slightly underrepresented among equity-holding employees, making up 62% of the U.S. labor force and 58% of equity-holding employees. White employees collectively hold a bit more equity than we would expect based on their numbers. They comprise 58% of equity-holding employees, and own 65% of the equity.
While Asians make up only a small percent of the American labor force ( 5% for East and South Asians combined), they’re overrepresented among equity-holding employees, making up 19% of equity-holding employees.1 Unlike their white peers, however, the amount of equity they collectively hold (20%) is nearly on par with their numbers of equity-holding employees (19%).

Some of the disparity that we’re seeing for underrepresented groups is due to the fact that equity-holding Black and Latinx employees are less likely to hold roles in job areas where equity amounts tend to be larger. For example, 7% of equity-holding employees are Black, but only 3% of product roles, which have a robust median of $12,000 in equity held, are filled by Black employees. (Note that median amounts of equity held are determined using 409A valuations—take a look at our methodology section to see how it works.)
An exception to this trend is Black representation in human resources, where the median amount of equity held is an above-average $10,000. Black employees fill 9% of these roles—more than the 7% we would expect based on the number of Black employees who hold equity.
Customer support and administrative roles, which have the lowest median amount of equity held in our dataset, of $3,000 and $4,000 respectively, also have more Latinx employees than would be expected based on their percentage of equity-holding employees. While 9% of equity-holding employees are Latinx, 13% of customer support and administrative teams are Latinx.

Black and Latinx employees are also more likely to hold junior positions that come with lower levels of equity. Whereas these two groups comprise 16% of equity-holding employees, they make up 25% at the entry level, and only 7% in the C-suite.2
White workers, in contrast, make up 58% of equity-holding employees and only 49% of entry-level workers, and occupy 76% of the C-suite.
While East and South Asian employees are both well represented in high-equity job areas, their numbers differ when we look at job level. East Asians make up 14% of equity-holding employees, but they represent only 9% at the VP level and 6% in the C-suite. In contrast, South Asians represent 5% of equity-holding employees, 11% of VPs, and 7% at the C-level. South Asians are, in fact, more overrepresented in the C-suite (1.4x) than white employees (1.3x).

We might expect Black and Latinx workers to more often hold junior positions if they are younger—and these groups do have a lower median age in the U.S. population. In Carta’s dataset, there are age differences by race and ethnicity: The median age of equity-holding Latinx employees is 34, three years younger than the median white employee.
But overall age is a small difference; it’s unlikely to fully explain the size of the equity gap that we’re seeing. We suspect that it is not age, but differences in job area, industry, and level—and the biases and structural circumstances that contribute to these differences—that drive much of the equity gap by race and ethnicity.
By gender identity, who has employee equity?

While 47% of the U.S. labor force are women, only 35% of the employees on the Carta platform who hold equity are women. The value of their equity grants in 2021 is only 27% of the total value of employee equity on Carta—meaning that 73% of total equity went to men. (Reminder: Non-binary people are not represented by the data this year.)
As with the broader gender salary gaps, much of the difference is due to men often holding different—and more highly compensated—roles than women do. The fact that men hold those roles is due to a number of social factors, including lack of representation, bias in the education pipeline, and a need for flexibility for the family care duties that more often fall to women. (There’s also research showing that bias is a factor in perception of roles: When more women enter a field, compensation drops.)

Women employees are less likely to hold roles in certain highly compensated job areas—including engineering (which had a median amount of equity held of $13,000 for mid-level employees between 2016 and 2021) and finance (with a $9,000 median). On the other hand, women are well represented in human resources ($10,000), and marketing ($8,000) roles.
Gender disparities in some job areas have more impact on overall employee equity than others. For example, engineers make up 17% of all equity-holding employees, and over 40% of all equity-holding men are engineers. In contrast, legal teams—which also have robust equity amounts and where women are well represented—make up less than 1% of all equity-holding employees.
How do gender, race, and ethnicity intersect for equity-holding employees?

Looking at the intersection of gender with race and ethnicity, we see significant differences between equity owners.
Race, ethnicity, and gender intersect in different ways. Within most race and ethnicity groups, the median amount of equity held is higher for men than for women. The one exception to this is that East Asian women earn slightly more equity than East Asian men ($8,500 compared to $8,000).
White women, meanwhile, receive 60% of what white men receive. Latinx women hold the least equity among all groups—their median amount of equity held is $4,400, compared with $12,500 for South Asian men, the group that held the most.

Some of the disparity between men and women within each race and ethnicity group is because women are more likely to hold more junior positions. Within every race and ethnicity group, women make up more than half of employees at the entry level, and fewer than half at every other level.This pattern within the venture ecosystem is quite consistent with research on women in the workplace that shows a “ broken first rung” between entry-level and mid-level jobs and a narrowing pipeline to the C-suite for women of all ethnicities.The gender gap within each race or ethnicity group is greatest between South Asian men and women, and smallest between Black men and women.
1 Note that for our analysis of employees, Southeast Asians, Native Hawaiians and Other Pacific Islanders are included in “Other,” which also includes American Indians and Alaska Natives. We hope to be able to consider more race and ethnicity groups in our analysis in the future as our dataset grows; please see our methodology section for more.
2 You may have noticed that C-suite executives hold a lower median amount of equity than those at the VP level, even though CEO, CTO, and other C-level roles are generally considered more senior than VP-level roles. Whereas companies of all stages and sizes tend to have C-level executives, generally it’s larger and more mature startups that have VPs as well. We believe that’s the likely source of the difference.
Founders
Founders play a key role in the venture ecosystem: They start the companies that investors support. They hold equity themselves, and they grant it to employees.For the first time this year, we’re able to look at founders by race and ethnicity as well as by gender (men and women). As our dataset continues to grow, we plan to look at the intersection of race, ethnicity, and gender for founders. We’ll also report on non-binary founders as soon as we can.
Who is founding companies, by race and ethnicity?

Relative to their share of the U.S. labor force, people of Asian and Pacific Islander backgrounds are overrepresented among founders by 2.7x. For every ten AAPI founders we would expect to see based on their share of the labor force, we actually see 27.
Latinx founders are underrepresented by 0.4x, meaning that we see four Latinx founders for every ten we’d expect. Black founders are underrepresented by 0.7x; there are seven for every ten we would expect to see. White founders are slightly overrepresented. For every ten we would expect to see, there are 11.

Although they remain an underrepresented group, Black founders are making progress. As a percent of all companies started each year on Carta, the number of companies started by Black founders more than doubled between 2016 and 2021, from 3.4% to 8.2%.
There are likely many factors influencing this increase, including a growing awareness of Black-owned businesses as a result of social justice movements over the past year and a half. Similarly, there’s been growing interest in Black-owned businesses within the venture community over the past several years, as well as a slight uptick in Black investors. The longer this momentum continues, the more likely it’s a result of actual change within the ecosystem.
Latinx founders did not substantially increase as a percent of all companies started each year on Carta.

Just as employees of color in the venture ecosystem tend to be younger than white employees, founders of color tend to be younger than white founders. The median age of Black founders is 37, compared to a median of 42 for South Asian and white founders.
These findings parallel other data that found that Black and Latinx people became entrepreneurs earlier. The equity gaps and obstacles to progress to senior roles we see in employees from these groups could be motivating factors to make the leap to founder. If we remove those obstacles, we could see more founders of color also starting companies at the mid-career stage.
We also saw that Black and Latinx founders are more likely to be living outside of California and New York. This isn’t surprising, as it largely reflects different demographics by region, but it underscores the importance of venture, accelerators, and other parts of the startup ecosystem across the country.
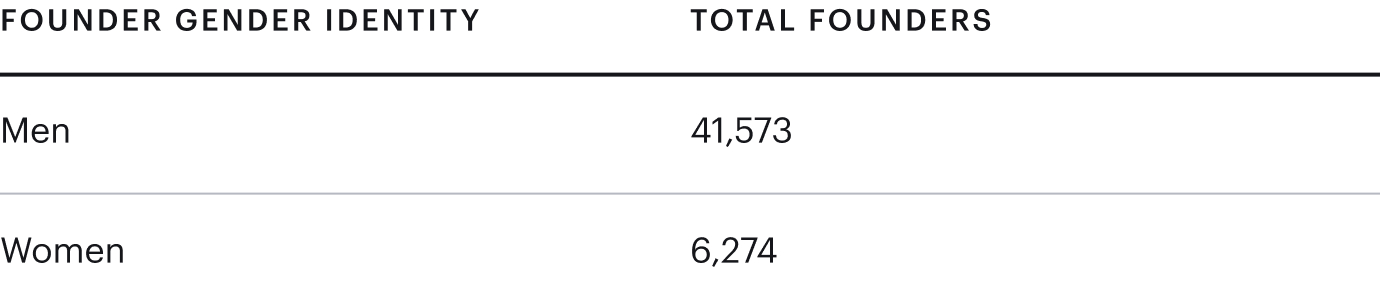
Who is founding companies, by gender identity?

Since 2016, the share of companies founded or co-founded by women hasn’t increased much. In 2021, there’s more gender equity in the C-suite—24% women—than among founders (14% women).
This number has remained remarkably stable over the past six years, which could be due to any number of social factors—including potential bias in the pitch process, a well-publicized funding gap for women-led businesses, lack of representation in STEM fields and the C-suite, and gender socialization, to name a few.
Two bright spots: the total amount of U.S. venture capital raised by female-founded companies has increased over the past decade, with a sharp increase in 2021. This reflects overall growth of capital within the ecosystem. And the number of women investors intentionally looking for women-led companies to fund has also grown in the past few years.

While the total amount of funding raised by women founders increased over the past two years, the percentage of total invested capital going to women-only teams has declined, from a pre-pandemic high of 8.2% in 2019 to 6.6% in 2021. There is also a smaller number of teams with men and women as co-founders; this group grew slightly during the pandemic.
Women-led teams also received a smaller percentage of overall invested capital in each progressive funding round in 2021. They received 11% of all seed fund investment money, but just 4% of all Series D capital. We’re keeping an eye on this concerning pattern for future years.

Women make up the largest share of founders in the sectors of education (24%) and consumer products and services (21%). They make up the smallest share of founders in financial technology (10%), energy (10%), and hardware (9%).
This distribution of founders by gender correlates—to an extent—with women’s representation in the labor force as reported by the Bureau of Labor Statistics, though the sector categories aren’t identical. Women are most overrepresented in education and health services (where 75% of workers are women) and “other services” such as personal care (54%). Interestingly, though women make up 53% of employees in the BLS’s “financial activities” sector, only 10% of fintech founders are women.
Ownership on Carta
Today’s employee-owners are the founders, VCs, and limited partners of tomorrow. In 2021, there are 1.6 million equity owners on Carta, representing a combined $2 trillion in equity value—up from $764 billion in 2020.
Our analysis includes data from more than 800,000 employee stakeholders on the Carta platform and 47,847 founders who manage their company equity on Carta.


Methodology
The Annual Equity Report analysis uses equity data from more than 800,000 U.S.-based employee stakeholders on Carta. Our company founder analysis includes data from 47,847 founders who manage their company equity on Carta.
Several of our analyses split employees into job area or job level. All role information in Carta is self-reported. We omit roles that are not easily categorized into a job area or level (such as “team lead” or “analyst”).
Valuing equity
Value for “equity held” is calculated using the difference of the latest fair market value (FMV) of an option (as of the latest valuation) and the strike price, multiplying by the quantity of shares granted. We used 409A valuation, rather than investor valuation, since 409A valuations are required to be updated in Carta regularly (every year, or every time a company has a material event). We also recognize that prices offered during a liquidity event are typically not the same as FMV; therefore, we use the percent that was fully diluted at the time of option issuance as frequently as possible. Any grants where the FMV was beneath the strike price were excluded from this analysis.
Value for “equity granted” is simply the strike price of an option multiplied by the quantity of shares granted. This method describes the amount of money needed to exercise the granted shares (as opposed to attempting to quantify how much those shares are currently worth).
Race and ethnicity
Carta offers U.S.-based employee stakeholders an opt-in method for sharing demographic information for the purposes of this aggregated, anonymized equity compensation analysis. Over 120,000 stakeholders responded to our survey.
Because insights about race and role leveling are derived from a subset of Carta’s data, we expect insights to be directionally correct—but we also expect them to change as Carta’s race dataset becomes more complete in the coming years.
Carta uses a founder’s self-identified race and ethnicity from the demographics survey whenever possible—and this allowed us, for example, to distinguish between South and East Asians among employees. However, the sparseness of the survey dataset (relative to the entirety of the Carta equity stakeholder dataset) poses a limitation on the significance of our findings; thus, for analyses on founders, we employed a matching algorithm to increase the sample sizes of our dataset. We identified previously unknown race and ethnicity information of founders by comparing the last names to aggregate name data from the 2010 U.S. Census.
To keep data anonymous, we classified race using last names only, independently of equity data. In this approach, we restructured our race classes to match the categories in the U.S. census. The race and ethnicity categories that we used for founders were: White/Caucasian, Black/African American, Asian/Pacific Islander, and Hispanic/Latinx. Note that in U.S. census data, Latinx includes everyone of Latin American culture or origin regardless of race, and all the other race and ethnicity categories only include non-Hispanics. This means that intersectional identities are not accurately represented. We used a minimum threshold of 98% confidence to determine a race for a last name. Overall, this approach led to a 3x increase in our sample sizes for founder race-related analyses.
We acknowledge that several race and ethnicity categories are missing from this classification scheme; however, it wasn’t possible to include every race and ethnicity due to small sample sizes. More accurate assignment of race and ethnicity continues to be an active area of improvement in future reports.
Gender identity
When available, Carta uses an employee’s self-identified gender (from the demographic survey) in this analysis. However, given the sparseness of the survey dataset relative to the overall dataset (4% of the total), we categorized unknown genders by comparing the stakeholder’s first name to aggregate name data from both the U.S. Social Security Administration and Gender API to yield a more complete dataset. To keep data anonymous, we classified gender using first names only independently of equity data.
Using this approach, we labeled 61% of stakeholders as men and assumed 32% to be women. Approximately 6% of people were removed because we could not match their names and <1% self-identified as another gender, but they did not compose a large enough sample for analysis. We considered first names with less than 85% gender accuracy too ambiguous to classify. This may mean that names not popular in the U.S. were excluded more often.
While we know that gender is non-binary, we were only able to associate names to women and men. We describe the equity gap using gender (woman/man) terms rather than sex (female/male) because we acknowledge that sex does not always accurately reflect an individual’s identity.
Using a taxonomy does have its shortcomings—namely, the exclusion or mis-gendering of non-binary people and people with names that don’t match current trends by gender. Proper gender identity assignment will continue to be an active area of improvement for future reports.
Organizations driving change in the ecosystem
-
81 cents: Knowing is half the battle. 81 cents aims to close pay gaps for women and BIPOC by giving us the intel to navigate tough career conversations and get paid fairly.
-
AllVoices: Everyone should be able to speak up safely. AllVoices is making that more possible by using tech to enable employees to send feedback, report harassment, bias, culture issues, and compliance concerns, anonymously.
-
Black Girl Ventures: Black Girl Ventures funds and scales tech-enabled, revenue-generating businesses founded by people who identify as Black/Brown and woman. Their BGV pitch competition is the largest pitch competition globally for Black women founders.
-
Bobbie: Modern parents should be empowered and supported in the feeding choice that is right for them and their baby. They should also be given the opportunity to invest in brands they believe in. Bobbie’s mission is to shake things up, including investing. This is why they opened up their cap table to women, many of whom are mothers: to pioneer a new brand-consumer relationship and to democratize investing.
-
Bolster: Diverse representation starts at the leadership level. Bolster helps CEOs scale themselves, their executive teams, and their boards with access to experienced talent from a diverse network of 6,000+ executives available for interim, fractional, project, advisory/coach/mentor, full-time, or board roles.
-
Elpha: Elpha is the professional network where women in tech succeed at work together. Join for free to unlock unlimited access to a high-caliber network of 50K+ women, insider job opportunities, daily conversations with experts, and resources full of practical advice.
-
Flockjay: Talent is distributed equally, but opportunities in tech are not. Flockjay is helping leading technology companies empower sales professionals of all backgrounds to advance their career through the power of education and access.
-
Girls Who Code: We need to close the gender gap in technology and change the image of what a programmer looks like and does. This is the mission of Girls Who Code. The not-for-profit organization is building the world’s largest pipeline for future female engineers with more than 8,500 programs worldwide including after school programs, summer immersion opportunities and college networking opportunities for alumnae.
-
Jopwell: Representation matters. Jopwell is a career advancement platform for Black, Latinx, and Native American professionals, unlocking opportunities and partnering with companies to promote diversity.
-
Strive: A good manager knows how to promote inclusion and diversity. One of Strive‘s specialties is offering leadership development programs for groups traditionally underrepresented in leadership in tech.
-
Syndio: Committed to creating a strong community of employers working to eradicate pay disparity, Syndio uses data science to help progressive leaders deliver on their commitment to equal pay across gender, race and ethnicity.
-
theBoardList: With 16,000 members, 1,800 searches and 5,000 candidates, theBoardList is making board rooms more diverse one board member at a time. If you’re interested, it’s easy to create an account at http://theboardlist.com.
-
The Mom Project: Women shouldn’t have to choose between work and family. The Mom Project helps women remain active in the workforce by working with employers who are committed to designing and supporting a better workplace.
-
Valence: Creating supportive communities is one of the most powerful ways to drive change and that’s exactly what Valence is doing by connecting Black professionals to create massive economic and social progress.