Executive summary
Venture funding on Carta inched upward in Q2. Startups combined to raise more than $15.4 billion in funding during the second quarter of 2023, up 26% from Q1. In several other areas of the venture landscape, such as early-stage valuations and late-stage deal counts, the story is similar: Numbers were trending back up in Q2 after significant declines in recent quarters.
Even with these recent gains, the venture market remains a long way off from the salad days of 2021. While capital raised was up significantly in Q2 on a quarterly basis, it’s still down 58% year over year. And there are other signs that the fundraising environment remains tight. For instance, nearly 20% of all rounds raised in Q2 were down rounds, the second-highest quarterly figure of the past five years.
It might be some time before activity returns to the record-setting pace of recent years. But it appears the overall venture market found a floor in the first half of 2023.
Q2 highlights
Late-stage deal counts are ticking up: For the first time since Q3 2021, the number of venture investments on Carta increased in Q2 at every stage from Series B onward. The downturn had hit these later stages particularly hard: Deal counts at Series B, C, D, and E+ had declined by at least 50% from recent highs.
The map of VC is shifting: In Q2, companies in the West census region raised 44.3% of all venture capital on Carta. That’s still more than any other region, but it’s down from a 51.2% share of capital raised in Q1. The Midwest, South, and Northeast regions all saw their share of VC funding rise, led by the Northeast, which claimed 29.9% of all Q2 capital.
Employees aren’t exercising their stock options: Employees opted to exercise just 26% of their vested stock options in Q2, tied for the lowest exercise rate since at least the start of 2018. As recently as Q4 2021, employees exercised 46% of vested options. Since then, the exercise rate has declined for six straight quarters.
Note: If you’re looking for more industry-specific data, you can also download the addendum to this report to get an extended dataset.
Key trends
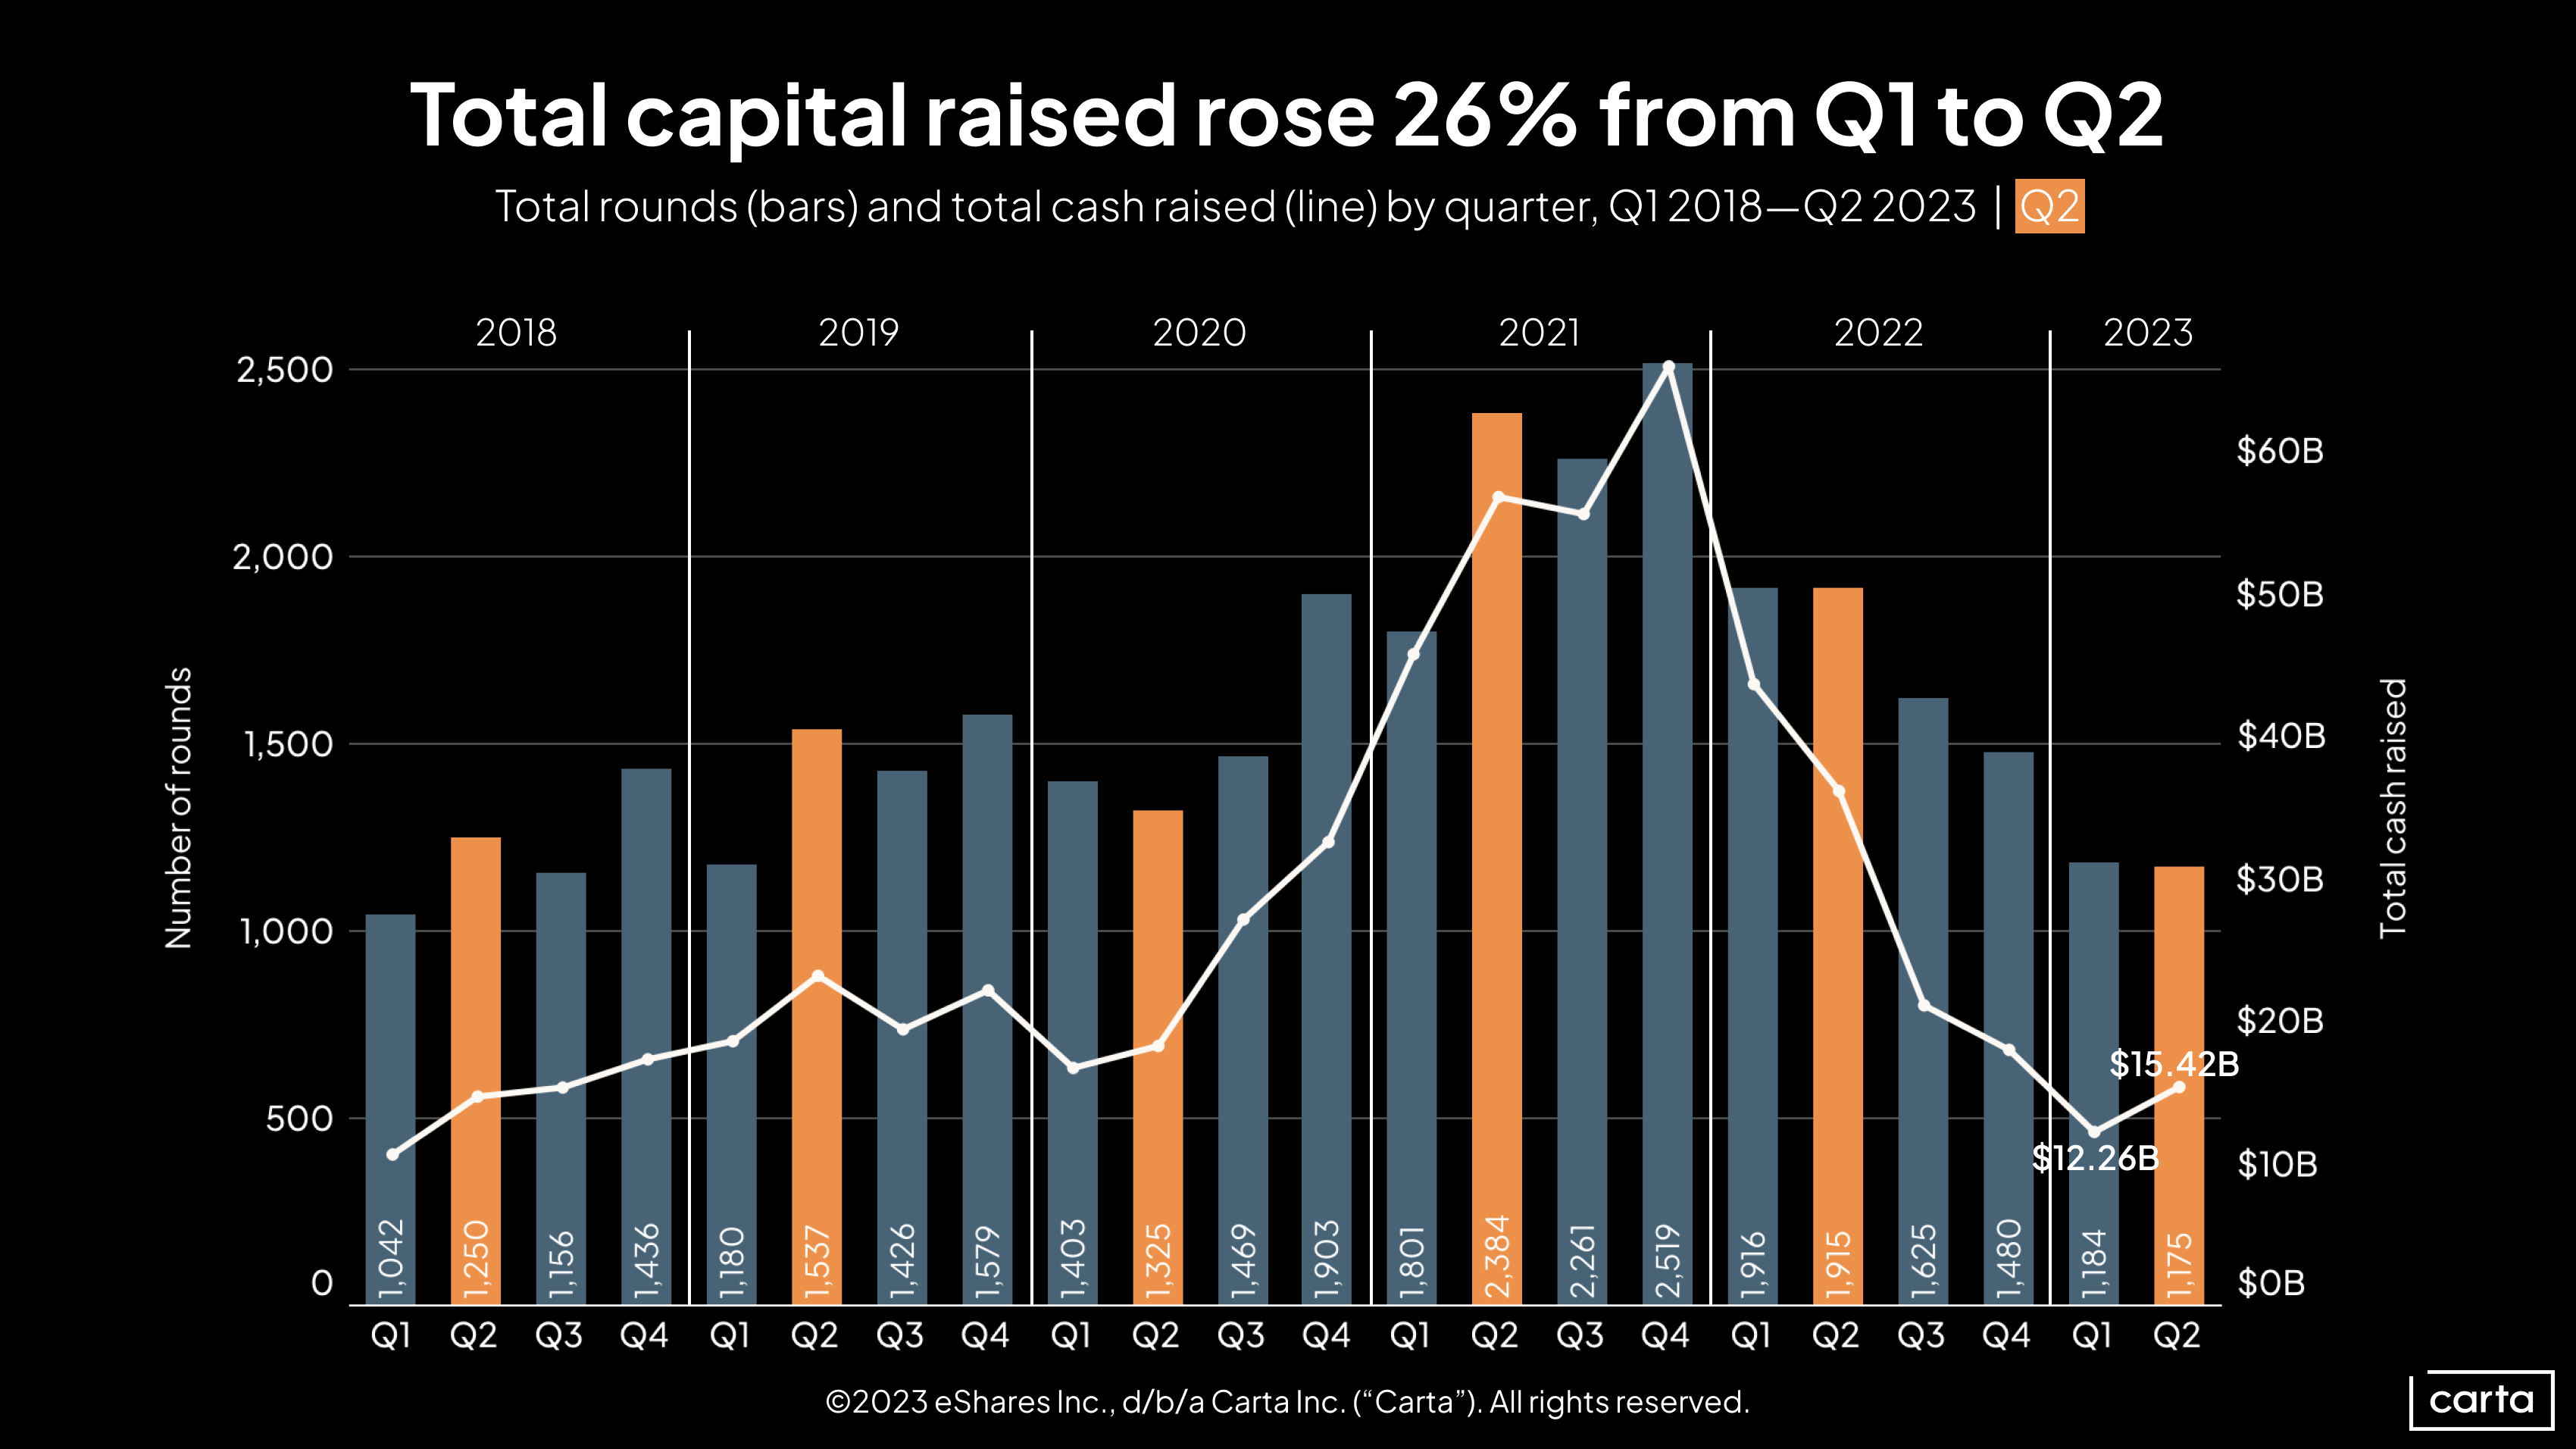
While the amount of venture dollars raised on Carta increased by 26% in Q2, the total number of deals stayed relatively flat. This means that the average investment size also increased, growing from about $10.4 million in Q1 to $13.1 million in Q2.
In terms of both deal count and cash raised, this was the slowest Q2 since at least 2018. At the halfway point, 2023 is on pace to be the quietest year for venture activity since at least 2018.
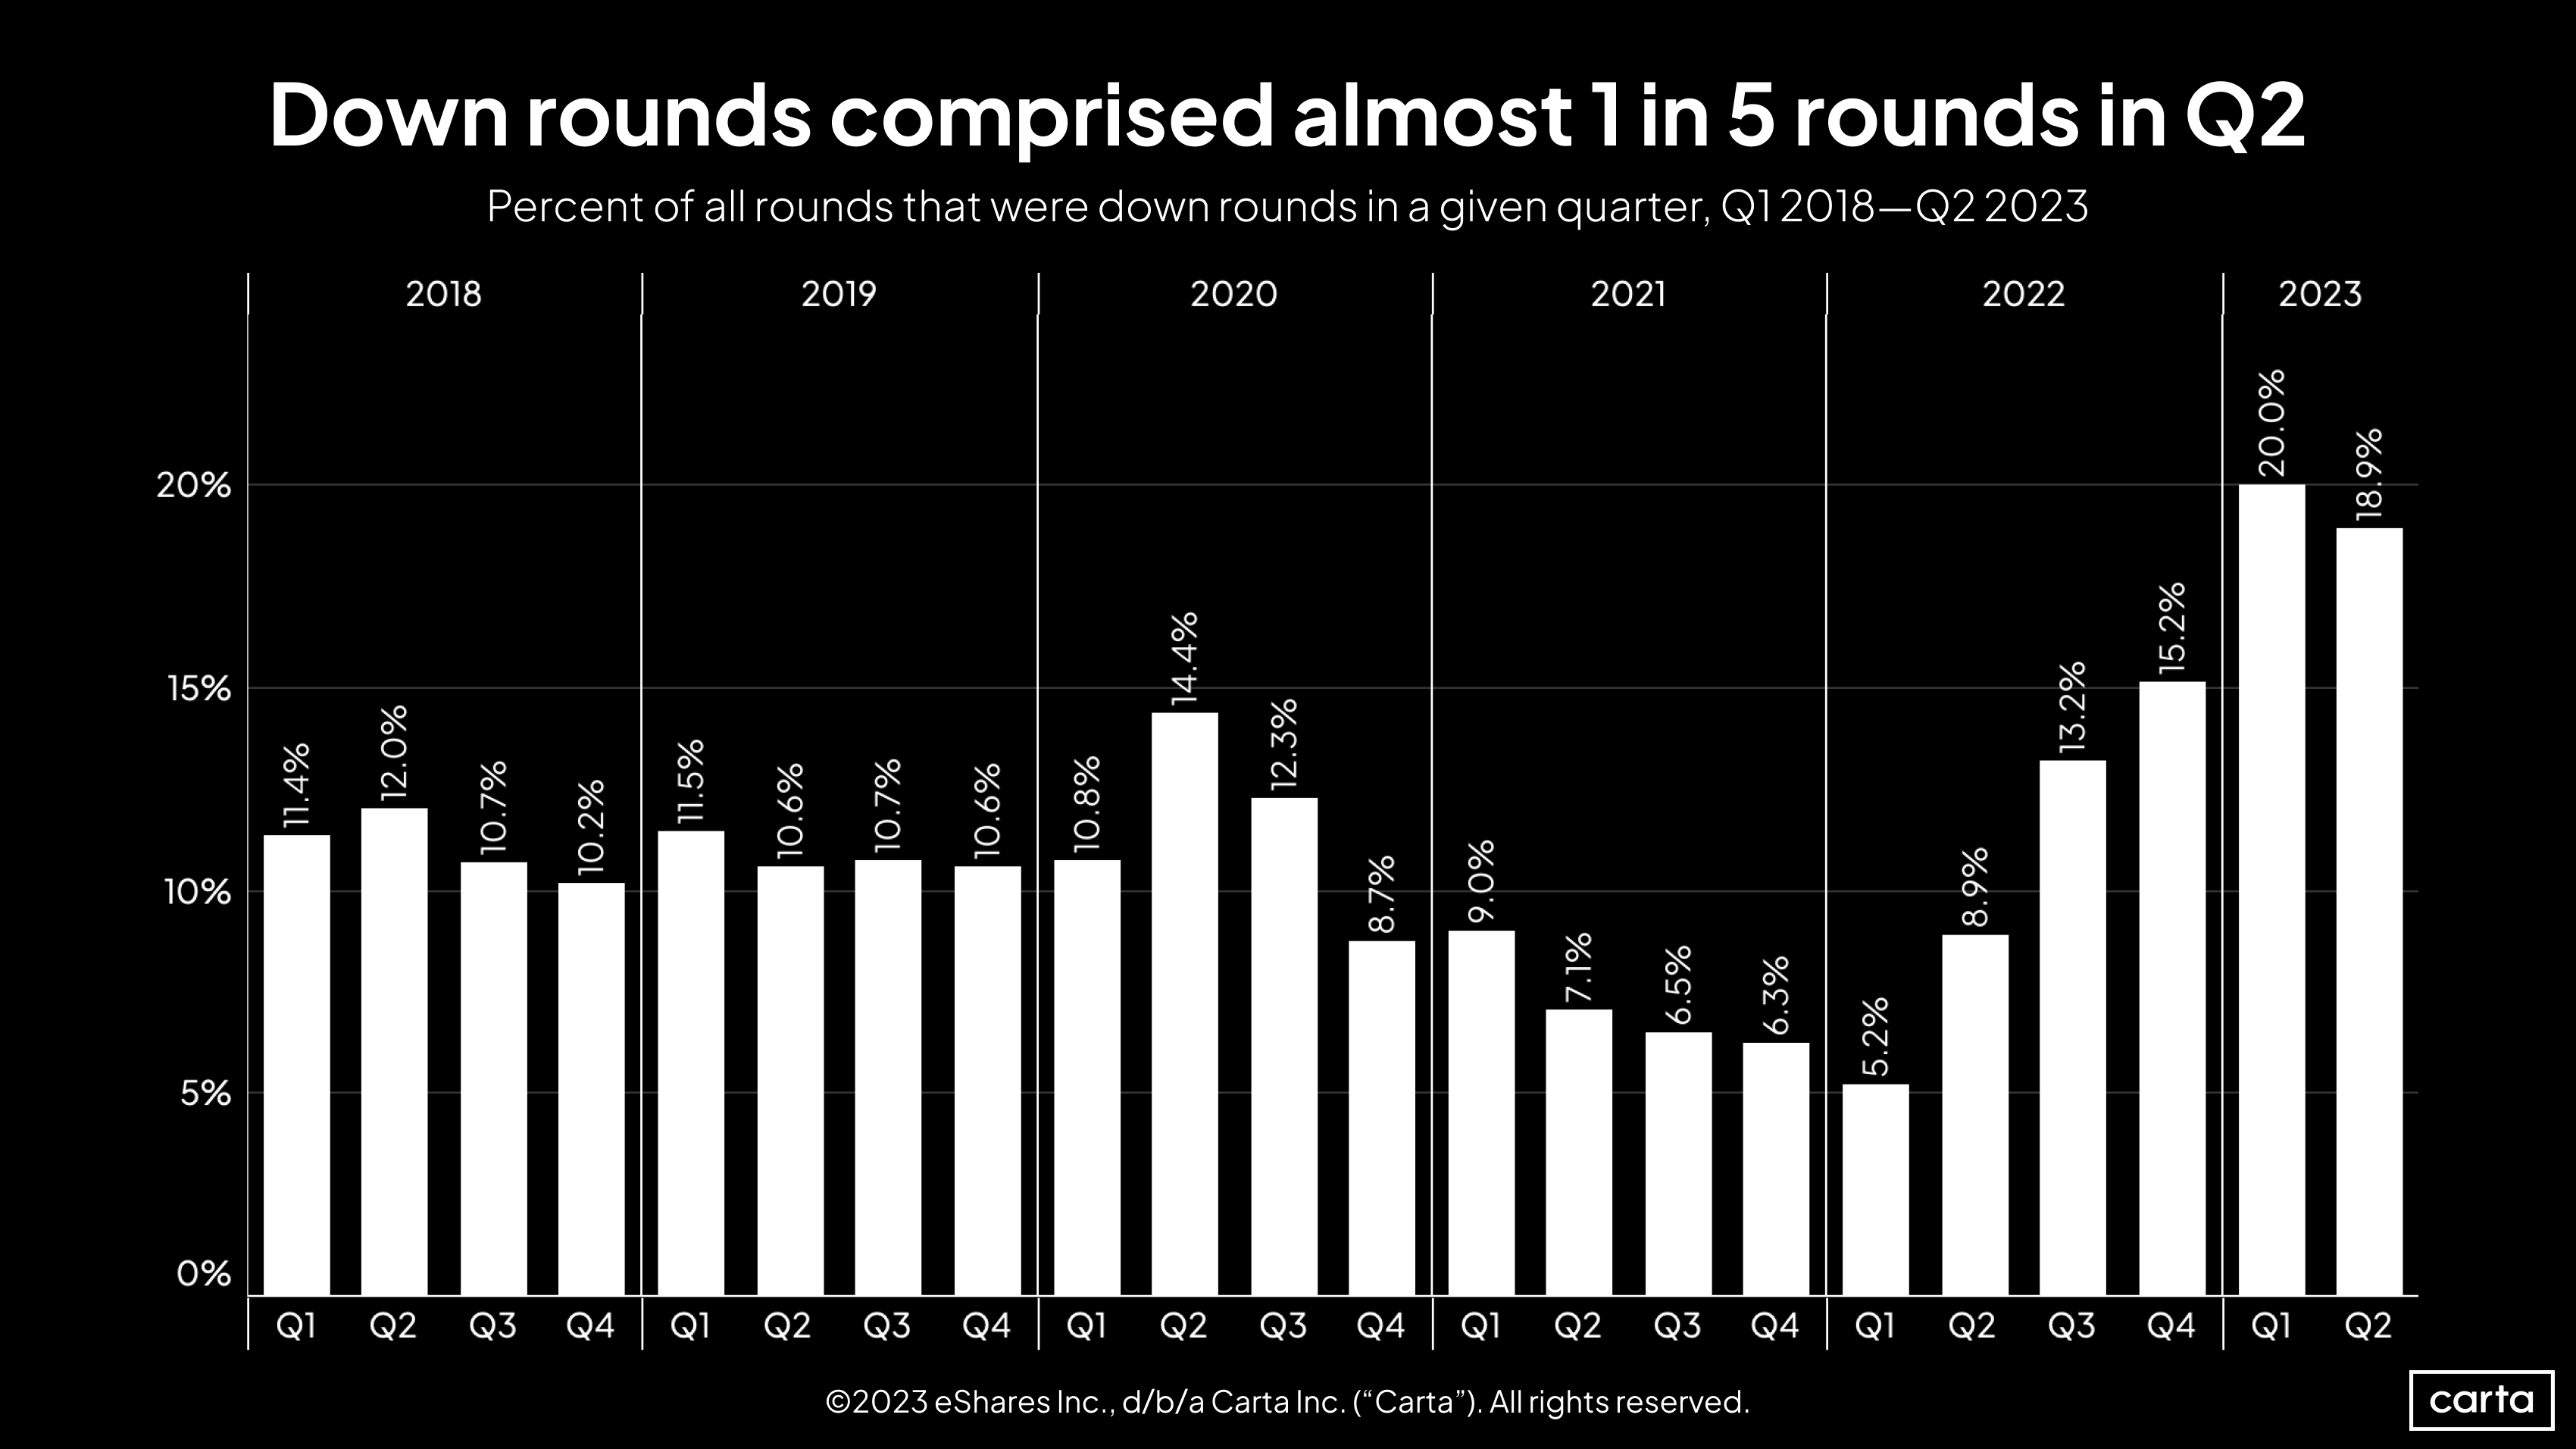
The startup valuation reset is real. Nearly 19% of all primary fundings on Carta in Q2 were down rounds, marking the third straight quarter in which that rate has been above 15%. Those three quarters represent the three highest rates of down rounds since at least the start of 2018.
The past 2.5 years of down-round data paint a clear picture of how the valuation landscape has shifted. Between Q1 2021 and Q1 2022, when the venture funding market was flourishing, the down-round rate declined for four straight quarters. After that, when the market entered a downturn, the down round rate increased for five straight quarters.
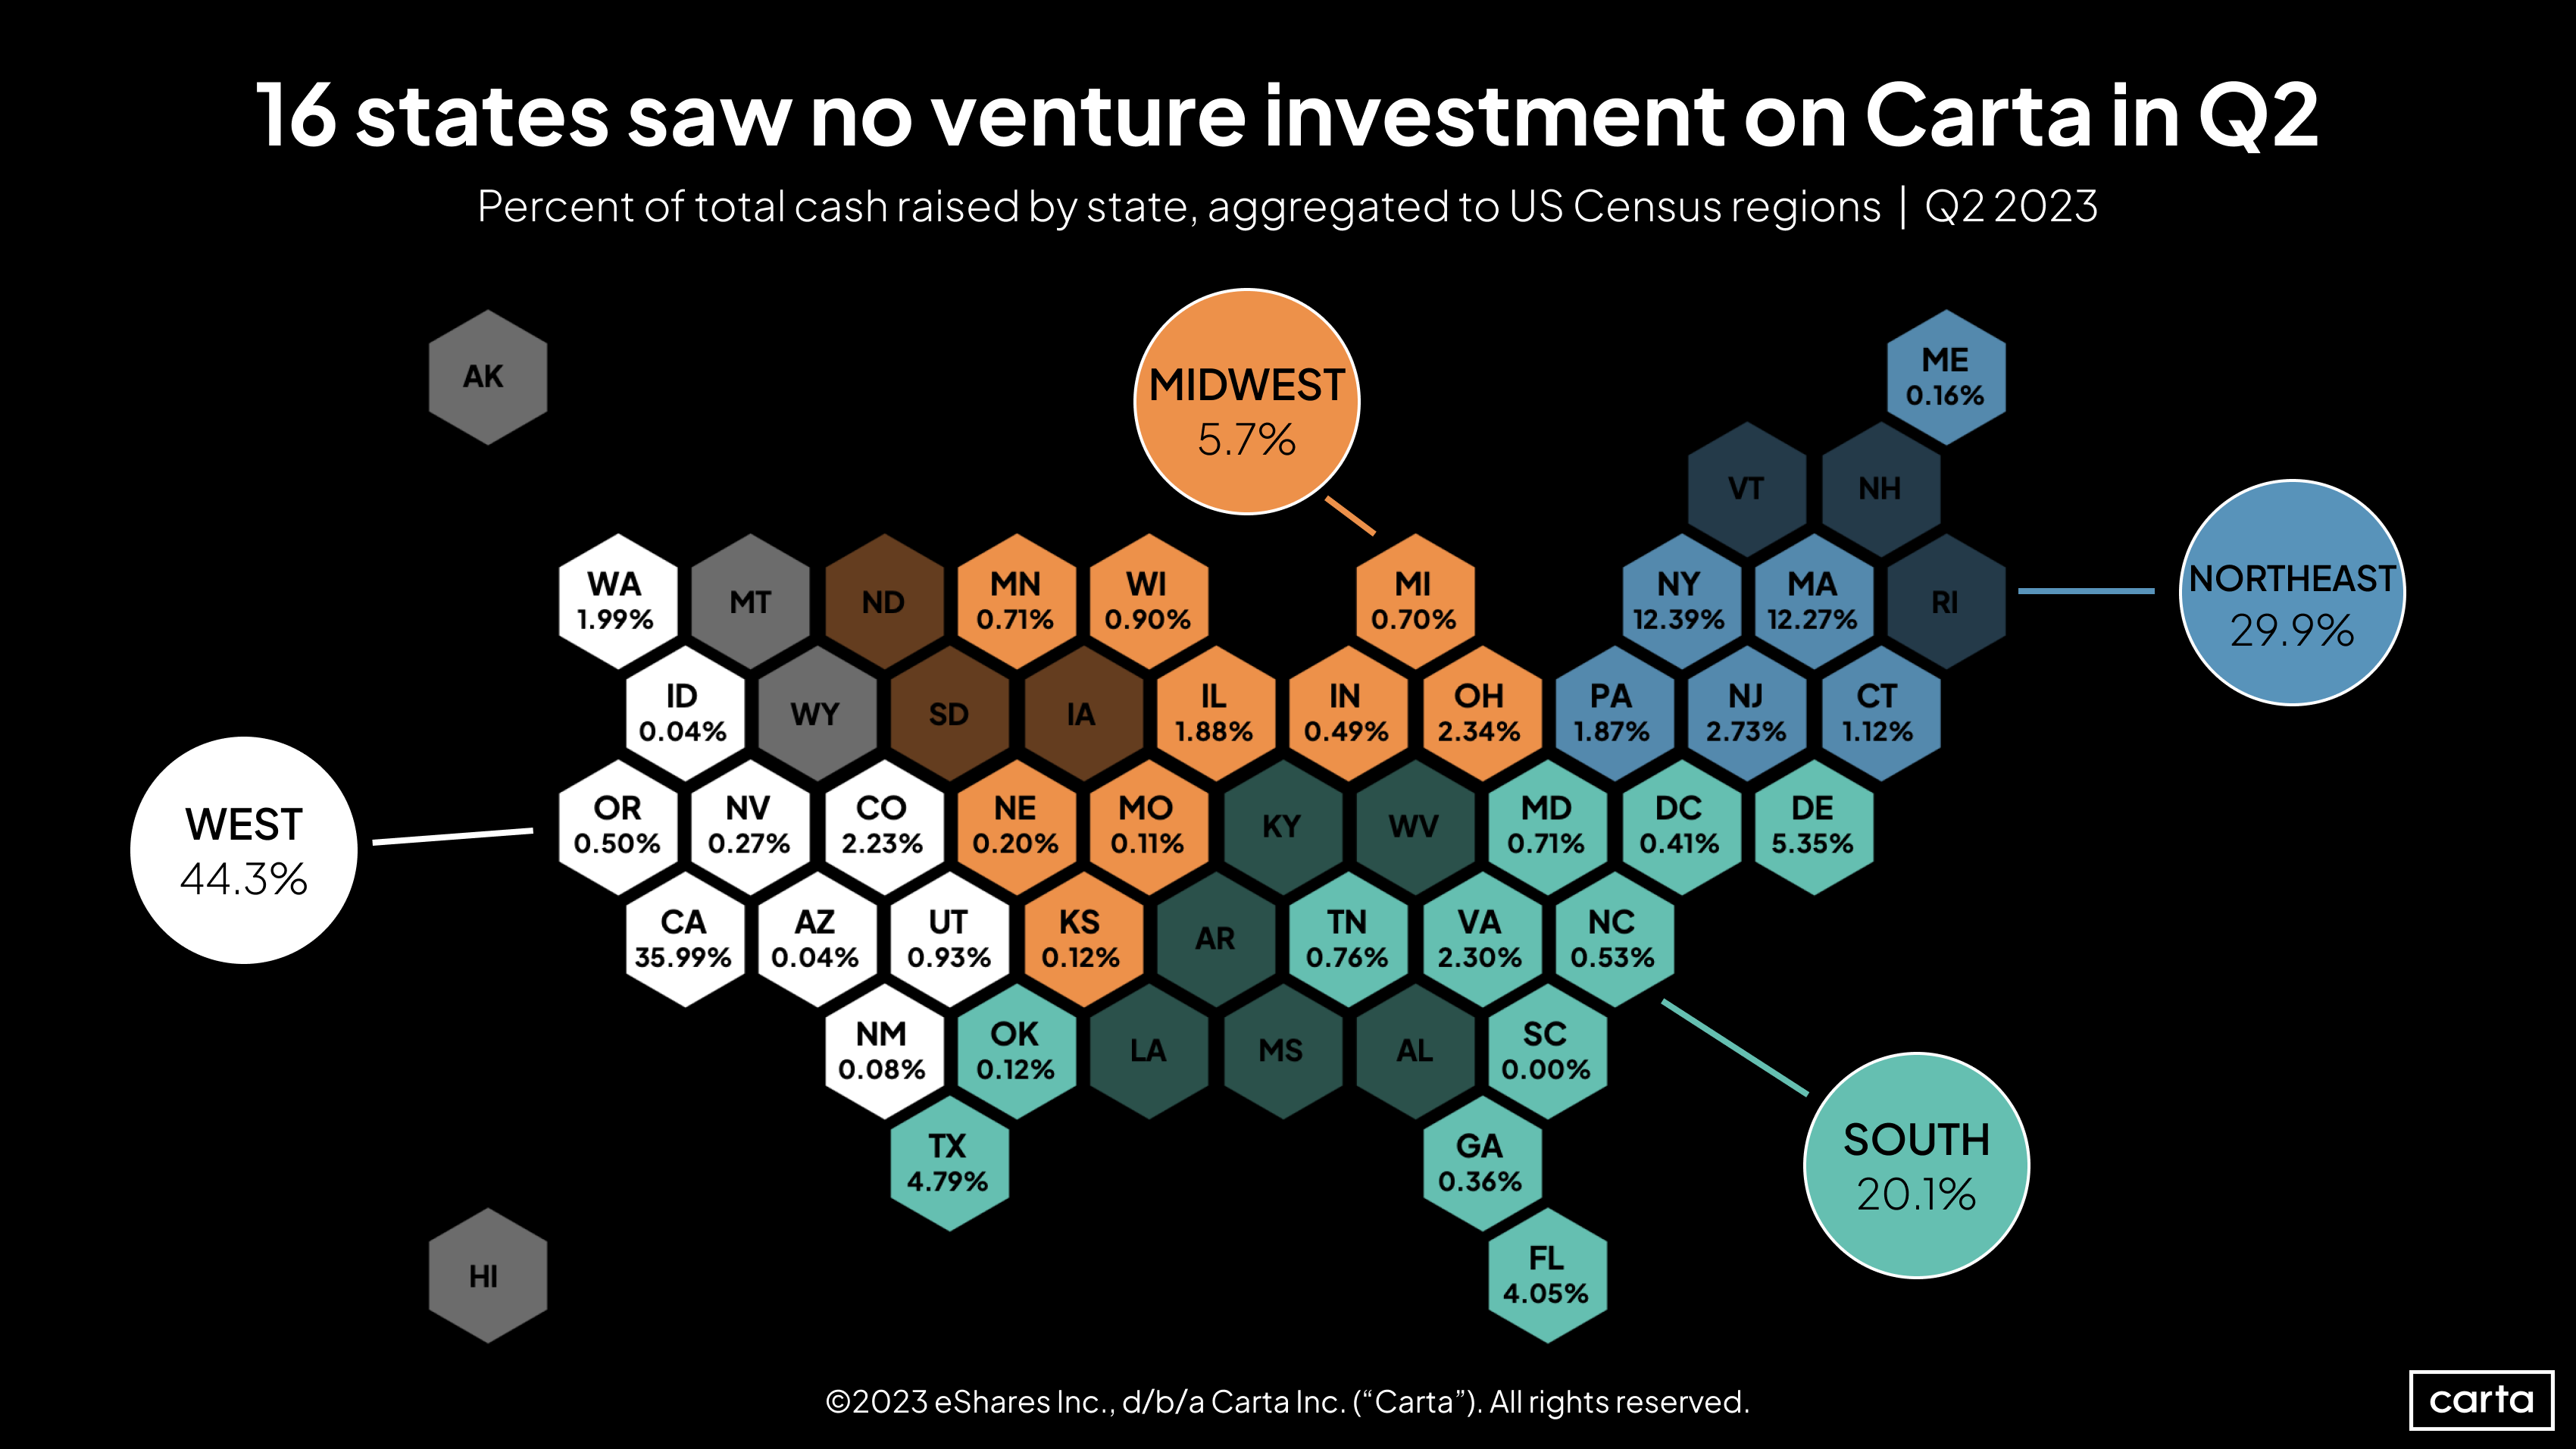
In terms of deal count, venture activity appears to have cooled off more in the West than in other parts of the country. The West census region accounted for 44.3% of all investments on Carta in Q2—still more than any other region, but down significantly from a 51.2% share in Q1 2023 and 55% for the entirety of 2022.
Each of the other three regions has seen an increase in its share of activity. The Midwest went from 3.5% of all deals in Q1 to 5.7% in Q2. The South rose from 18.1% to 20.1%, and the Northeast climbed from 26.8% to 29.9%.
When looking at the percentage of cash raised instead of deal count, the picture is similar, but less dramatic. The West fell from 47% of venture dollars raised on Carta in Q1 to 44% in Q2, while the other regions all either increased or held steady.
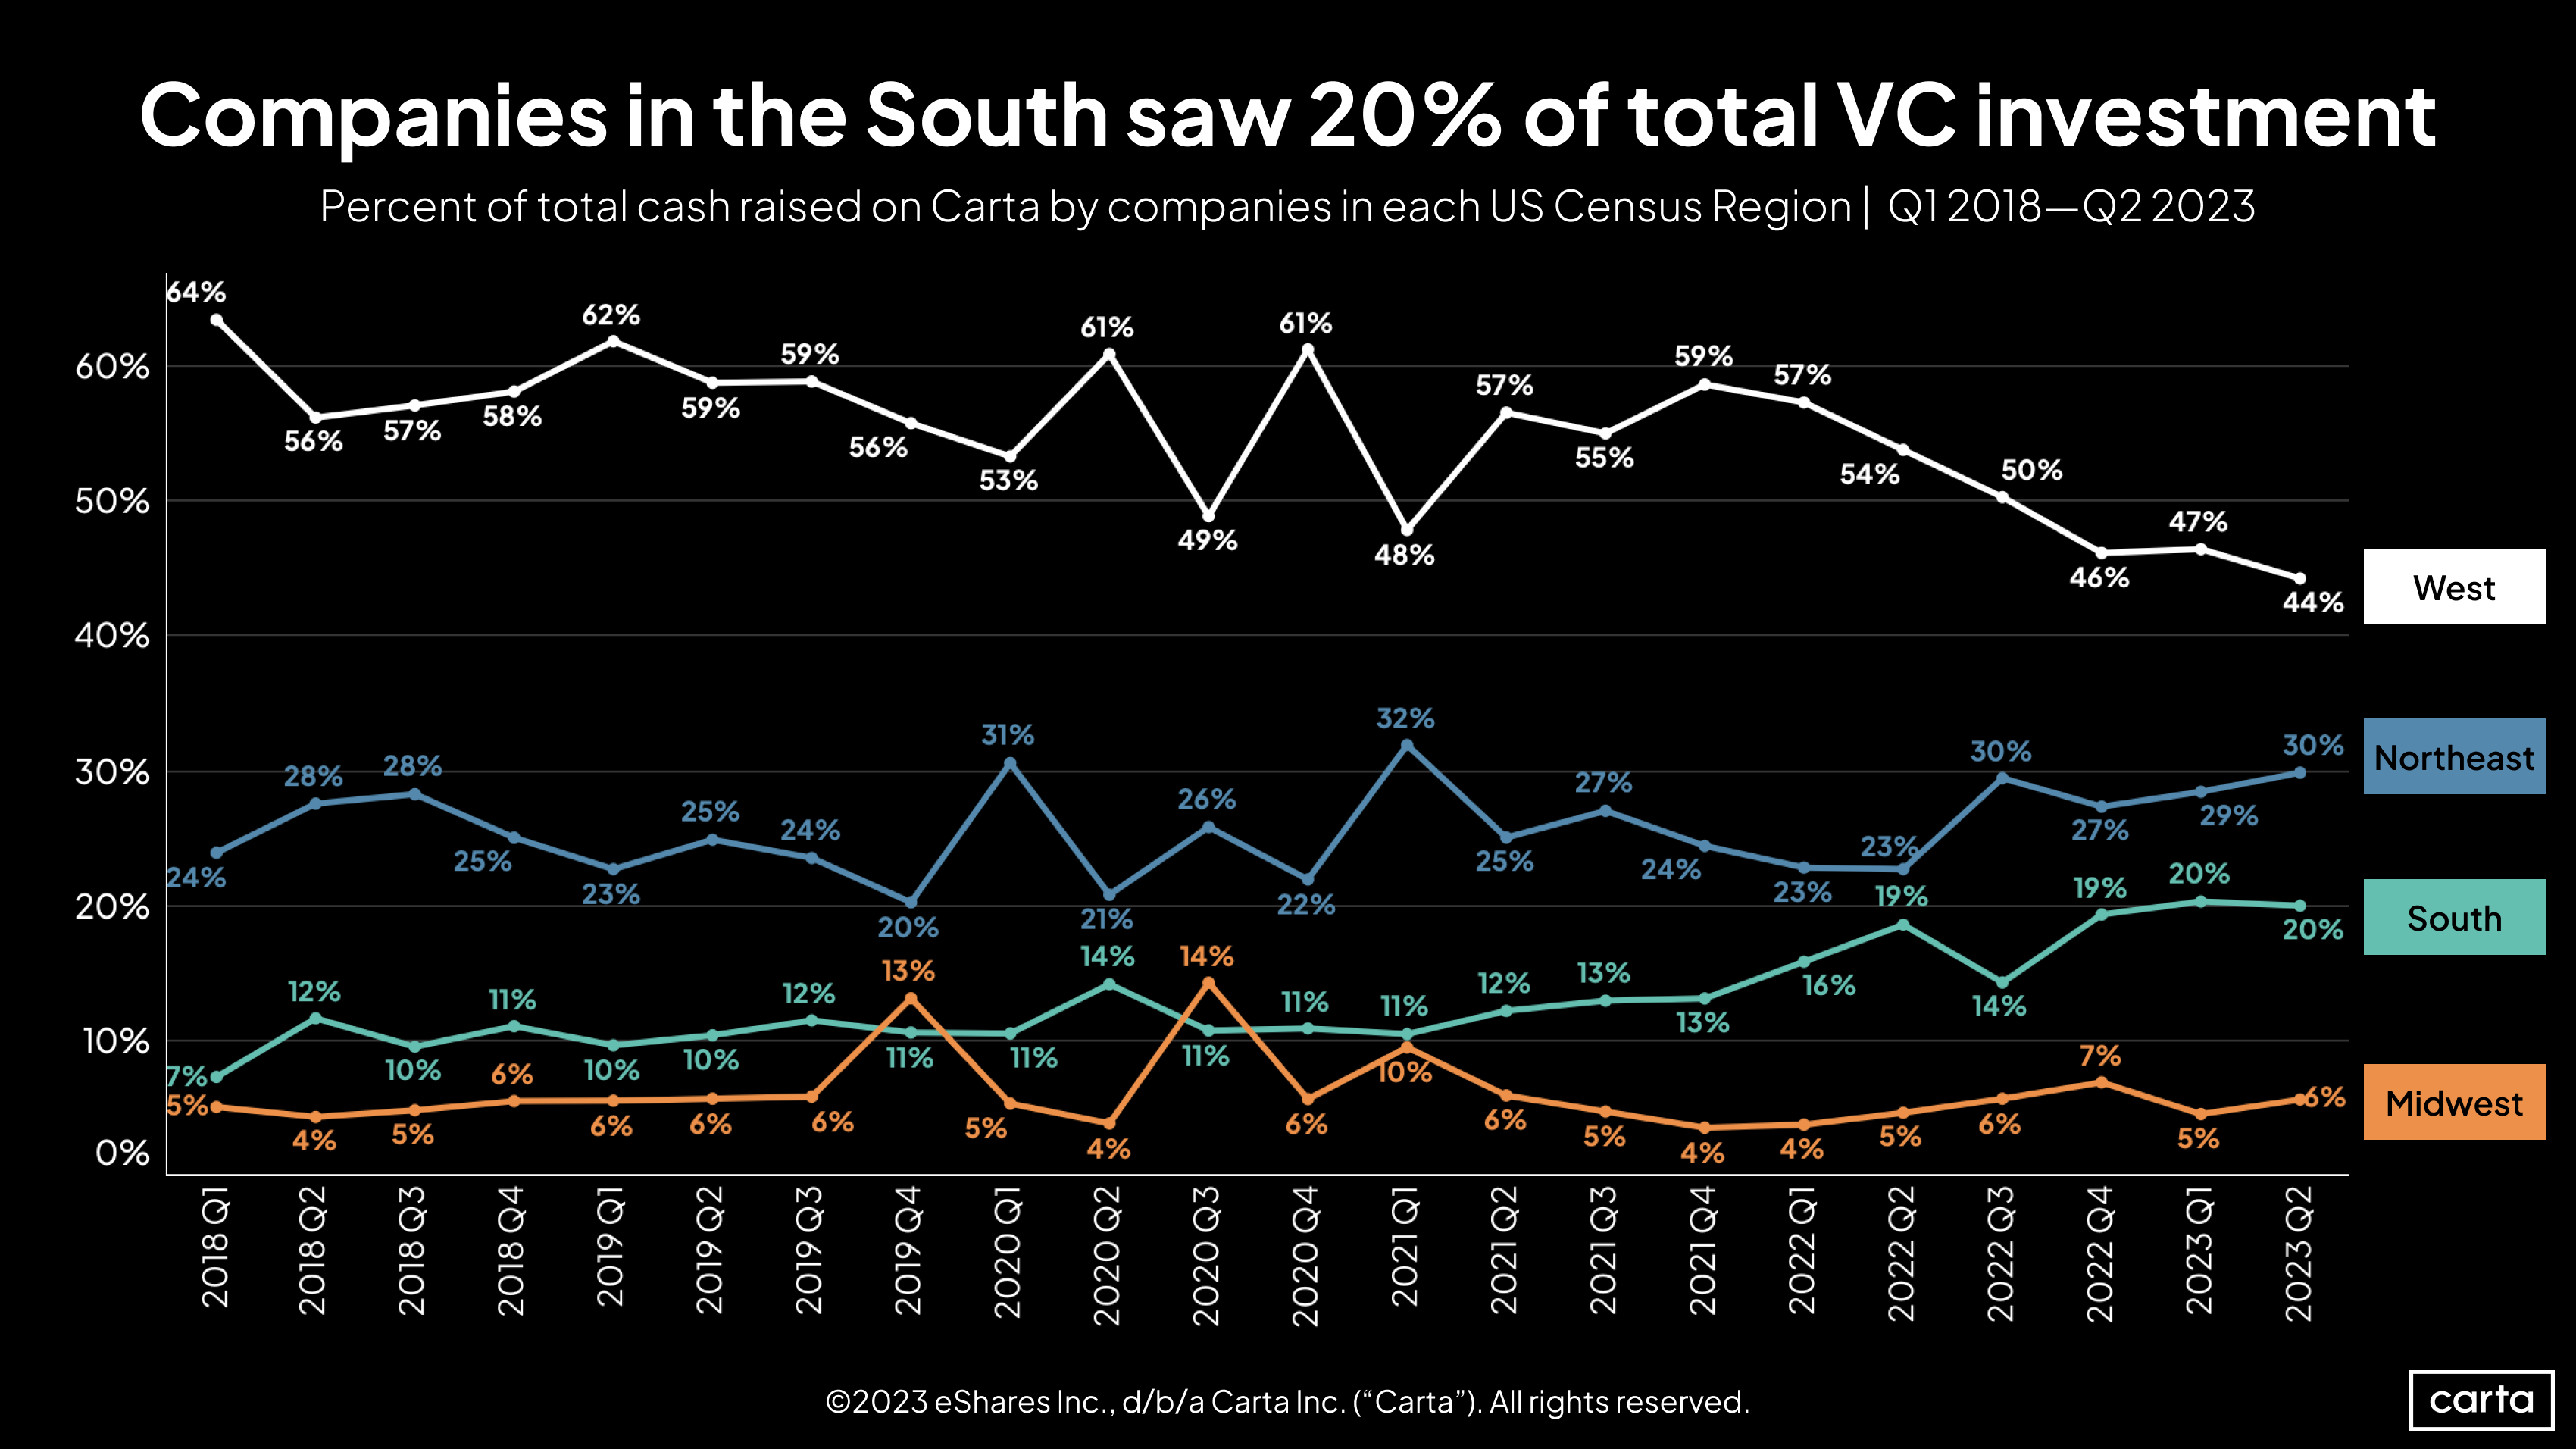
On a longer timeline, two major shifts emerge: The West’s share of all cash raised has gradually declined, and the South’s share has seen the greatest relative increase. Over the past four years, the West’s portion of venture funding has fallen from 59% to 44%, and the South’s has risen from 10% to 20%. Meanwhile, the Midwest remains at 6% of cash raised, and the Northeast has ticked up from 25% to 30% over the same span.
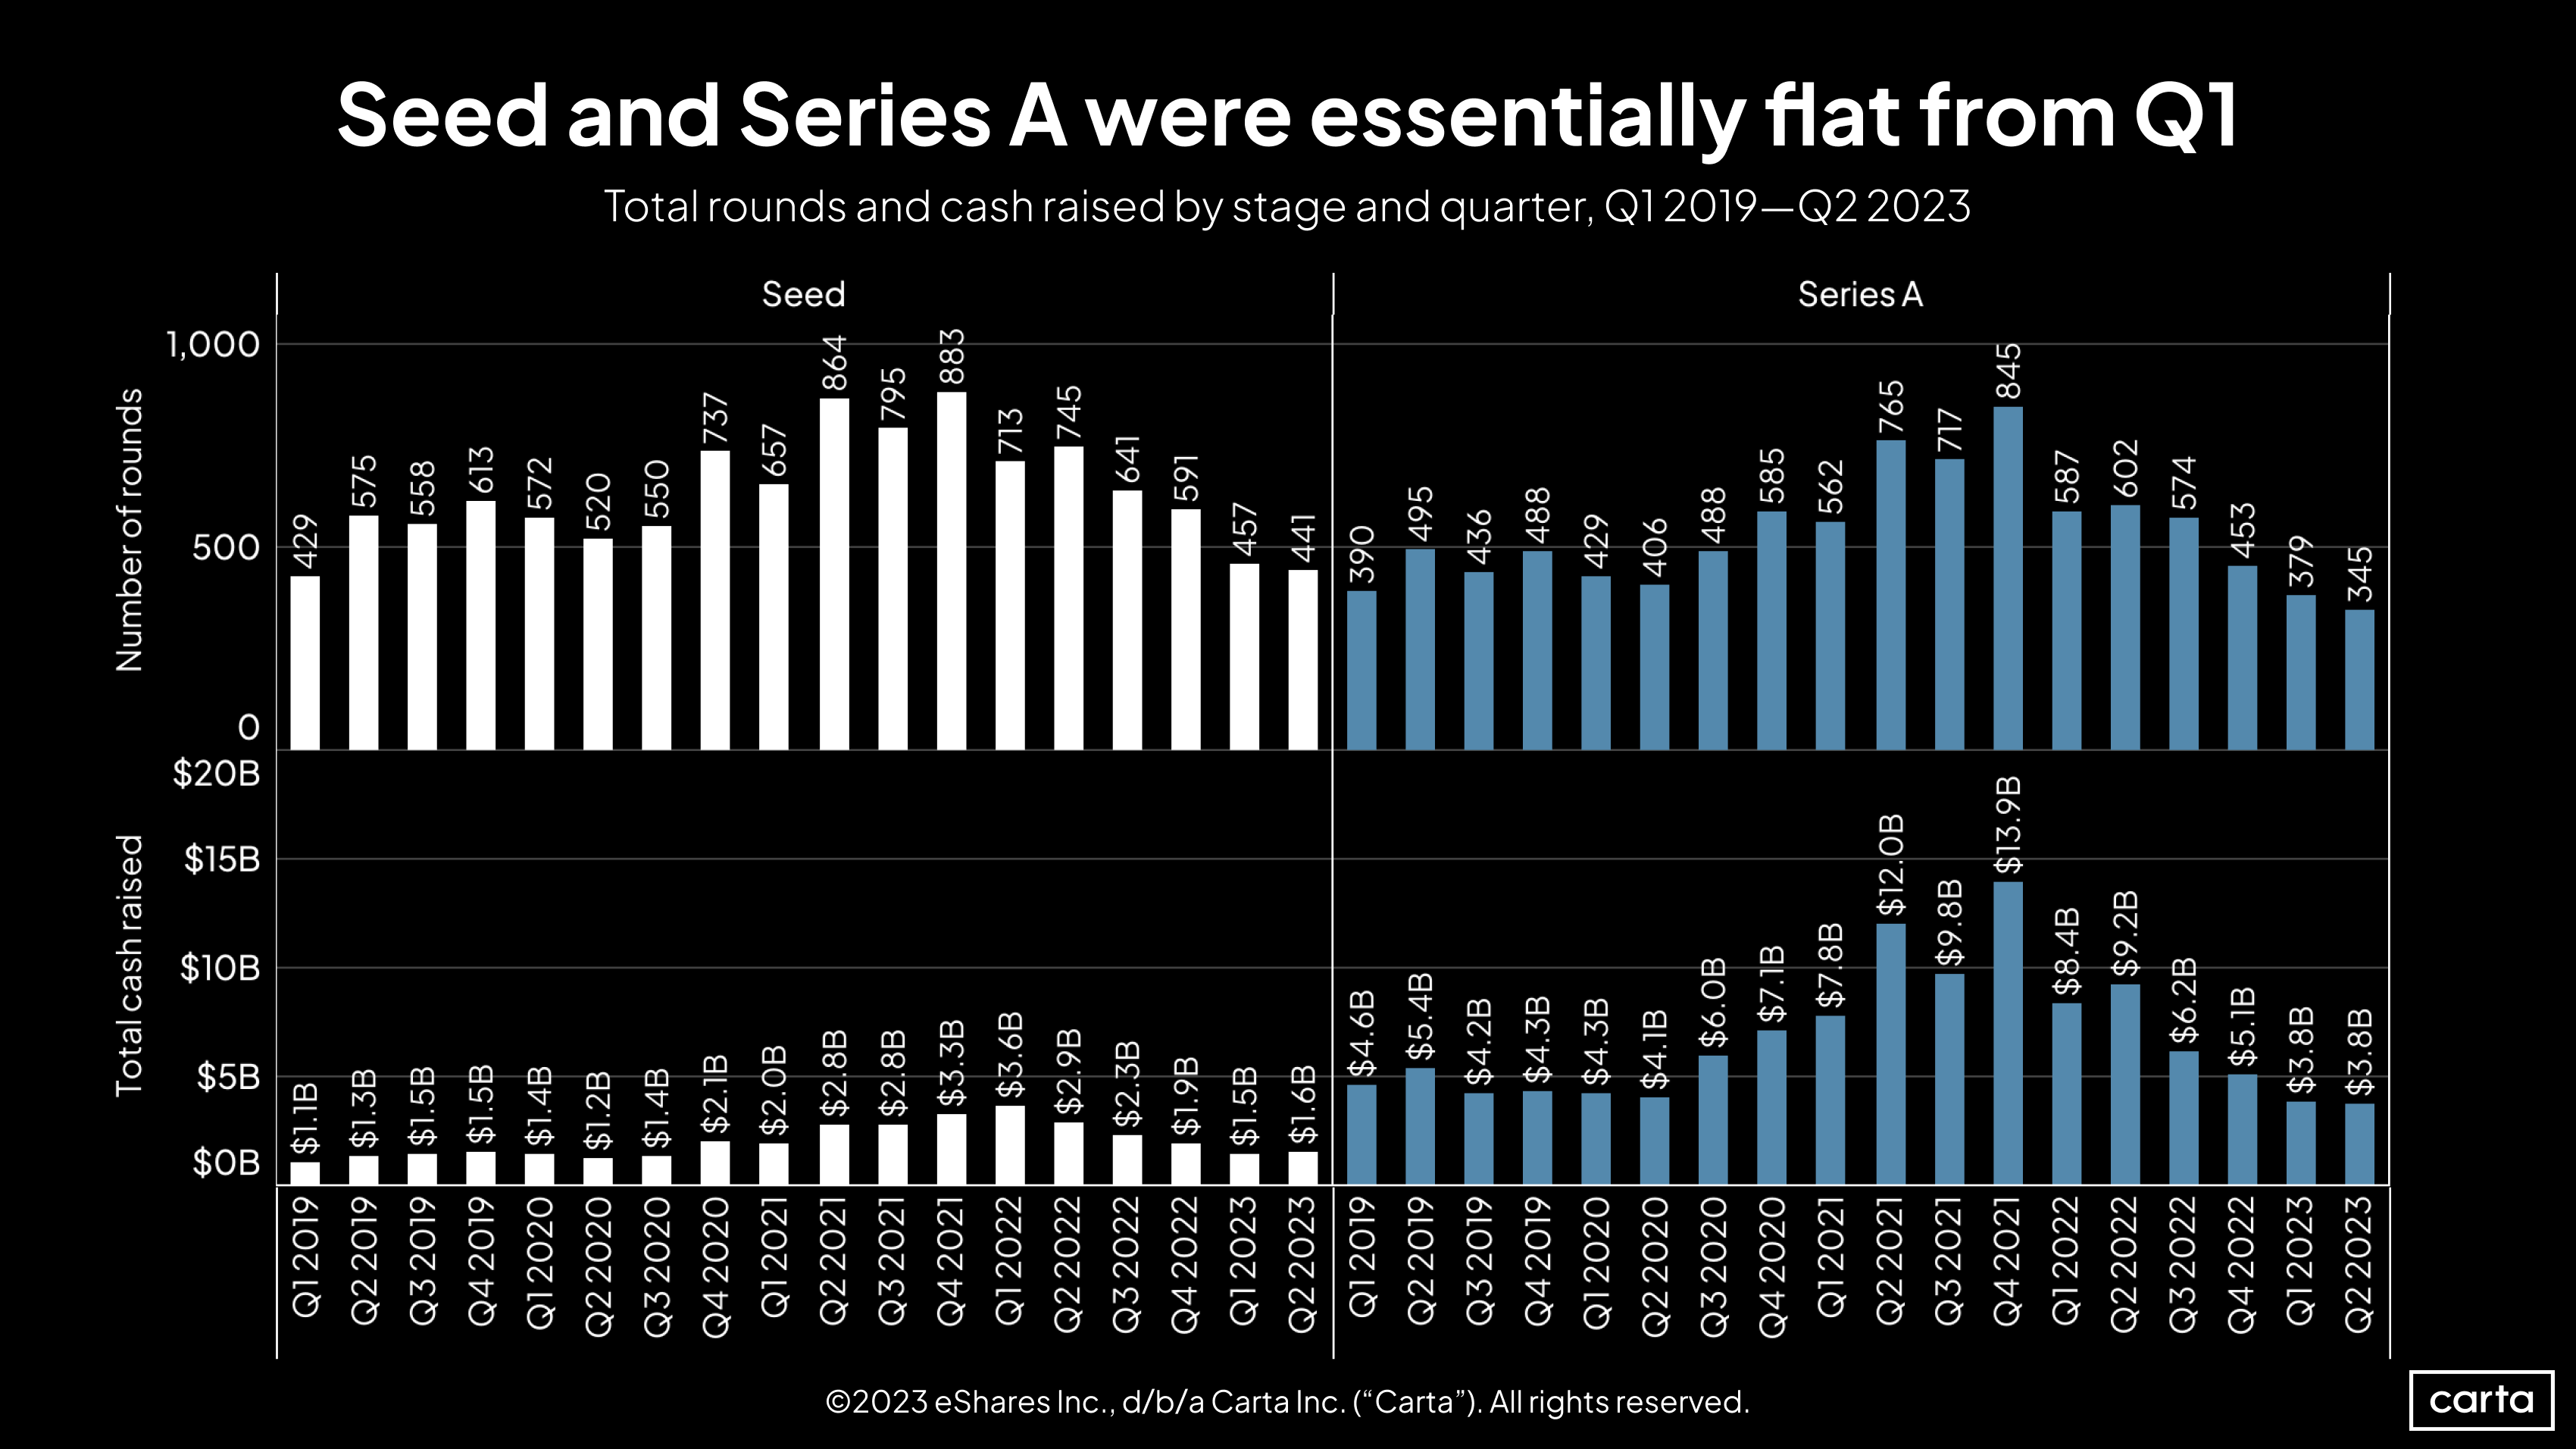
In terms of the number of deals and dollars raised, little changed at the earliest stages of the startup lifecycle in Q2.
For now, deal count ticked down slightly at both seed and Series A, but those figures could increase in the coming weeks as more fundings from Q2 are reported on Carta. Total cash raised at Series A in Q2 was $3.8 billion, equaling Q1 for the lowest count since at least the start of 2019.
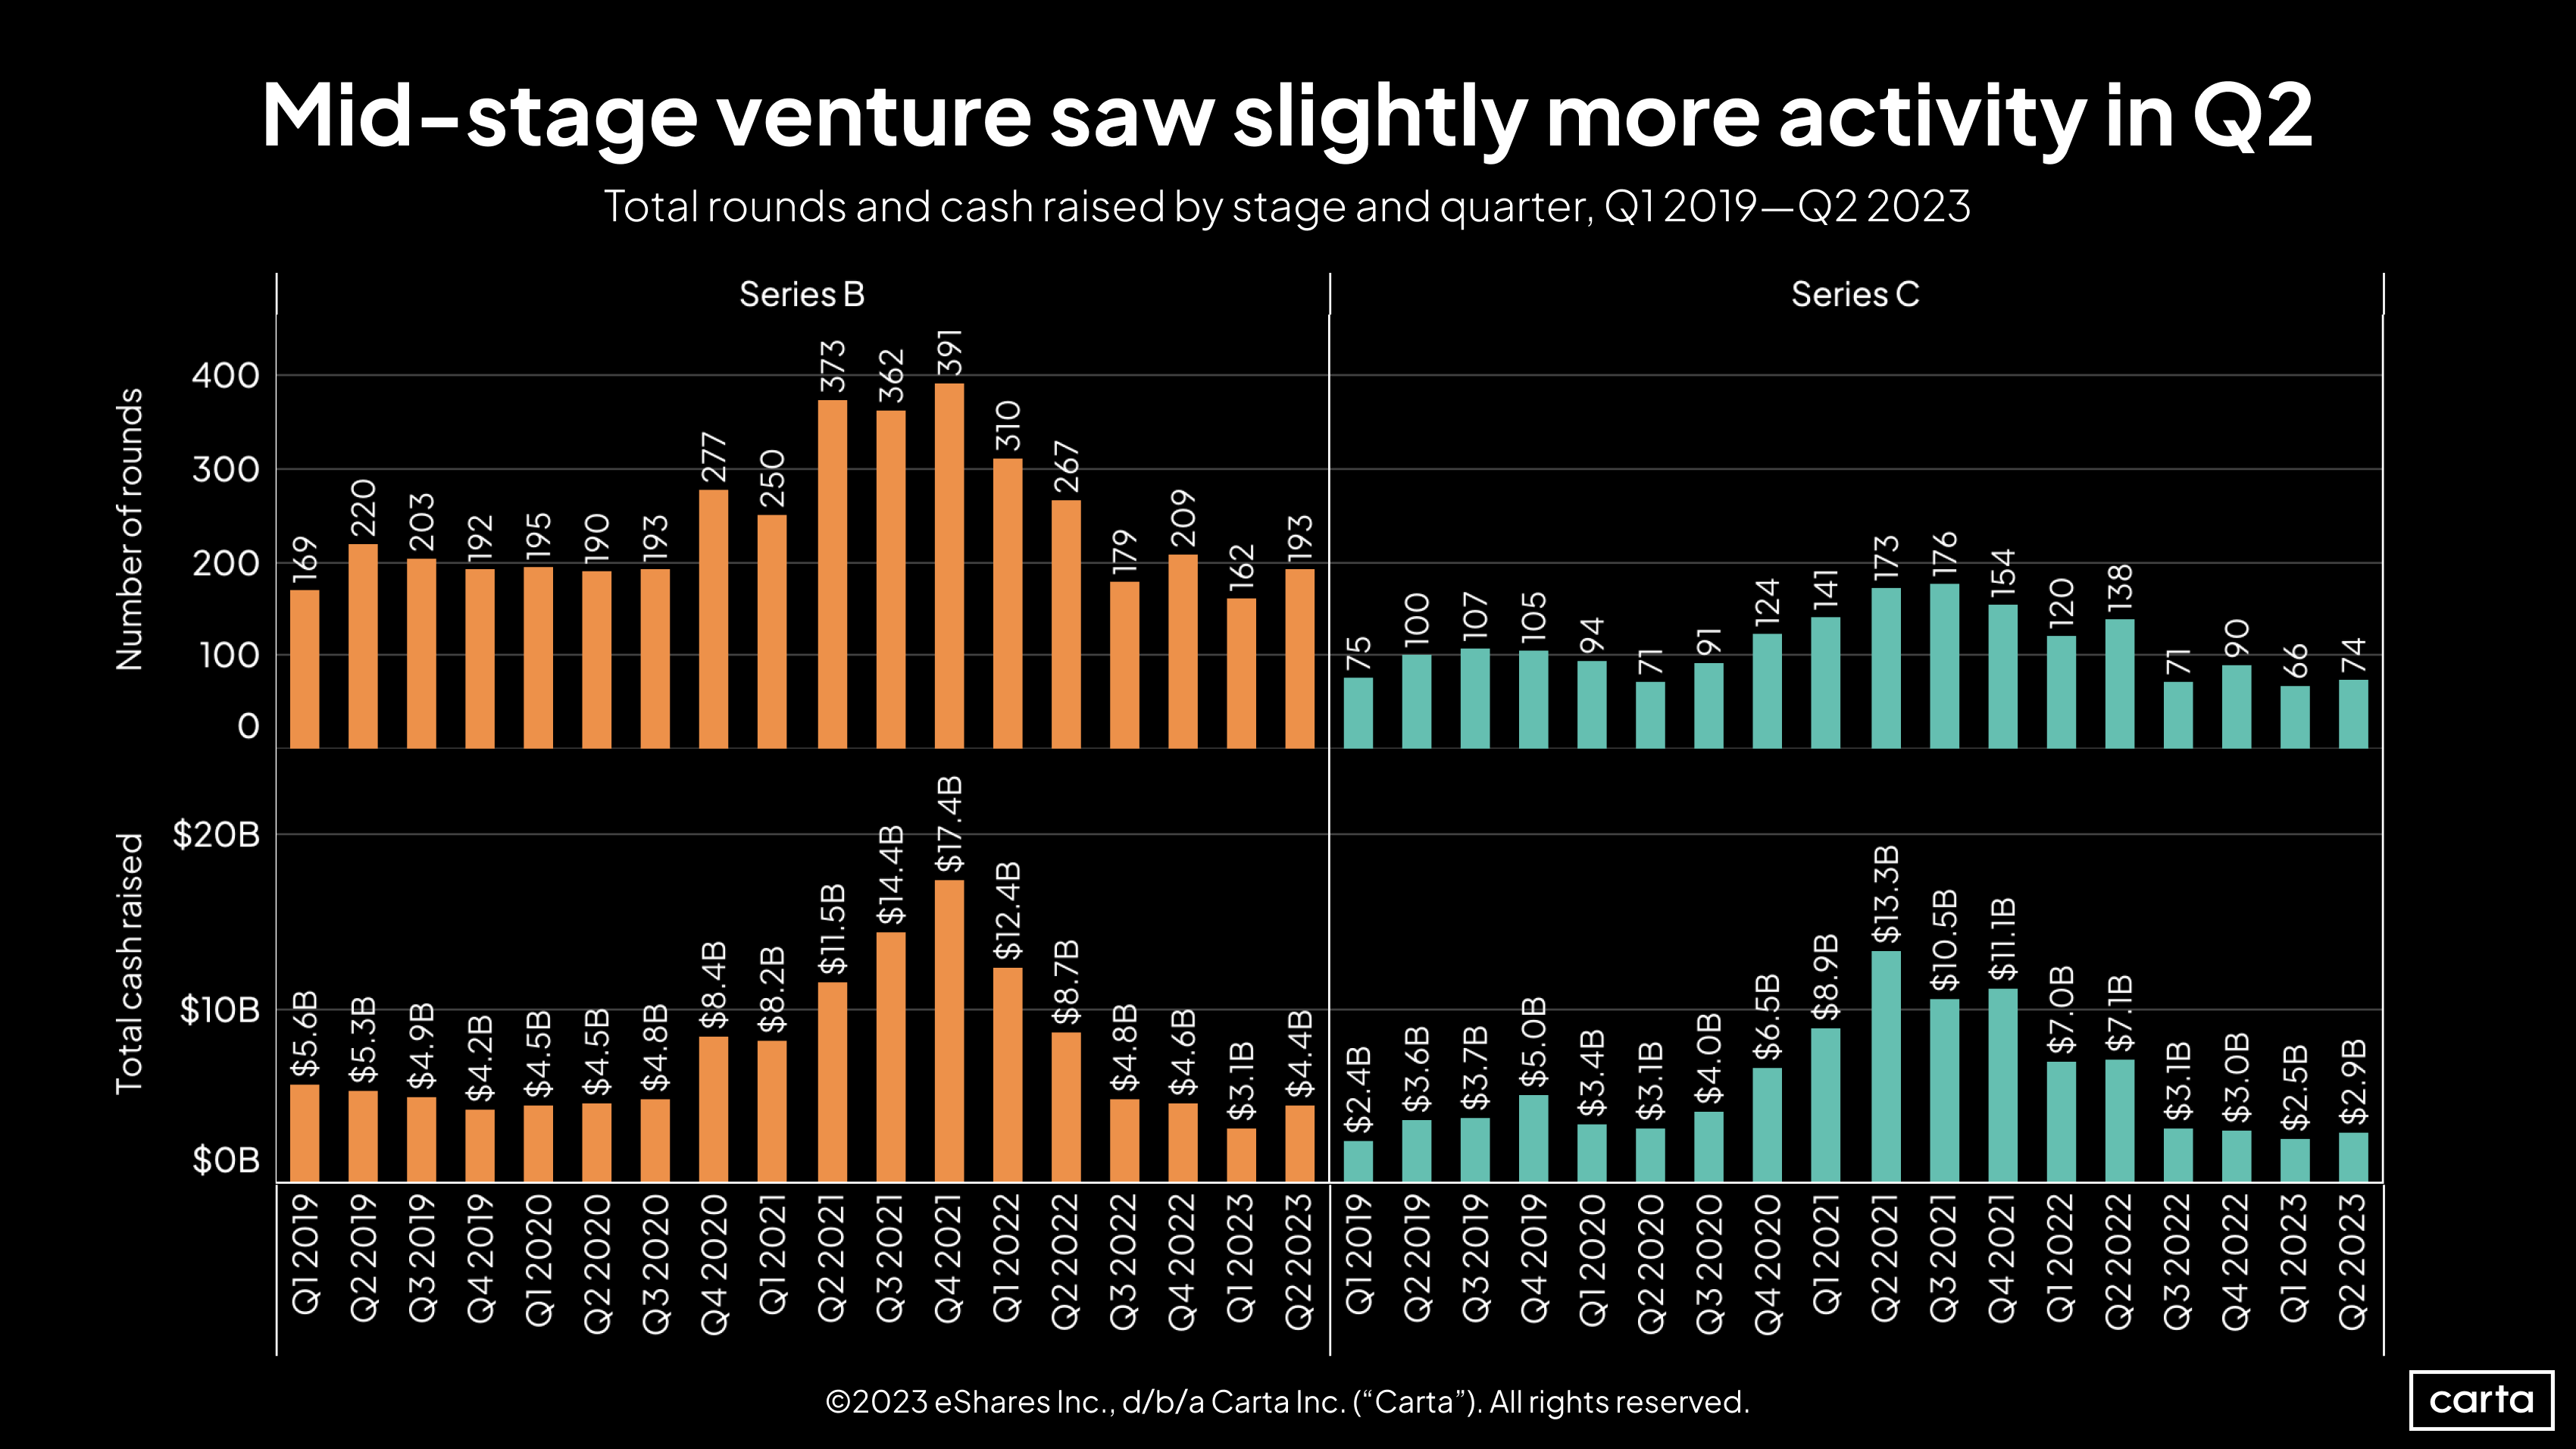
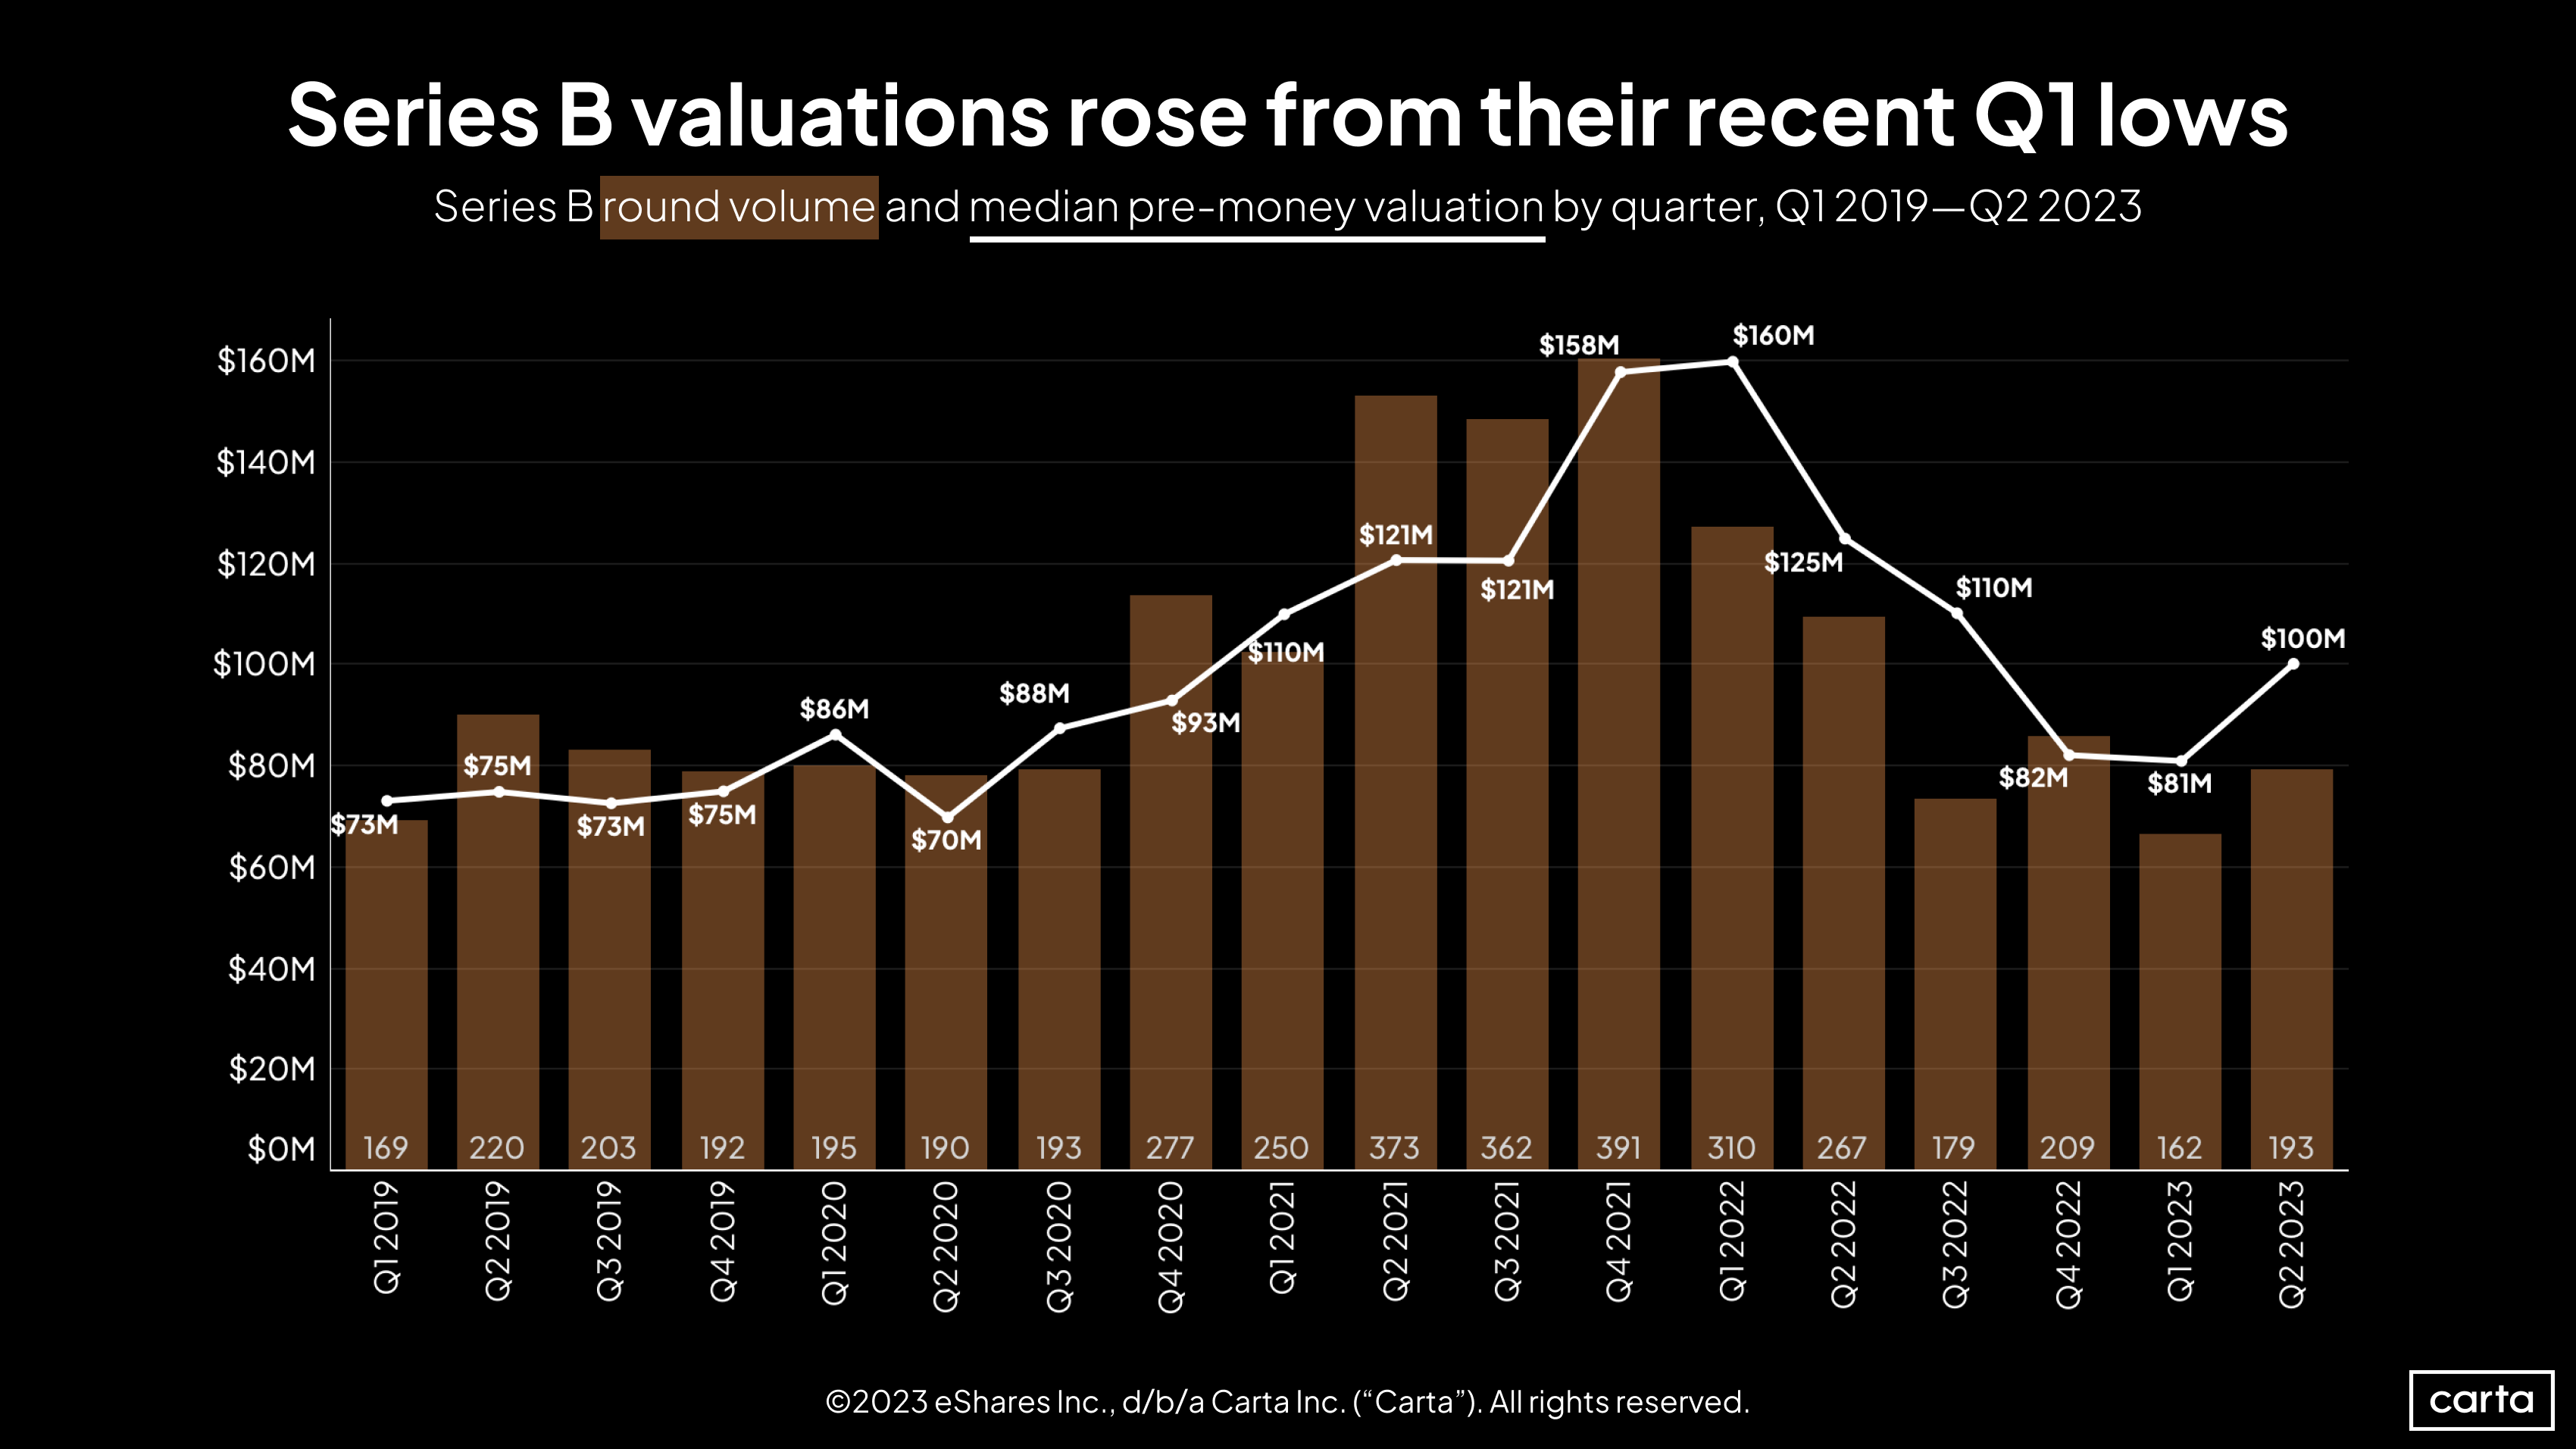
At both Series B and Series C, the number of venture investments on Carta began to bounce back in Q2 after sinking to recent low points in Q1. The number of Series B deals increased 19% quarter over quarter, while Series C deal count climbed by 12%.
At Series B, the quarterly increase in cash raised was even bigger, with Q2’s total of $4.4 billion representing a 42% rise. Series C cash increased by a more modest 14%. Still, despite those quarter-over-quarter climbs, funding totals at both stages remain relatively low compared to the prior four-plus years.
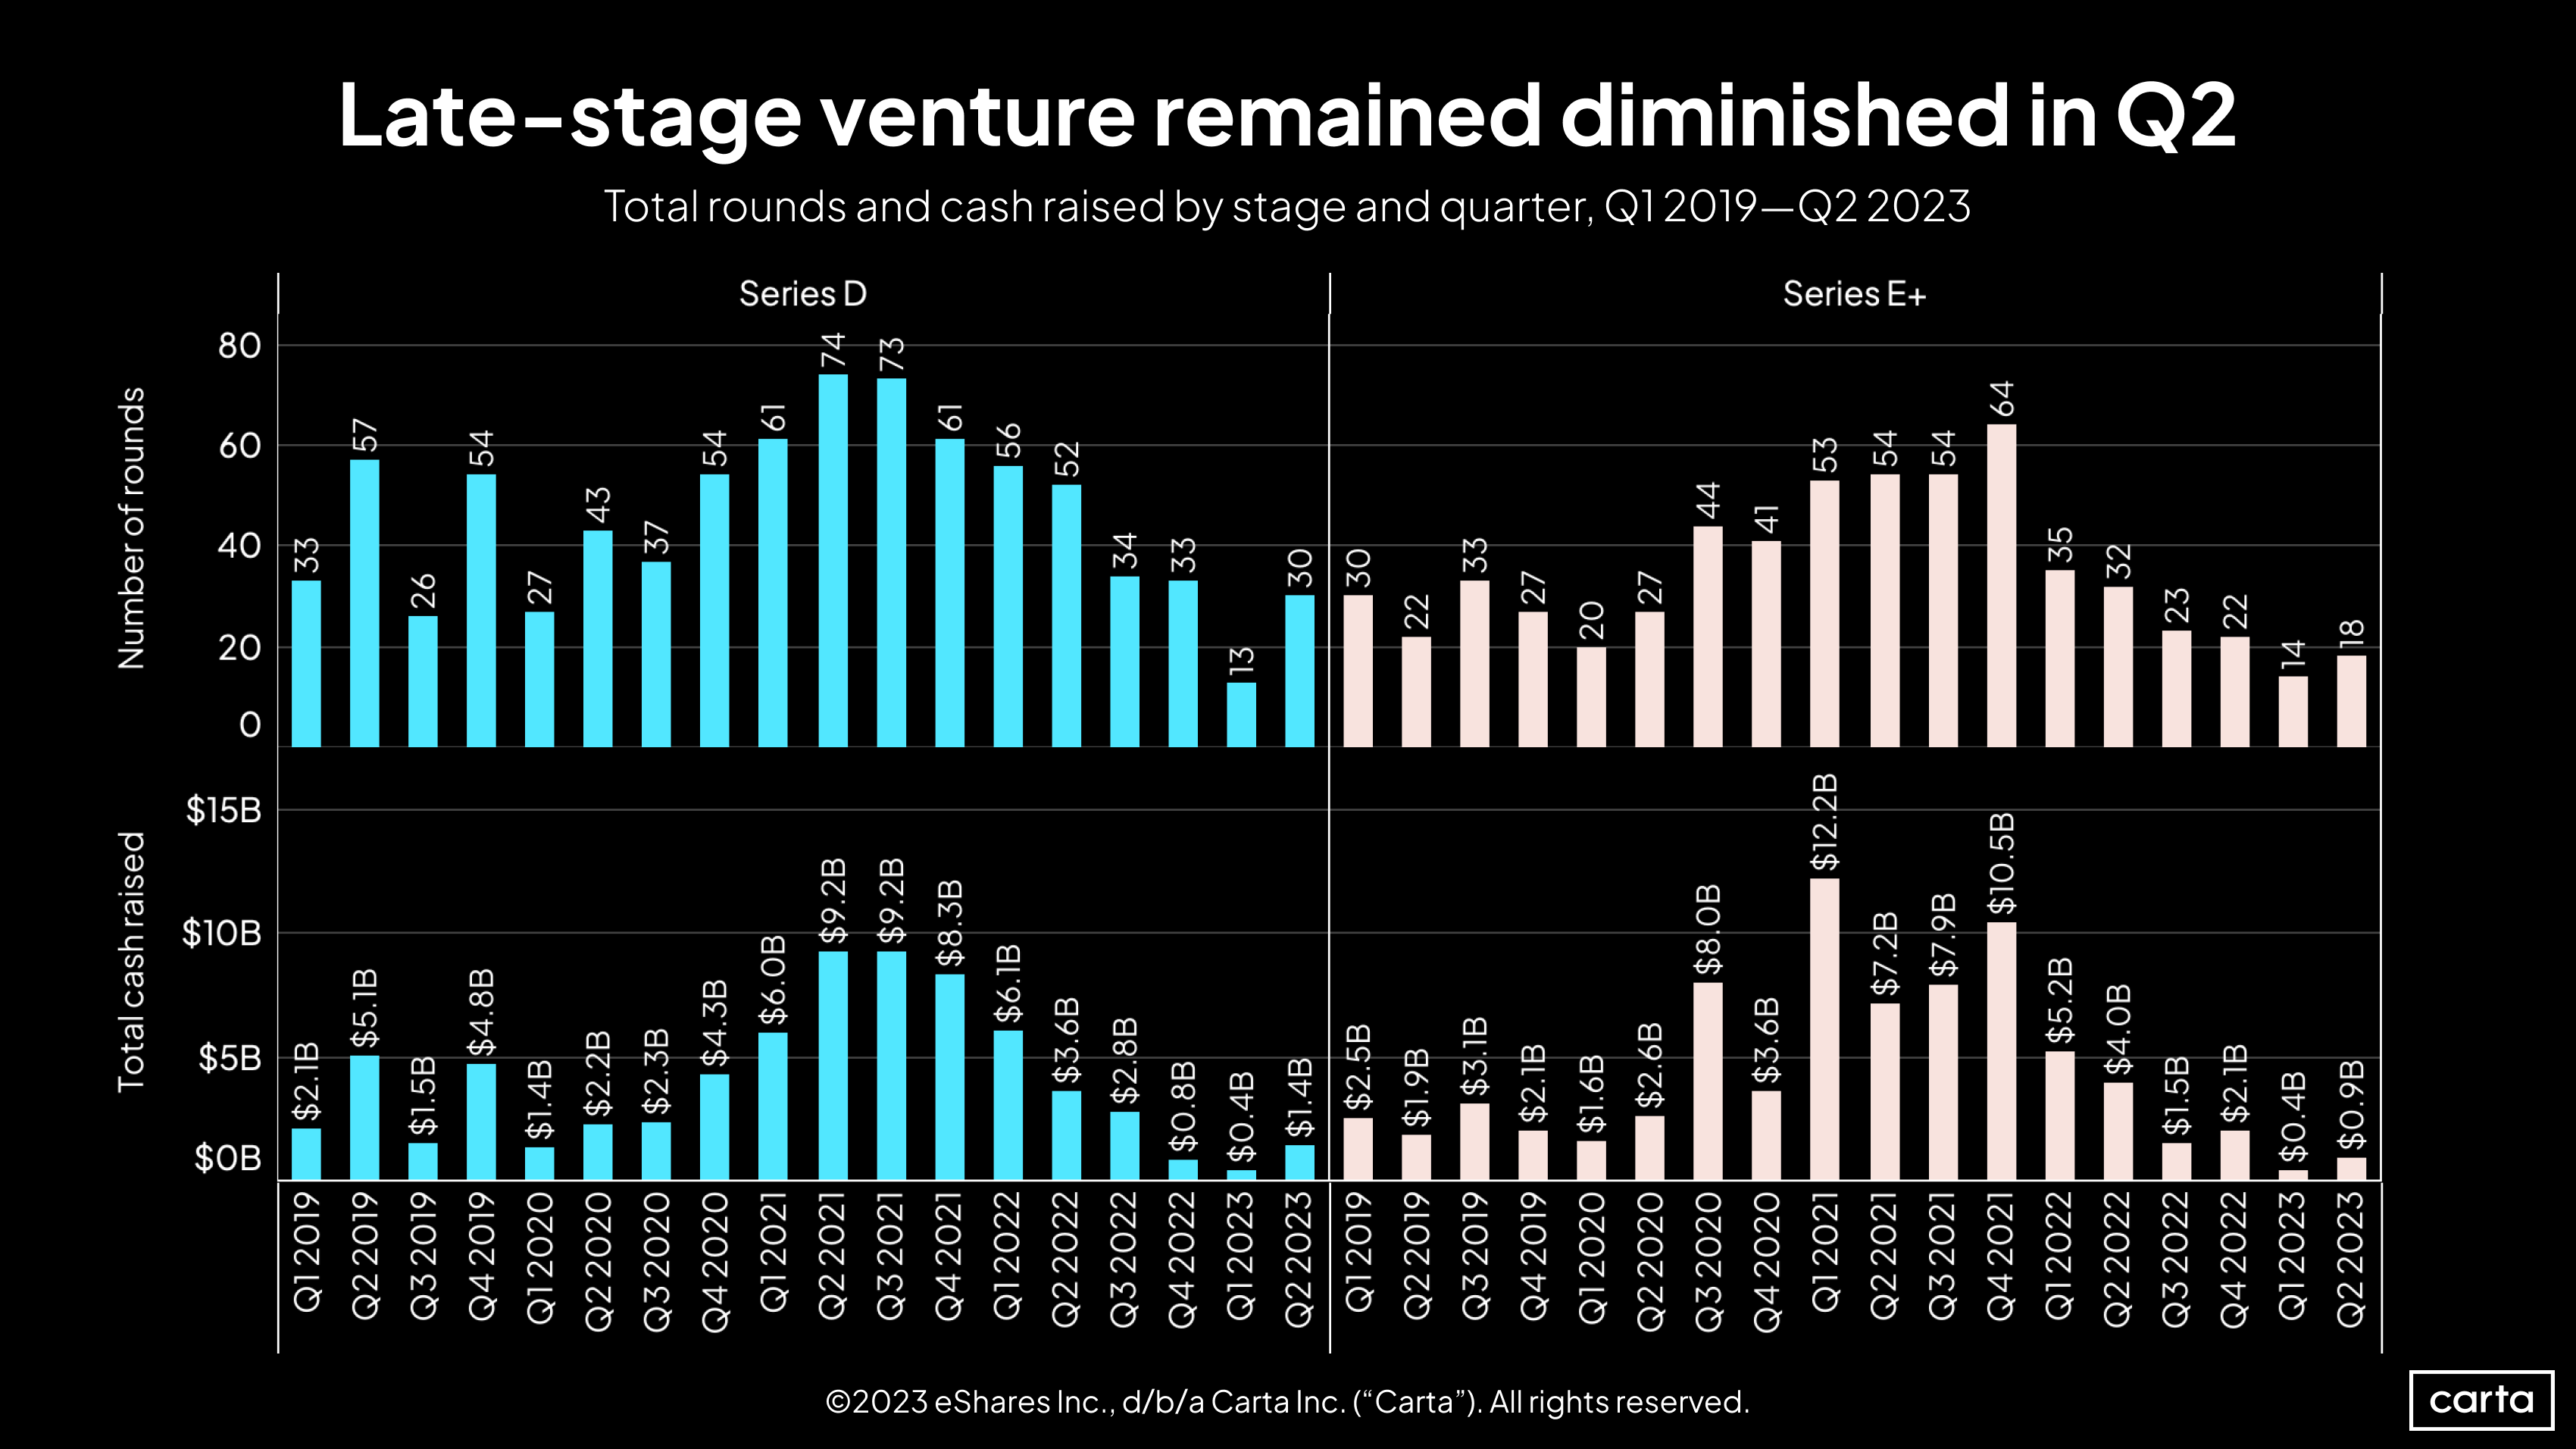
It’s still too early to say for sure, but it appears that late-stage venture activity on Carta has begun to rebound after potentially bottoming out in Q1. Yet even with the inklings of a recovery, the late-stage market is a long way off from the highs of 2021.
The number of Series D deals more than doubled from Q1 to Q2, and total Series D cash raised climbed by 250%. But on a year-over-year basis, Series D funding is down 61%. Total cash raised at Series E and beyond also climbed by more than 100% from Q1 to Q2, but it remained below $1 billion, representing a 78% year-over-year decline.
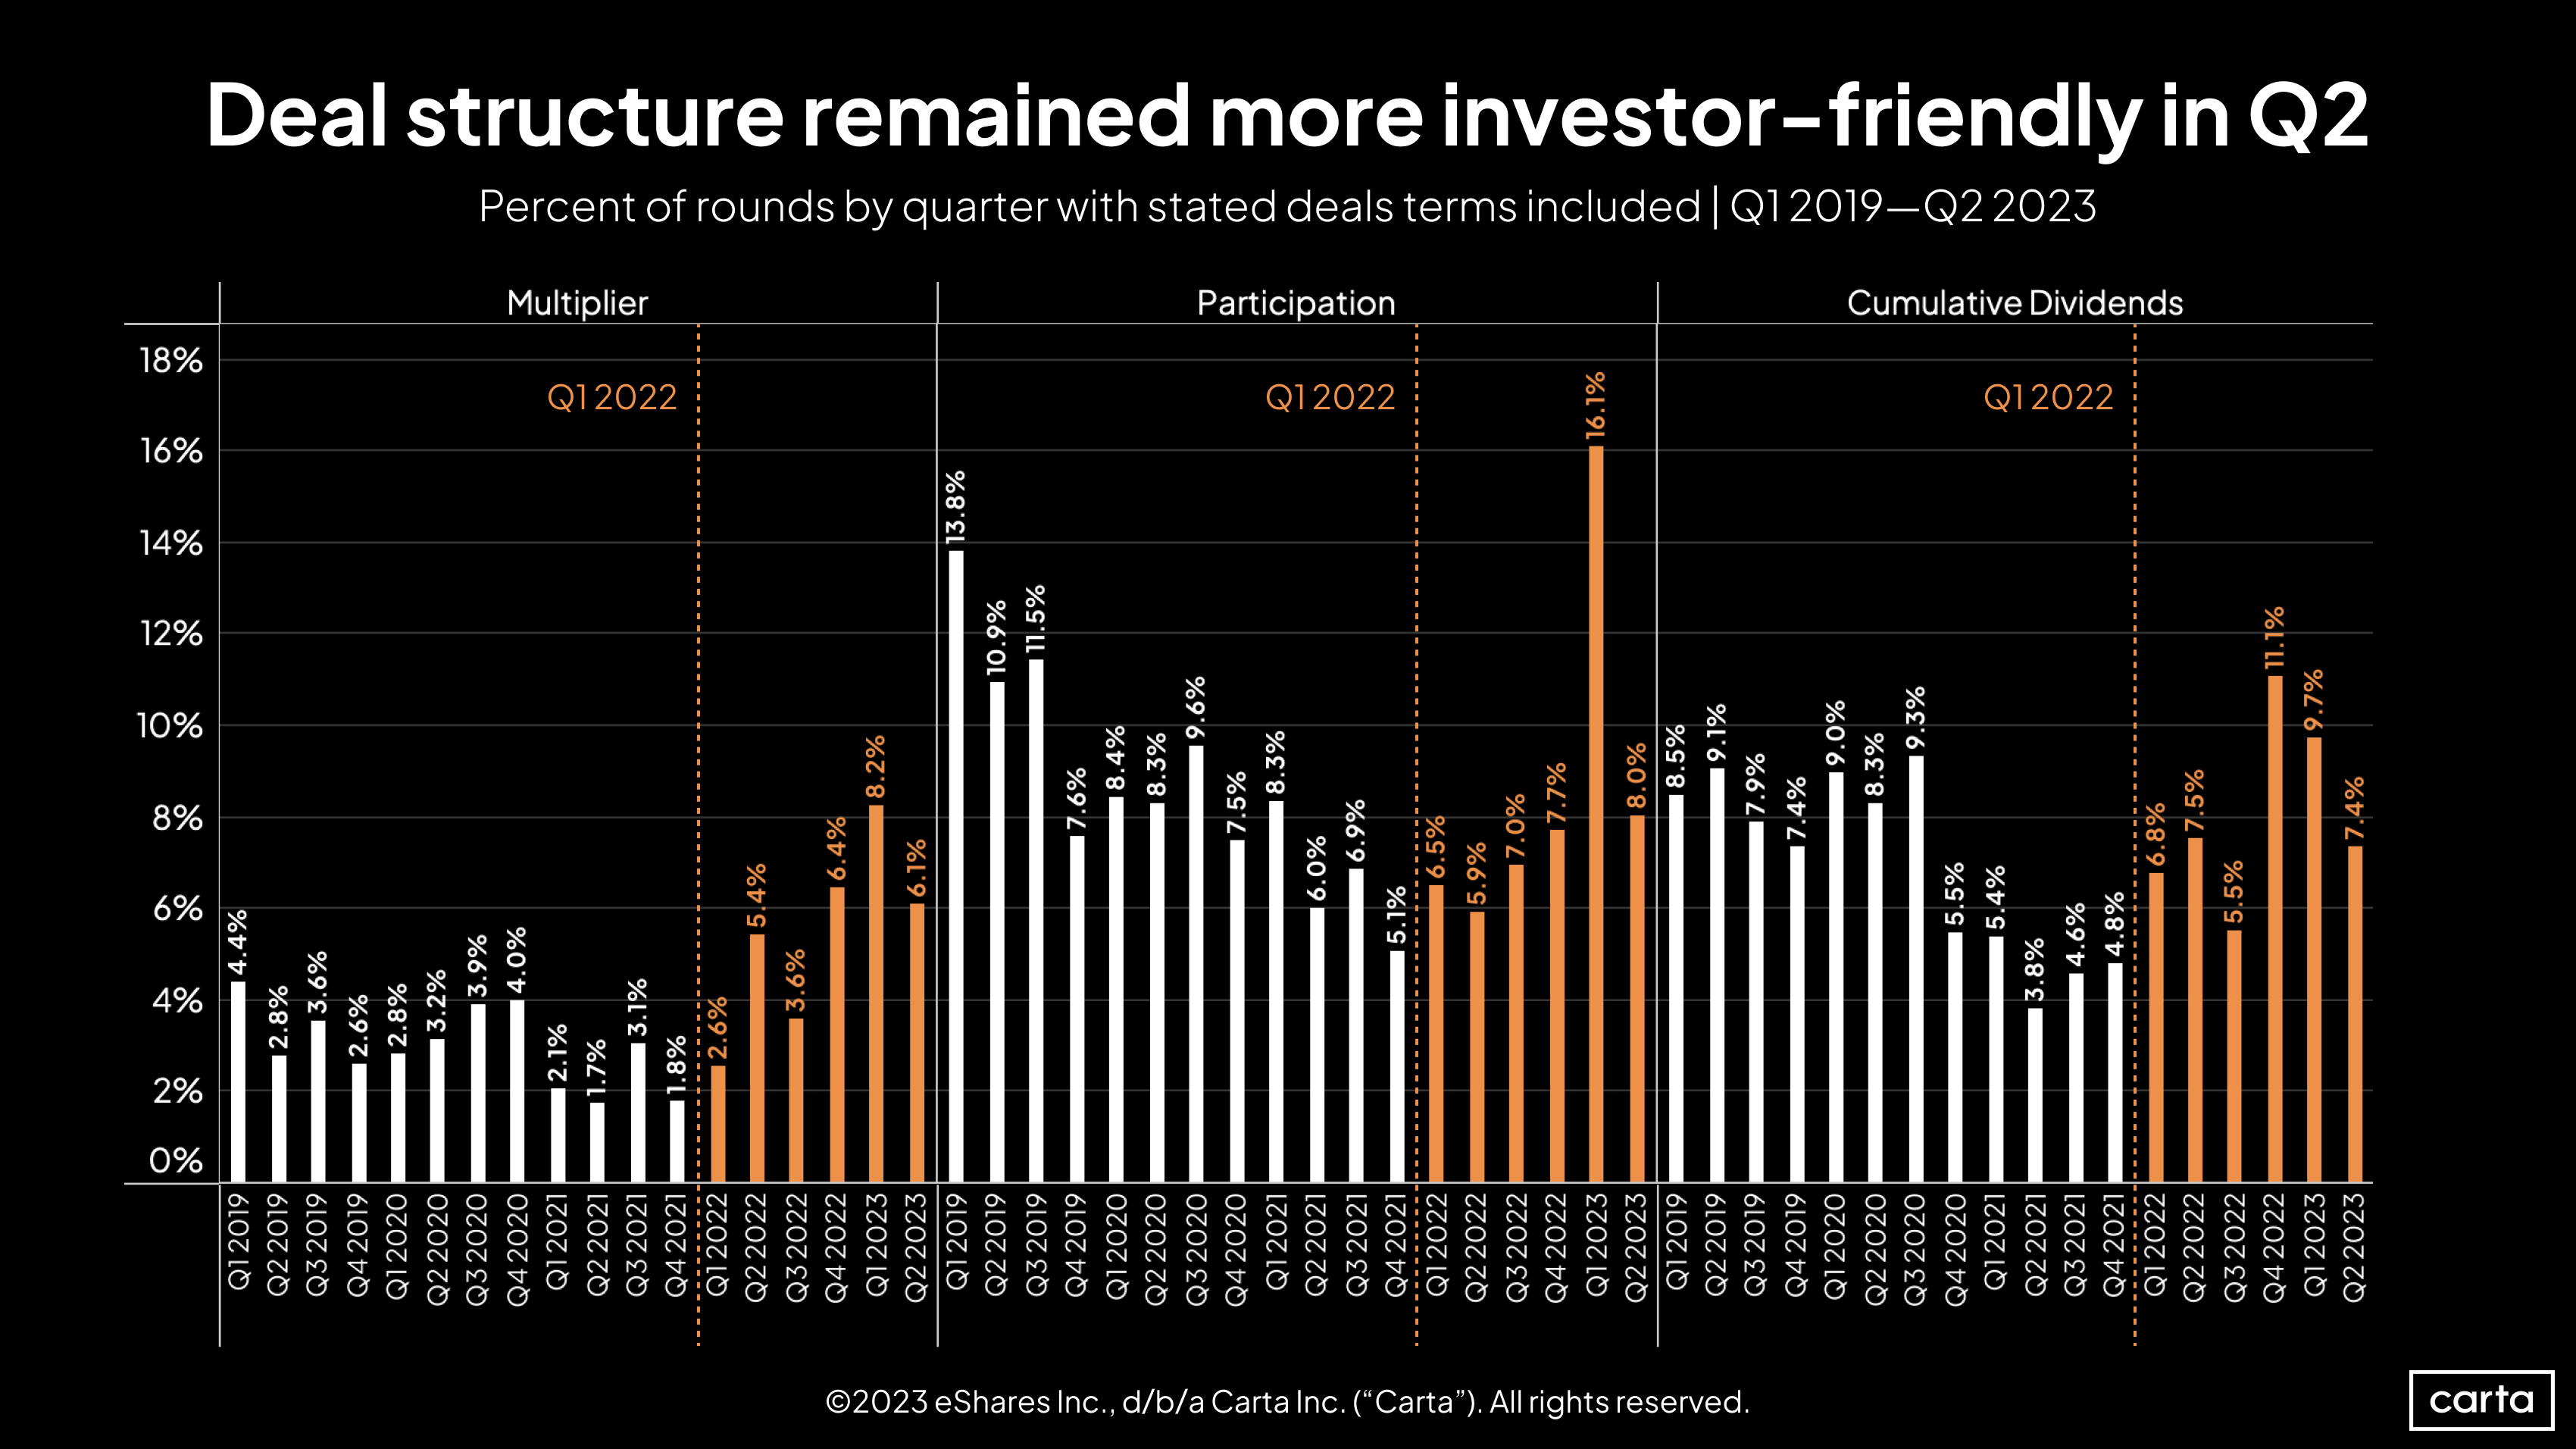
When the venture market tightens up and funding is harder to find, investments tend to include more investor-friendly terms, such as liquidation multipliers and participating preferred shares. The frequency of these structured deals ticked down in Q2, another sign that the market may be coming back up after reaching a bottom.
The rate of deals on Carta with multipliers fell from 8.2% in Q1 to 6.1% in Q2—still relatively high by recent standards, but the lowest mark of the past three quarters. Meanwhile, the percentages of deals involving participation and cumulative dividends both fell back roughly in line with recent norms.
Fundraising & valuations
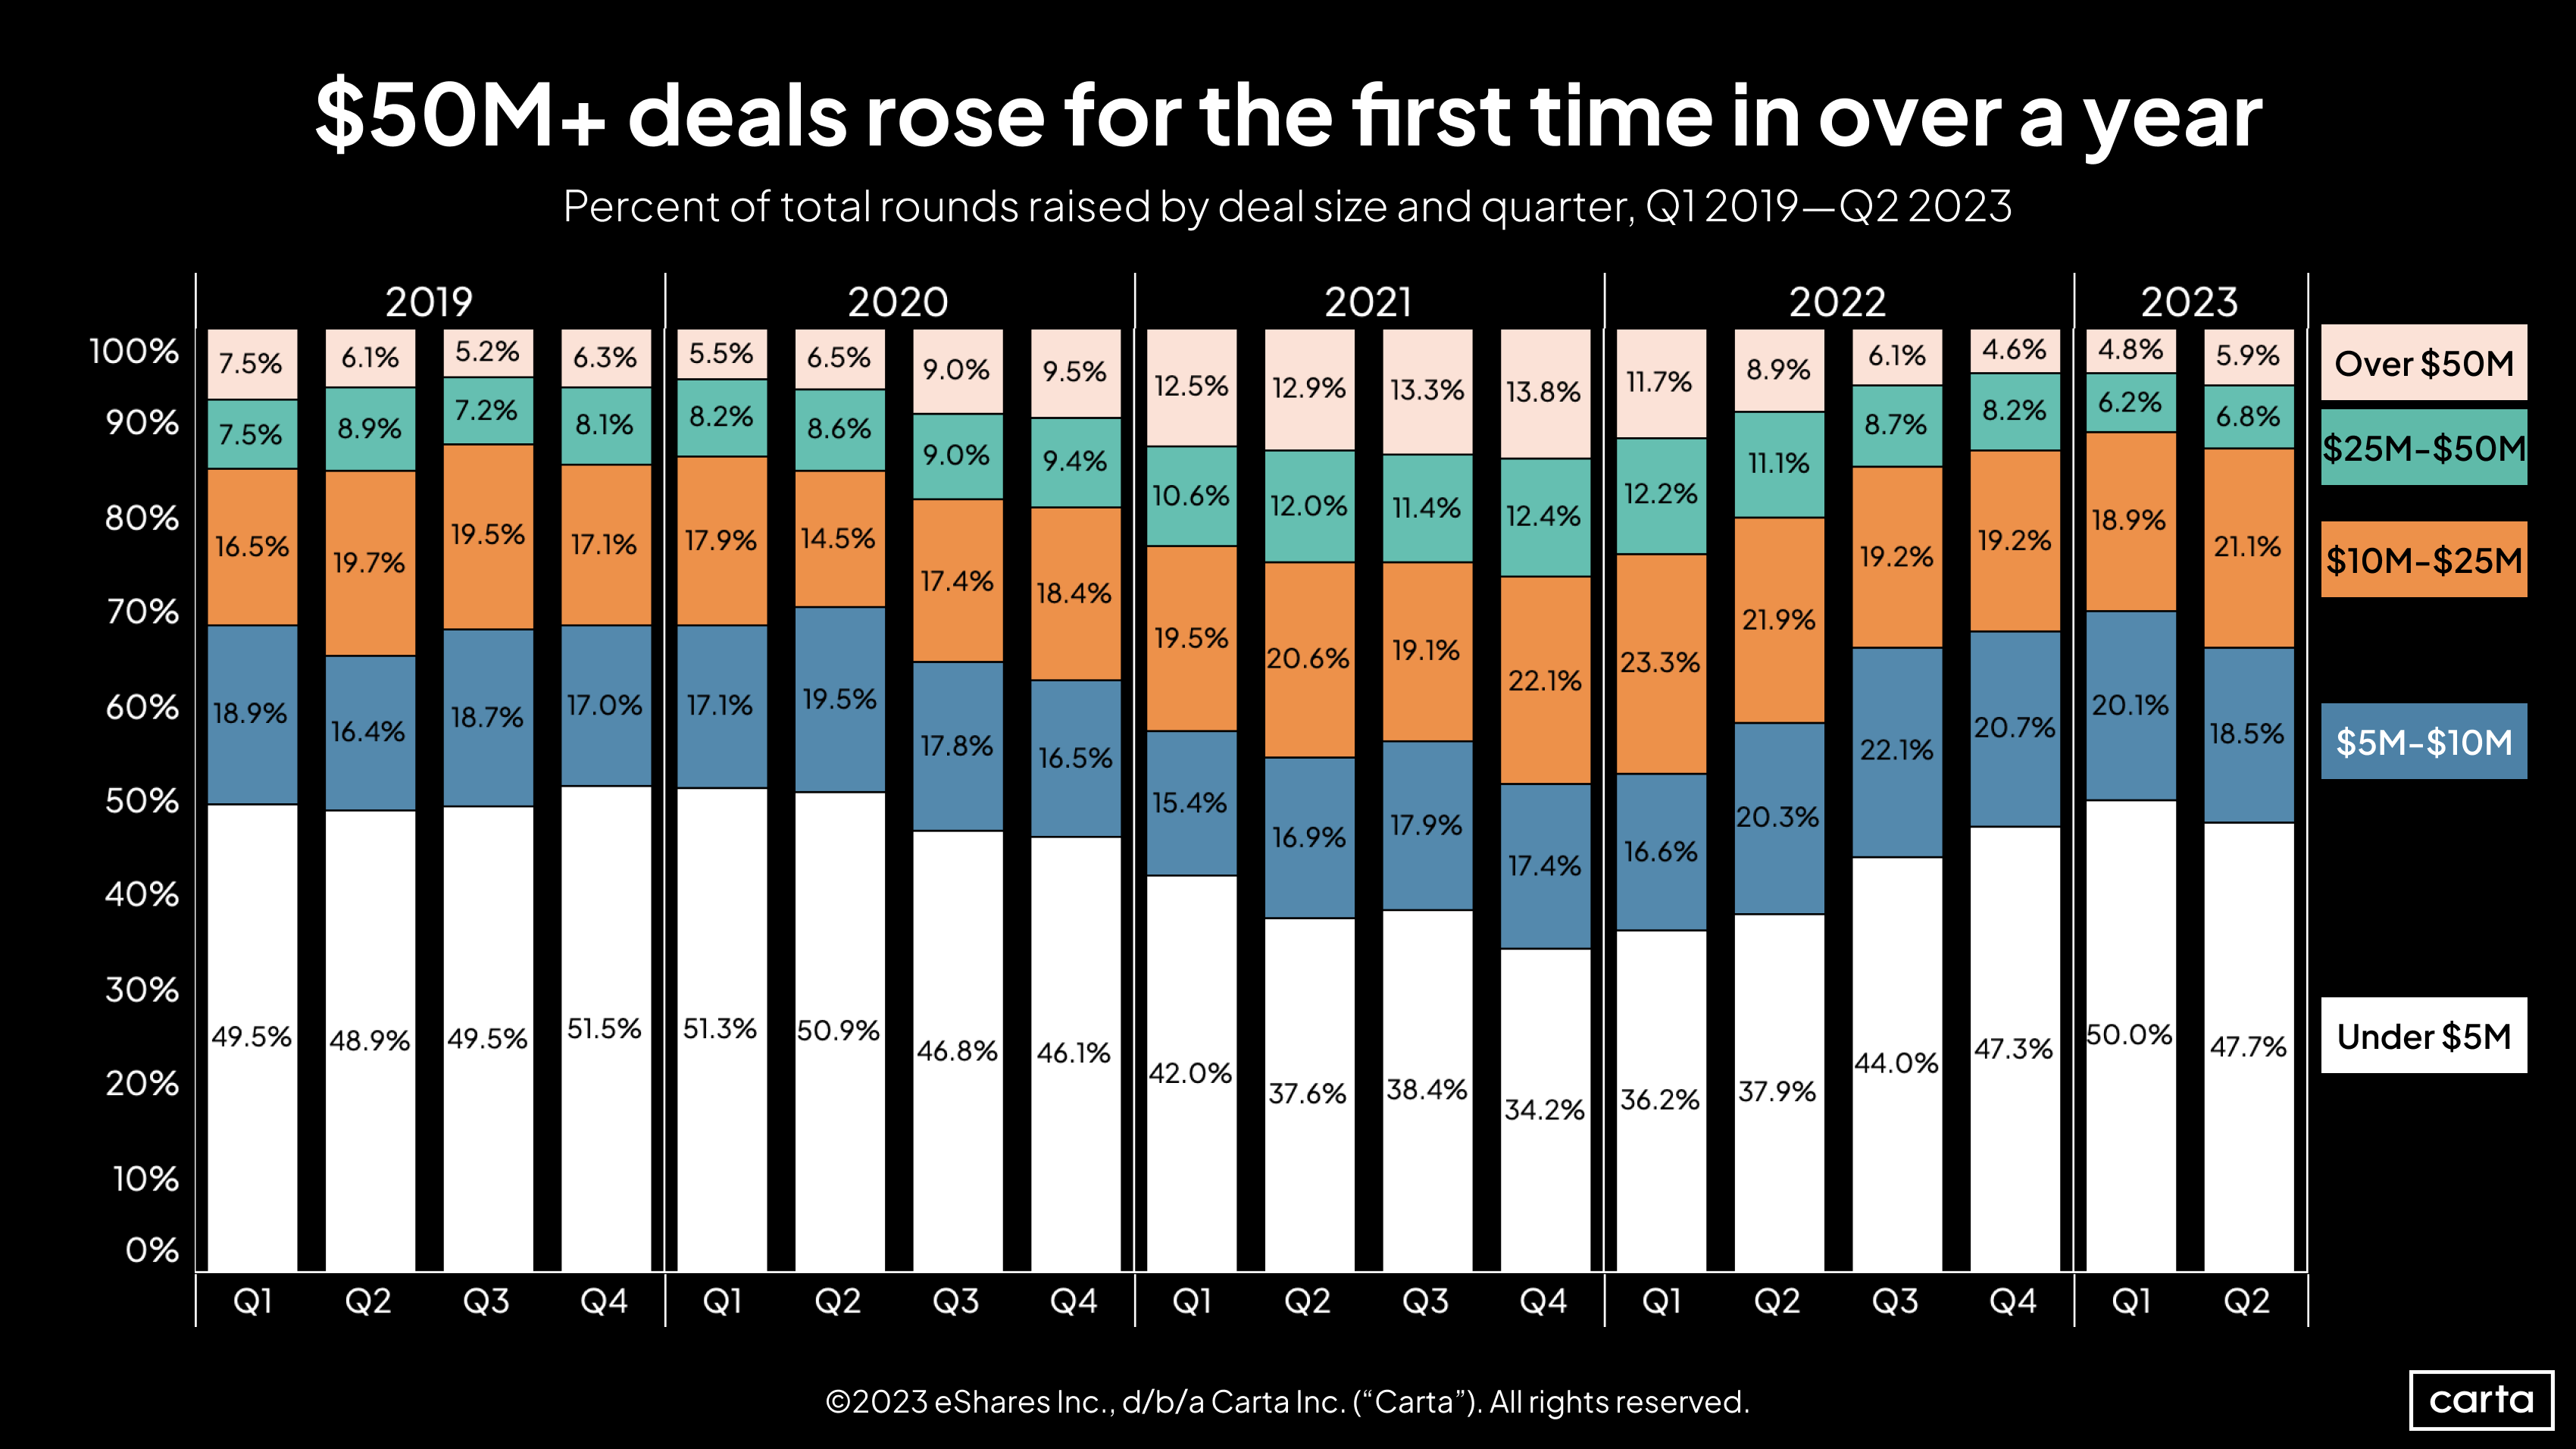
Mega-deals grew more frequent in Q2, with the rate of venture investments that are larger than $50 million rising to 5.9%, up from 4.8% in Q1. Like in many other areas, however, that quarter-over-quarter increase does not offset the full scope of recent declines. Deals over $50 million were more than twice as rare in Q2 as they were in any quarter in 2021.
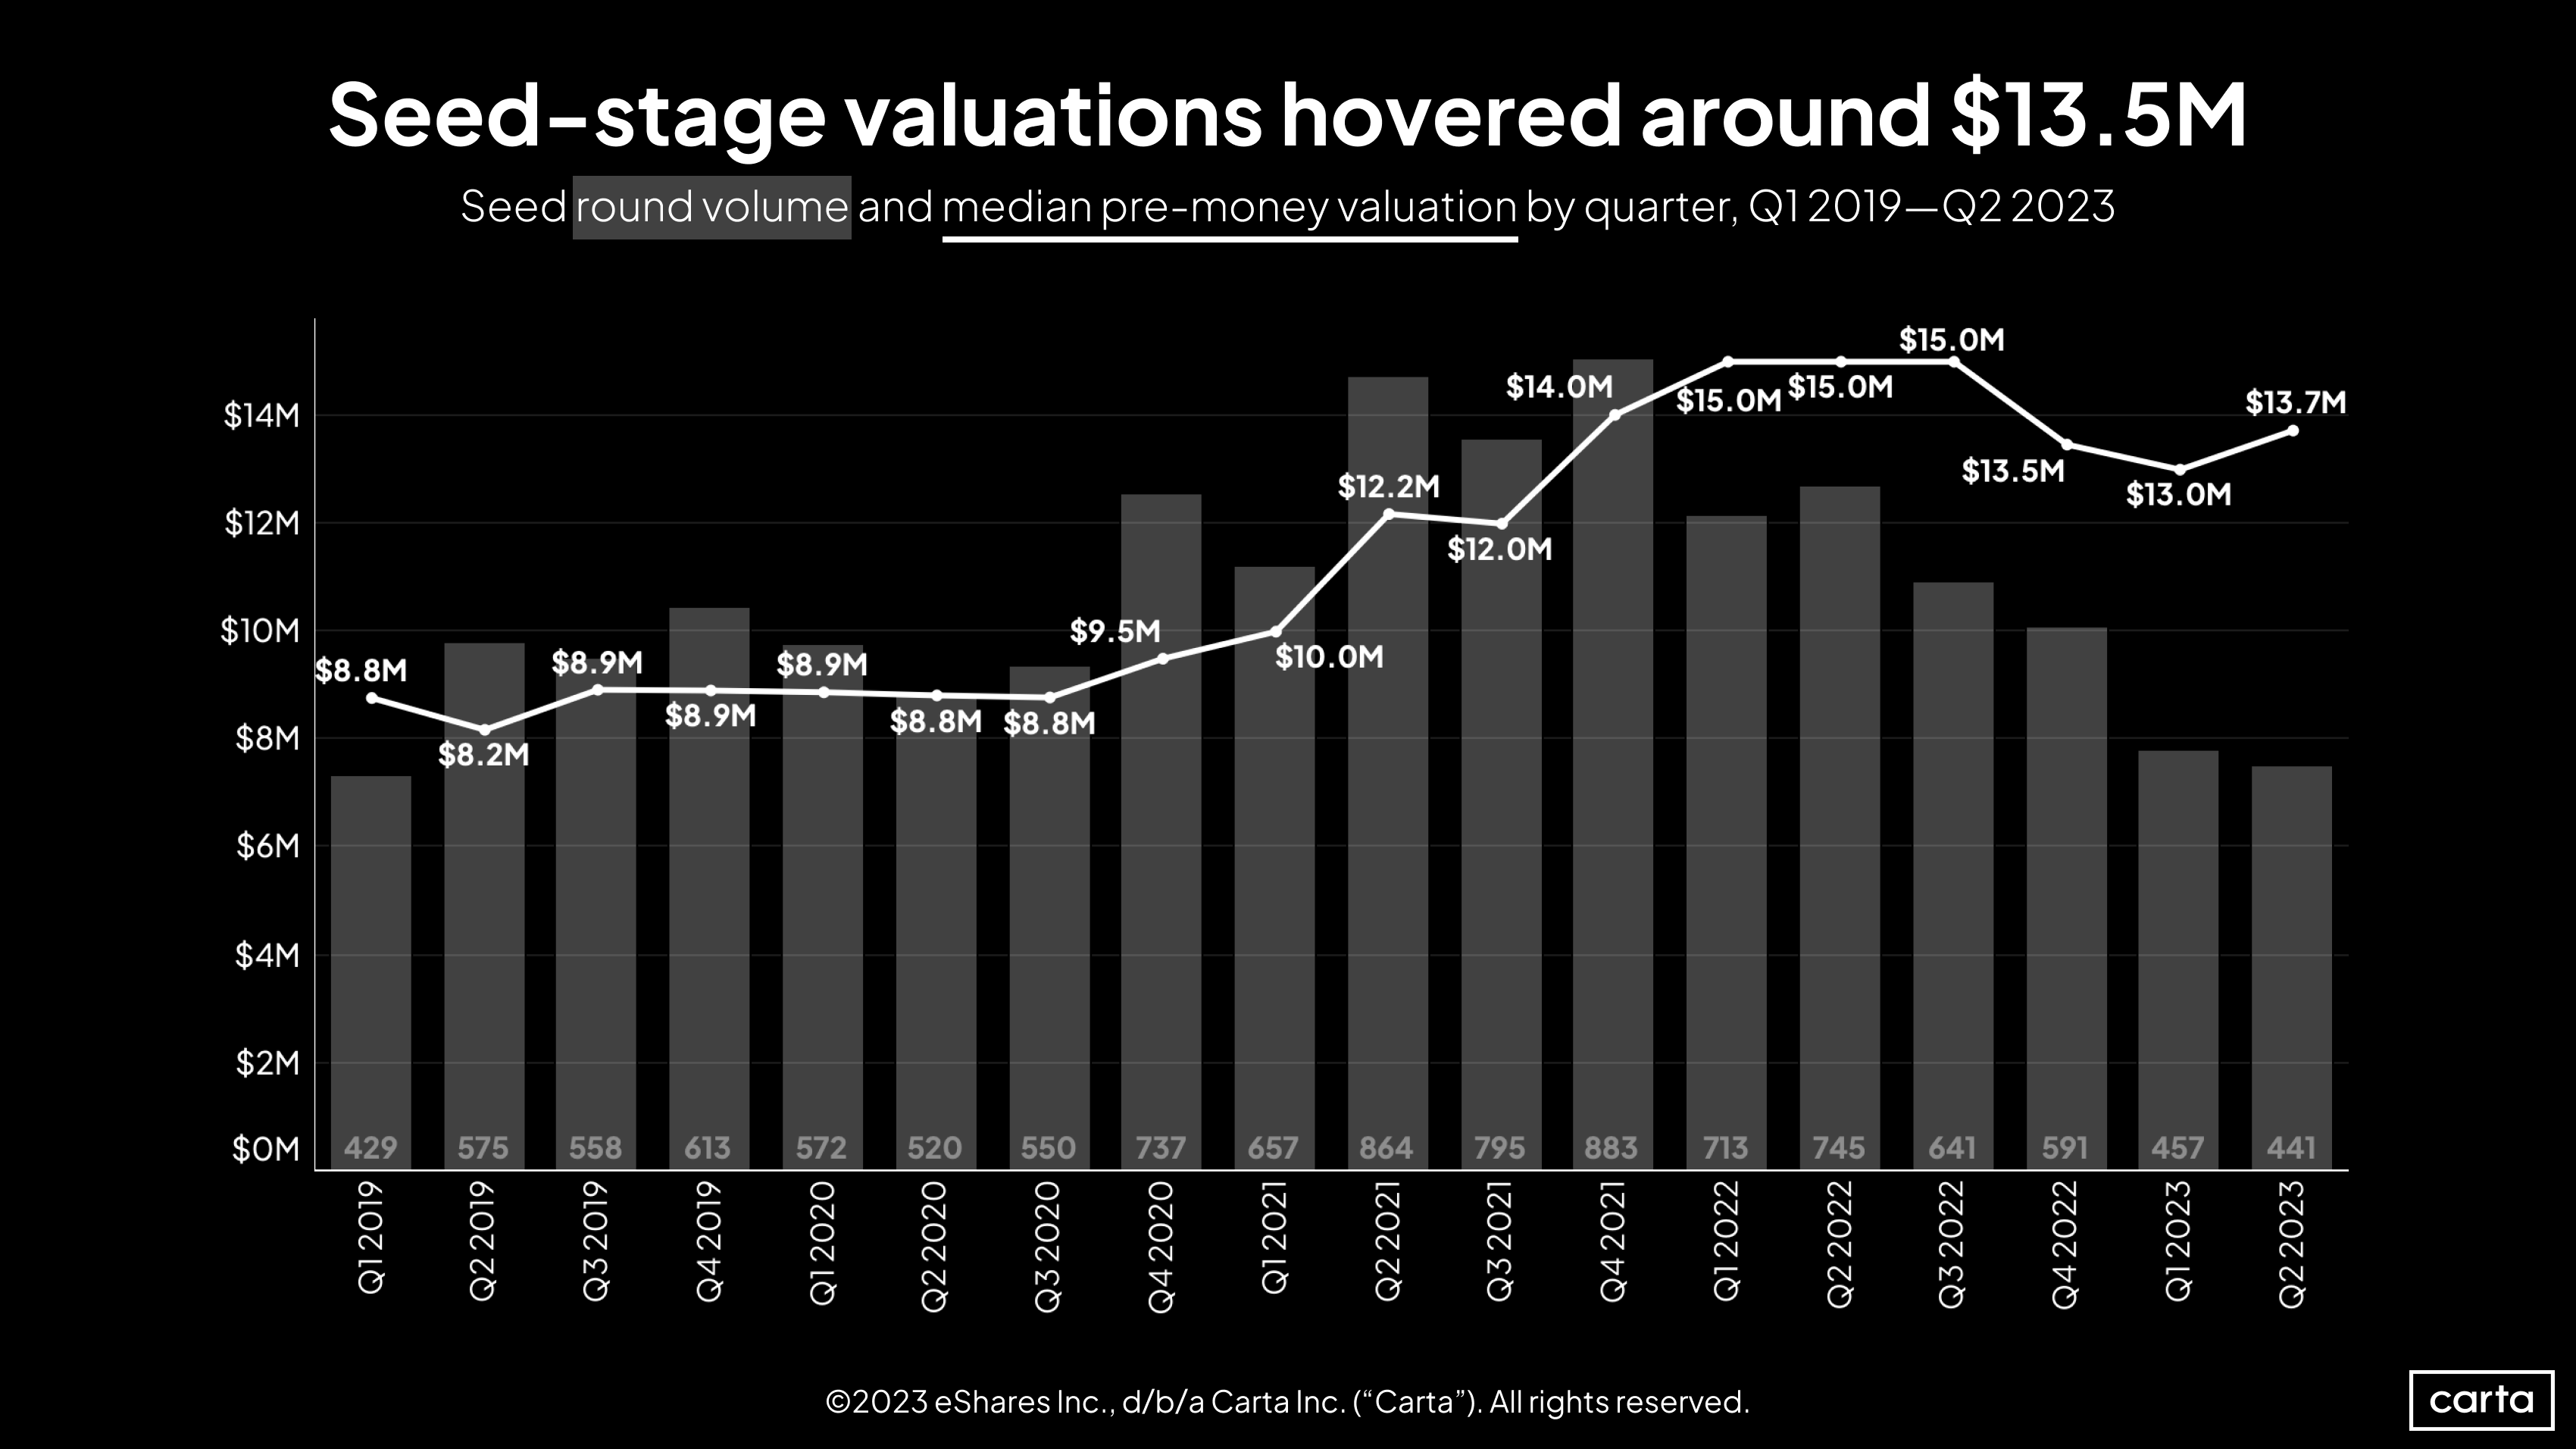
The median seed valuation reached $13.7 million in Q2, an increase from Q1 of about 5%. While that’s lower than the recent peak of $15 million that maintained through the first nine months of 2021, it’s still significantly higher than any quarter prior to 2021. On a longer timeline, the median seed valuation is still clearly trending up.
Conversely, the quantity of seed investments is clearly trending down: Deal count has dropped for four straight quarters.
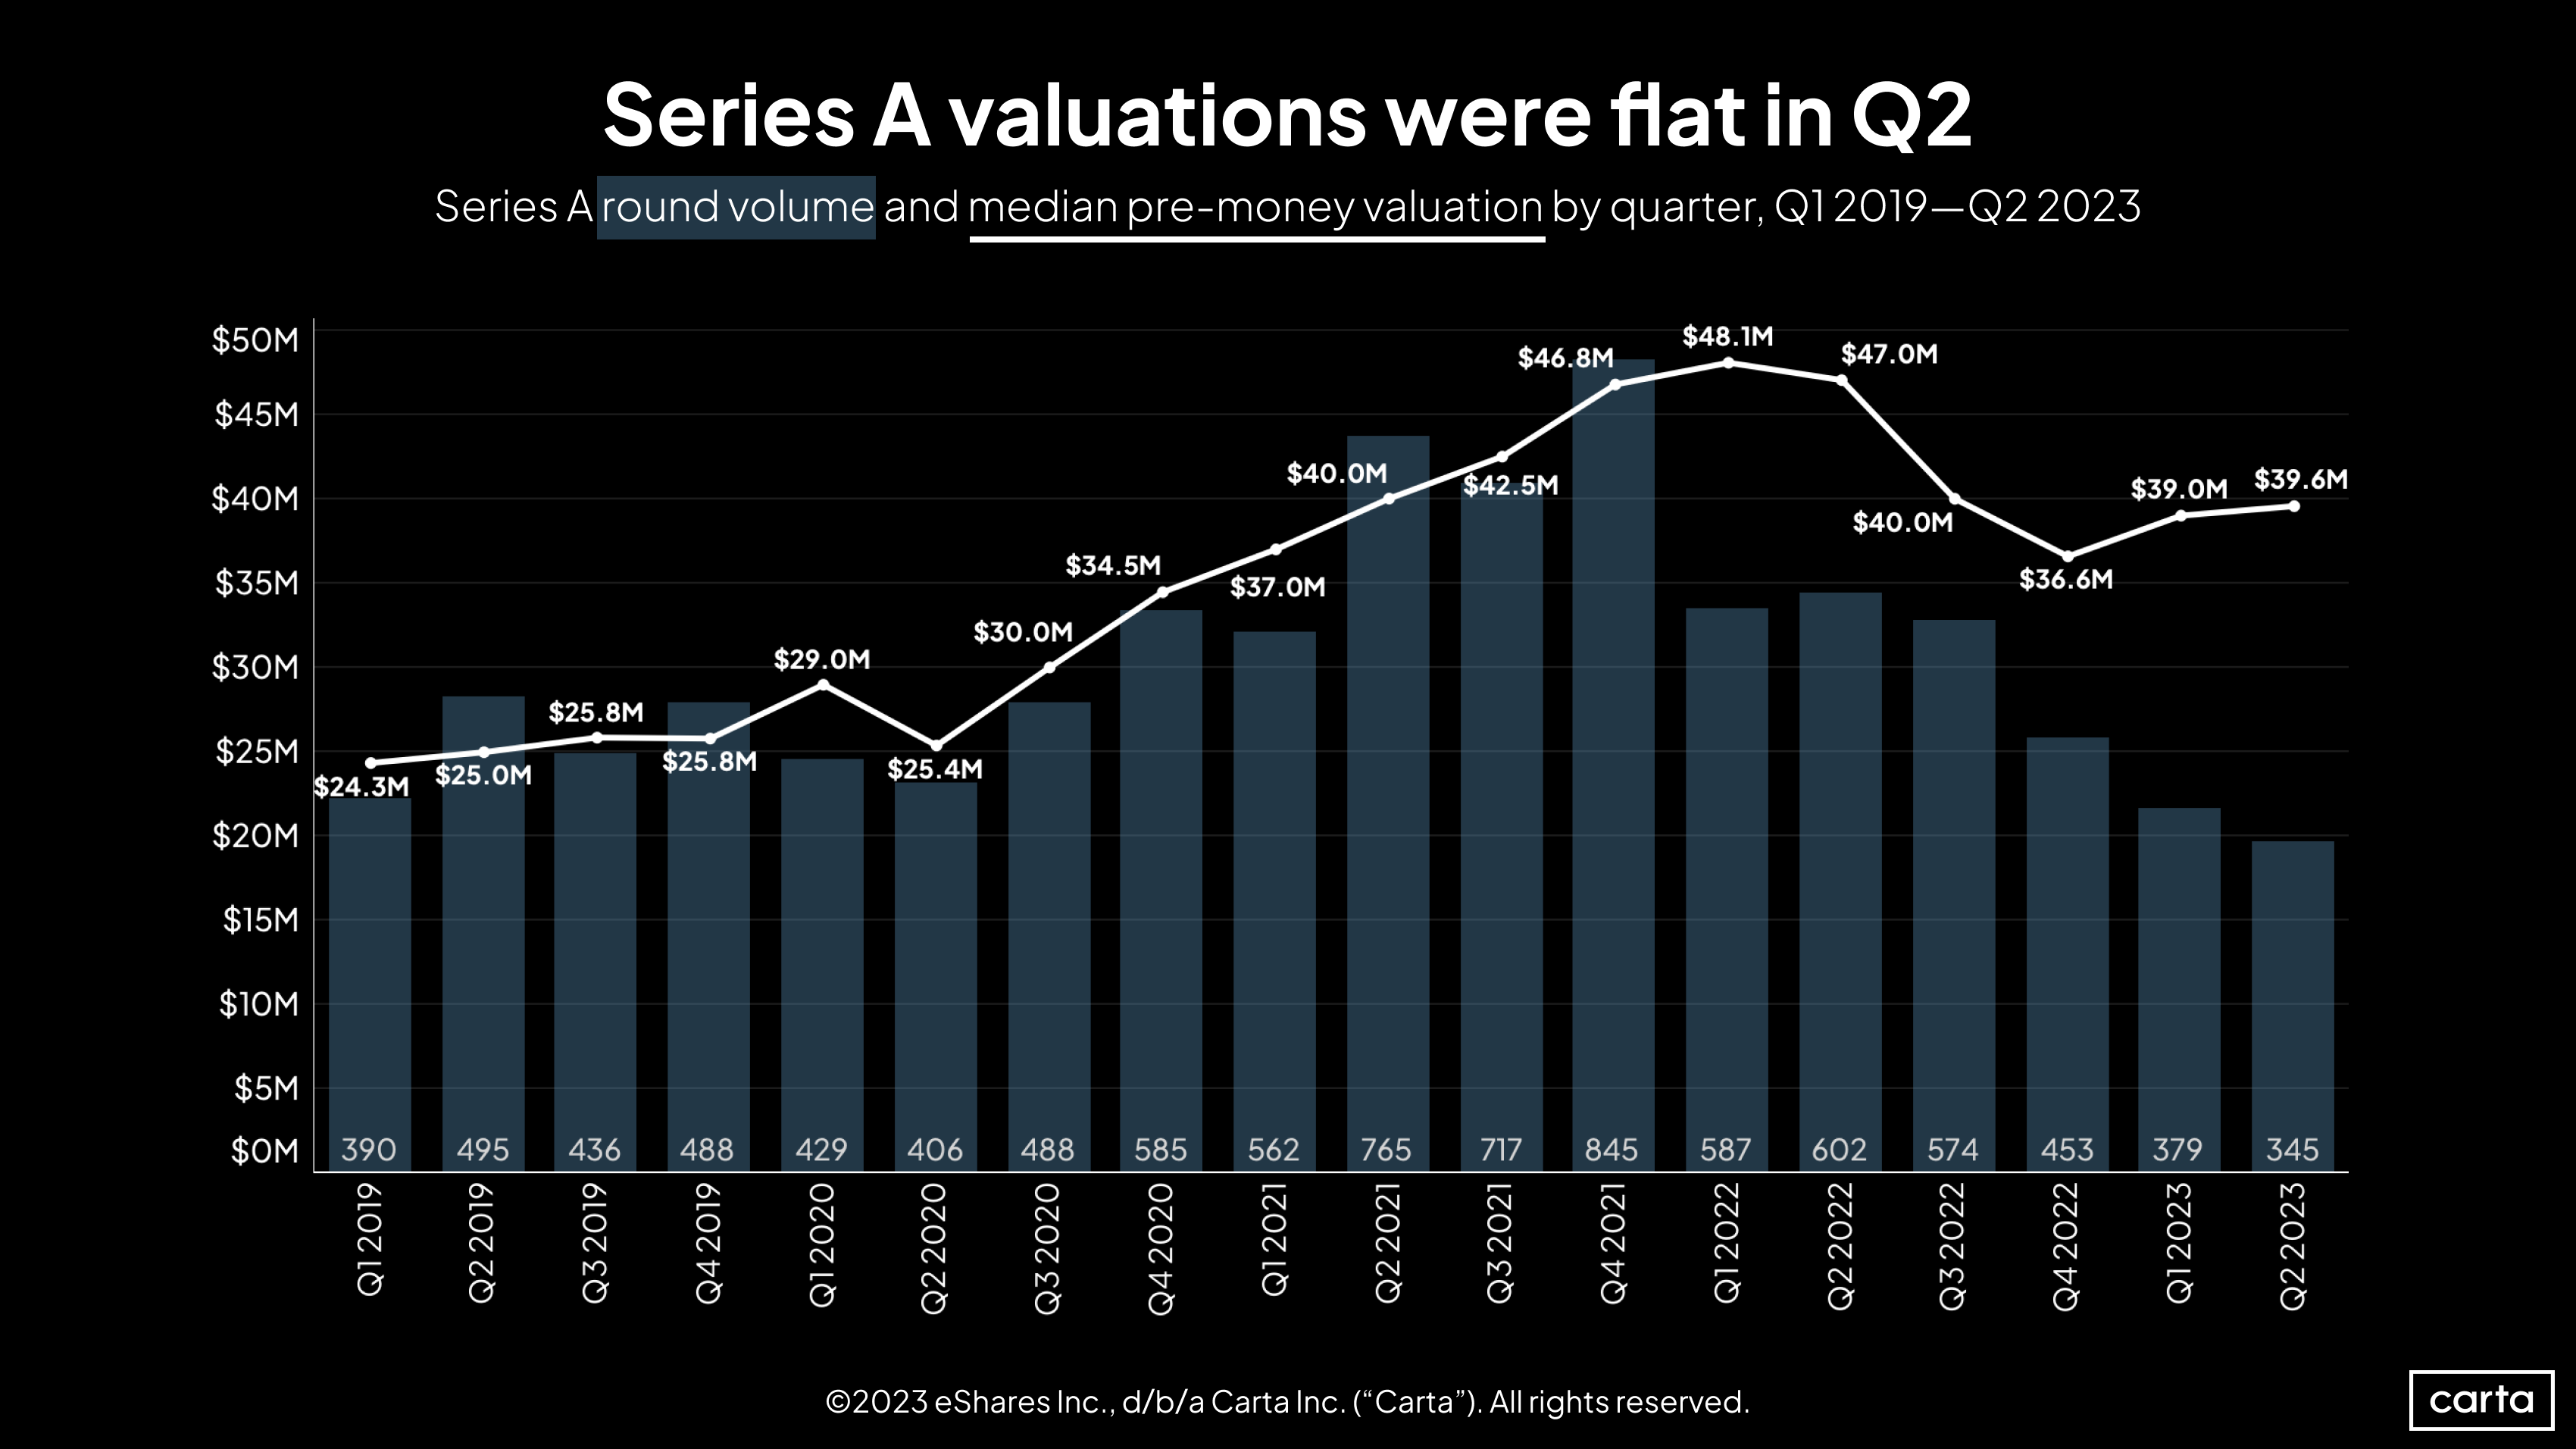
The same is true at Series A: While Q2’s median valuation of $39.6 million is well below its recent high, it’s still well above the median from any year prior to 2021.
After a 2% uptick in Q2, the median Series A valuation has now climbed for two straight quarters. Deal count, though, is moving in the opposite direction, with three straight quarterly declines. This combination of fewer deals and higher valuations could suggest that only the upper echelon of startups are succeeding in raising Series A rounds, thus leading to higher valuations.
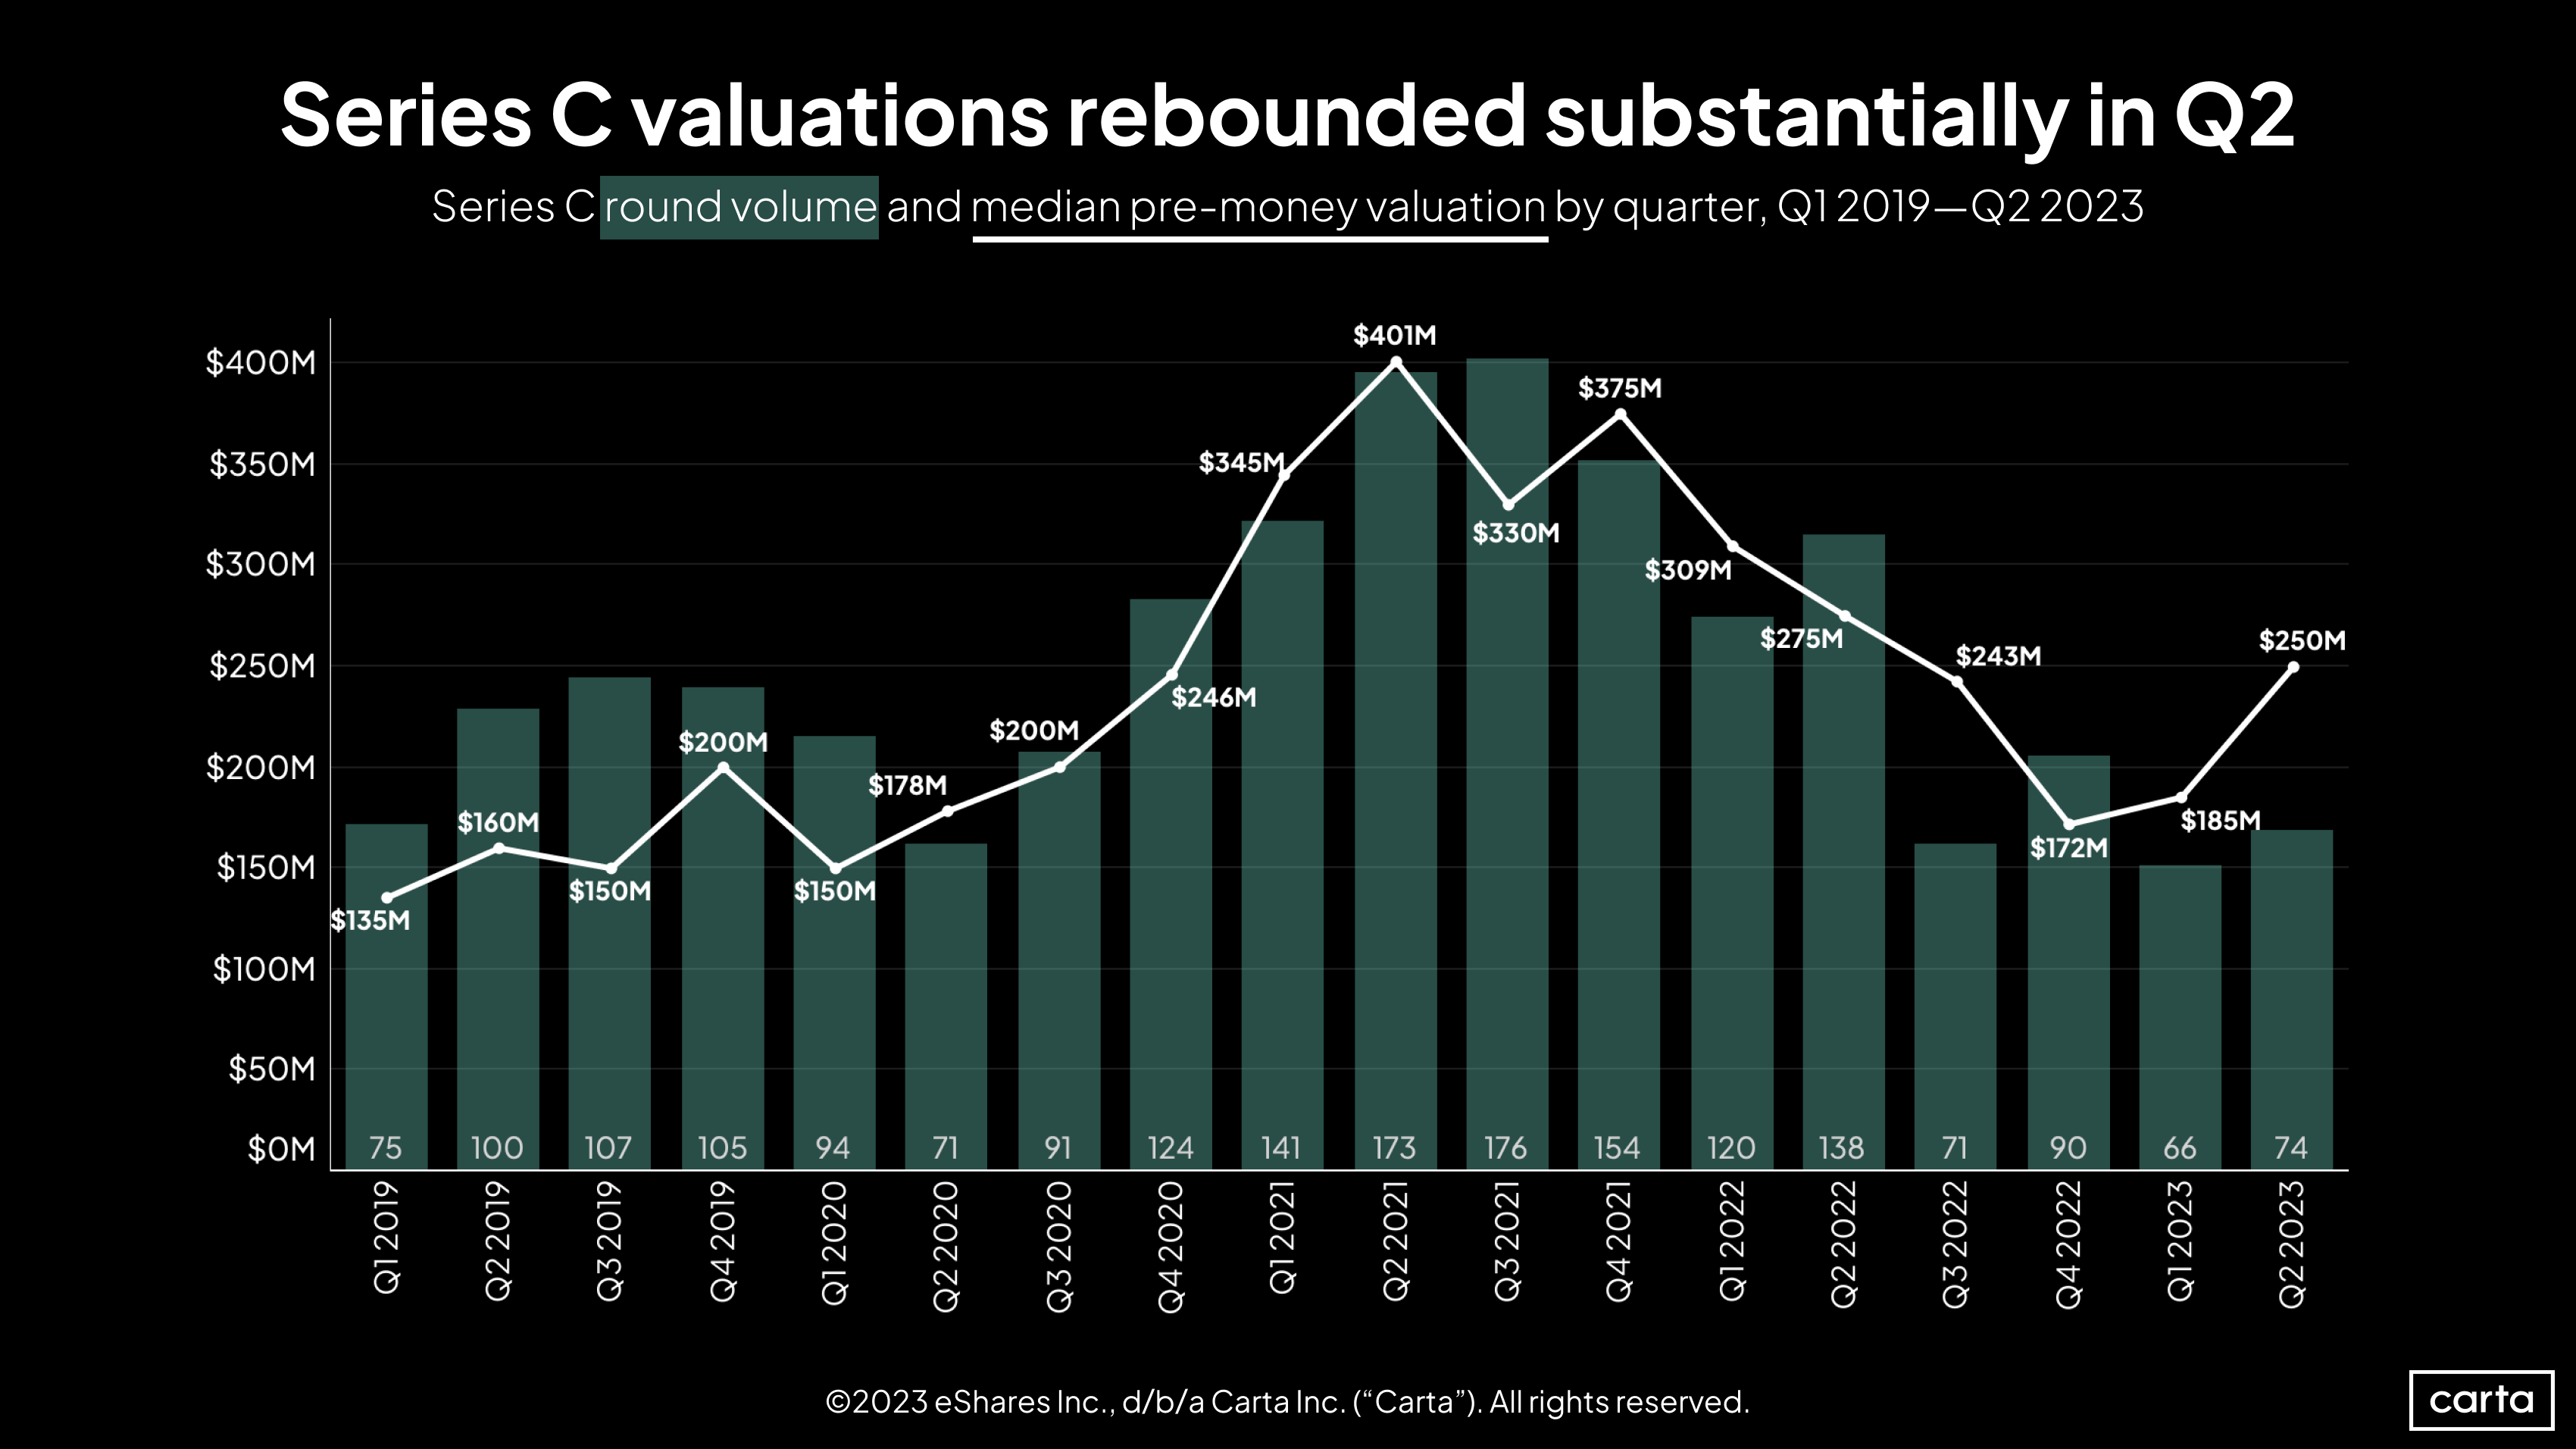
The median Series C valuation leaped by 35% in Q2, rising to its highest point in the past four quarters. The number of Series C investments also increased, climbing 12% quarter over quarter. Relative to recent years, however, deal count remains low. Q2 had the fourth-fewest Series C deals of any quarter since the start of 2019.
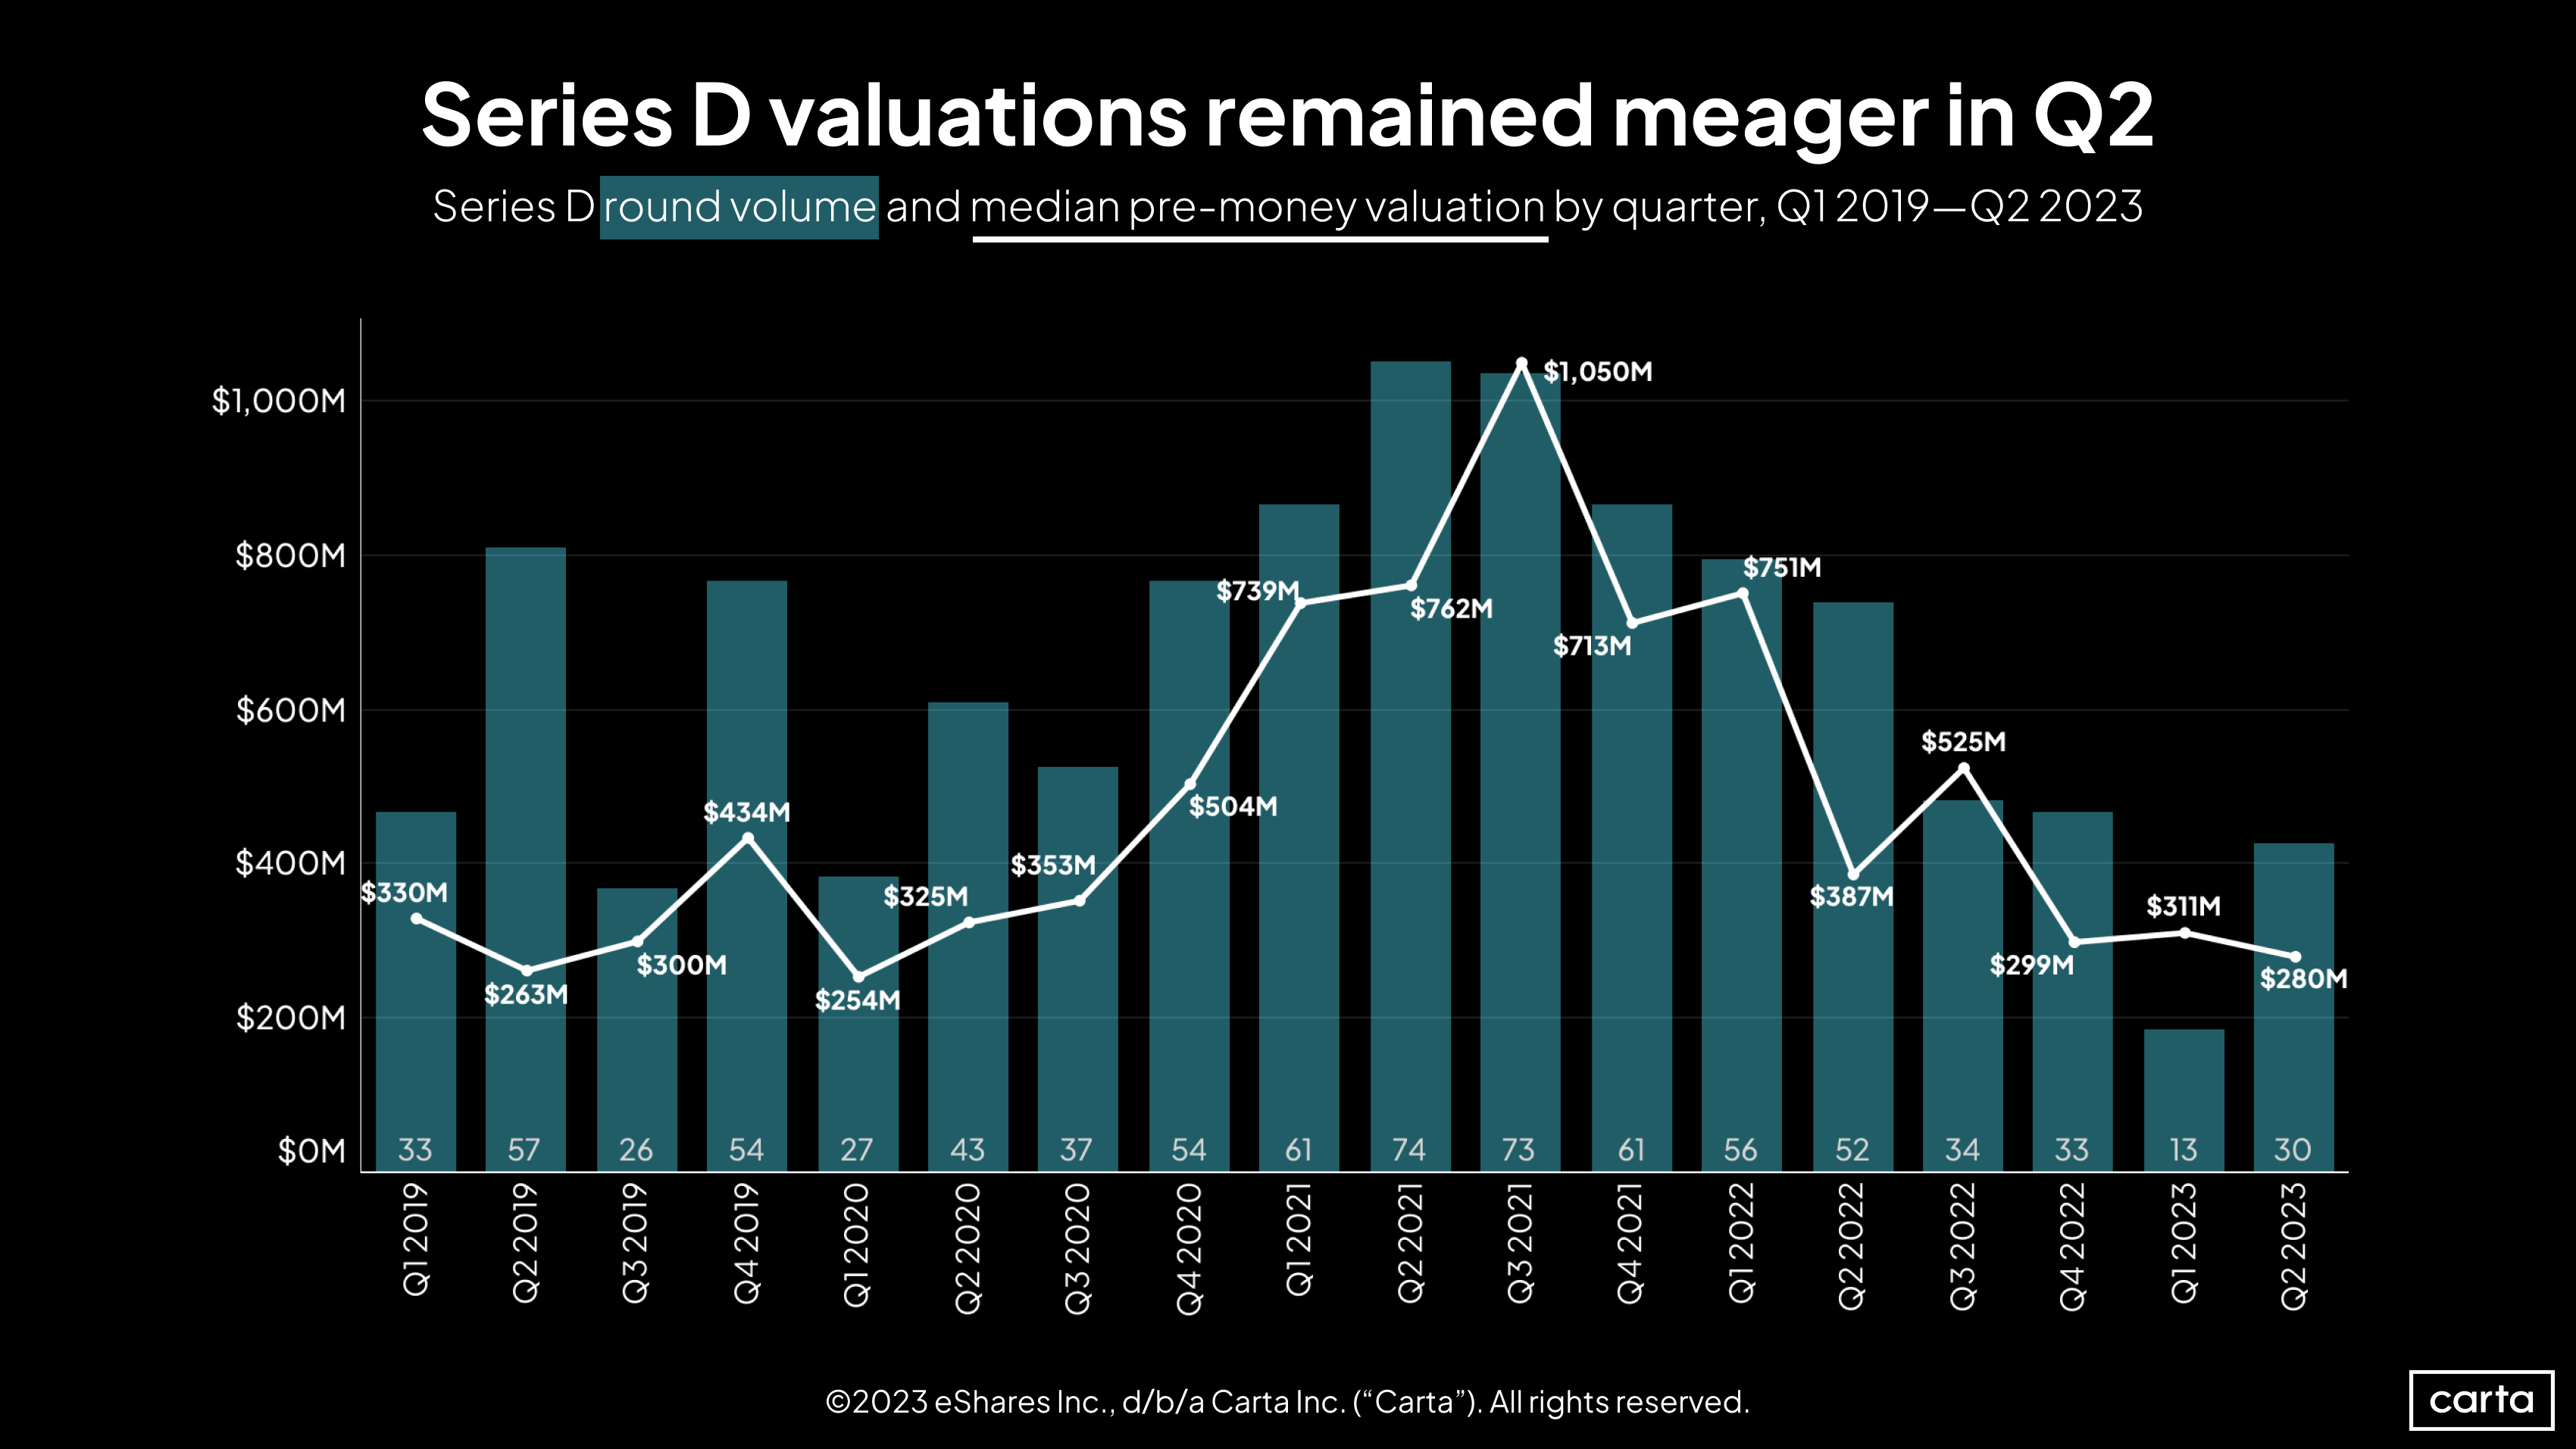
Series D deal count more than doubled between Q1 and Q2, a promising sign after activity declined significantly to start the year. Early returns indicate that Q1’s plunge in Series D deals might be a blip rather than a long-term trend.
Conversely, the median Series D valuation declined by 10% compared to Q1, falling back below $300 million for the second time in the past three quarters. The trend of declining Series D valuations continues, but it is decelerating. Year over year, the median Series D valuation is down 28%. Over the prior year, it had fallen by 49%.
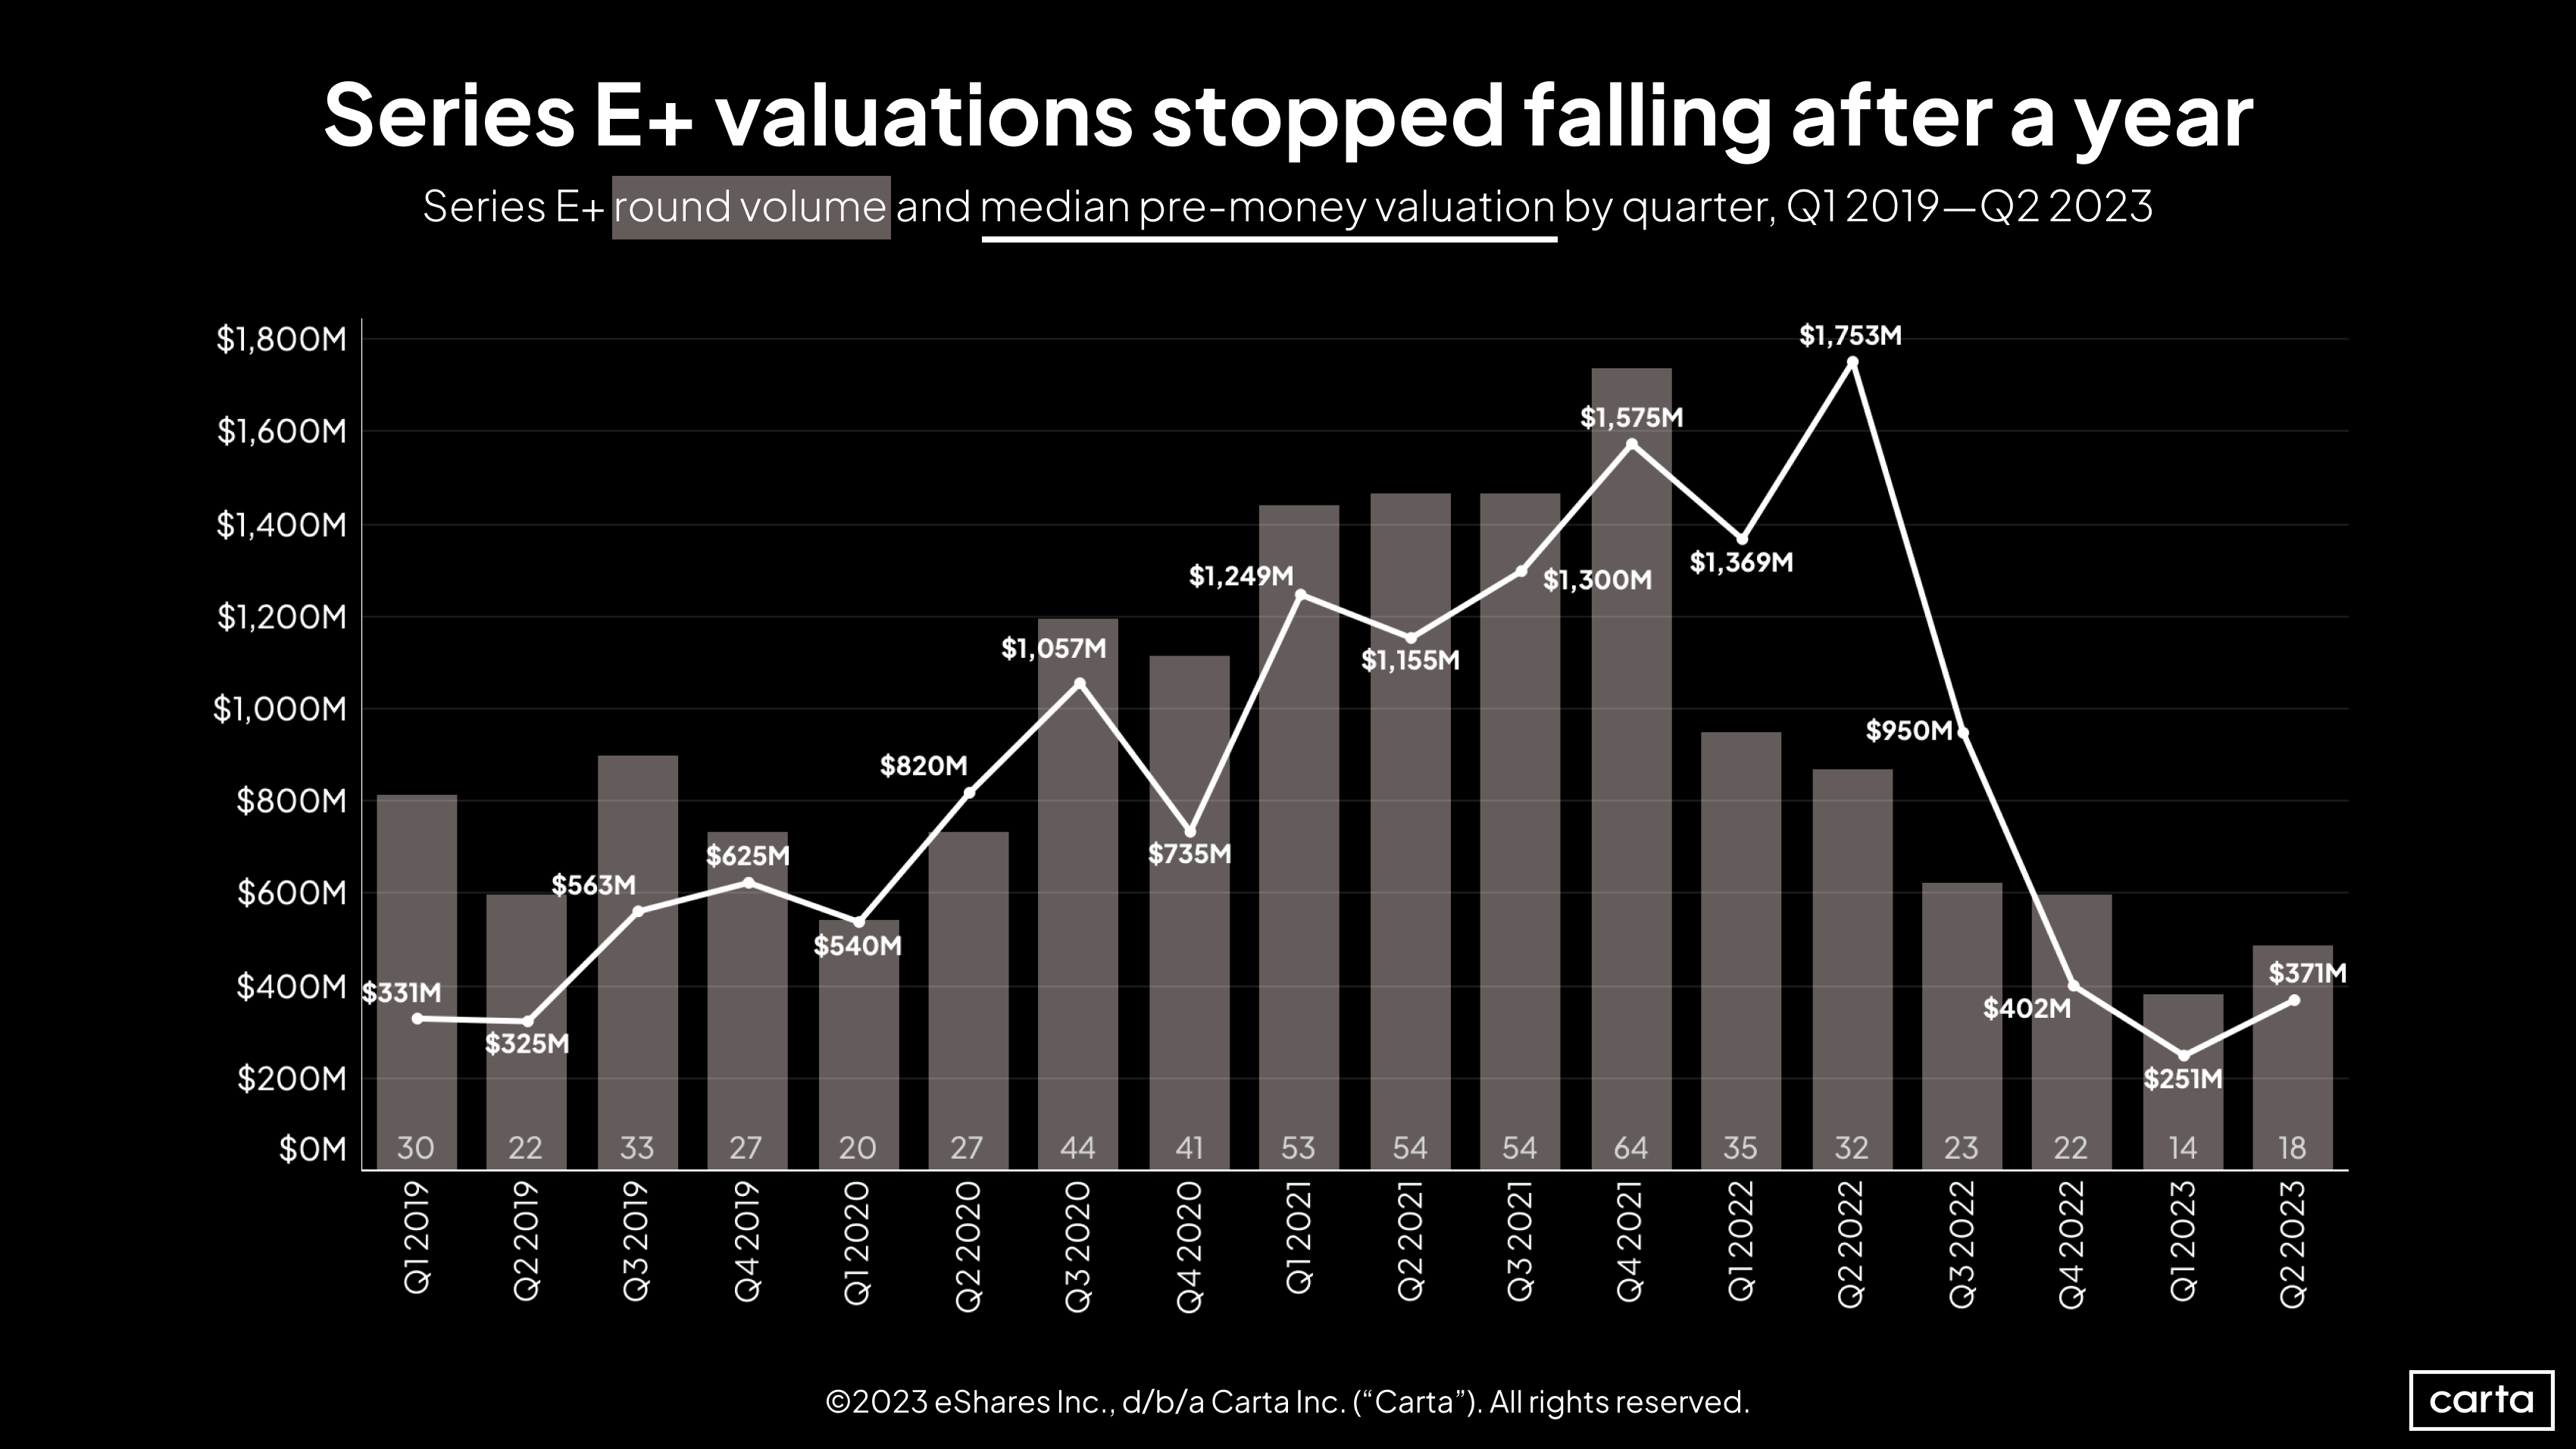
Deal count and median valuation both trended up at Series E+ in Q2, with quarterly increases of 29% and 48%, respectively. Within the context of the past several years, however, activity at these latest stages of the startup lifecycle remains infrequent, and valuations remain relatively low.
At both seed and Series A, median valuations trended up in Q2, while deal counts trended down. At later stages, these two statistics were more likely to move in tandem: At Series B, Series C, and Series E+, median valuations and deal counts both increased in Q2.
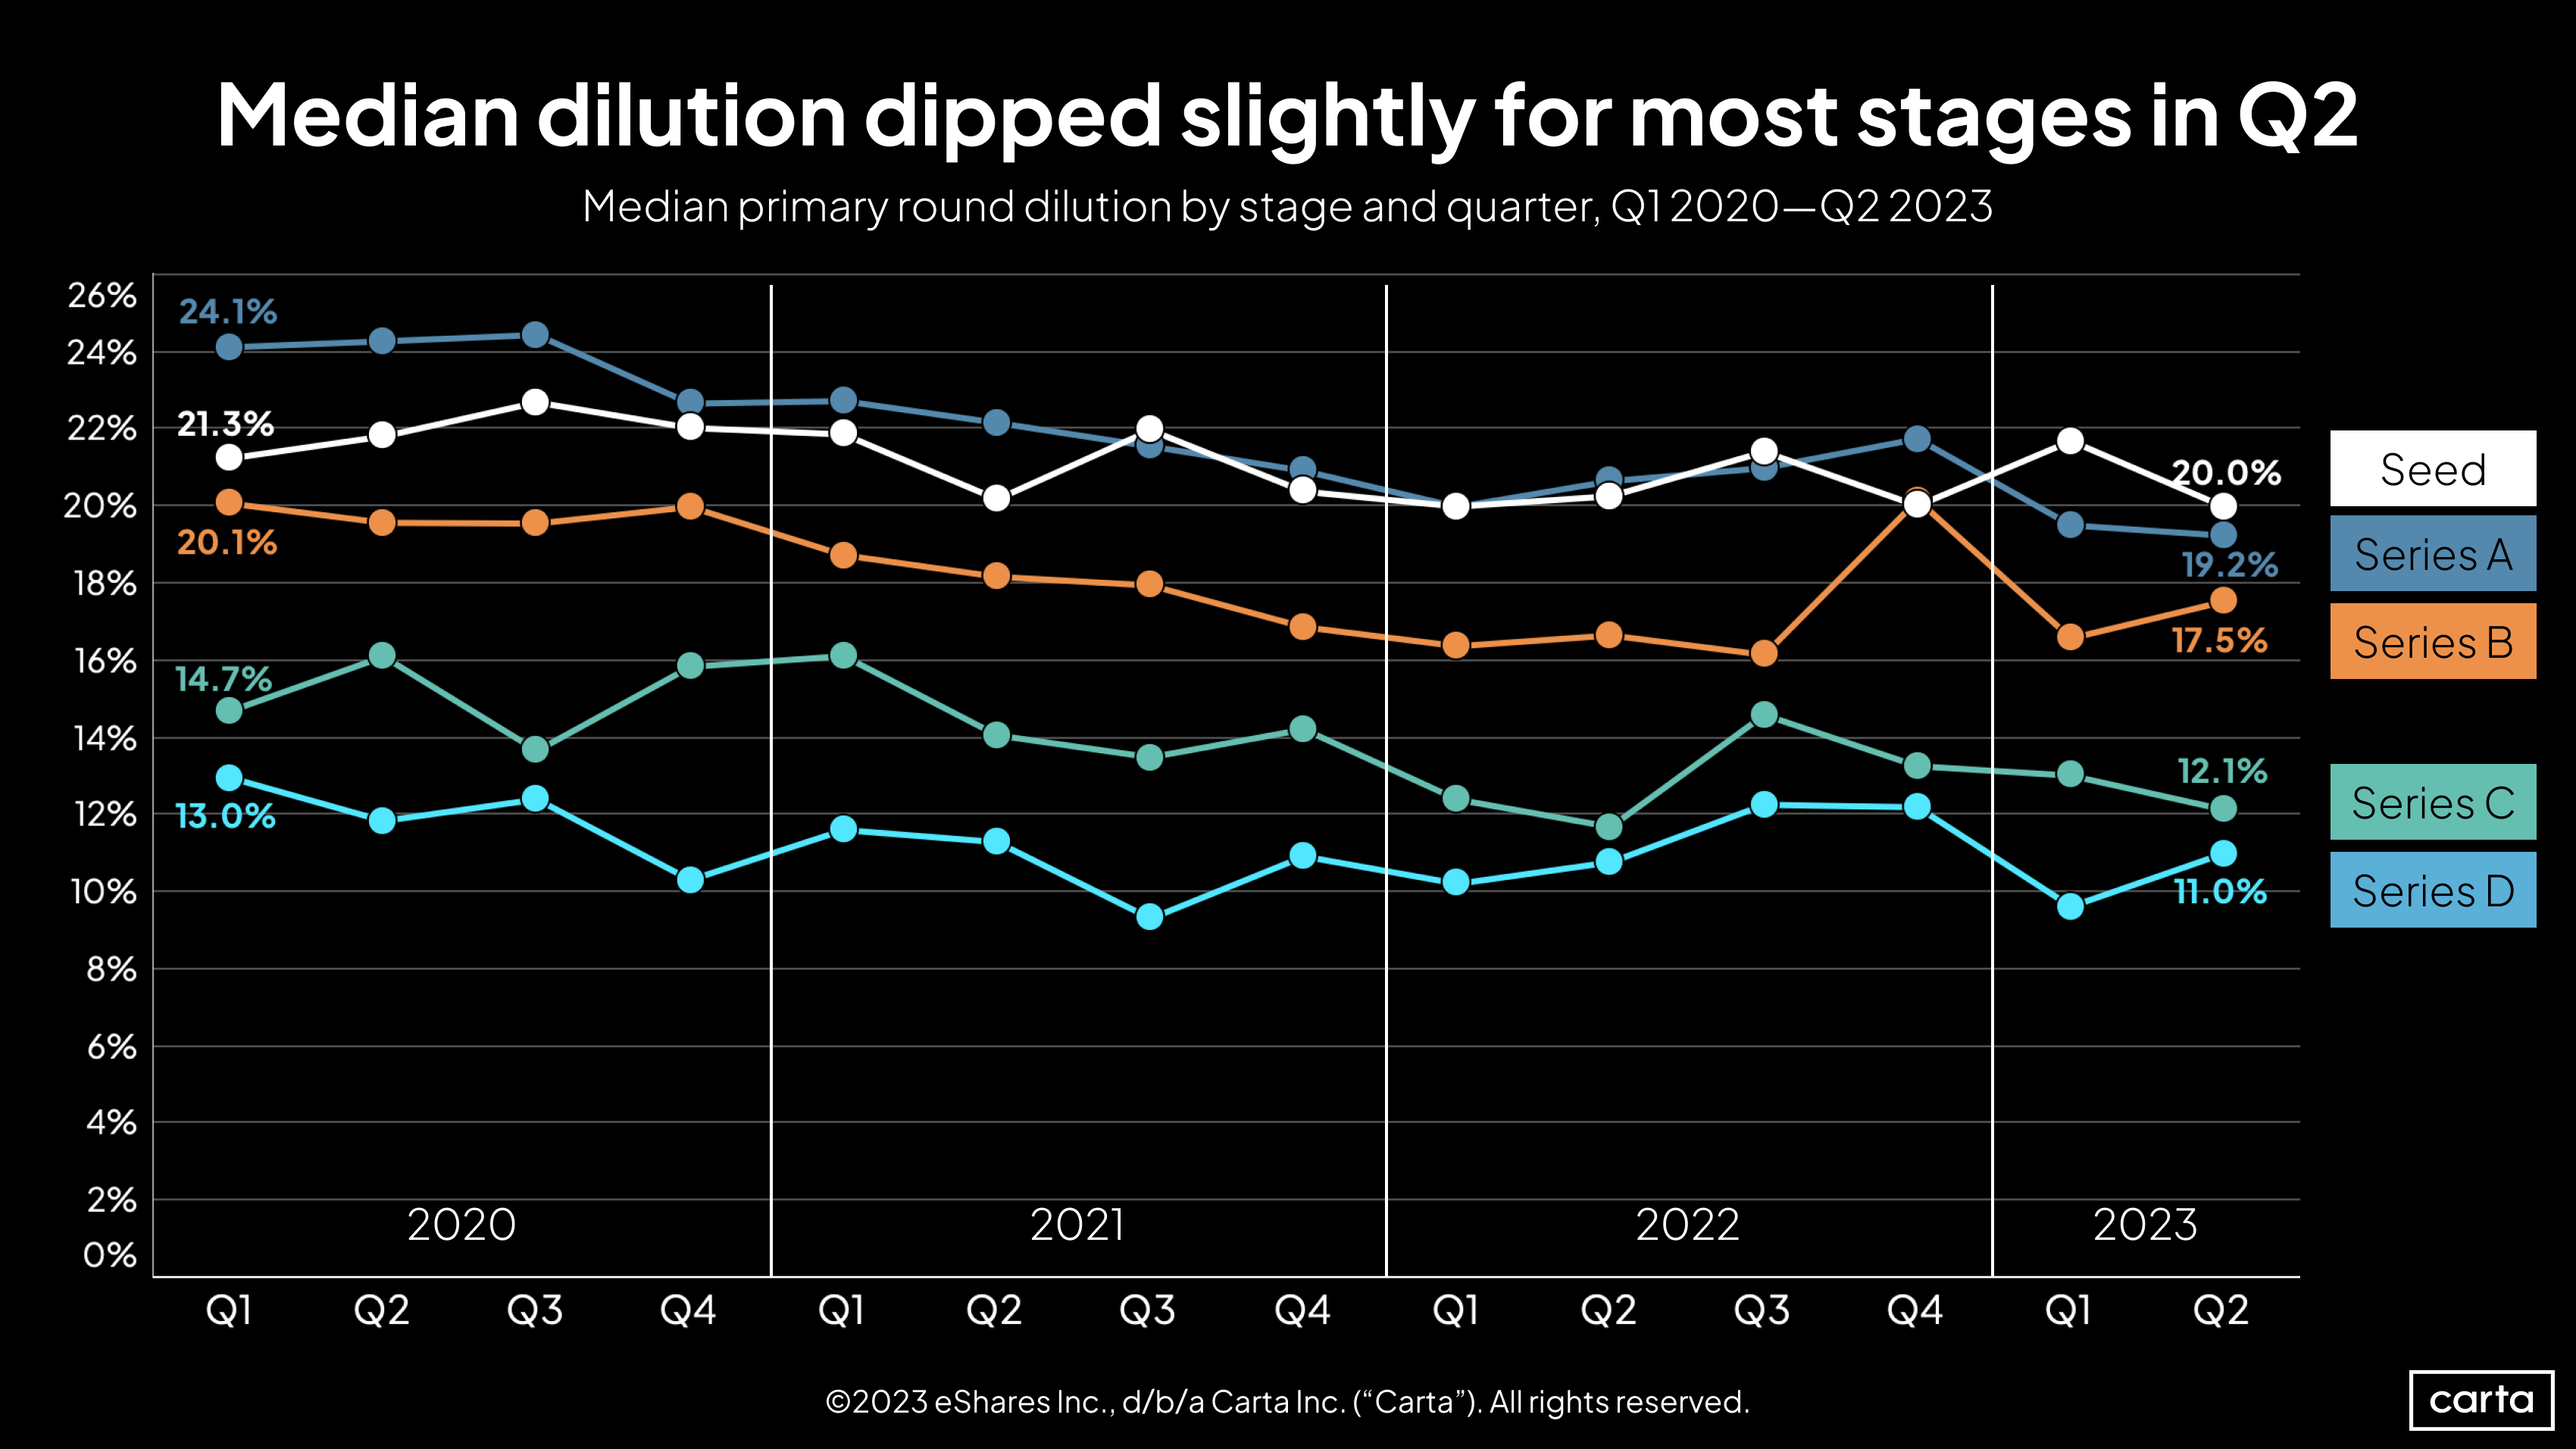
Median dilution in venture rounds—calculated as round size divided by pre-money valuation—ticked down at seed, Series A, and Series C, and it inched up at Series B and Series D. In general, a lower dilution rate is friendly to founders because it means they are retaining a larger share of their company’s equity.
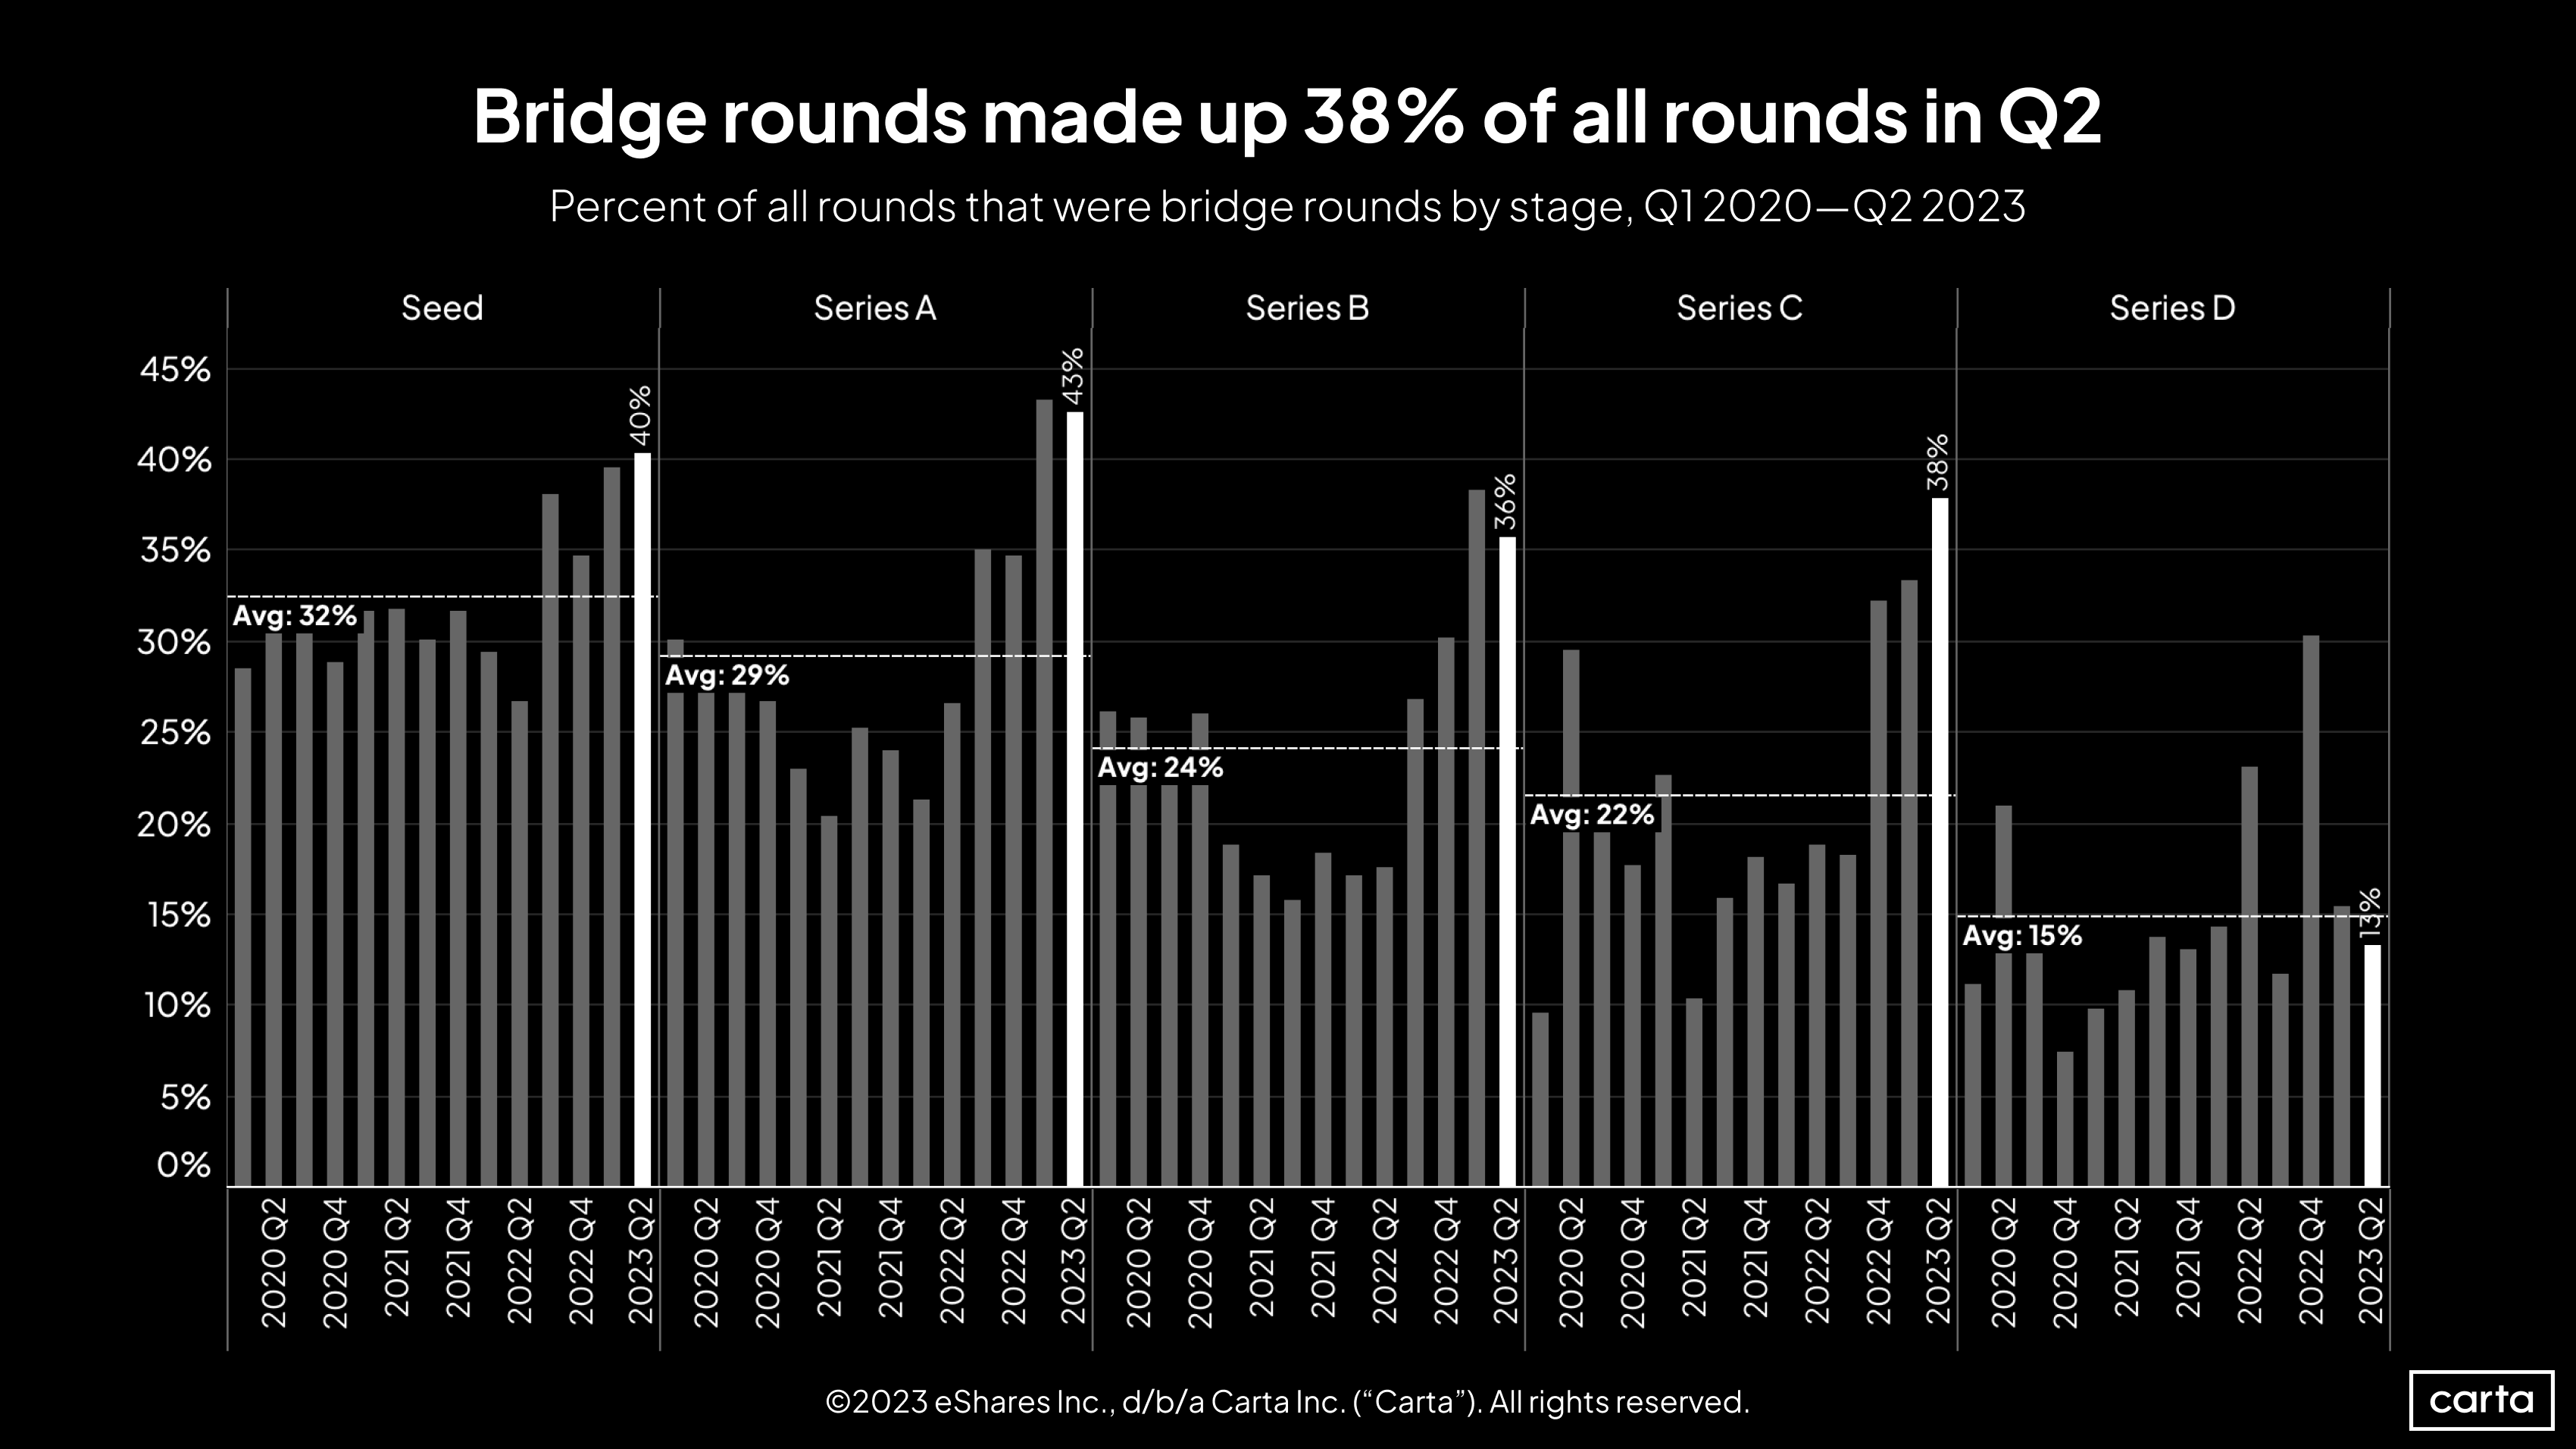
At every stage from seed to Series C, bridge rounds remained much more popular in Q2 than they were for much of the past three years. The biggest disparity comes at Series C. In Q2 2023, bridge rounds comprised 38% of all fundings raised by companies whose latest priced round was a Series C. The average quarterly figure at Series C since the start of 2020 was just 22%.
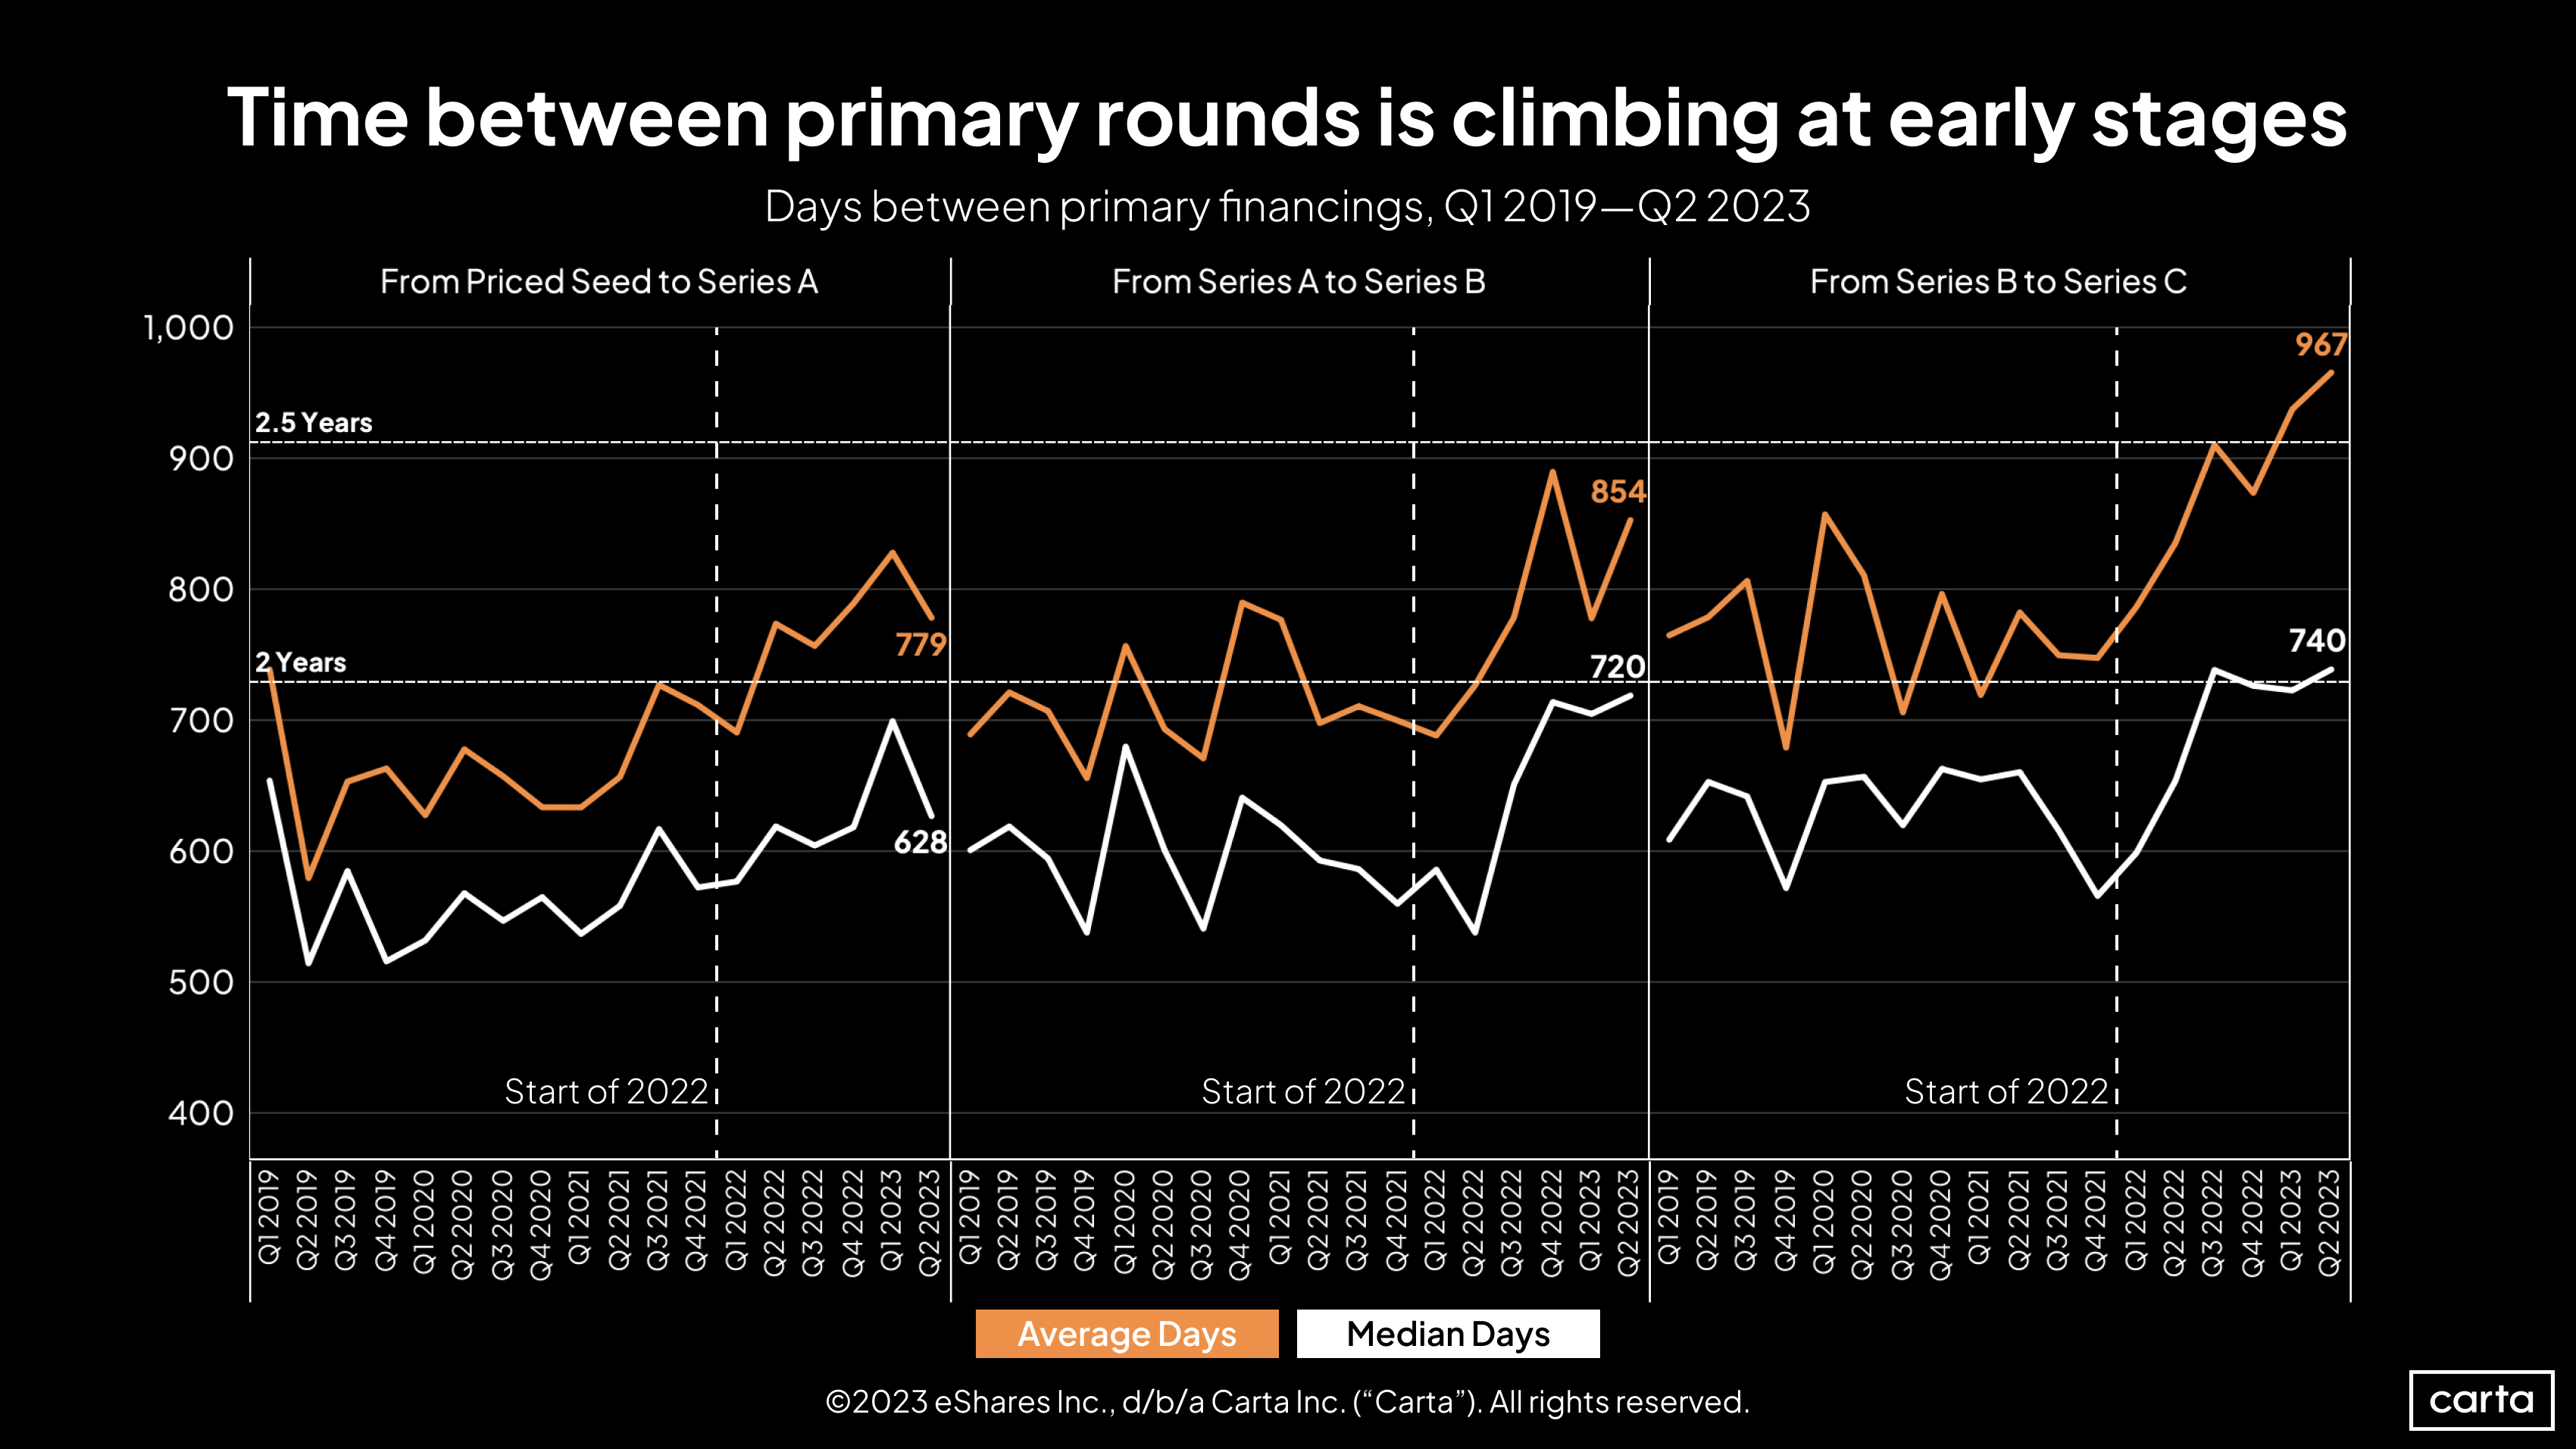
On average, companies that raised a Series C round in Q2 had waited 967 days since closing their Series B—the equivalent of about two years and eight months. That’s easily the longest average wait since the start of 2019, and it’s an increase of nearly 200 days compared to Q2 2021. Longer waits mean that startups need to plan for more runway to sustain themselves between capital raises.
The wait from Series A to Series B also got longer in Q2, measured by both average and median. The time from seed to Series A, however, got significantly shorter—the average wait shrunk by 50 days between Q1 and Q2. These figures can show notable variance on a quarterly basis, however, so it’s too soon to infer a reversal in the long-term trend of wait times getting longer.
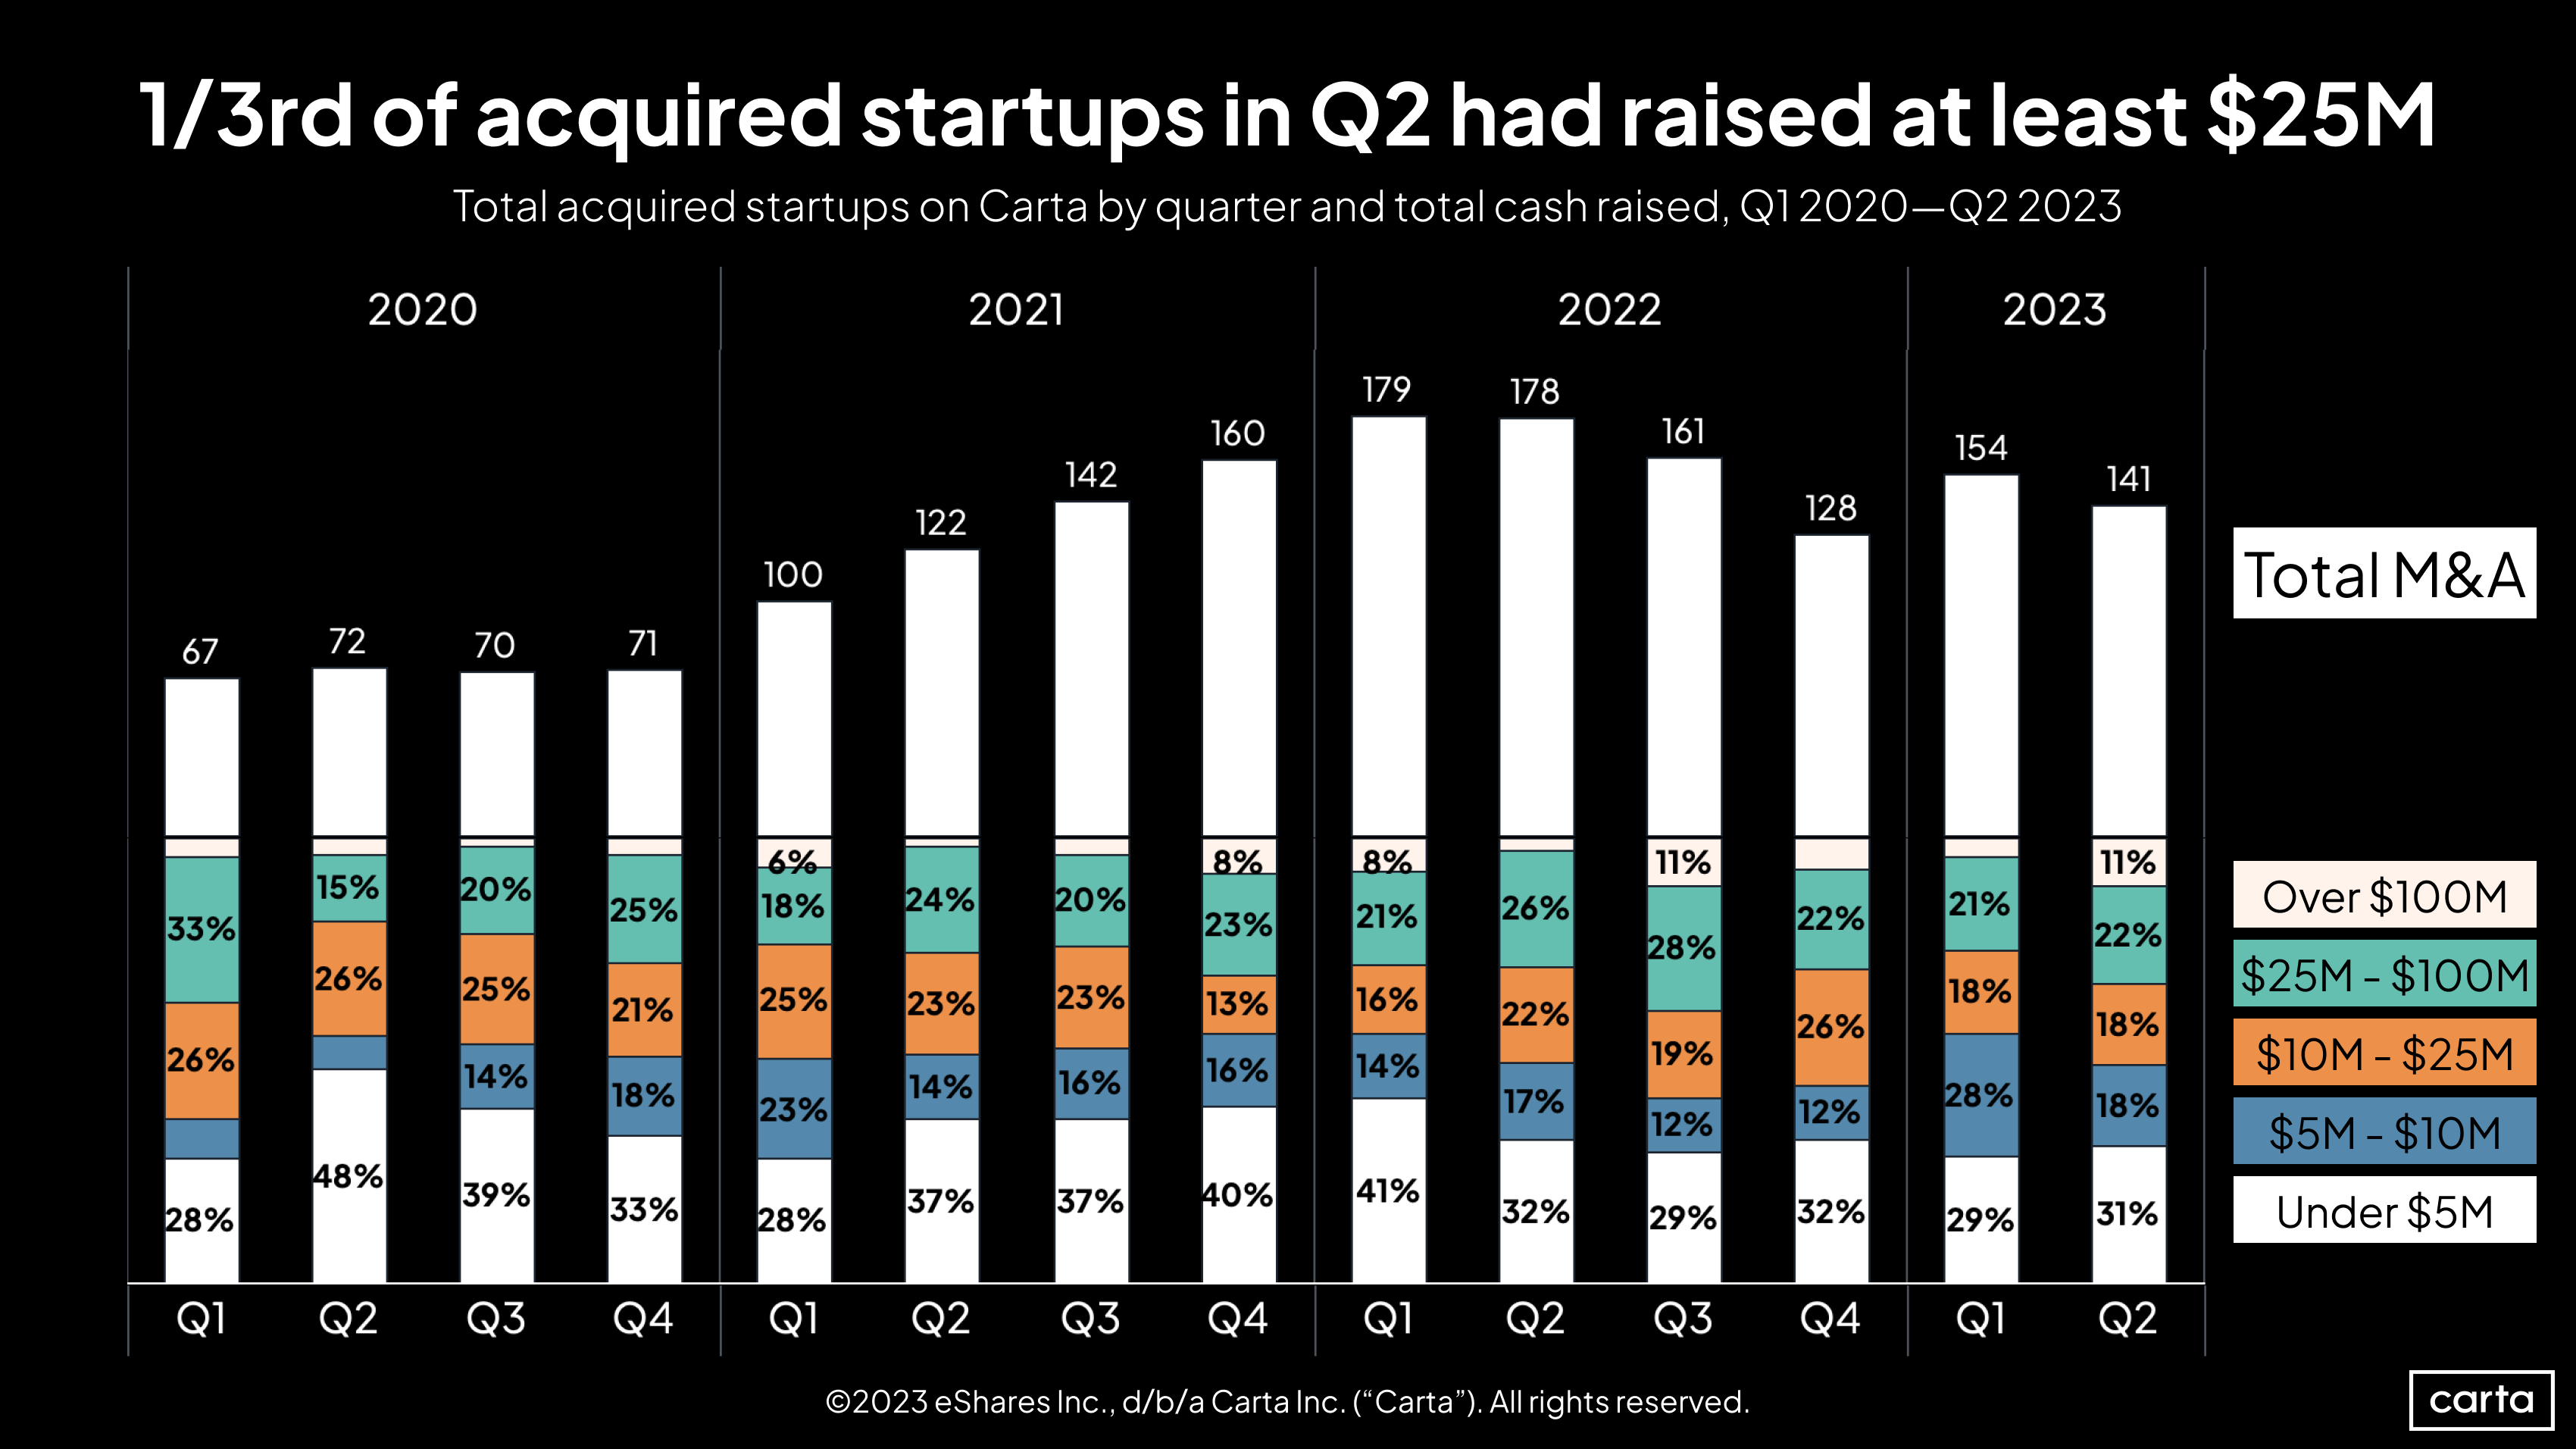
About 11% of all startups on Carta that were acquired in Q2 had raised more than $100 million in prior venture funding, only the second time that figure has topped 10% since the start of 2020. Overall, 33% of acquisitions involved startups that had raised at least $25 million, the third-highest rate since the start of 2020.
The number of transactions fell to 141 from 154, an 8% dip. However, compared to other measurements of the venture ecosystem such as deal counts and valuations, the market for startup M&A has been much more resilient amid the venture downturn, even as deal activity in the broader market for M&A has declined precipitously.
Employee equity & movement
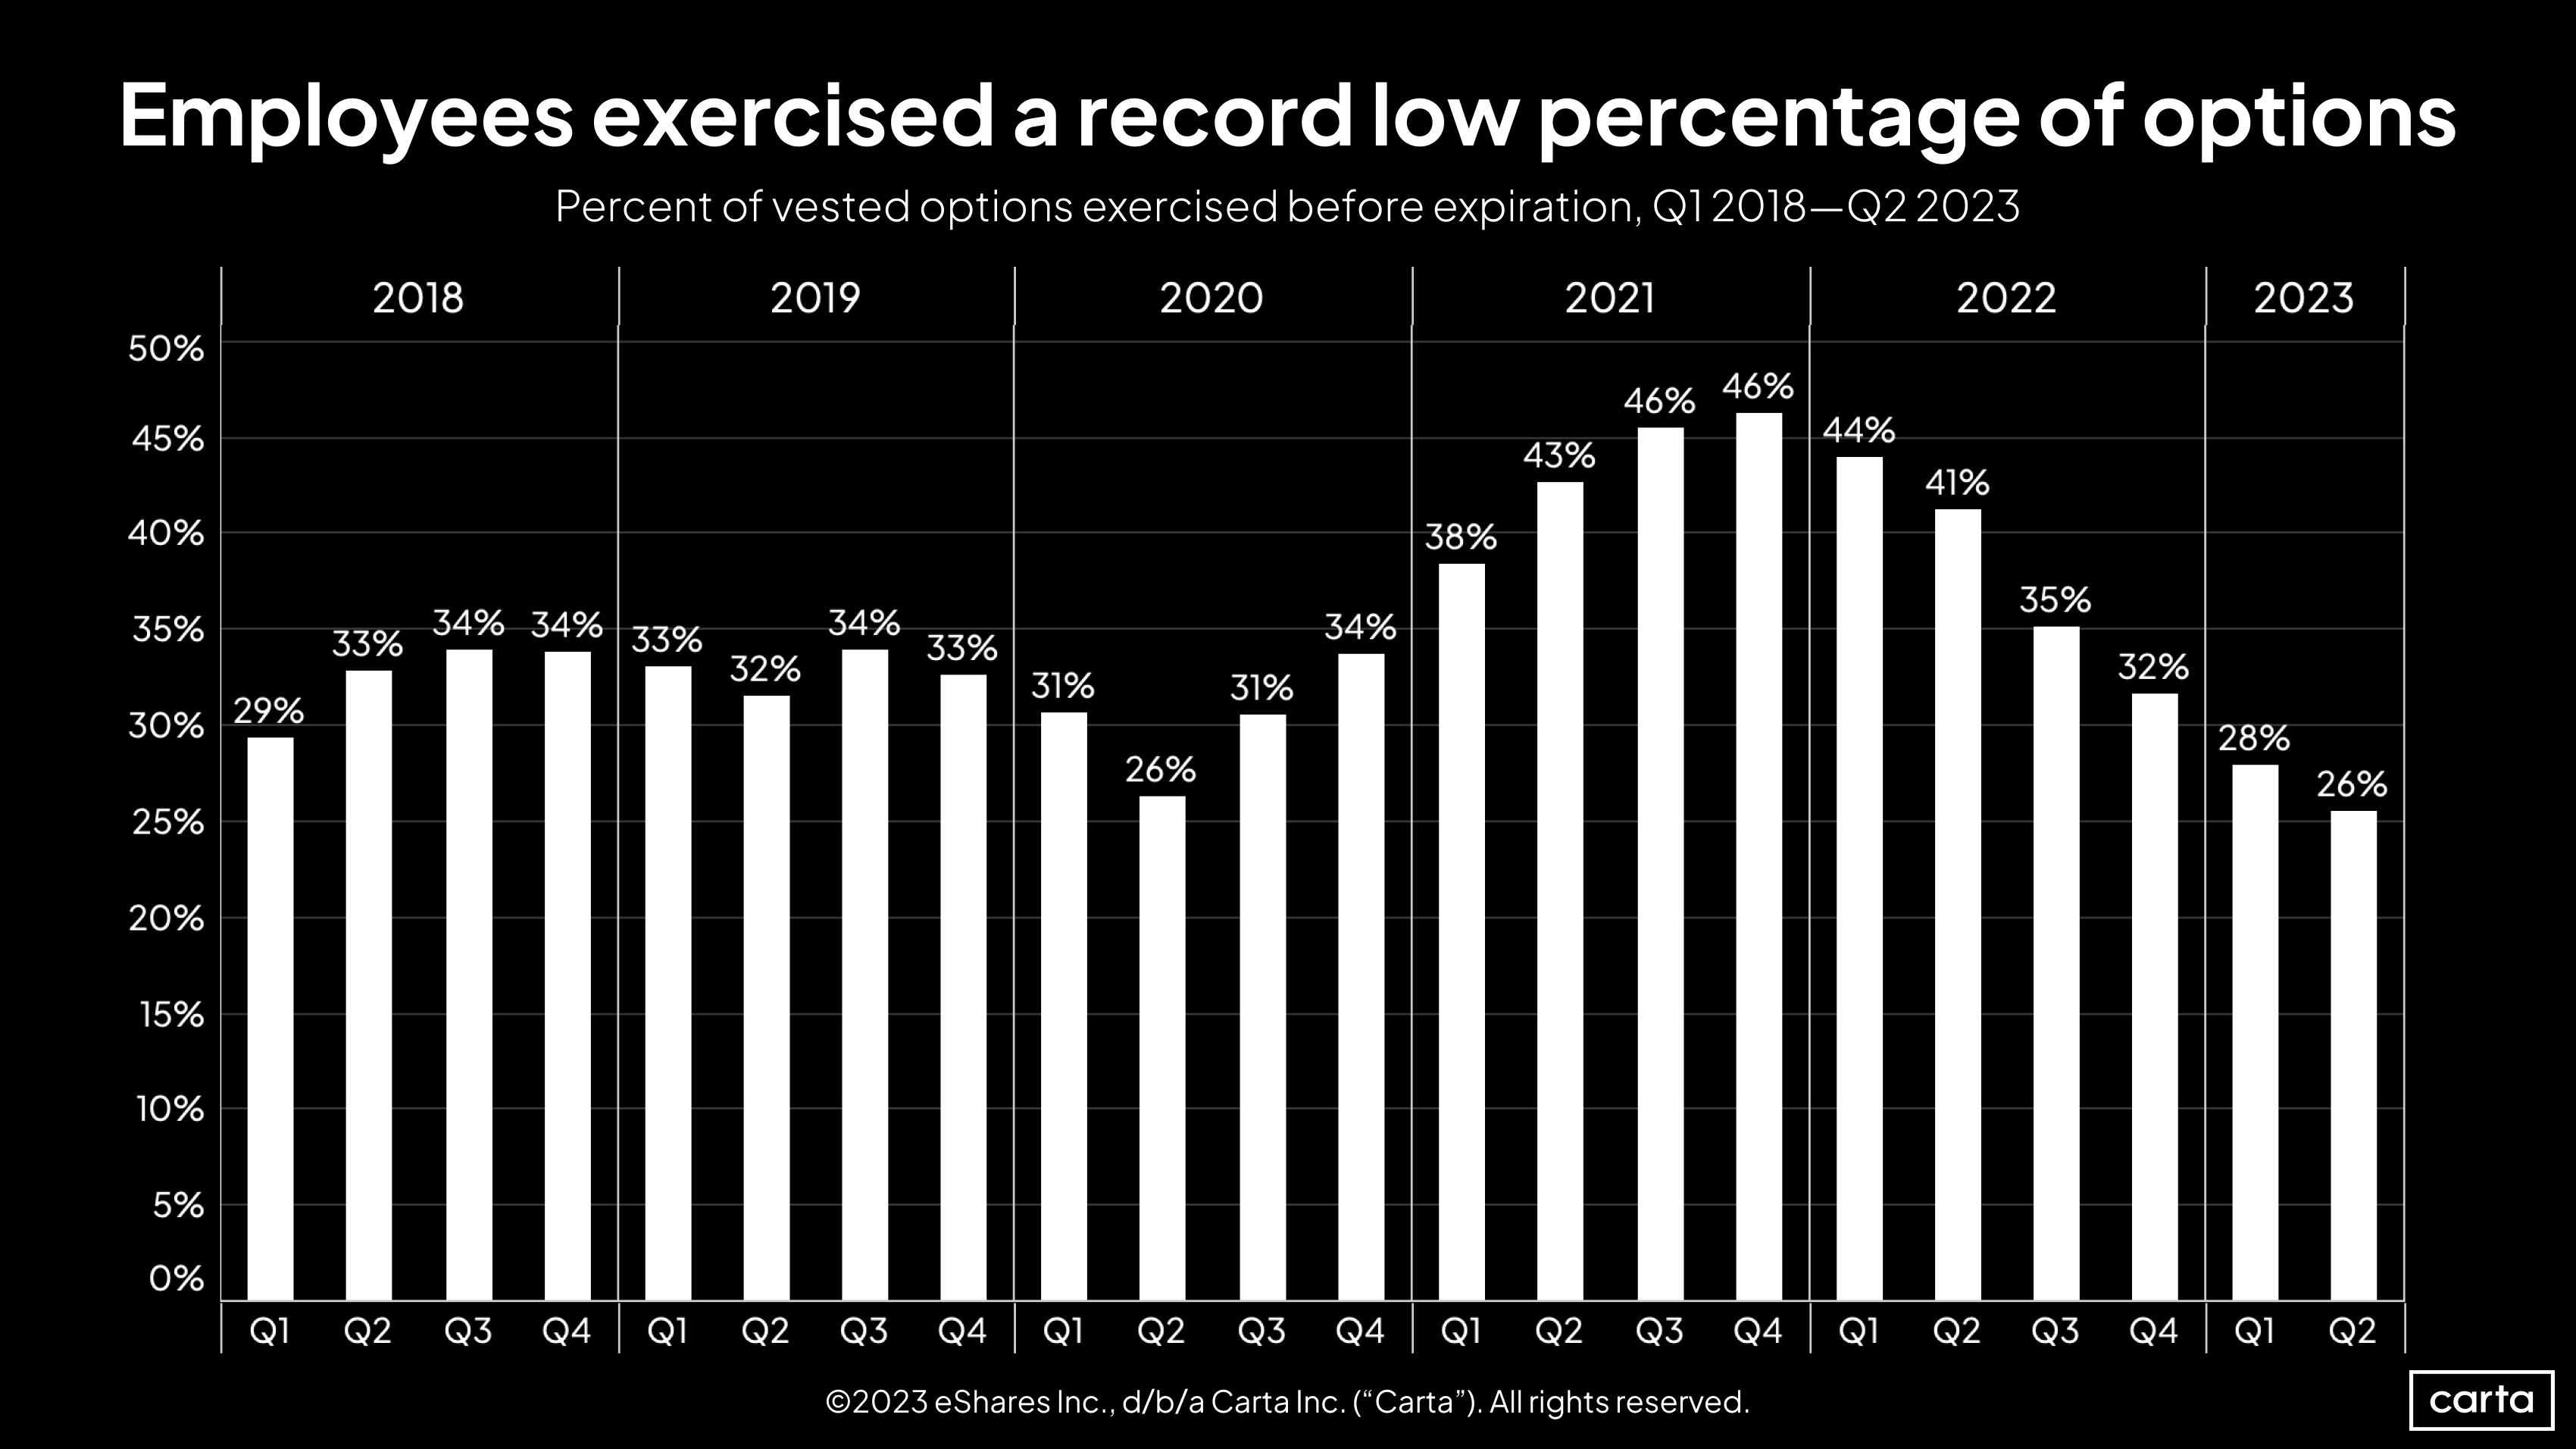
The rate of vested stock options that employees chose to exercise declined for the sixth straight quarter in Q2. At least part of this trend is likely due to the recent decline in venture-backed valuations and the increase in down rounds: When shares in a company become less valuable, employees have less motivation to exercise those shares.
Q2’s exercise rate of 26% is tied for the lowest figure of the past five years. The other quarter when the rate sank so low was Q2 2020, that period of intense uncertainty that immediately followed the onset of the Covid-19 pandemic.

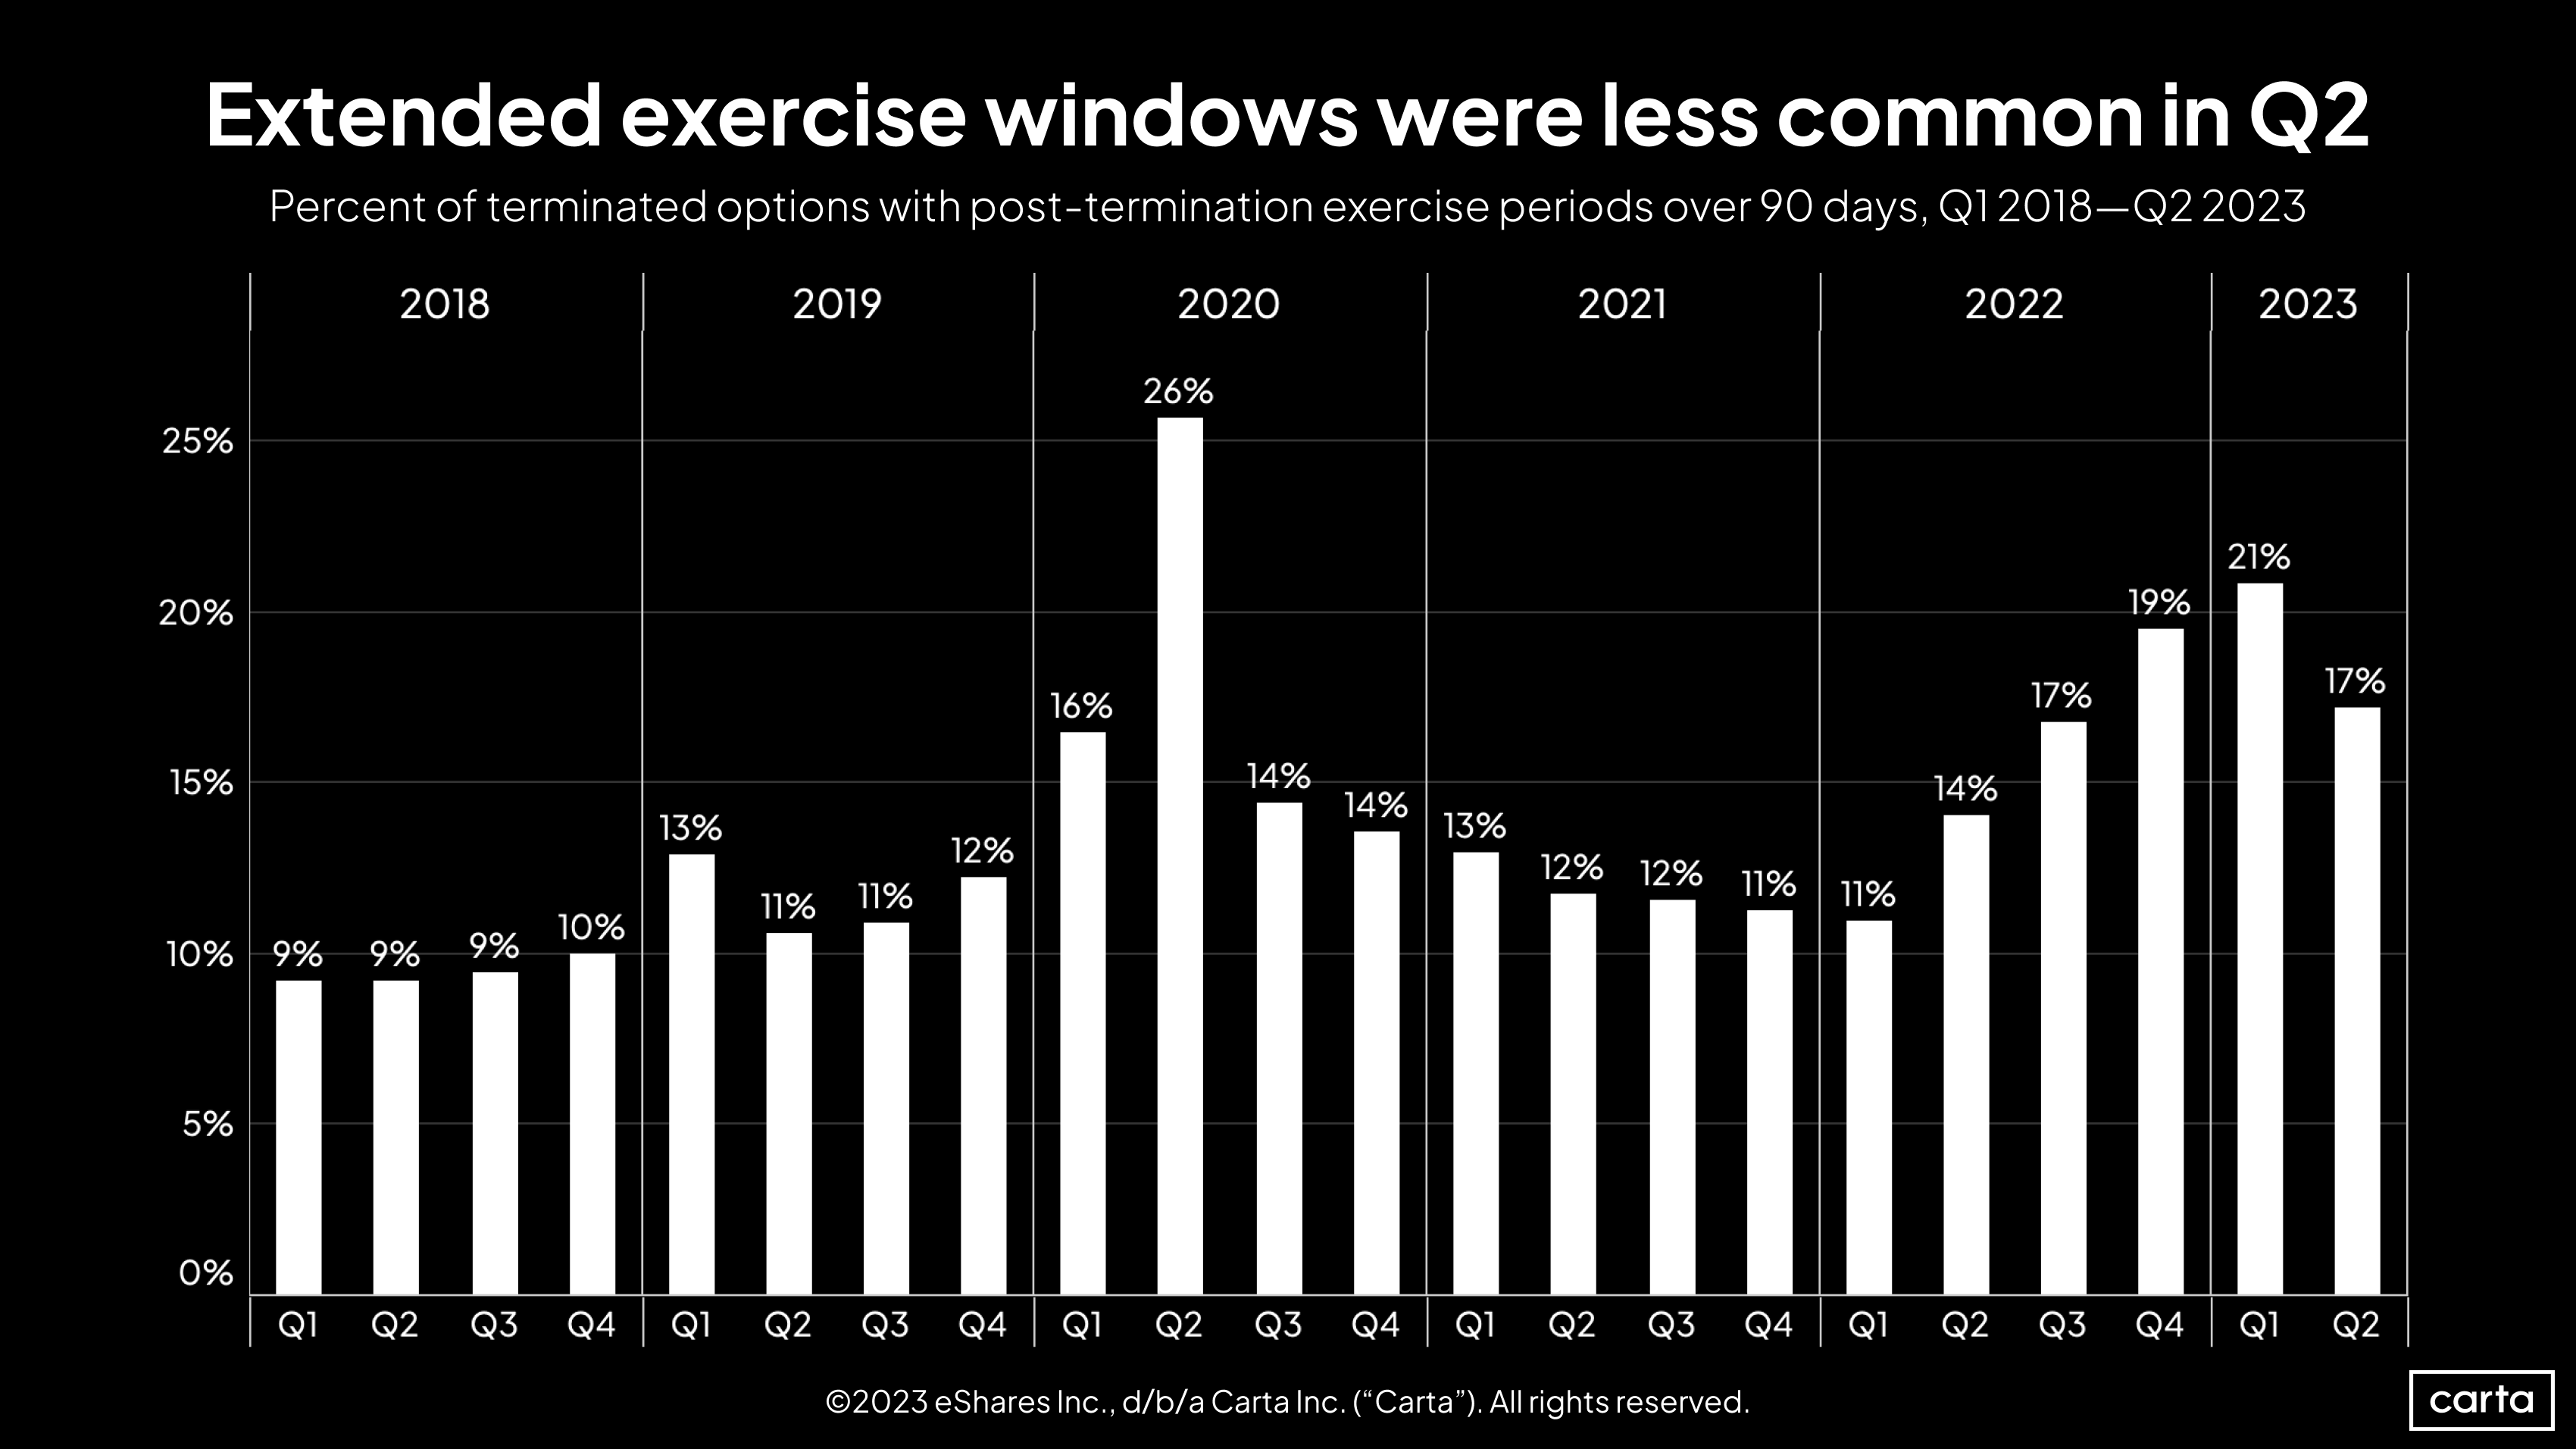
Employers grew less likely to offer an extended post-termination exercise period (PTEP) to their employees in Q2, ending a stretch in which extended PTEP has grown more common for four straight quarters.
This decline correlates to a recent decline in the number of layoffs (see below), likely because companies often offer extended PTEP to laid-off workers as a way to lessen the economic sting of an unexpected job loss. As with the number of layoffs, the rate of extended PTEP remains fairly high relative to past years.
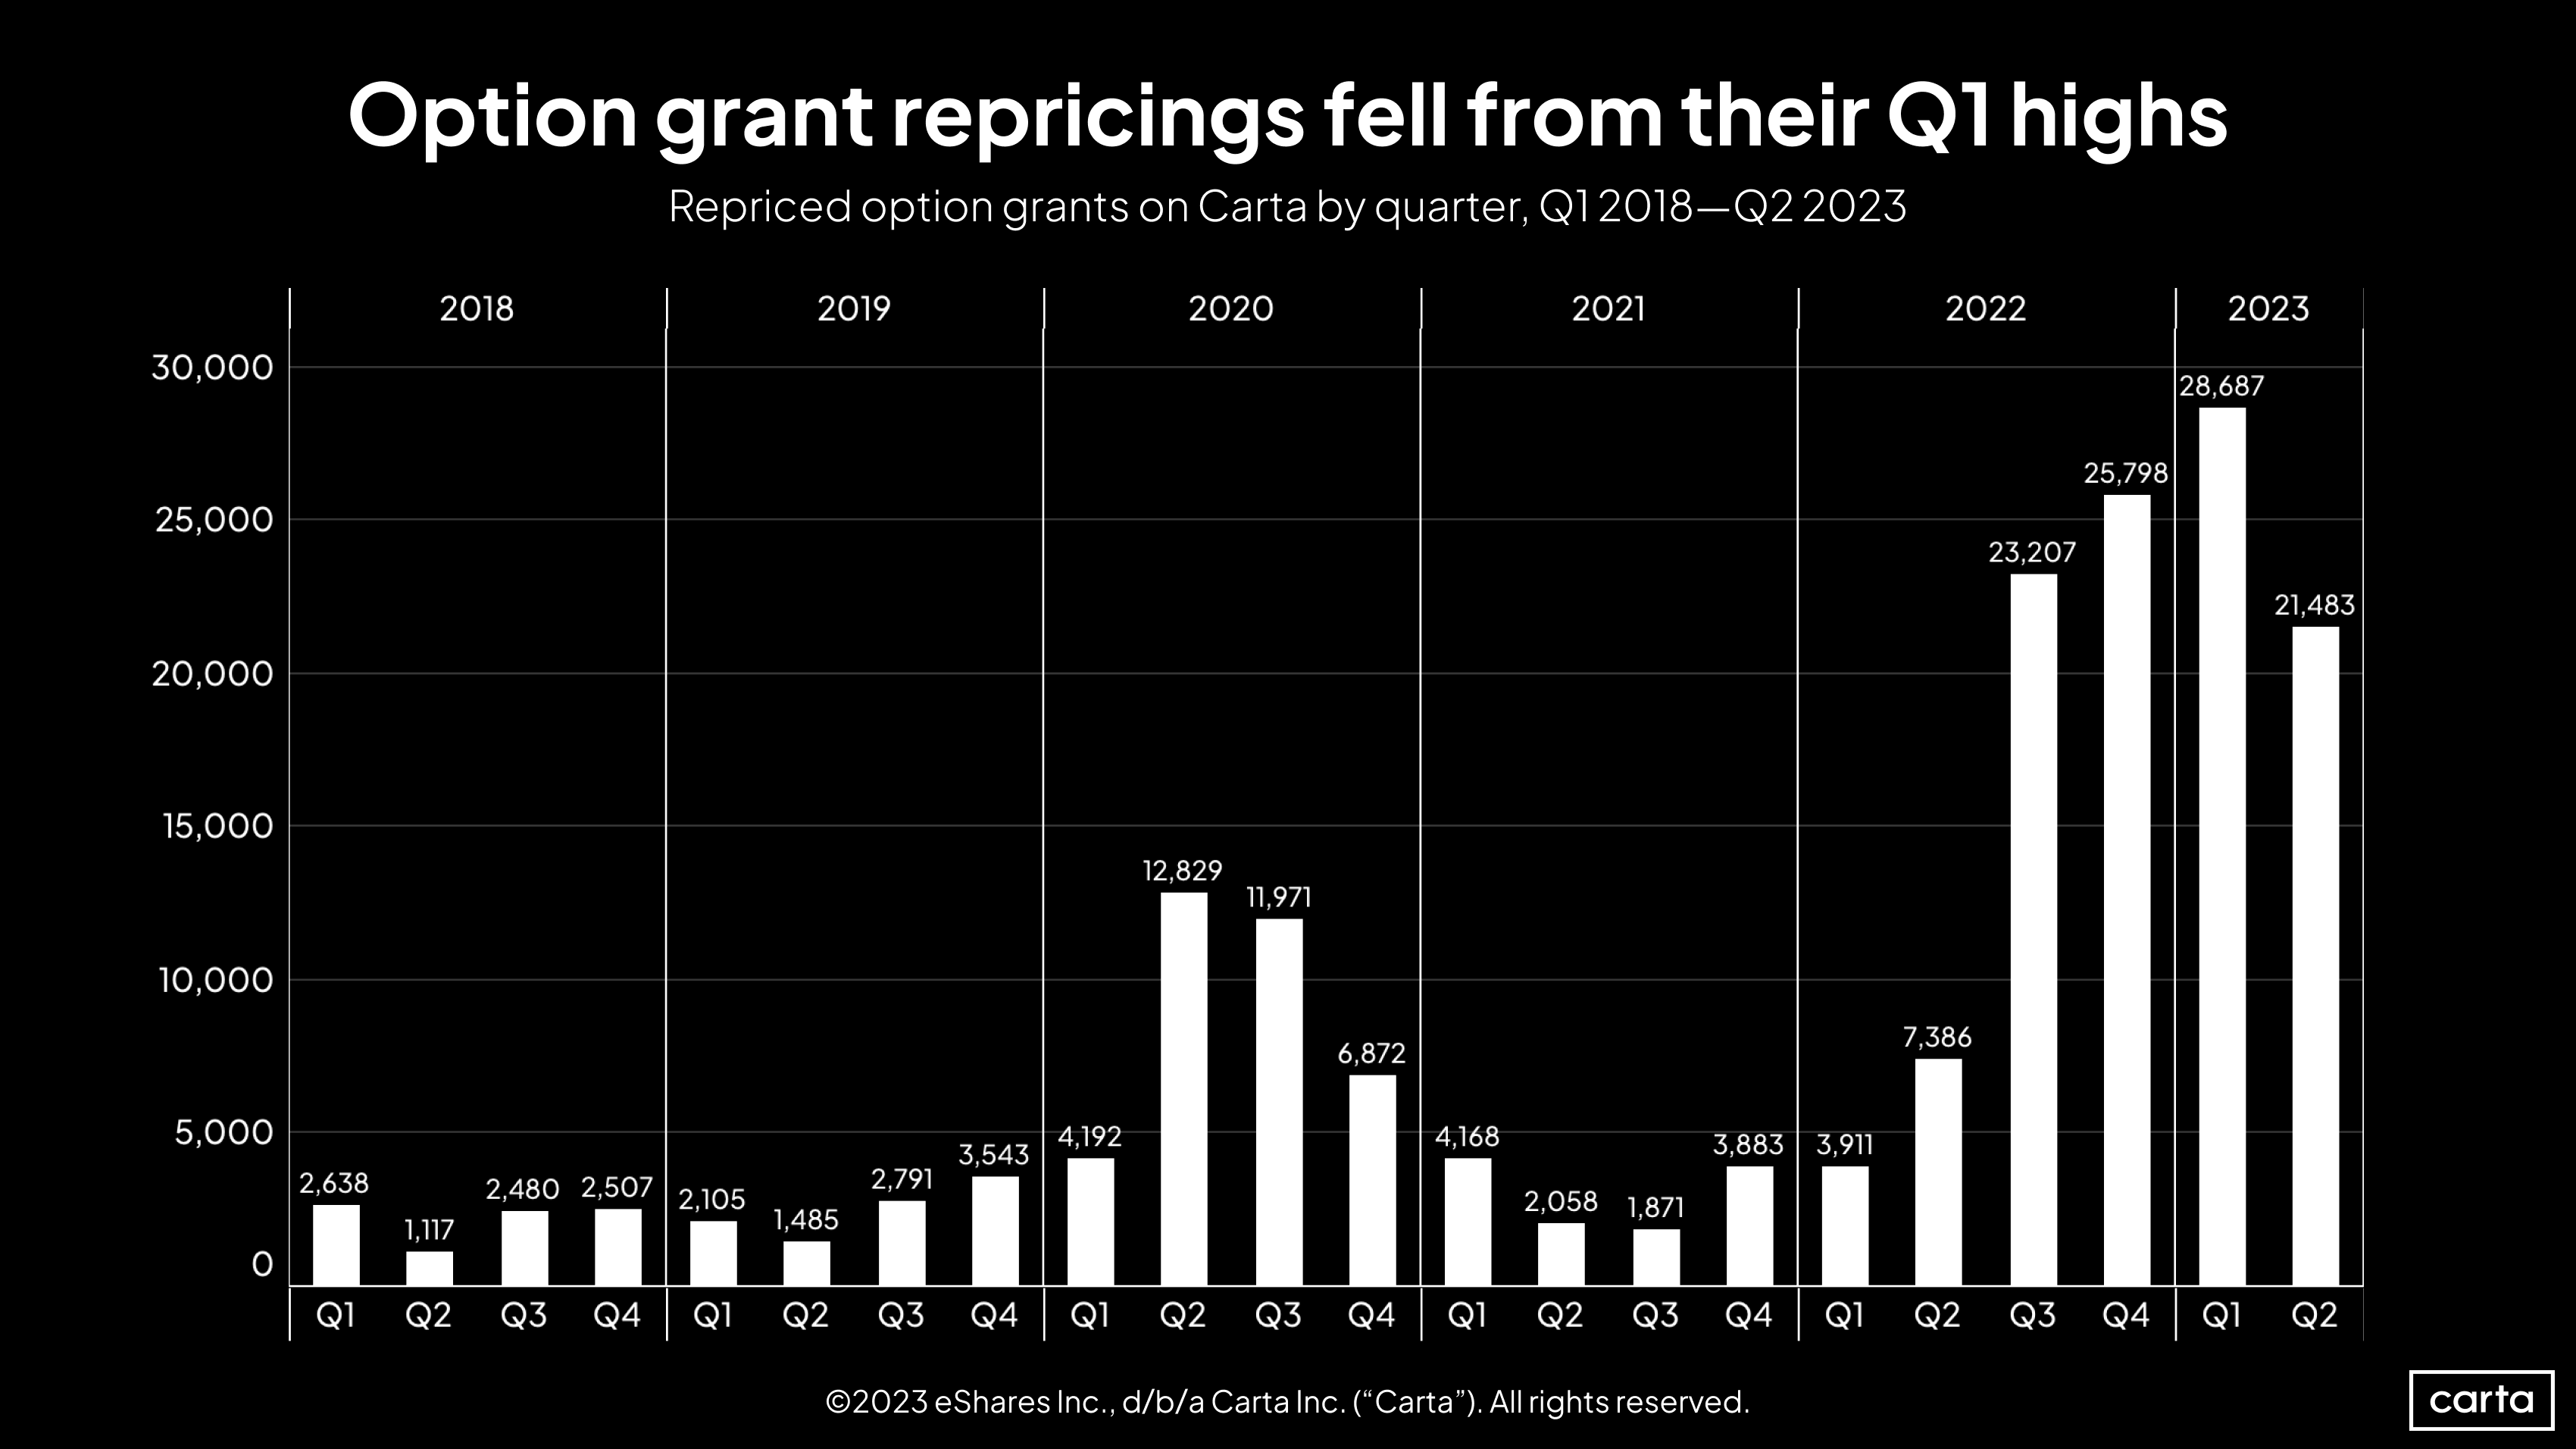
The number of option grant repricings on Carta fell by 25% from Q1 to Q2. But the frequency of grant repricings remains quite high relative to past years. Each of the past four quarters have seen at least 20,000 options repricings on Carta; before that, the quarterly high was under 13,000.
Again, this is likely a symptom (at least in part) of the broader decline in valuations and the increase in down rounds. When a company’s valuation decreases, the existing stock option grants that it has already issued become less appealing. Repricing option grants is a way to make those grants more appealing.
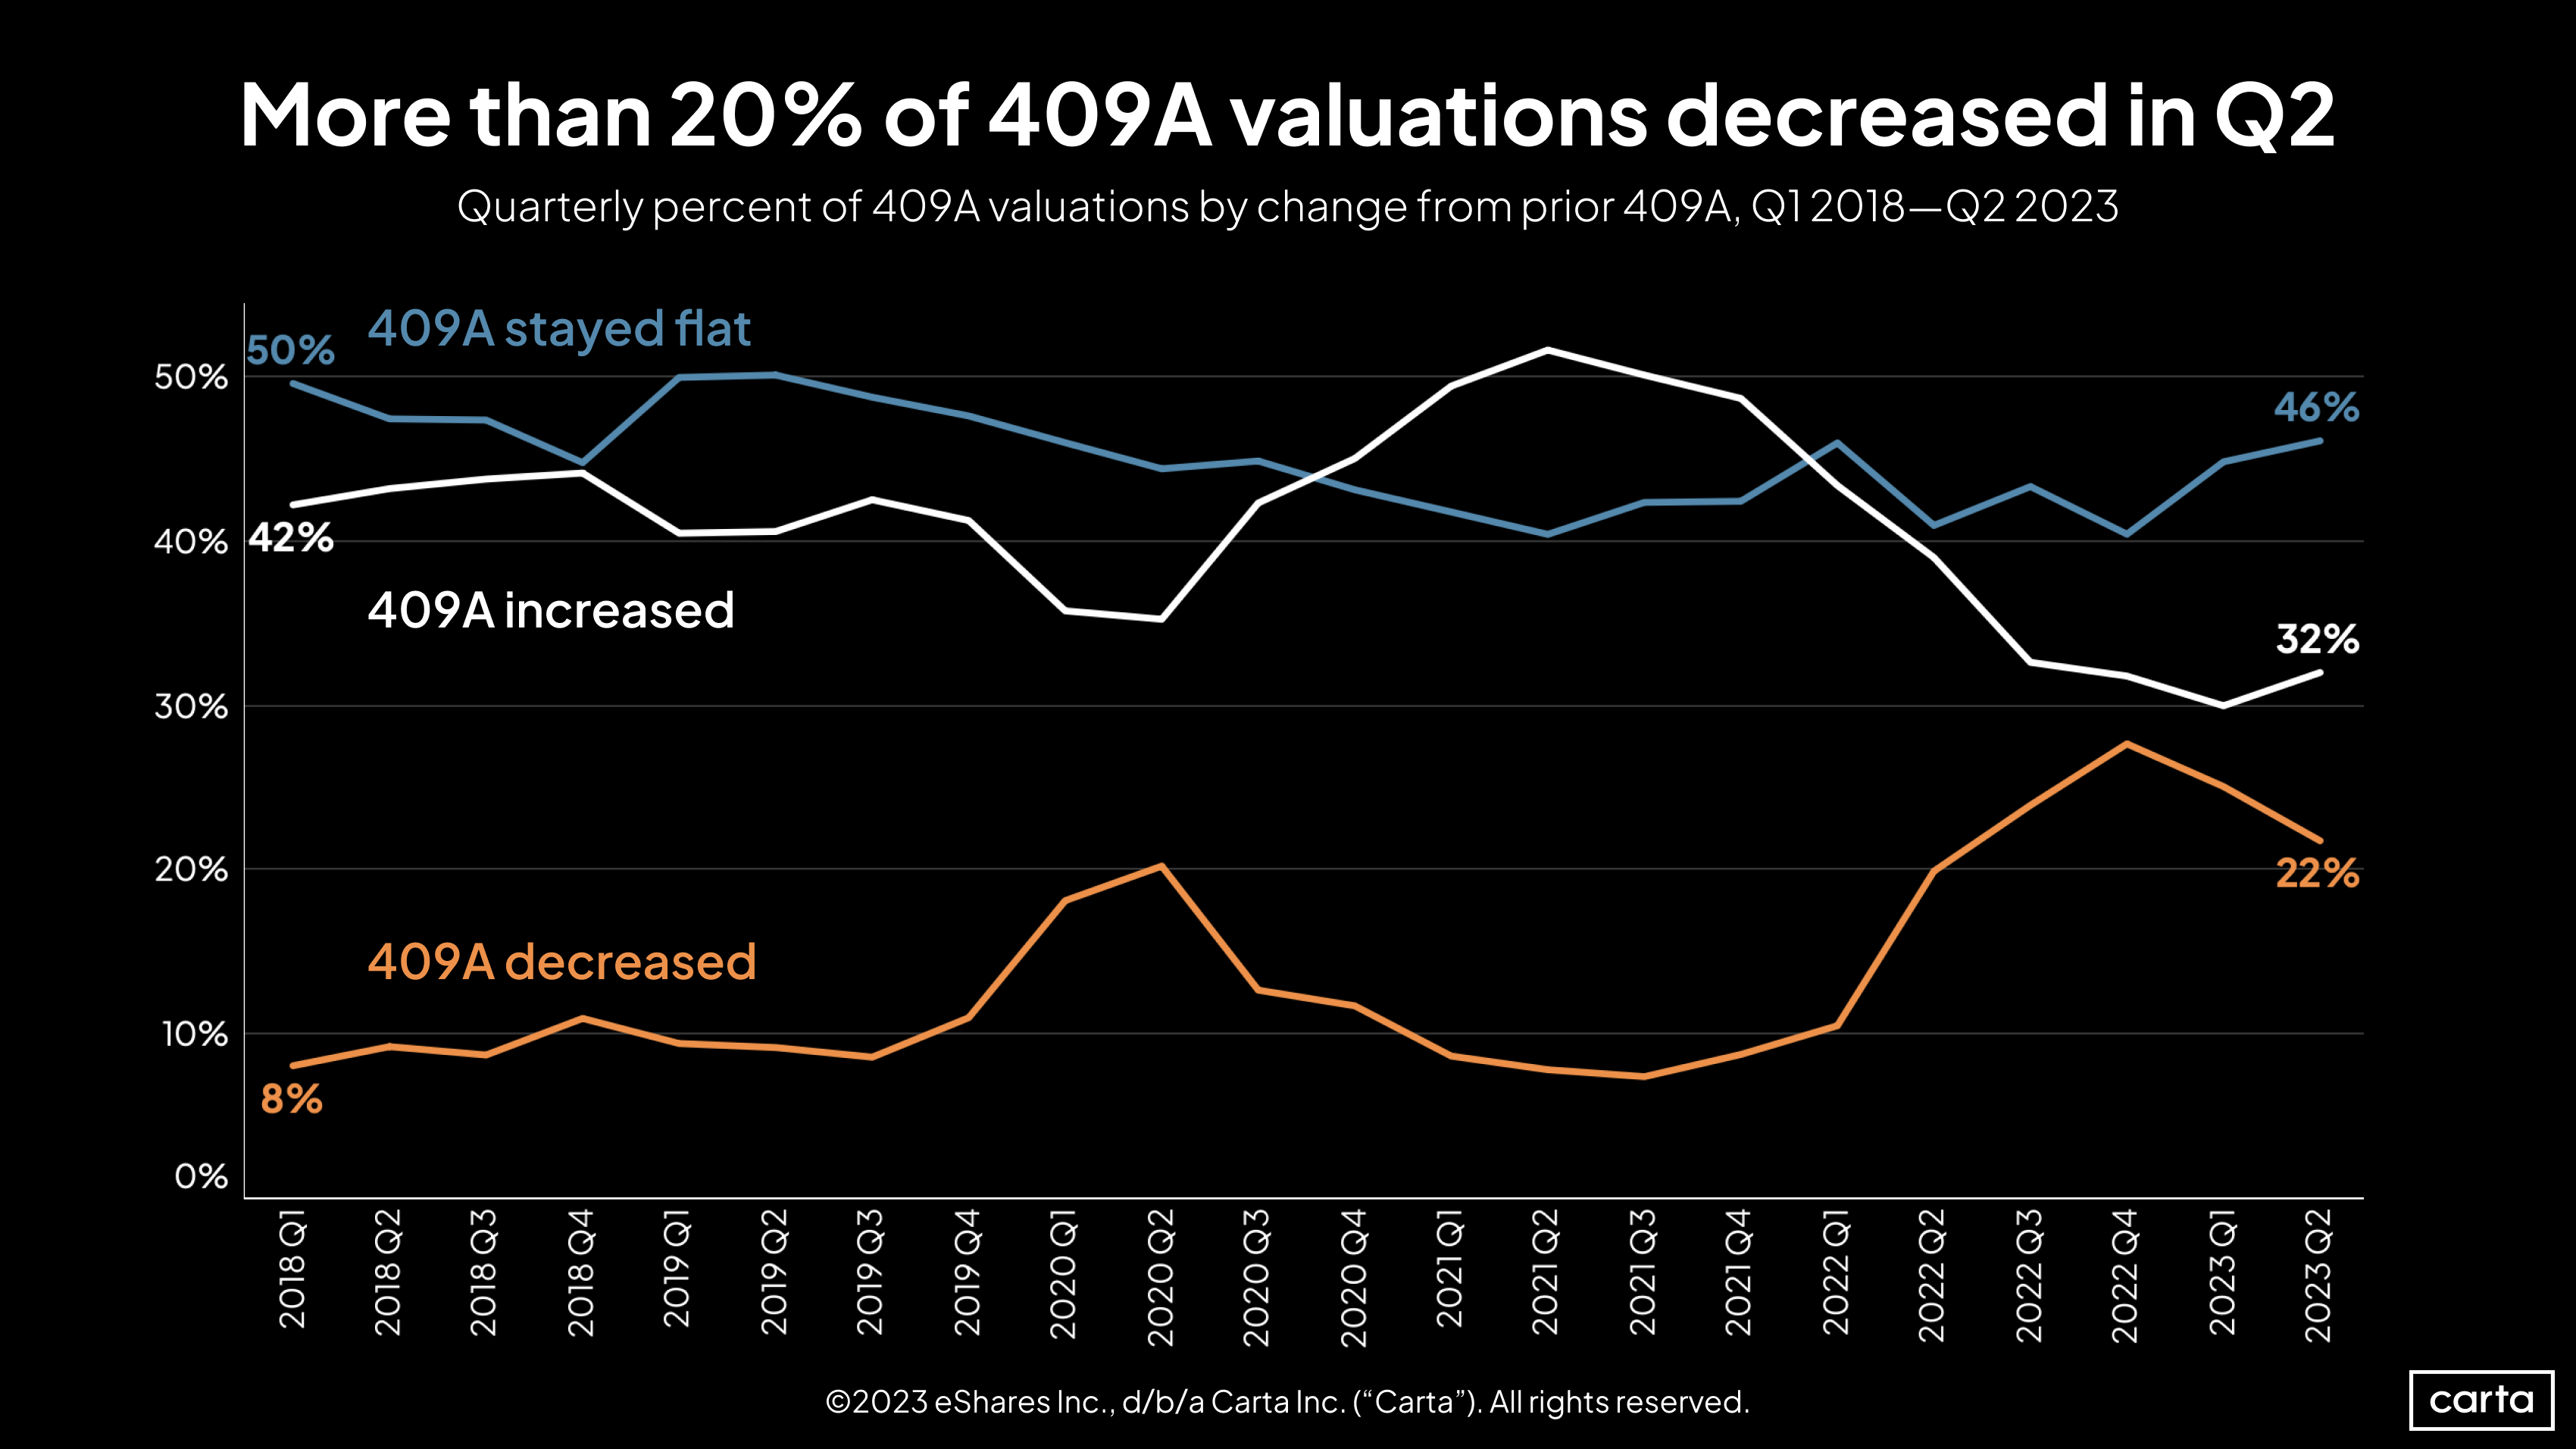
The percentage of new 409A valuations that were higher than the company’s prior 409A ticked up to 32% in Q2, marking the first quarterly increase in two full years. Meanwhile, the percentage of new 409A valuations that were lower than the company’s prior 409A has now declined for two straight quarters.
When combined with valuation trends from primary venture rounds of various stages (see above), it seems clear that the valuation environment grew more favorable to founders and startups in Q2.
After peaking at more than 17,000 in January 2023, the number of layoffs by companies on Carta has now fallen below 10,000 for two consecutive months. That’s a welcome change. Still, layoff rates remain much higher than at any point prior to mid-2022, with the exception of April 2020, when layoffs spiked after the onset of the pandemic.
The number of workers leaving their jobs by choice has also declined from recent highs, falling more closely in line with historical norms. There were more voluntary departures than layoffs on Carta in each month from March through June, a return to the historical norm after that relationship inverted in early 2023.
Industry-specific data
For more industry-specific details on Q2 fundraising, download the addendum to the Q2 report.
Methodology
Carta helps more than 38,000 primarily venture-backed companies and 2,200,000 security holders manage over $2.9 trillion in equity. We share insights from this unmatched dataset about the private markets and venture ecosystem to help founders, employees, and investors make informed decisions and understand market conditions.
Overview
This study uses an aggregated and anonymized sample of Carta customer data. Companies that have contractually requested that we not use their data in anonymized and aggregated studies are not included in this analysis.
The data presented in this private markets report represents a snapshot as of July 24, 2023. Historical data may change in future studies because there is typically an administrative lag between the time a transaction took place and when it is recorded in Carta. In addition, new companies signing up for Carta’s services will increase historical data available for the report.
Financings
Financings include equity deals raised in USD by U.S.-based corporations. The financing “series” (e.g. Series A) is taken from the legal share class name. Financing rounds that don’t follow this standard are not included in any data shown by series but are included in data not shown by series. Primary rounds are defined as the first equity round within a series. Bridge rounds are defined as any round raised after the first round in a given series. If there is no indication that a round is a primary or bridge round, both are included.
In some cases, convertible notes are raised and converted at various discounted prices within a series (e.g. Series A-1, Series A-2, Series A-3). In these cases, converted securities are not included in cash raised, and only the post-money valuation of the new money is included.
Terminations
Terminations entered into Carta must include a reason. Involuntary terminations include both terminations for performance and company layoffs. Voluntary terminations are employees who decided to leave of their own accord. Other termination reasons, including for cause, death, disability, and retirement were not included in the data and make up less than 1% of all terminations combined.


DISCLOSURE: This communication is on behalf of eShares Inc., d/b/a Carta Inc. (“Carta”). This communication is for informational purposes only, and contains general information only. Carta is not, by means of this communication, rendering accounting, business, financial, investment, legal, tax, or other professional advice or services. This publication is not a substitute for such professional advice or services nor should it be used as a basis for any decision or action that may affect your business or interests. Before making any decision or taking any action that may affect your business or interests, you should consult a qualified professional advisor. This communication is not intended as a recommendation, offer or solicitation for the purchase or sale of any security. Carta does not assume any liability for reliance on the information provided herein. ©2023 eShares Inc., d/b/a Carta Inc. (“Carta”). All rights reserved. Reproduction prohibited.