Executive summary
The downturn that has defined the venture capital industry for much of the past two years continued in the third quarter of 2023. The amount of capital raised by startups on Carta declined by 38% from Q2 to Q3, and the number of venture fundraising rounds fell by 27%. Nearly one in five investments was a down round. In terms of dollars raised, total VC funding has now declined in six of the past seven quarters.
For founders and startups, Q3 offered a few encouraging signs: The median pre-money valuation in venture deals increased at nearly every stage. Dilution is trending downward at most stages, which means founders are able to retain ownership of a larger portion of their companies when they raise new cash. And Q3 saw a sharp decline in the frequency of investor-friendly deal terms such as liquidation preferences and cumulative dividends.
The startup market remains a bustling place: Many companies are successfully raising venture capital at attractive valuations. But investors are still playing offense in most deal negotiations, and the bar for writing a check remains high.
Q3 highlights
Early-stage valuations are on the rise: The median pre-money valuation for deals at both seed stage and Series A increased in Q3 for the second consecutive quarter. The median Series A valuation hit $40 million, its highest point in the past five quarters.
Time between rounds is lengthening: Among startups that raised a Series C in Q3, the average wait time since raising a Series B was 1,090 days—more than three years. At both Series C and Series A, the average and median time between rounds increased significantly in Q3. More time in between primary rounds means startups have to make their existing funds last for longer.
409A valuations are staying put: About 54% of companies that received new 409A valuations in Q3 saw their valuation stay the same, the highest rate of flat 409A valuations since the start of 2018. About 29% of companies saw their 409A valuation go up and 16% saw it go down.
Note: If you’re looking for more industry-specific data, you can also download the addendum to this report to get an extended dataset.
Key trends
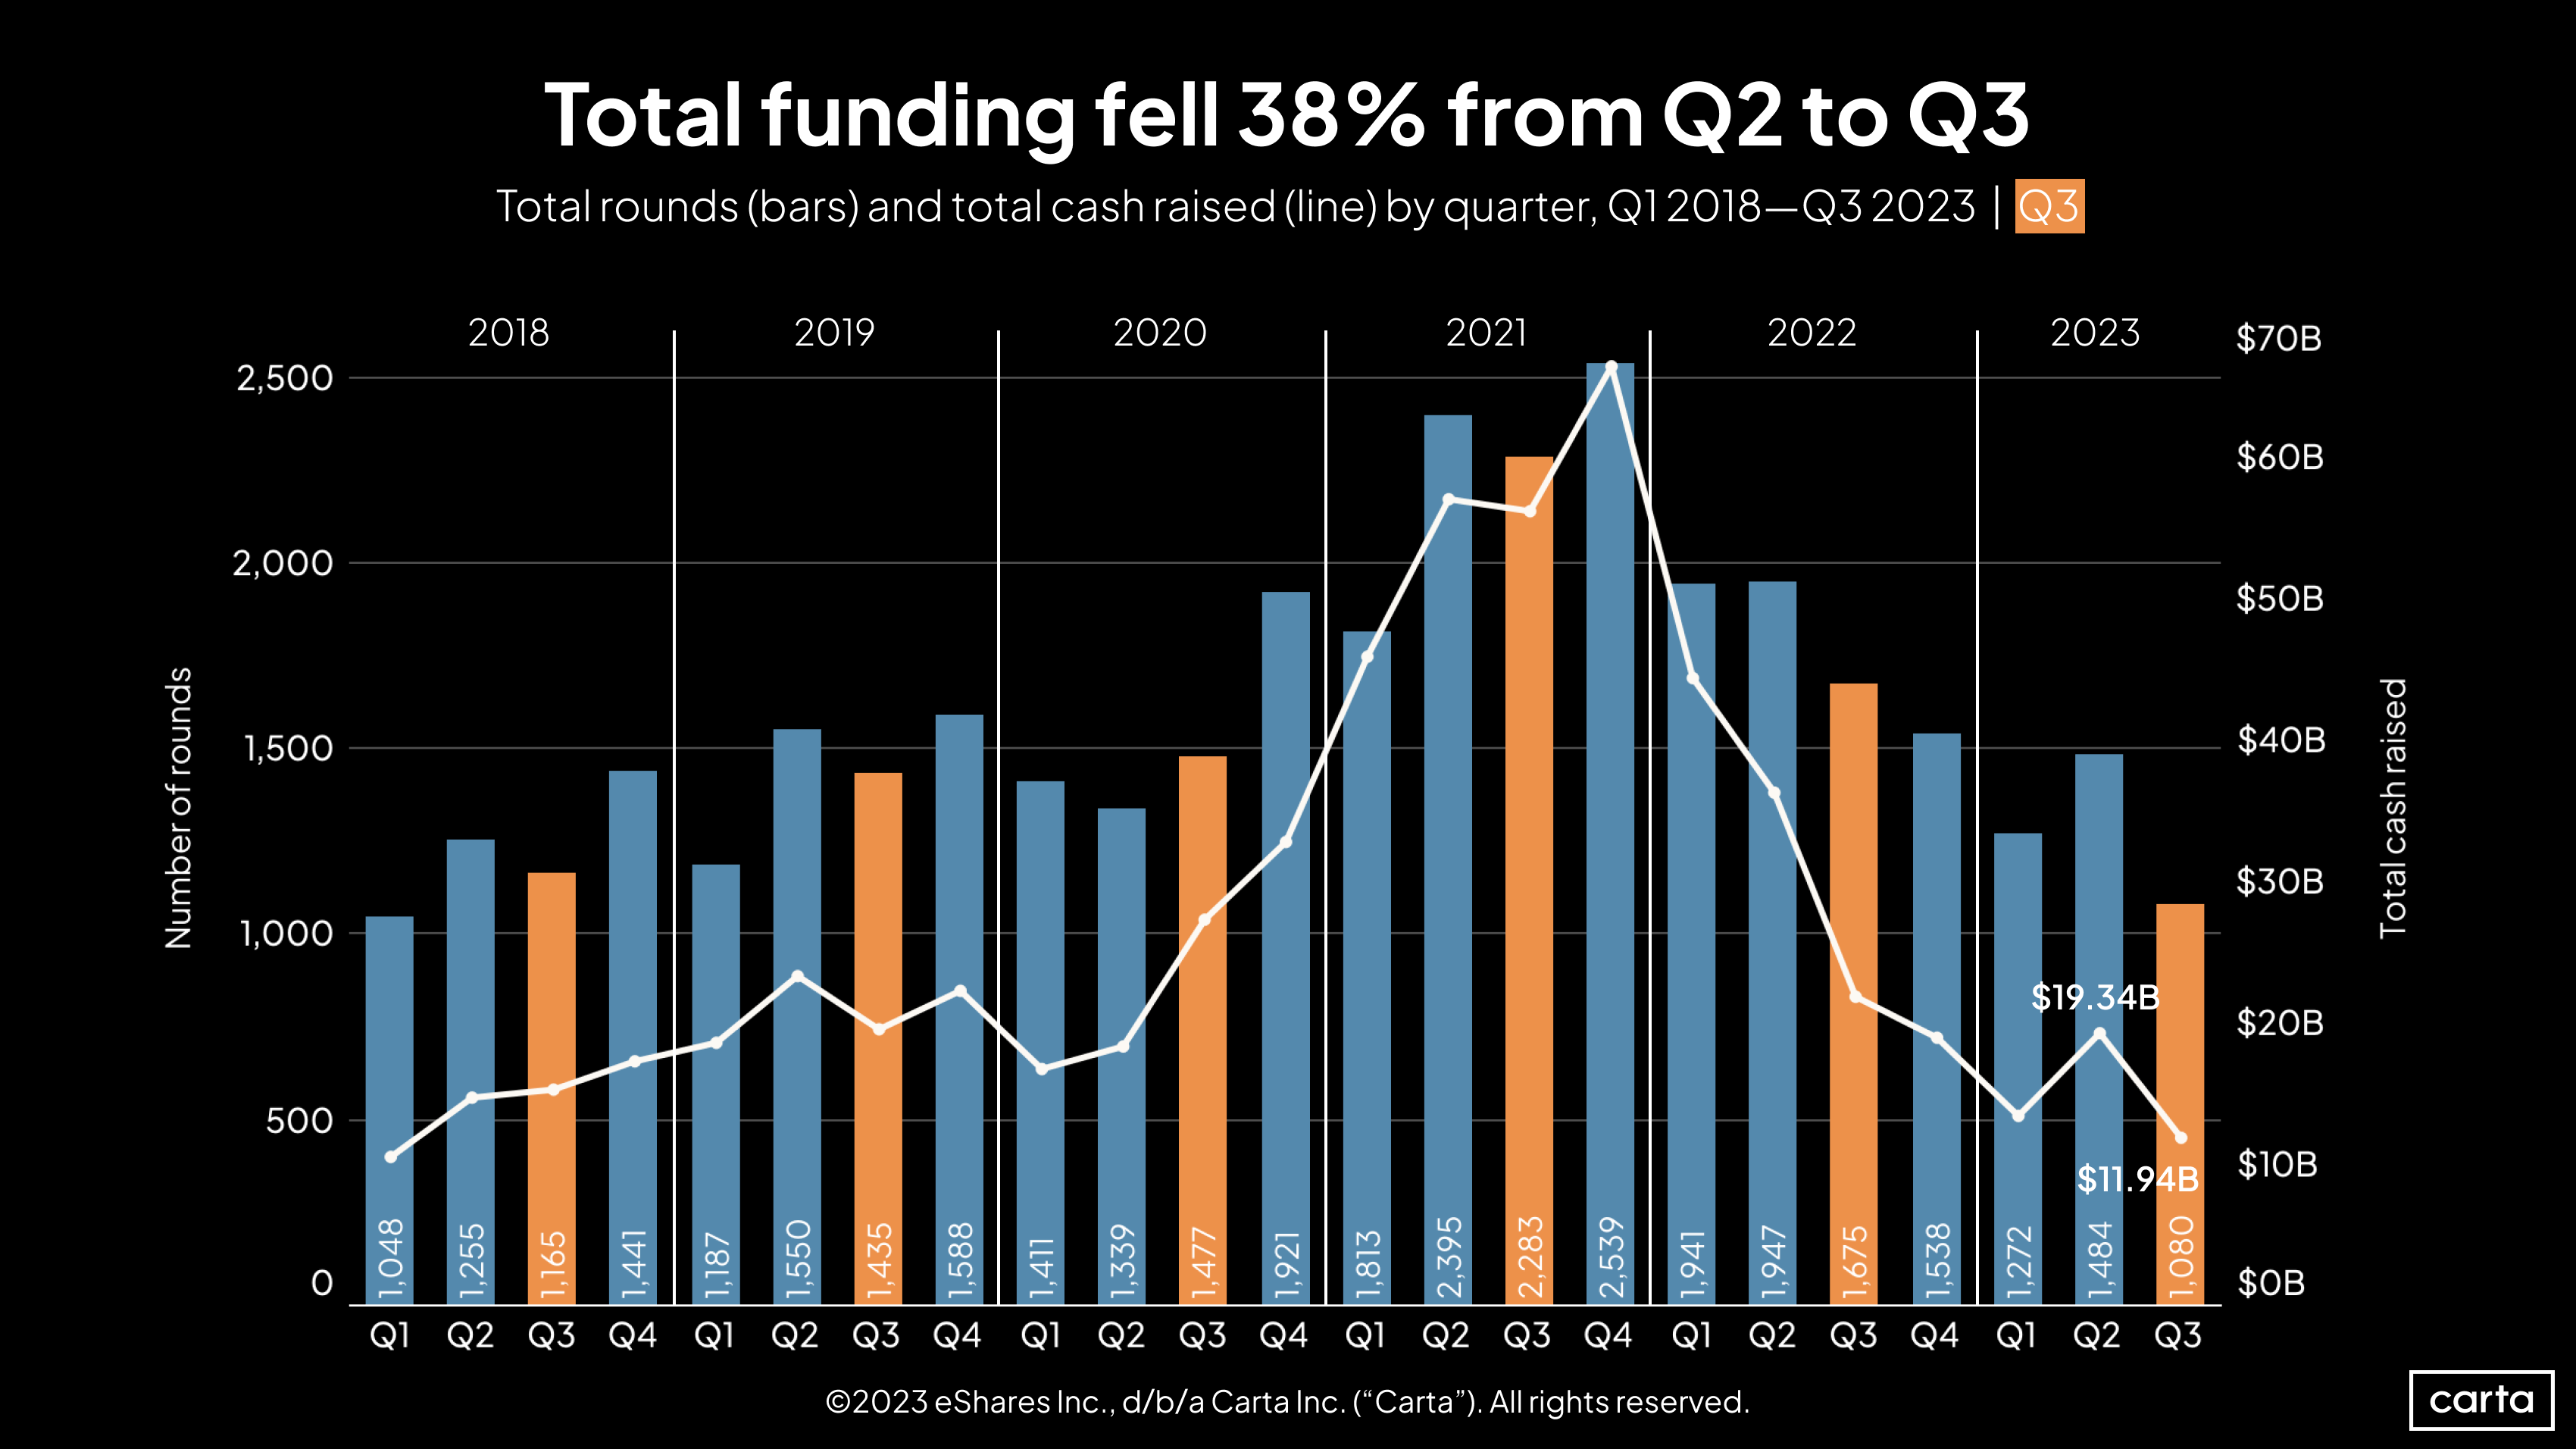
Q3 numbers for deal count and capital raised will likely increase in the weeks to come as companies continue to report transactions from the quarter. For now, Q3 was the slowest quarter for venture fundraising activity on Carta since Q1 2018.
This past quarter’s declines continue a two-year trend. From Q3 2021 to Q3 2022, overall deal count fell by 27%. Over the next year, from Q3 2022 to Q3 2023, it fell by another 36%. Total capital raised fell by 61% between Q3 2021 and Q3 2022, then by another 46% between Q3 2022 and Q3 2023.
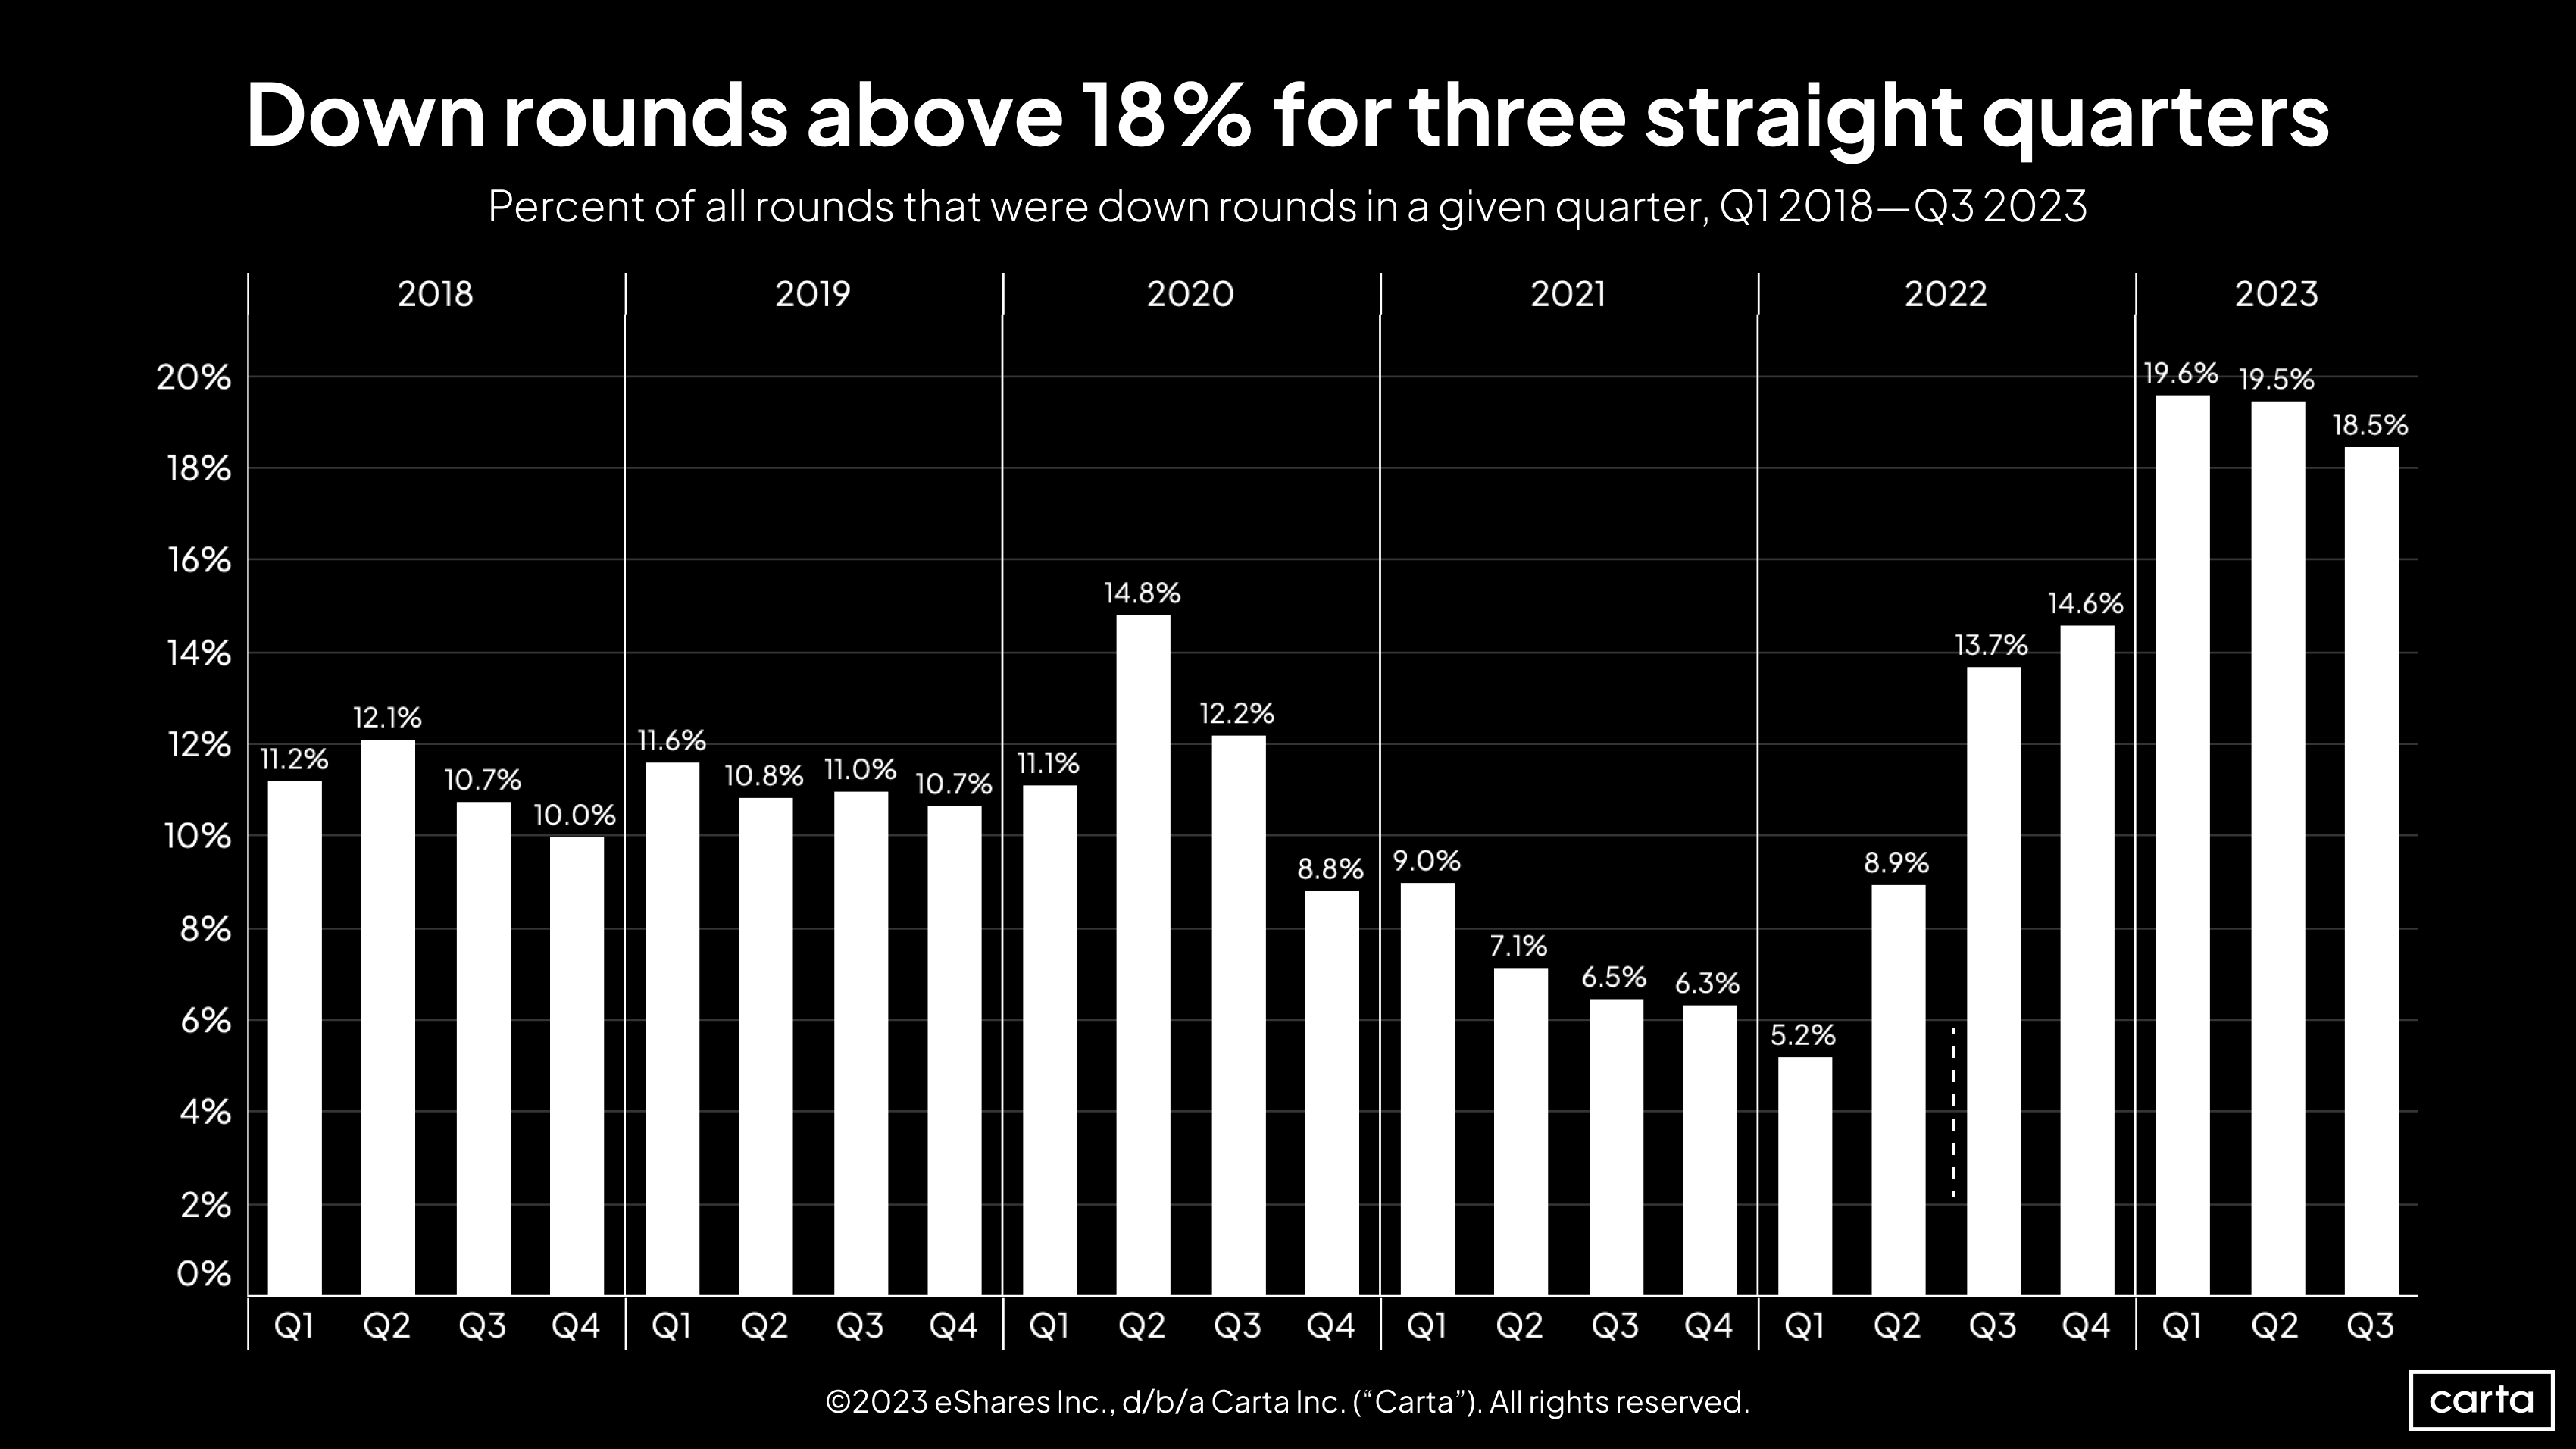
From the perspective of founders, down rounds remain an all-too-prominent feature of the current venture landscape. While the rate of down rounds declined slightly in Q3, it remained above 18% for the third quarter in a row. The past three quarters represent the three highest down-round rates we’ve seen since the start of 2018.
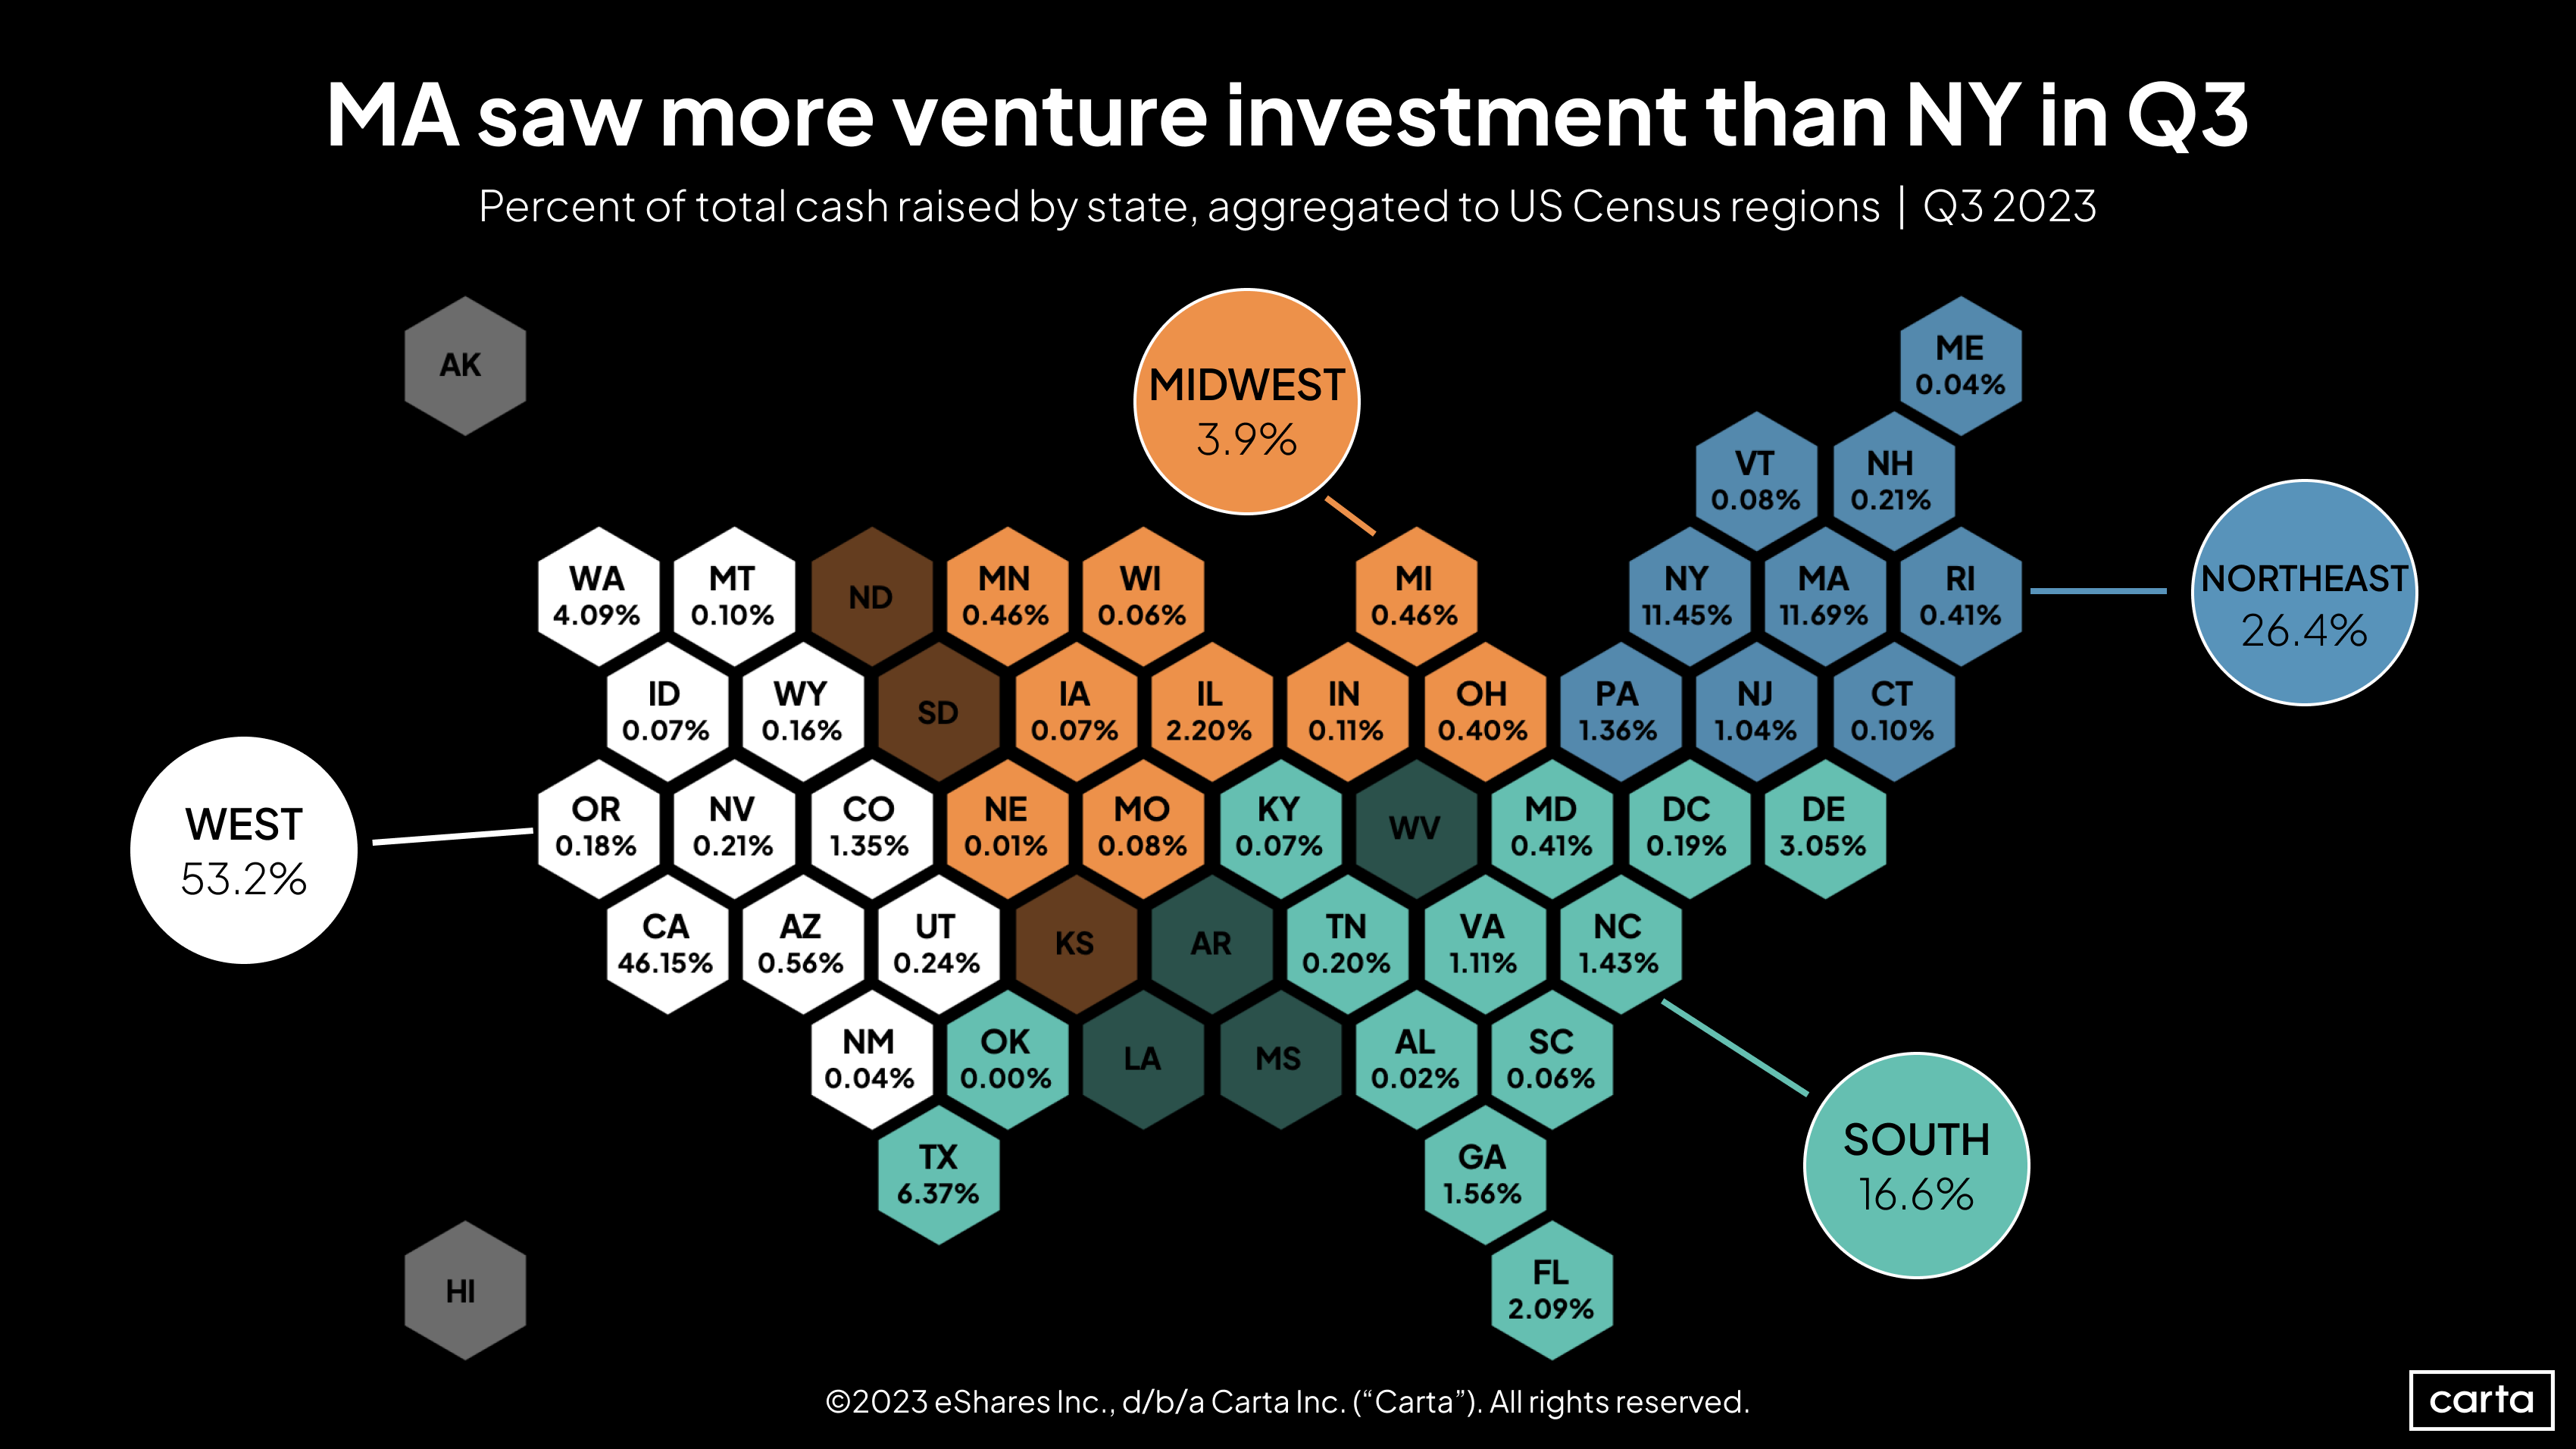
About 11.7% of all venture capital raised in Q3 went to startups headquartered in Massachusetts, surpassing New York for the second largest share of any state. Relative to the rest of the U.S., it’s been a good year for raising capital in the longtime biotech hub. Massachusetts startups brought in more than 12% of all VC in the country in both Q1 and Q2, tracking well above the state’s 9.5% share for all of 2022.
On the opposite coast, California logged 46.2% of all venture dollars raised in Q3, equaling its market share from 2022. During the first half of 2023, it had appeared that the rest of the country might be gaining ground on the VC industry’s historical home base: California logged 40.7% of capital raised in Q1 and just 36% in Q2. But that downward trend didn’t continue into Q3.
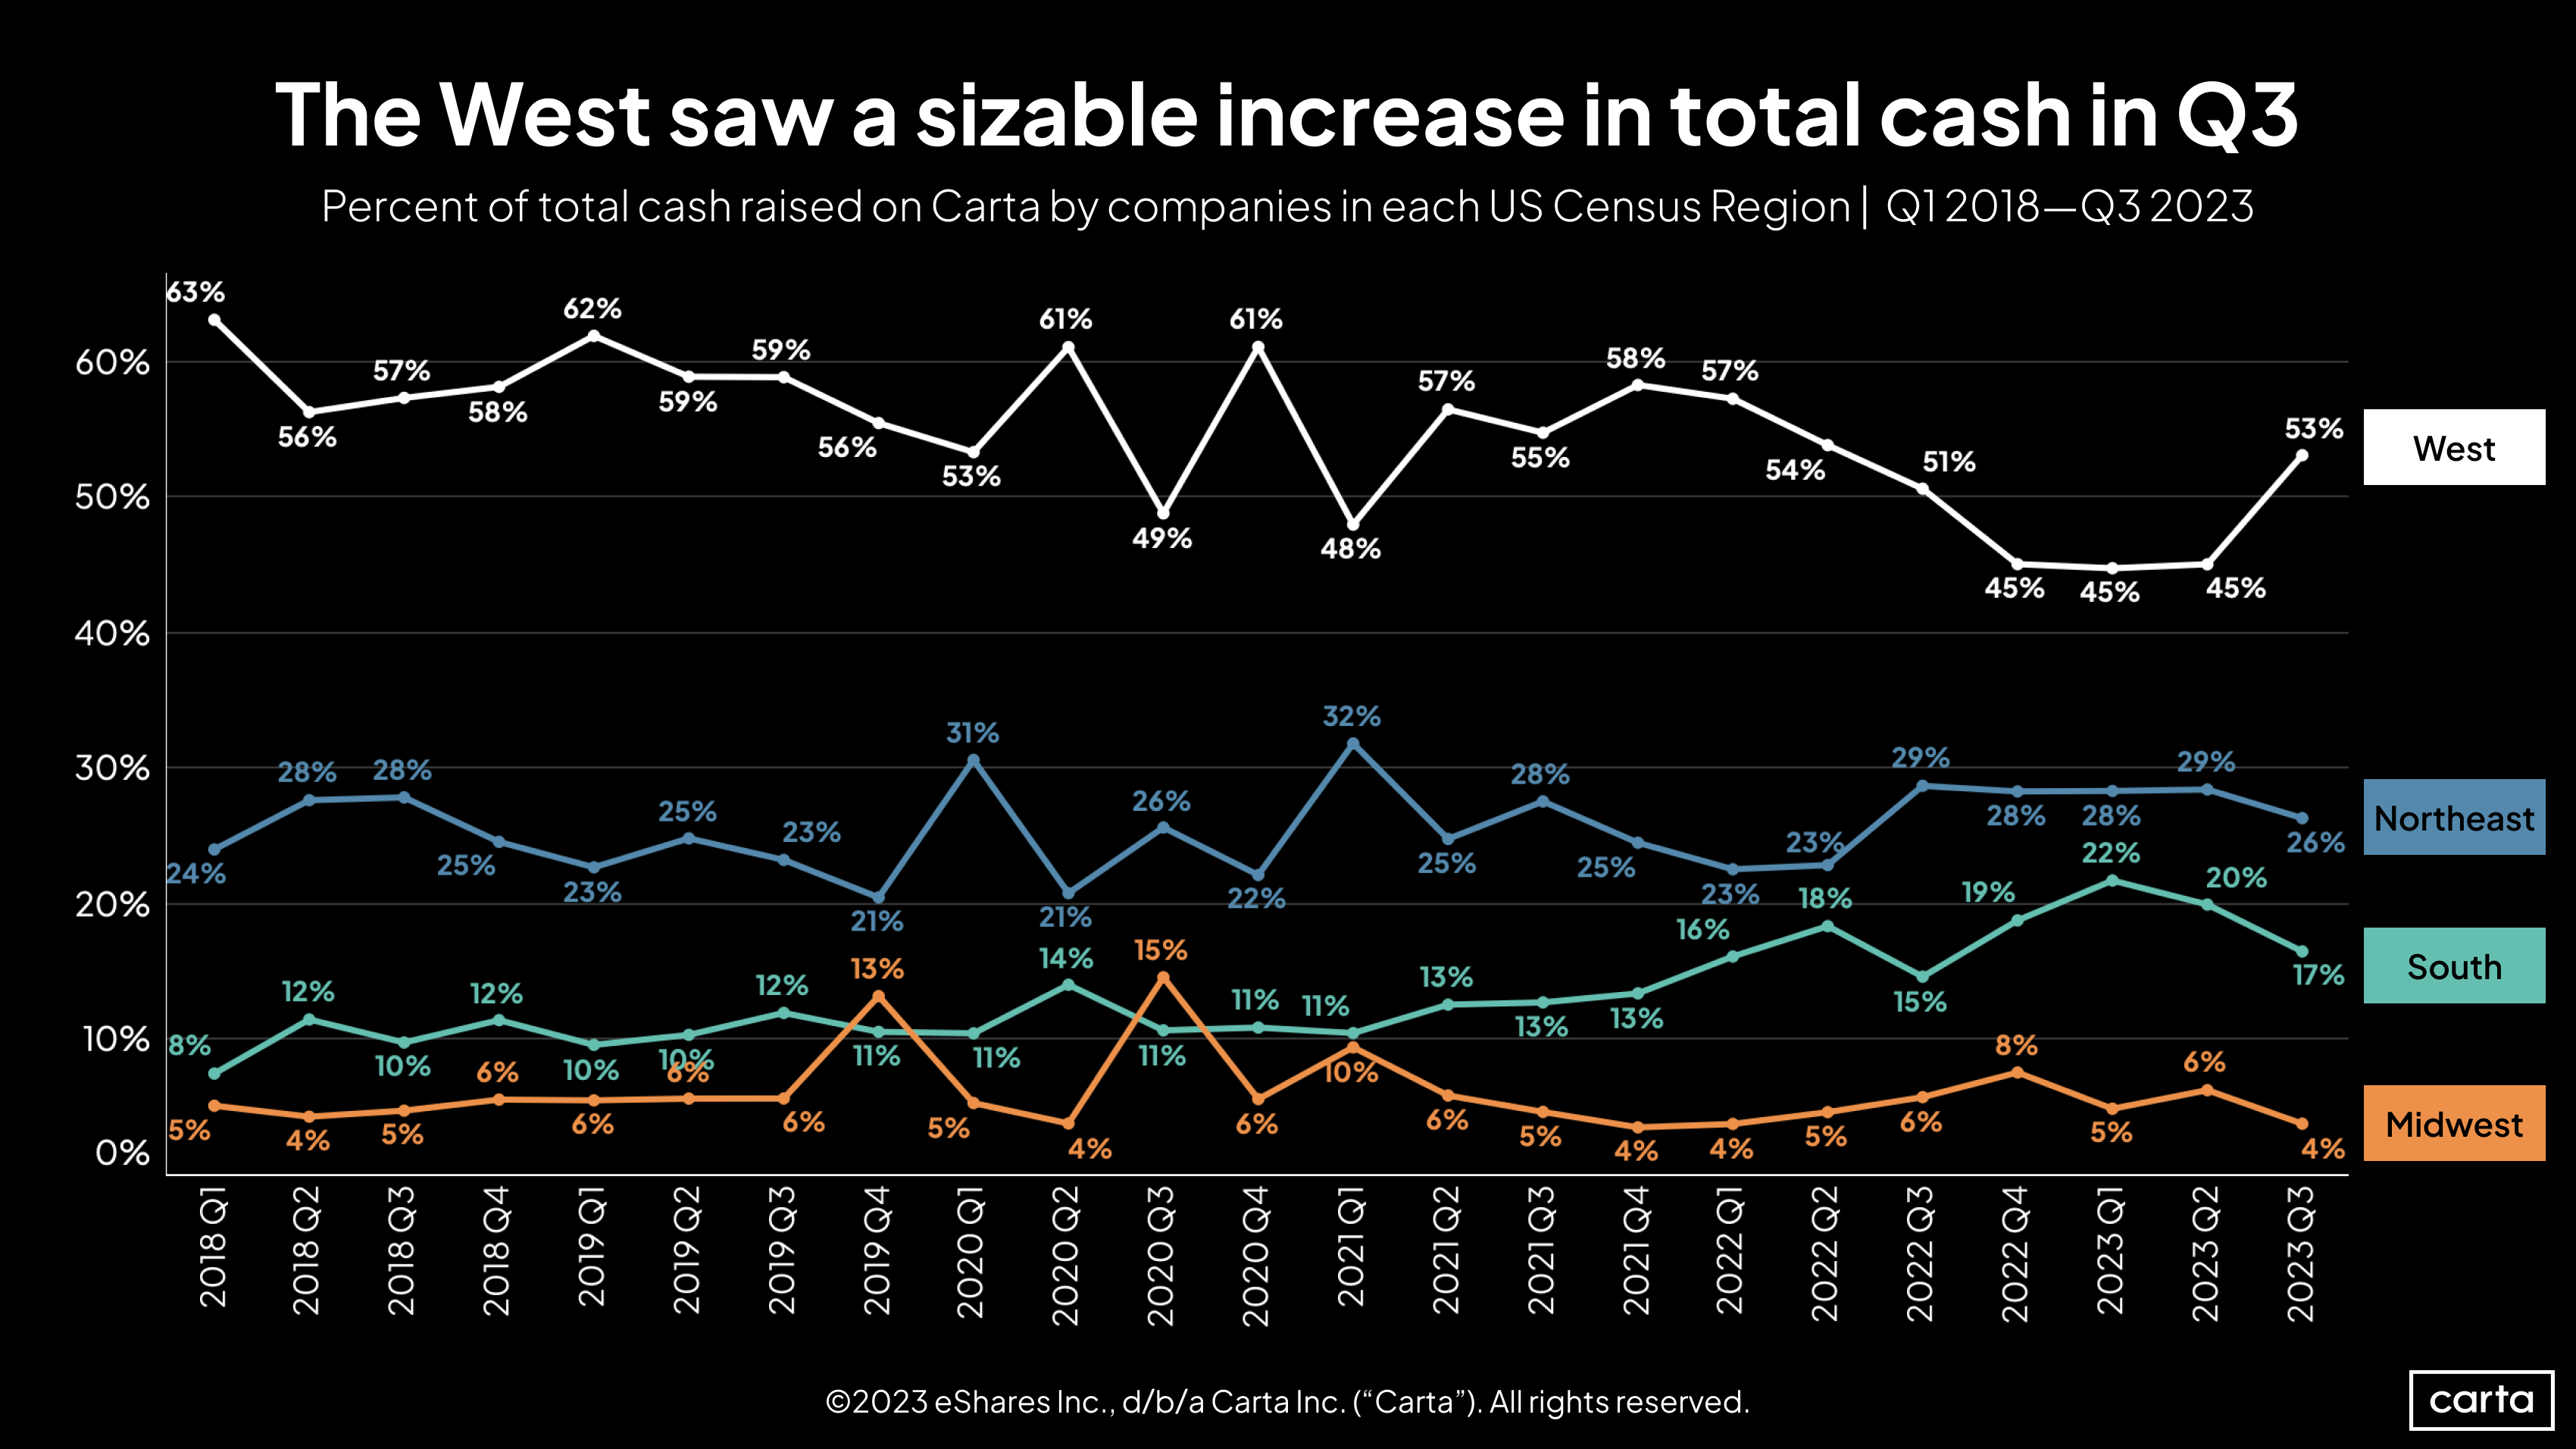
As a result of California’s recovery, the West census region’s share of all venture capital raised in the U.S. rose to 53%, its highest point in the past five quarters. The other three census regions all saw their share of dollars raised decline.
The Midwest’s market share fell from 6% to 4%, equaling its low point of the past six years. The region’s share of VC raised was trending up throughout 2022, reaching 8% in Q4. Since then, the numbers have moved in the opposite direction.
Likewise, the South had begun an ascent in 2021 that saw the region’s share of venture funding begin to rival that of the Northeast. The South’s share of VC fundraising cleared 20% for the first half of the year, but slipped back to 17% this quarter.
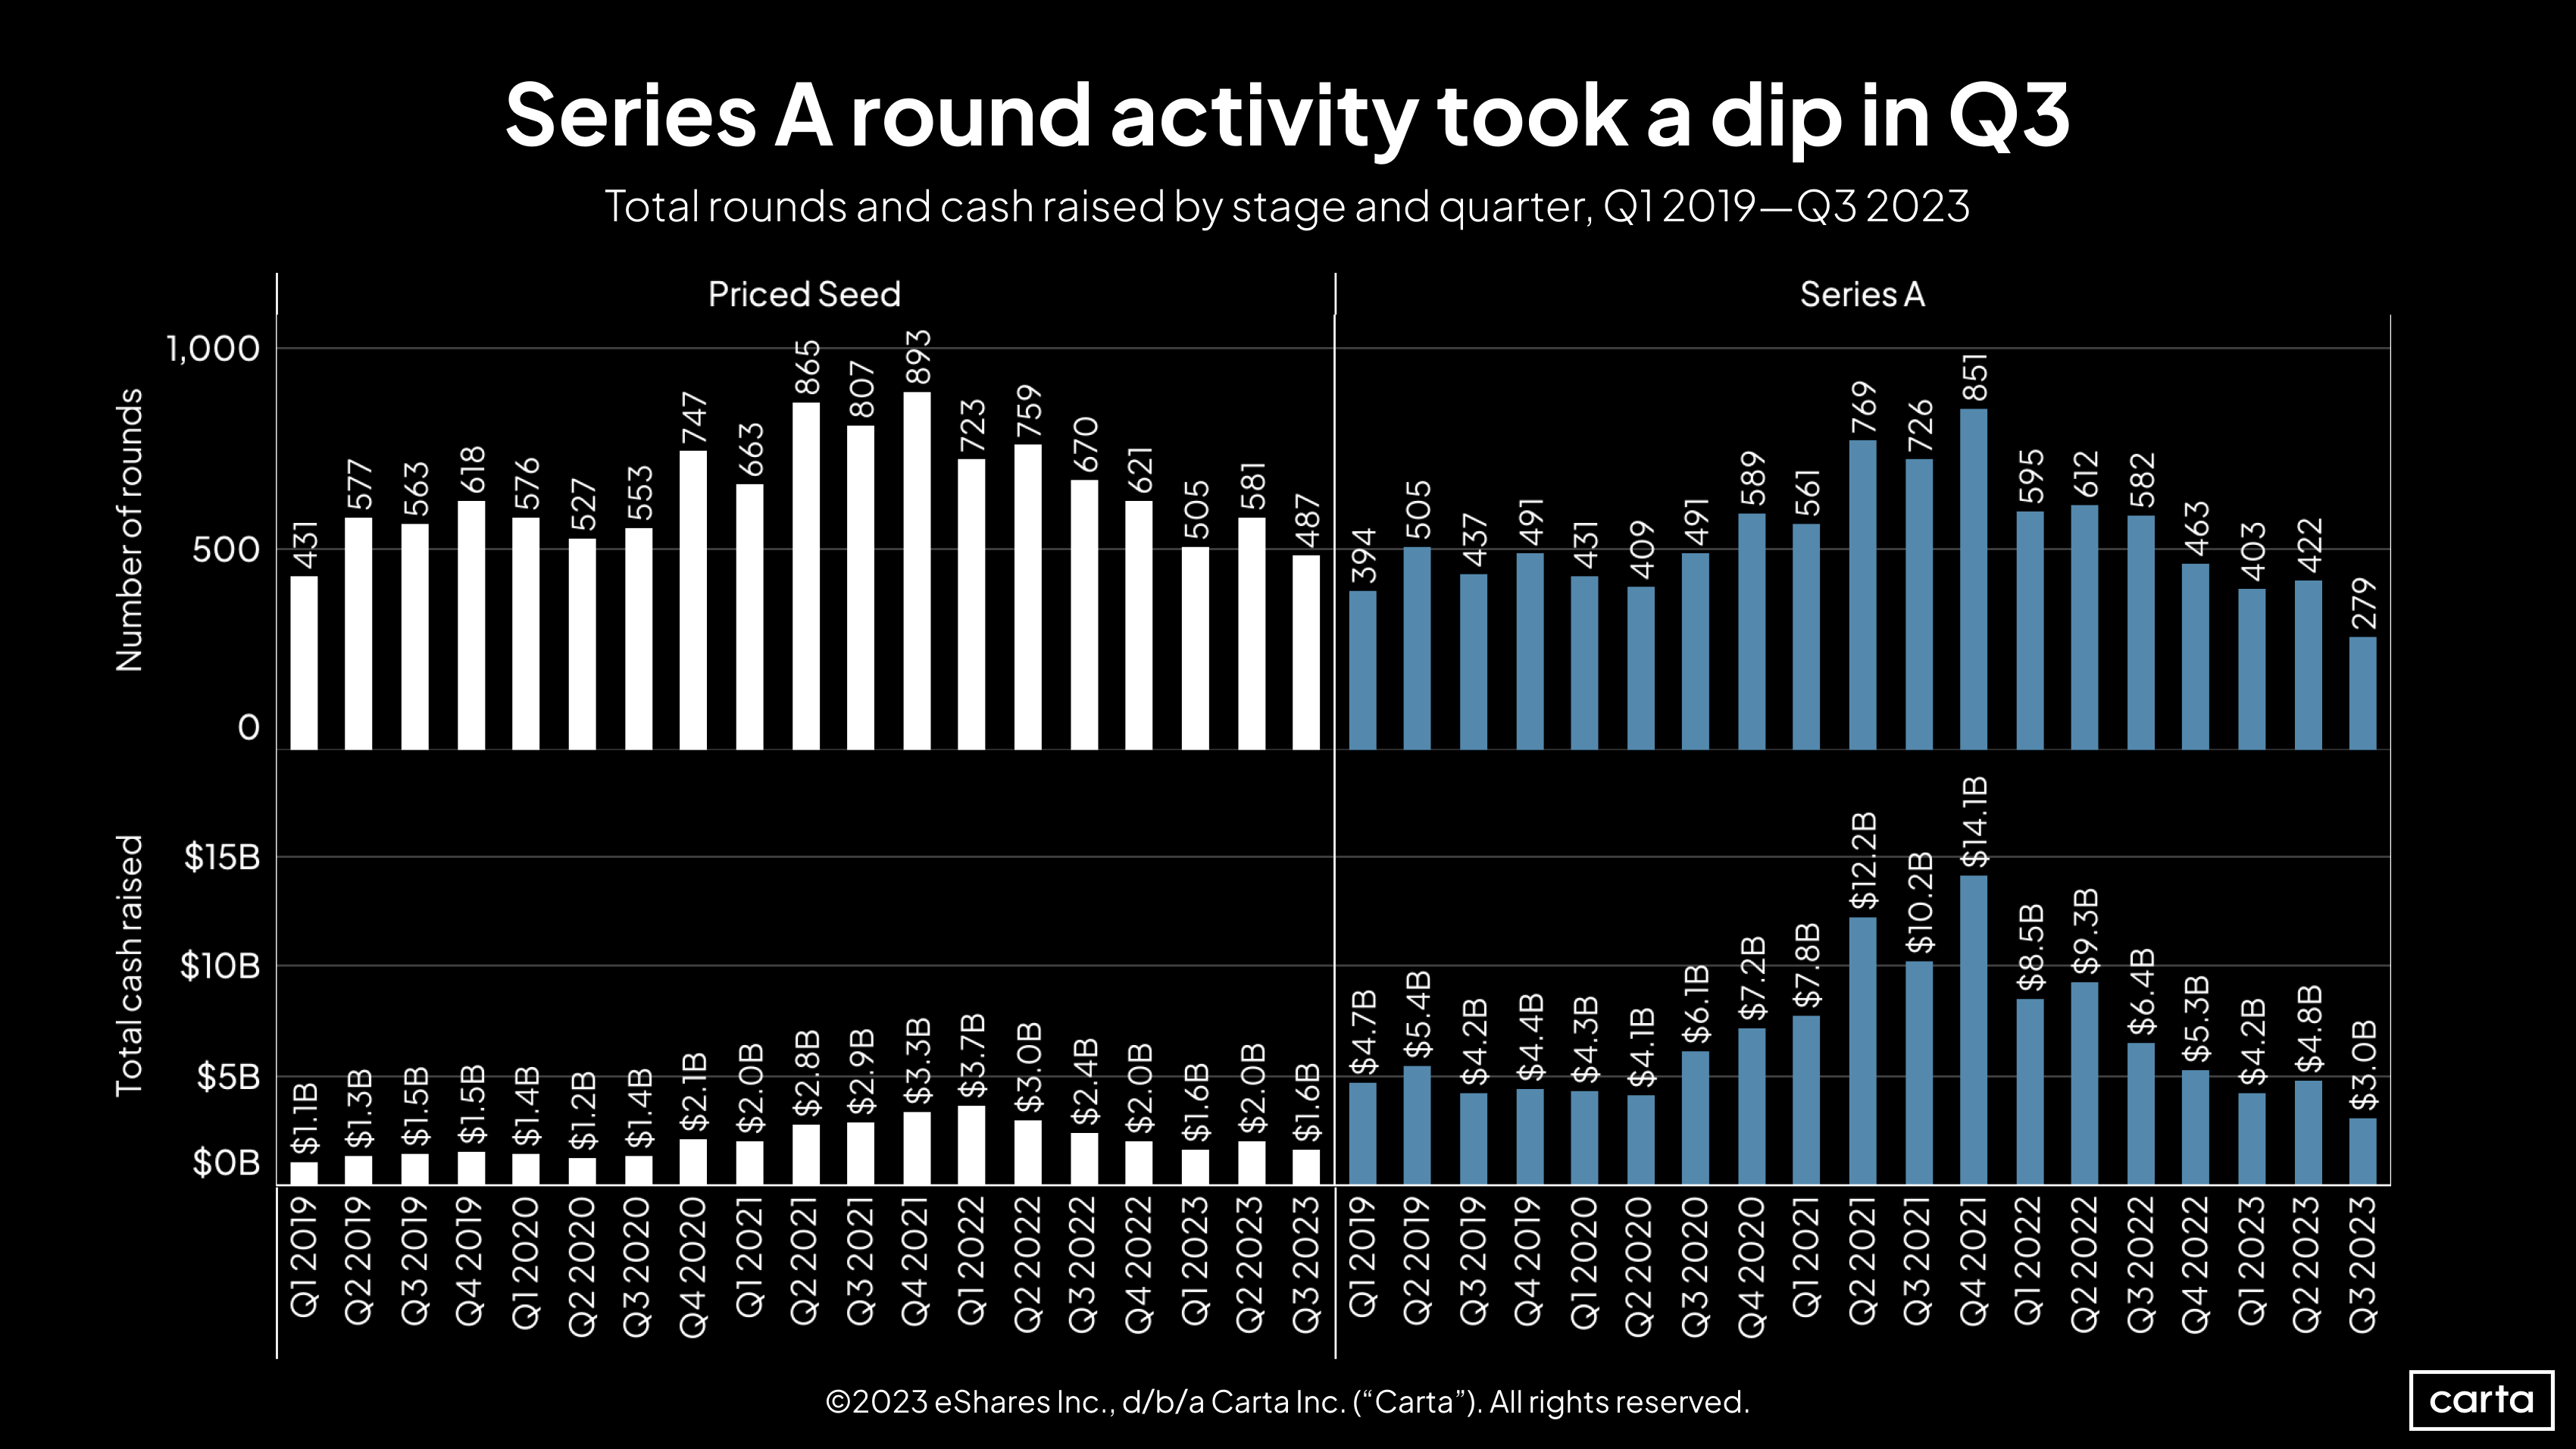
The number of Series A rounds raised on Carta fell by 34% from Q3 to Q2, the largest quarterly decline in terms of percentage since at least the start of 2019. Compared to two years ago, in Q3 2021, the quarterly count of Series A investments has fallen by 62%. This decline in deals creates a major gap in the market for the many startups that raised seed funding in 2021 and 2022 and are back in the market to raise their next round.
The seed market saw a smaller decline in Q3, with deal count falling by 16%. Total cash raised in seed fundings, meanwhile, fell by 20% in Q3, to $1.6 billion. That’s tied for the smallest sum in the past three years.
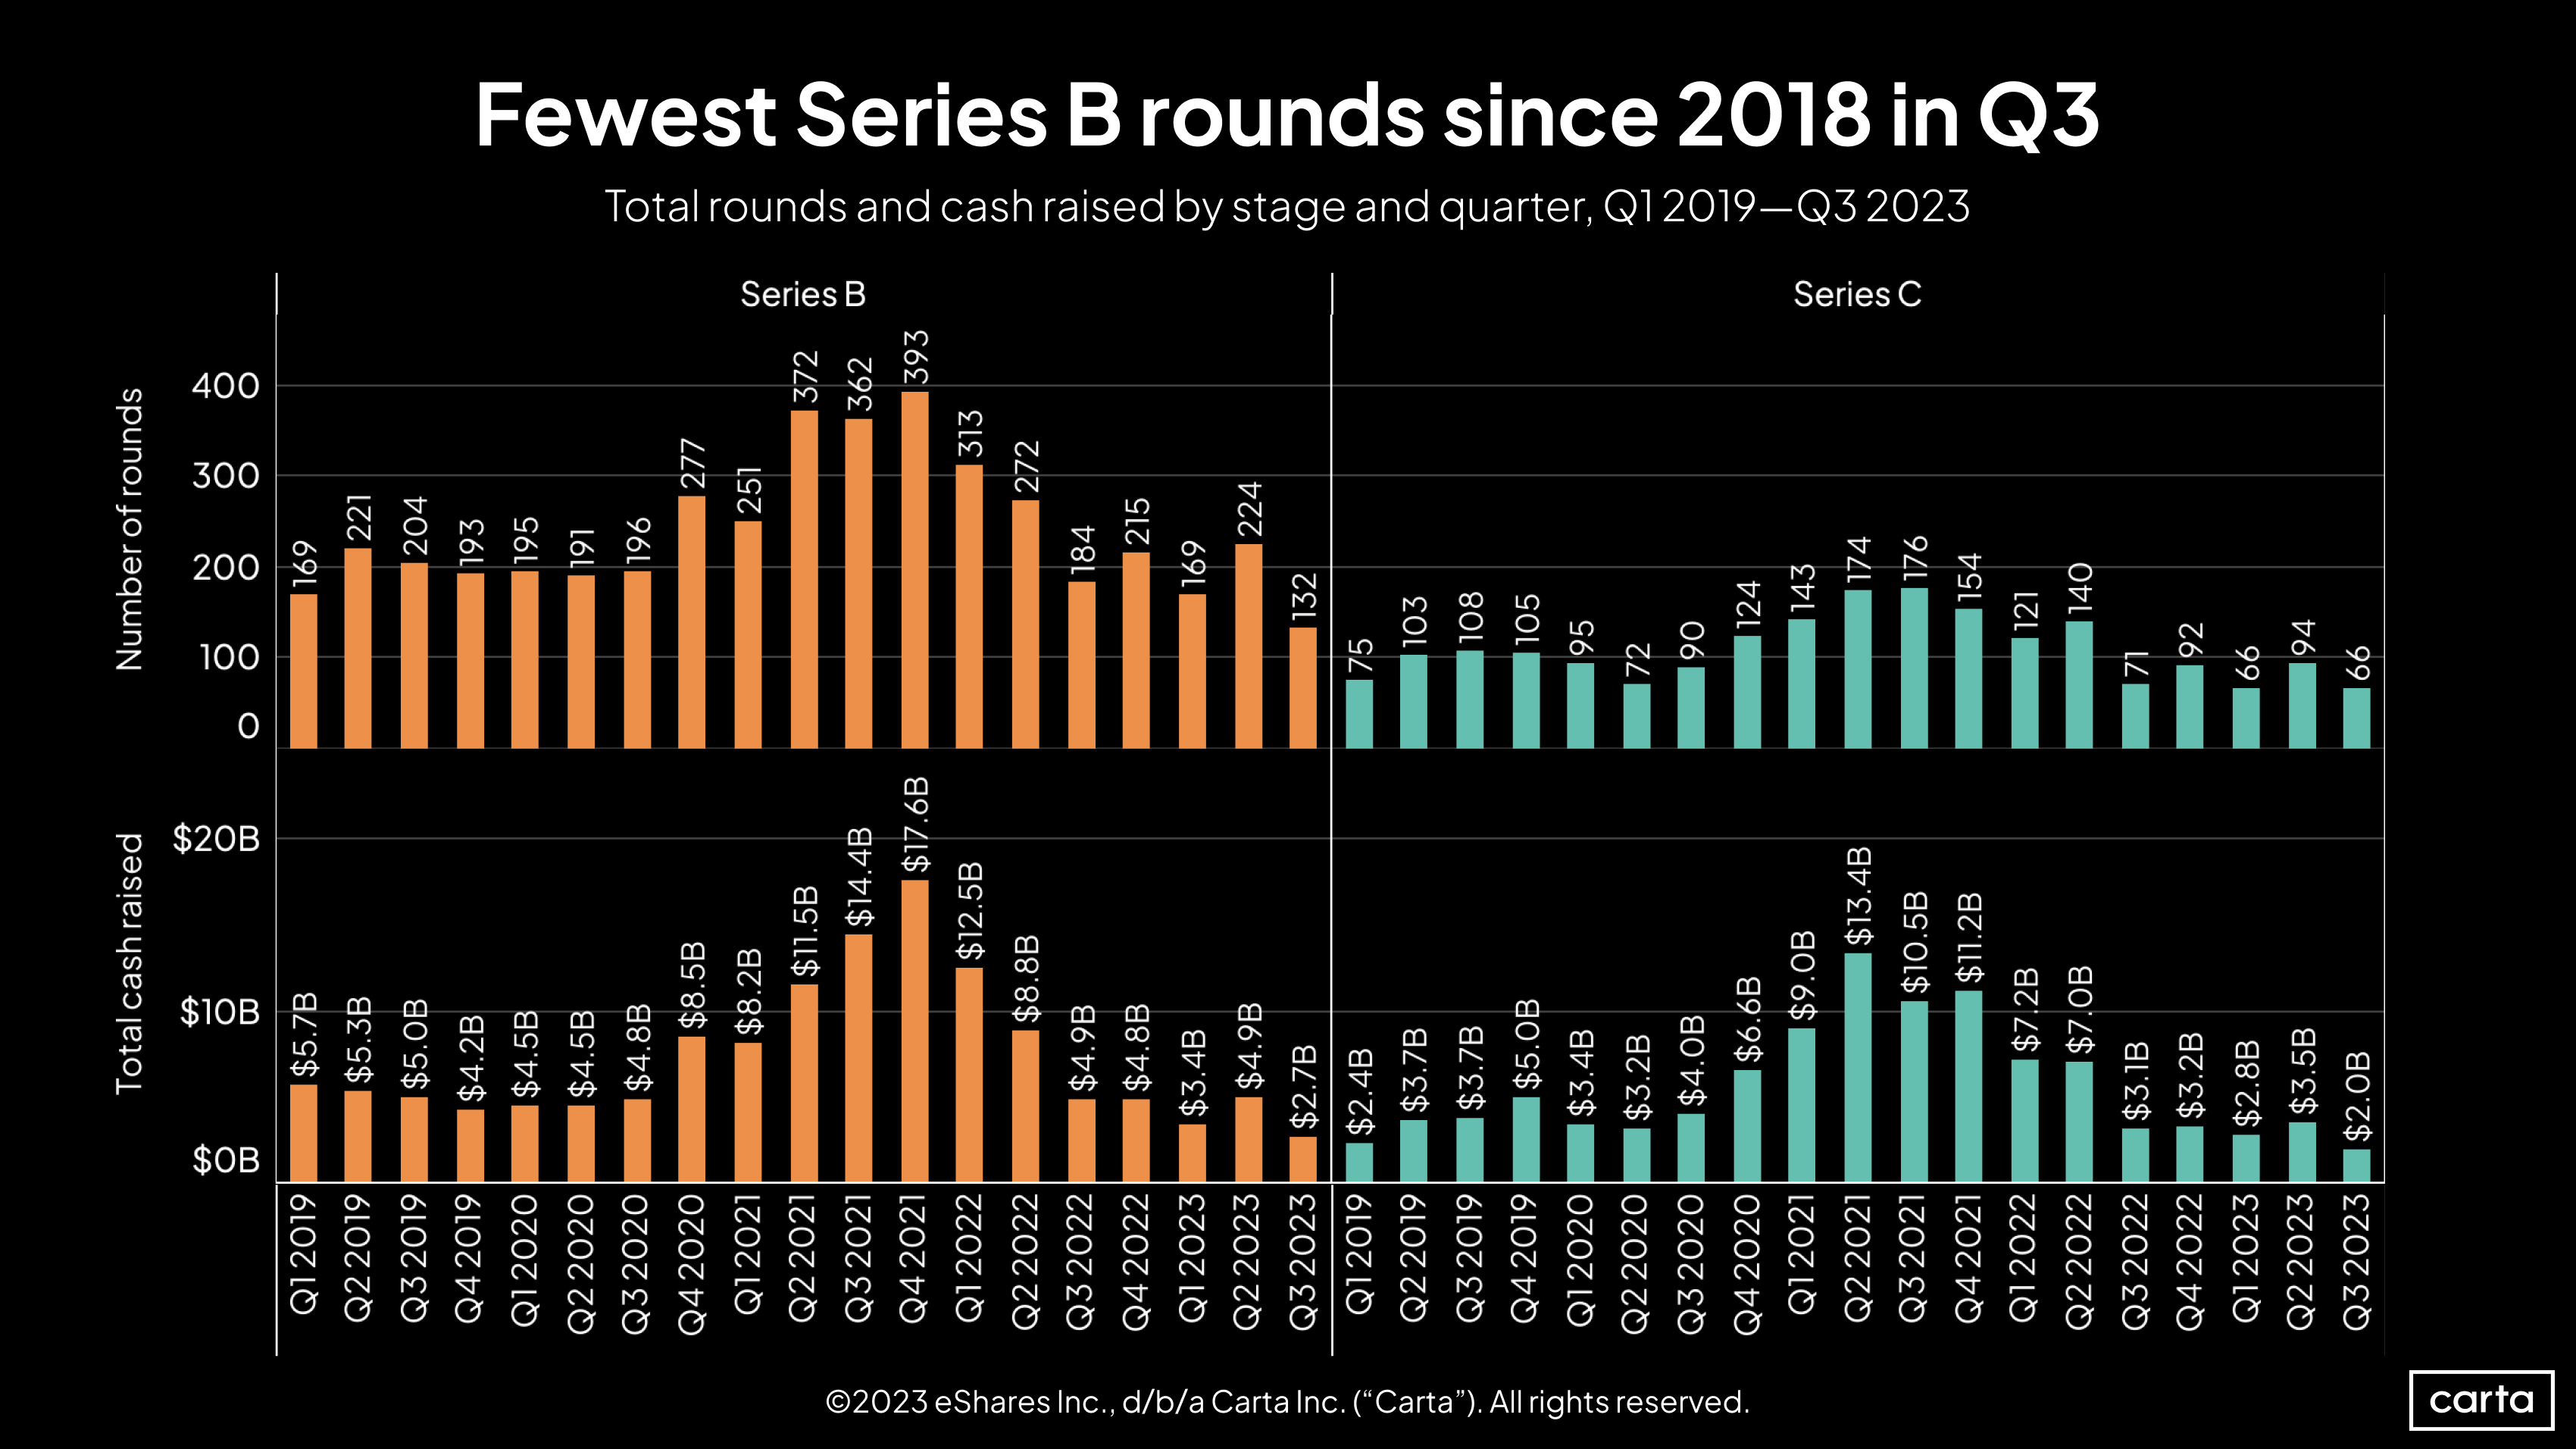
The plunge in deal count at Series B was even more pronounced than at Series A, with Q3’s total of 132 transactions representing a 41% quarterly decline. Cash raised at Series B fell by 45%, down to $2.7 billion, the lowest total of the past five years. In four of the past five quarters, the amount of cash raised by Series A startups on Carta has exceeded the sum raised by Series B startups, an inversion of the historical norm.
Deal count at Series C was 30% lower in Q3 than it was in Q2. Volatility at Series C has been a feature of the downturn: In each of the past five quarters, Series C deal count has either increased or decreased by at least 25%.
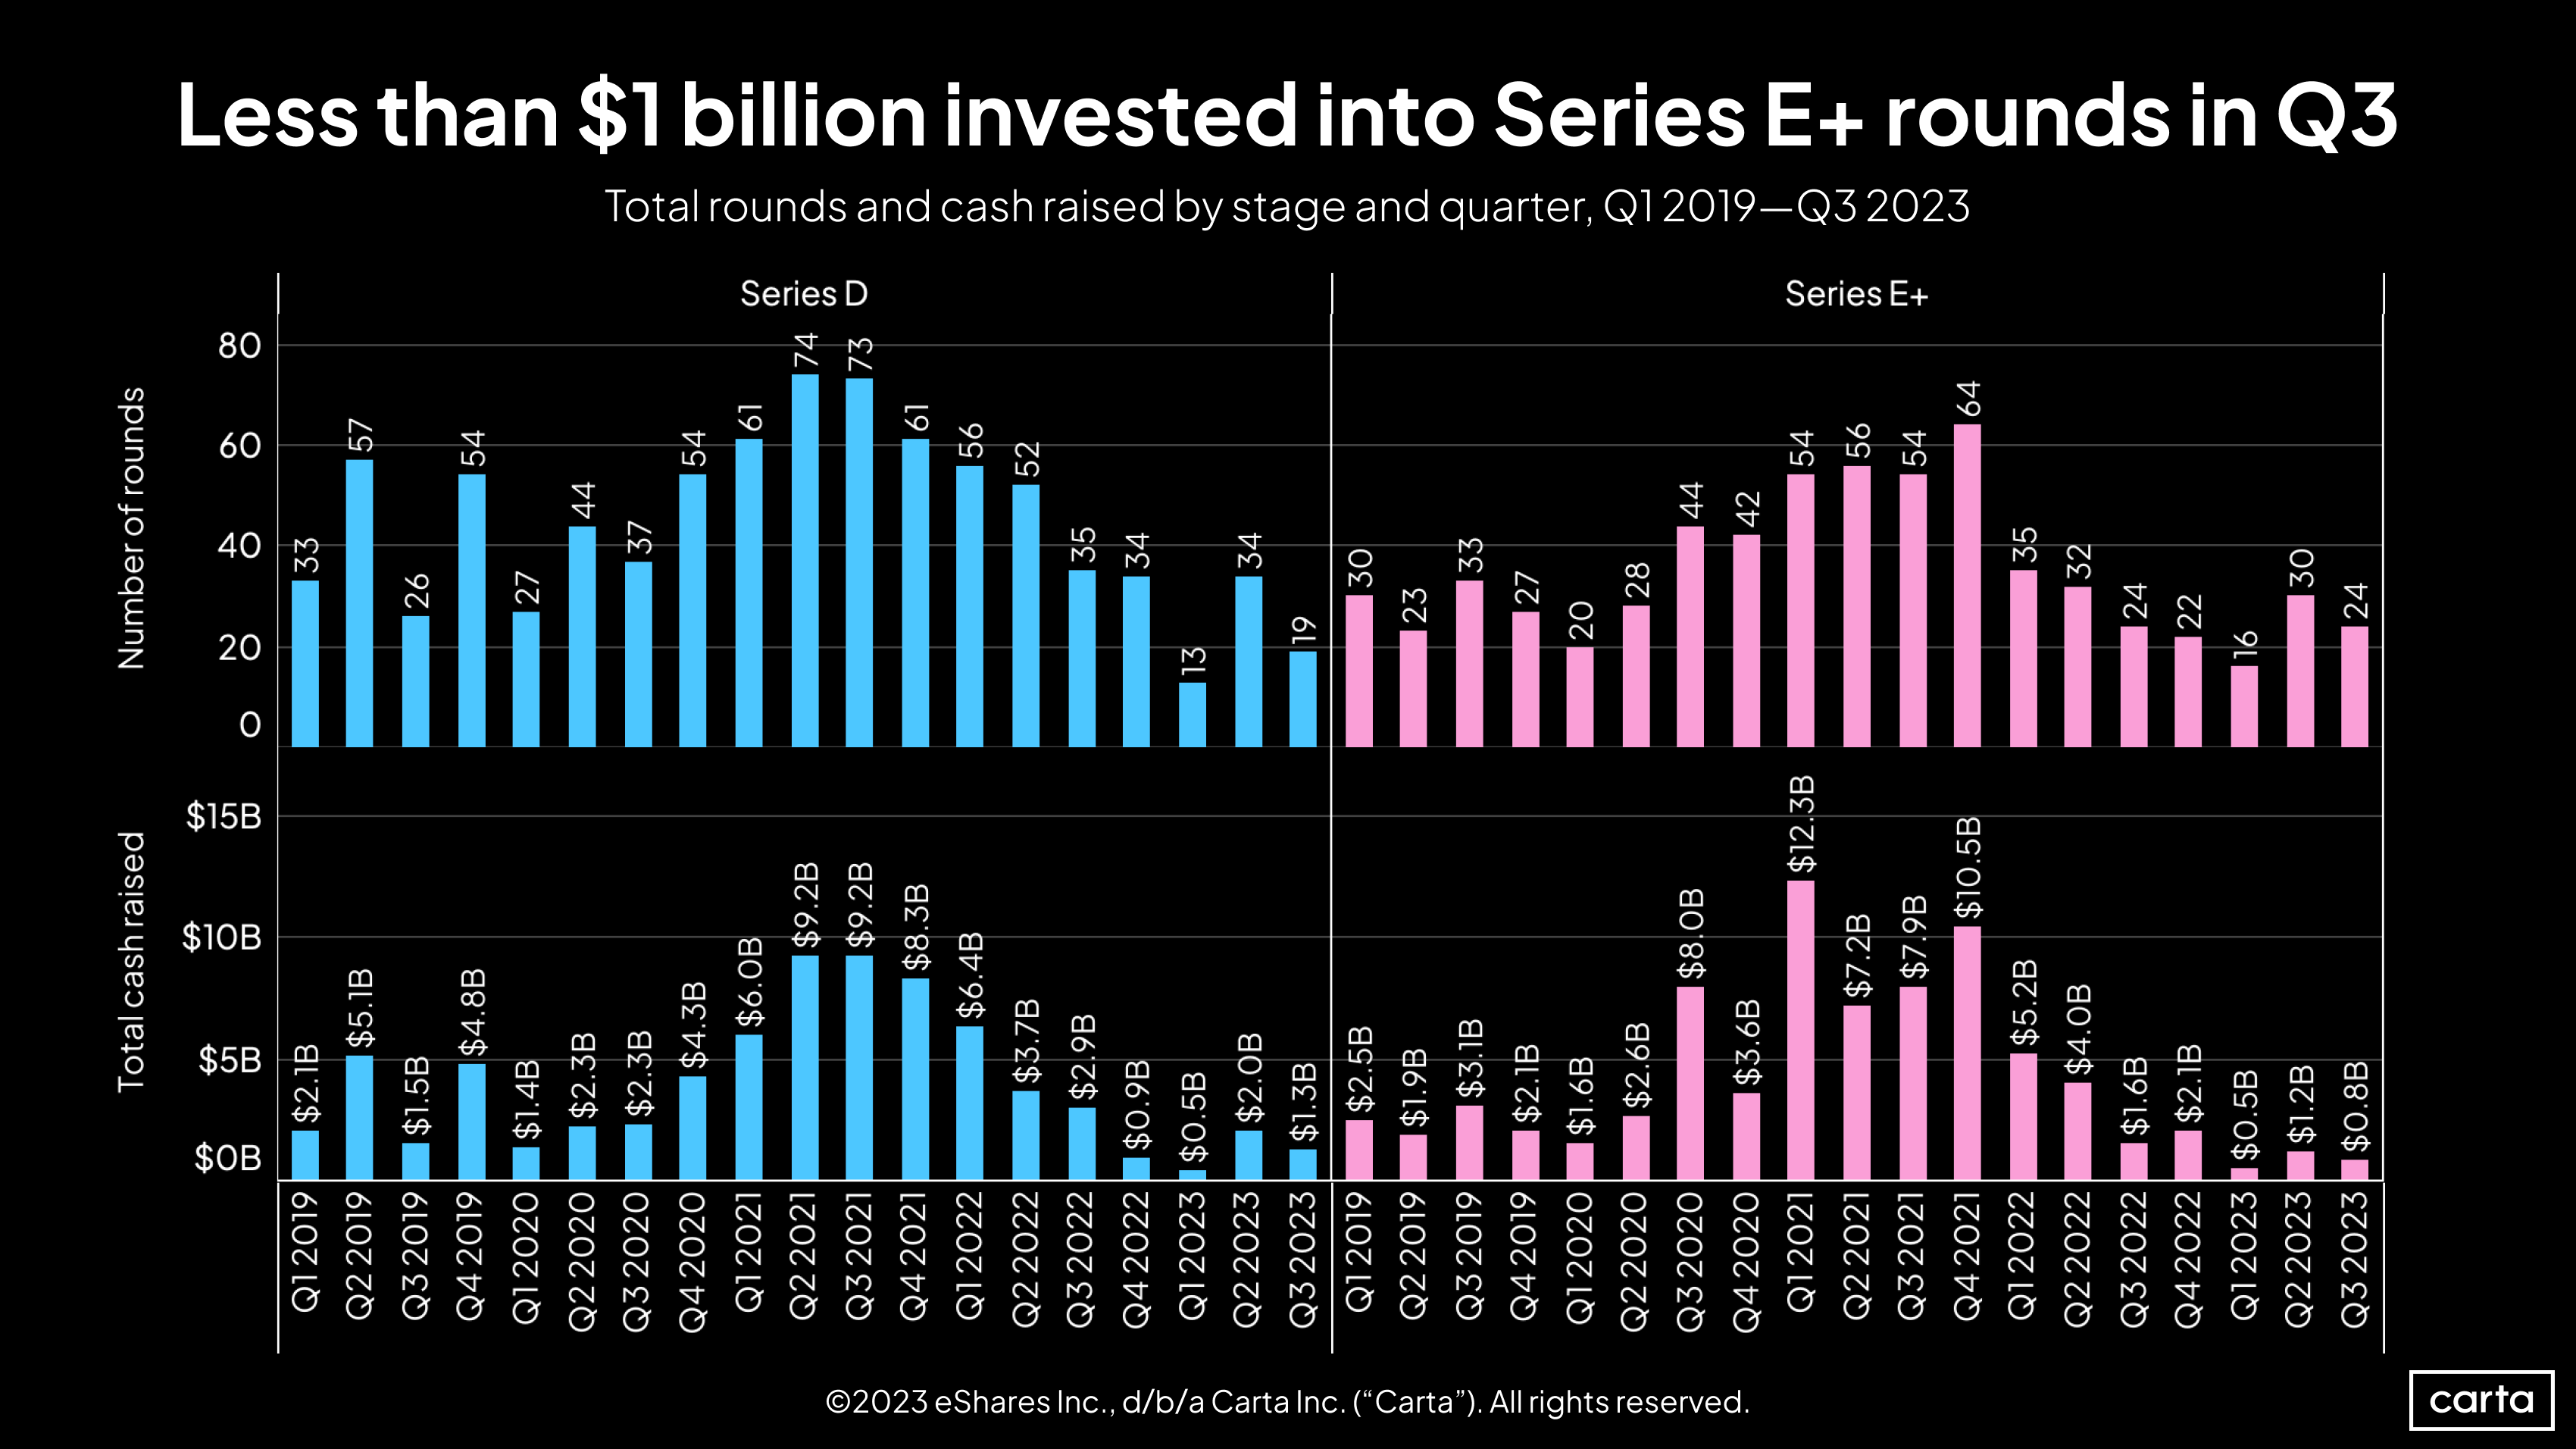
The overarching trend of fewer deals and less cash raised also carried over to the latest stages of the venture life cycle. Deal count in Q3 fell by 44% at Series D and 20% at Series E+, while cash raised fell by 35% at Series D and 33% at Series E+.
The slump in late-stage activity over the past two years has mirrored a major decline in the IPO market. The number of U.S. IPOs fell by 82% from 2021 to 2022, and it’s on pace to tick up only slightly in 2023. This correlation makes sense: Investors in late-stage companies are always thinking about a potential exit, and IPOs are one of their major exit pathways.
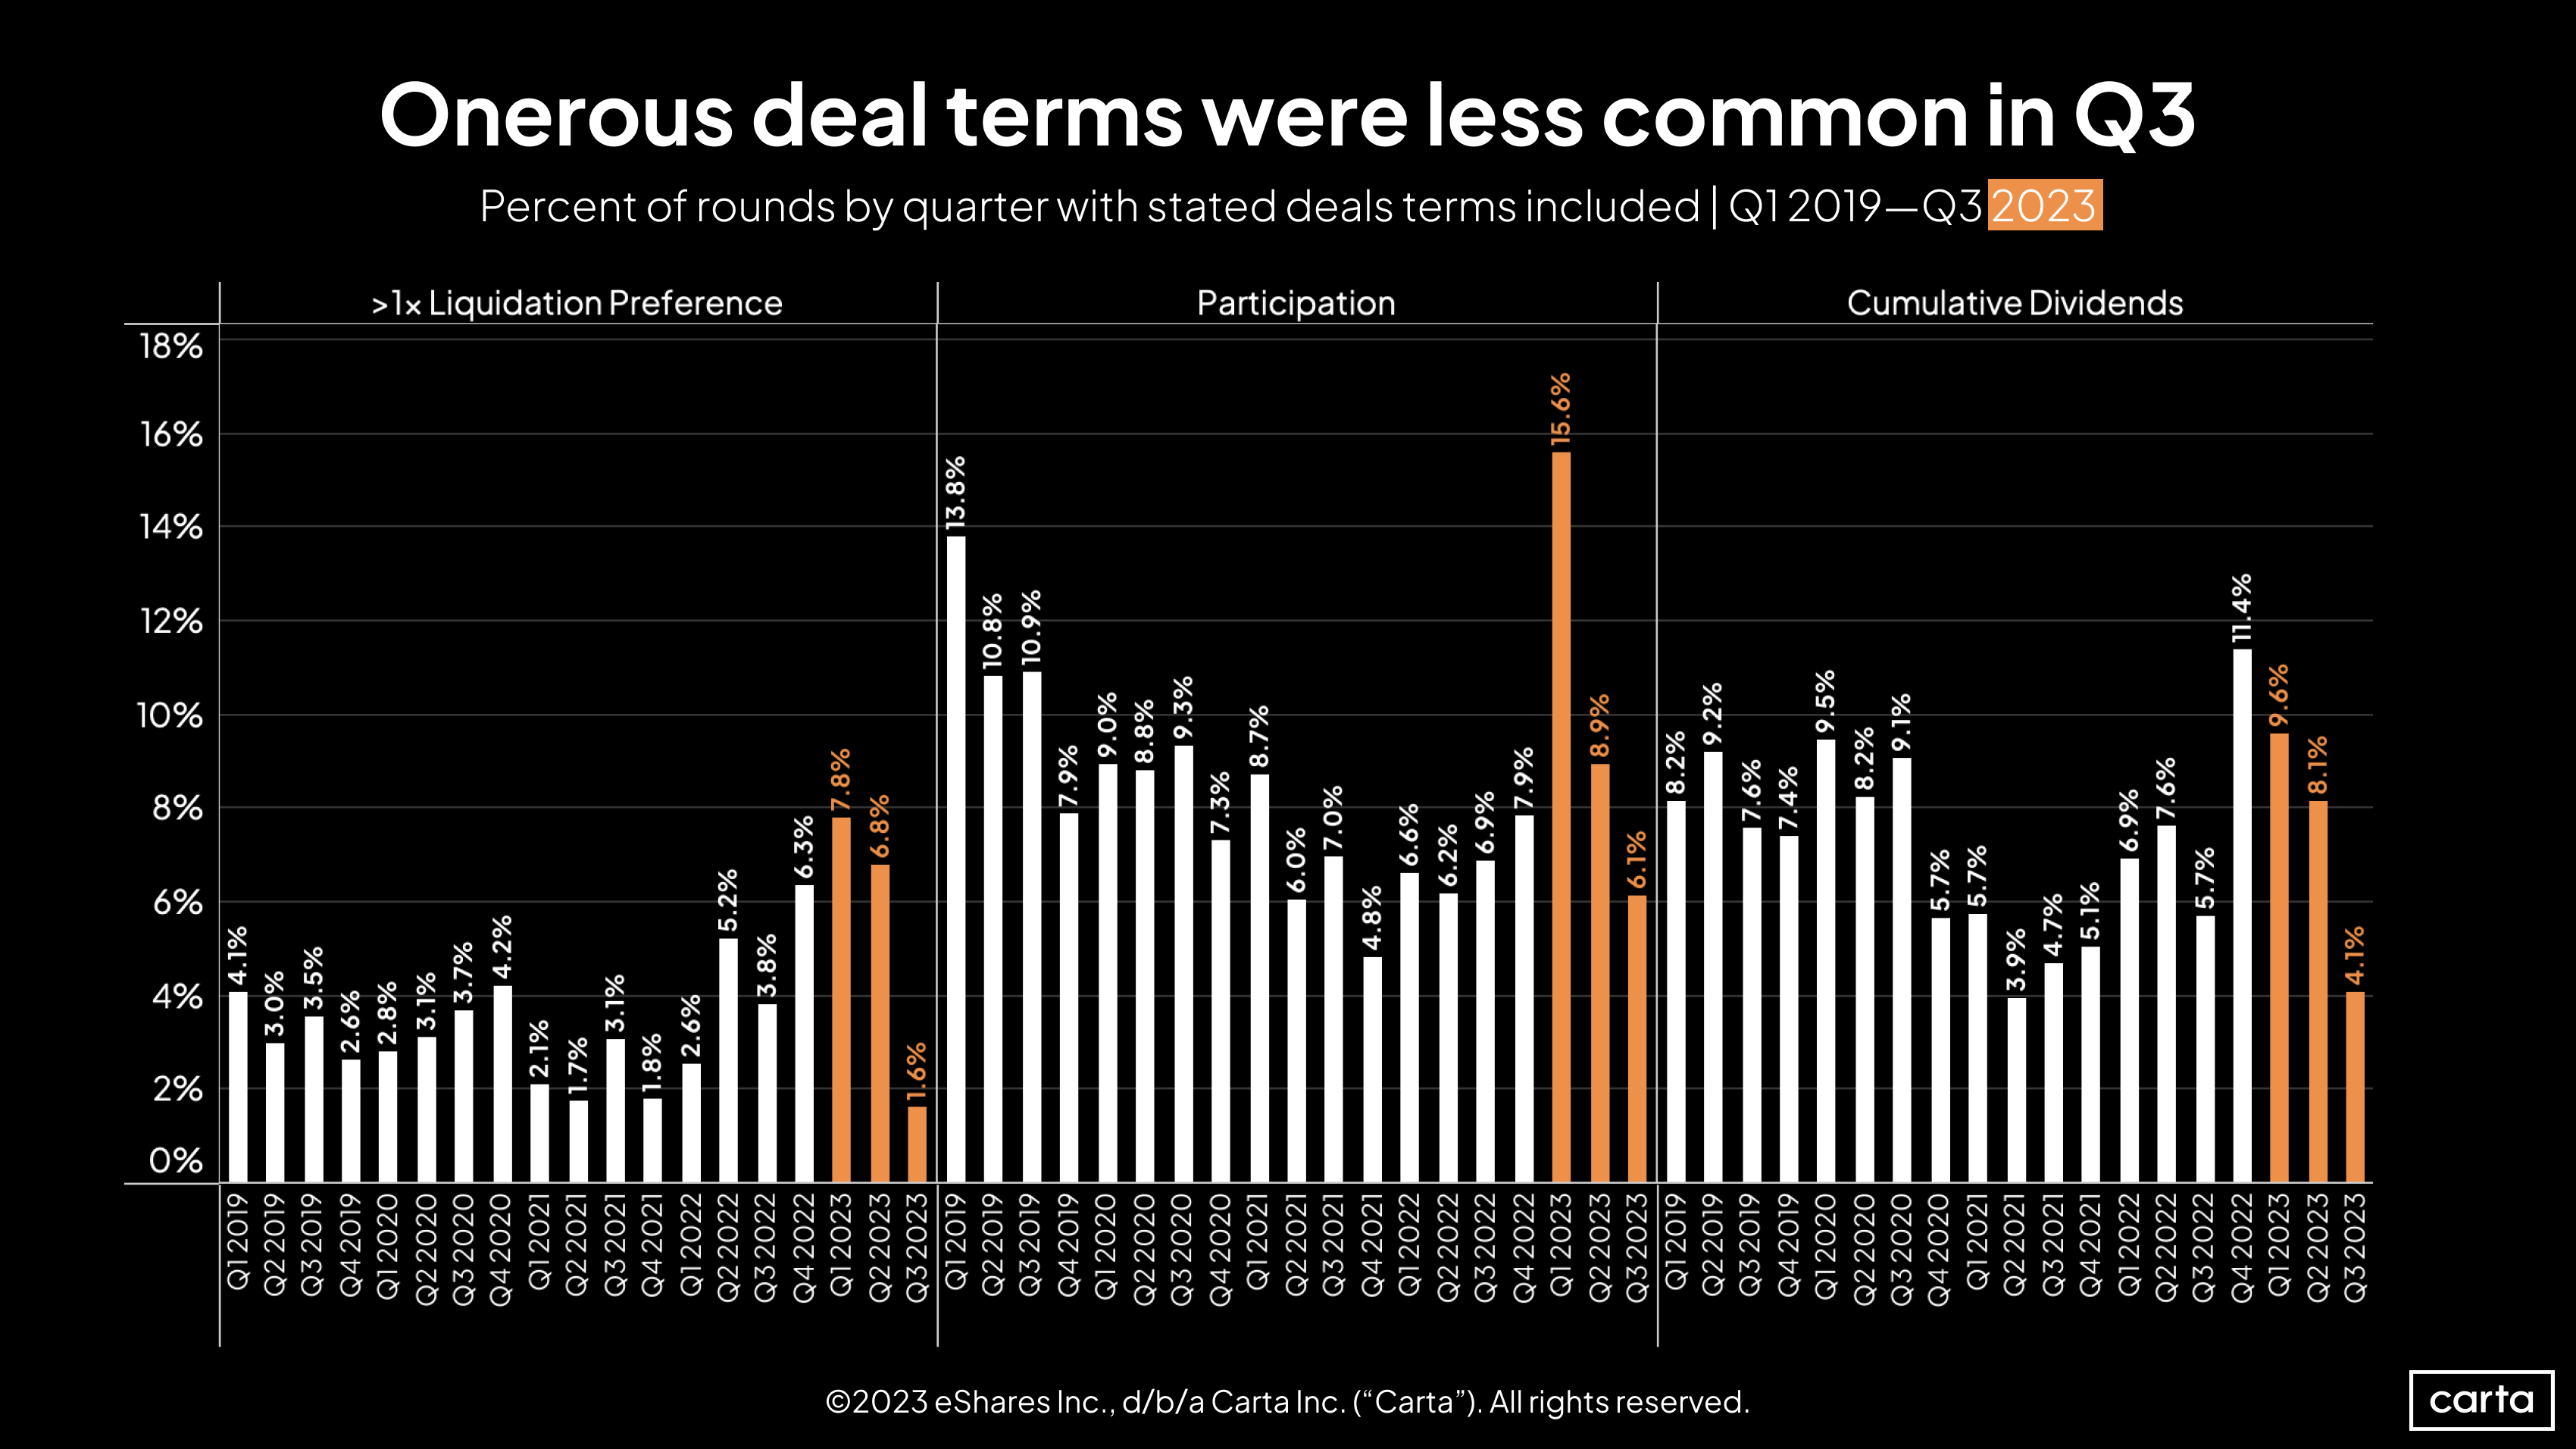
Investor-friendly deal terms like liquidation preferences, participating preferred stock, and cumulative dividends had been on the rise in recent quarters, as VCs used the leverage created by the venture slowdown to both protect against downside risk and increase their upside. But Q3 was a different story.
The percentage of deals on Carta involving non-standard liquidation preferences fell to 1.6%, the lowest rate in the past five years. Just two quarters ago, that figure sat at a five-year high of 7.8%. The rate of deals involving cumulative dividends declined to its second-lowest point of the past five years, and the rate of deals involving participation fell to its lowest point in the past seven quarters.
Fundraising & valuations
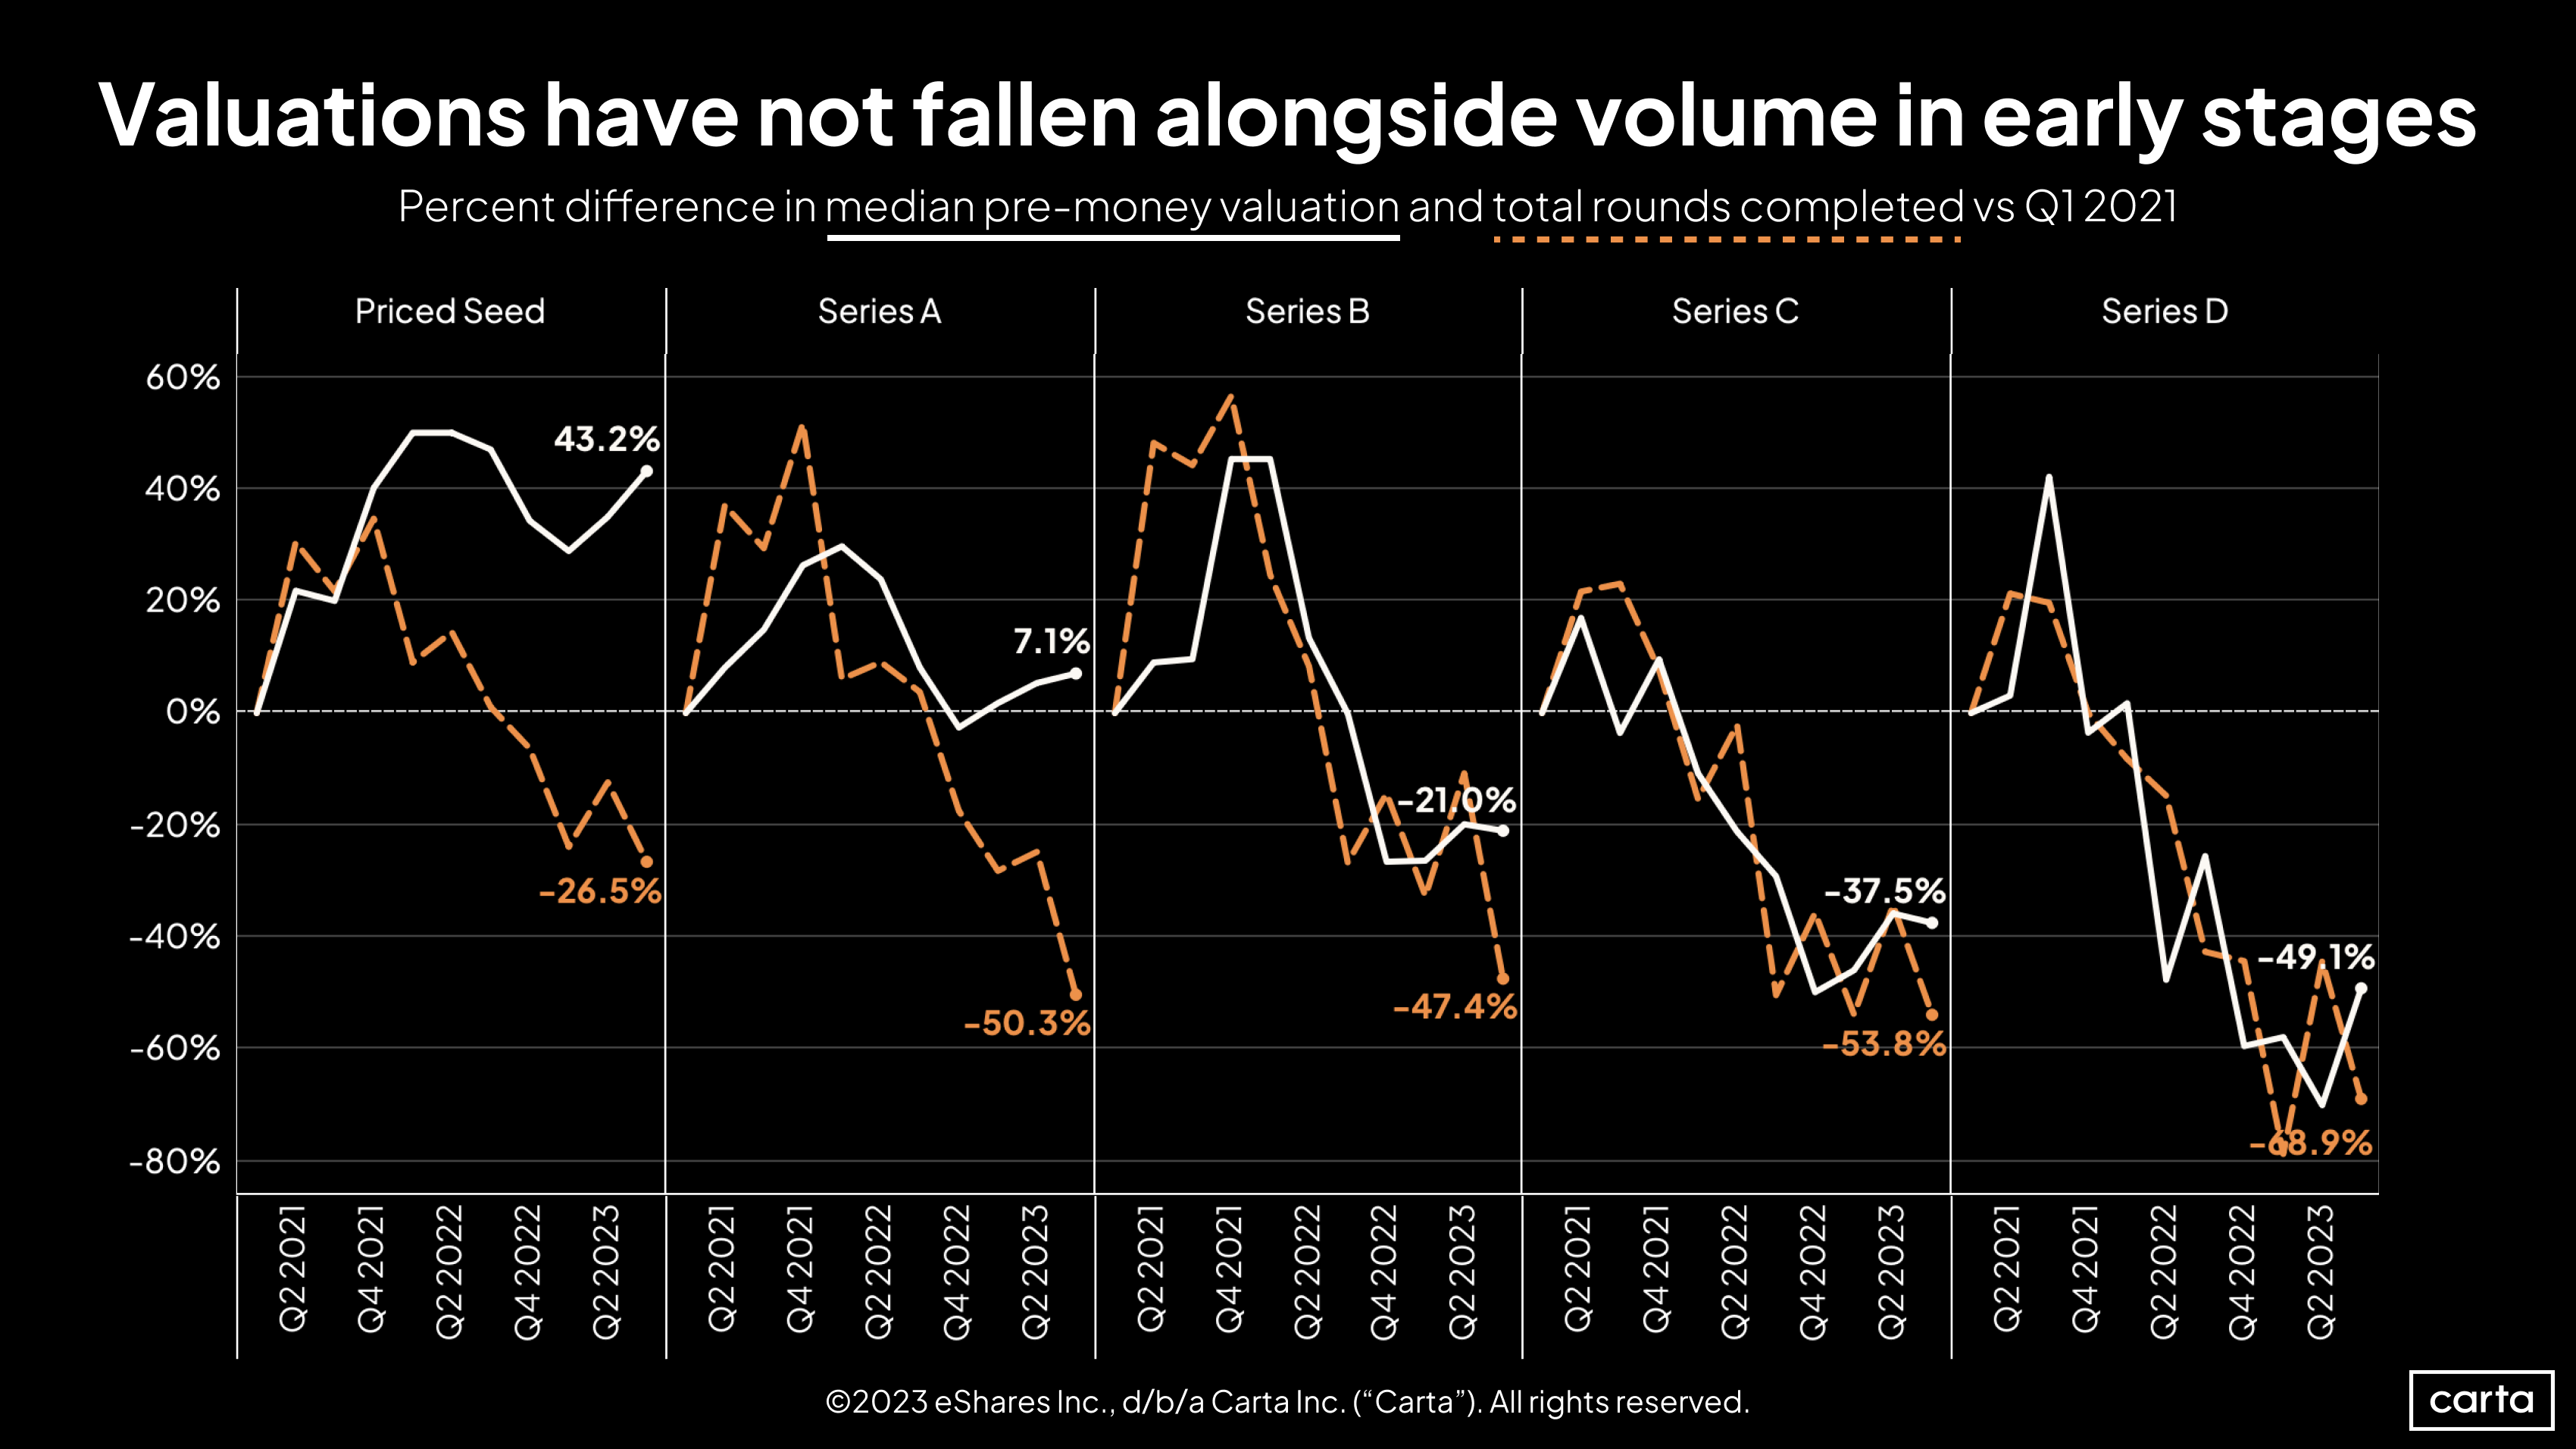
At Series B, Series C, and Series D, median pre-money valuations and deal count have declined roughly in unison over the past two years. At seed and Series A, however, things look quite different. There, valuations have actually trended up since Q1 2021, while round count has fallen significantly.
The pairing of decreasing deal count with sharply falling valuations tells one story: Late-stage investors are finding fewer attractive companies to back, and few (if any) companies are immune from the realities of a valuation reset.
Lower deal counts combined with rising valuations tells us a different story: Early-stage investors are finding fewer attractive companies to back, but the most attractive of the bunch are still able to command premium valuations.
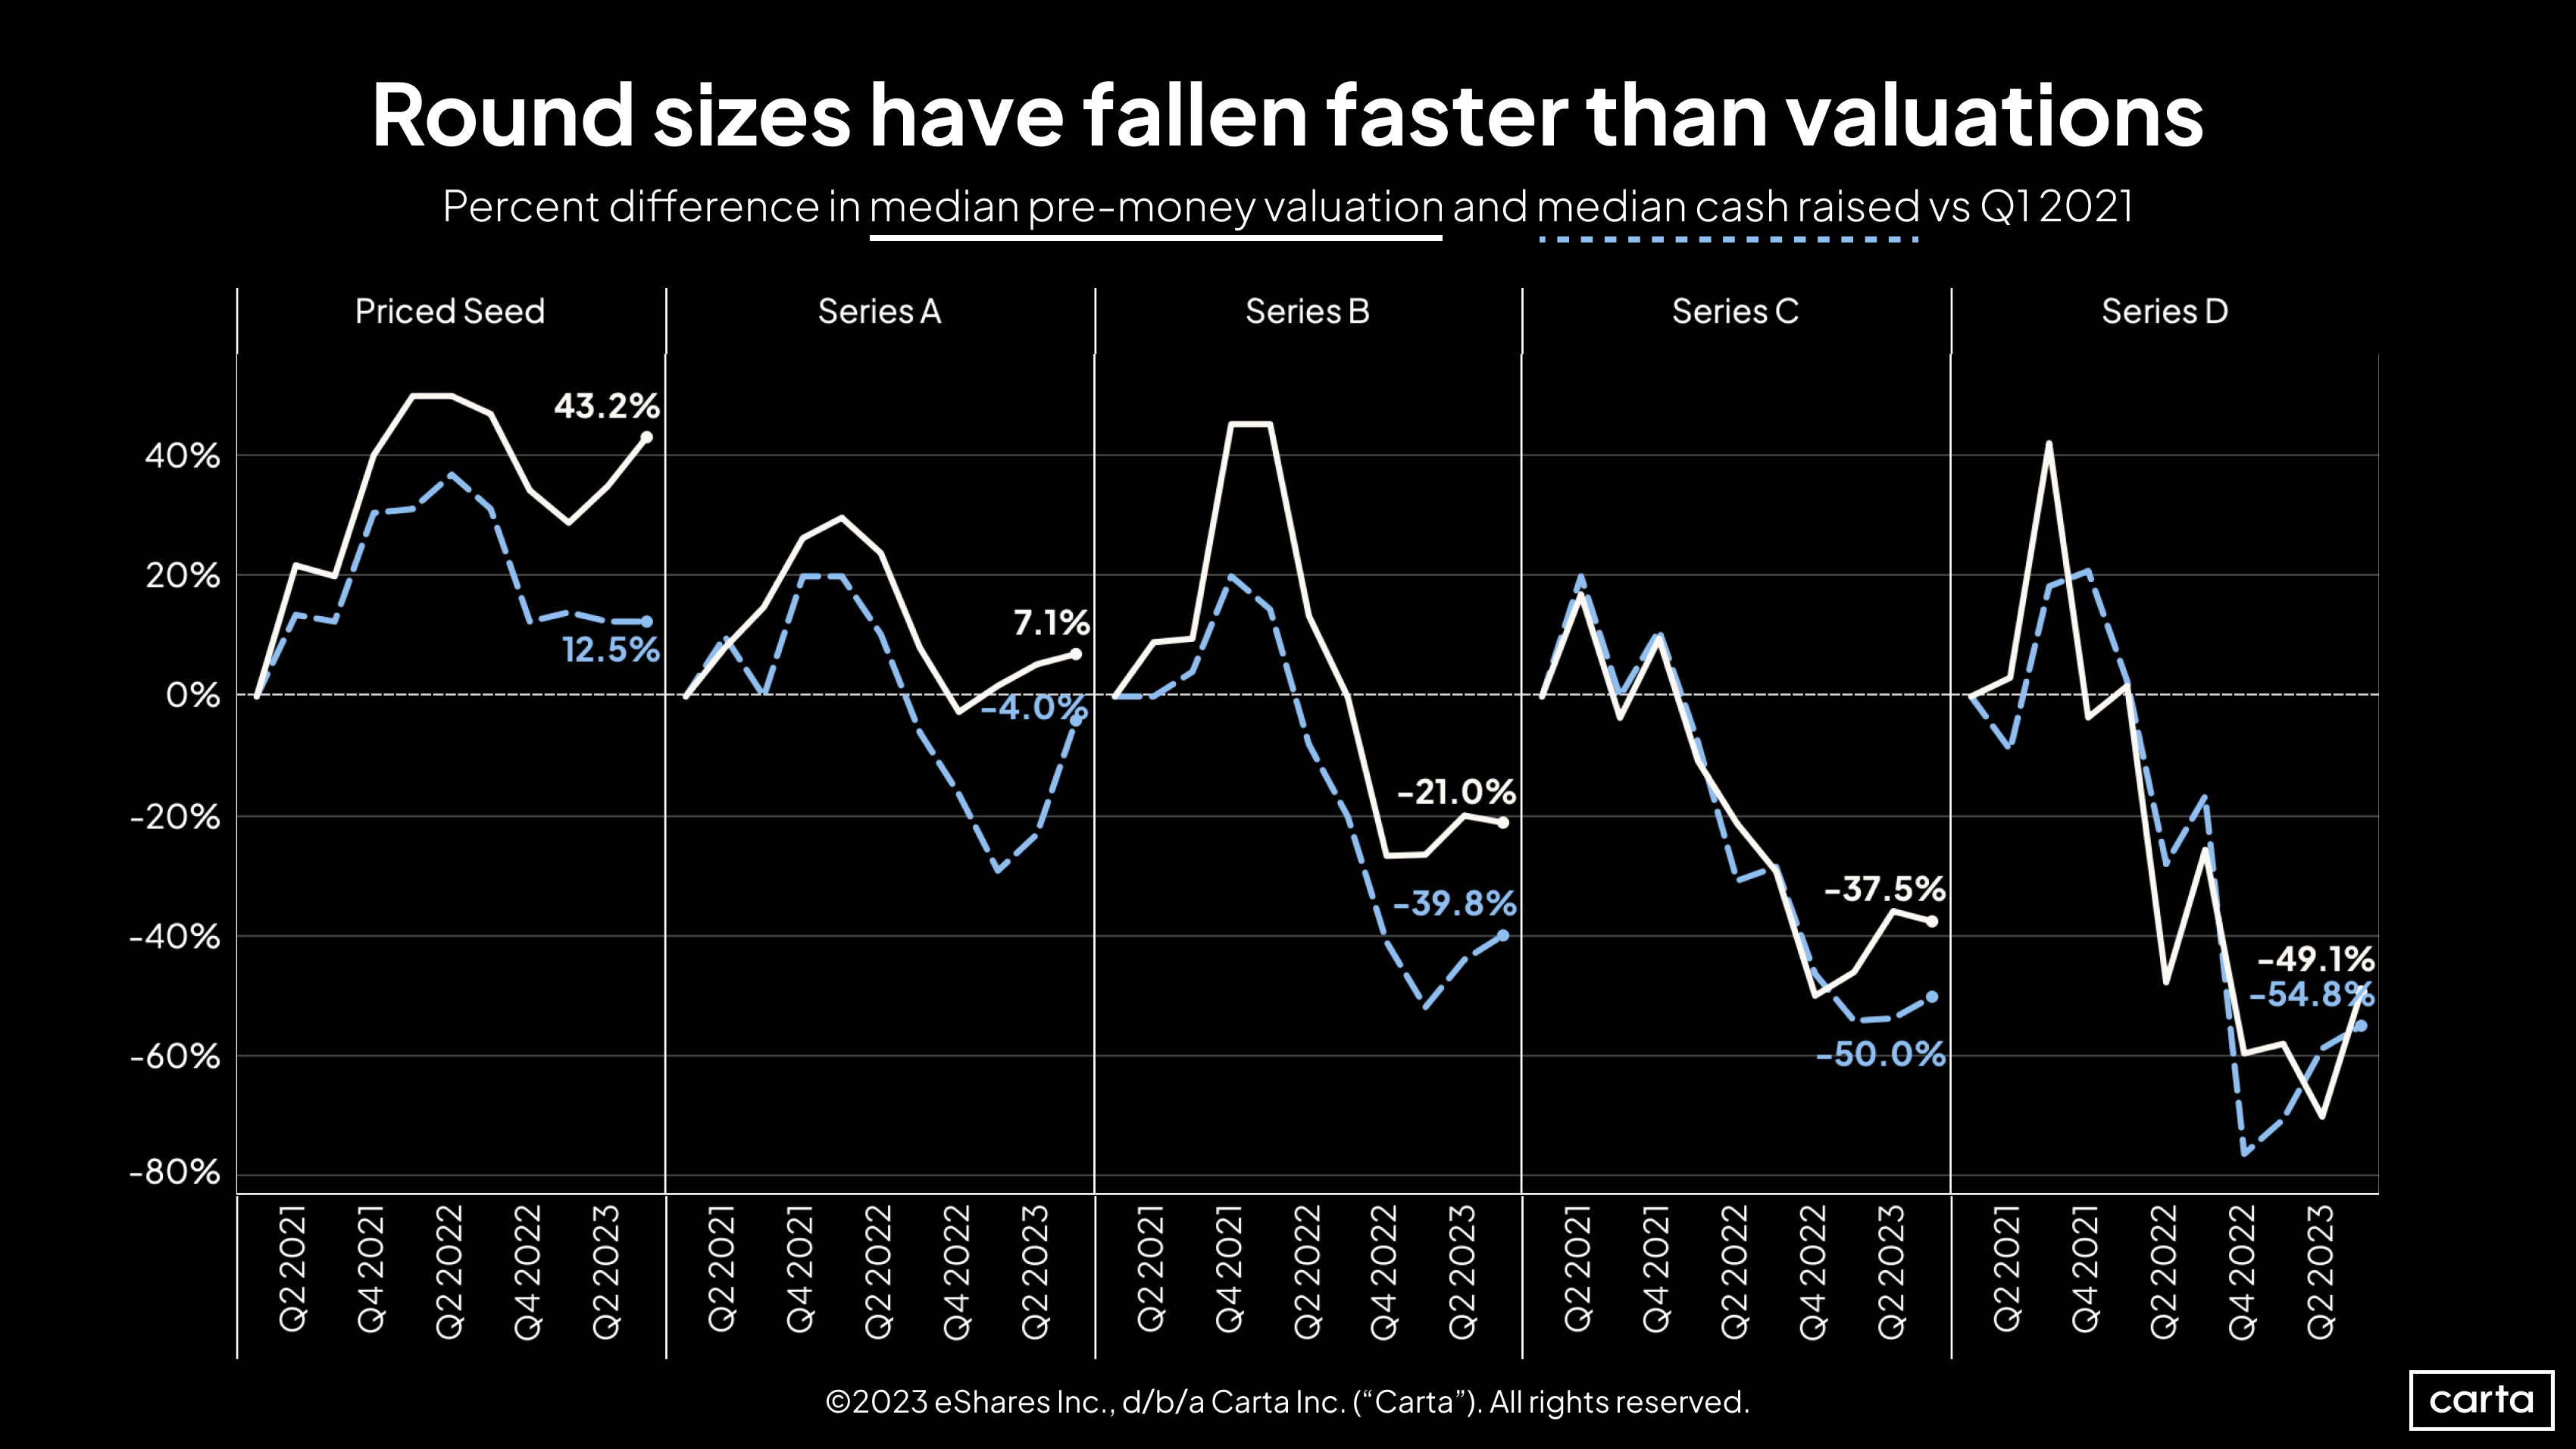
The shapes of these charts comparing valuations with round size are similar to those above that compare valuations against deal count: The later you get in the venture life cycle, the more closely the two trend lines track.
But here, the differences between earlier stages and later stages are even starker. In the past three years, median seed and Series A round sizes haven’t fallen nearly as far as the number of rounds completed at those stages; in fact, the median seed round size has gone up.
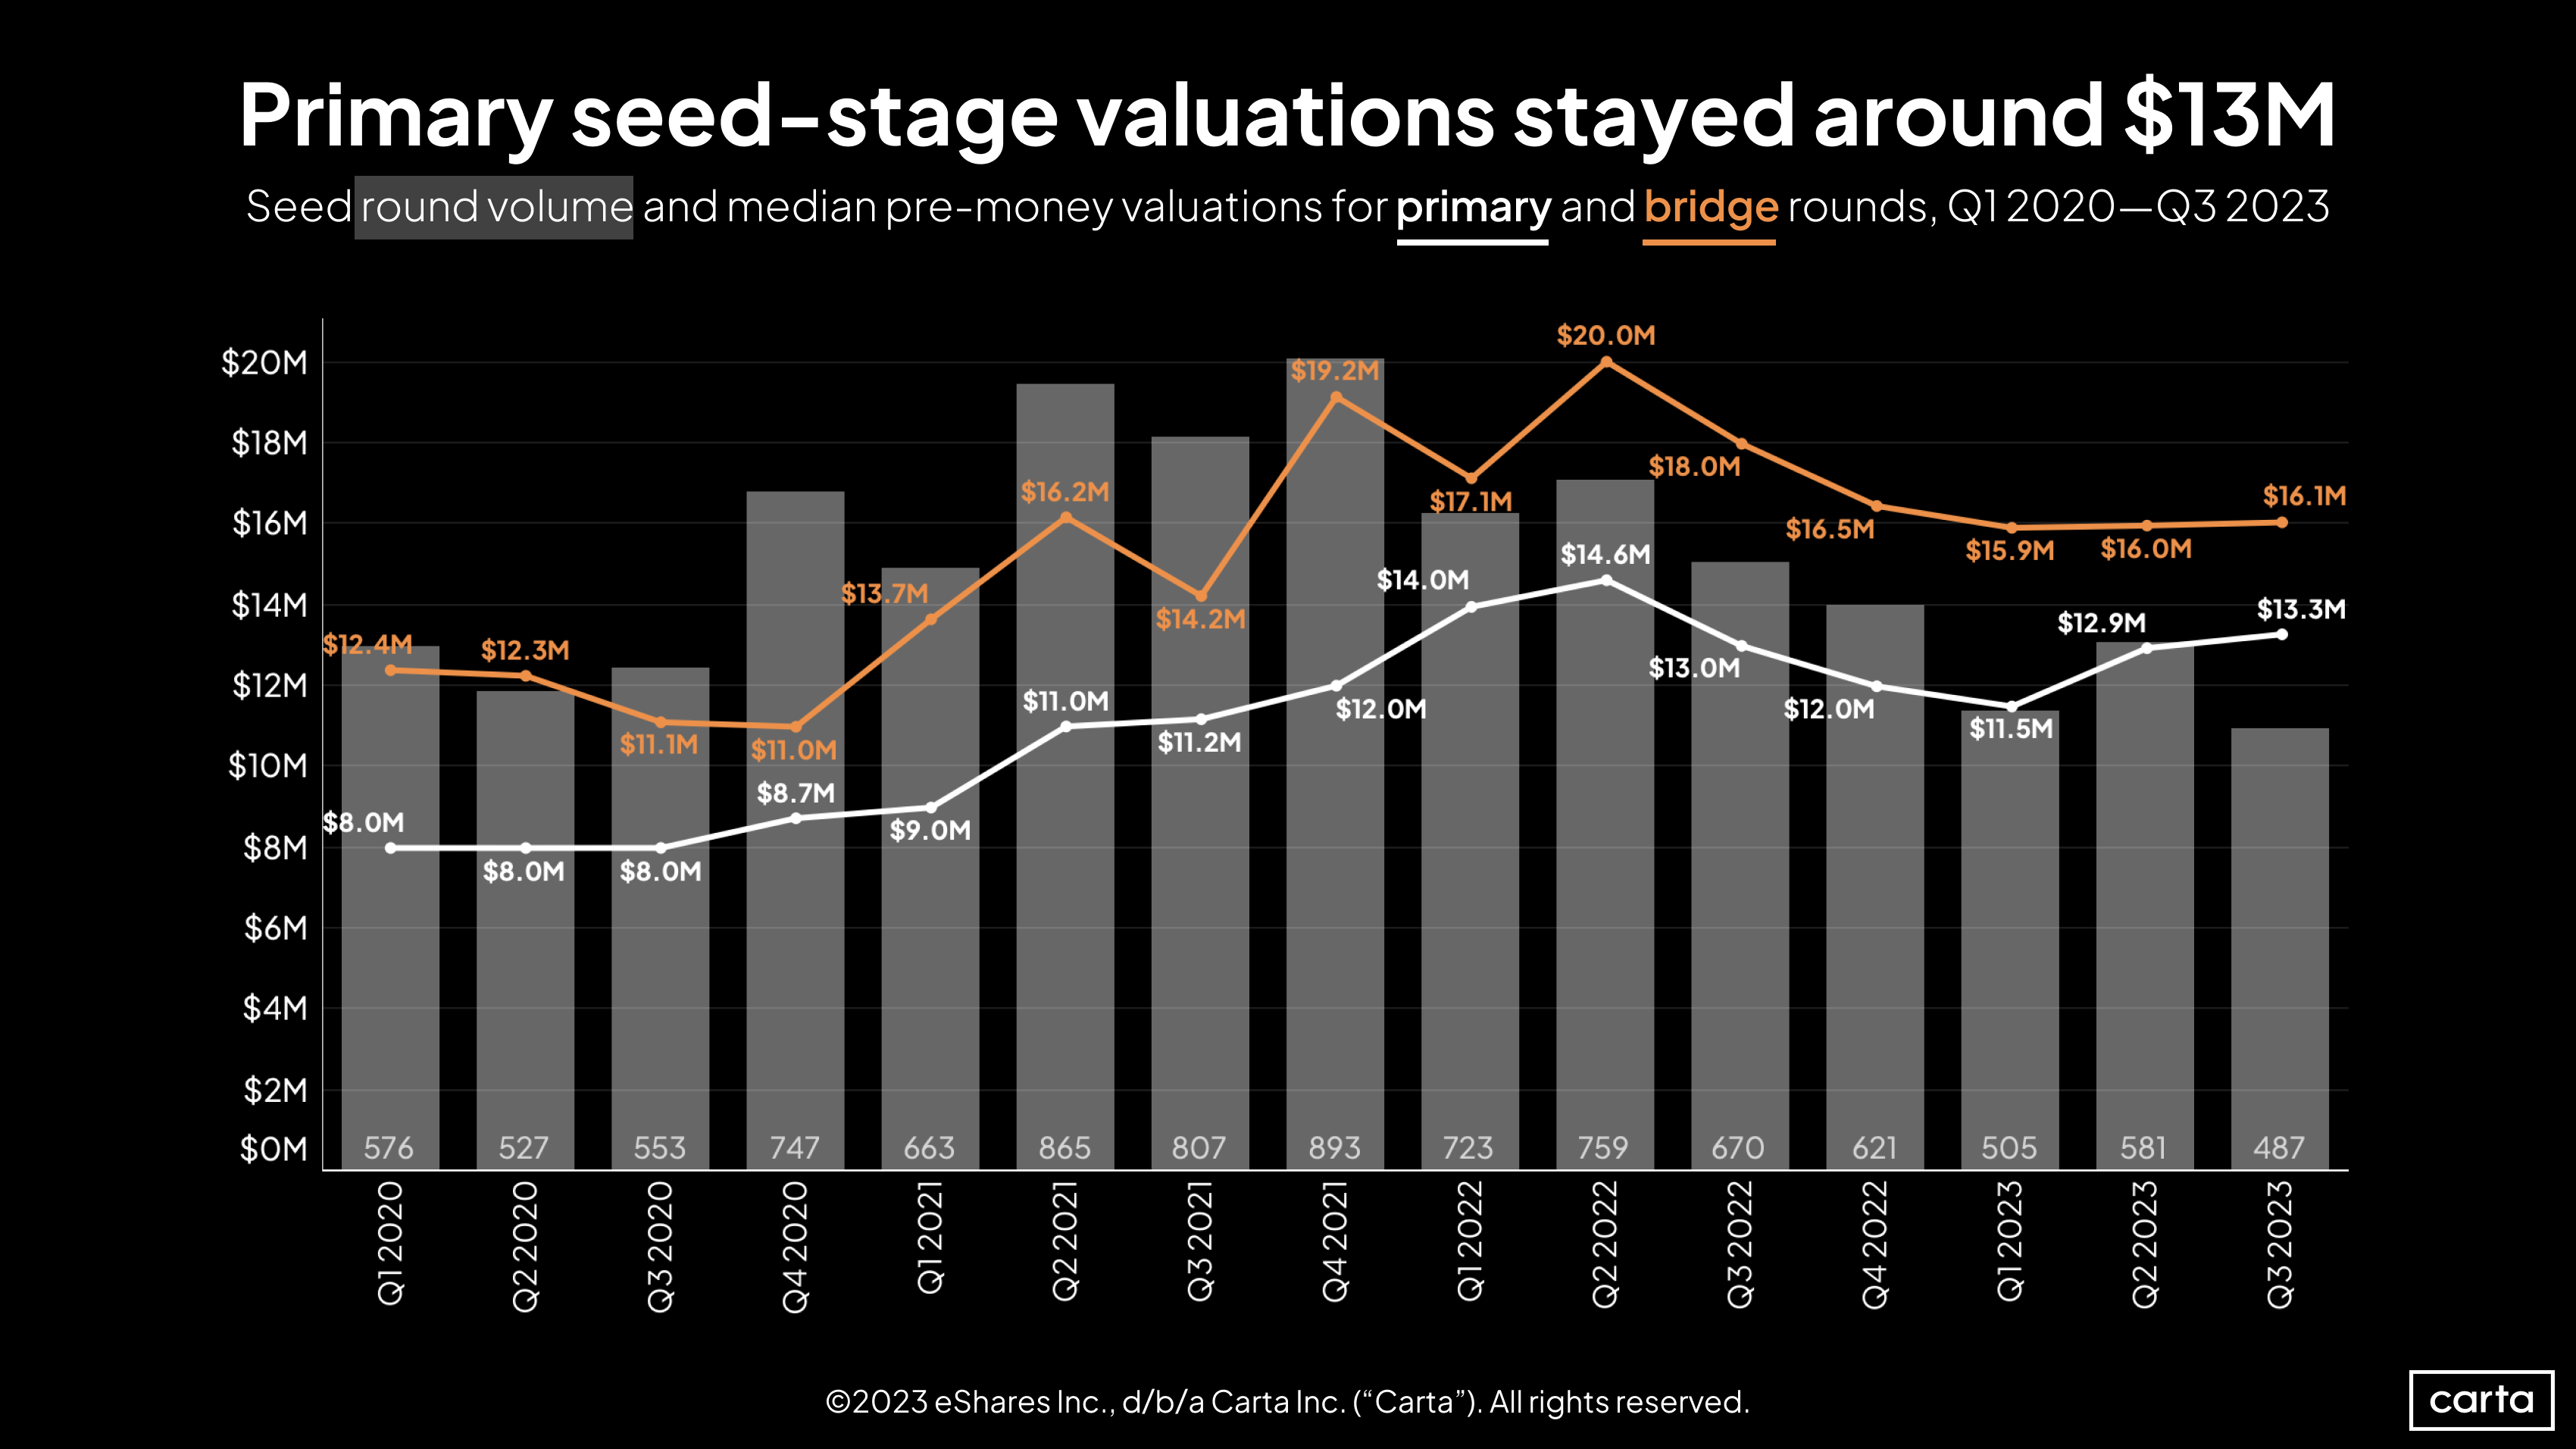
The median pre-money valuation for seed rounds on Carta rose for the second straight quarter, but only slightly, ticking up 3% to $13.3 million. On a year-over-year basis, the median valuation is also essentially flat, with a 2% increase. In terms of valuation, the seed stage has lately been much less volatile than other stages.
Bridge rounds for seed companies have consistently come at higher valuations than primary rounds, which makes sense at such an early stage. Seed companies raising a bridge round have already raised a primary seed round and have thus likely had more time to grow than startups raising seed funding for the first time.
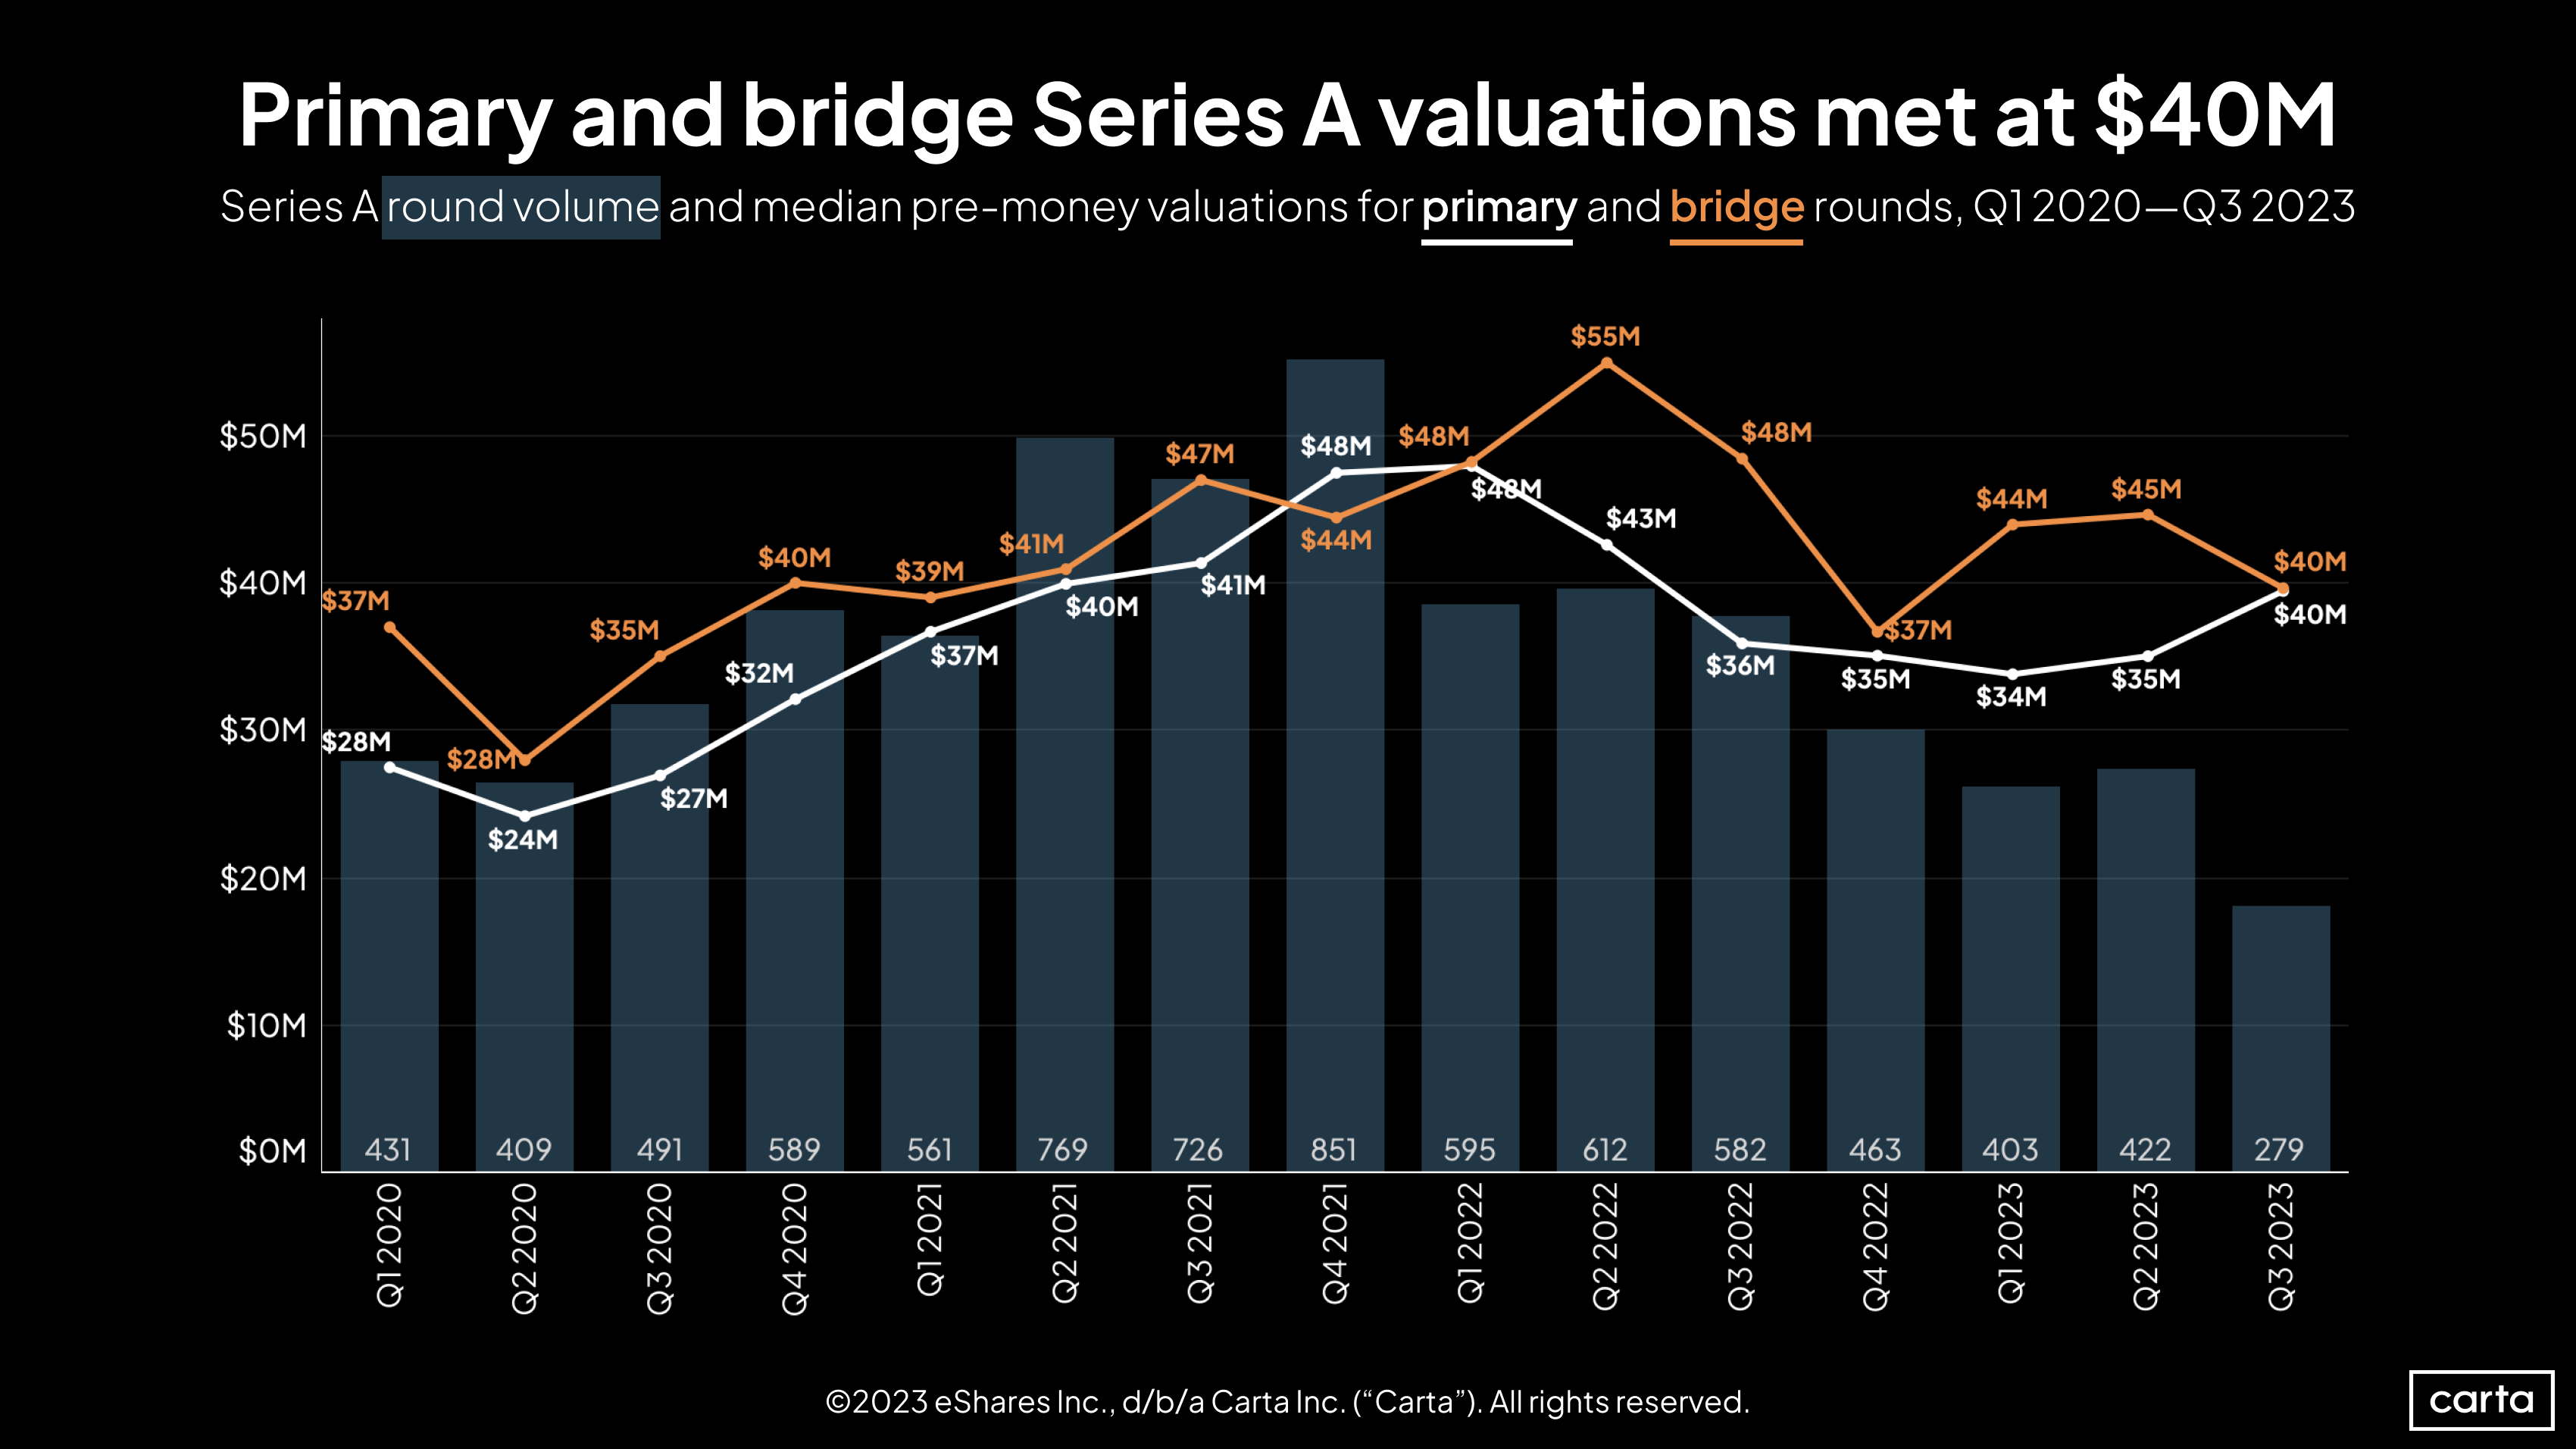
Bridge valuations at Series A have been consistently higher than primary valuations so far in the 2020s, with just a few exceptions. One of those exceptions occurred in Q3, as primary and bridge Series A valuations converged at $40 million.
At the same time, the trend line for primary Series A valuations diverged from the one for Series A deal count. The median pre-money valuation for primary Series A deals climbed 14% quarter-over-quarter, while the number of Series A rounds fell by 34%. Fewer transactions are taking place at this stage, but valuations in the deals that are getting done are at their highest point in five quarters.
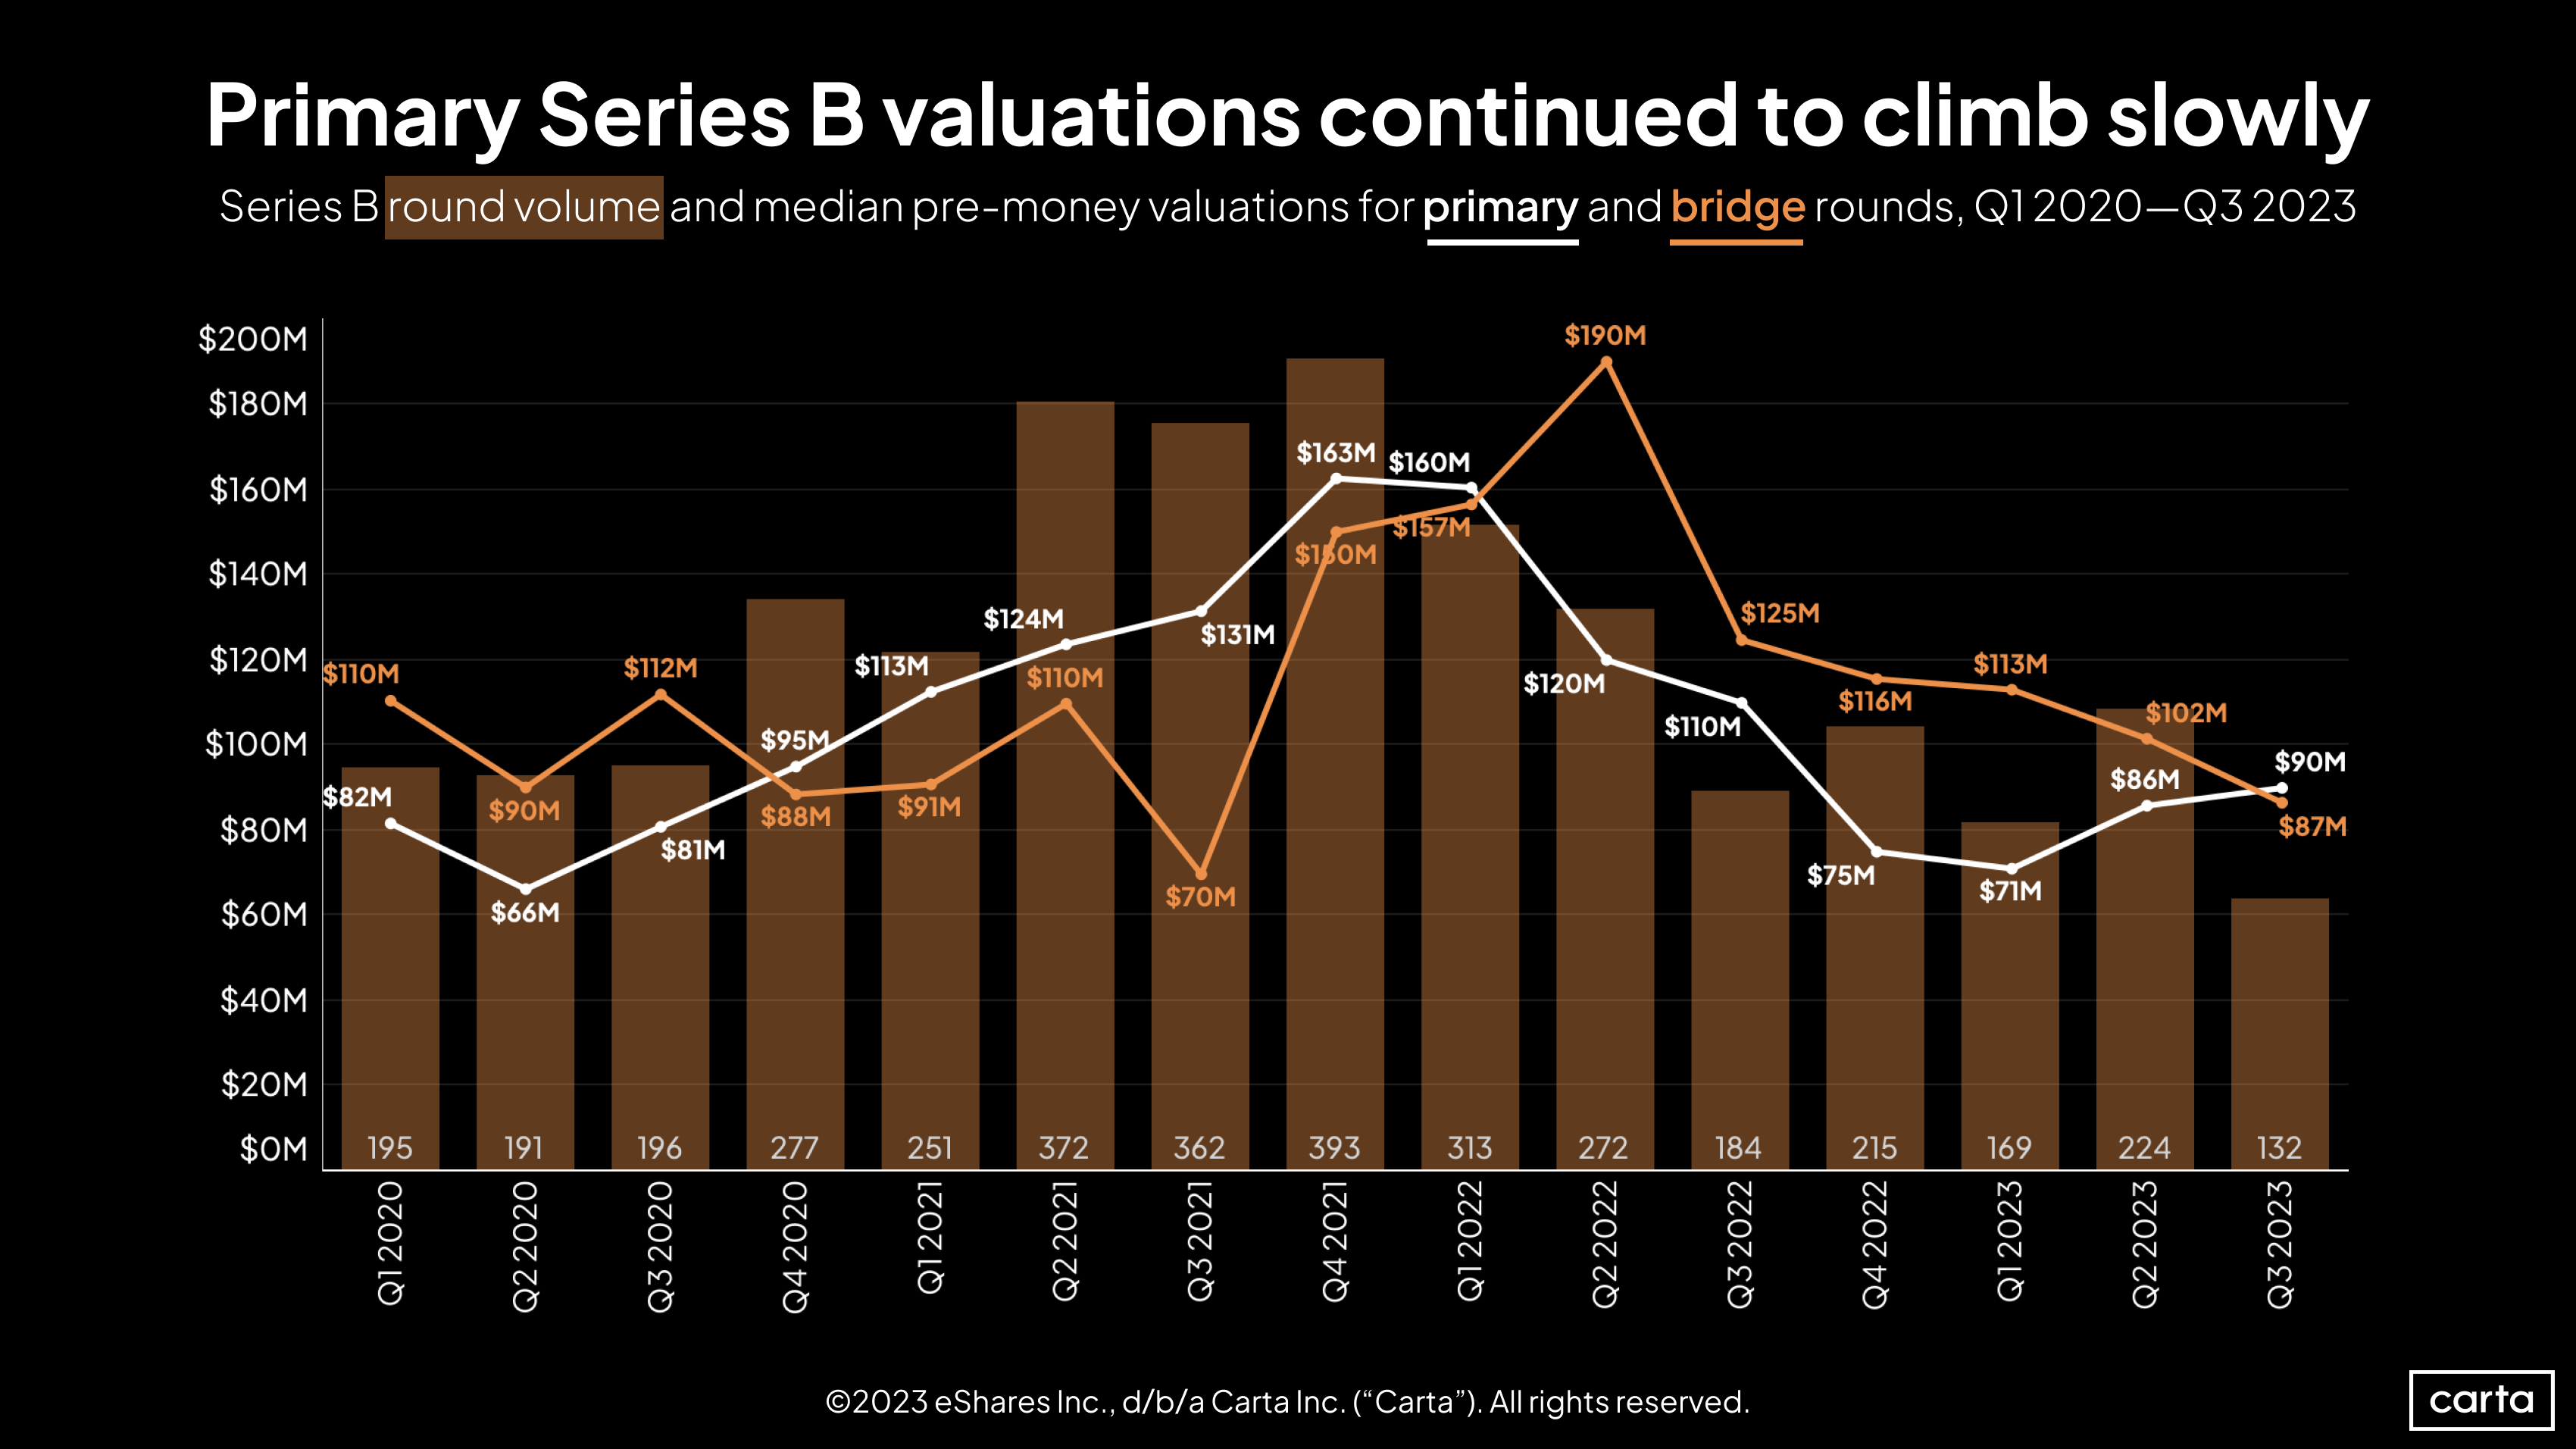
At Series B, primary and bridge valuations fully crossed over in Q3, with the median pre-money bridge valuation finishing lower than the median primary valuation for the first time since Q1 2022. Bridge valuations at Series B have shown more volatility than at other stages of the venture life cycle. Most recently, the median has declined for five straight quarters.
The median primary valuation, meanwhile, has now increased in two straight quarters. So far, median Series B valuations from 2023 bear a fairly close resemblance to those from 2020.
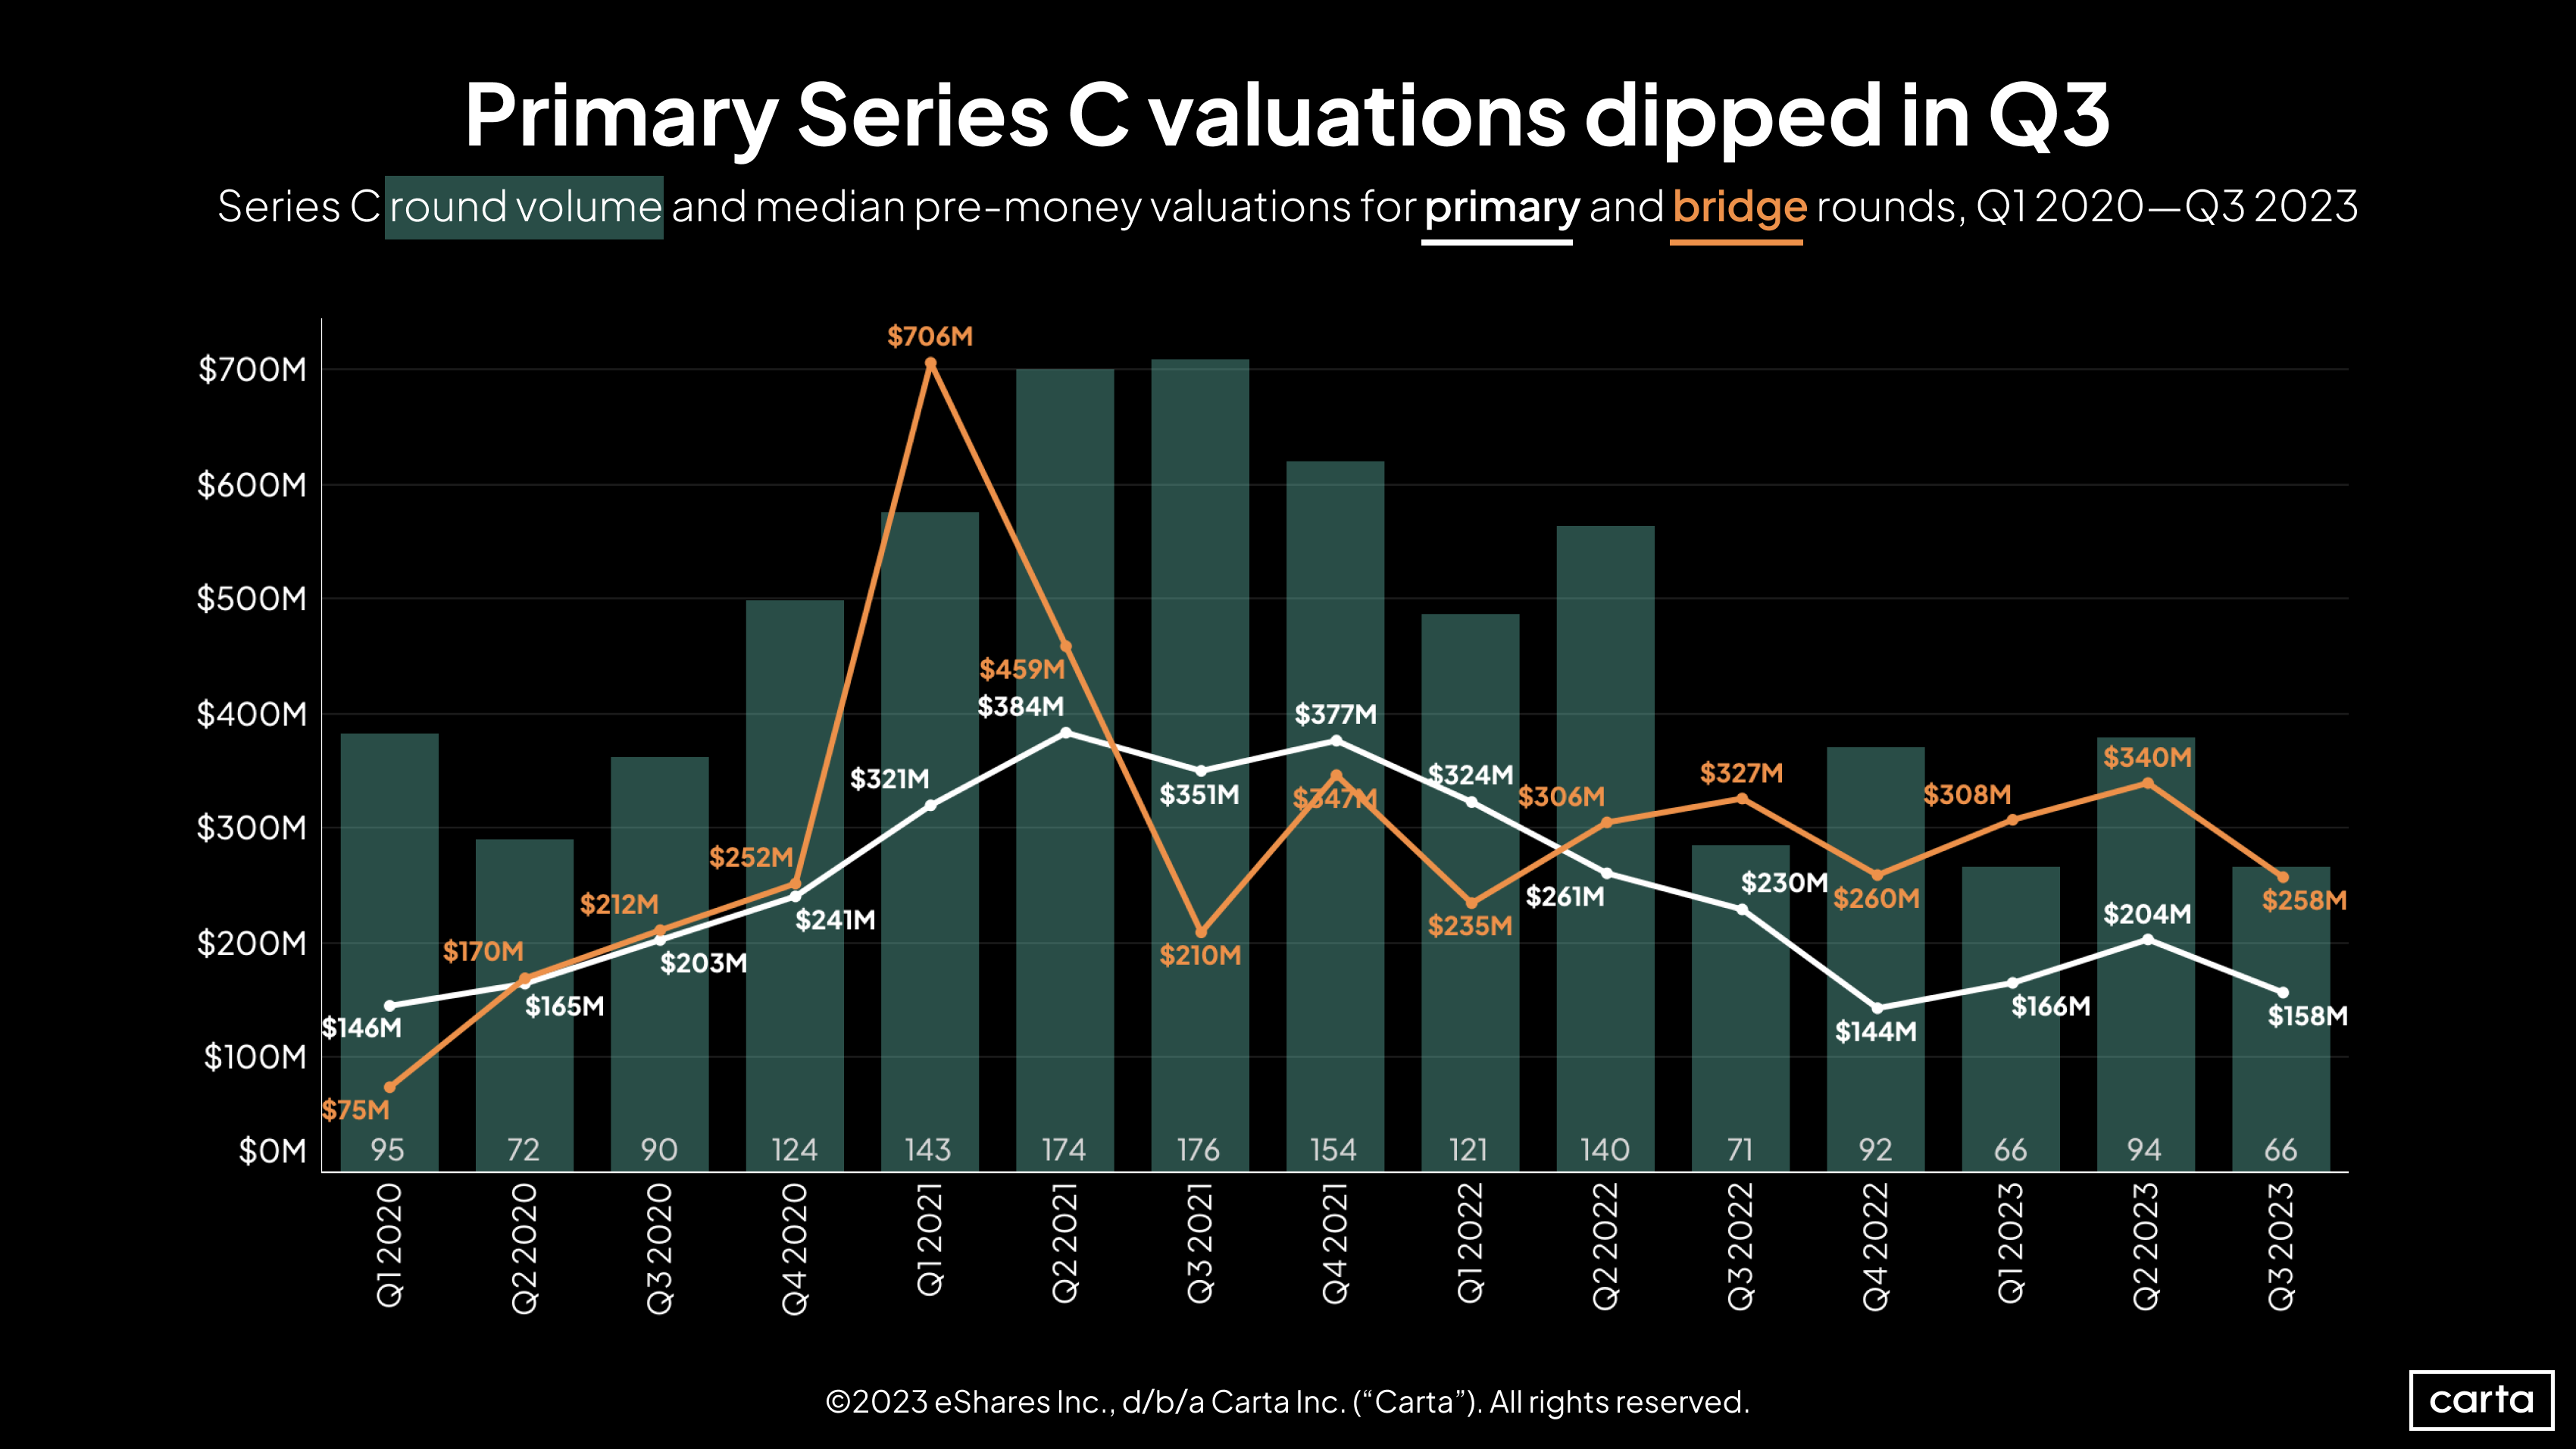
After increasing in the previous two quarters, the median Series C pre-money valuation in primary funding rounds on Carta fell by 23% in Q3, landing at $158 million. That’s the third-lowest quarterly median since the start of 2020. The median remained above $320 million for all of 2021 and into Q1 2022. Now, it’s been $204 million or lower for four straight quarters—long enough to look more like a market reset than a blip.
Directionally, Series C valuations for primary rounds and bridge rounds have moved in parallel for the past five quarters, with median valuations for bridge deals now consistently higher—sometimes by more than $100 million.
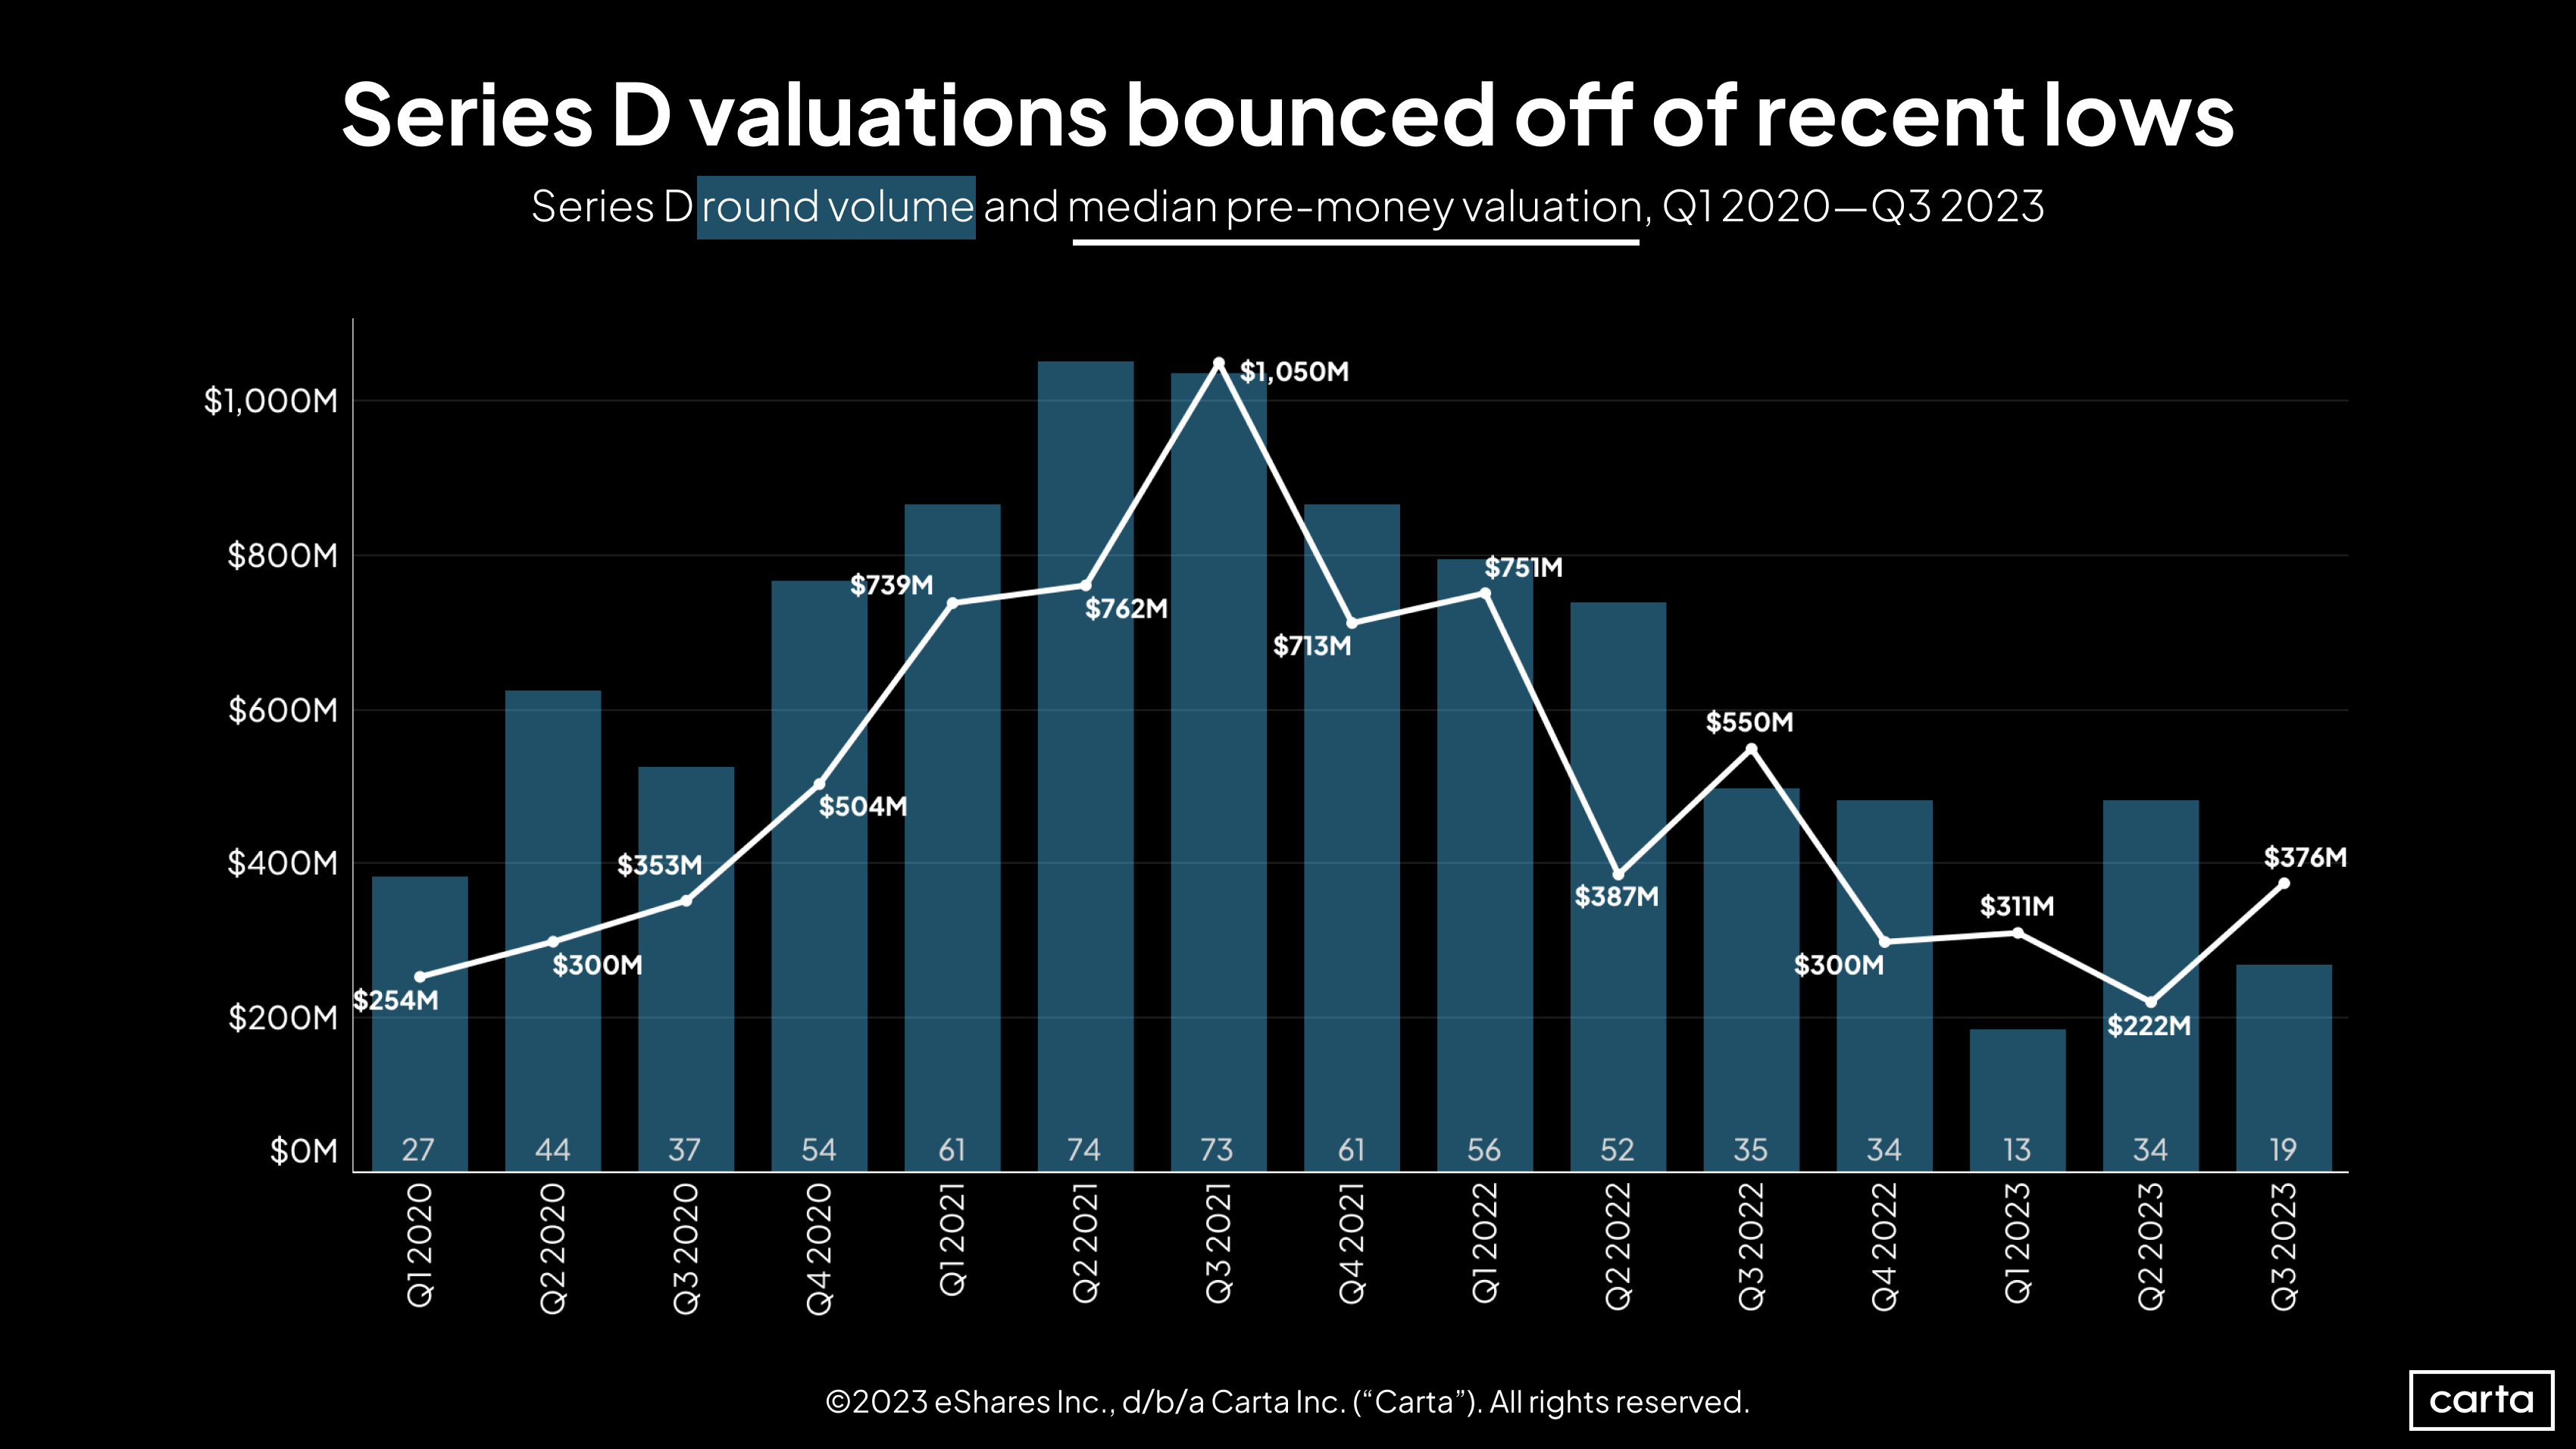
The median Series D valuation grew by 69% in Q3, the largest quarterly climb since at least the start of 2020. But that increase comes after valuations had sunk to a four-year low in Q2. The median Series D valuation in each of the past four quarters has been lower than any quarterly figure from the previous two years.
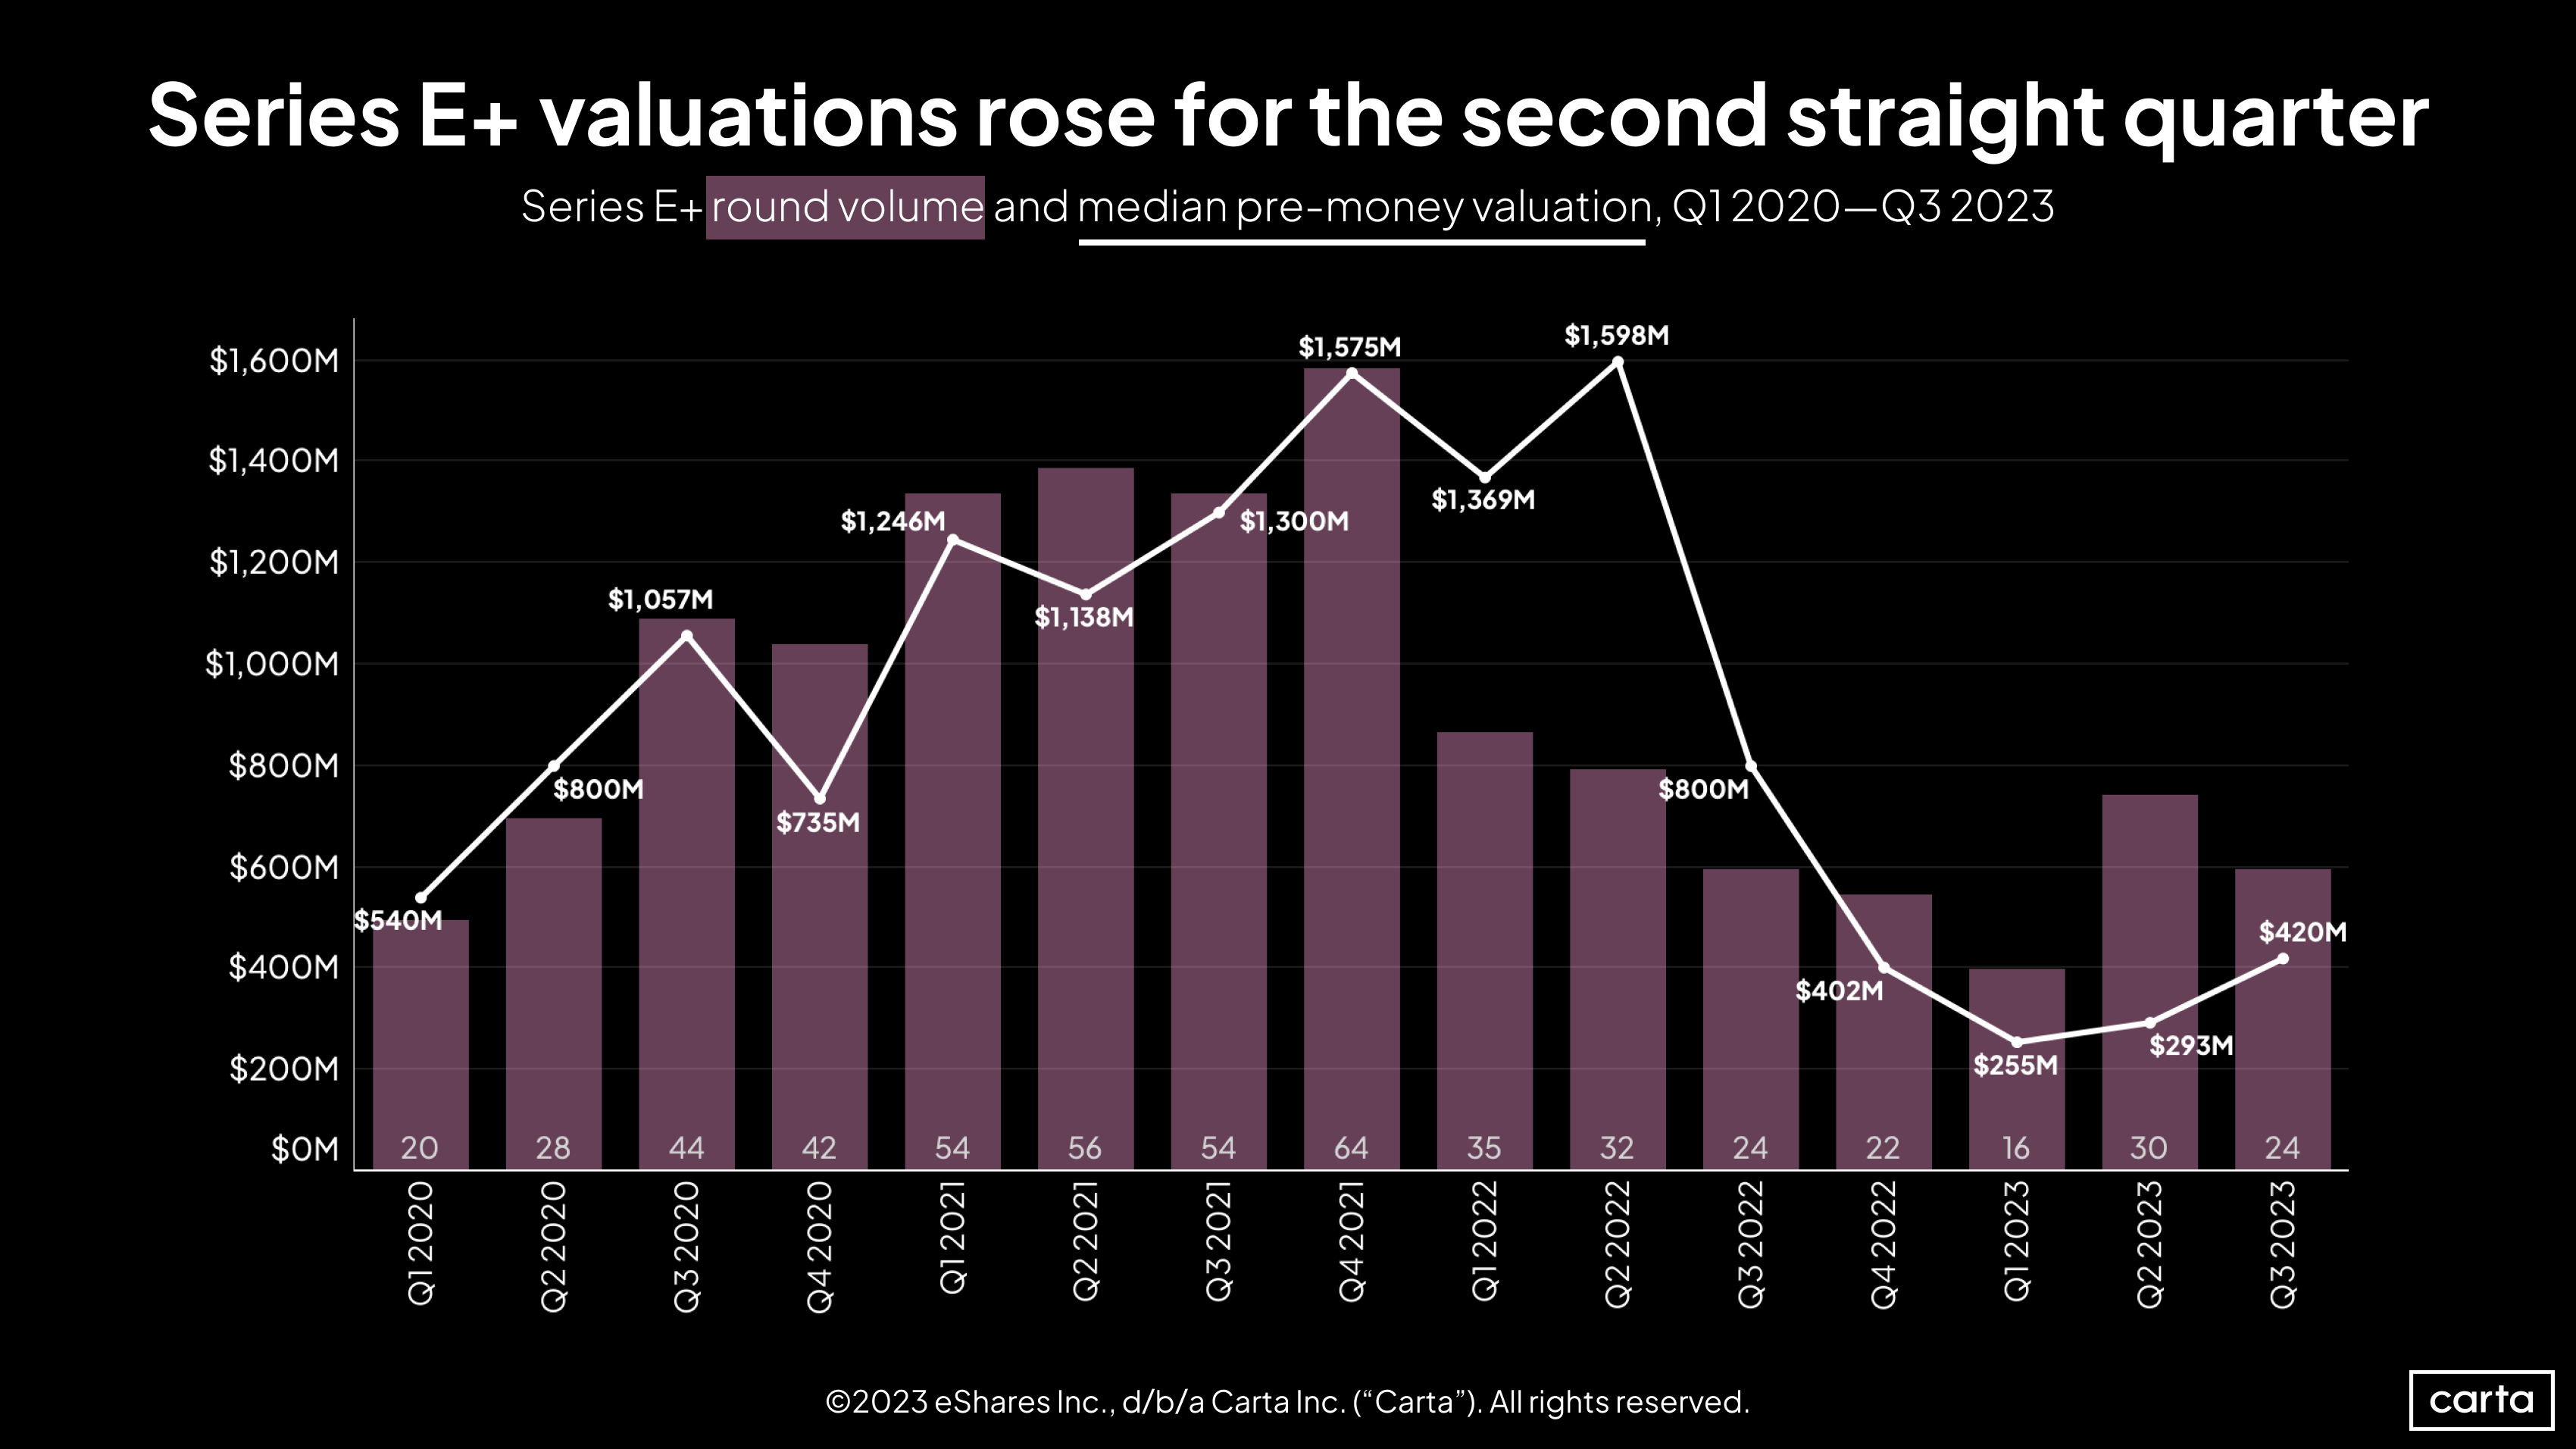
There were 24 new investments on Carta at Series E and beyond in Q3, and those deals came at a median pre-money valuation of $420 million. The former represents a 20% decline from the prior quarter, while the latter represents a 43% increase.
These figures are still a long way off what occurred in late 2020 and throughout 2021. But judging the current environment against one of the most bullish venture markets in history may not be the most relevant comparison. The market for fundings at these latest stages appears to have shifted at the start of 2022.
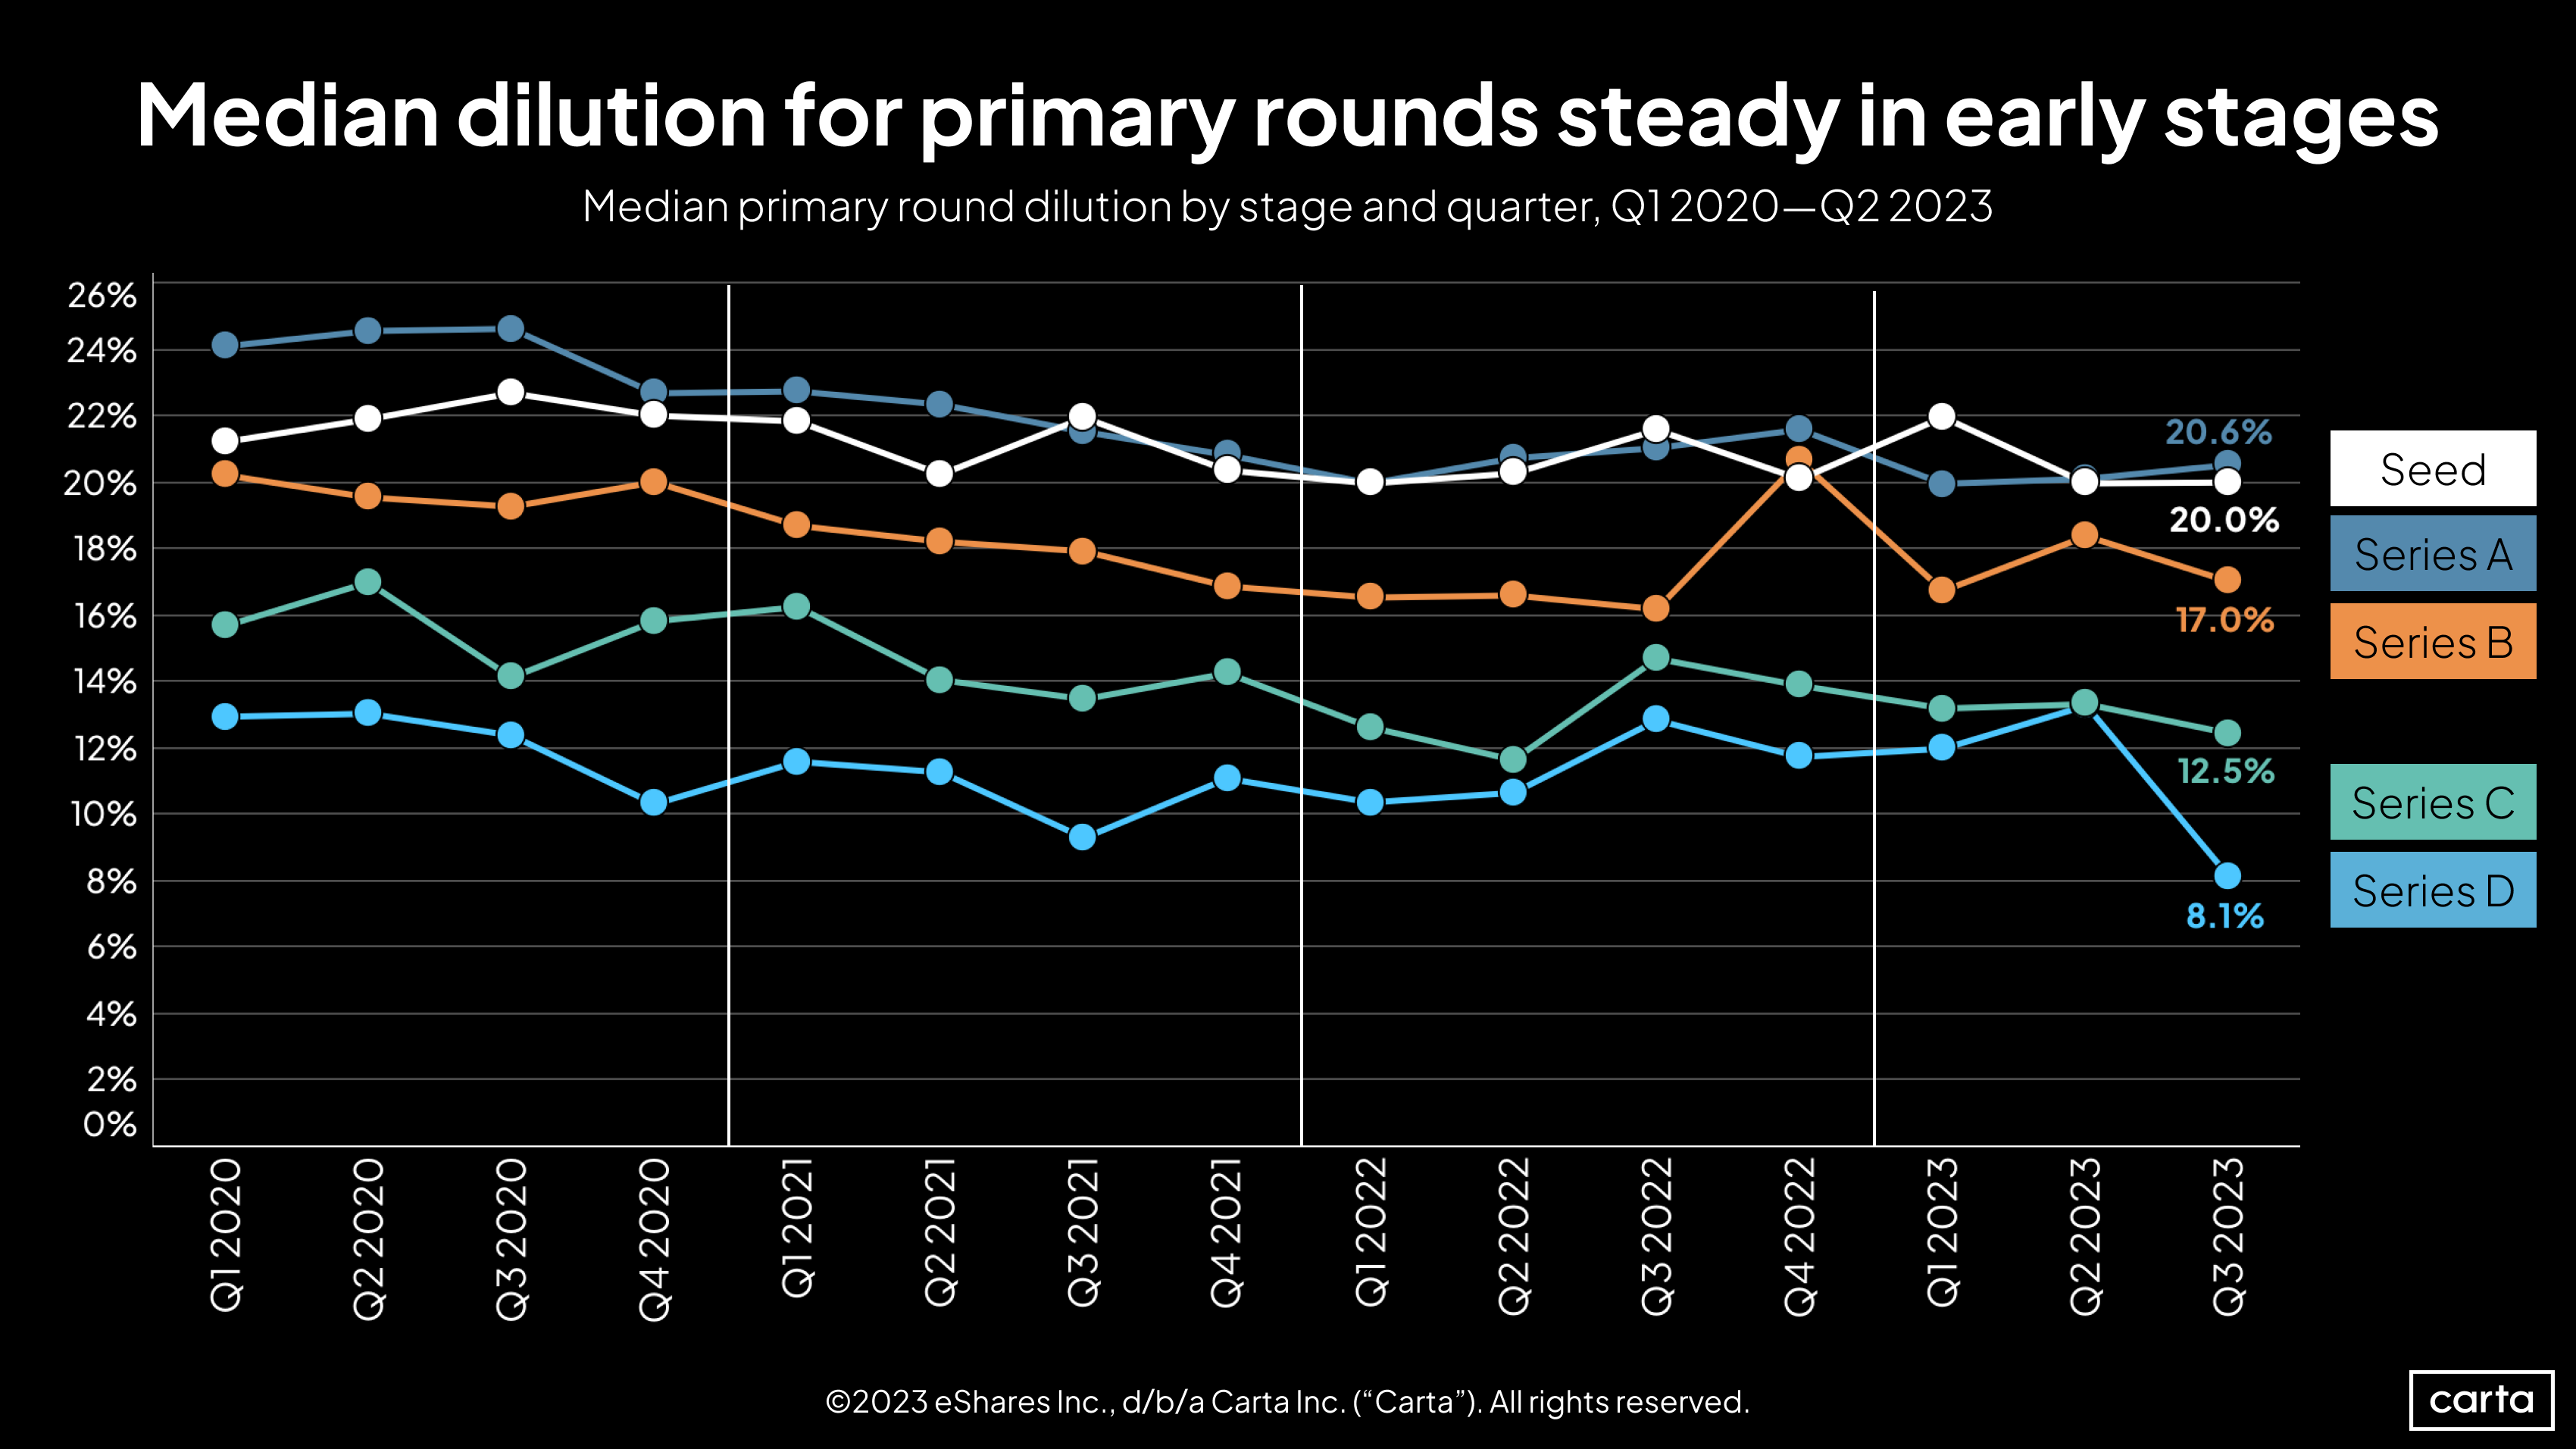
In Q3, the median dilution in primary funding rounds (defined as pre-money valuation divided by round size) was stable at both seed and Series A. At later stages, however, there was significant downward movement. At Series B, Series C, and Series D, companies raising new funding rounds sold off a smaller percentage of their shares in Q3 than they did in Q2.
The change was most notable at Series D, where median dilution fell to 8.1%, its lowest point in the past four years. Compared to Q1 2020, dilution has decreased at every stage.
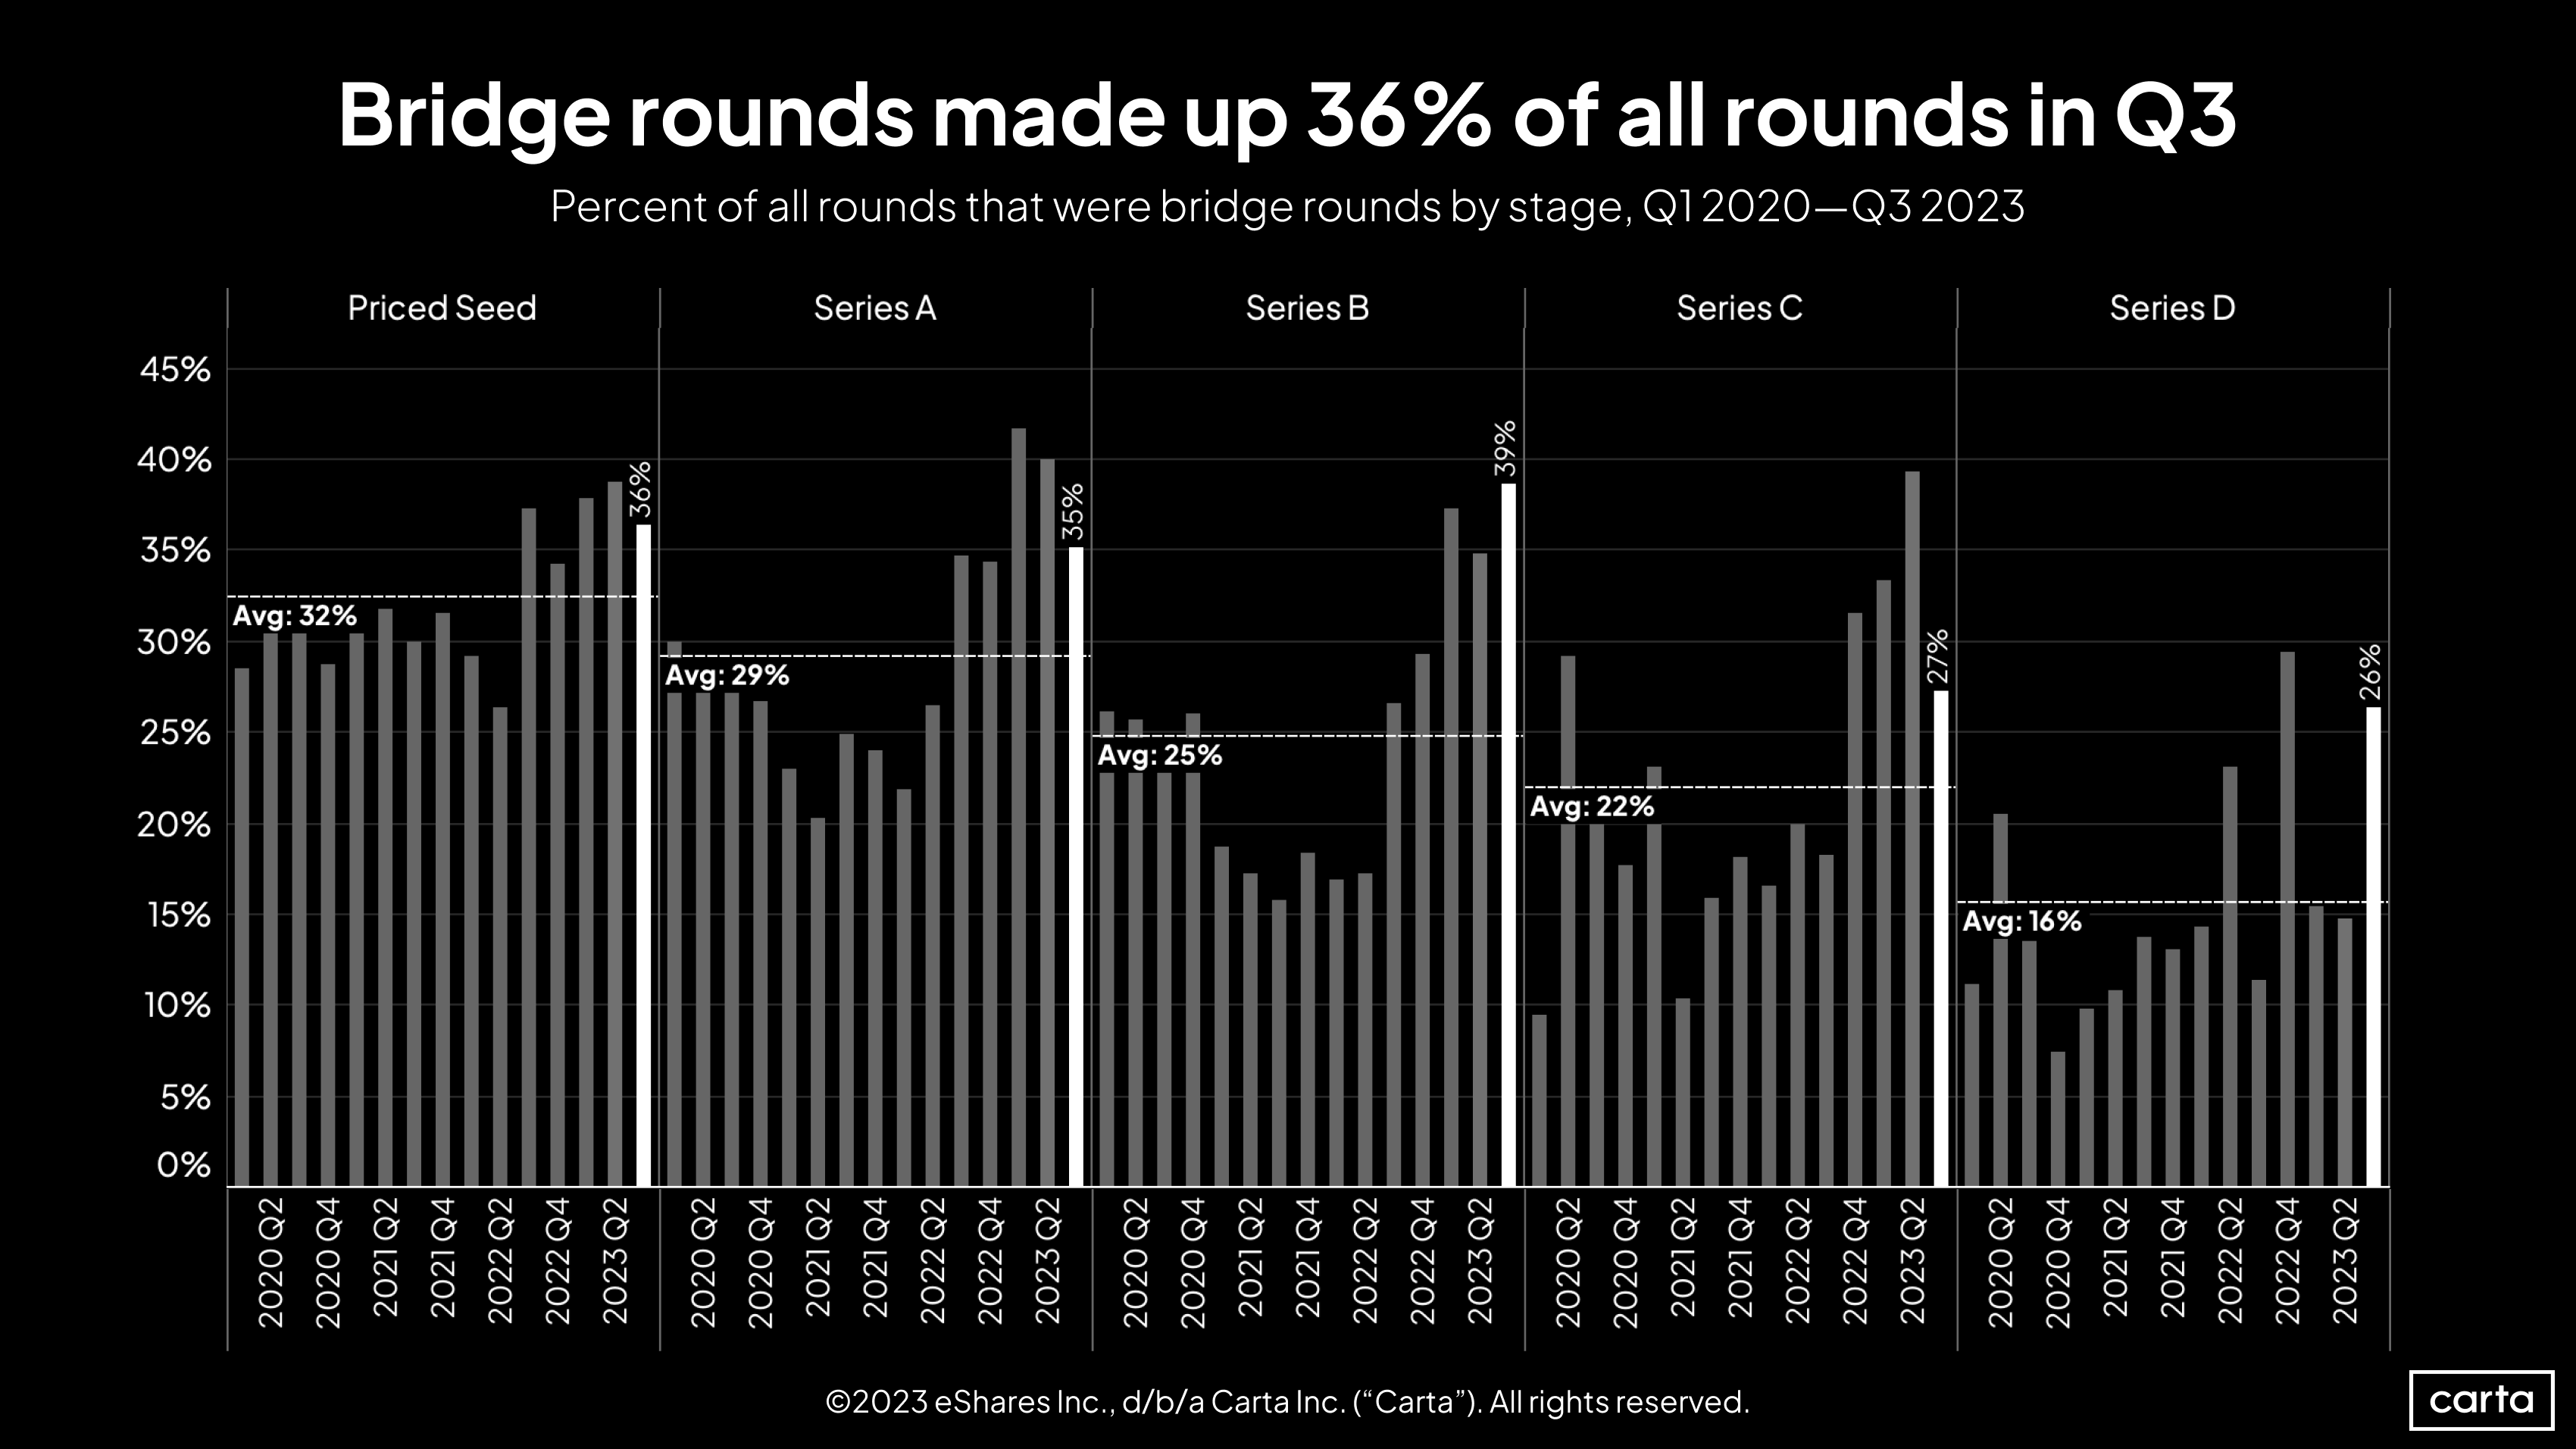
At every stage from seed through Series D, bridge rounds were significantly more common in Q3 than the average rate over the past three years. They were most prevalent at Series B, where 39% of all new investments were classified as bridge rounds, compared to quarterly average of 25% since the start of 2020. This overlapped with a 30% overlap in Series C deal count in Q3, as a growing number of startups opt for bridge rounds over new priced rounds.
The biggest change in Q3 occurred at Series D, where the rate of bridge rounds jumped to 26%, up from 15% in Q2. In general, bridge rounds grow less common as companies progress through the stages of the VC life cycle, although Series B was a notable exception in Q3.
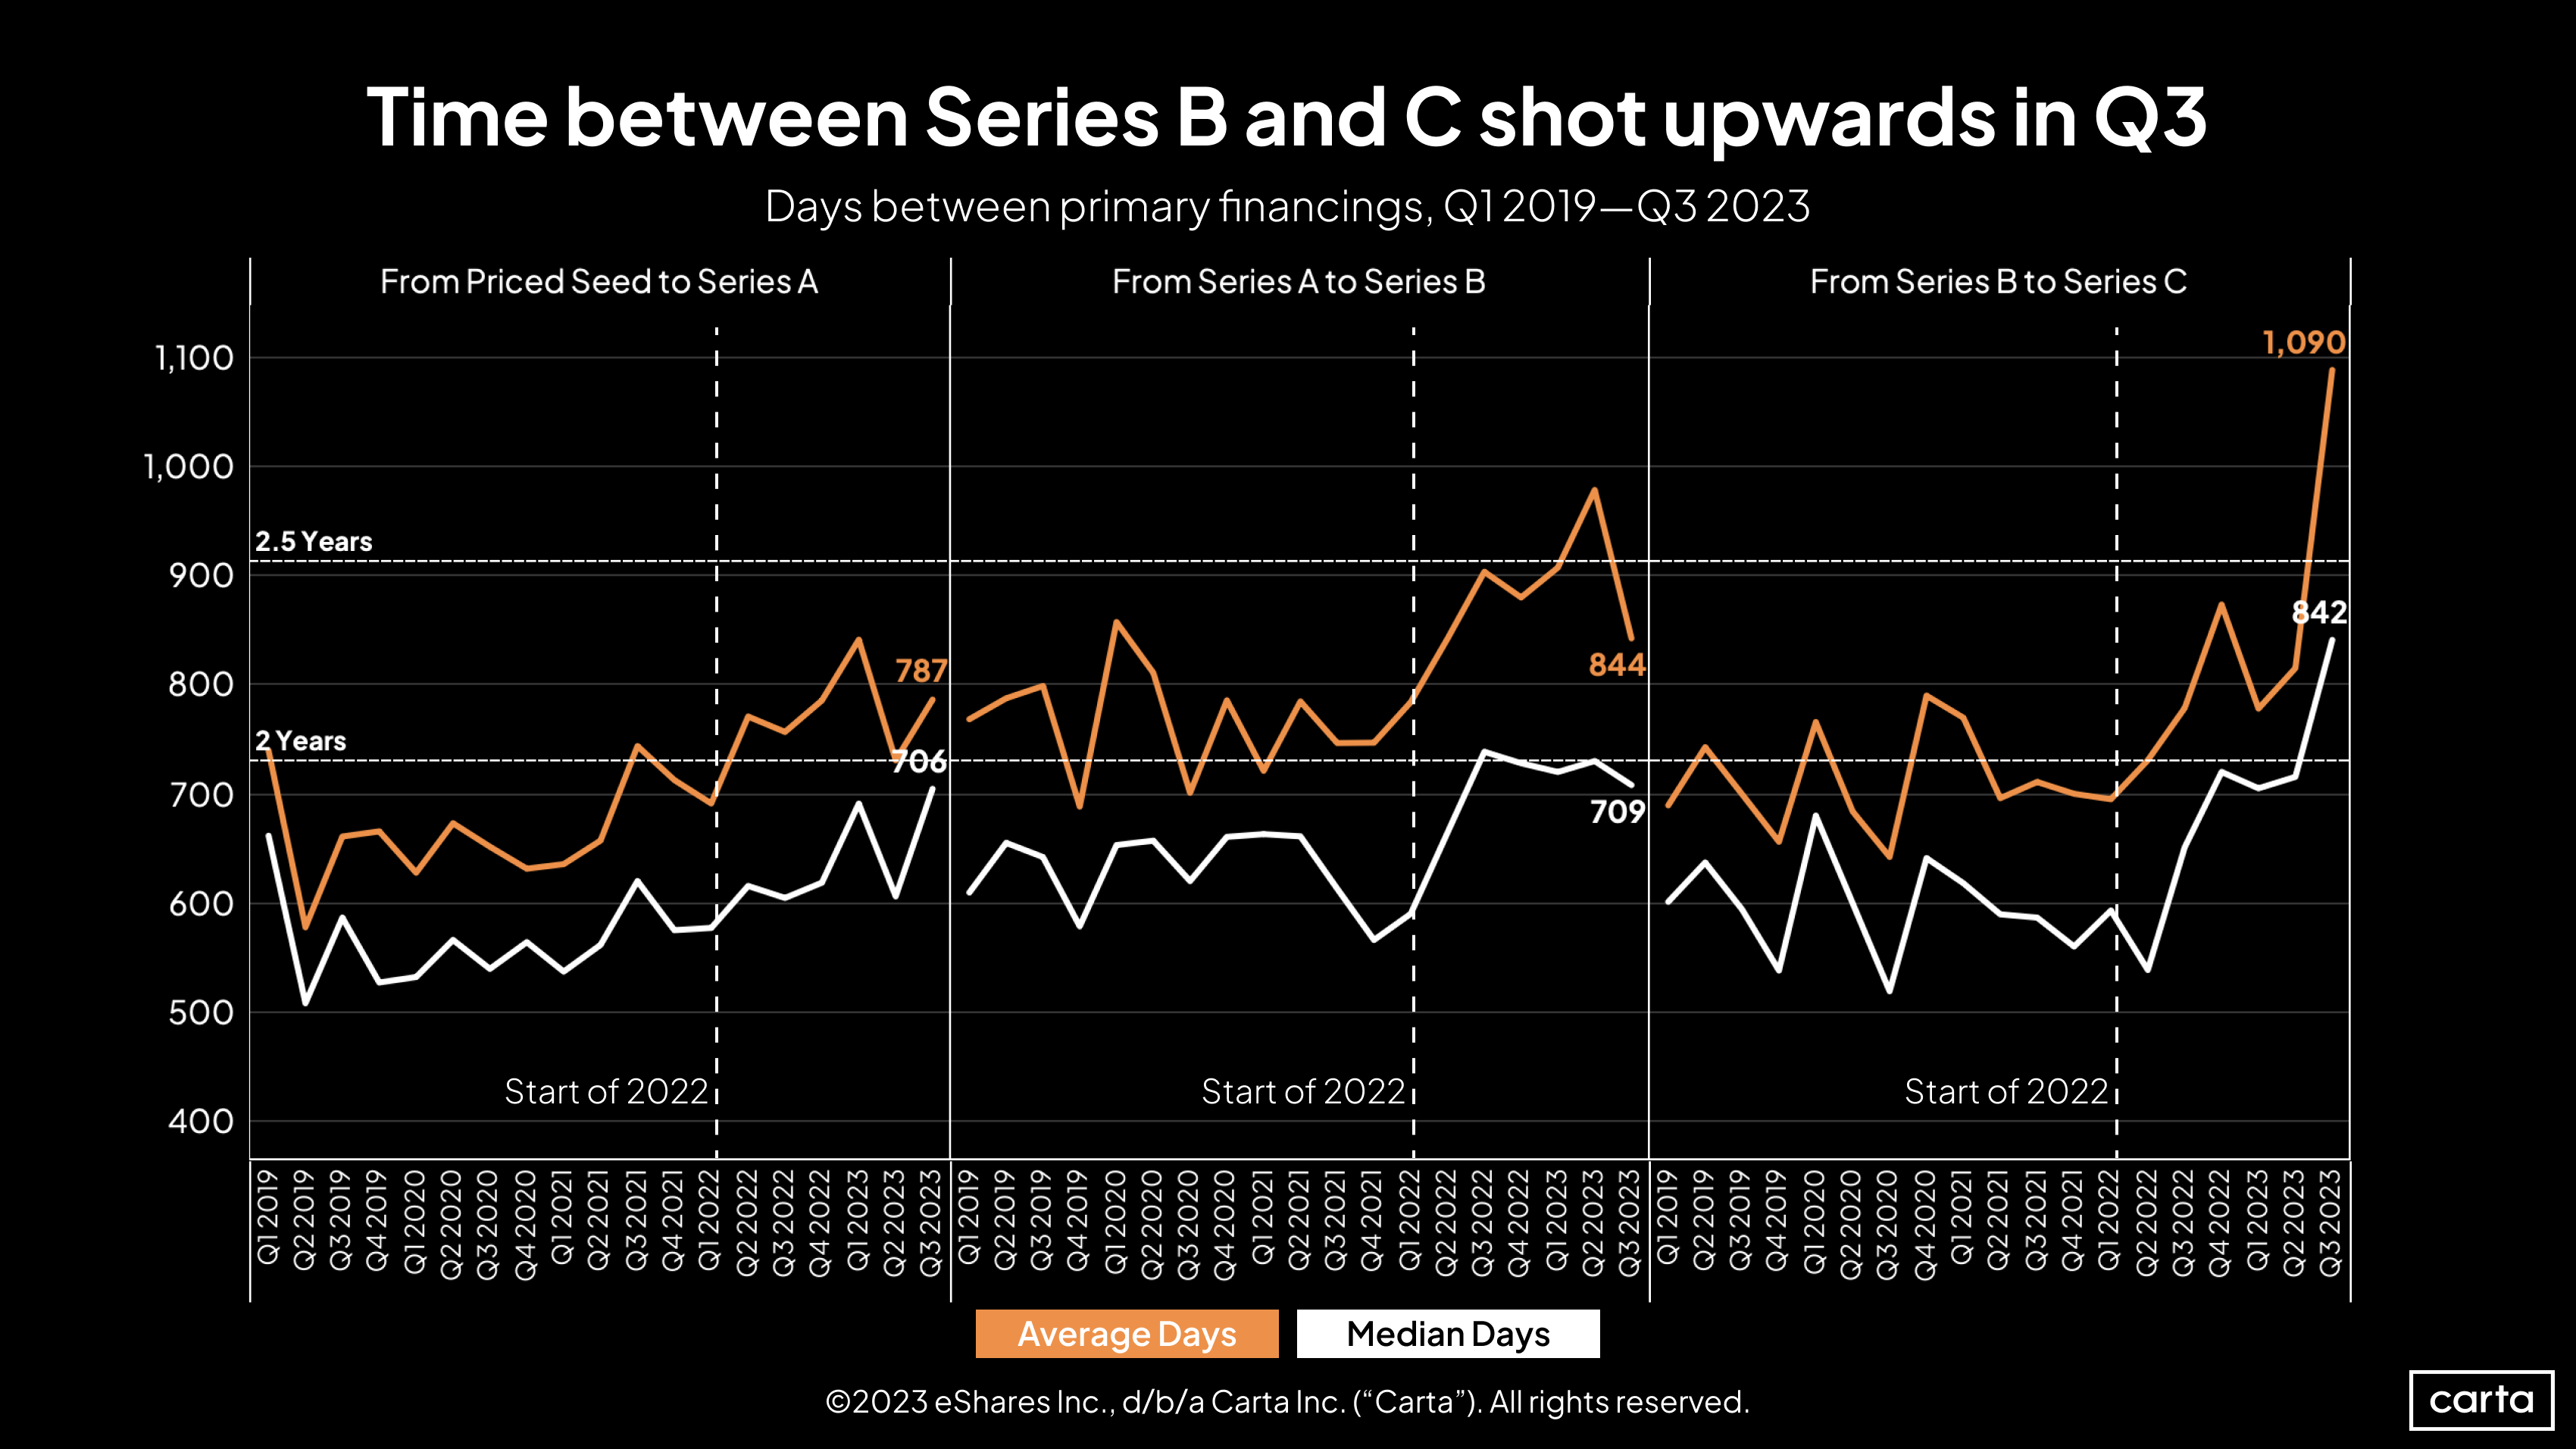
The median time between a priced seed round and a Series A increased by 16% in Q3. The median time between a Series B and a Series C increased by 17%. These leaps are in line with what we’ve seen since the start of 2022: With fewer total deals taking place, many companies are having to wait longer before getting another bite at the funding apple.
But this quarter brought an exception to that trend: The median wait time between a Series A round and a Series B actually decreased by 3%, and the average wait time fell by 14%. At the same time, the quantity of Series B rounds on Carta in Q3 fell by 41%, as noted above. Fewer deals took place, but those companies that were able to raise Series B rounds didn’t have to wait as long.
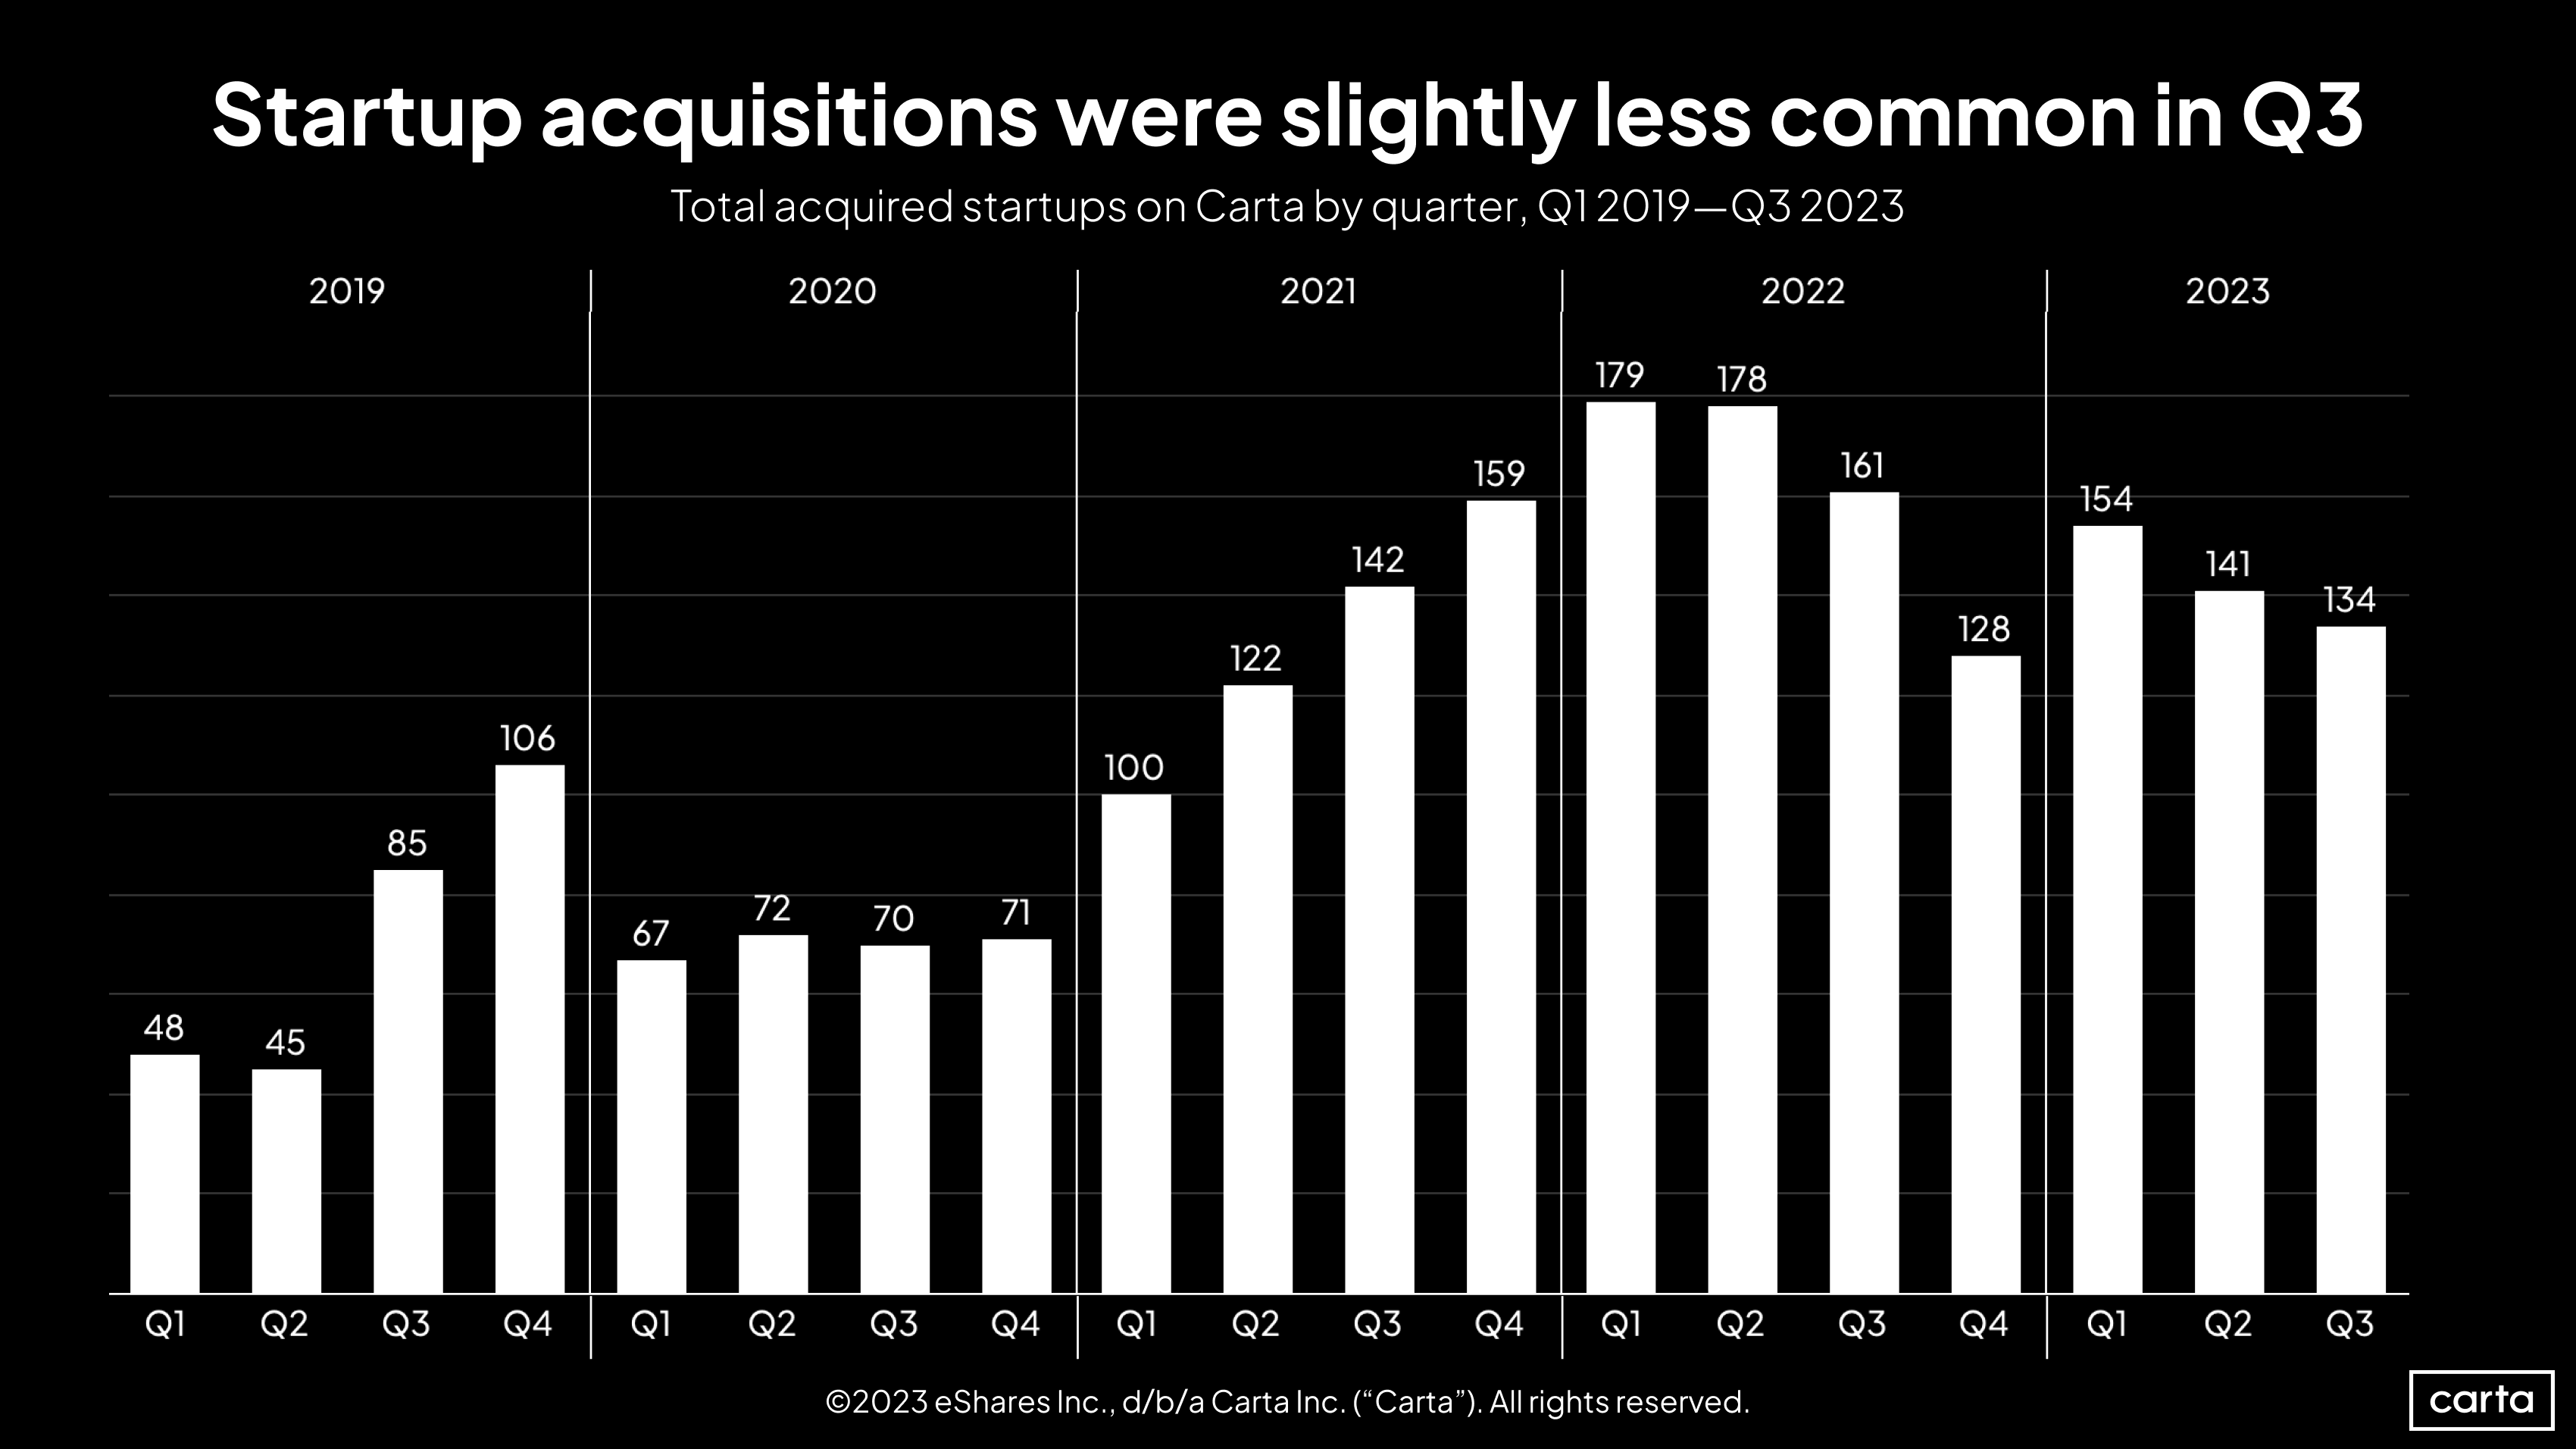
The number of acquired startups on Carta fell by about 5% in Q3, declining to 134. But that figure is still in line with numbers from the past several quarters. In fact, compared to the volatility that abounds in so many other corners of the venture landscape, the market for startup M&A has been quite steady. The count of startup acquisitions has now been between 122 and 179 for 10 straight quarters.
Employee equity & movement
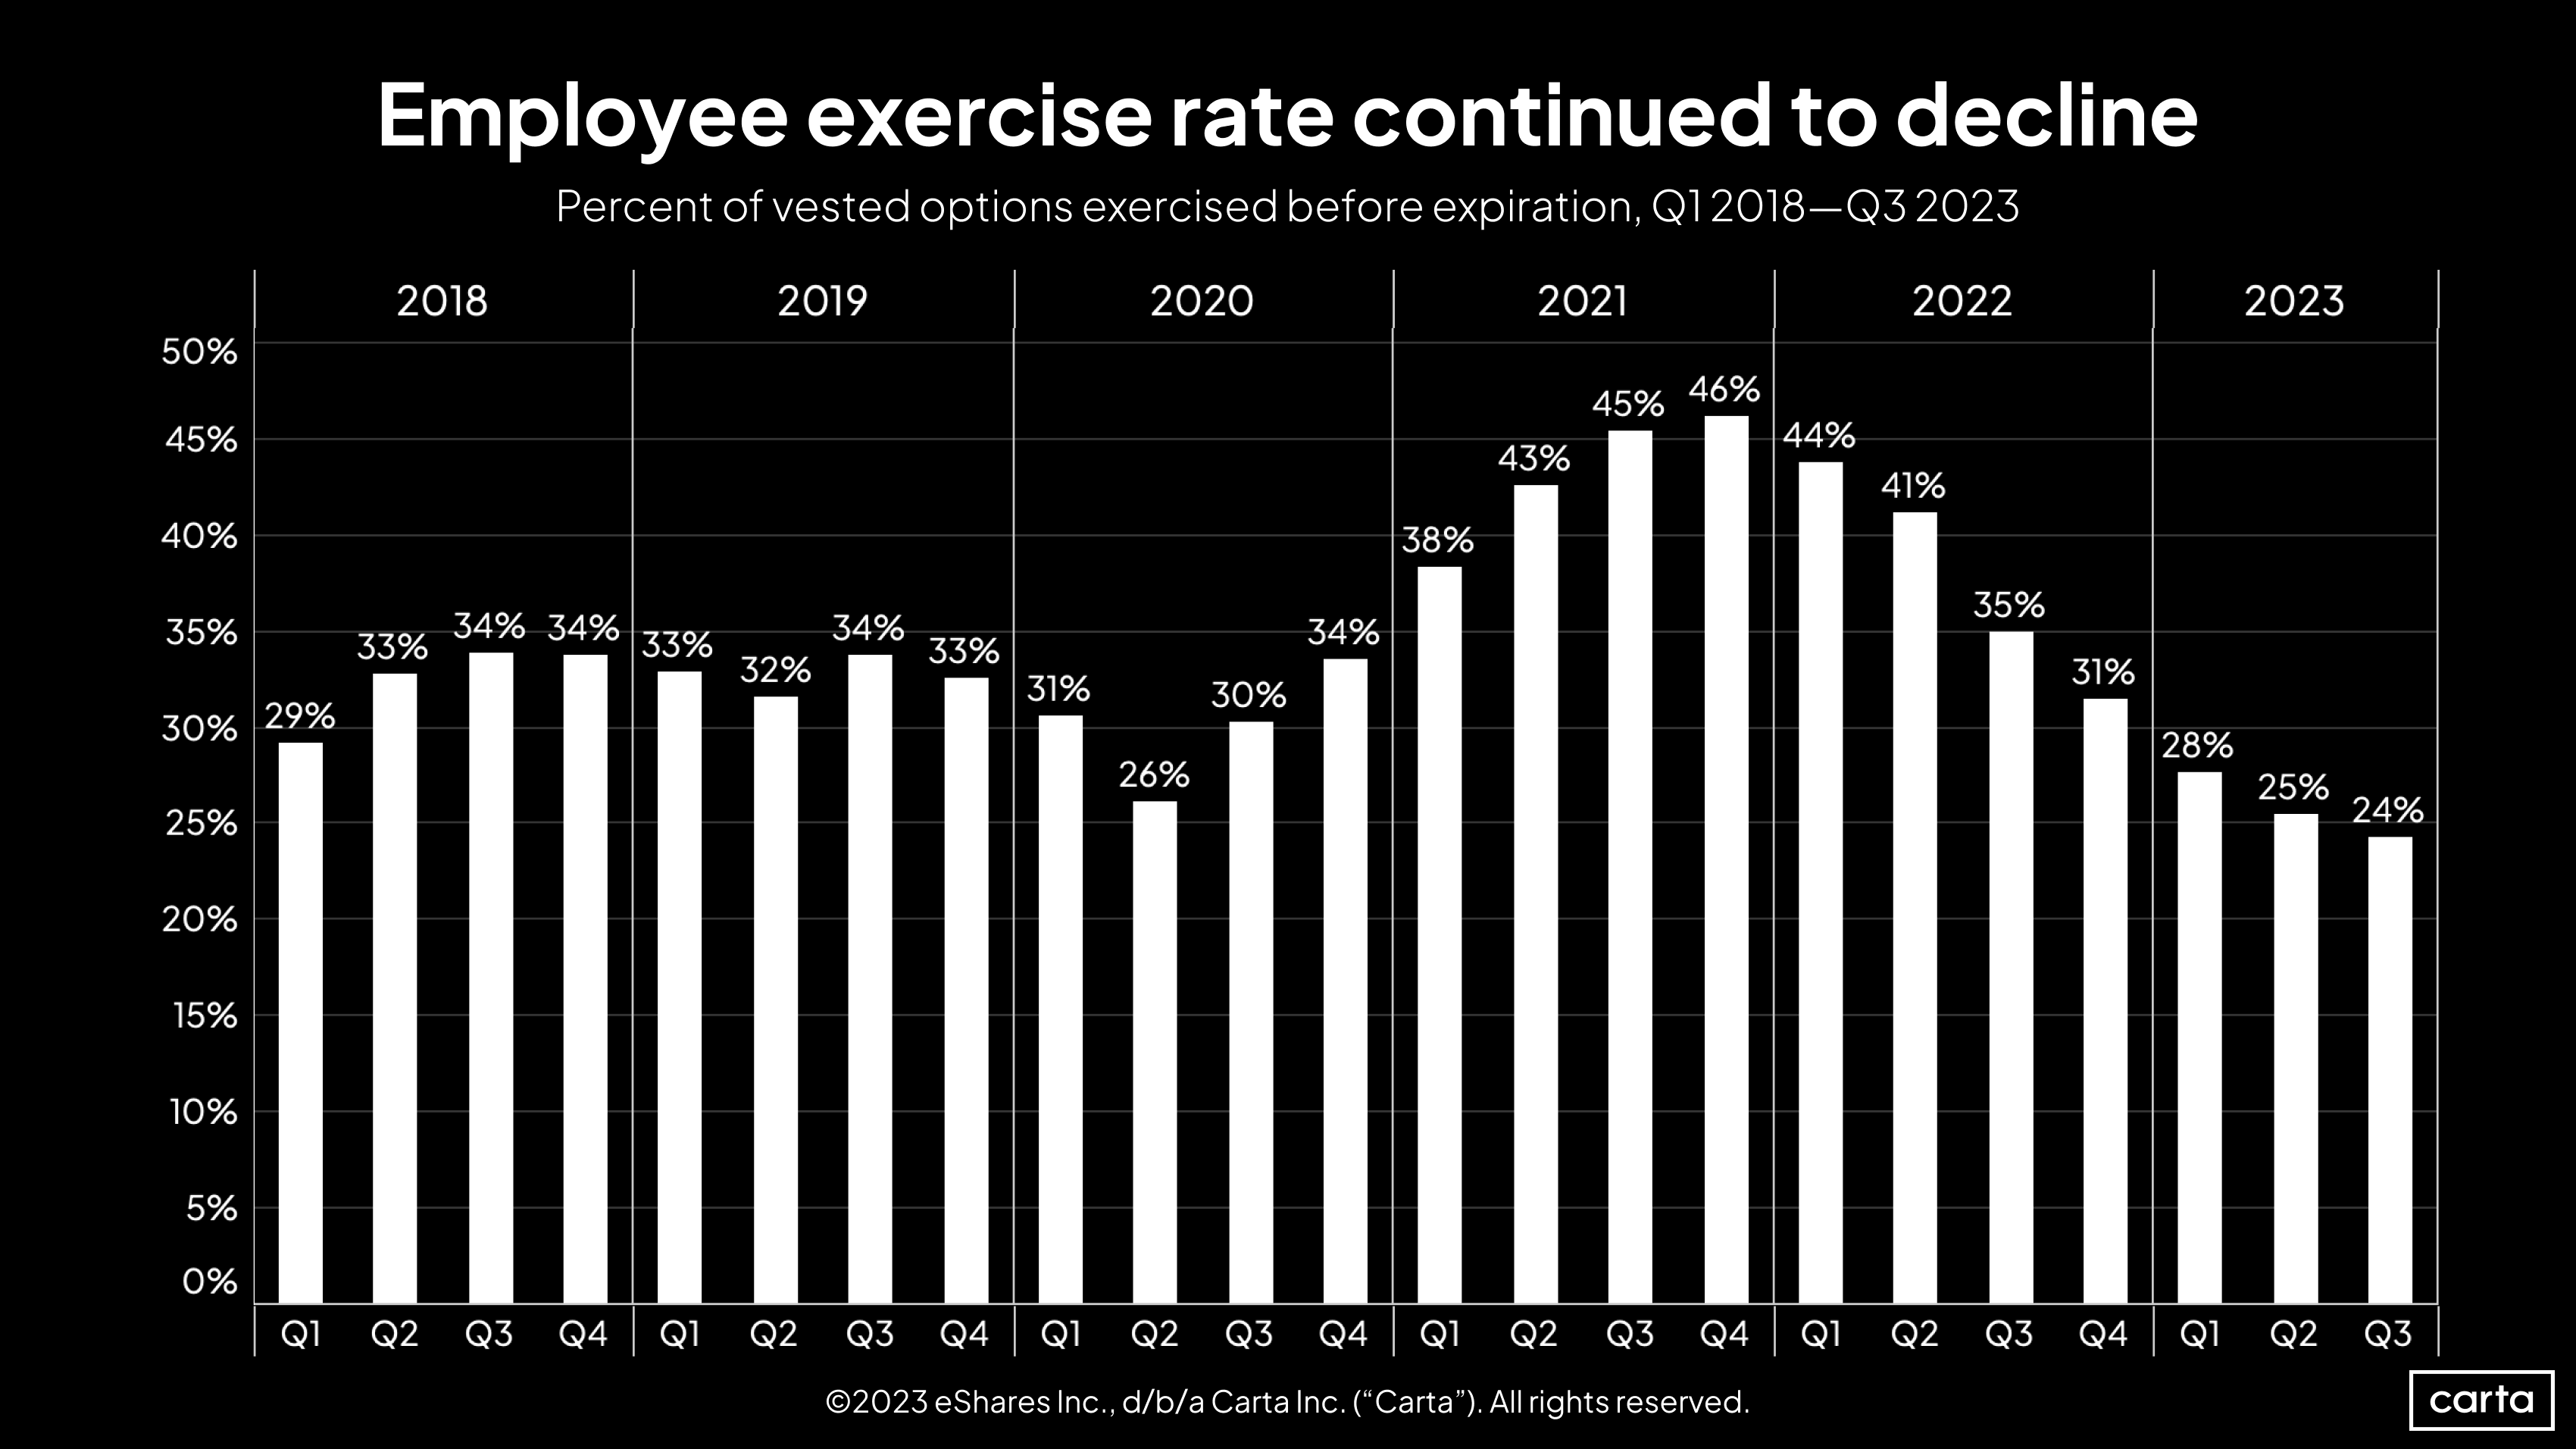
Employees at private companies on Carta opted to exercise just 24% of their vested stock options in Q3, the lowest quarterly exercise rate since at least 2018. This figure has now fallen for seven straight quarters, steadily dropping from a high point of 46% in Q4 2021.
Historically, there’s an inverse correlation between exercise rates and startup valuations: When valuations are in a period of decline, employees are less likely to exercise their vested shares, because those shares might be becoming less valuable relative to the strike price.
Median valuations increased at most venture stages in Q3, but the growth wasn’t significant enough to meaningfully impact employee decisions on whether to exercise.
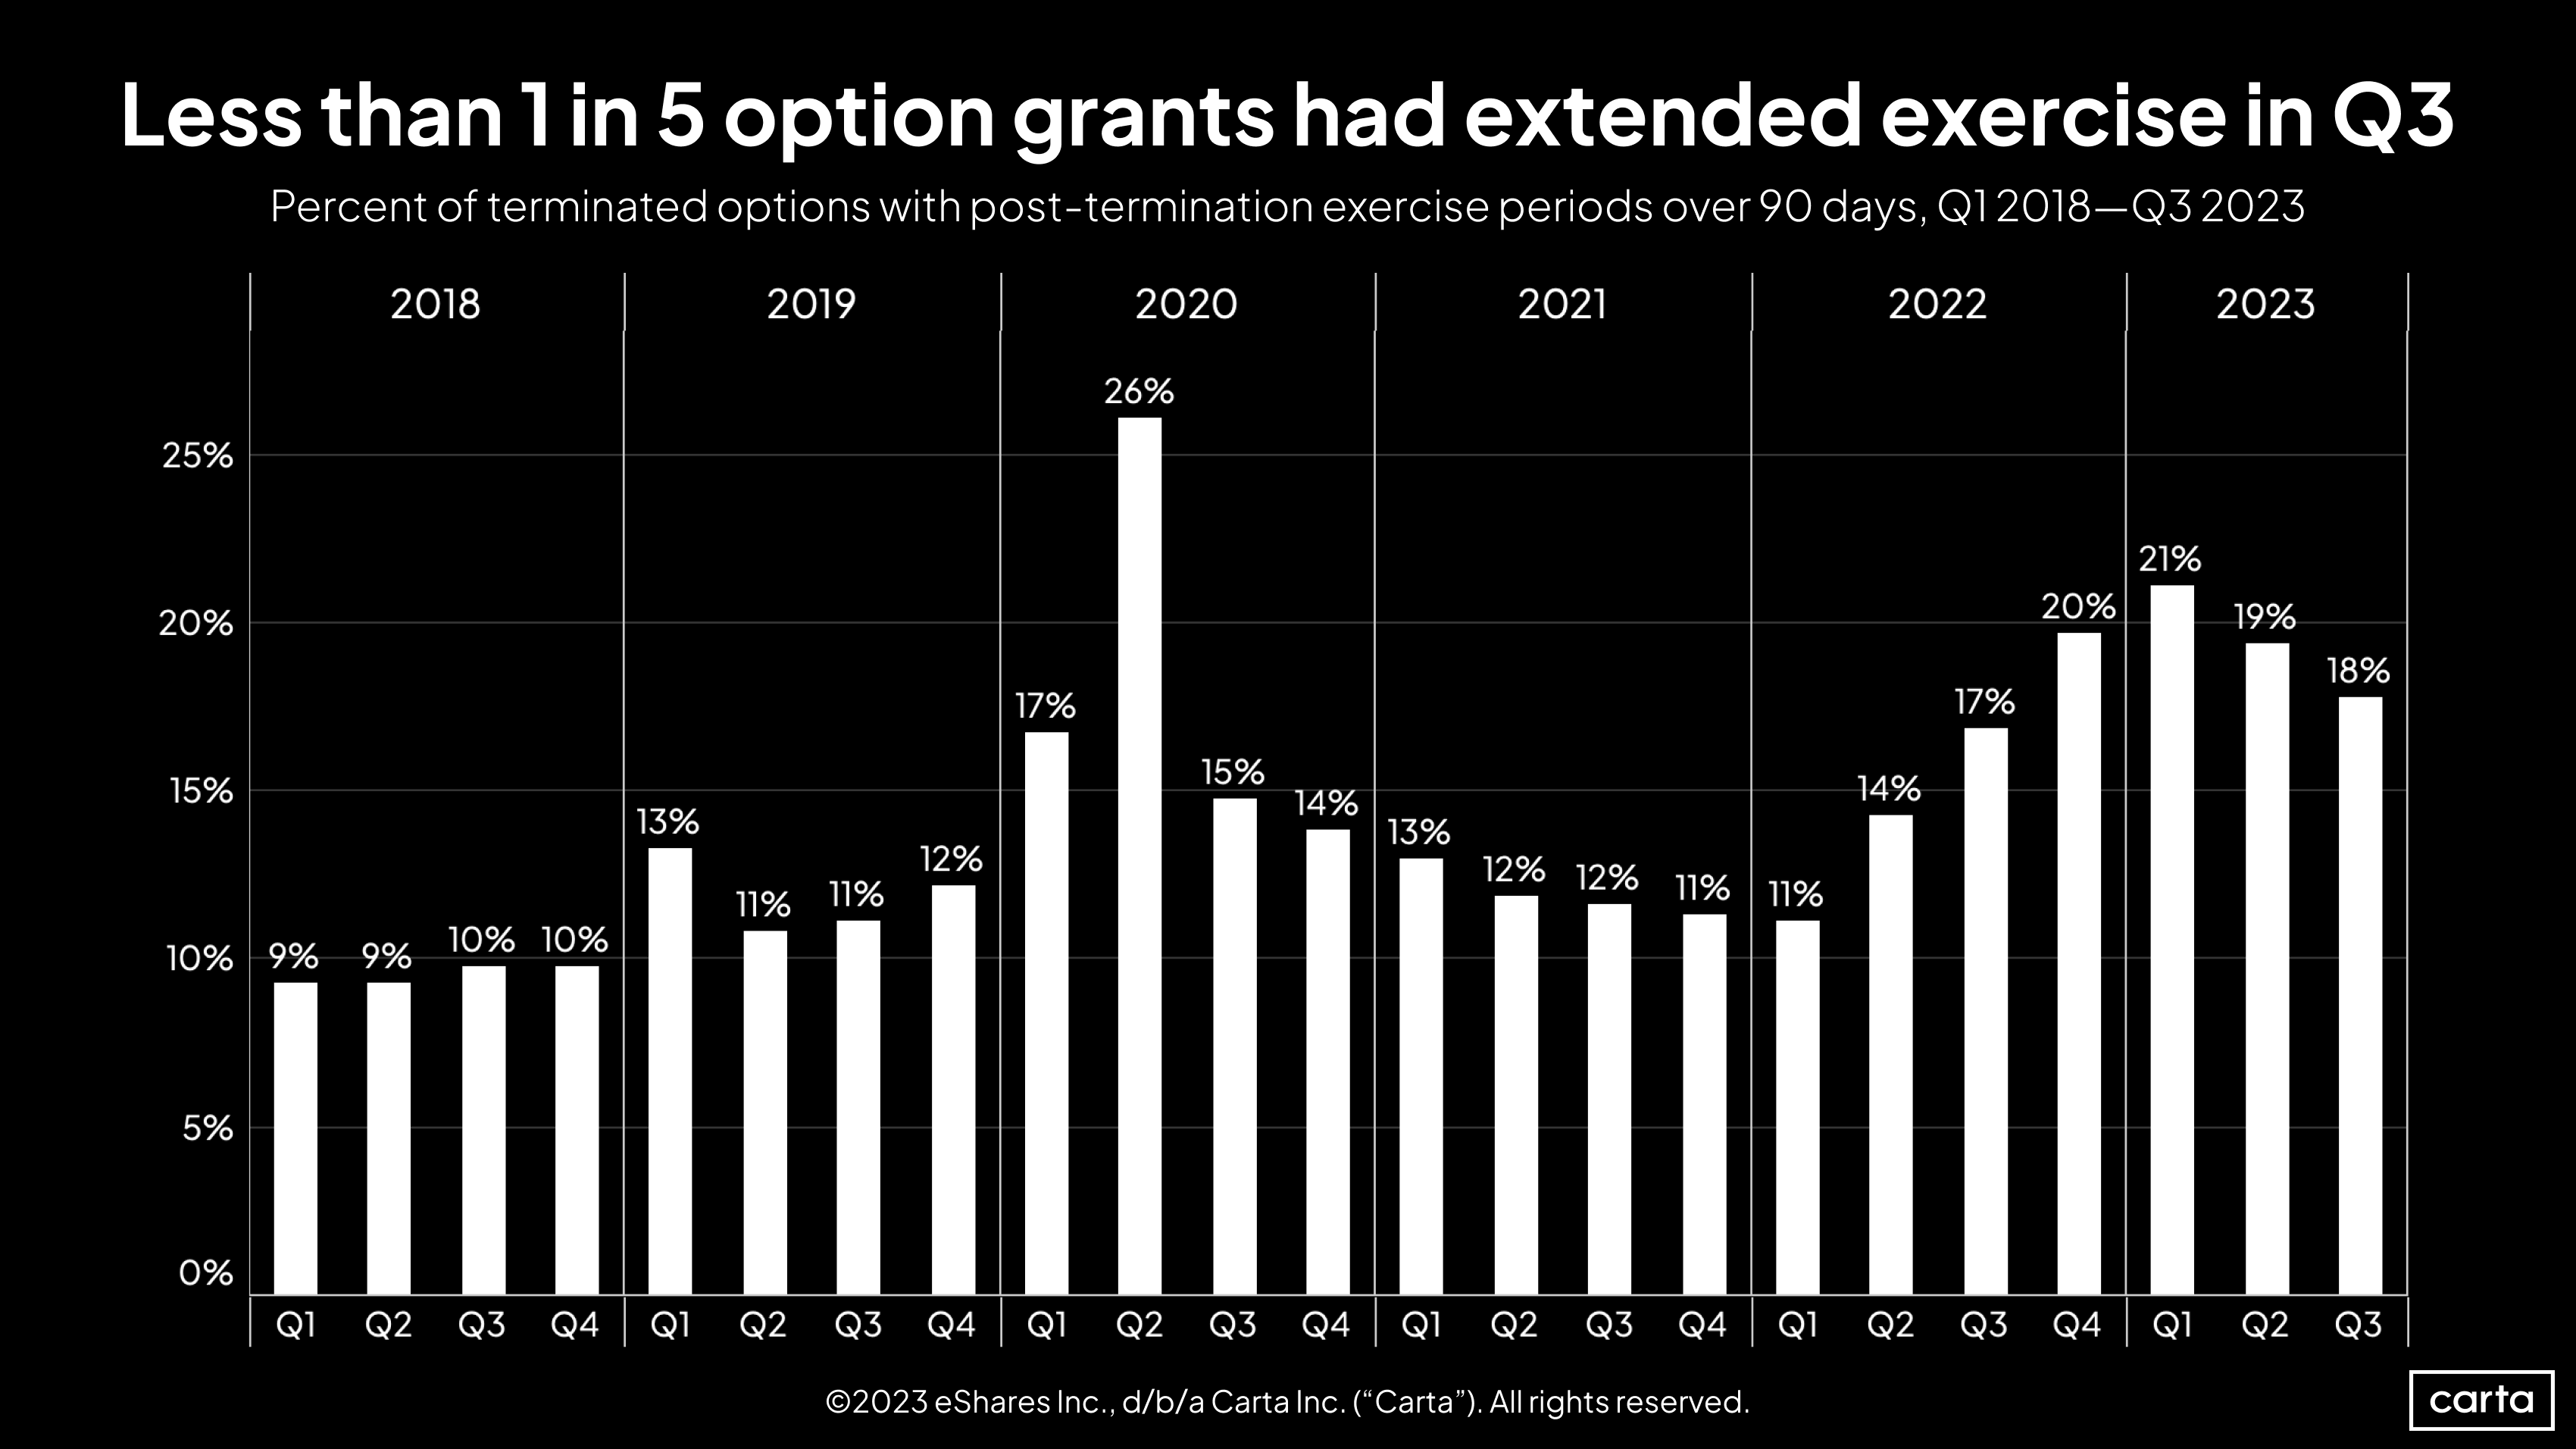
When an employee leaves a company, they typically have 90 days to choose whether to exercise any vested stock options or else lose those options forever. In Q3, companies offered employees longer than 90 days for 18% of all vested options, continuing a trend of extended post-termination exercise periods (PTEP) growing more popular in recent quarters.
If we treat the onset of the pandemic in Q2 2020 as an outlier, the average quarterly rate of extended PTEP from the start of 2018 to the end of 2021 was 11.9%. Since the start of 2022, the average quarterly rate has increased to 17.1%, and it’s up to 19.3% in 2023 alone.
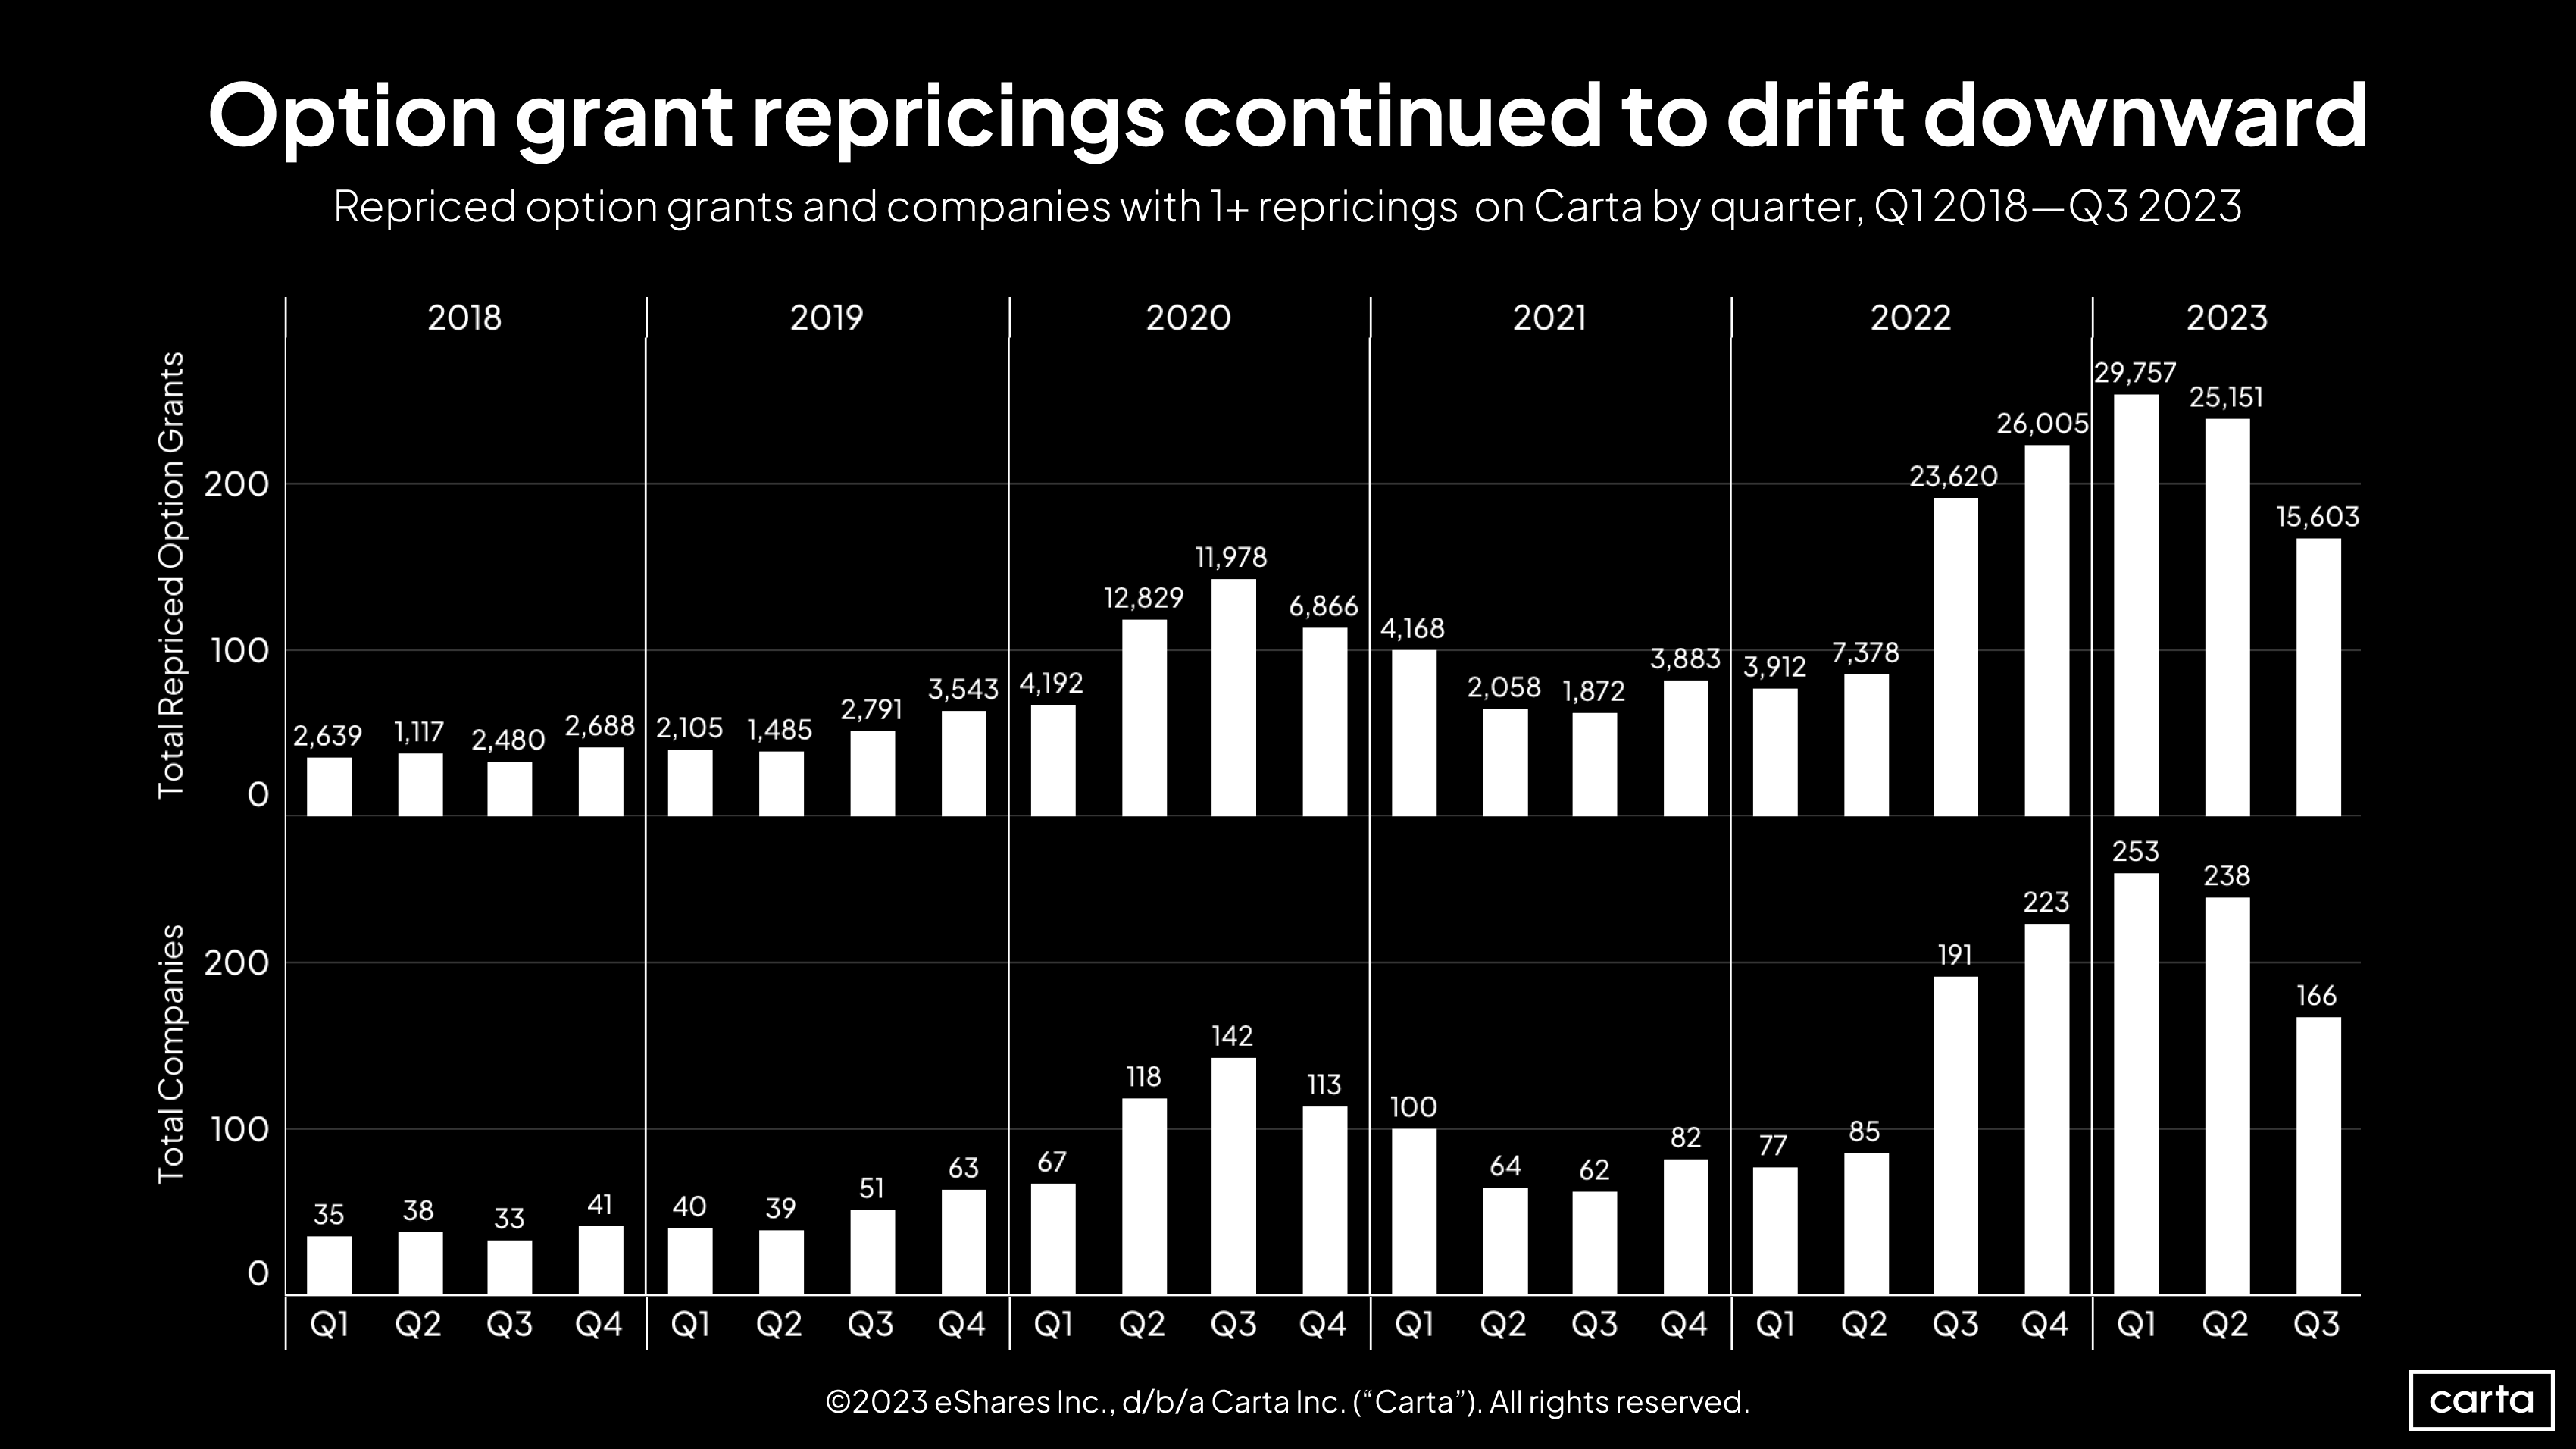
The recent history of repricings has a clear line of demarcation: Since the start of Q3 2022, companies have grown significantly more likely than they were before to reprice their option grants. Like many other notable VC trends, this one is linked to the recent downturn in valuations. If a company’s valuation declines, then existing option grants become less valuable to employees. Resetting those grants at a lower valuation is one way to make stock options a more appealing currency to employees and potential hires.
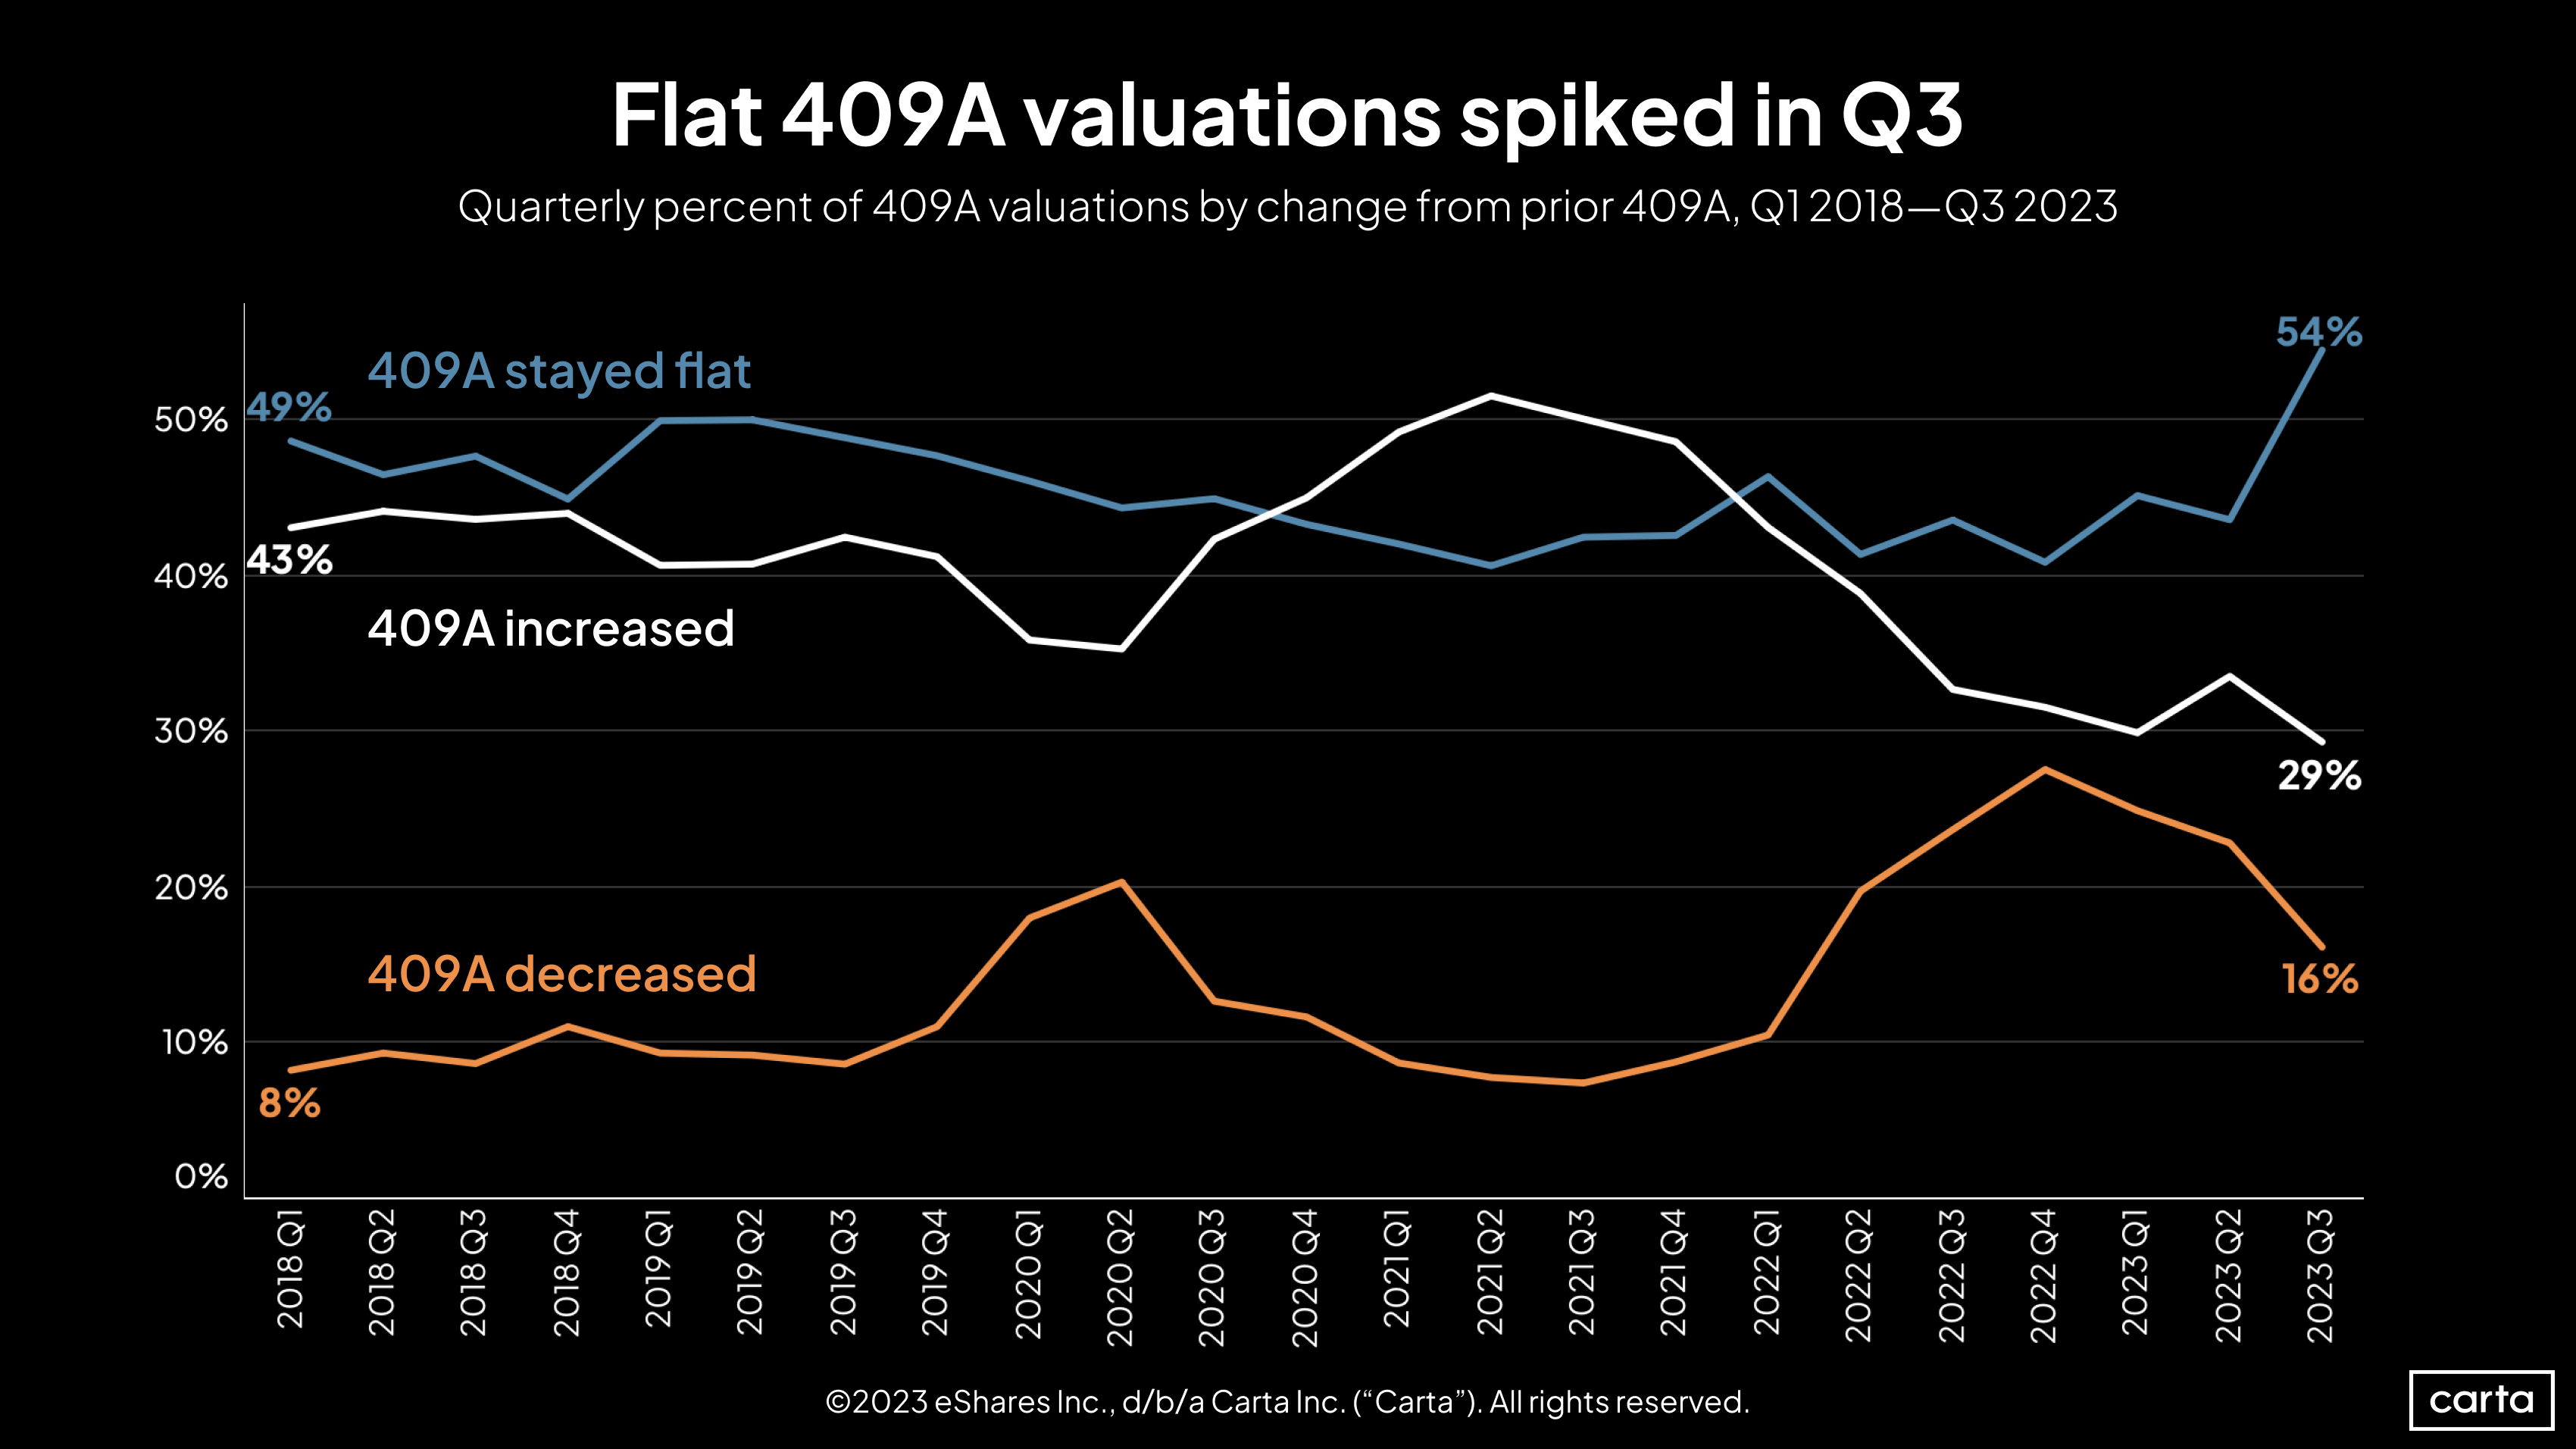
For the first time in at least the past six years, more than 50% of companies receiving new 409A valuations on Carta saw no change from their previous 409A. Flat valuations have been the most common outcome for several quarters now, but had never been the majority. In Q3, a flat 409A valuation was nearly twice as likely as a valuation increase.
Both 409A valuation increases and decreases grew less common in Q3, a historically uncommon occurrence. Typically, these two figures are inversely correlated. But the Q3 increase in flat rounds was large enough to defy that trend.
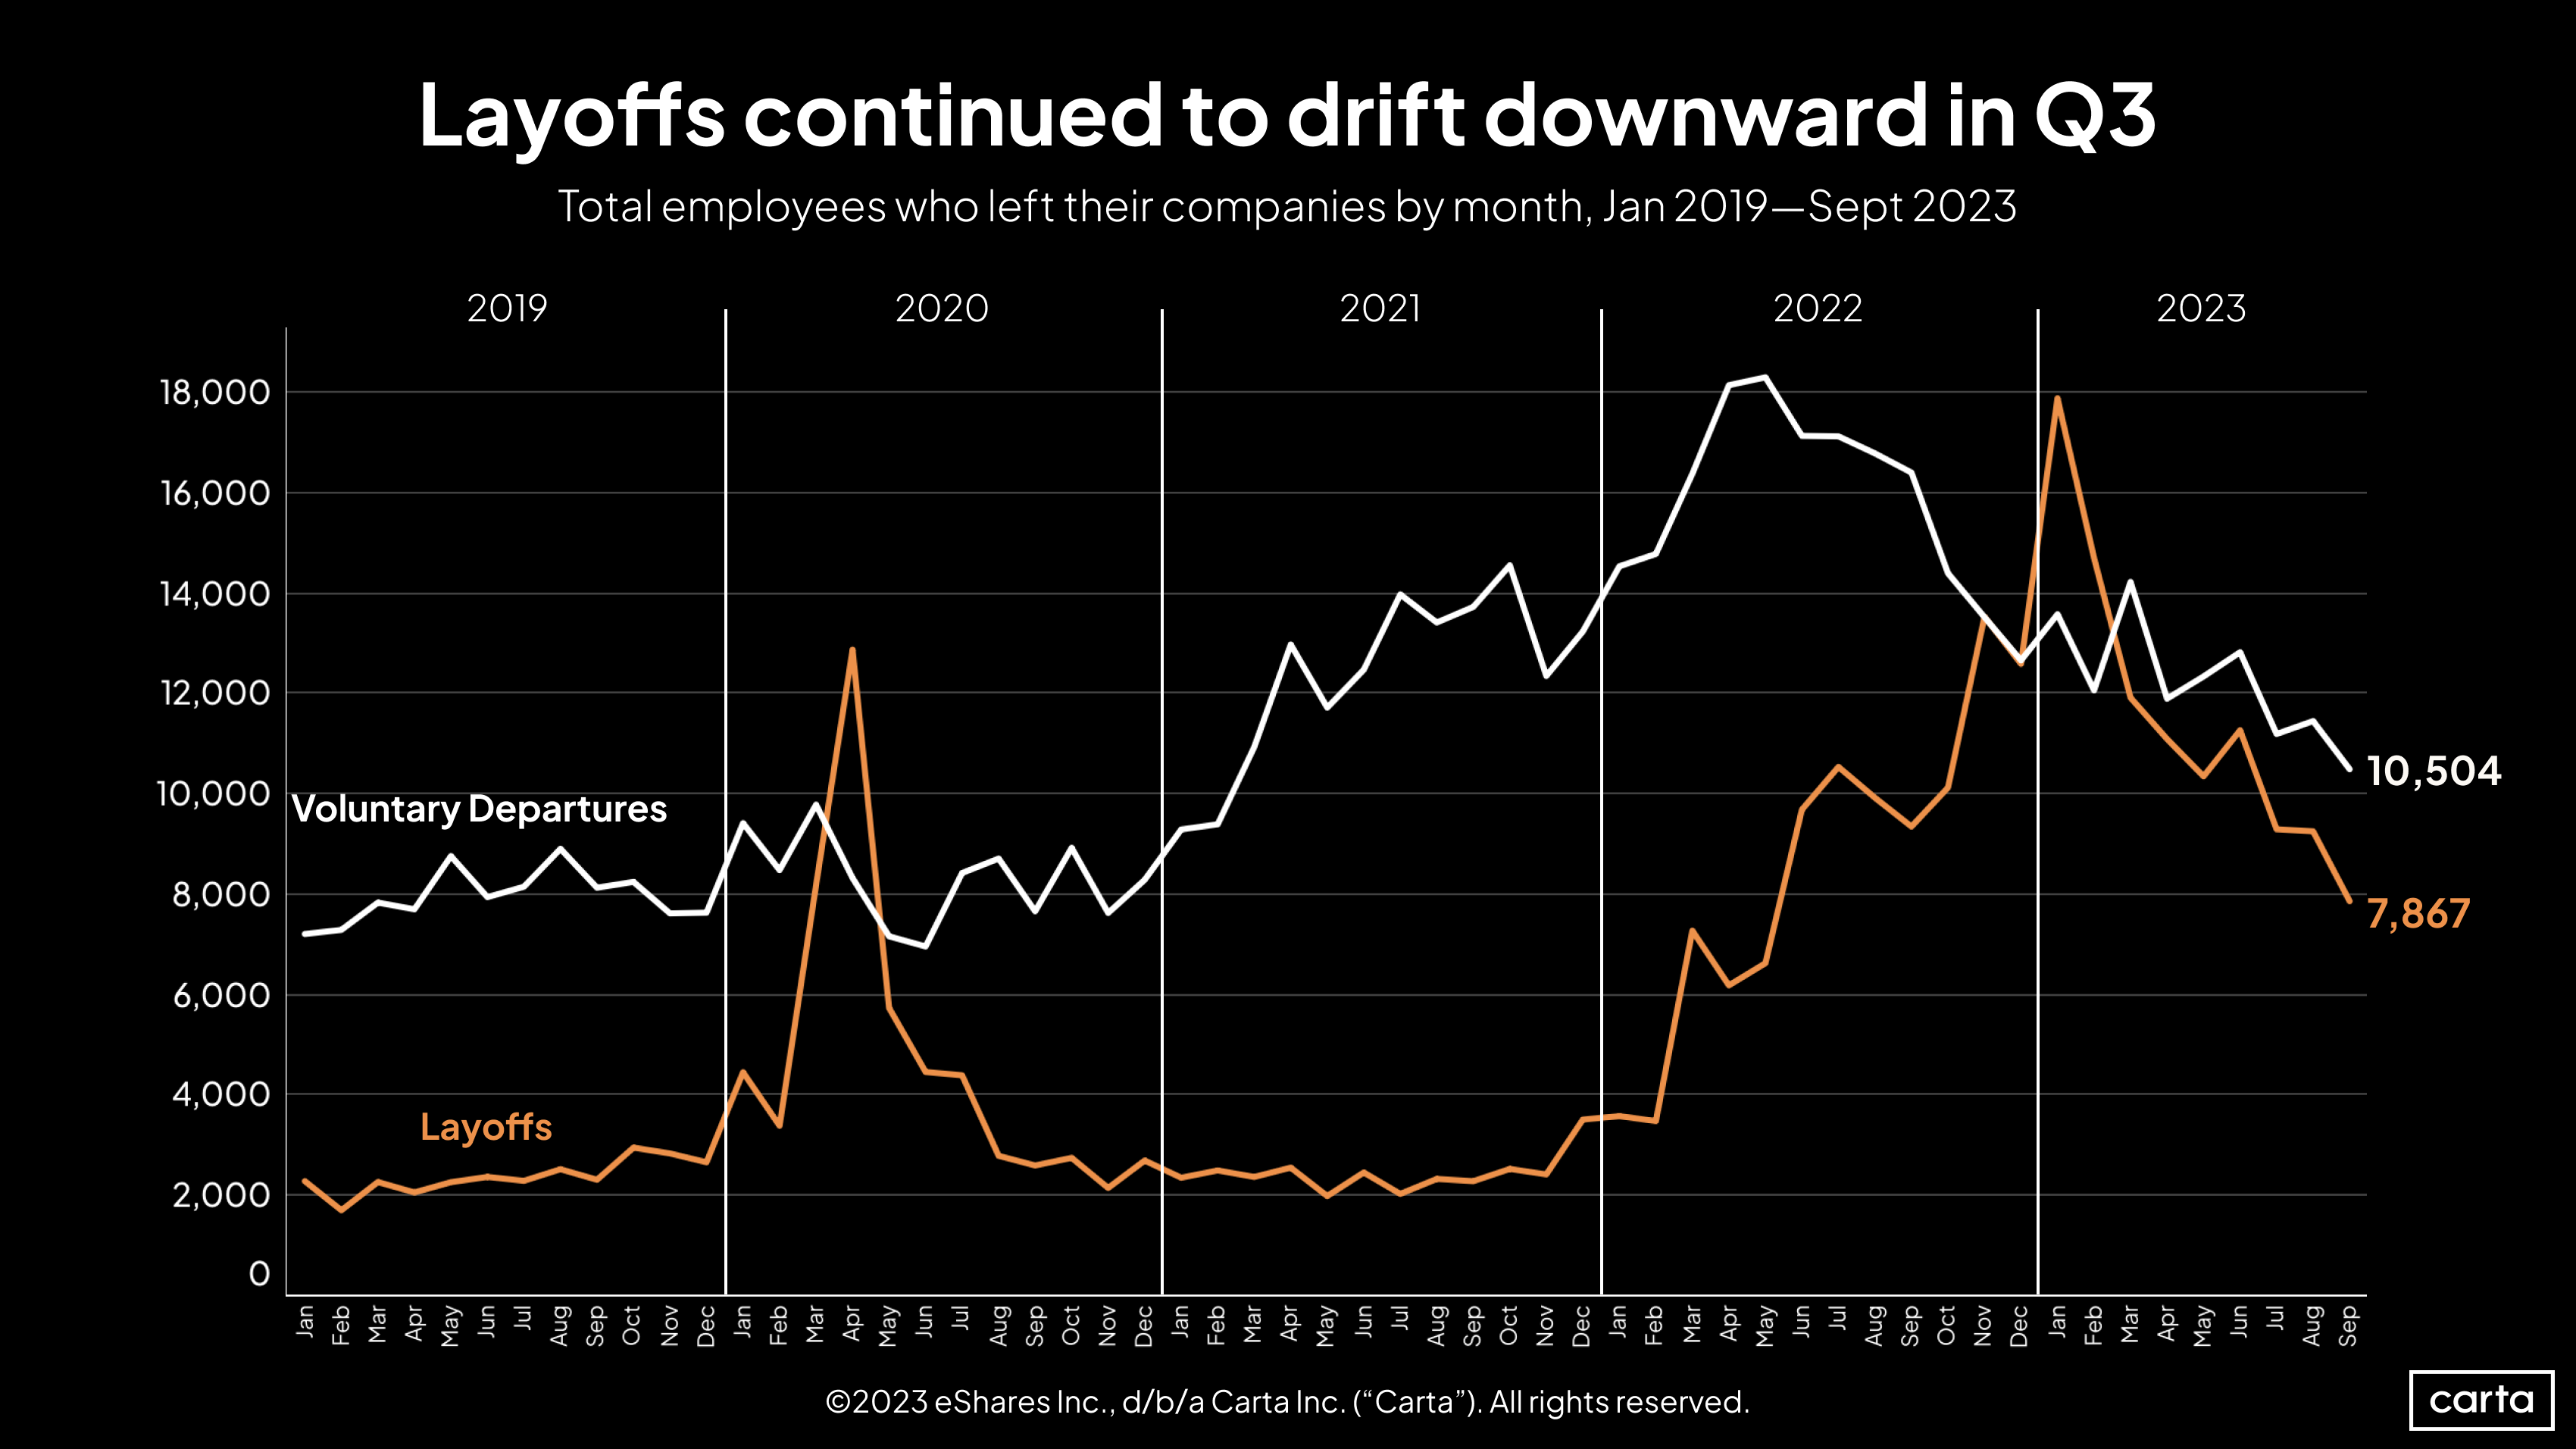
This year’s downward trends in the numbers of both voluntary job departures and layoffs continued in Q3. The number of layoffs by companies on Carta fell below 8,000 in September, the first time since May 2022 that it’s been so low.
These declines come as the number of companies and employees on Carta continues to grow. While the number of both voluntary and involuntary departures remains high relative to what we saw in 2019 and 2020, this is partly due to the increased size of the overall sample.
Industry-specific data
Download the addendum to this quarter's report to get industry-specific data on fundraising and valuations.
Methodology
Carta helps more than 41,000 primarily venture-backed companies and 2,300,000 security holders manage over $2.9 trillion in equity. We share insights from this unmatched dataset about the private markets and venture ecosystem to help founders, employees, and investors make informed decisions and understand market conditions.
Overview
This study uses an aggregated and anonymized sample of Carta customer data. Companies that have contractually requested that we not use their data in anonymized and aggregated studies are not included in this analysis.
The data presented in this private markets report represents a snapshot as of Oct 24, 2023. Historical data may change in future studies because there is typically an administrative lag between the time a transaction took place and when it is recorded in Carta. In addition, new companies signing up for Carta’s services will increase historical data available for the report.
Financings
Financings include equity deals raised in USD by U.S.-based corporations. The financing “series” (e.g. Series A) is taken from the legal share class name. Financing rounds that don’t follow this standard are not included in any data shown by series but are included in data not shown by series. Primary rounds are defined as the first equity round within a series. Bridge rounds are defined as any round raised after the first round in a given series. If there is no indication that a round is a primary or bridge round, both are included.
In some cases, convertible notes are raised and converted at various discounted prices within a series (e.g. Series A-1, Series A-2, Series A-3). In these cases, converted securities are not included in cash raised, and only the post-money valuation of the new money is included.
Terminations
Terminations entered into Carta must include a reason. Involuntary terminations include both terminations for performance and company layoffs. Voluntary terminations are employees who decided to leave of their own accord. Other termination reasons, including for cause, death, disability, and retirement were not included in the data and make up less than 1% of all terminations combined.


DISCLOSURE: This communication is on behalf of eShares Inc., d/b/a Carta Inc. ("Carta"). This communication is for informational purposes only, and contains general information only. Carta is not, by means of this communication, rendering accounting, business, financial, investment, legal, tax, or other professional advice or services. This publication is not a substitute for such professional advice or services nor should it be used as a basis for any decision or action that may affect your business or interests. Before making any decision or taking any action that may affect your business or interests, you should consult a qualified professional advisor. This communication is not intended as a recommendation, offer or solicitation for the purchase or sale of any security. Carta does not assume any liability for reliance on the information provided herein. ©2023 eShares Inc., d/b/a Carta Inc. ("Carta"). All rights reserved. Reproduction prohibited.