As more startups and investors join Carta, high-level trends of the venture industry become easier to spot in our data. In a previous blog post we analyzed how long it actually takes to get funded. Using this aggregate and anonymized data set, we studied the revenue of startups at different funding rounds. Then we dove into industry-level estimates of revenue multiples.
Increasing Revenue Pressure at Later Funding Rounds
As startups move into later stages of funding, the pressure to produce revenue increases. The following graph shows the percentage of startups, with and without revenue, at different rounds.
Percentage of Startups with and without Revenue by Funding Round

More than half of Seed stage companies don’t have any revenue, but the pressure to be making money quickly builds up. Only about a third of A stage startups have zero revenue, which declines to 15.6 and 5.6 percent for B and C rounds, respectively.
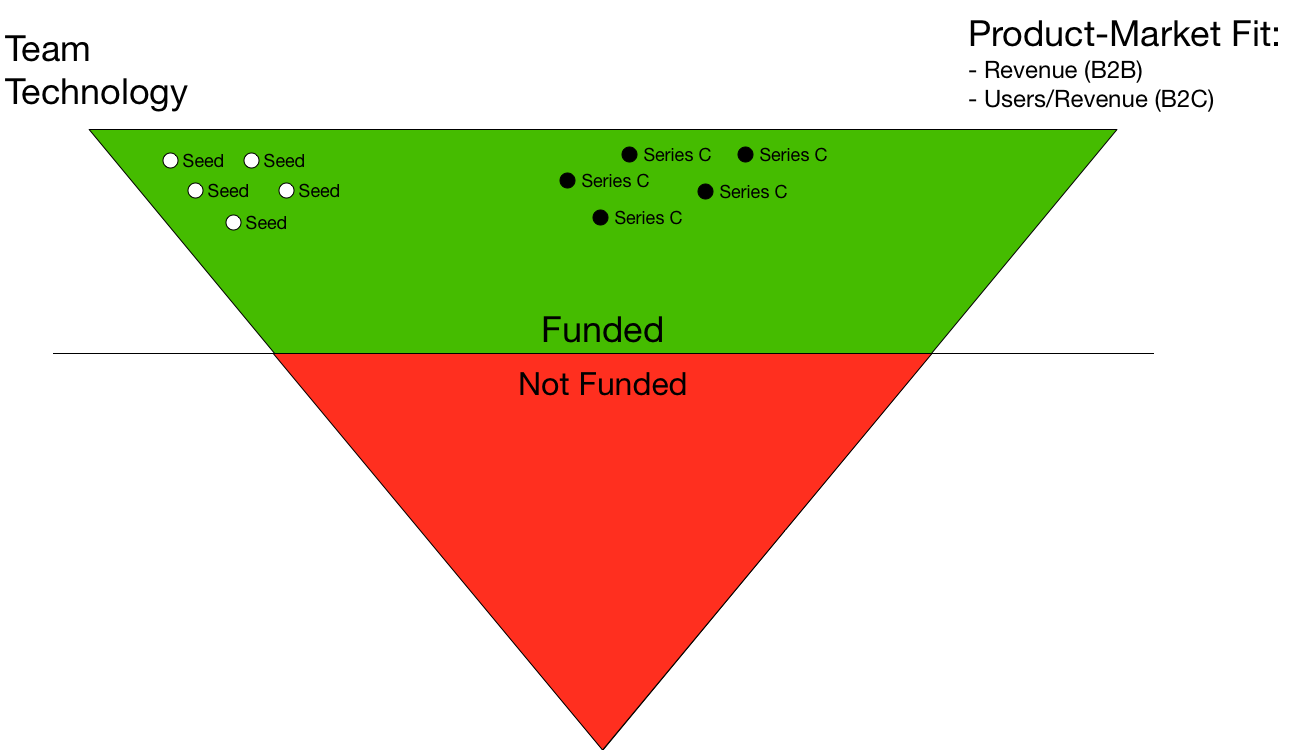
This trend makes sense. As startups mature, the ability to prove that they can execute on their vision increases. For most startups—especially B2B ventures — this involves sales. The following diagram depicts this idea.
Next we analyzed the revenue distribution at each stage of funding. We grouped startups into three revenue segments:
-
Less than $1M annual revenue
-
Between $1M and $10M annual revenue
-
More than $10M annual revenue
Revenue Distribution by Funding Round
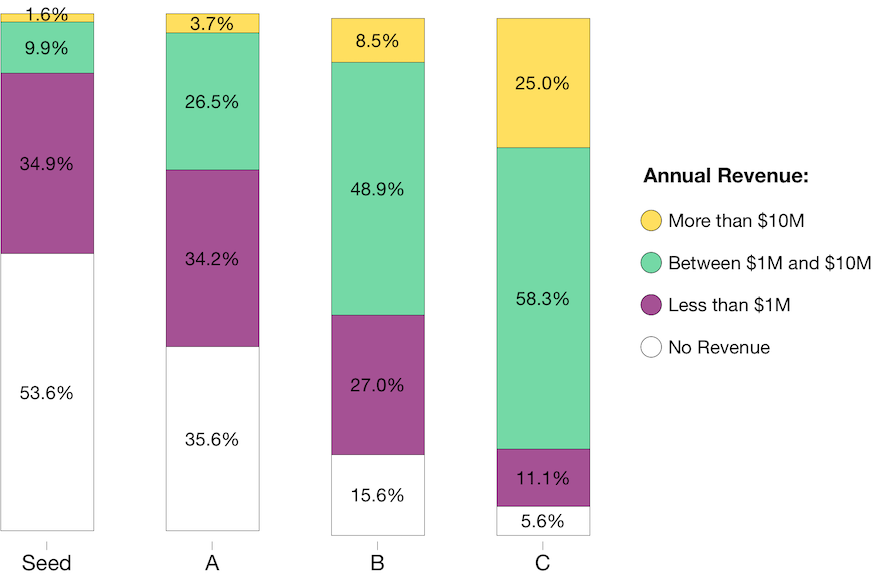
As expected, the companies at the later stages of funding are more likely to have higher revenues. Startups with an annual revenue between $1M and $10M a year represent 9.9 percent of Seed stage financings. This group of companies increases to 48.9 and 58.3 percent at the B and C round, respectively. Note that companies with more than $10M a year in annual revenue represent a quarter of stage C stage financings.
Increasing Revenue Pressure over Time
Besides the increasing pressure for revenue at later funding rounds, a second revenue pressure is observed when we analyze the data across cohorts.
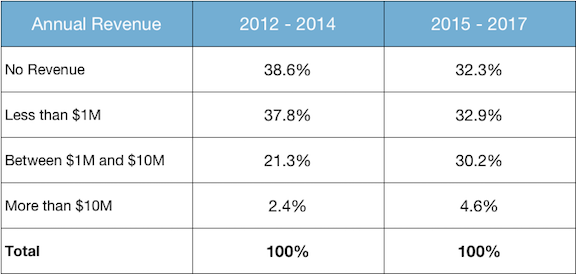
In the past few years there has been a shift in VC funding practices. The data from Carta indicated that since 2015, VC firms are less interested in funding startups with no revenue. The next table shows the revenue distribution of funded startups at the Seed stage over time.
Revenue Distribution at Seed Stage, pre- and post-2015

In the last two years, seed startups with an annual revenue above $1M have increased there share of the market by about nine percentage points. These companies have crowded out the participation of startups with an annual revenue below the $1M mark.
Revenue Distribution at A Stage, pre- and post-2015
This same trend is observed for Series A rounds. Startups with an annual revenue of $1M or more now represent about 35 percent of A round financings, considerably higher than the 24 percent of just two years ago.
Revenue Multiples
We must ask the question: If entrepreneurs show they are able to deliver on their vision, have they seen that reflected in higher valuations for their companies?
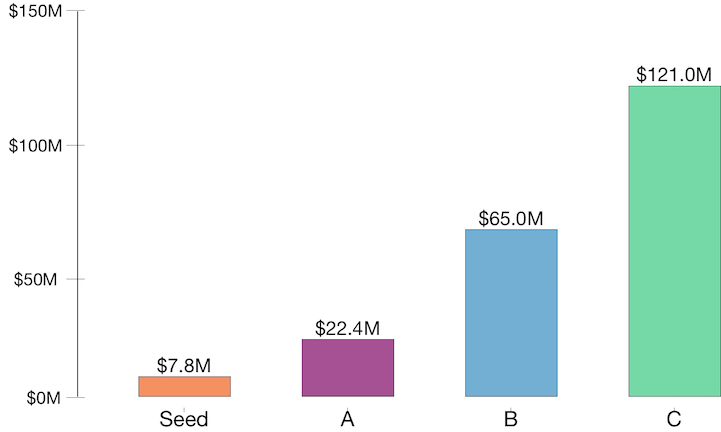
To answer this question we now complement the revenue trend analysis above with industry-level post-money valuations estimates. The next graph presents the median valuation by funding round for 2016.
Median Post-Money Valuations, 2016
We can now estimate revenue multiples.
The revenue multiple is defined as:
Please notice that it is not possible to compute revenue multiples for startups with no revenue, given that the ratio would simply go to infinity.
The median revenue multiple across all Seed, A, B, and C funding rounds for startups with revenue is equal to 20. (60 percent of the startups in our sample were producing revenue) This median estimate of 20x the annual revenue can serve as a baseline metric for post-money valuations in the venture industry.
If the post-money valuation has increased at the same rate as annual revenue, then the ratio between the denominator and the numerator should remain constant, producing the same revenue multiple. The table below shows the median revenue multiples for Seed and series A funding rounds.
Median Revenue Multiples for Seed and A Stage, pre- and post-2015
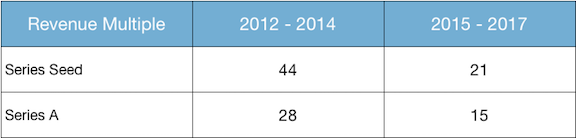
The multiples are clearly not constant. This indicates that startup valuations have not kept up with revenue growth. The ratio of post-money valuation to annual revenue has fallen about 45 percent for Seed and A funding rounds during the last two years.
Final Remarks
Adjusting to a shifting landscape is a required skill for any entrepreneur. Our Carta data set shows that the startup landscape is clearly shifting towards tangible results. VC firms are demanding annual sales of at least $1M for post-Seed funding rounds. “Selling the dream”, as they say in the industry, is getting harder. Therefore, entrepreneurs planning to raise a next round in the near future should seriously consider revisiting their price structure in order to rebalance revenue versus growth. This will most likely increase their chances of getting funded.
However, we need to consider possible external factors. It is possible that the pool of startups has changed, causing this shift in the data. Nevertheless, these revenue multiples are at least indicative of a less favorable funding environment than the one three years ago.
Carta will continue providing industry-level analyses to help inform the decision making process of startups around the world.