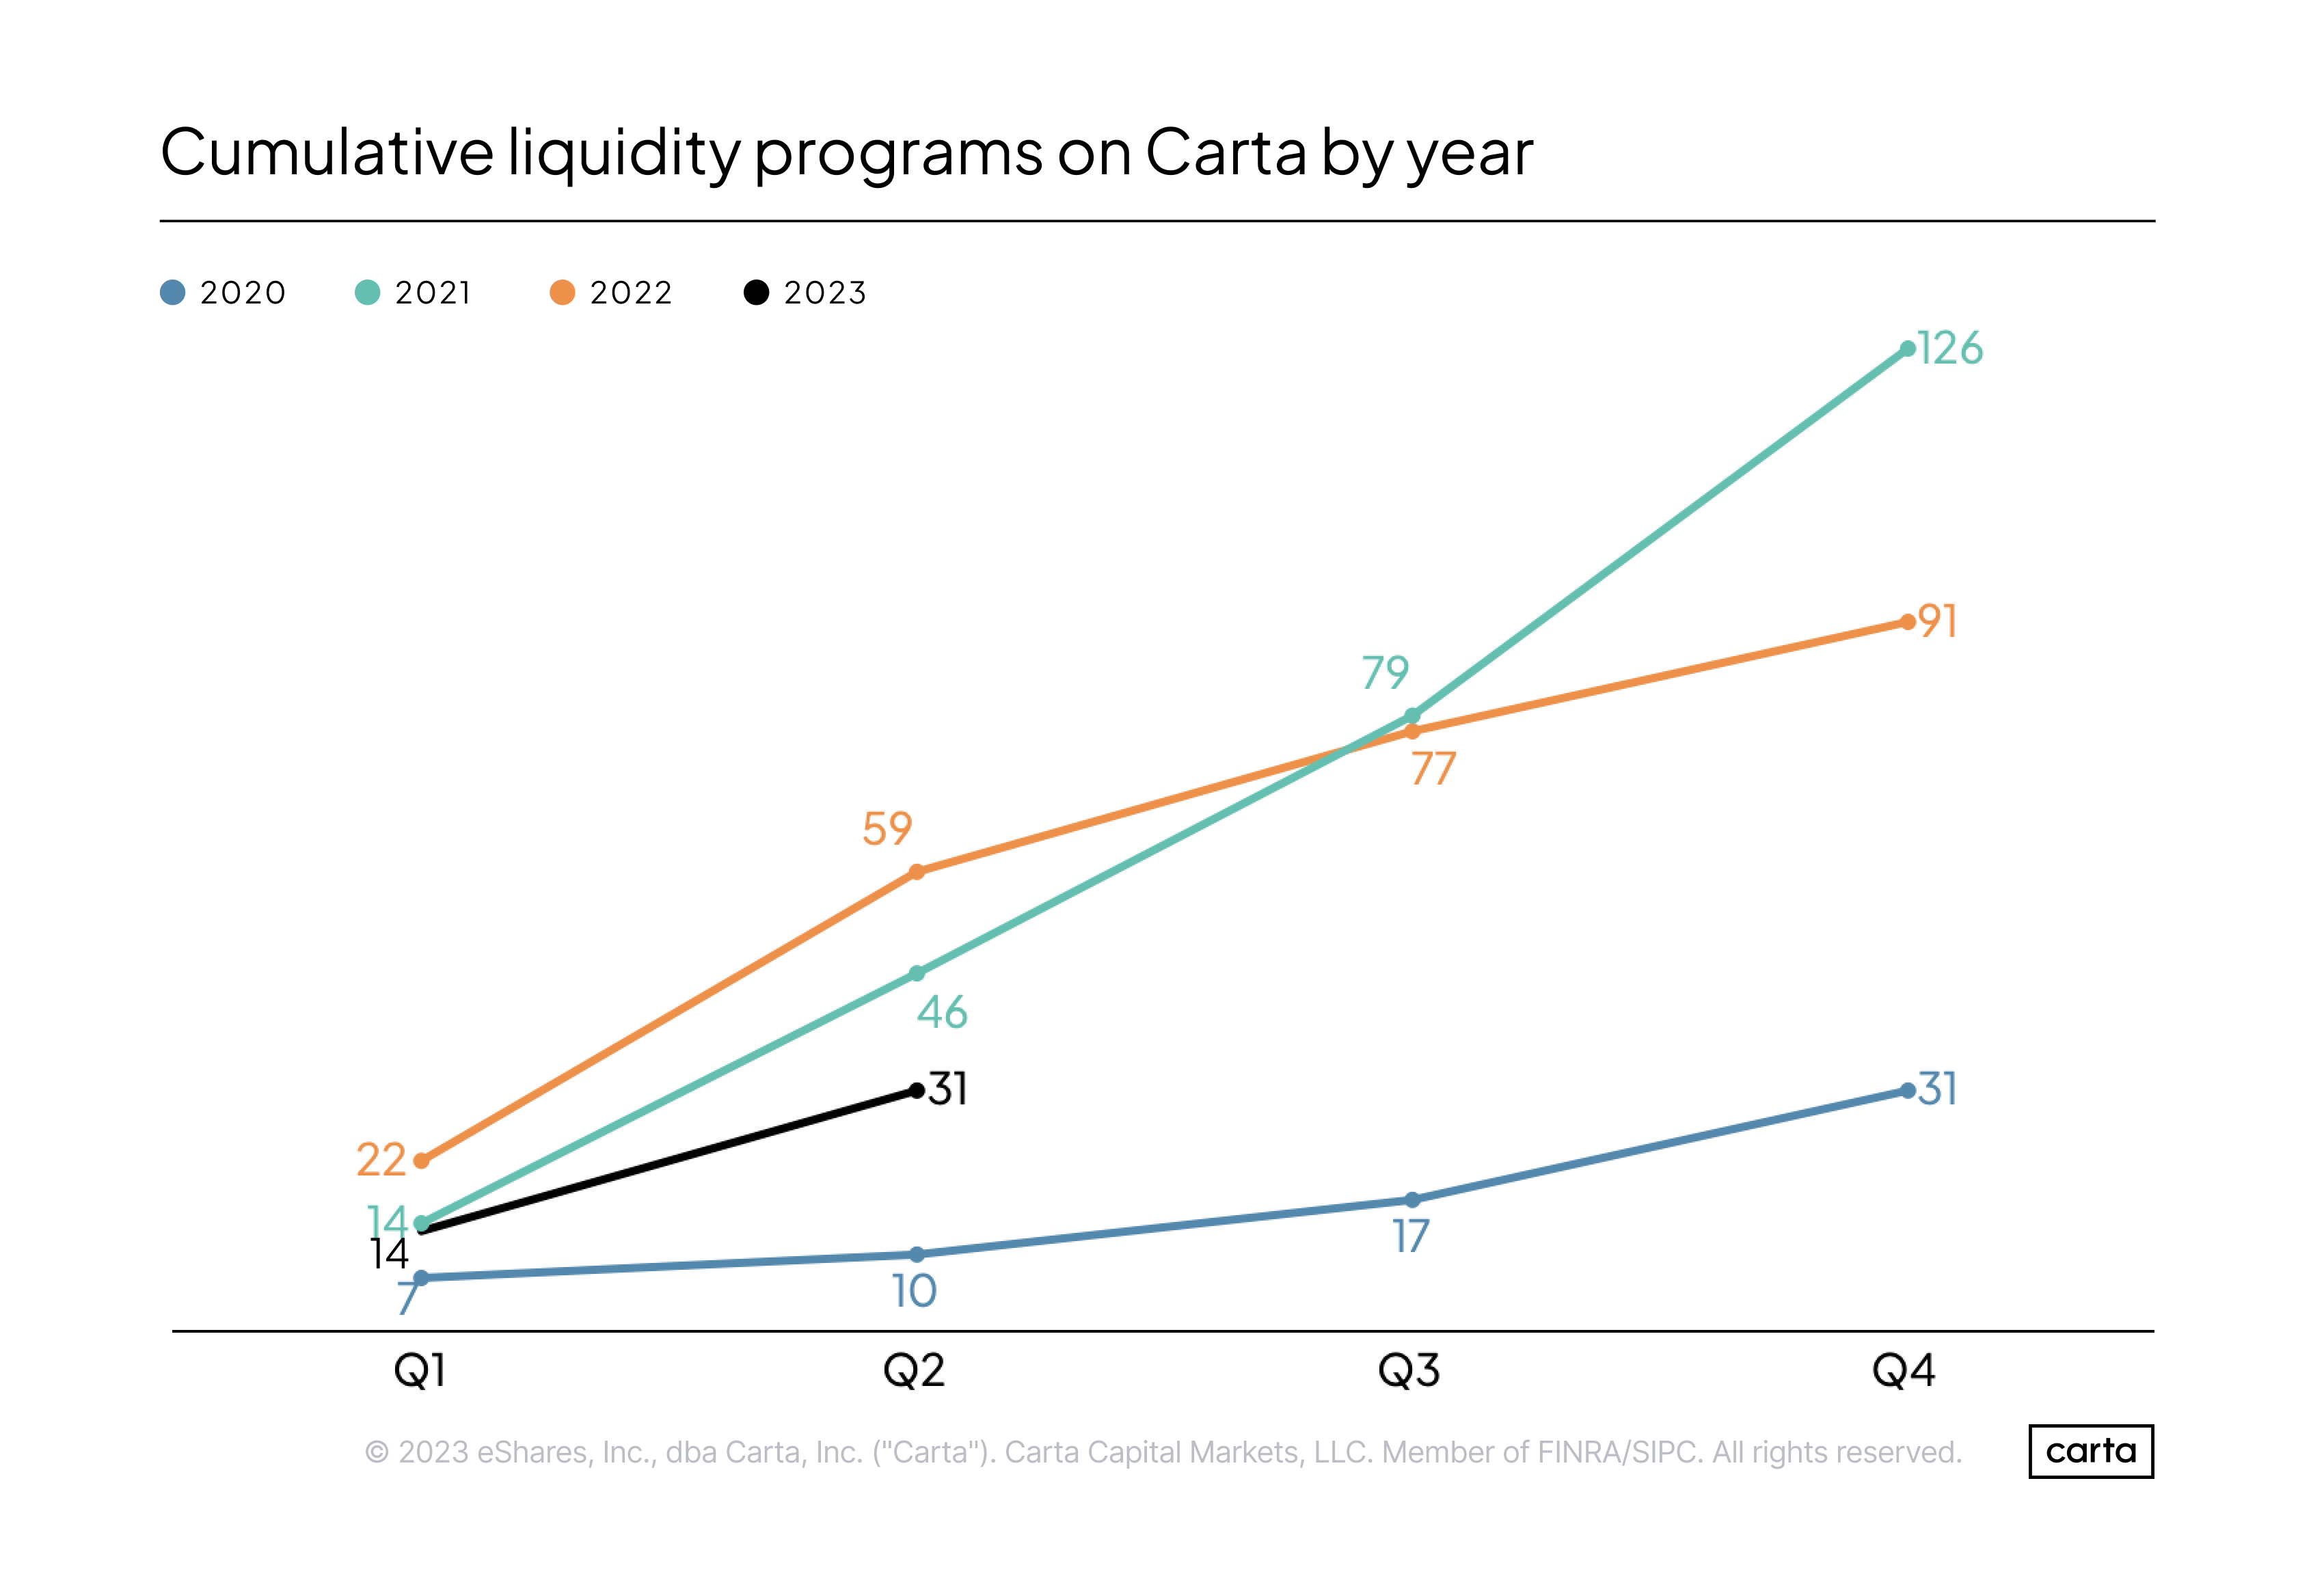
For the past year, the private secondary market has been in a holding pattern. There were 31 company-sponsored secondary transactions on Carta during the first half of 2023, almost equaling the 32 transactions that occurred in the second half of 2022.
Those figures are remarkably low relative to the brisk pace of secondaries transacted on Carta across 2021 and early 2022. In this regard, the private secondary market is consistent with trends in the rest of the private market ecosystem—beginning in Q2 2022, venture deal count declined for four consecutive quarters. The decline leveled off in Q2 of this year—and final totals may even show a slight uptick in dealcount last quarter. In terms of venture dollars raised, the private markets are also showing signs of a comeback. In line with these trends, there are signs that the private secondary market may be on the brink of picking back up.
Enthusiasm among both buyers and sellers in the secondary market had begun to increase in the first several weeks of 2023. But the collapse of Silicon Valley Bank sent shockwaves through the industry, forcing many companies to shift their focus to more basic financial questions and delaying potential primaries and secondaries. In recent months, however, conversations about private secondary transactions have again grown more common. More conversations will likely lead to more activity.
During much of 2022, the spread between what sellers were asking and what buyers would agree to pay (the bid-ask spread) was quite high—buyers believed that a valuation reset had occurred, but sellers were loath to part with their shares at what they still perceived as a discount. In the first half of the year, there was growing agreement on both sides that a reset had occurred. The bid-ask spread has started to narrow, a sign that buyers and sellers are getting closer to an equilibrium that can be conducive to more transactions.
Employees’ desire for liquidity could create another tailwind: Some large companies that delayed liquidity programs in recent quarters due to price concerns are once again considering tender offers, in part as a way to give their workers a long-awaited chance to sell some of their shares and convert their equity into cash.
This demand for private secondary transactions hasn’t gone anywhere. Investors want access to high-growth startups, and companies want liquidity for their employees and early backers who wish to exit their positions. The big questions for the rest of 2023 center on value—whether these two sides of the secondaries equation are able to agree on the proper price for the assets they hope to buy and sell.
The Carta Liquidity team is here to help you and your company navigate the evolving private markets. Write to us at company_coverage@cartacapitalmarkets.com.
Which companies are choosing liquidity?
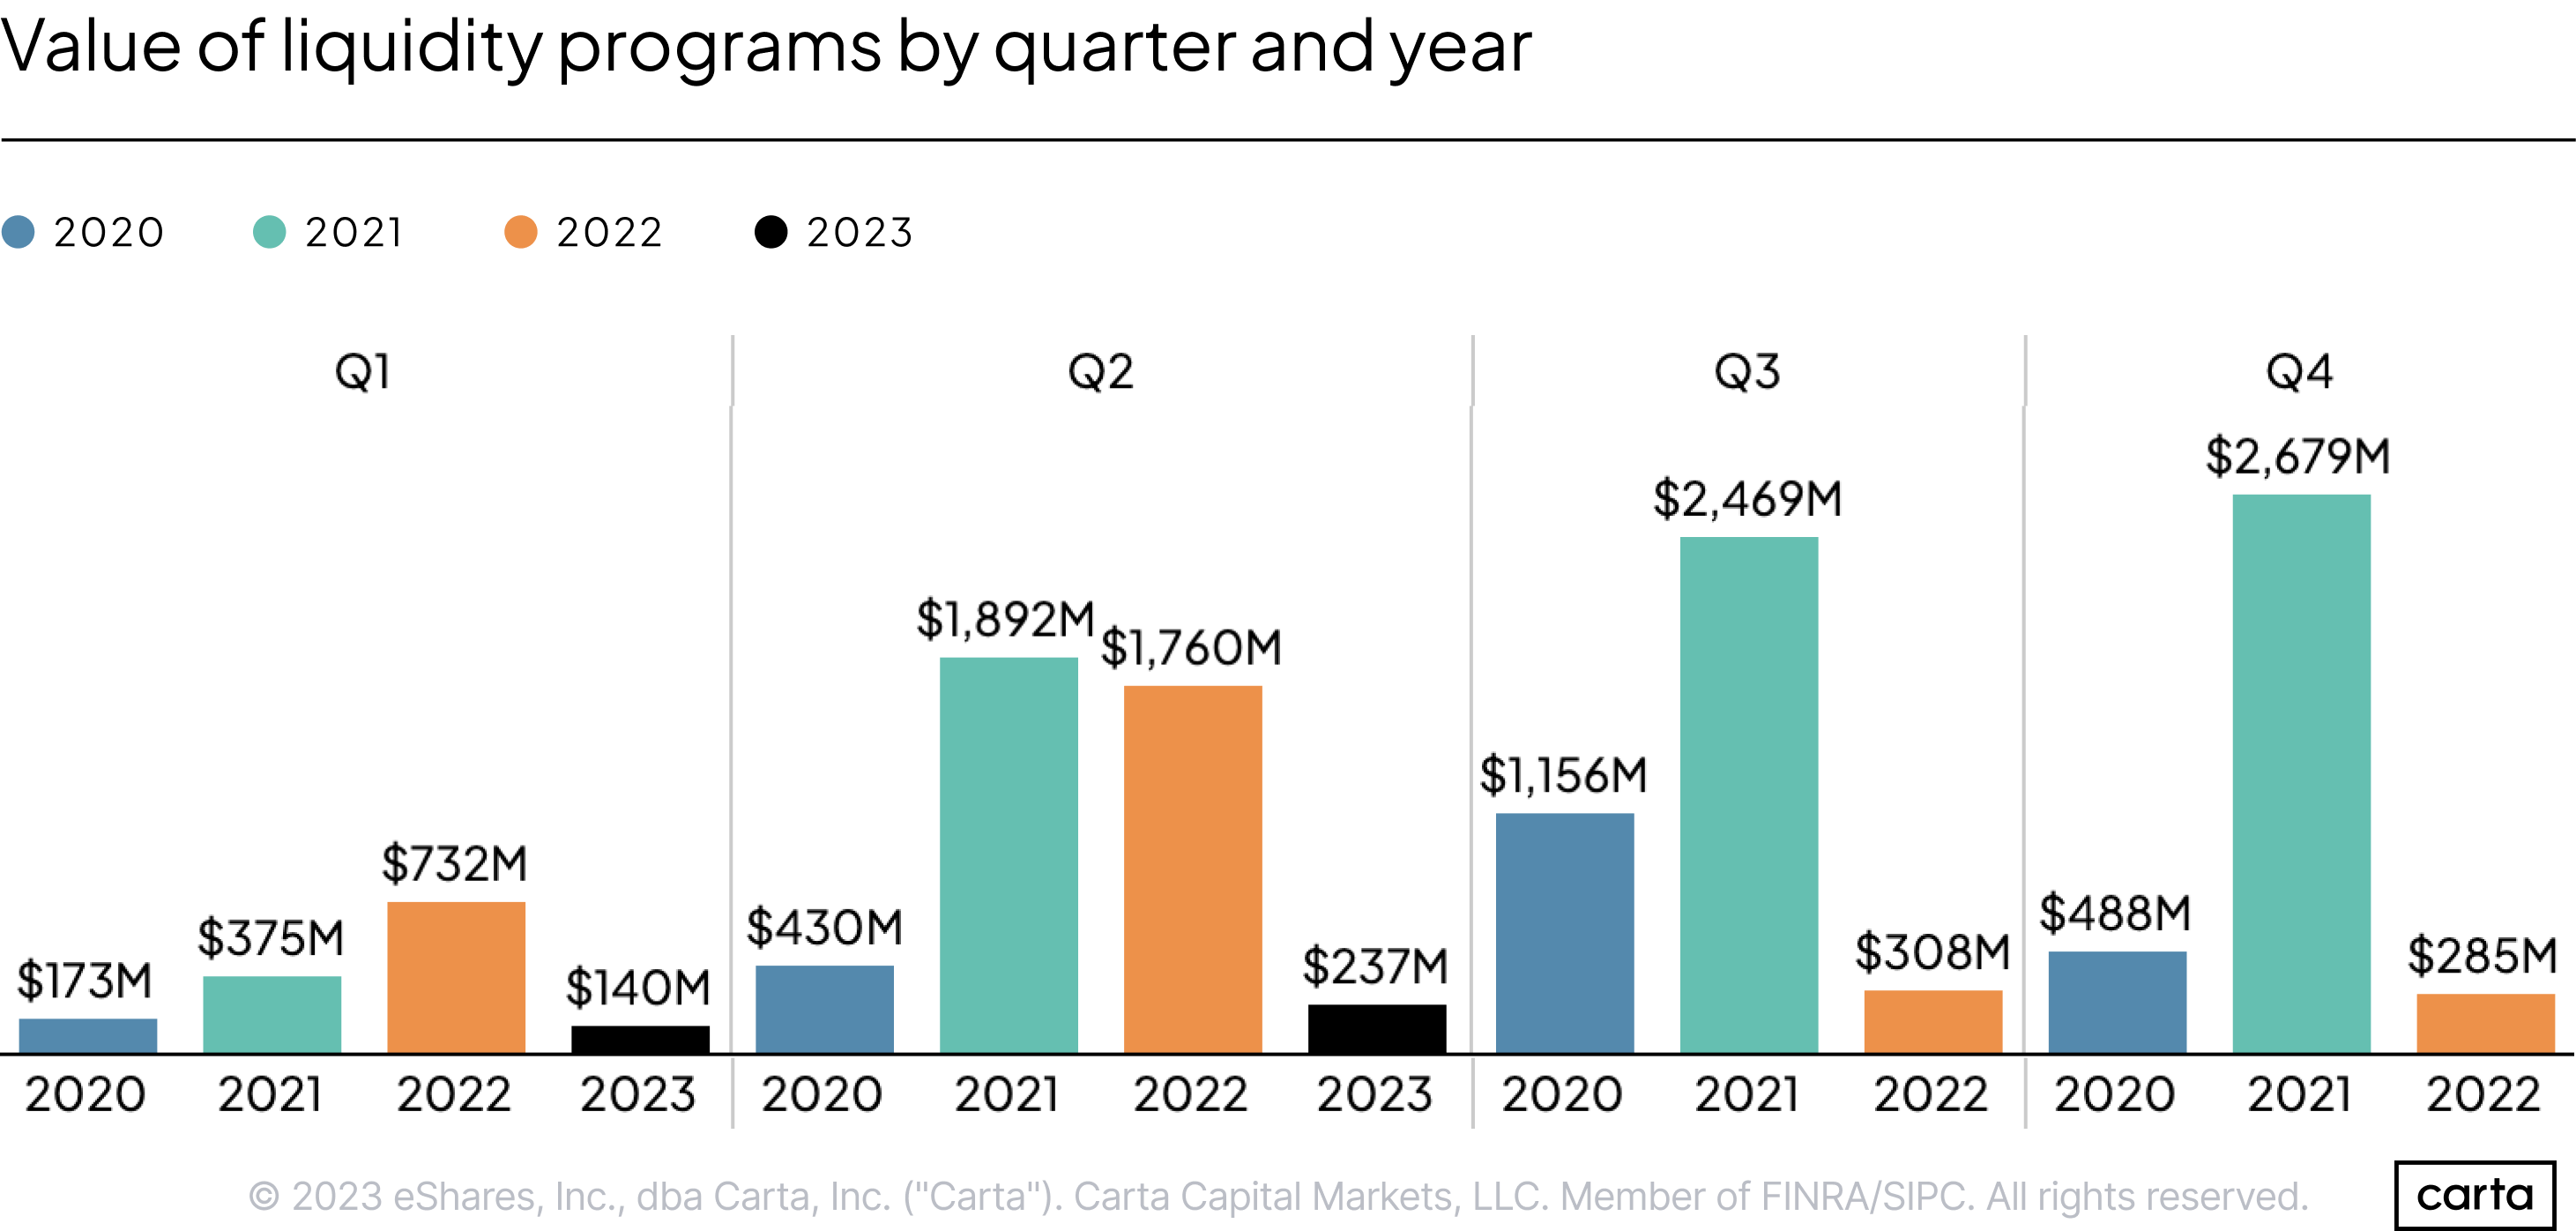
The combined value of liquidity programs on Carta was $377 million during H1. That’s the slowest half-year for secondary activity so far this decade, even though the quantity of deals that took place was much lower in 2020. This means that deals are getting smaller: The mean size of a liquidity transaction in H1 2023 was about $12.2 million, compared to $25.3 million in H1 2022 and $35.5 million in H1 2020.
However, the value of liquidity programs on Carta increased by 69% from Q1 to Q2, and the average deal size grew 39% bigger. Since then, buyers and sellers have been more eager to transact and more likely to do larger deals.
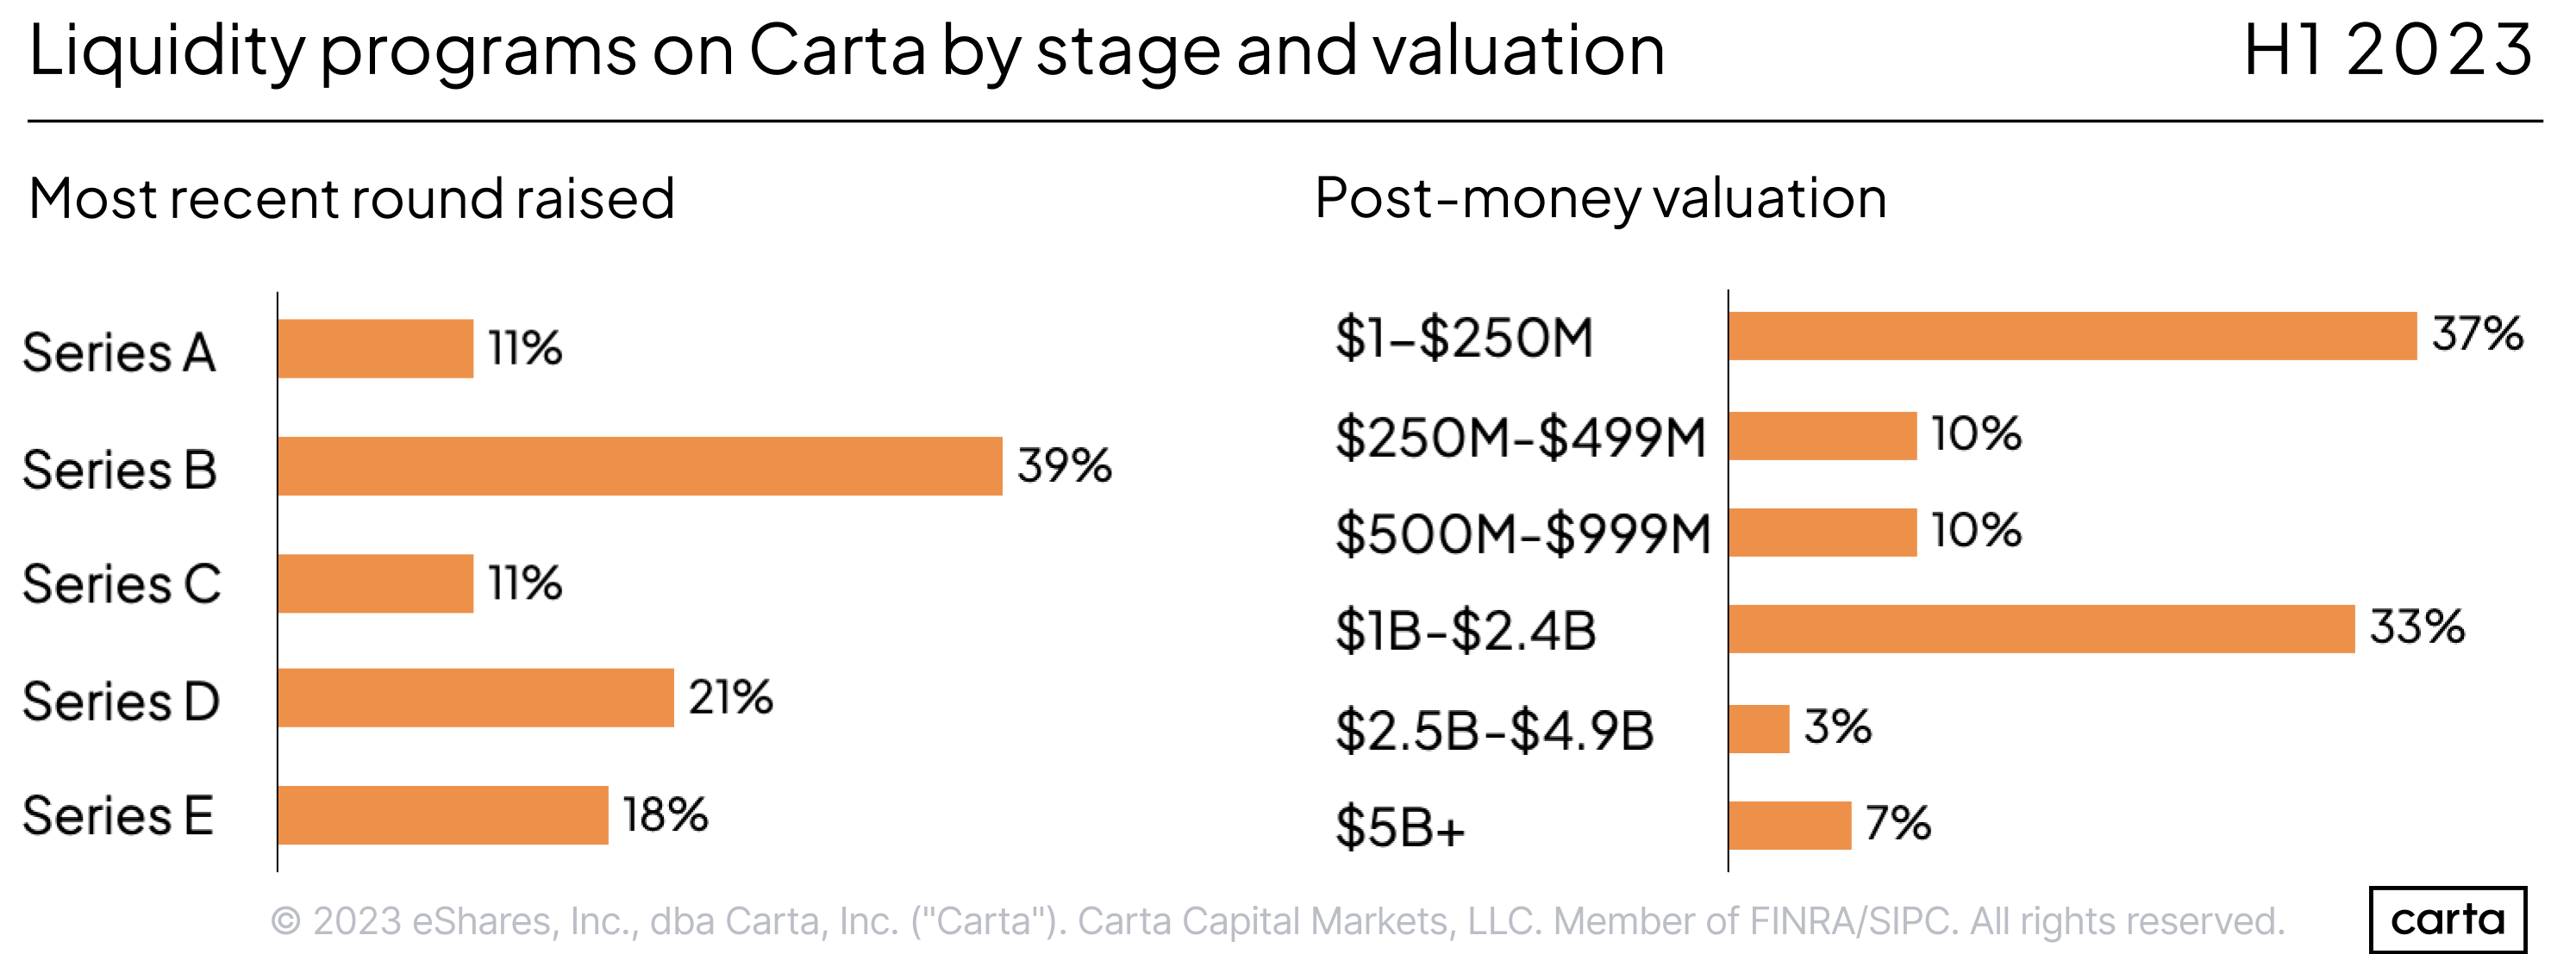
The market for liquidity programs on Carta has shifted significantly from last year. Perhaps the biggest change is related to valuation: In H1, about 37% of all companies conducting secondaries on Carta had been valued at $250 million or less in their most recent round of primary venture funding. That’s a huge jump from the whole of 2022, when just 15% of all secondary deals involved companies in that valuation category.
Conversely, about 43% of companies that conducted liquidity programs on Carta in H1 2023 were worth $1 billion or more, and 10% were worth $2.5 billion or more. Last year, about 56% of companies pursuing secondaries were unicorns (startups valued at $1 billion or higher), and 20% were worth at least $2.5 billion.
Smaller startups have thus played a larger role in the secondaries market so far this year than in 2022, and unicorns have played a smaller role.
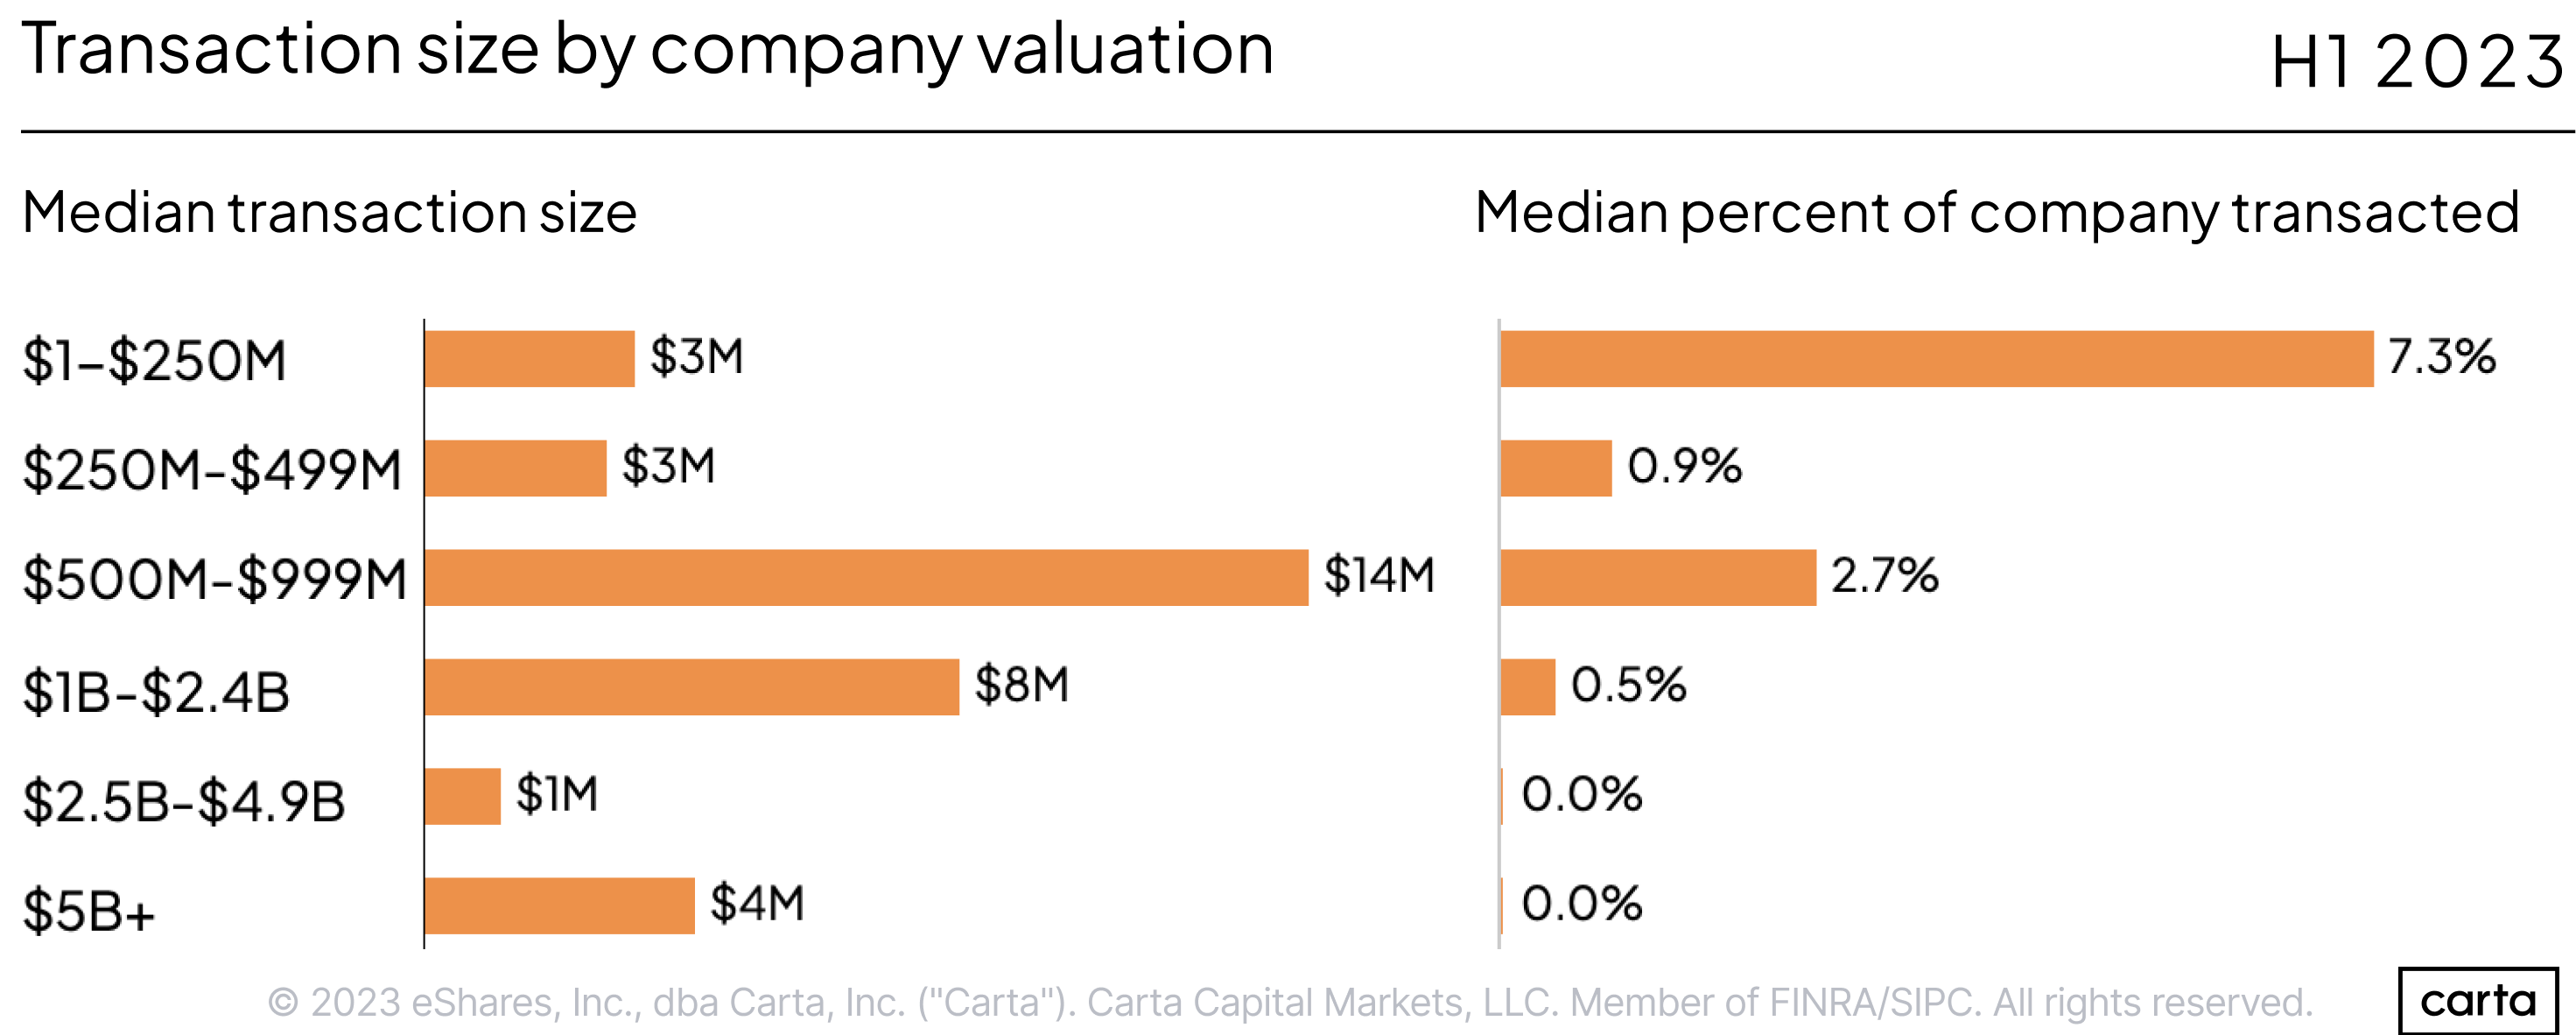
Those unicorns that have pursued secondaries in 2023 have tended to do much smaller deals than in years past. For instance, the median secondary transaction size among companies valued at $5 billion or more declined all the way to $4 million in H1 2023. Last year, it was $53 million.
So far this year, the percentage of a company’s shares that are sold in a secondary transaction on Carta has varied widely depending on the company’s valuation. Among startups valued at $250 million or less, the median liquidity program has involved 7.3% of the company’s total shares, up from a 4.4% rate for all of 2022.
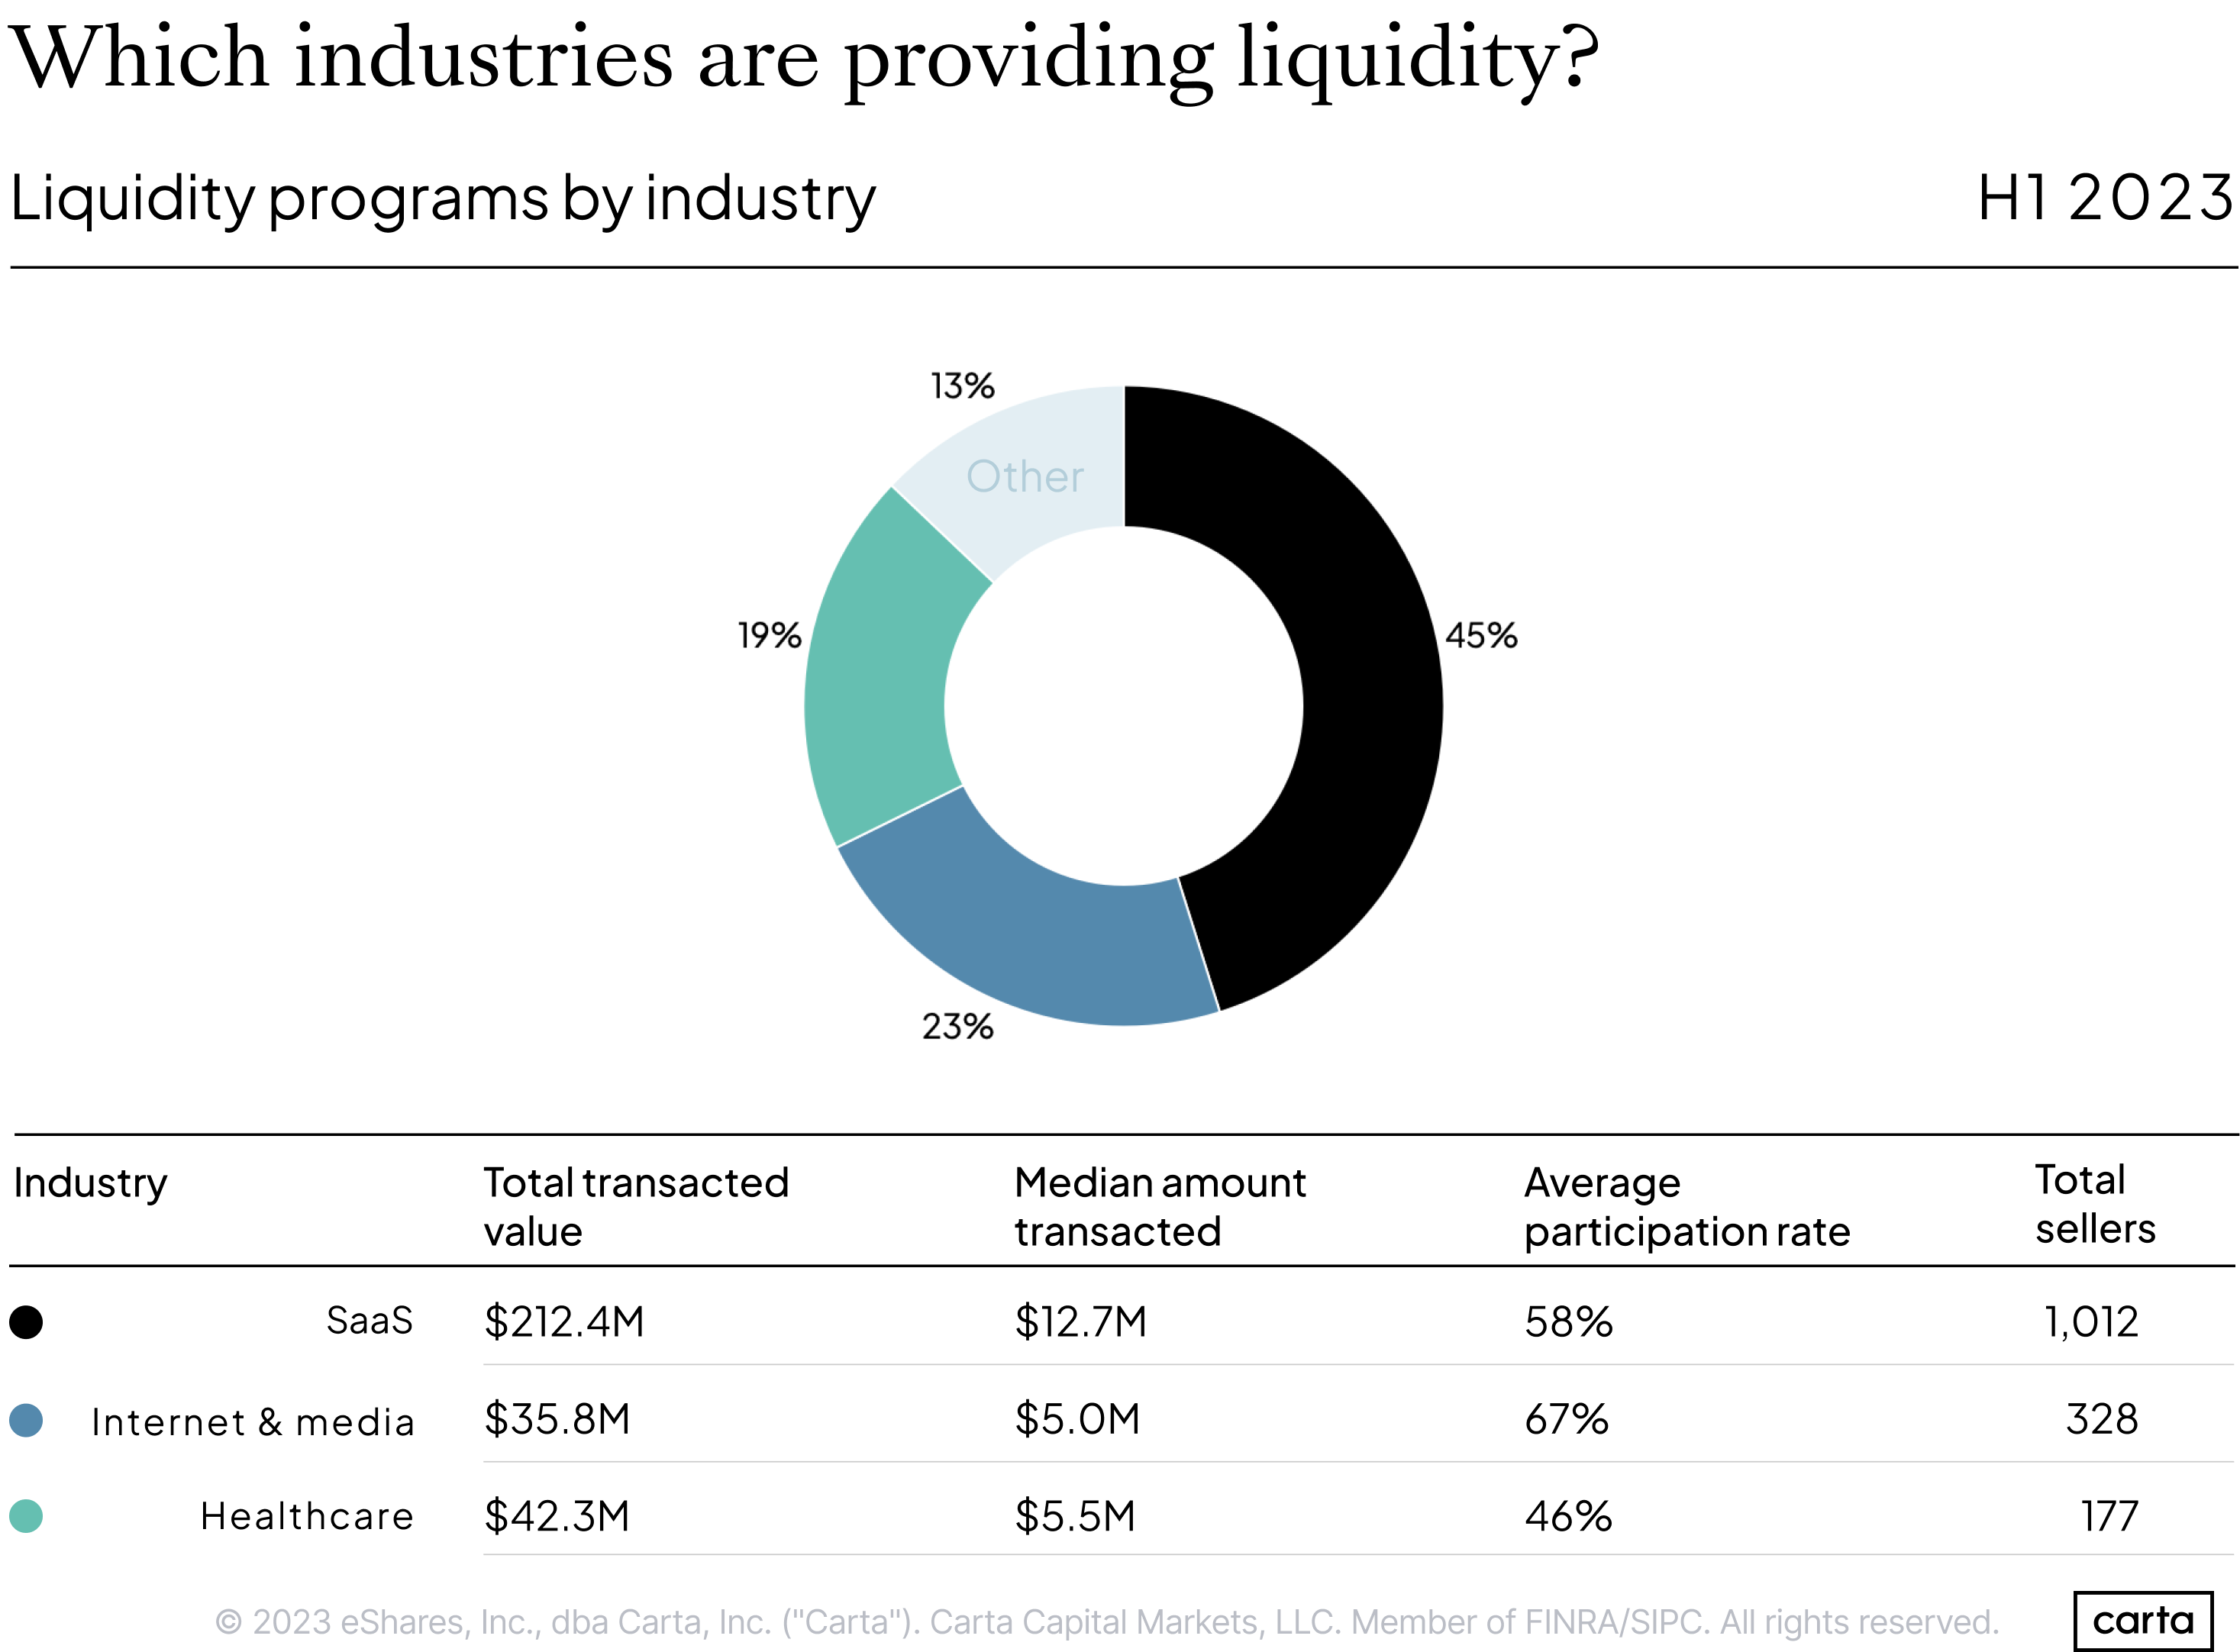
A plurality of startups conducting liquidity programs so far this year on Carta have been in the SaaS sector, which is in line with historical norms. Two other sectors have seen substantial increases in their share of secondary activity: About 23% of deals so far this year involved internet & media companies, up from 18% for the full year 2022, and about 19% of deals this year have been in healthtech, up from just 7% in 2022.
There’s a notable range across these three sectors in terms of participation rate—the percentage of eligible sellers who choose to participate in any given liquidity program. About two-thirds of all eligible sellers at internet & media companies are choosing to transact, while in healthcare, that figure is less than 50%.
Who is choosing to sell equity?
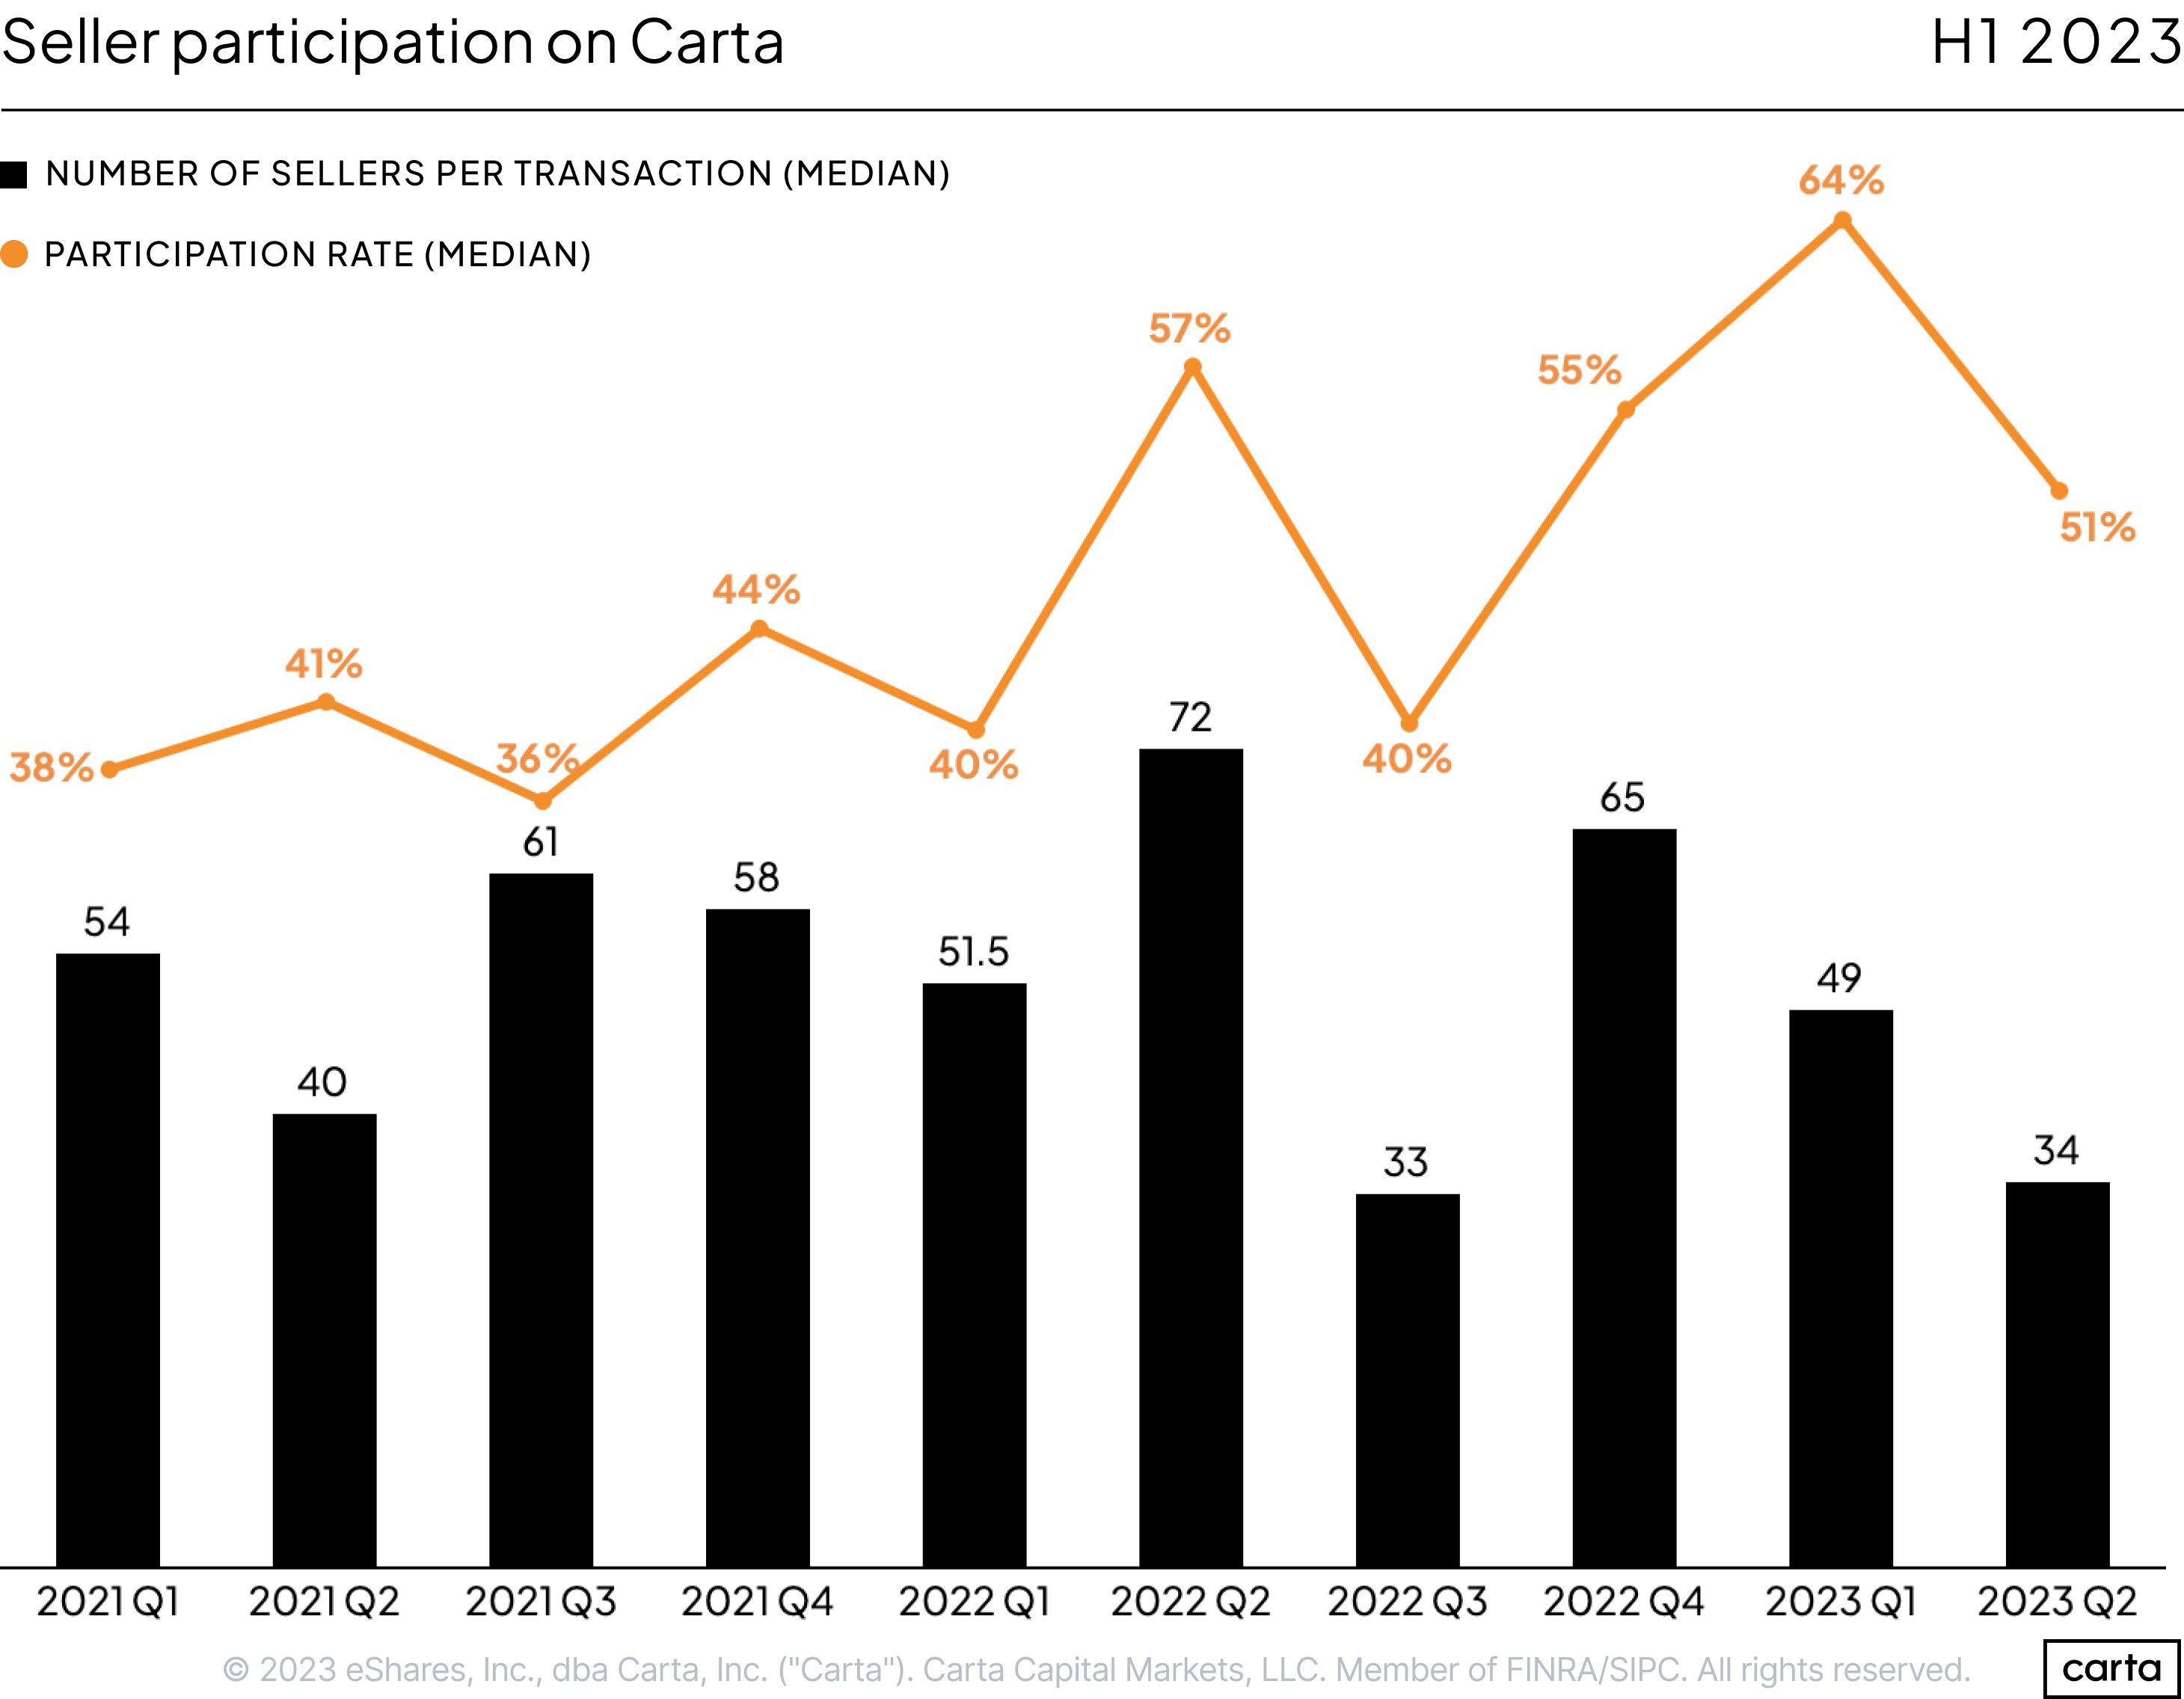
The median participation rate across all sectors on Carta reached 64% during Q1 2023, its highest quarterly figure of the past three years, before dipping back to 51% in Q2. Participation rates in each of the past three quarters are substantially higher than participation rates from 2021 and Q1 2022, signaling that eligible shareholders have grown more likely to participate in secondary transactions as the broader venture market has shifted.
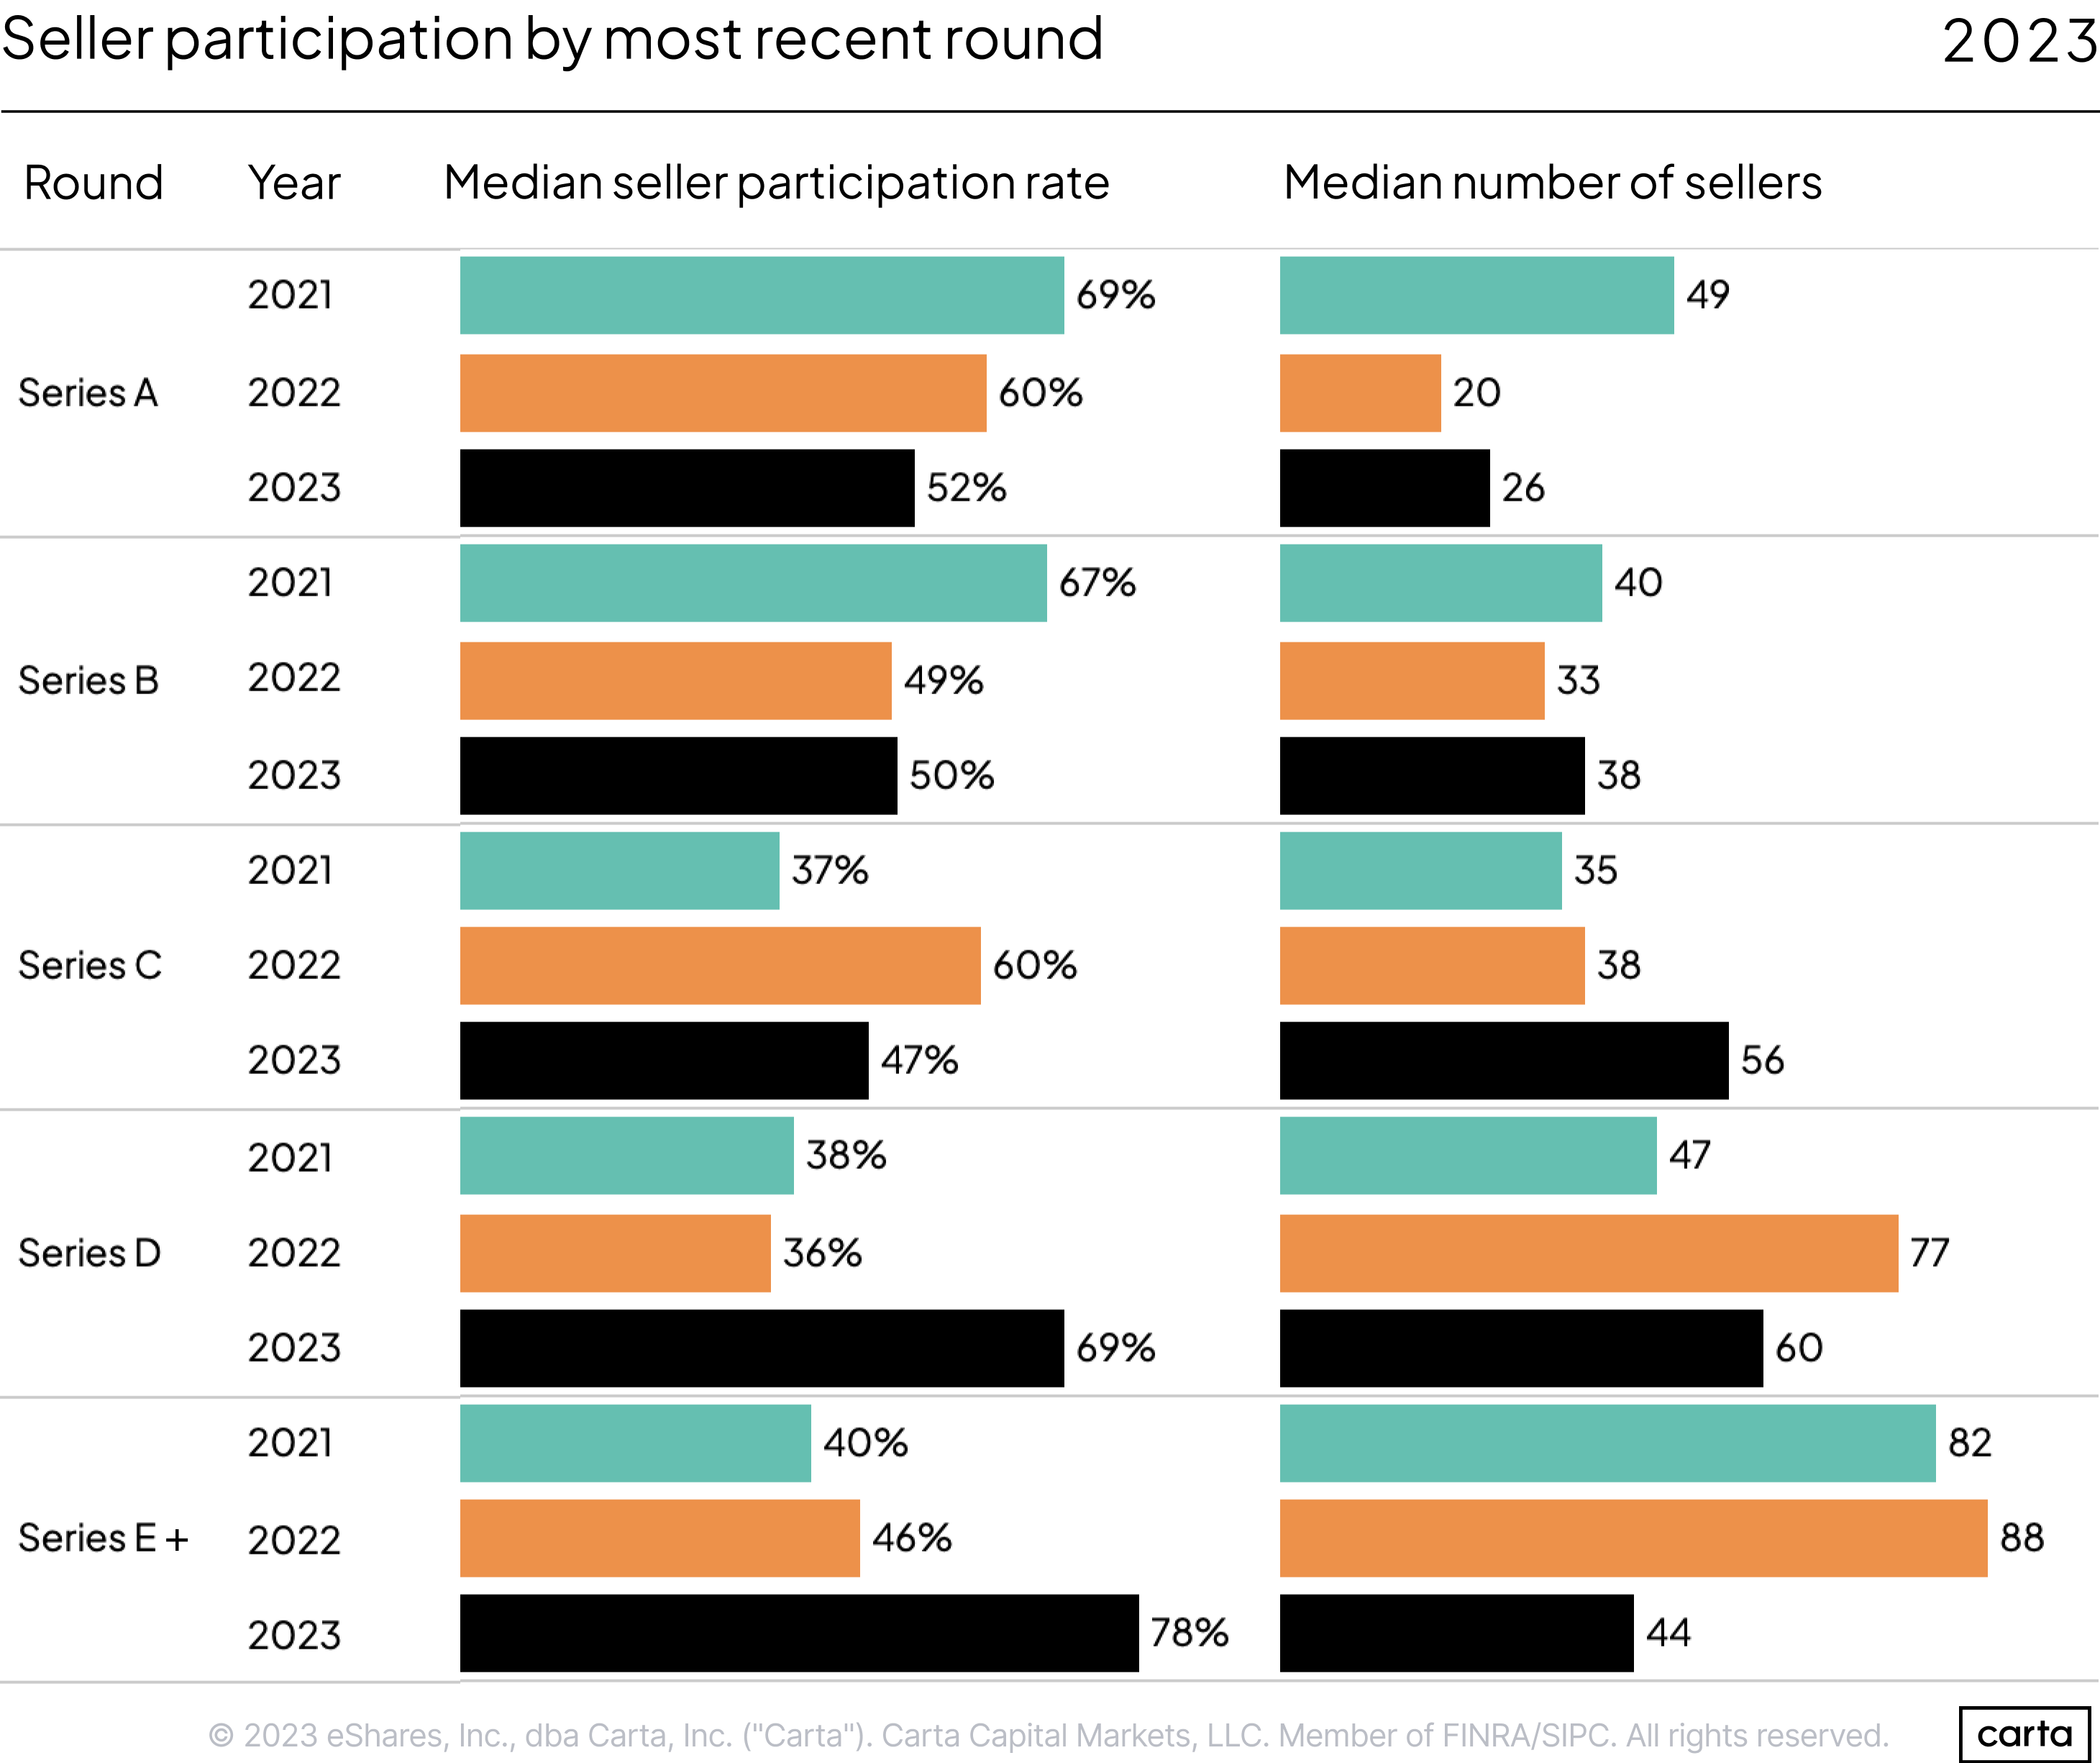
At each of Series A, Series B, and Series C, the median participation rate so far this year is hovering around 50%. But it leaps up to 69% at Series D and 78% at Series E+. When shareholders at these later-stage companies have had the opportunity for liquidity, a vast majority are choosing to take it.
This is in sharp contrast to the market environment of 2021: Then, shareholders at early-stage companies were much more likely to participate in liquidity programs than employees at late-stage companies.
At both ends of the spectrum, this change can be explained in part by the widespread reset of tech valuations that has taken place over the past year. When valuations were high, shareholders at early stages were more likely to sell, because they didn’t know how long the climate of lofty valuations would last. It made sense to get out while the getting was good. Shareholders at later stages, meanwhile, were more likely to hold onto their shares during a secondary deal, because the prospect of an IPO or another type of exit in the very near future was even more enticing.
Early-stage shareholders still operate on a longer timeline. But today, that might make them less likely to sell—if an investor believes valuations will trend back up in the coming years, then there might be other opportunities to sell at a higher price in the future. And late-stage companies have had limited exit options for much of 2023. In some cases, a secondary transaction has been a shareholder’s only chance to liquidate shares in the near future. However, the IPO market has been revving back up so far this fall, which could create more opportunities for late-stage liquidity.
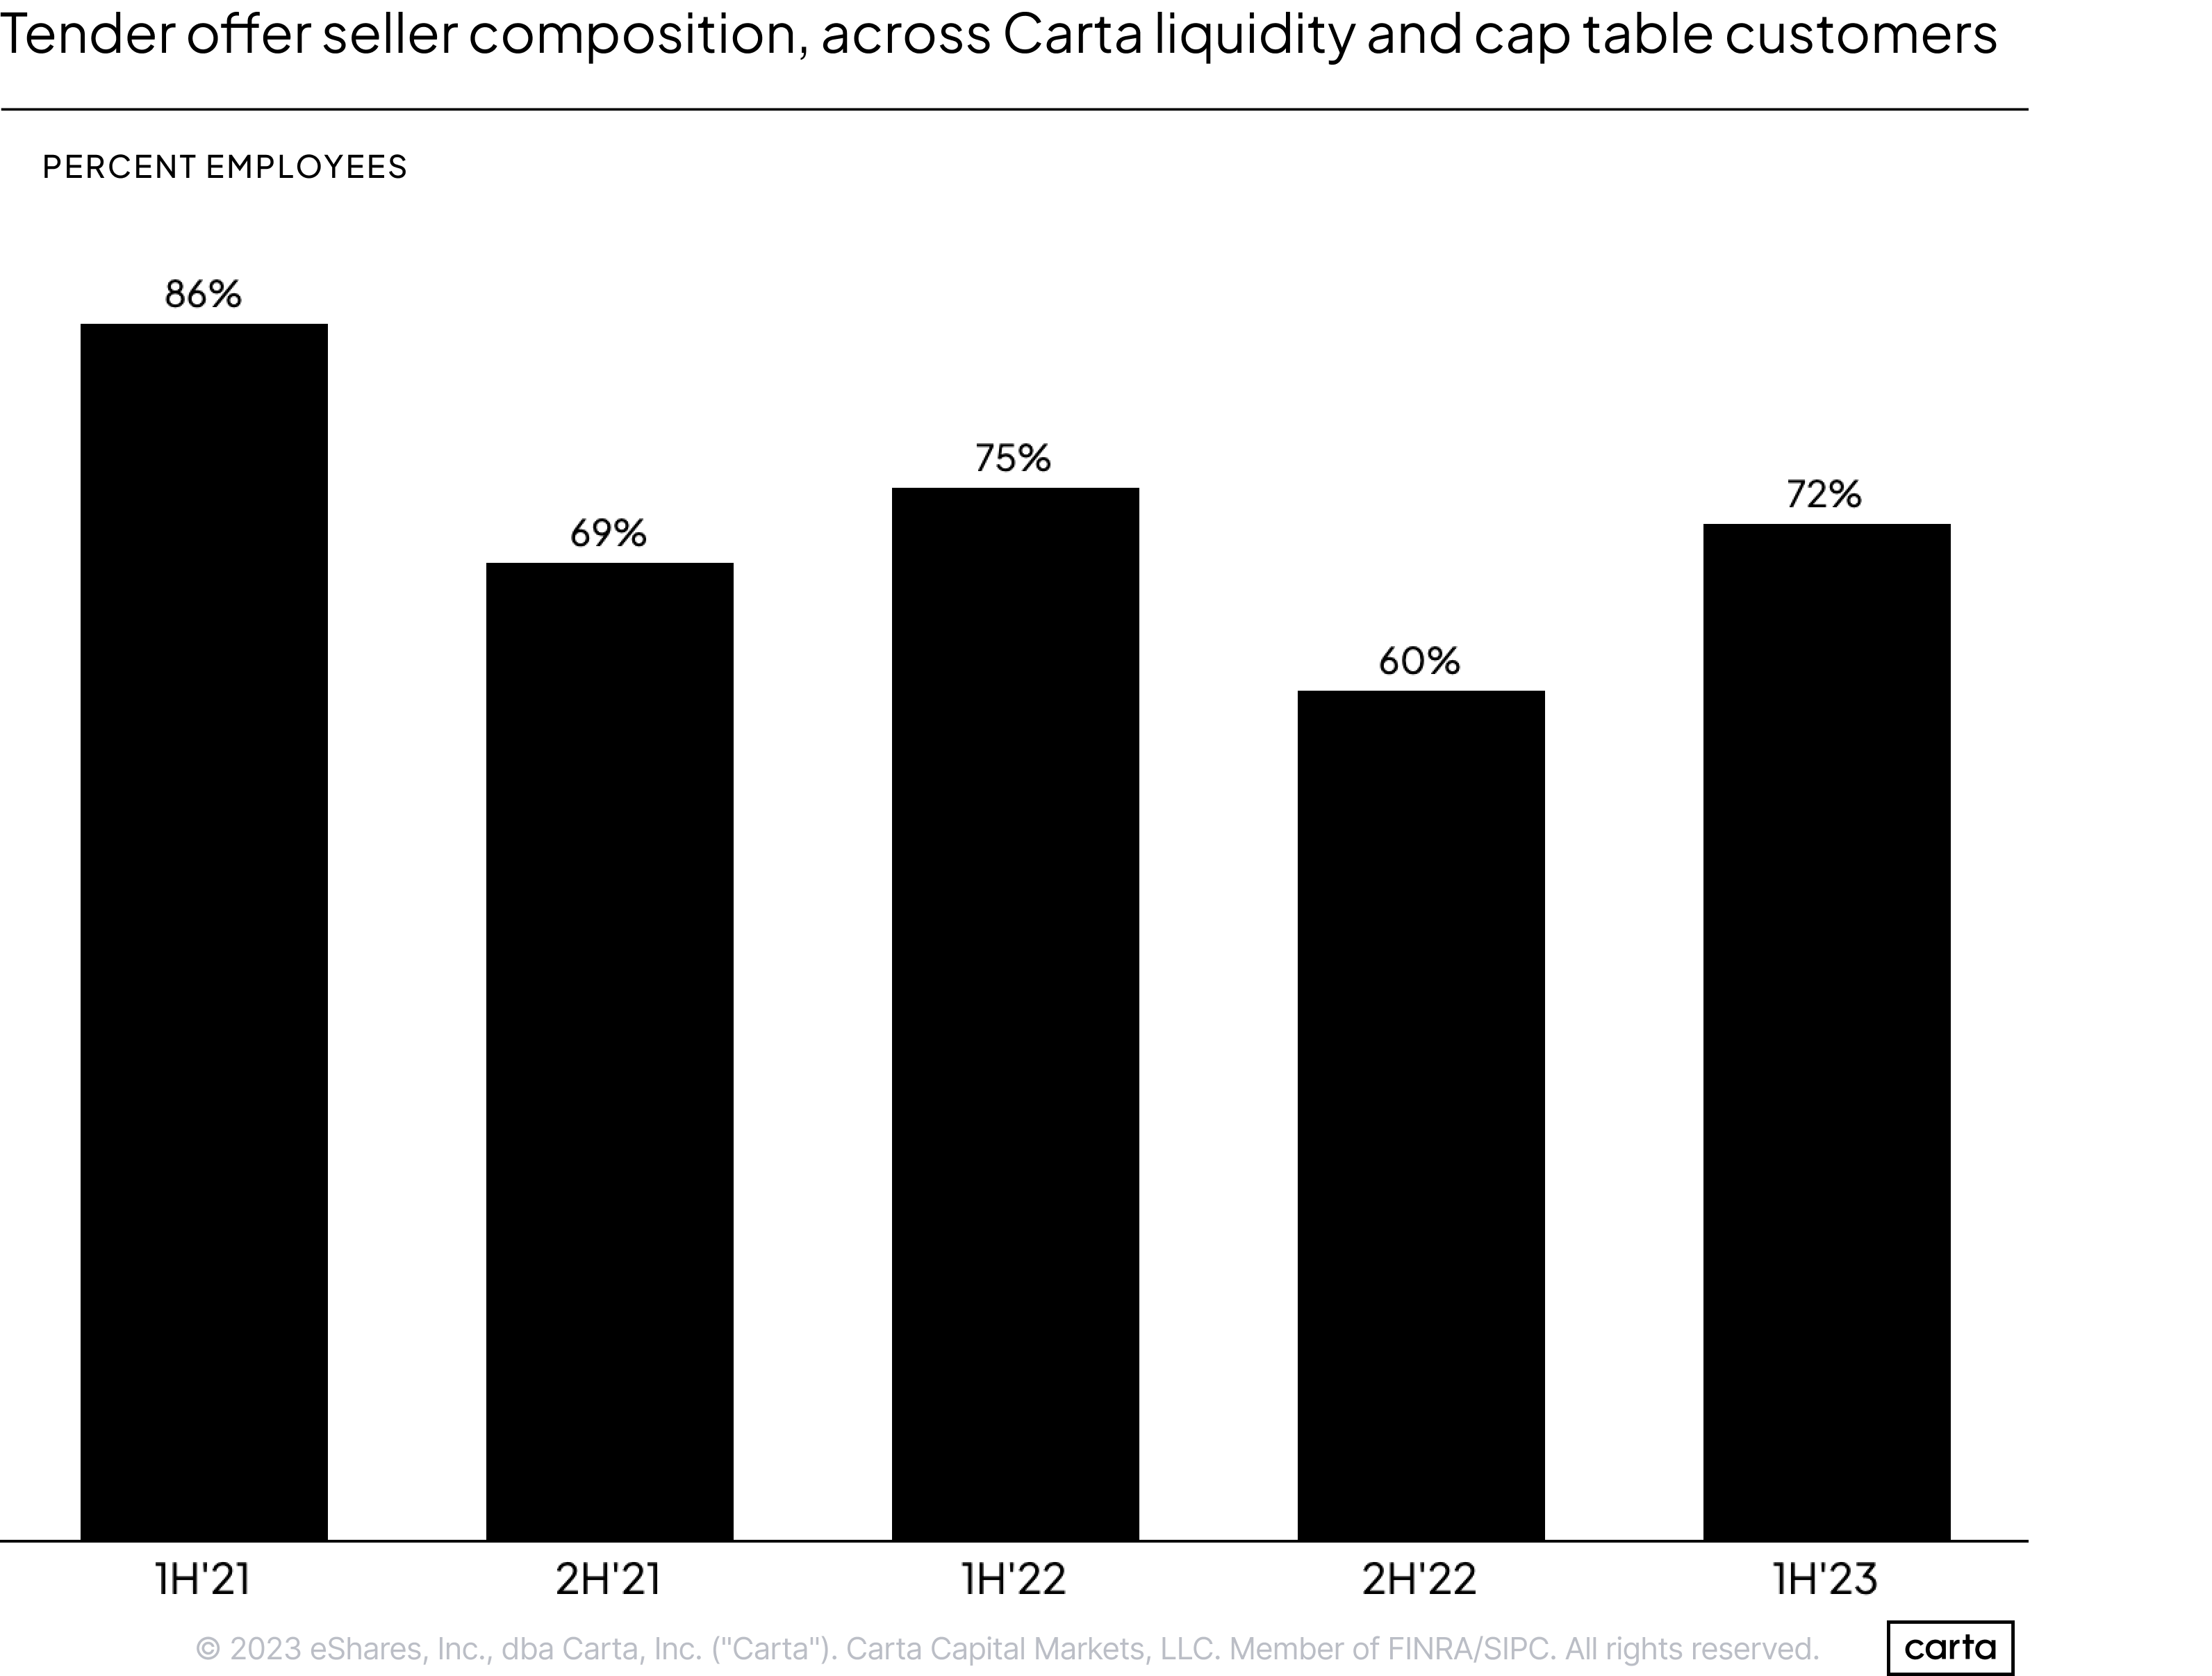
Employees have comprised the clear majority of sellers in secondary transactions conducted by Carta customers throughout the past few years, both on and off the Carta Liquidity platform. But the size of that majority has varied. Back in H1 2021, nearly seven out of every eight sellers was an employee. That rate fell to three out of four in H1 2022, and it dipped to just three out of five in H2 2022 before bouncing back up so far in 2023.
Aside from employees, the most common types of sellers are founders and investors. So, when the percentage of employees who are sellers declines, the percentage of sellers who are founders and investors increases.

DISCLOSURE: This communication is on behalf of eShares Inc., d/b/a Carta Inc. ("Carta"). This communication is for informational purposes only, and contains general information only. Carta is not, by means of this communication, rendering accounting, business, financial, investment, legal, tax, or other professional advice or services. This publication is not a substitute for such professional advice or services nor should it be used as a basis for any decision or action that may affect your business or interests. Before making any decision or taking any action that may affect your business or interests, you should consult a qualified professional advisor. This communication is not intended as a recommendation, offer or solicitation for the purchase or sale of any security. Carta does not assume any liability for reliance on the information provided herein. ©2023 eShares Inc., d/b/a Carta Inc. ("Carta"). All rights reserved. Reproduction prohibited. Carta Capital Markets, LLC, member FINRA/SIPC.