Overview
Every year, Carta reports on the state of equity in the venture ecosystem. Through the aggregated and anonymized data from tens of thousands of startups employing over 1.5 million people, we examine how opportunities to found companies, raise venture funding, and work at startups are distributed according to race and gender.
This report began in 2018, in partnership with #ANGELS to look into equity (employee ownership) distribution by gender. The report has expanded since then, looking closely at race and ethnicity, and how they interact with gender. As the report has grown, the goal has remained the same: to gather, analyze, and share data on the state of startups to see where inequities exist throughout the entrepreneurial ecosystem.
Unfortunately, this year is another reminder of the work that remains to be done. Over the past year, rising interest rates and a pullback in venture capital investment has made it harder for all founders to start and grow their businesses. However our data shows that this environment has had an outsized impact on women founders and founders of color. While previous years showed some progress, this year is a reminder that time alone does not move us forward. Across the startup ecosystem, we must work actively to build a more fair and equitable industry.
Employees
Race & Ethnicity
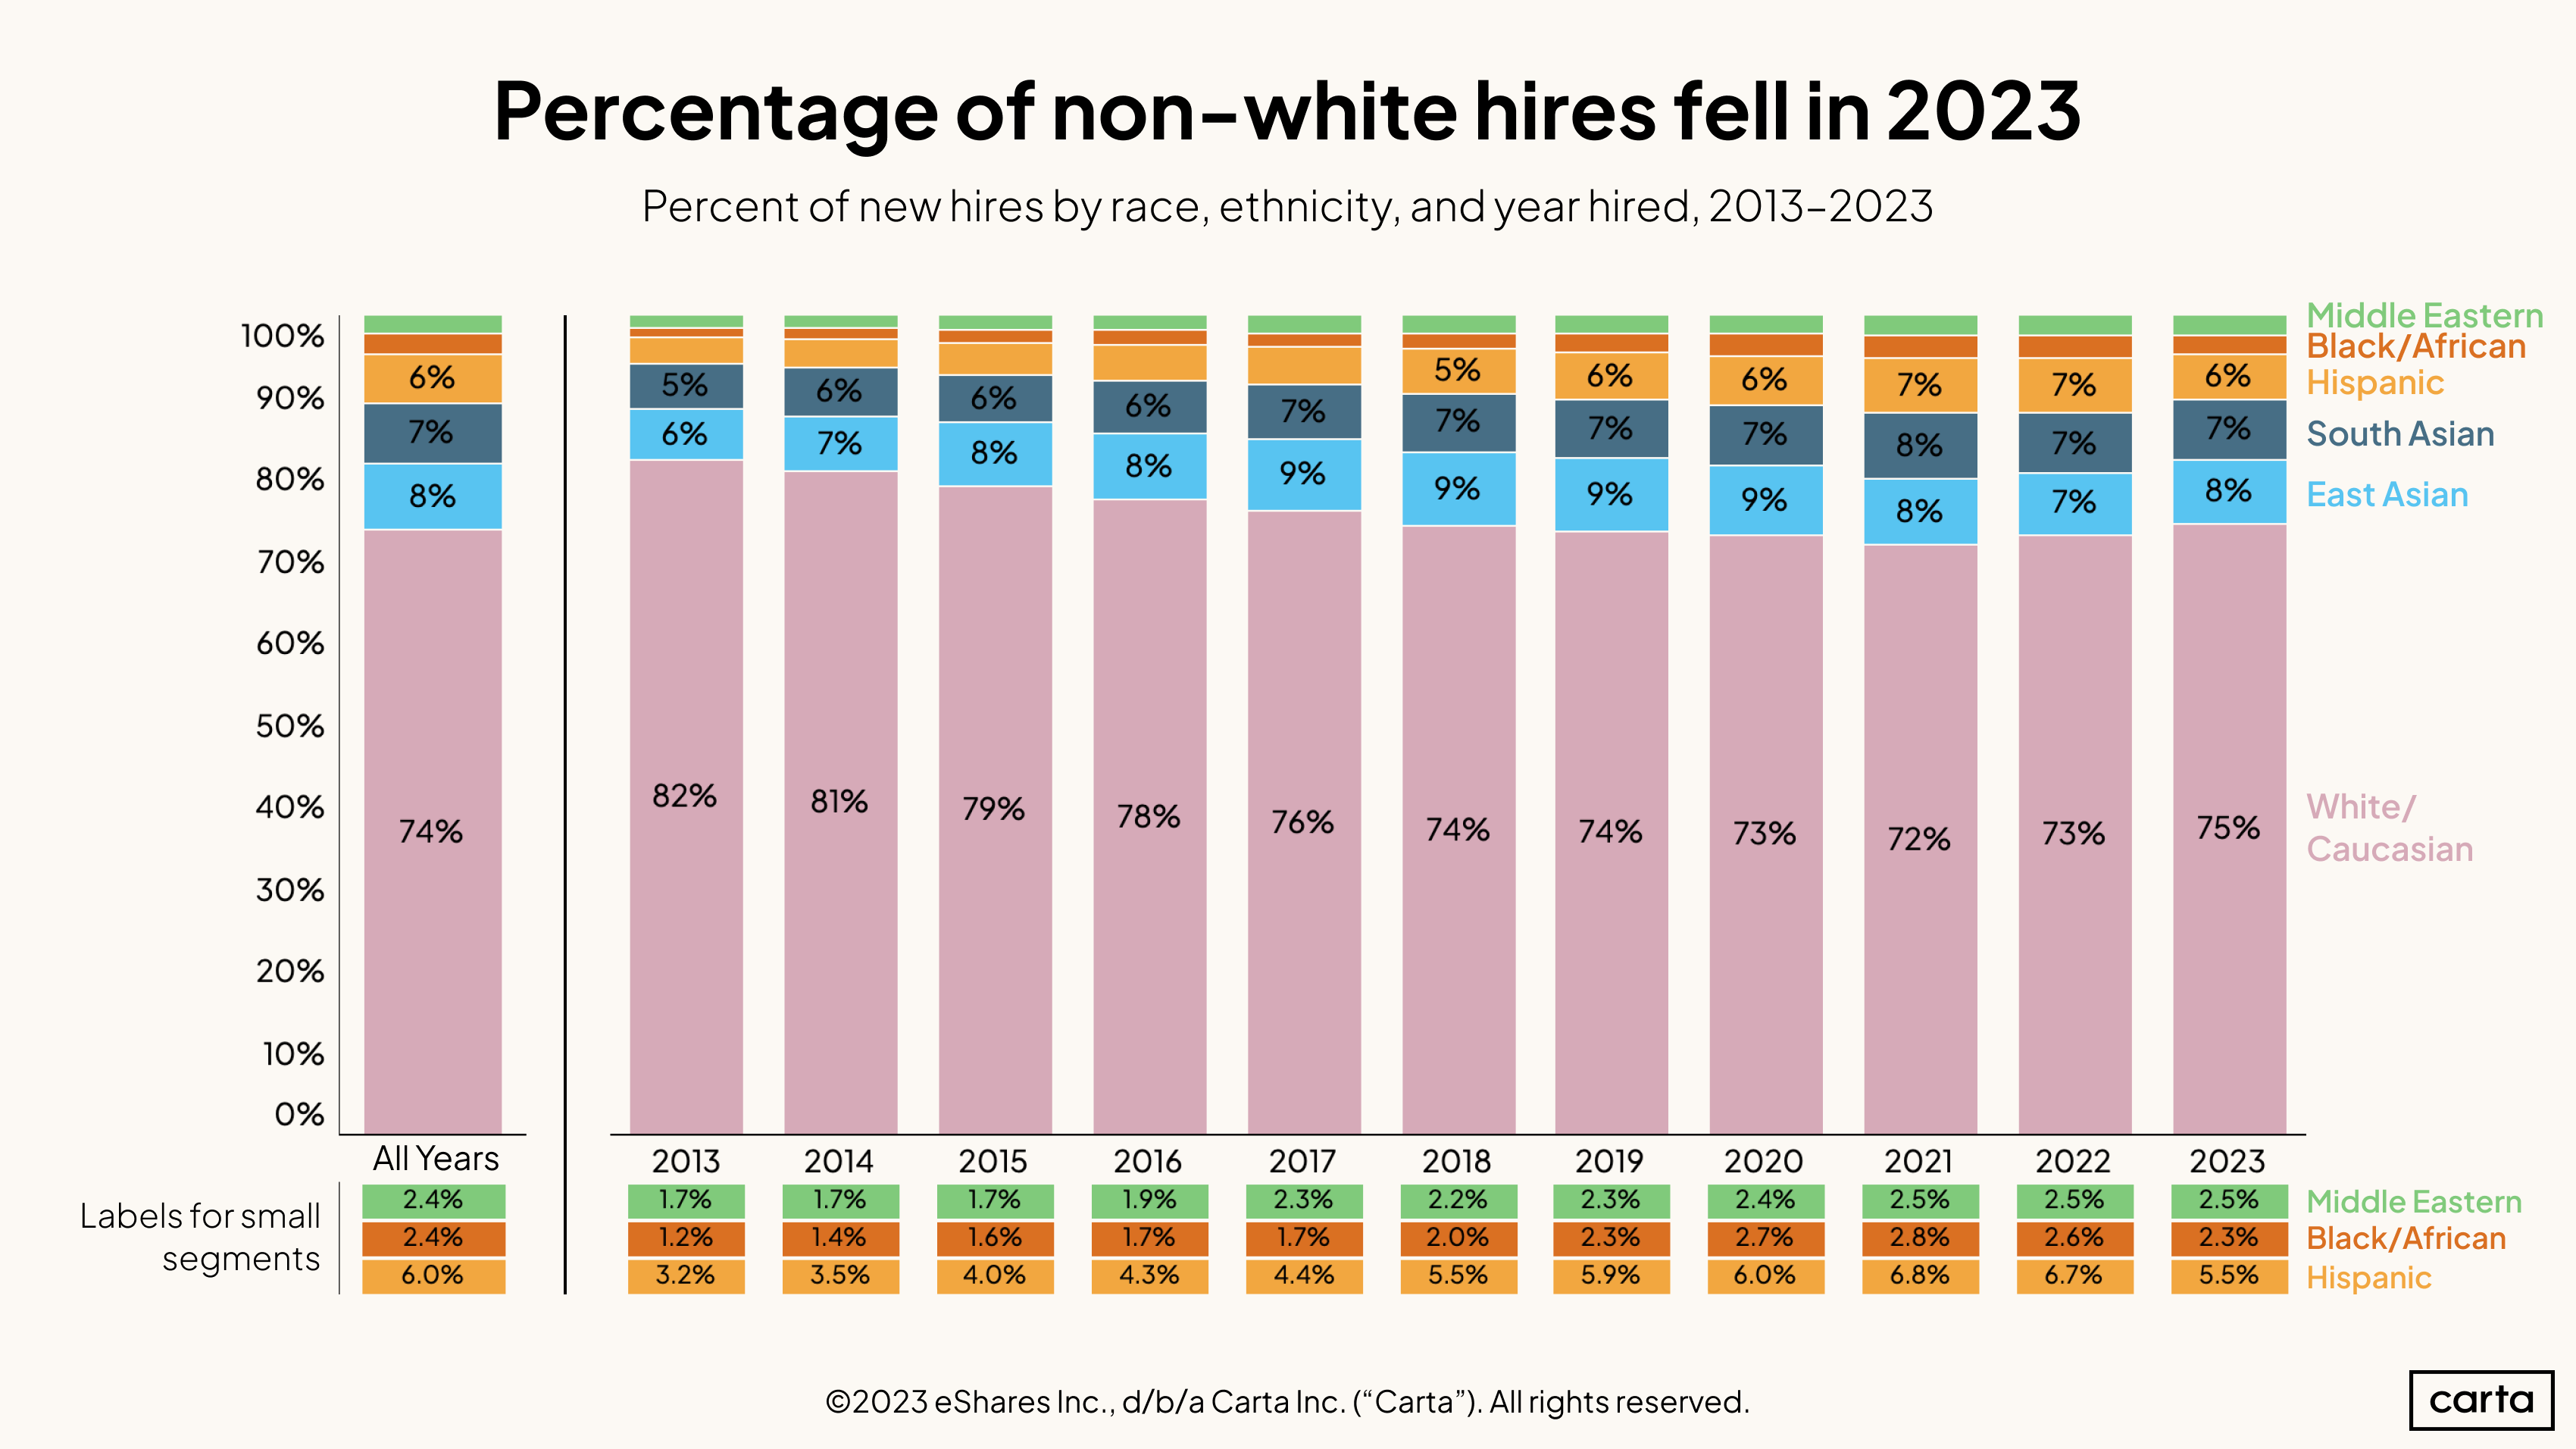
The rate of hires who identify as belonging to historically marginalized communities declined to 25% of all hires during 2023, the smallest figure in the past six years. Between 2013 and 2021, the proportion of hires from diverse backgrounds increased eight consecutive years. Now, it has fallen in each of the past two.
As a point of clarification, this data comes from U.S.-based stakeholders who opted to fill out a demographic profile page for the purposes of aggregated, anonymized equity compensation analysis.
This year’s biggest decline came among Hispanic employees, who went from 6.7% of new hires in 2022 to 5.5% in 2023. The proportion of new hires who are Black dipped from 2.6% to 2.3%, its lowest point in the past four years.
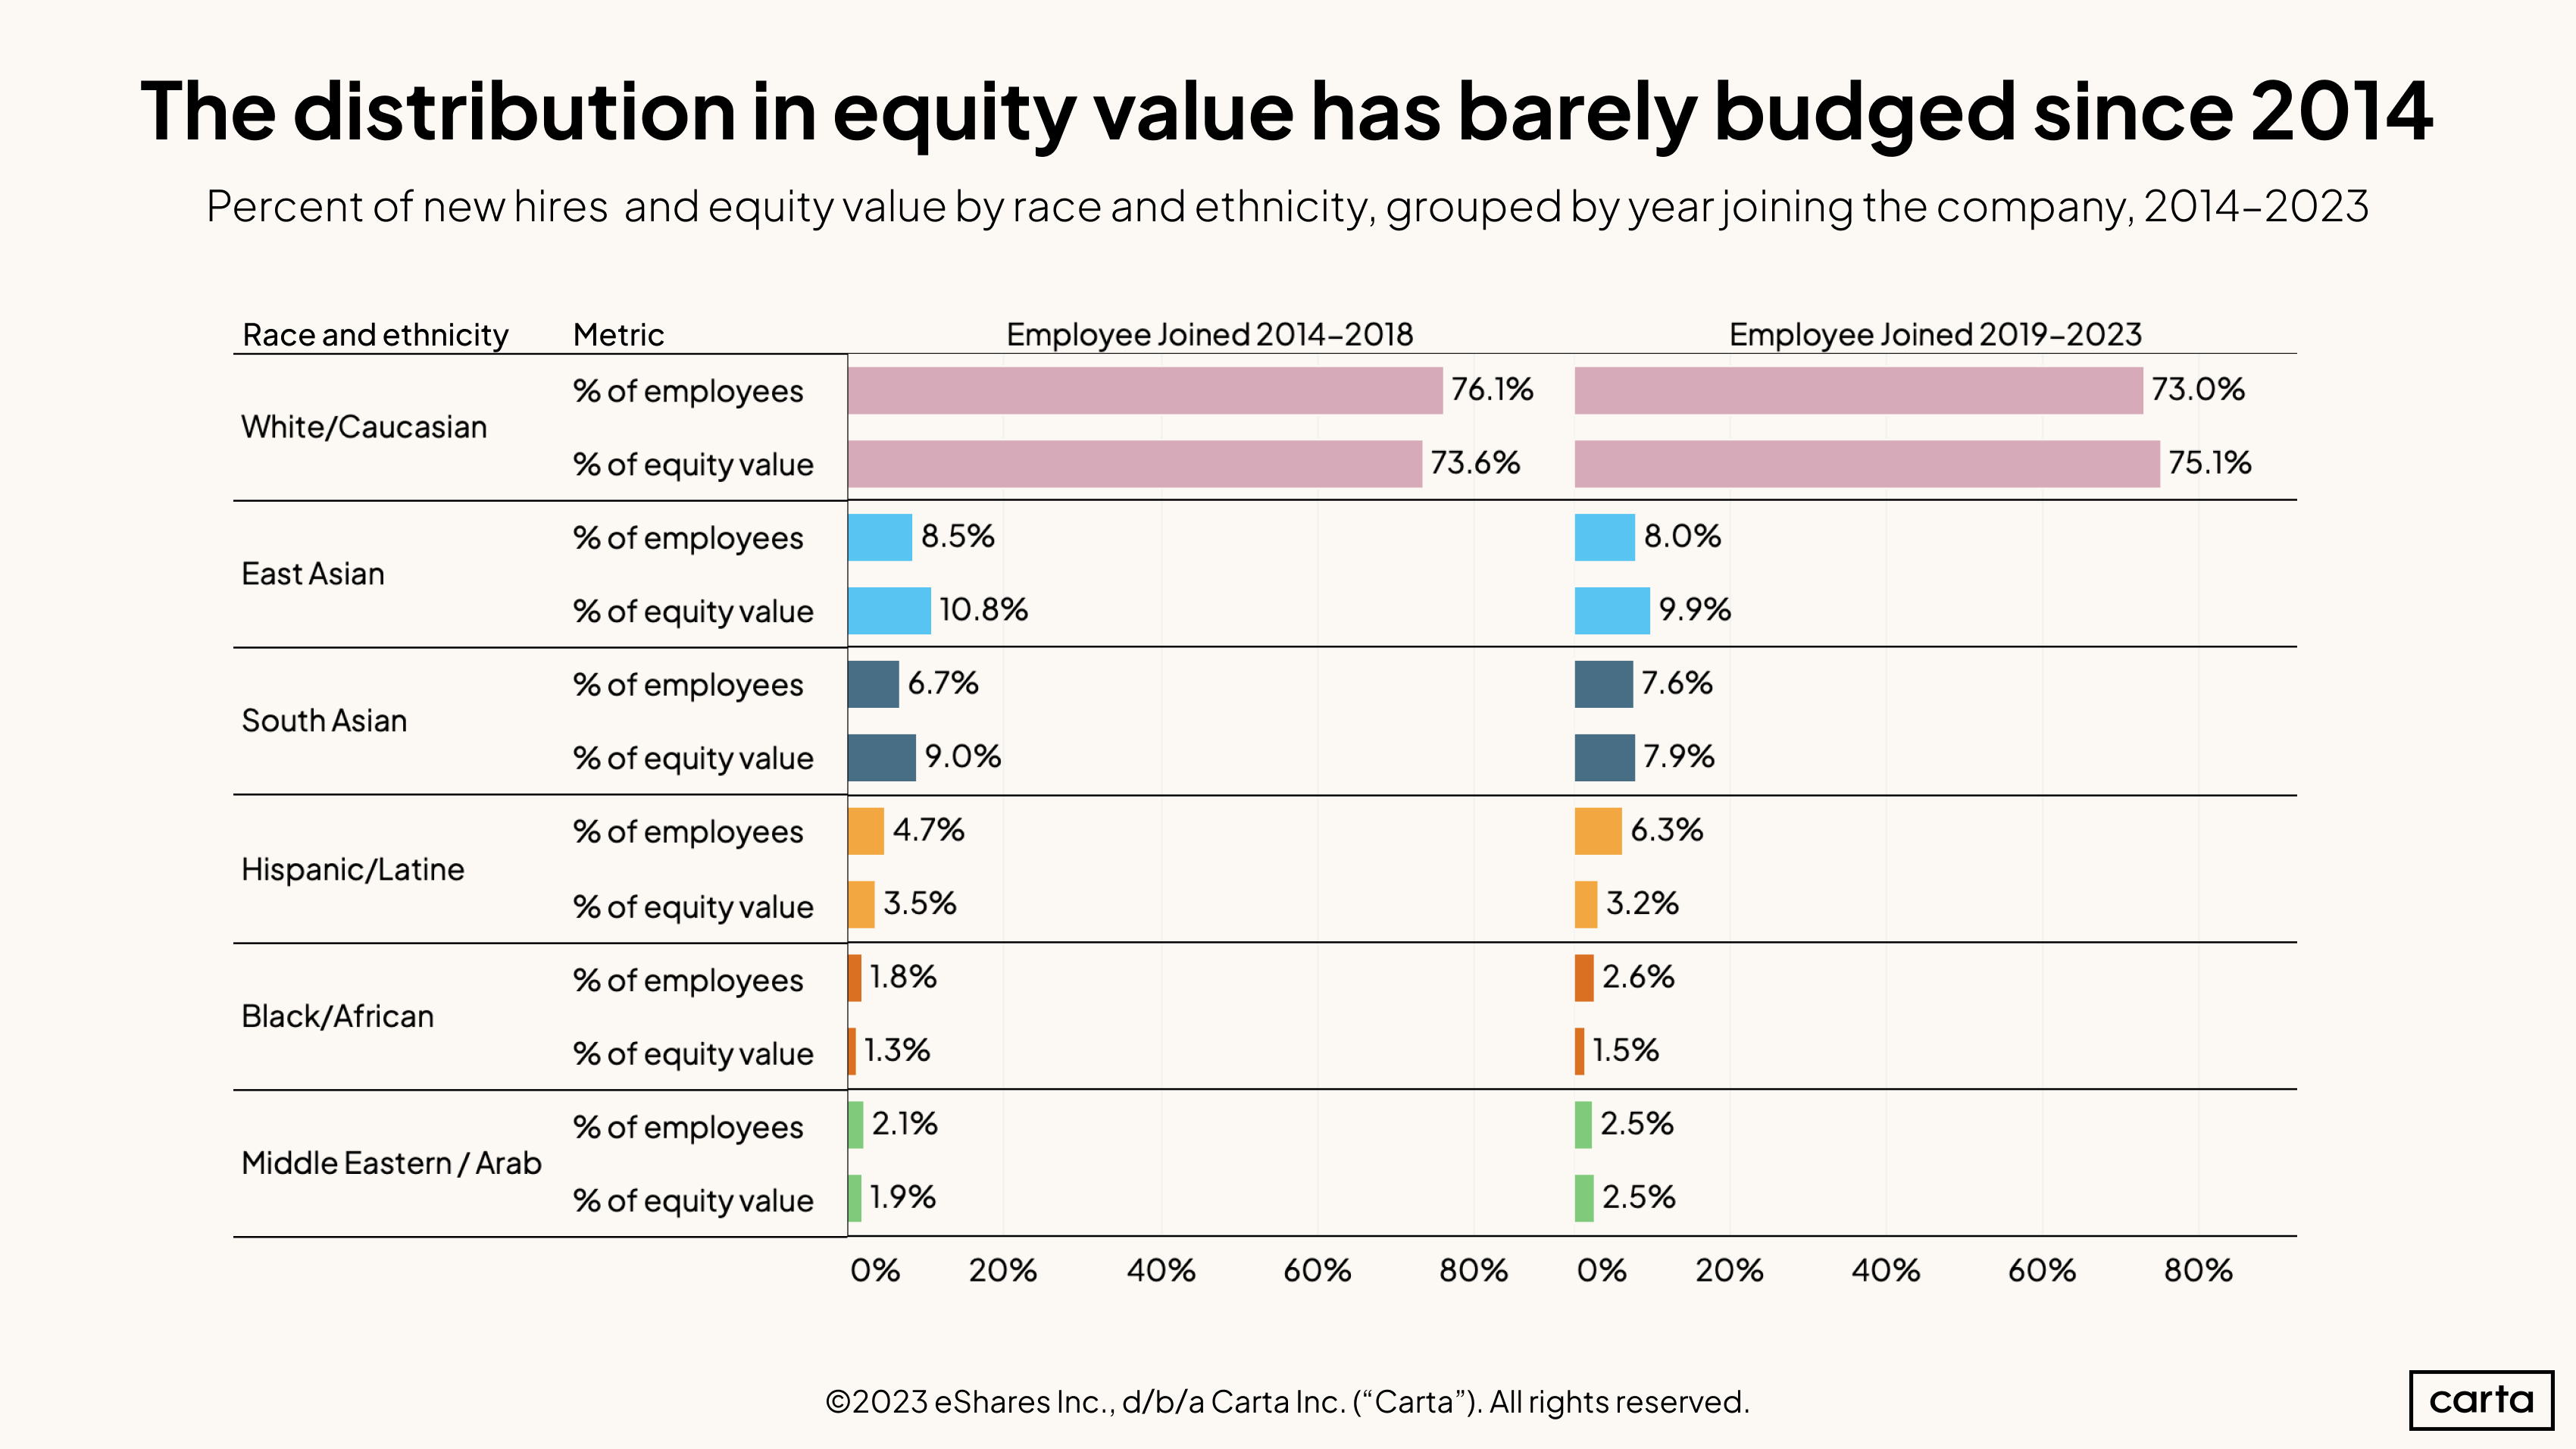
The way equity value is distributed among startup employees of different races and ethnicities looks very much the same as it did 10 years ago. There are only marginal differences when comparing equity distribution among employees hired between 2014 and 2018 against new hires from 2019 through 2023.
Over the past five years, South Asian and Hispanic employees have begun to make up a larger segment of the overall pool. Yet despite those gains, they’re receiving a smaller percentage of overall equity. The share of equity value among East Asian employees has also declined, while the share of equity value among white employees has increased from 73.6% to 75.1%.
Both Black and Hispanic employees have seen the gap widen between their percentage of the workforce and the percentage of equity they receive. This suggests that these groups may be underrepresented in the types of leadership positions that are more likely to receive significant equity compensation, such as chief technology officer and CEO roles.
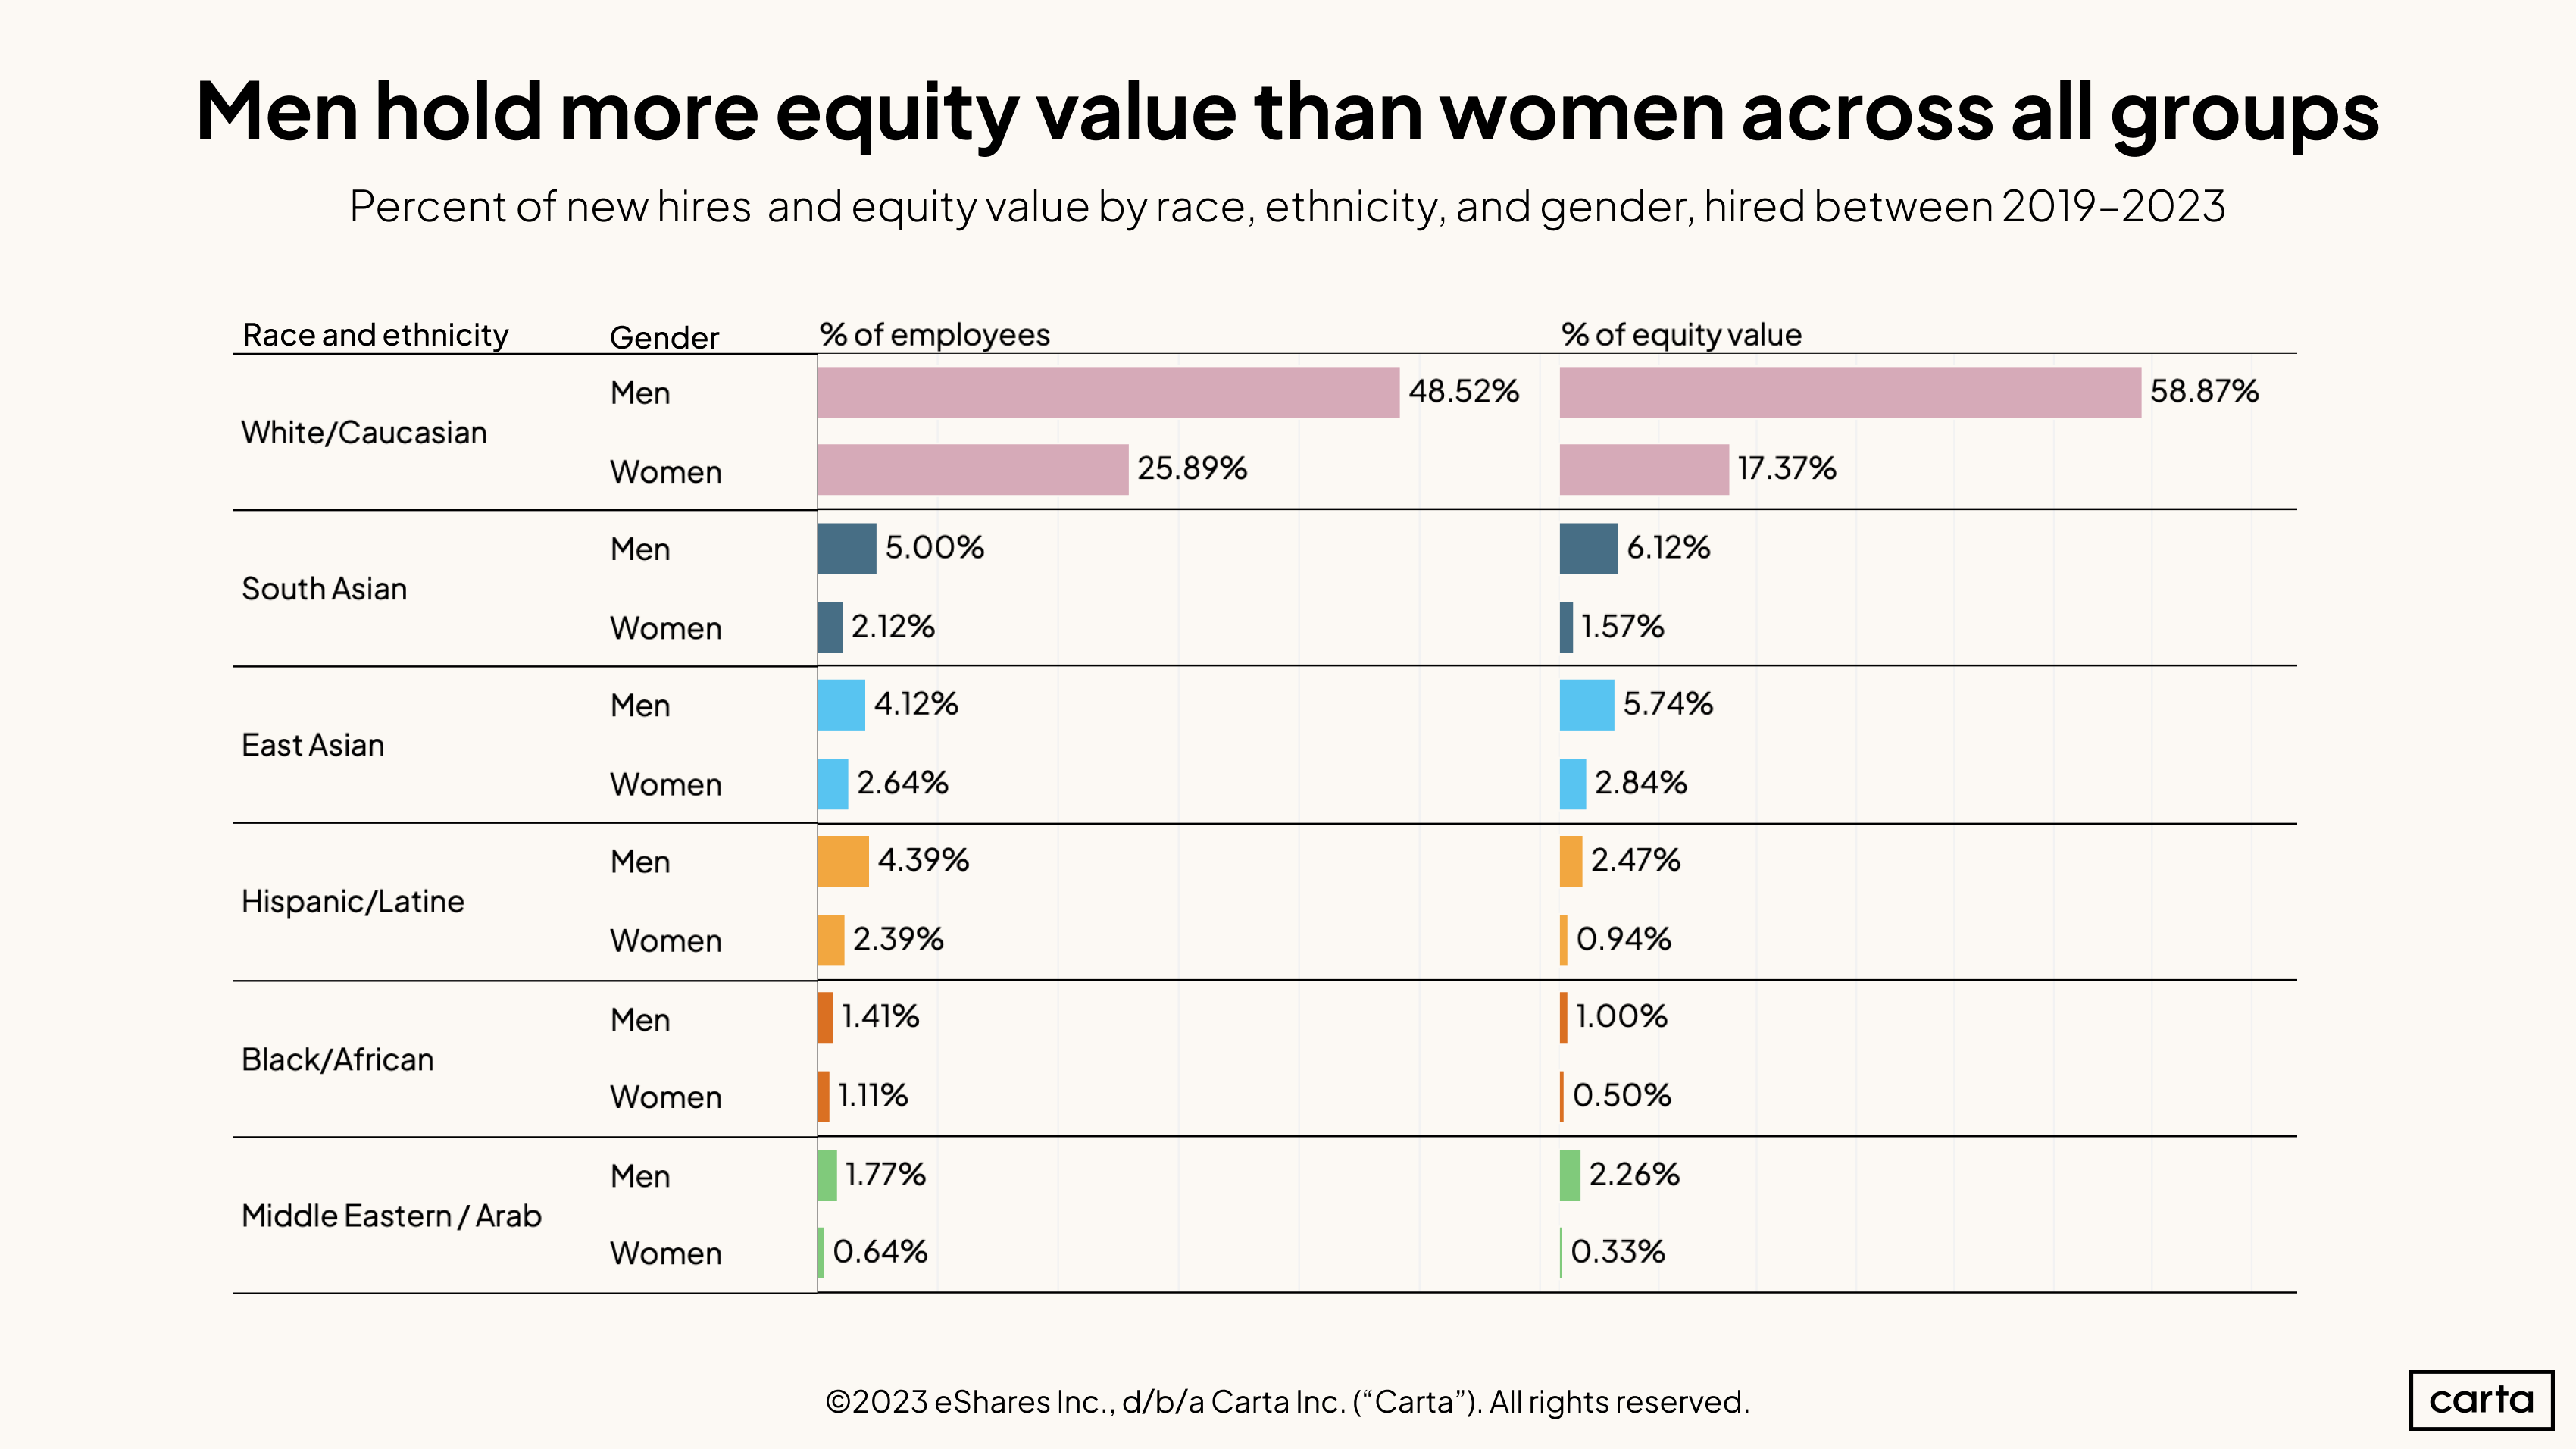
Compared to women, men make up a larger percentage of employees and receive a larger percentage of equity value across each group. But the gaps vary across different races and ethnicities. For instance, white men receive about 3.4x more equity value than white women, whereas East Asian men receive 2x more equity than East Asian women.
Among all these groups, the largest gap between the percentage of employees and the percentage of equity is among Hispanic women. They account for 2.39% of all employees yet receive just 0.94% of equity value.
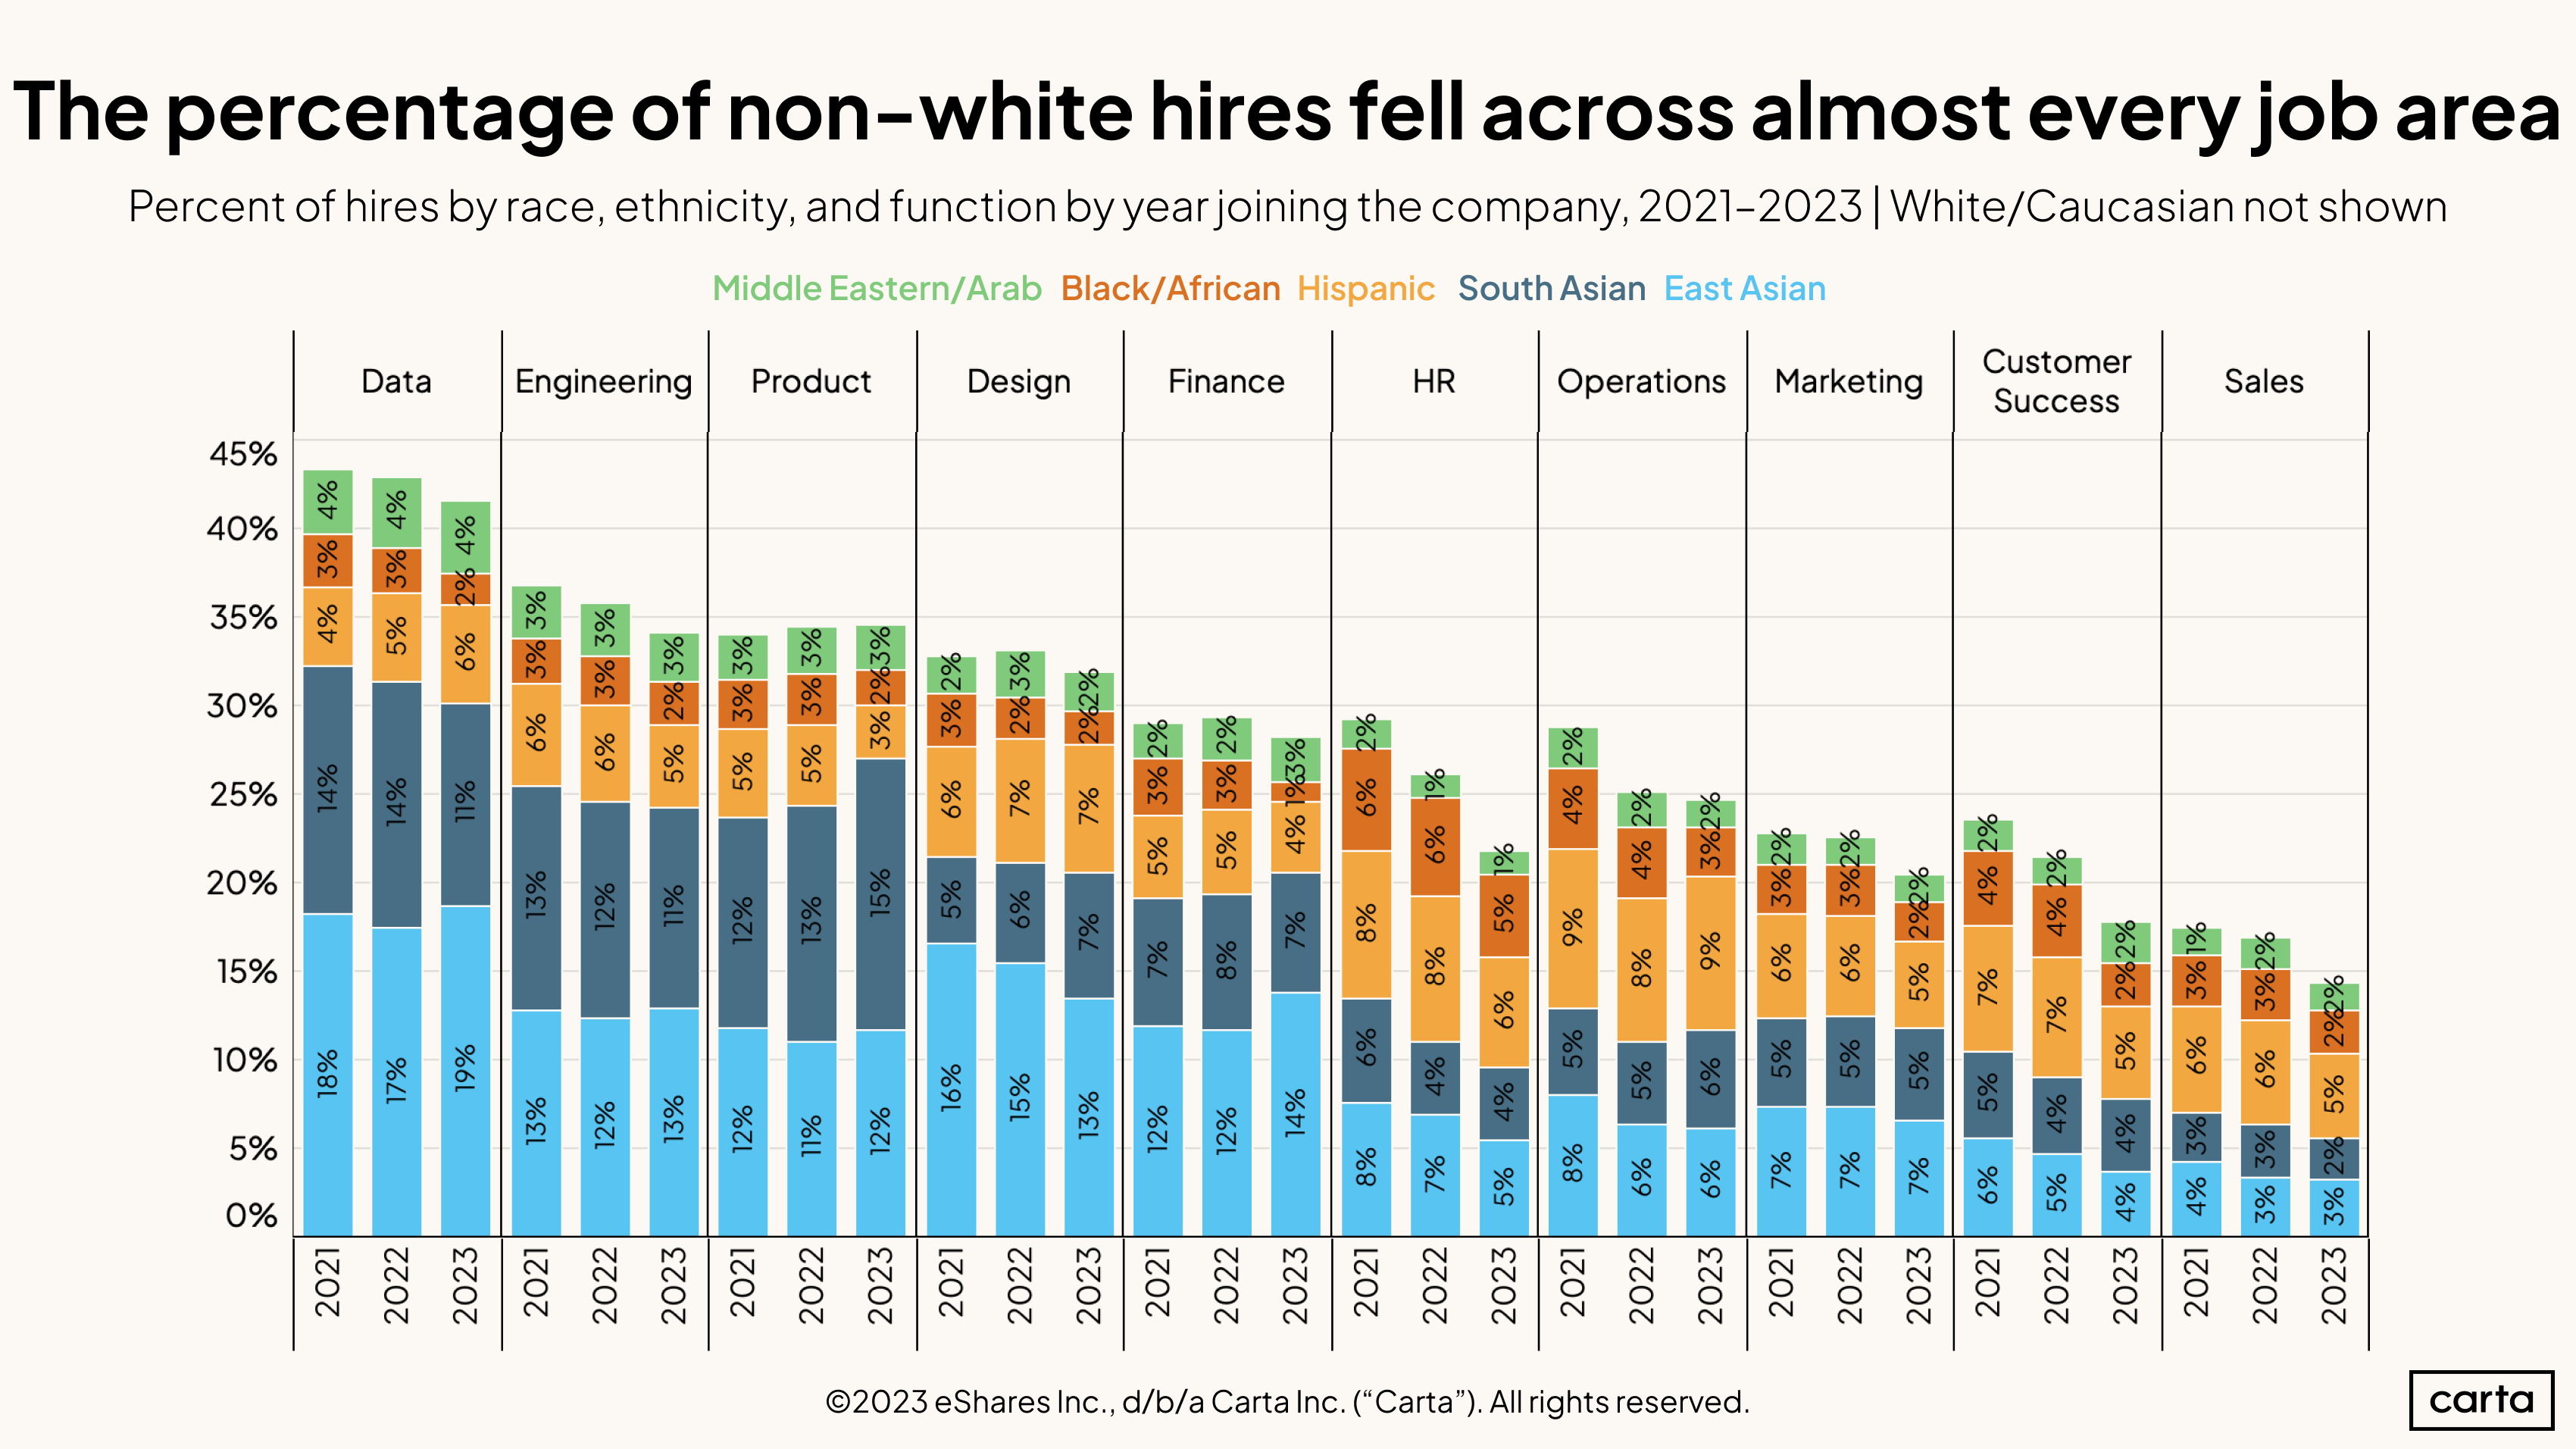
The majority of new hires across each of these key job areas are white, and the gap between hires who were white and those who were people of color increased in 2023 in each segment except for product roles. The smallest gap is in data, where 58% of hires this year are white and 42% are of other races and ethnicities. The largest gap is in sales roles, where 86% of new hires this year are white.
Over the past two years, the biggest change has occurred in human resources (HR) roles, where the rate of non-white hires has fallen from 29% in 2021 to 21% in 2023. The racial and ethnic background of new hires has also shifted noticeably in operations and customer success.
Gender
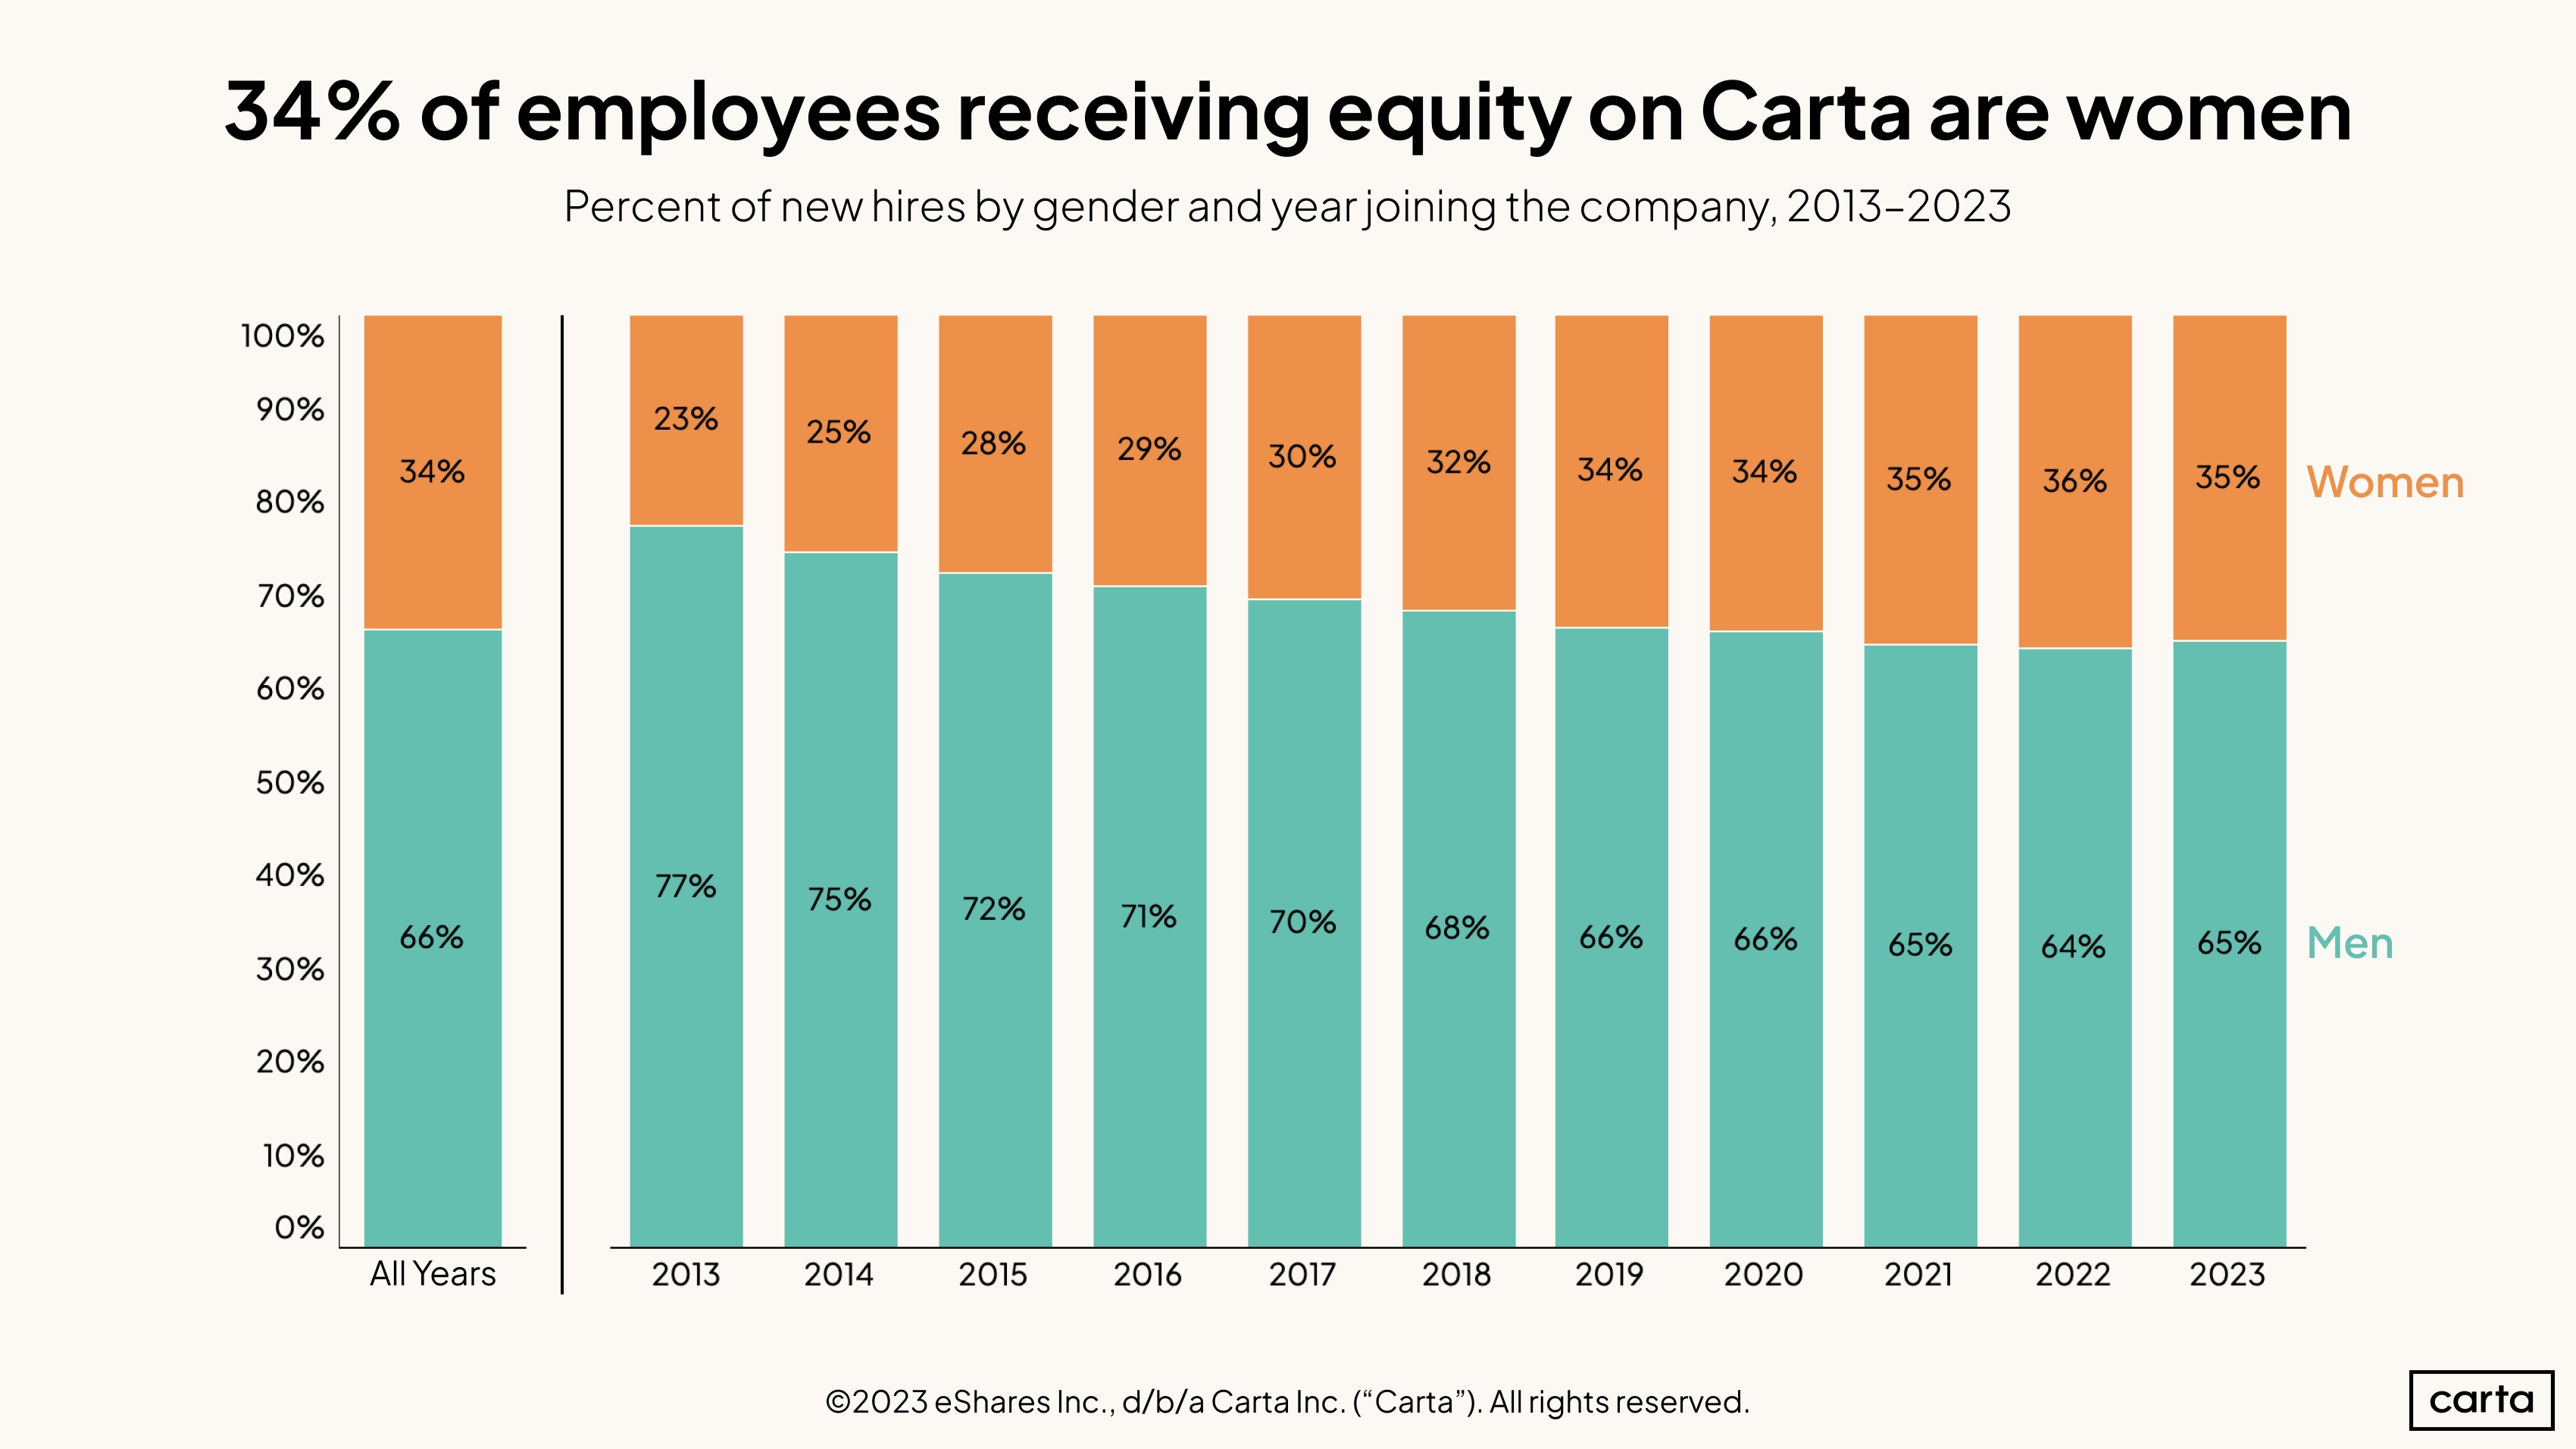
The proportion of new equity-receiving hires who are women dipped slightly to 35% in 2023, the first annual decline in the past decade. Before this slight reversal, the proportion of new hires receiving equity who are women had been growing slowly but steadily, rising from 23% in 2013 to 36% in 2022.
Cumulatively, over the past 11 years, 34% of new hires who received equity are women.
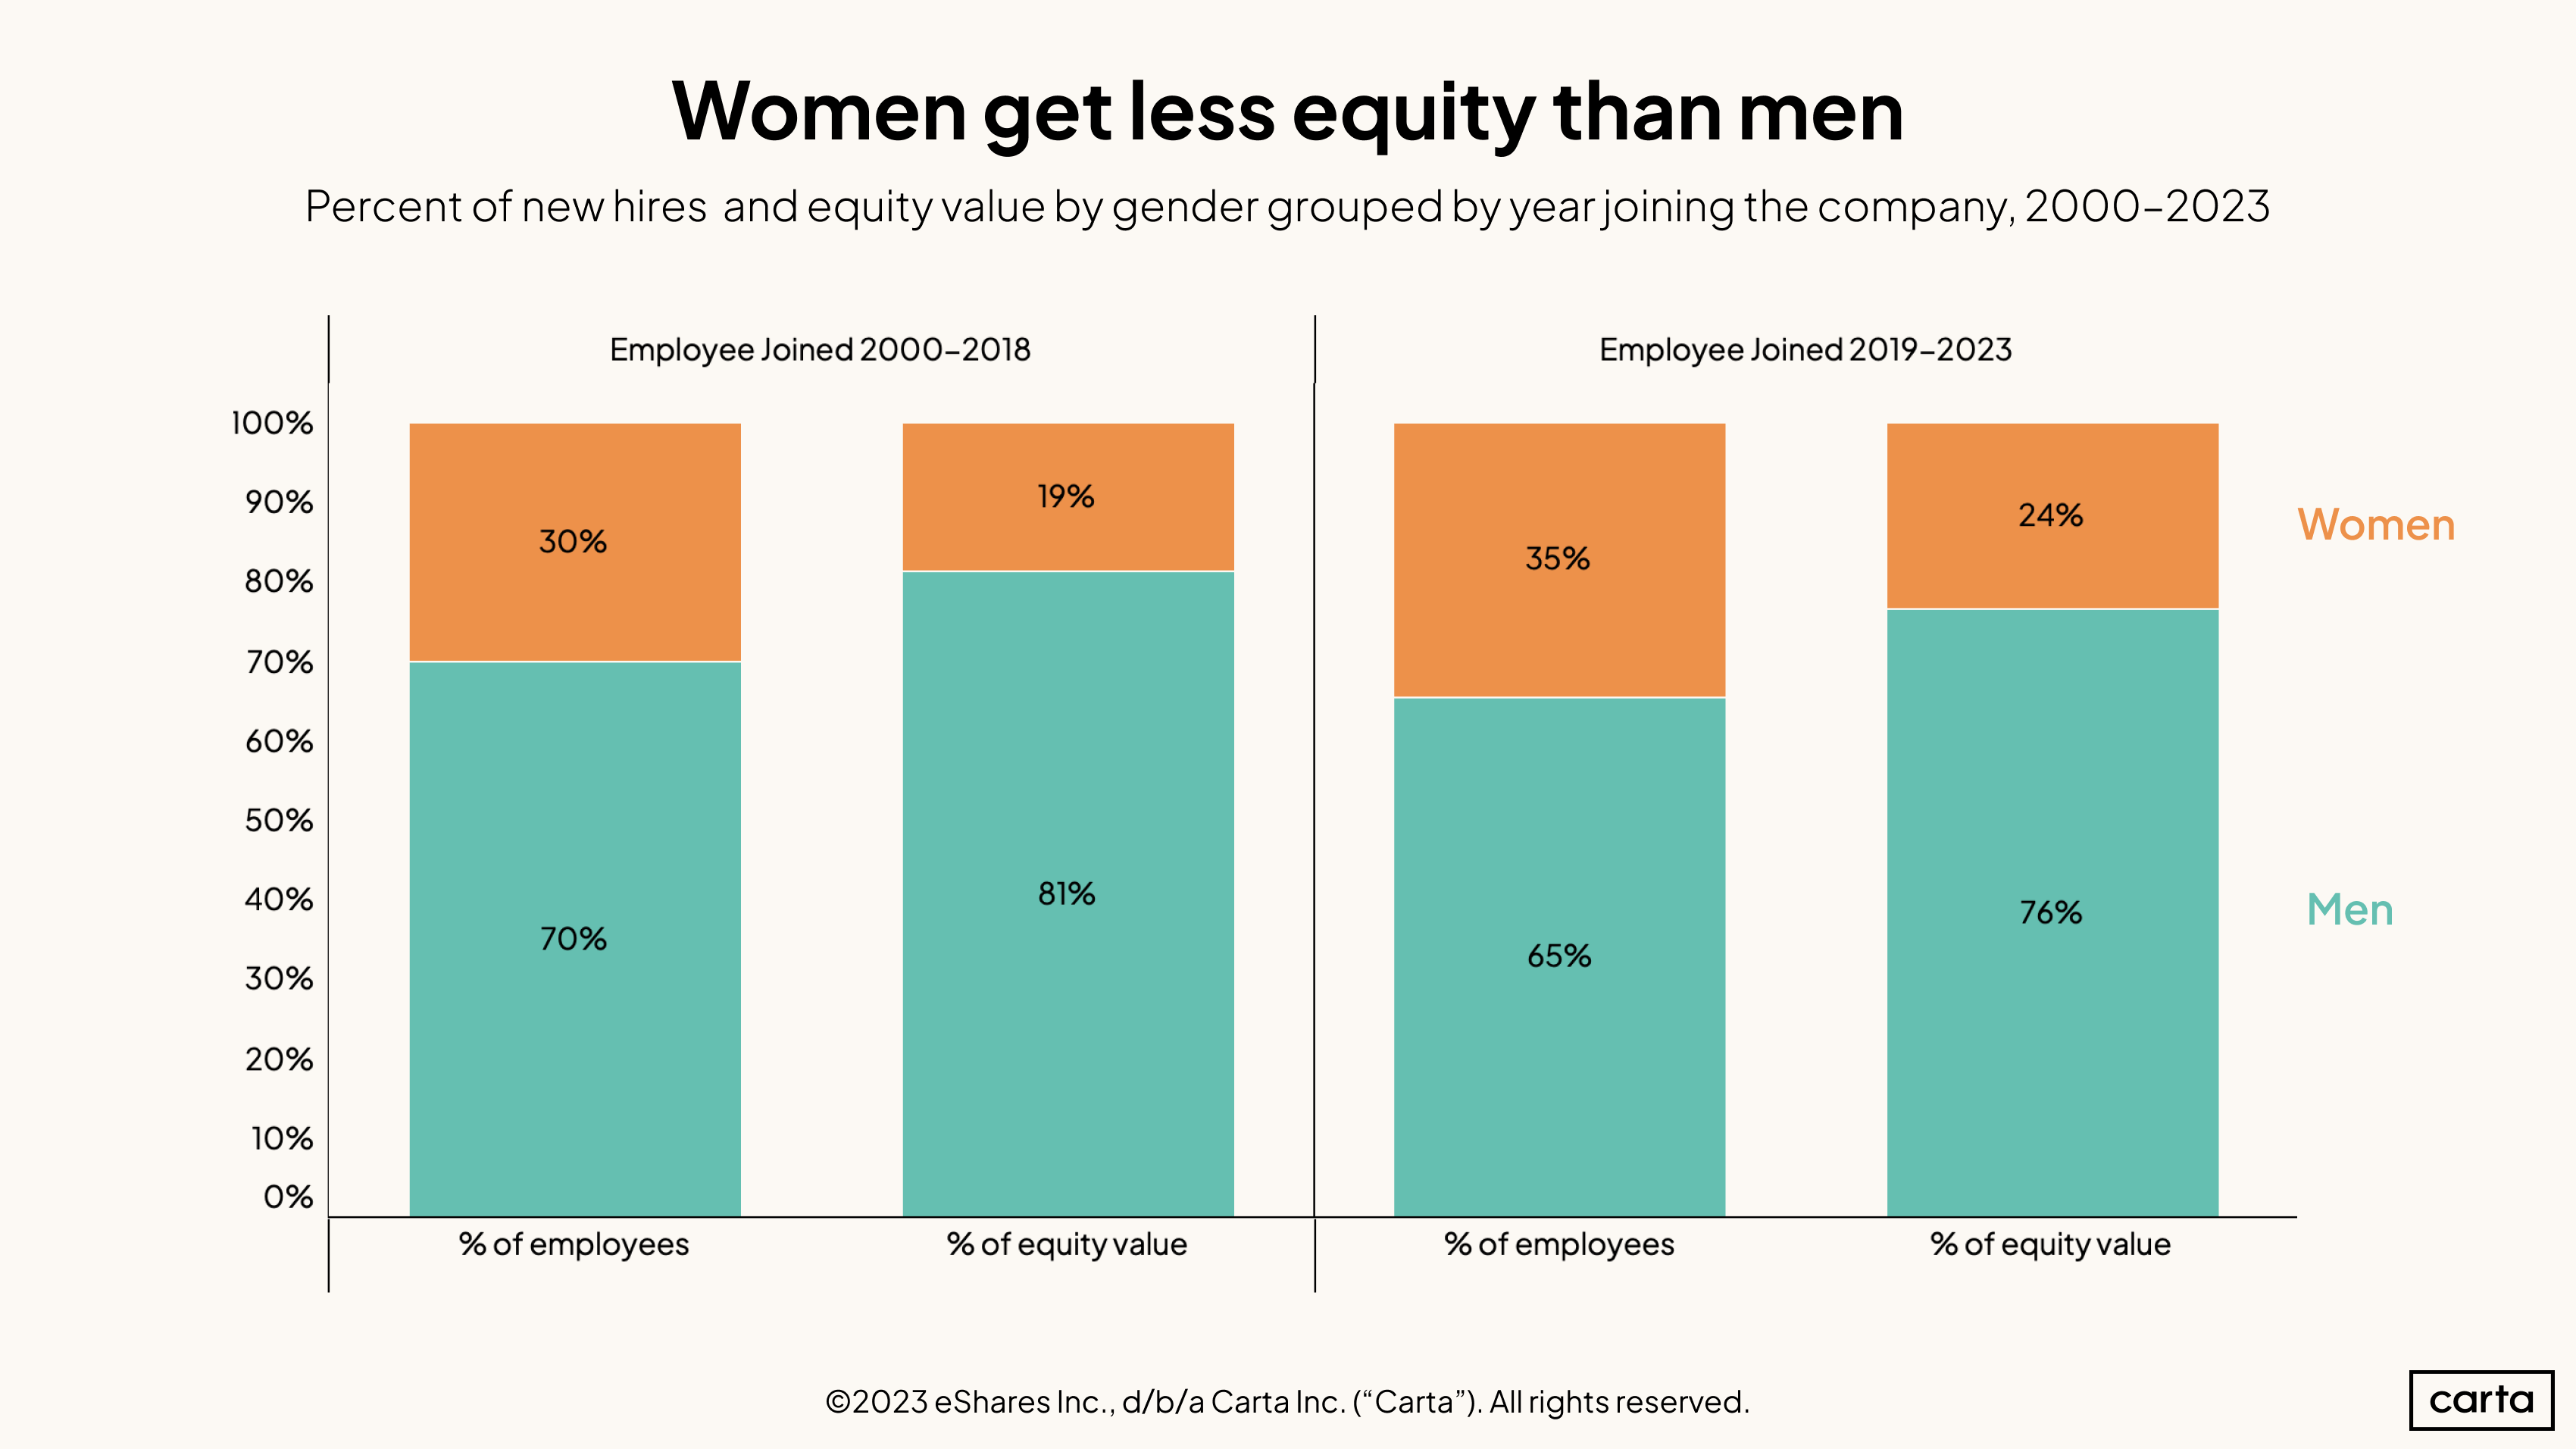
Over the past five years, 35% of new hires who receive equity as part of their compensation are women. But that 35% received just 24% of all total equity issued. Women are underrepresented compared to men at all levels of startup employment, and the gap is particularly acute at higher levels of the compensation spectrum.
However, the equity gaps between men and women have narrowed over the past five years compared to the previous 19. Women who were hired between 2000 and 2018 made up 30% of all new employees and received 19% of all newly issued equity.
The percentage of new hires who are women either declined or stayed steady in most major job functions this year. Combined with the above data on the racial and ethnic background of new hires, this indicates that companies were more likely to hire white men in 2023 than in the past two years.
Women still make up the majority of new hires in HR and marketing functions, as they have in each of the past five years. The percentage of new hires who are women in the product segment has gone from 33% in 2019 to 36% this year, the largest increase of any job function.
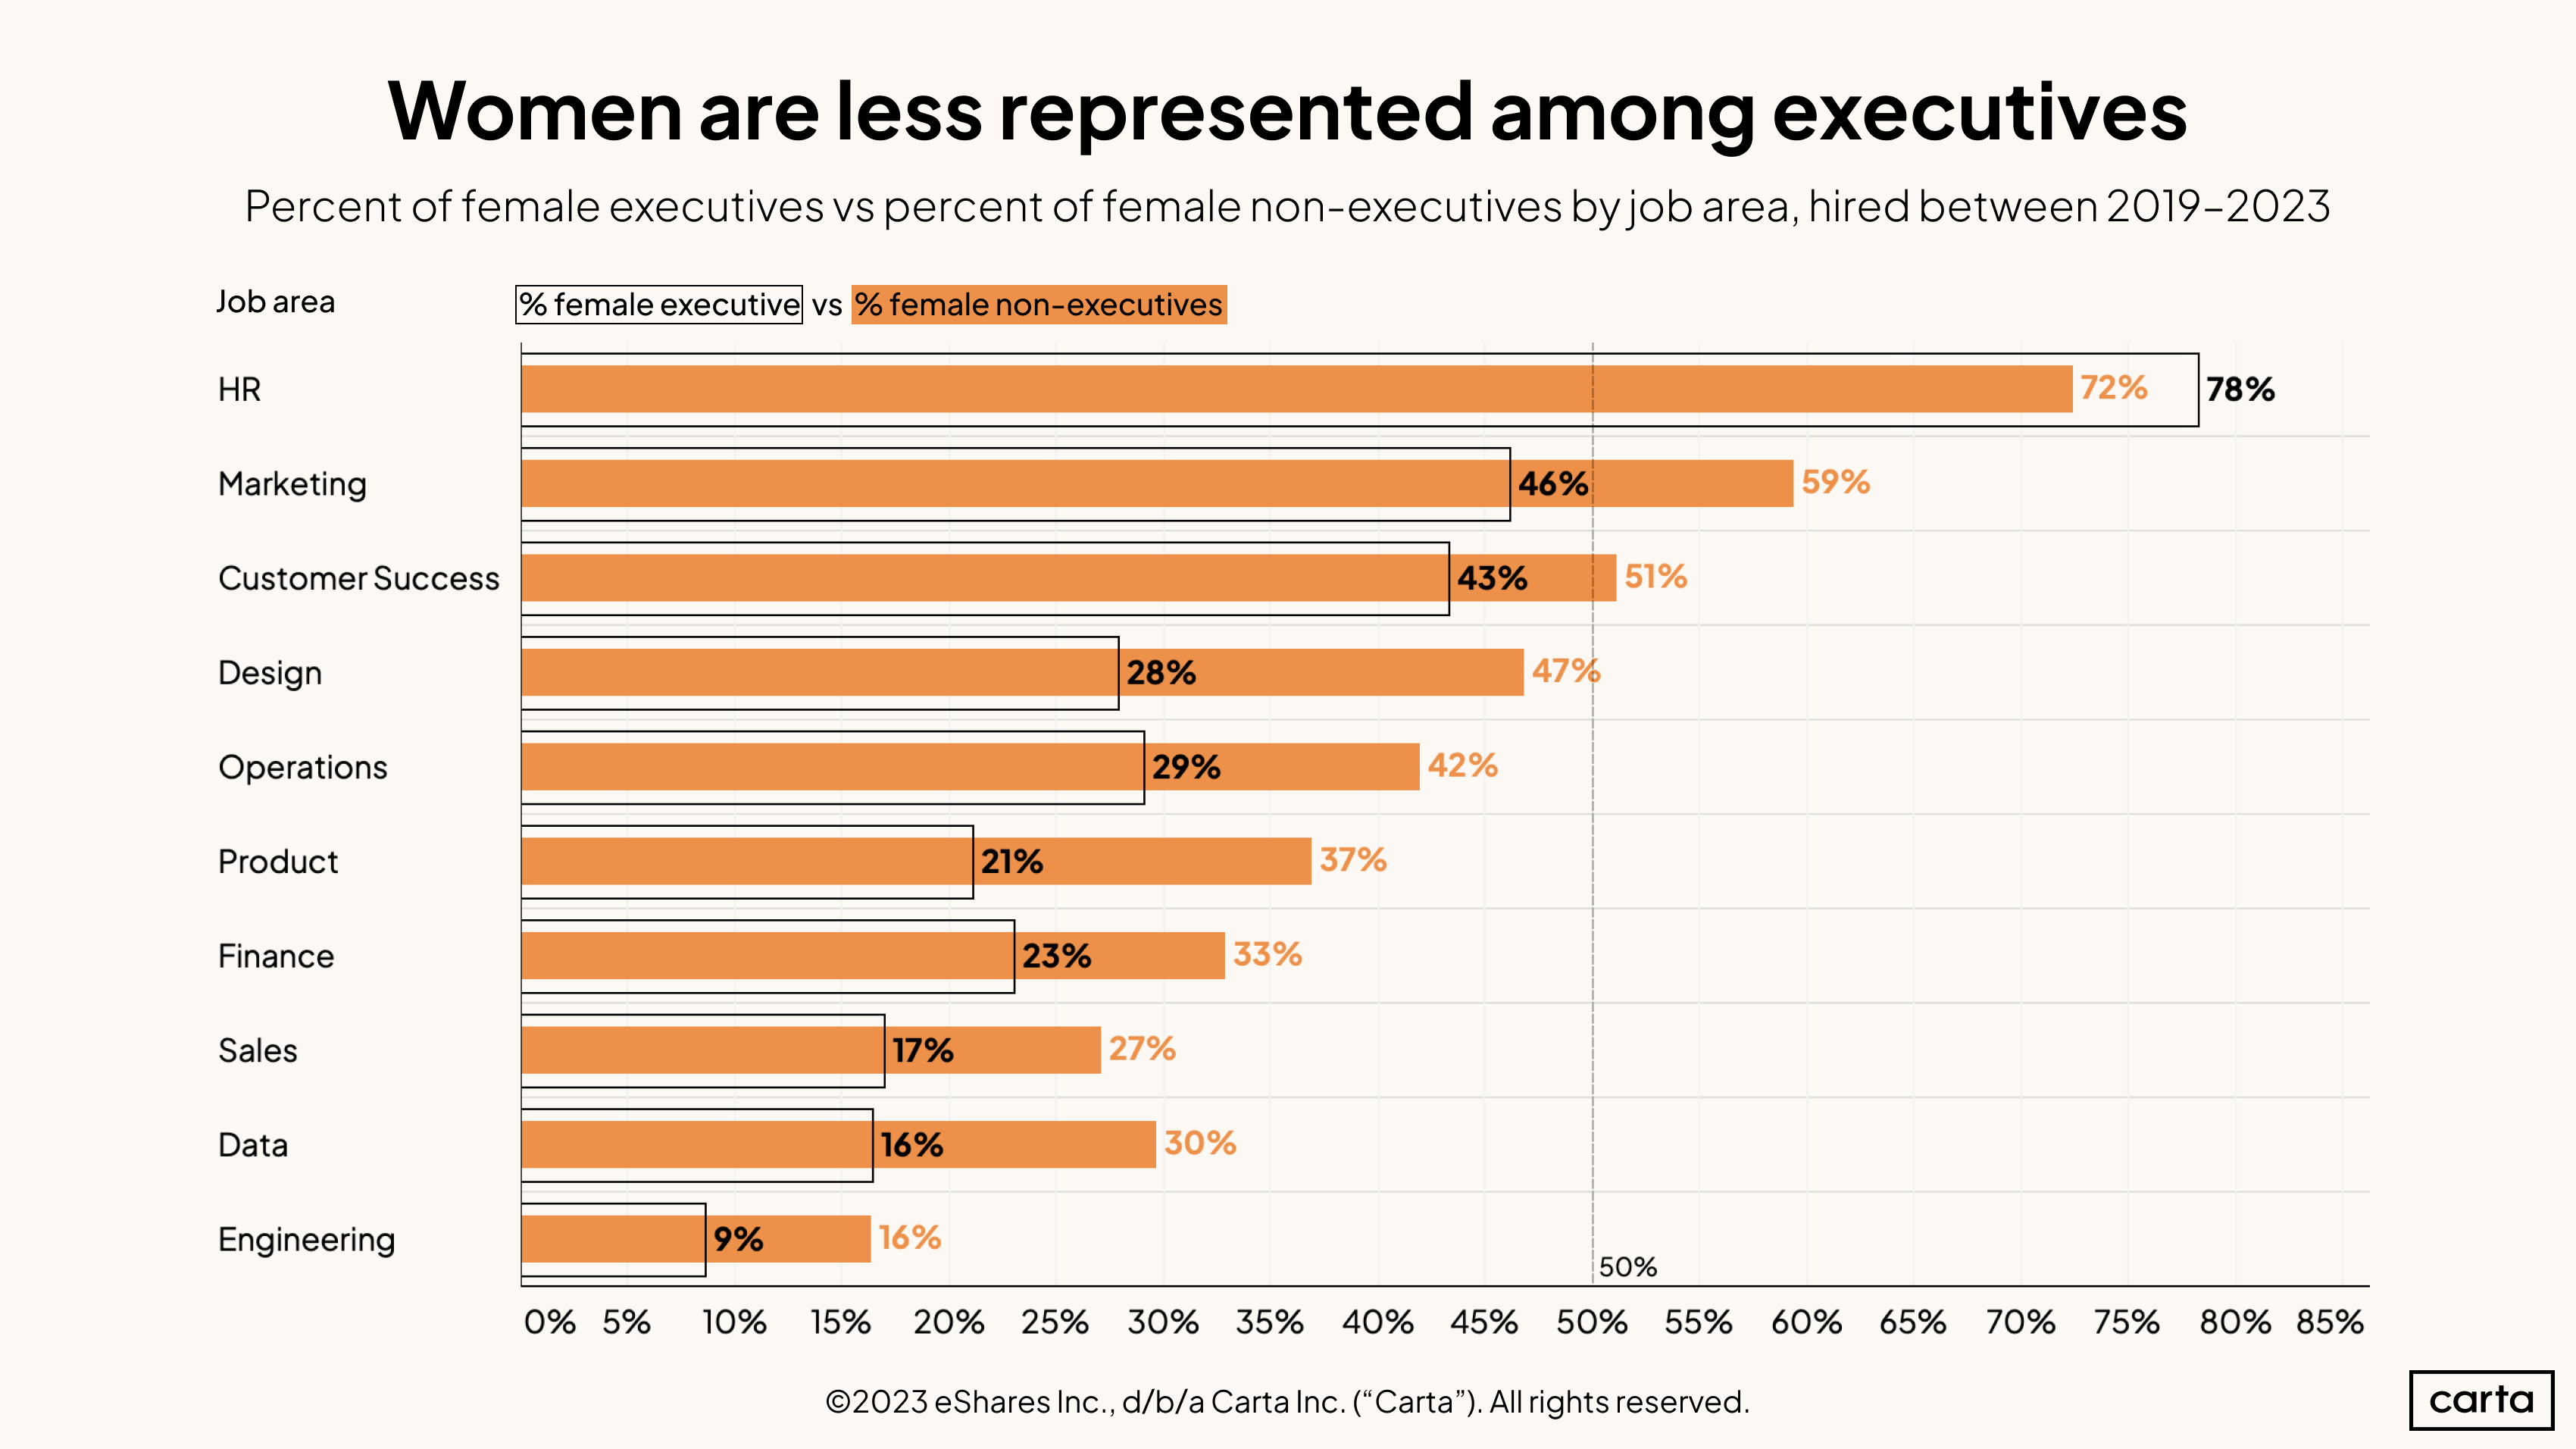
Among employees in HR hired to non-executive positions in the past five years, 72% are women. Among HR executives, that figure increases to 78%. In every other major job function, the rate of executive women lags behind the rate of women in non-executive roles—in some cases, far behind.
In the design function, for instance, women make up 47% of all non-executive employees but just 28% of executives. In product, 37% of non-executive employees are women, compared to 21% of executives. The gap is particularly stark in the functions where women are least represented in the first place: In both data and engineering, the proportion of women in non-executive roles is nearly twice as high as that of executives.
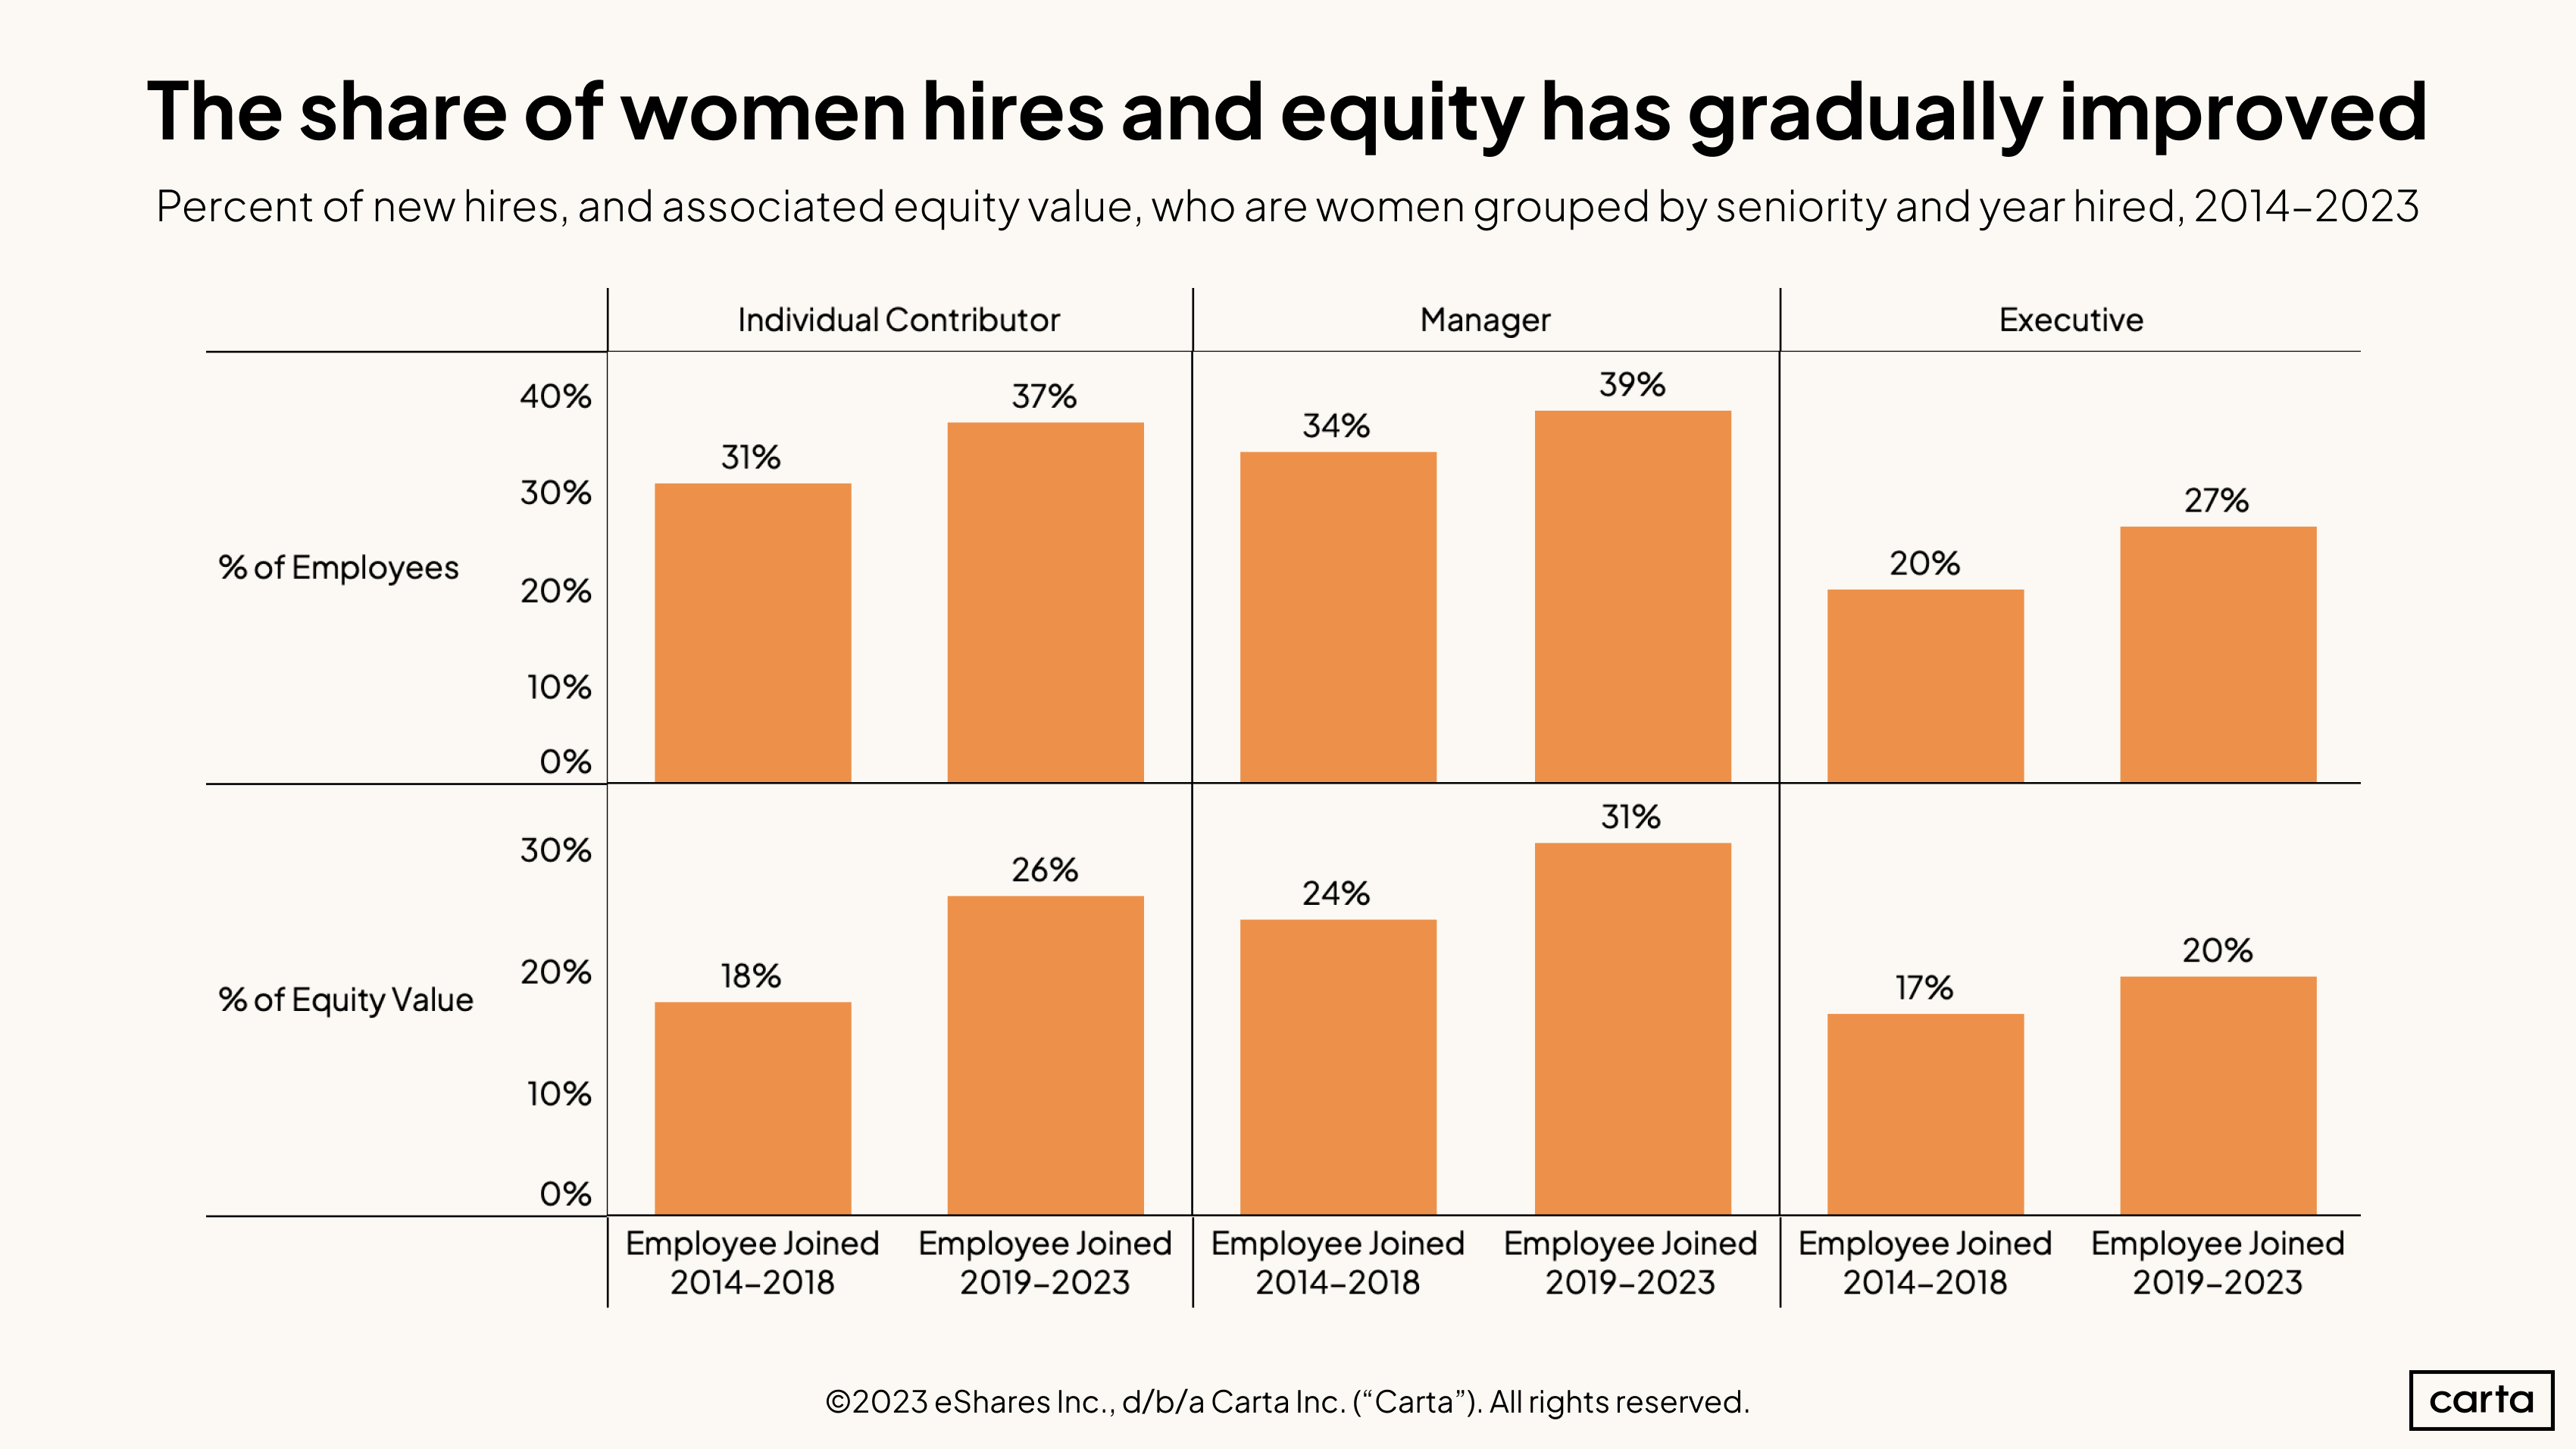
Over the past five years, women have become more prevalent as individual contributors, as managers, and as executives. And at each of those job functions, women also earn a larger proportion of all equity than the previous five years.
In terms of gender representation, the biggest gains have come at the executive level, where women have gone from 20% of all hires between 2014 and 2018 to 27% between 2019 and the present. Regarding equity compensation, individual contributors and managers have both seen significant gains, with individual contributors going from 18% of equity received to 26% and managers from 24% to 31%.
Even with those recent gains, however, women are still hired much less frequently than men and receive a much smaller slice of the equity pie.
Founders
Race & Ethnicity
While the founder data largely looks similar to last year, there were a few minor shifts in the racial and ethnic makeup of founders who started new companies on Carta in 2023.
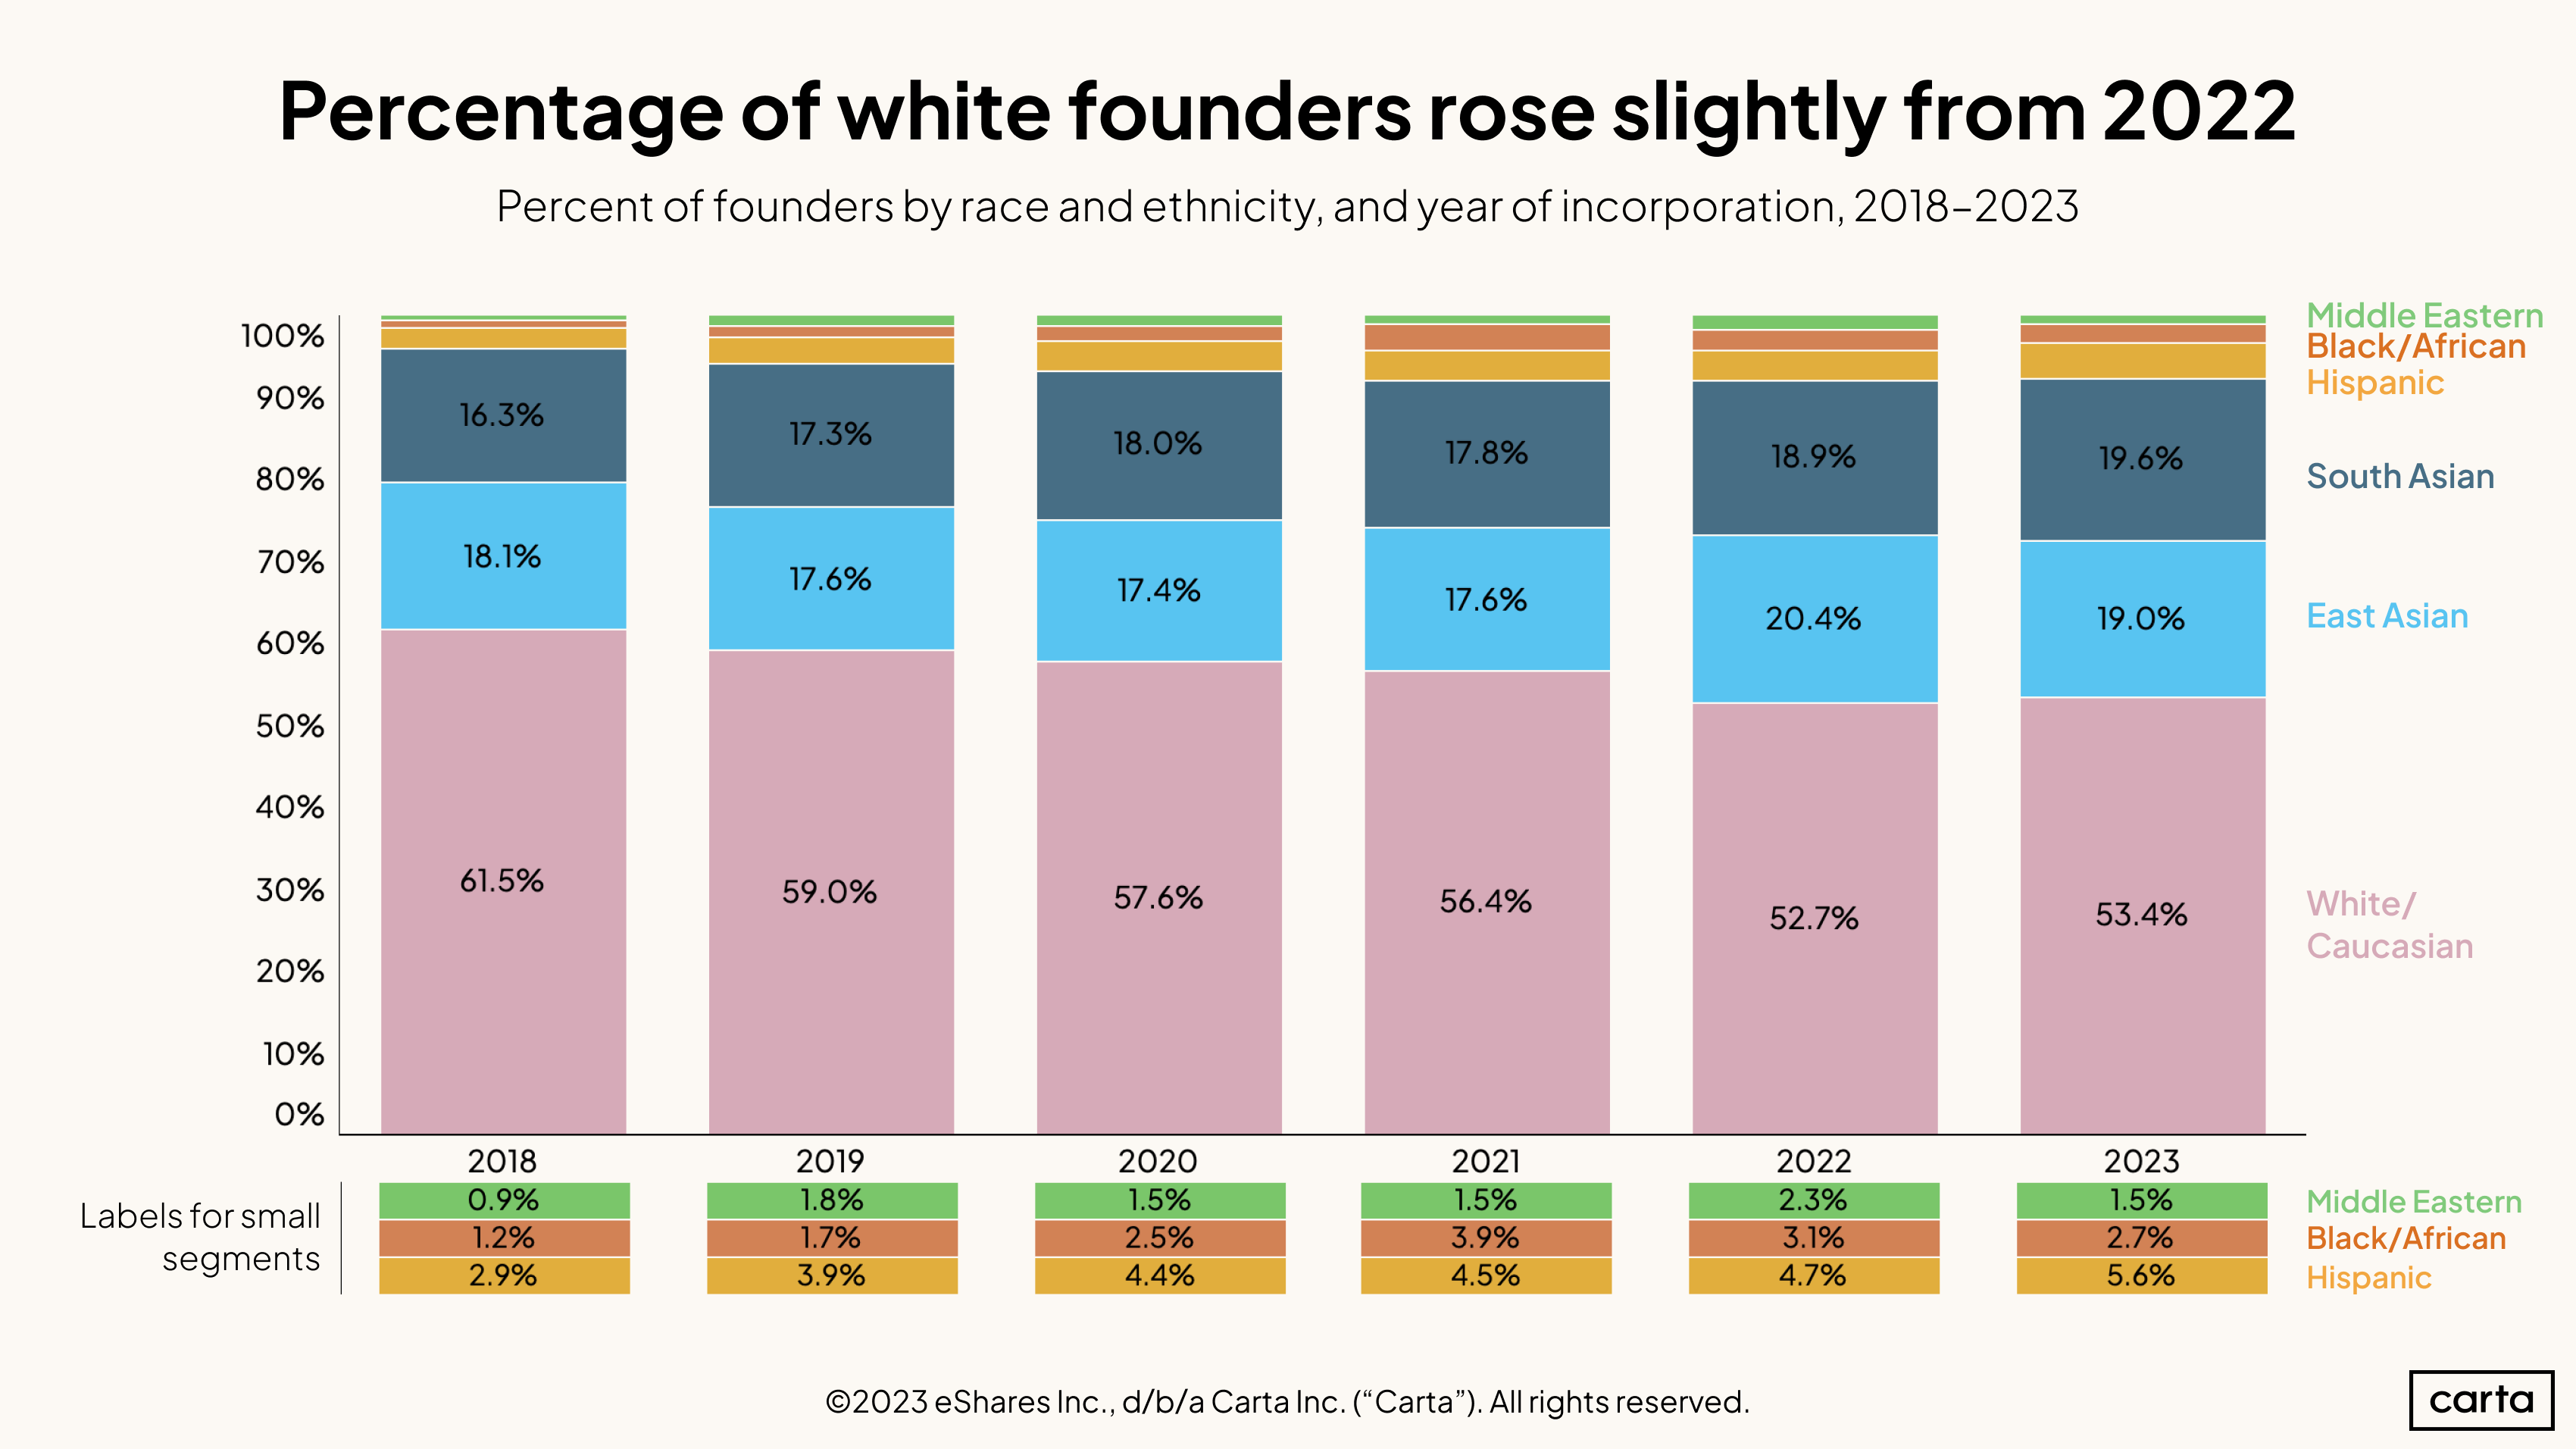
Hispanic founders accounted for 5.6% of the founder population in 2023, the highest rate of the past six years. Meanwhile, the percentage of Black founders has fallen from 3.9% in 2021 to 2.7% in 2023. Overall, 18% of the U.S. labor force is Hispanic and 13% is Black. With those shifts we saw the percentage of white founders increase slightly from 2022, rising to 53.4%. That ends a string of four straight years in which the percentage of non-white founders increased, and the percentage of white founders declined.
The percentage of South Asian founders increased to 19.6% this year, also a recent high. Conversely, the rate of East Asian founders declined to 19%. There were more South Asian founders than East Asian founders in 2023, a reversal from 2022.
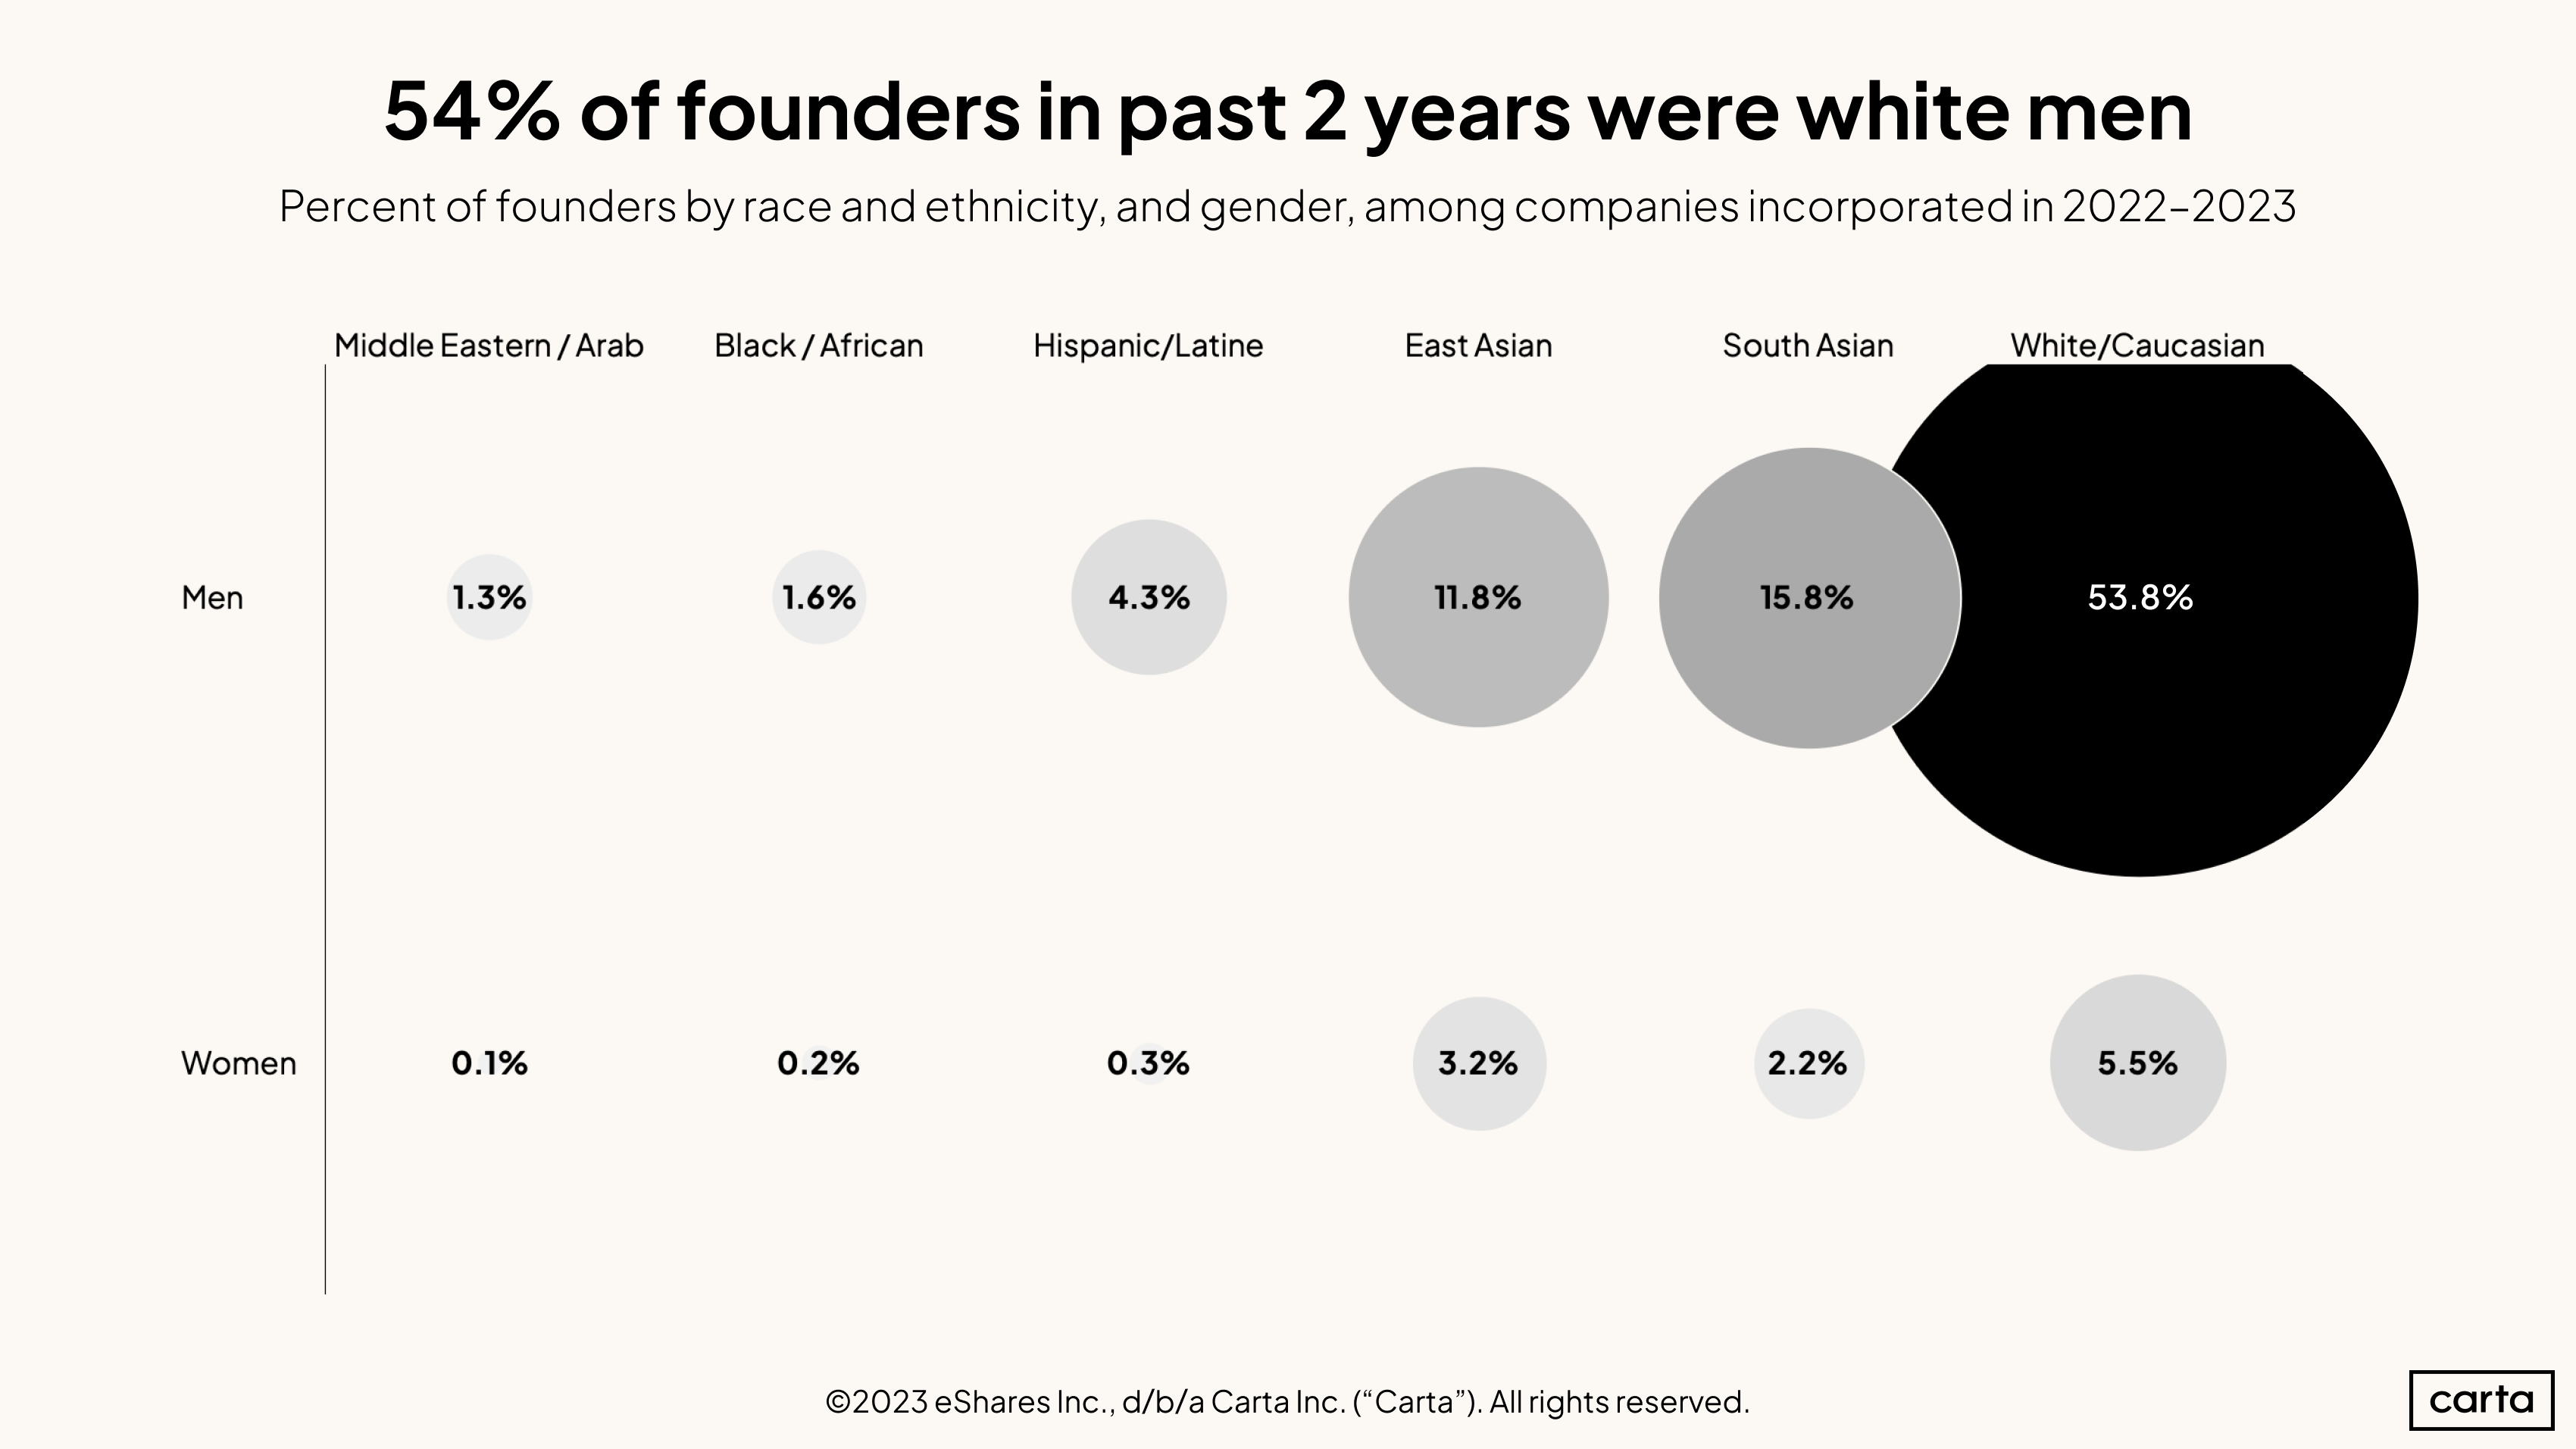
The majority of founders over the past two years are white men. Across all races and ethnicities, more than seven out of every eight founders over the past two years are men.
There is a significant gender imbalance among founders of all races and ethnicities, but some disparities are smaller than others. East Asian founders who are men are more prevalent than East Asian founders who are women by a ratio of about 3.7 to 1, compared to a ratio of 9.8 to 1 among white founders.
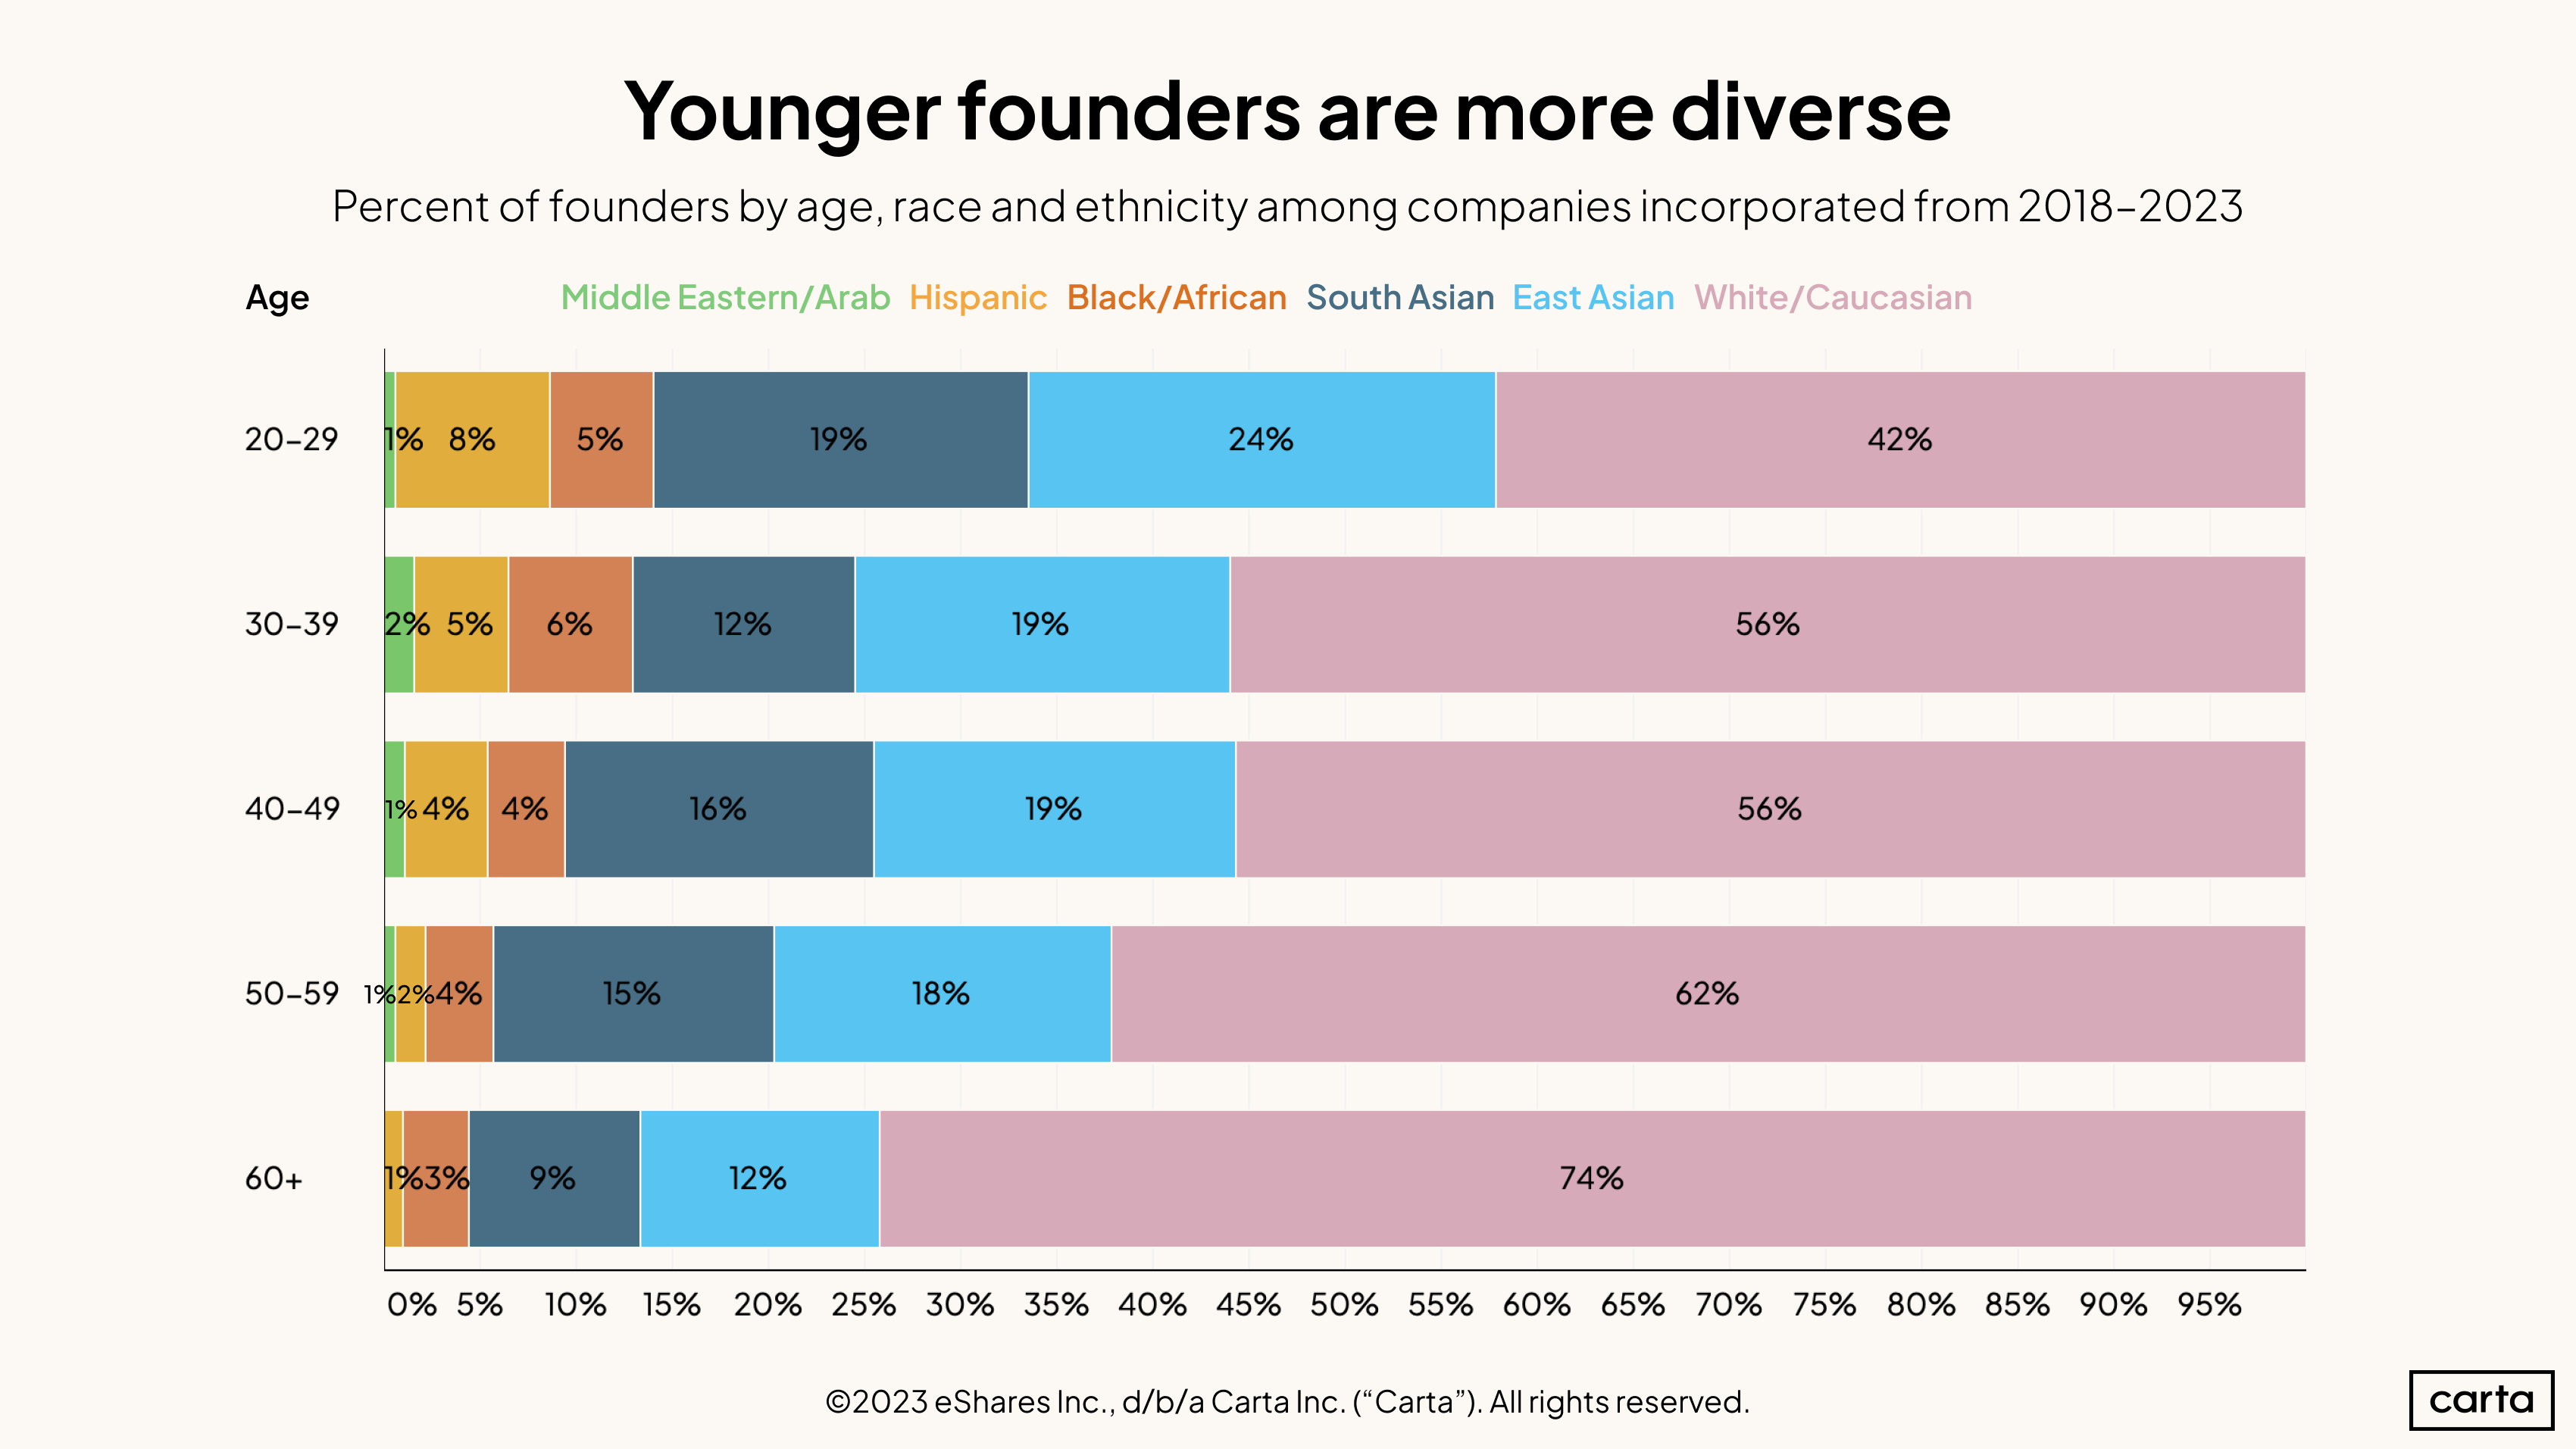
Overall, the majority of founders are white. But that’s not the case among founders in their 20s—in that cohort, just 42% of founders dating back to the start of 2018 are white. That’s a significant difference from the cohort of age-60+ founders, where 74% are white.
There are major gaps across age groups among other races and ethnicities, too. East Asian founders account for 24% of all 20-something founders over the past six years, compared to just 12% of founders in their 60s. Nearly 20% of founders in their 20s are South Asian, compared to less than 10% of founders in their 60s or older. The biggest disparity exists among Hispanic founders, who make up 8% of founders in their 20s compared to just 1% of those 60 or older.
There’s a clear trend across all age groups: Younger founders are more likely to have diverse racial and ethnic backgrounds.
Gender
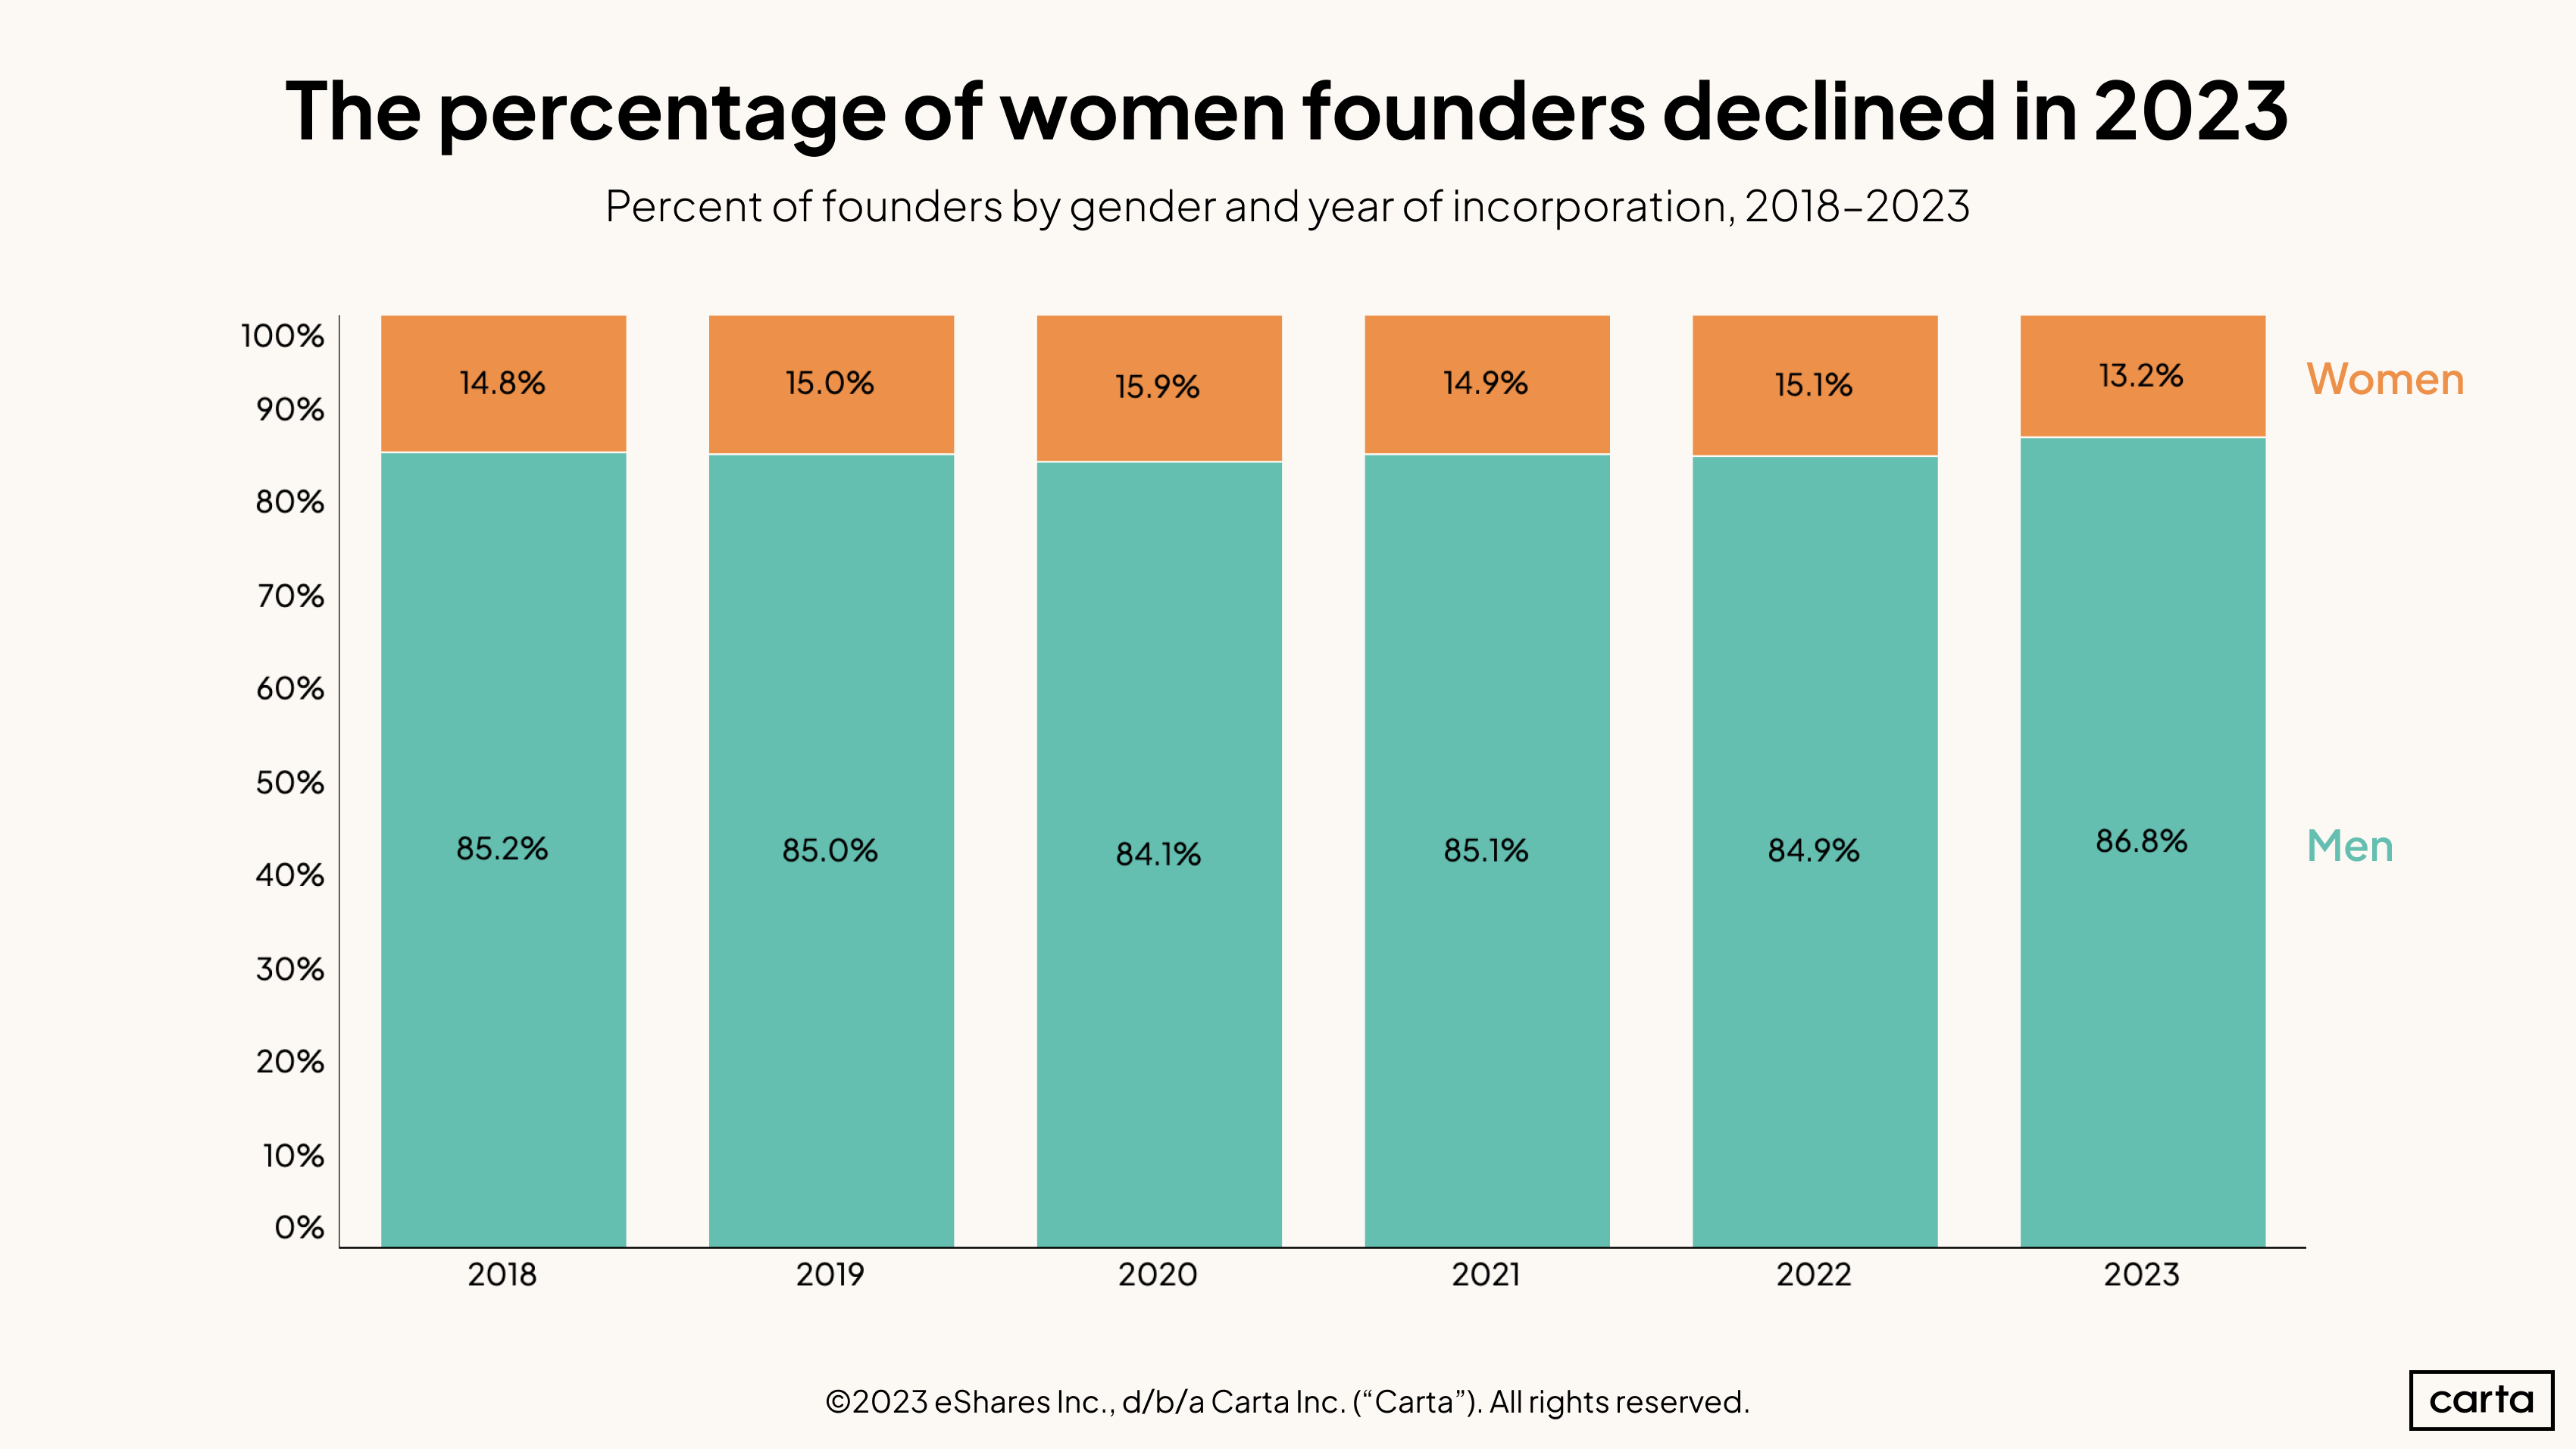
The percentage of founders who are women declined this year. For companies incorporated in 2023, 86.8% of founders were men, the highest rate in the past six years. The proportion of founders who are women (13.2%) is the lowest in the last six years.
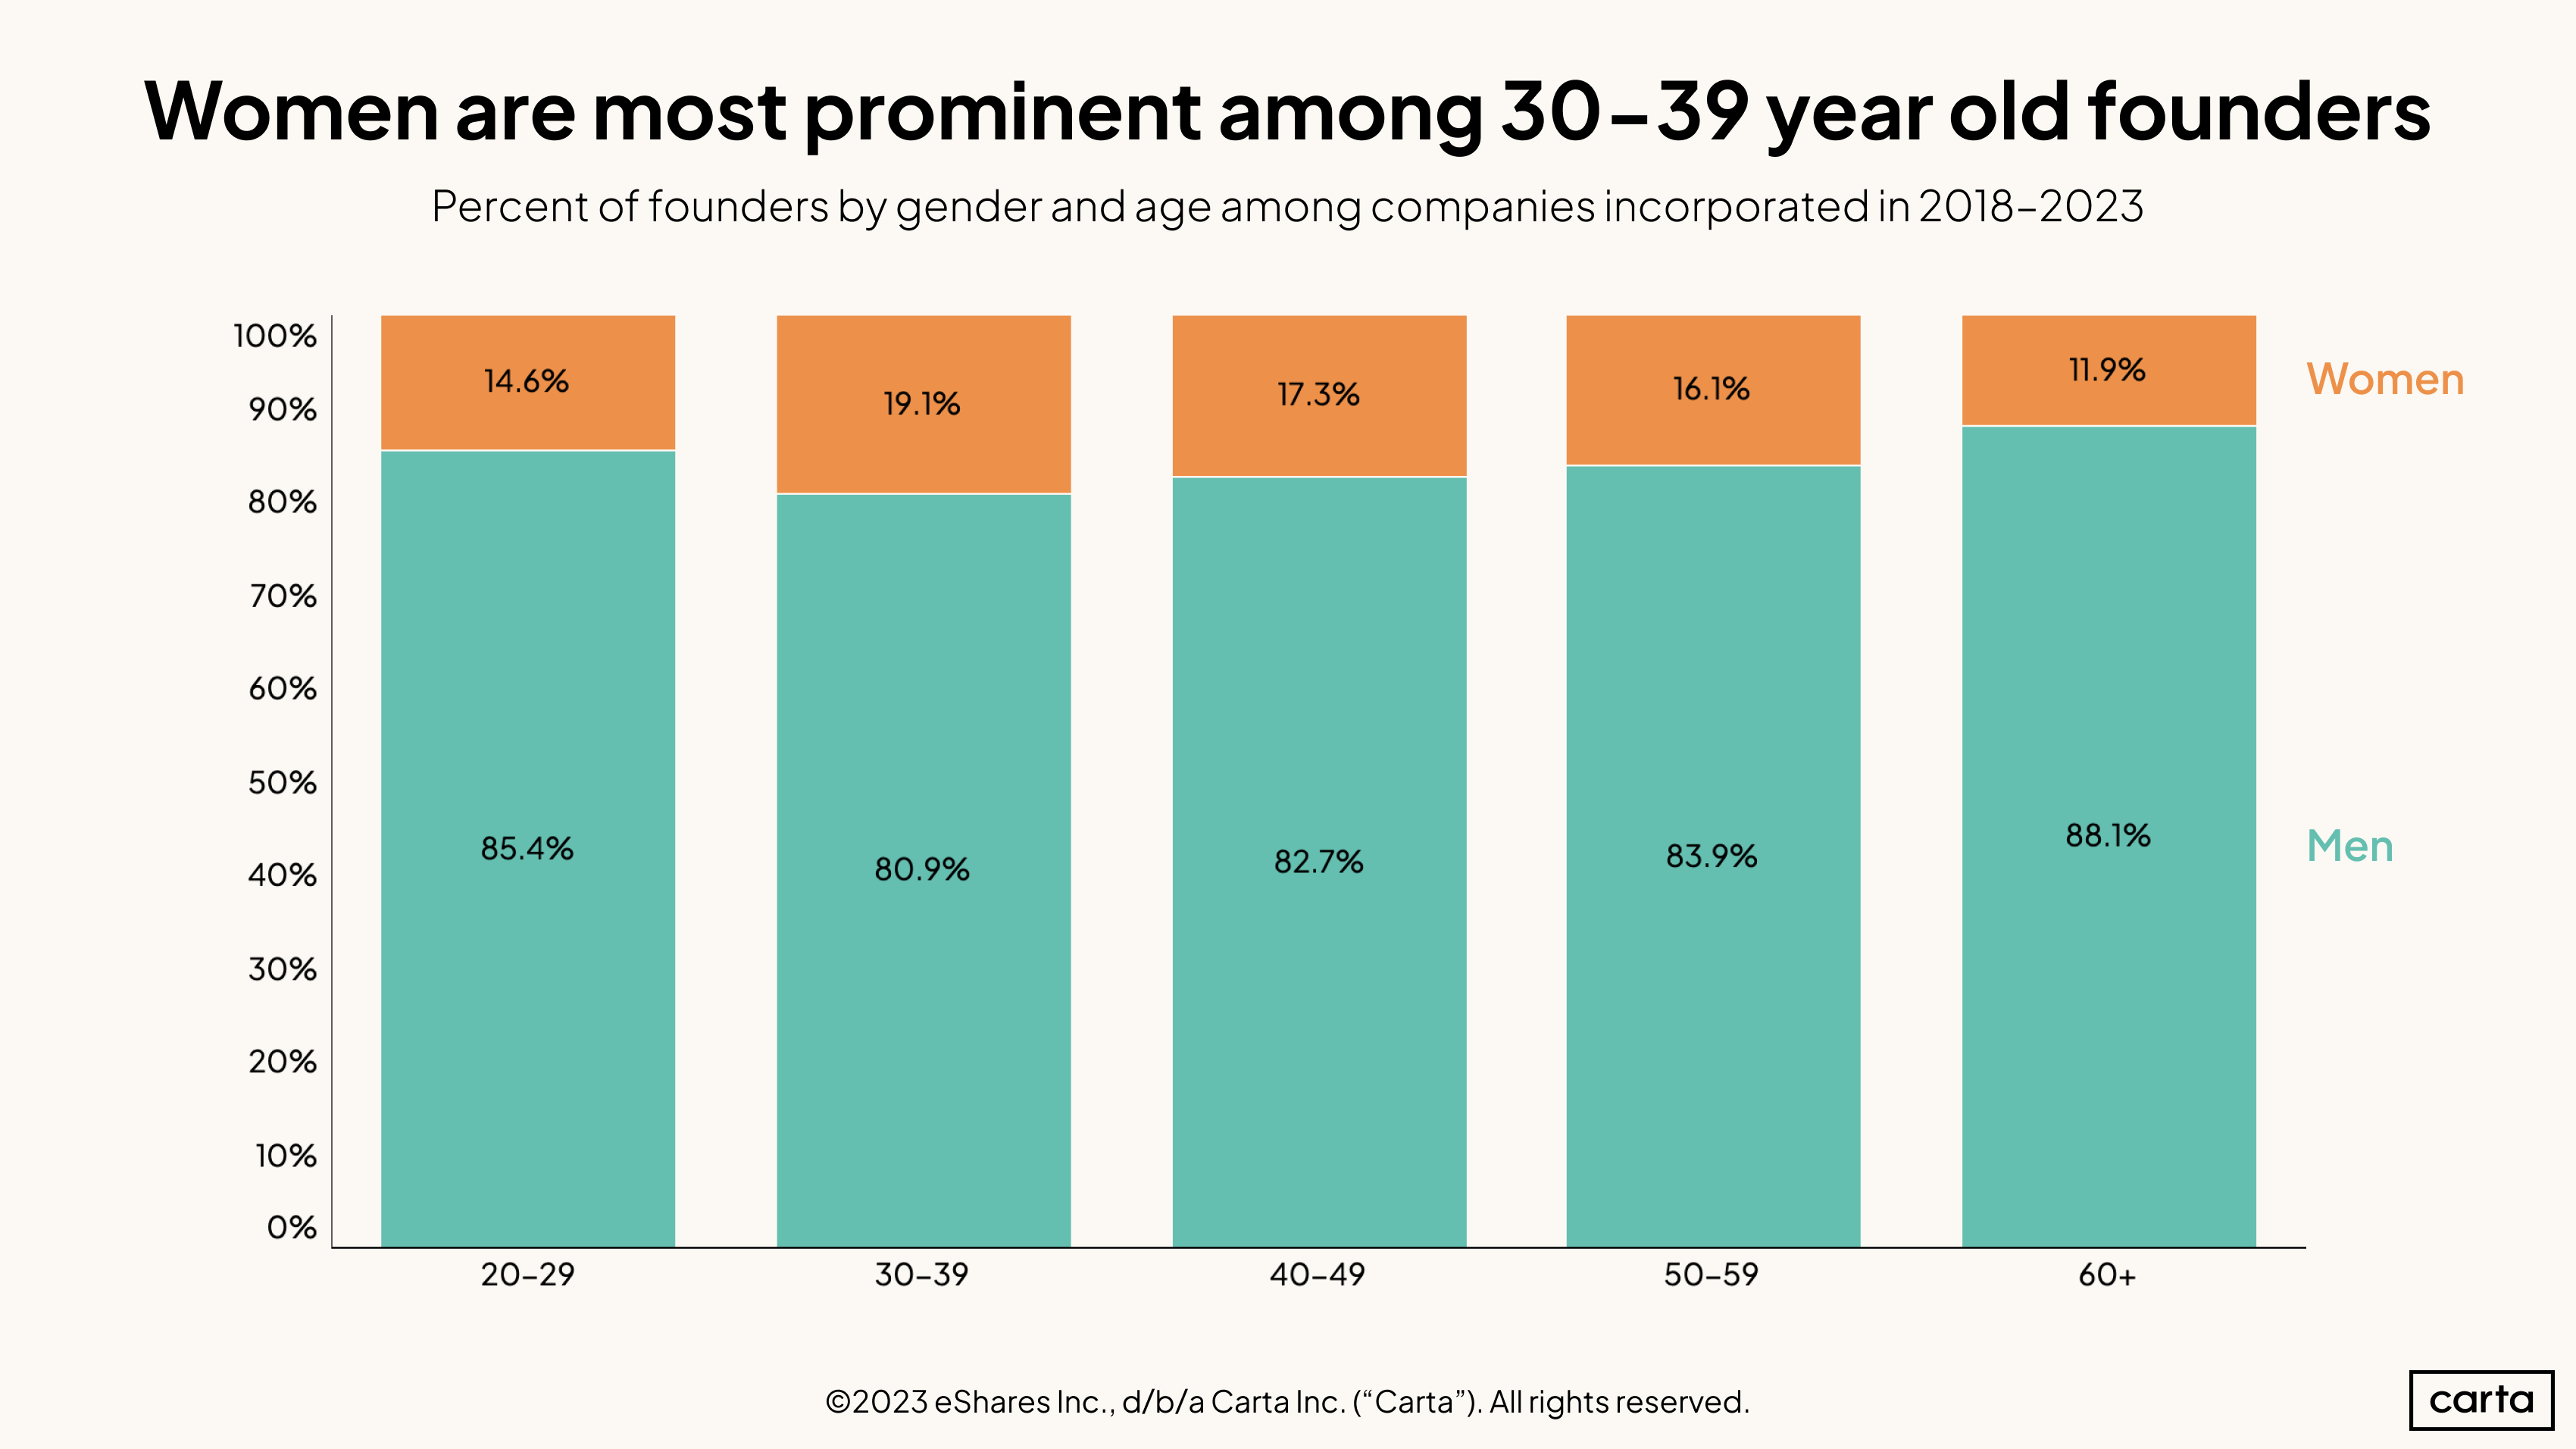
Broken down by age group, there are the most women in the 30-39 founder cohort. Among these founders in their 30s, 19.1% are women. In older age groups, women are more infrequent, with women accounting for 11.9% of founders who are 60 or older. Across all age groups, men are the overwhelming majority of founders.
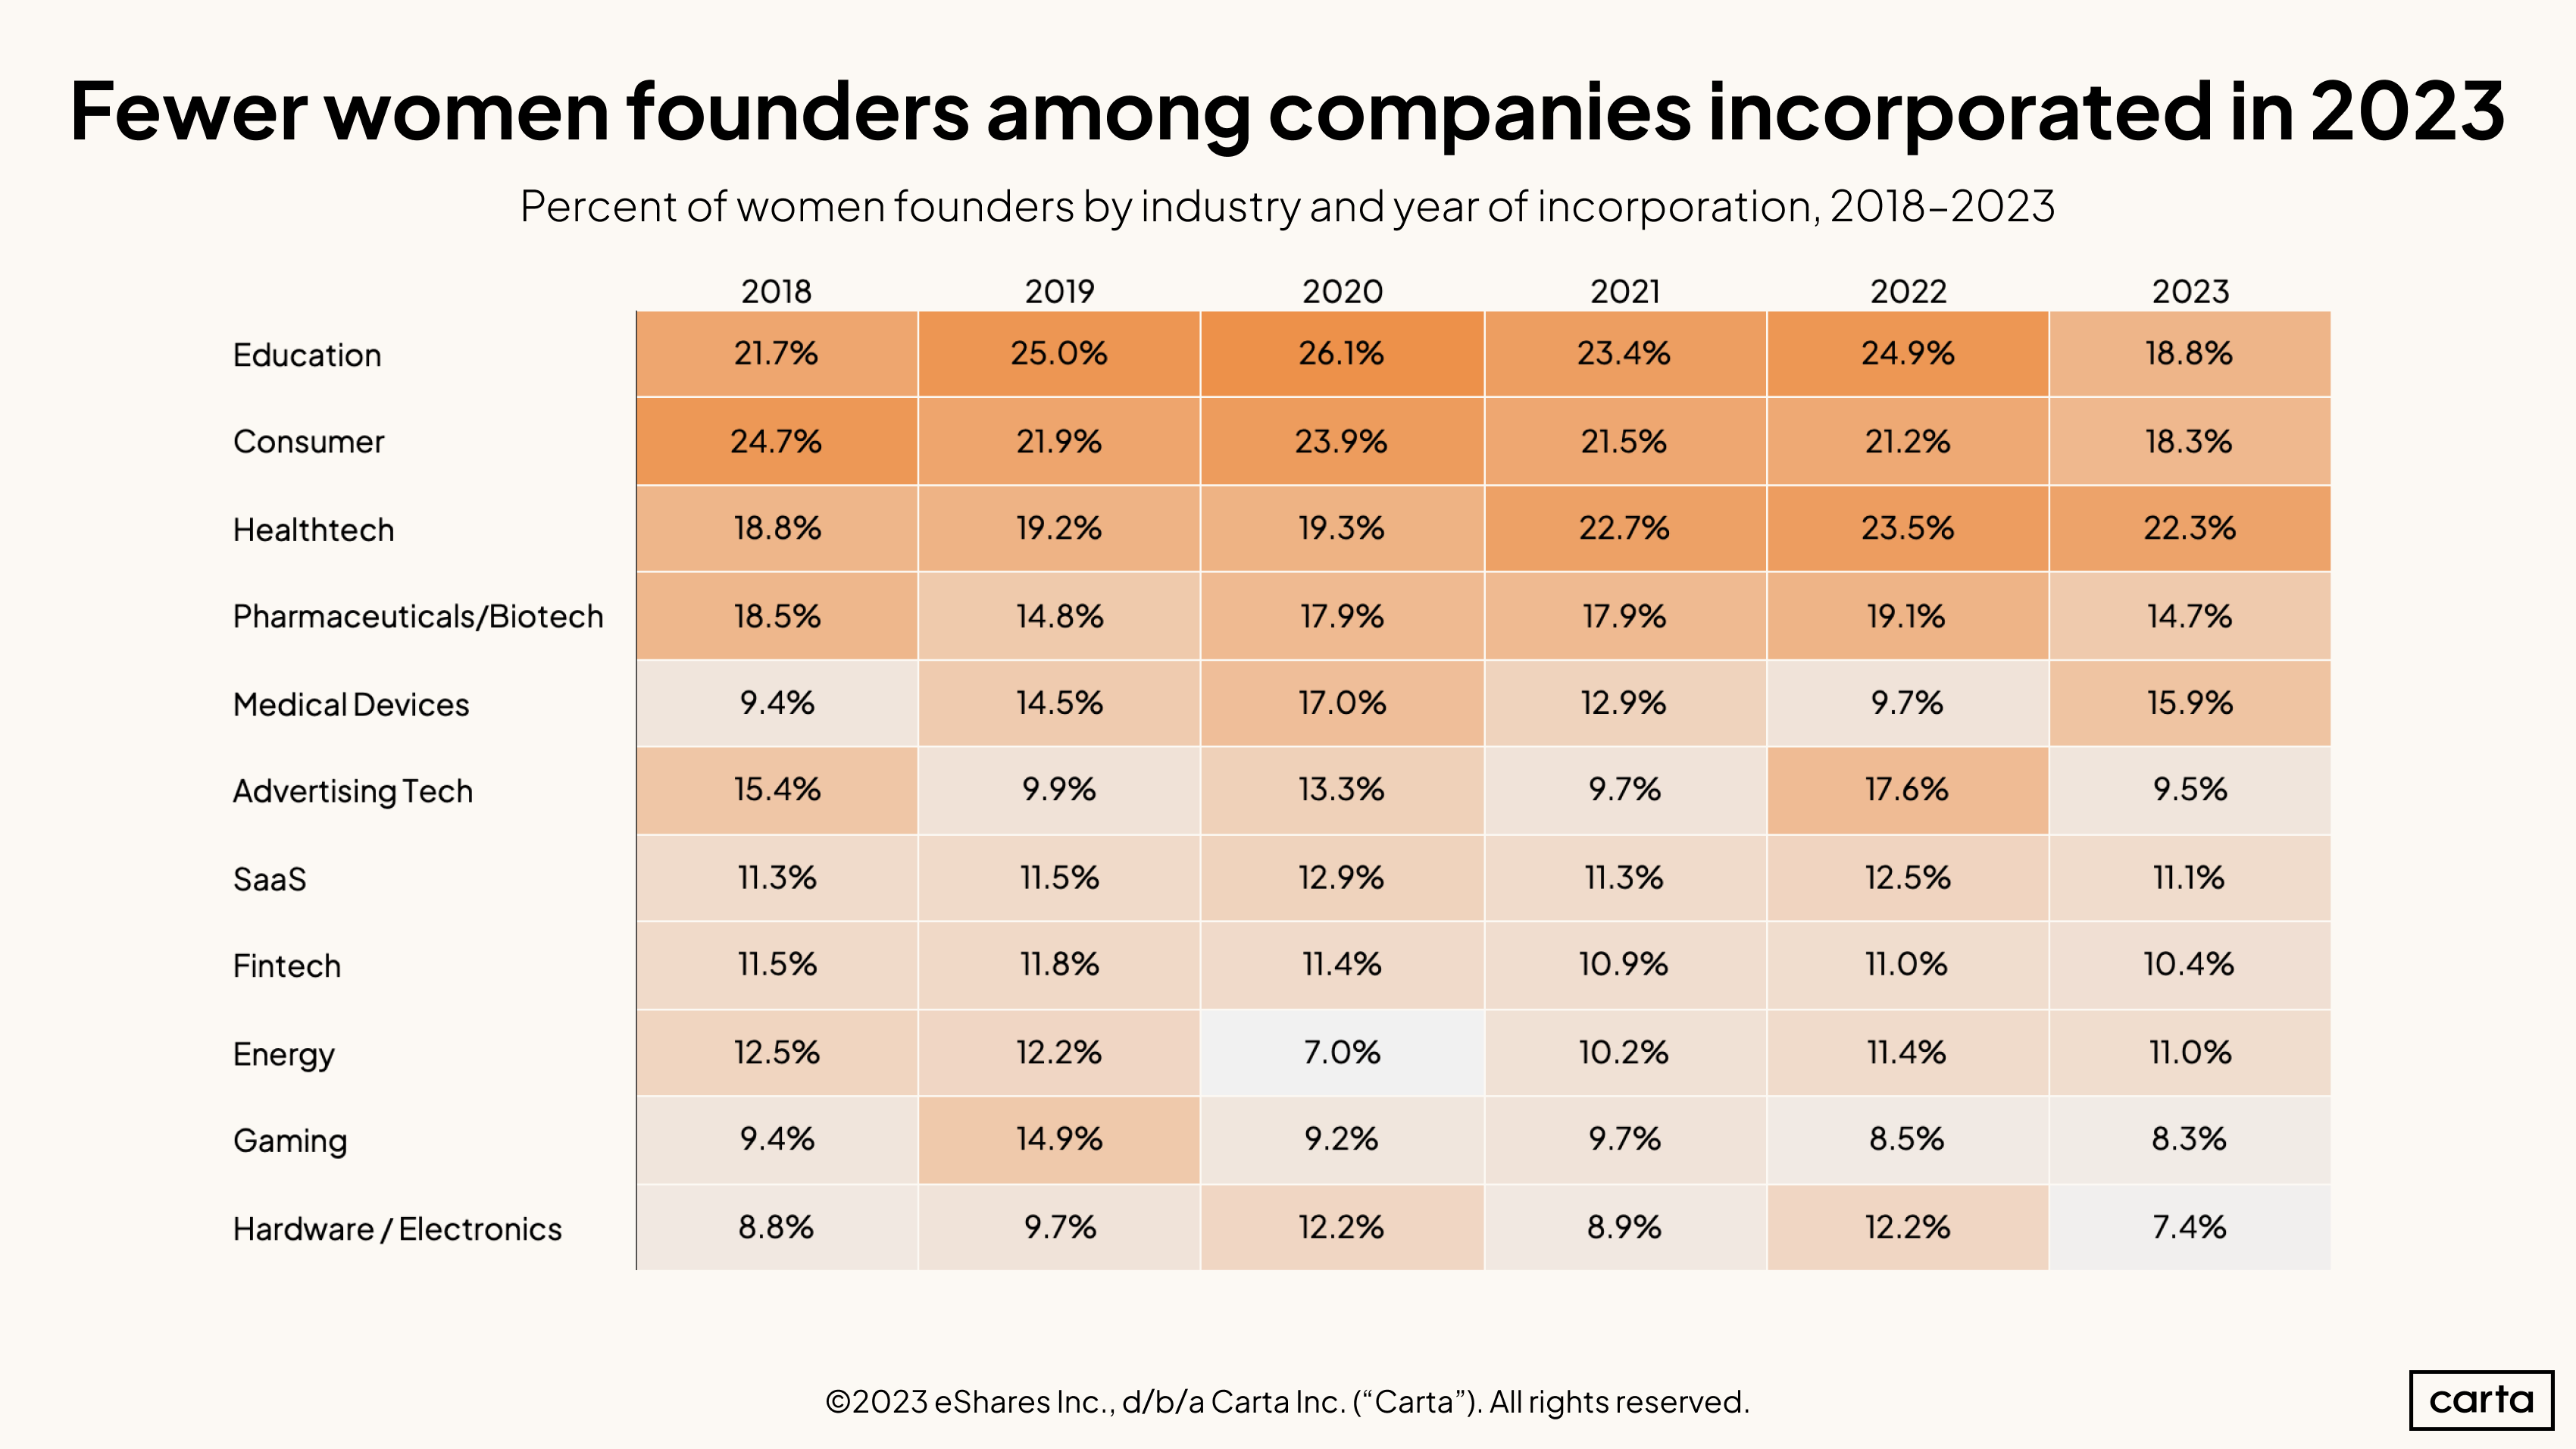
The decline in founders who are women persisted across almost all industry segments. Education and consumer companies, which previously had a stronger proportion of women than other verticals, saw their frequency of founders who are women decline to 18.8% and 18.3%, respectively.
In 2023, the sector with the greatest representation of women founders was healthtech, which had 22.3% women. Still, this was a slight decline from the previous year. The only vertical that had an increase in women founder representation was medical devices, which increased from 9.7% in 2022 to 15.9% this year.
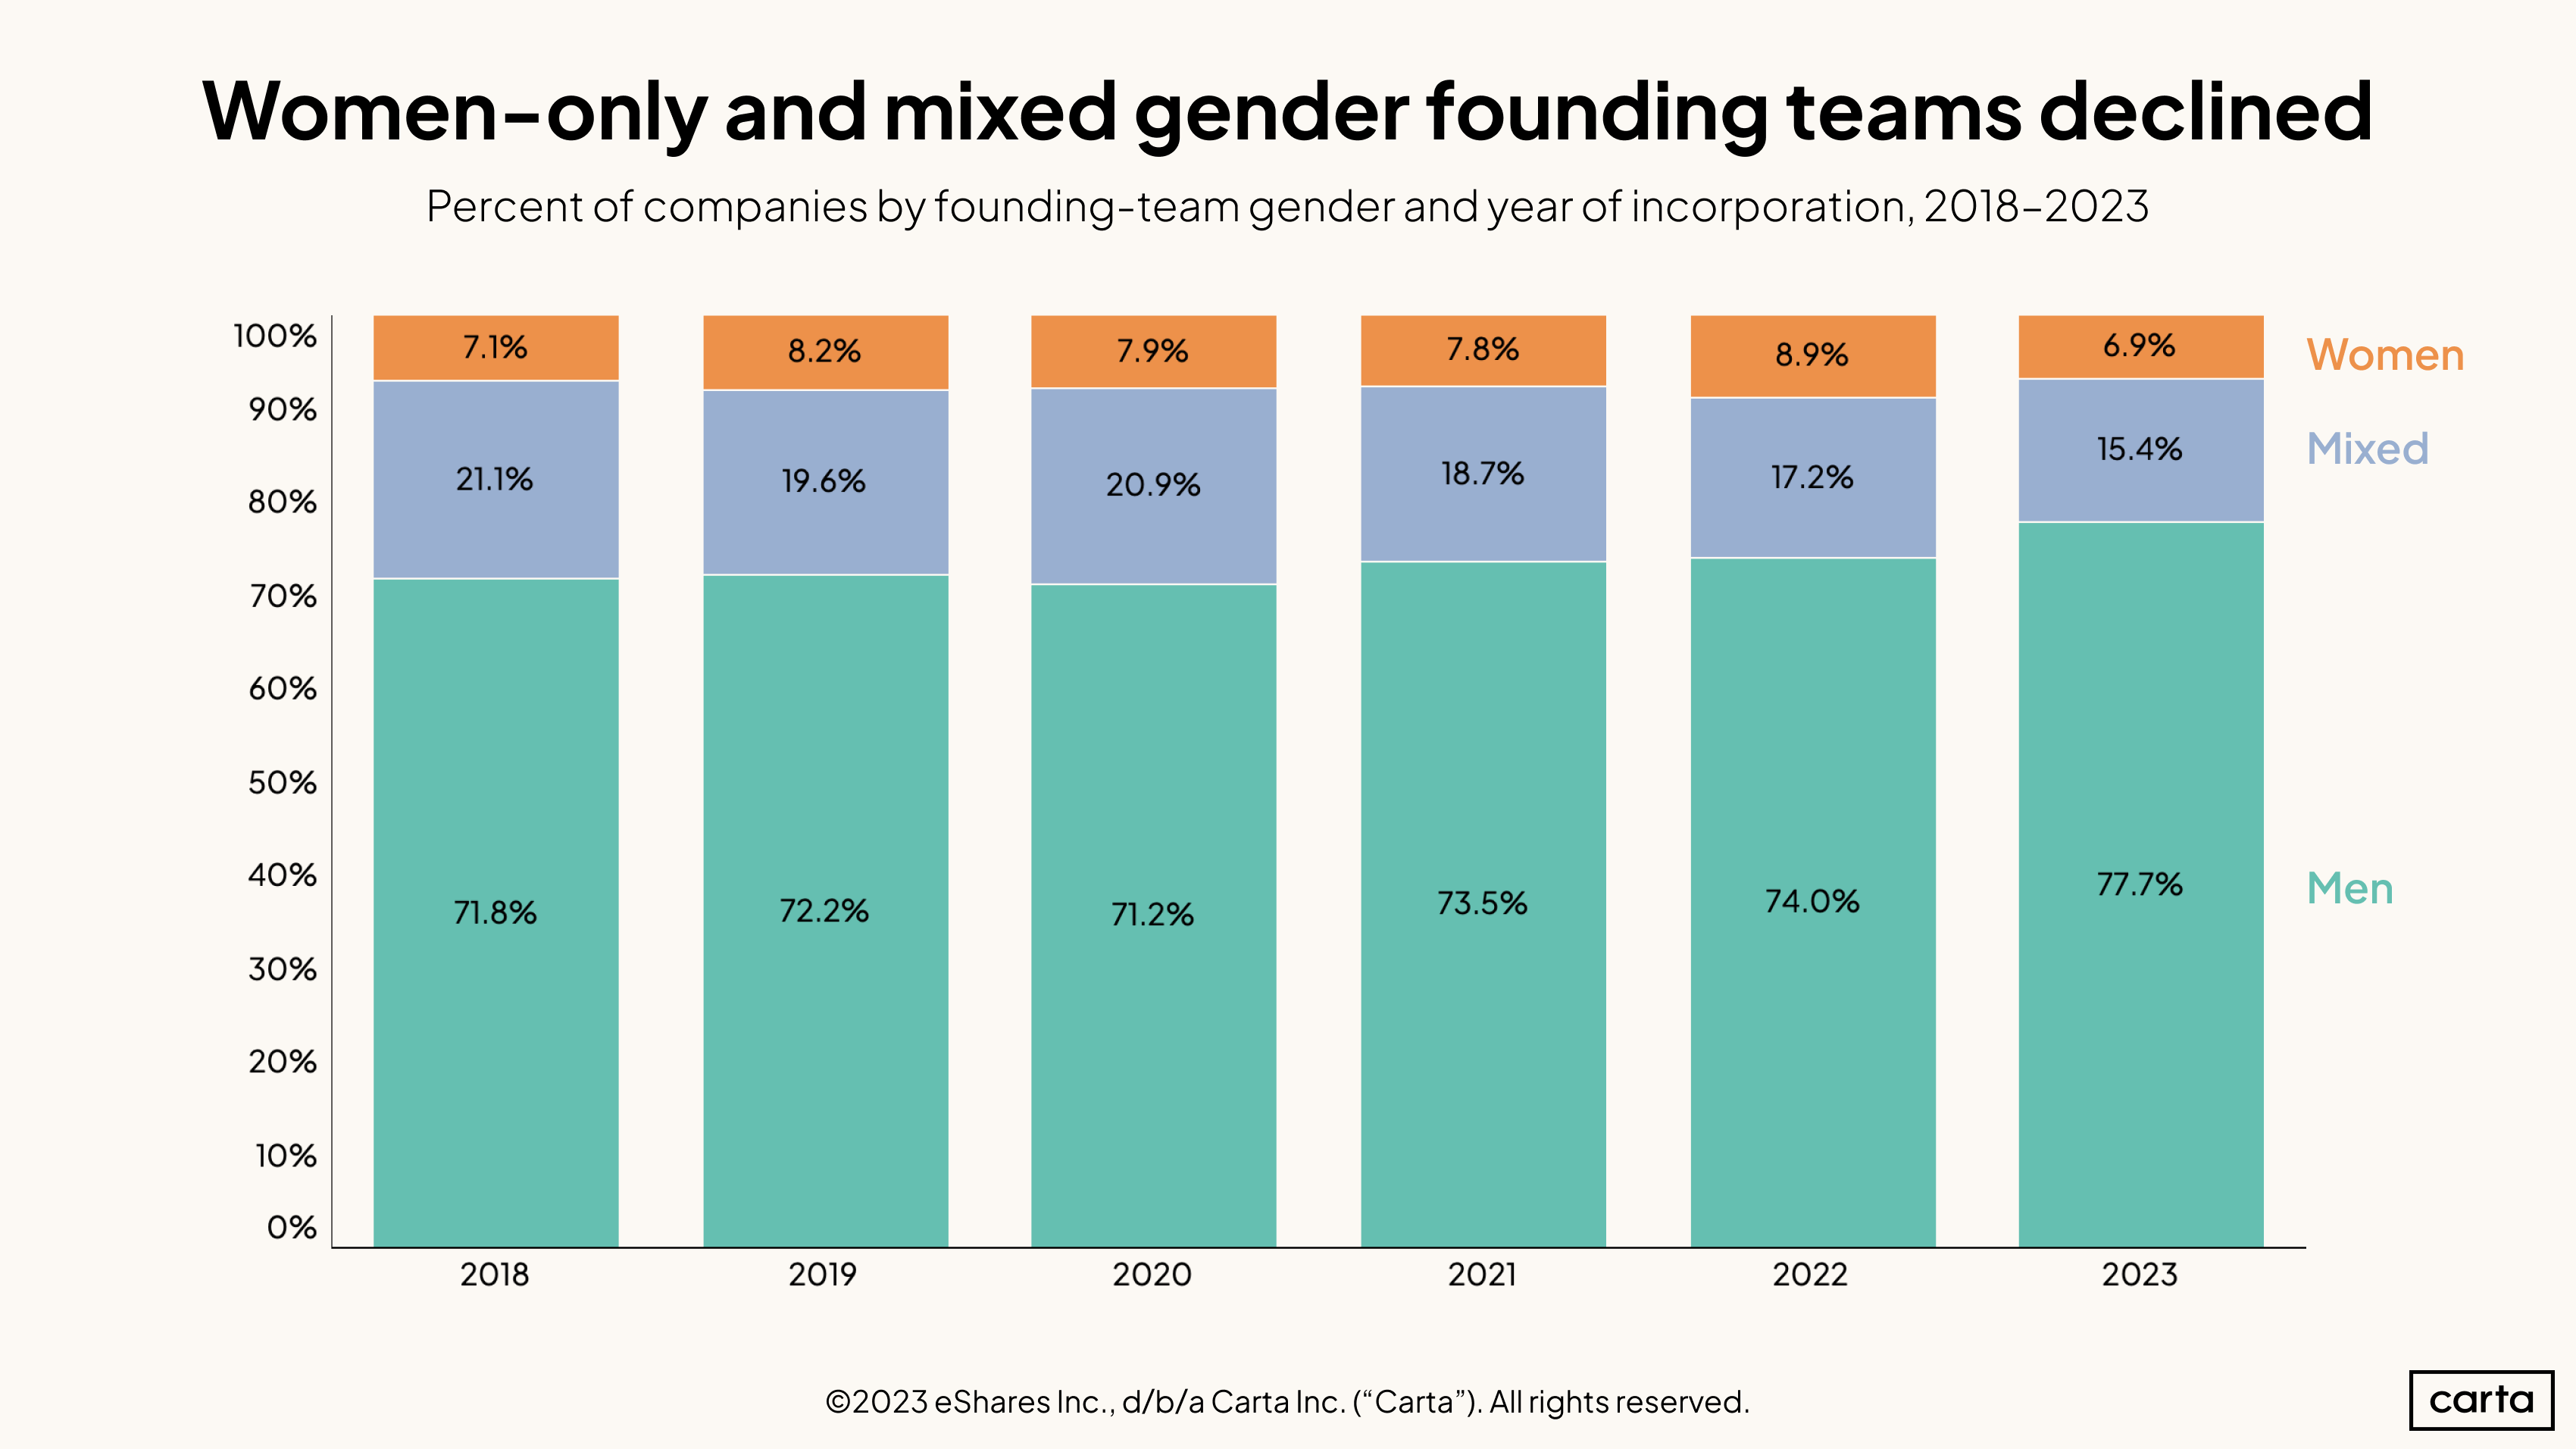
This year, 77.7% of new co-founder teams did not include a single woman or non-binary person. This is a higher rate of teams made up only of men than the previous five years. Of the remaining teams, 15.4% were mixed gender, and 6.9% were all-women teams.
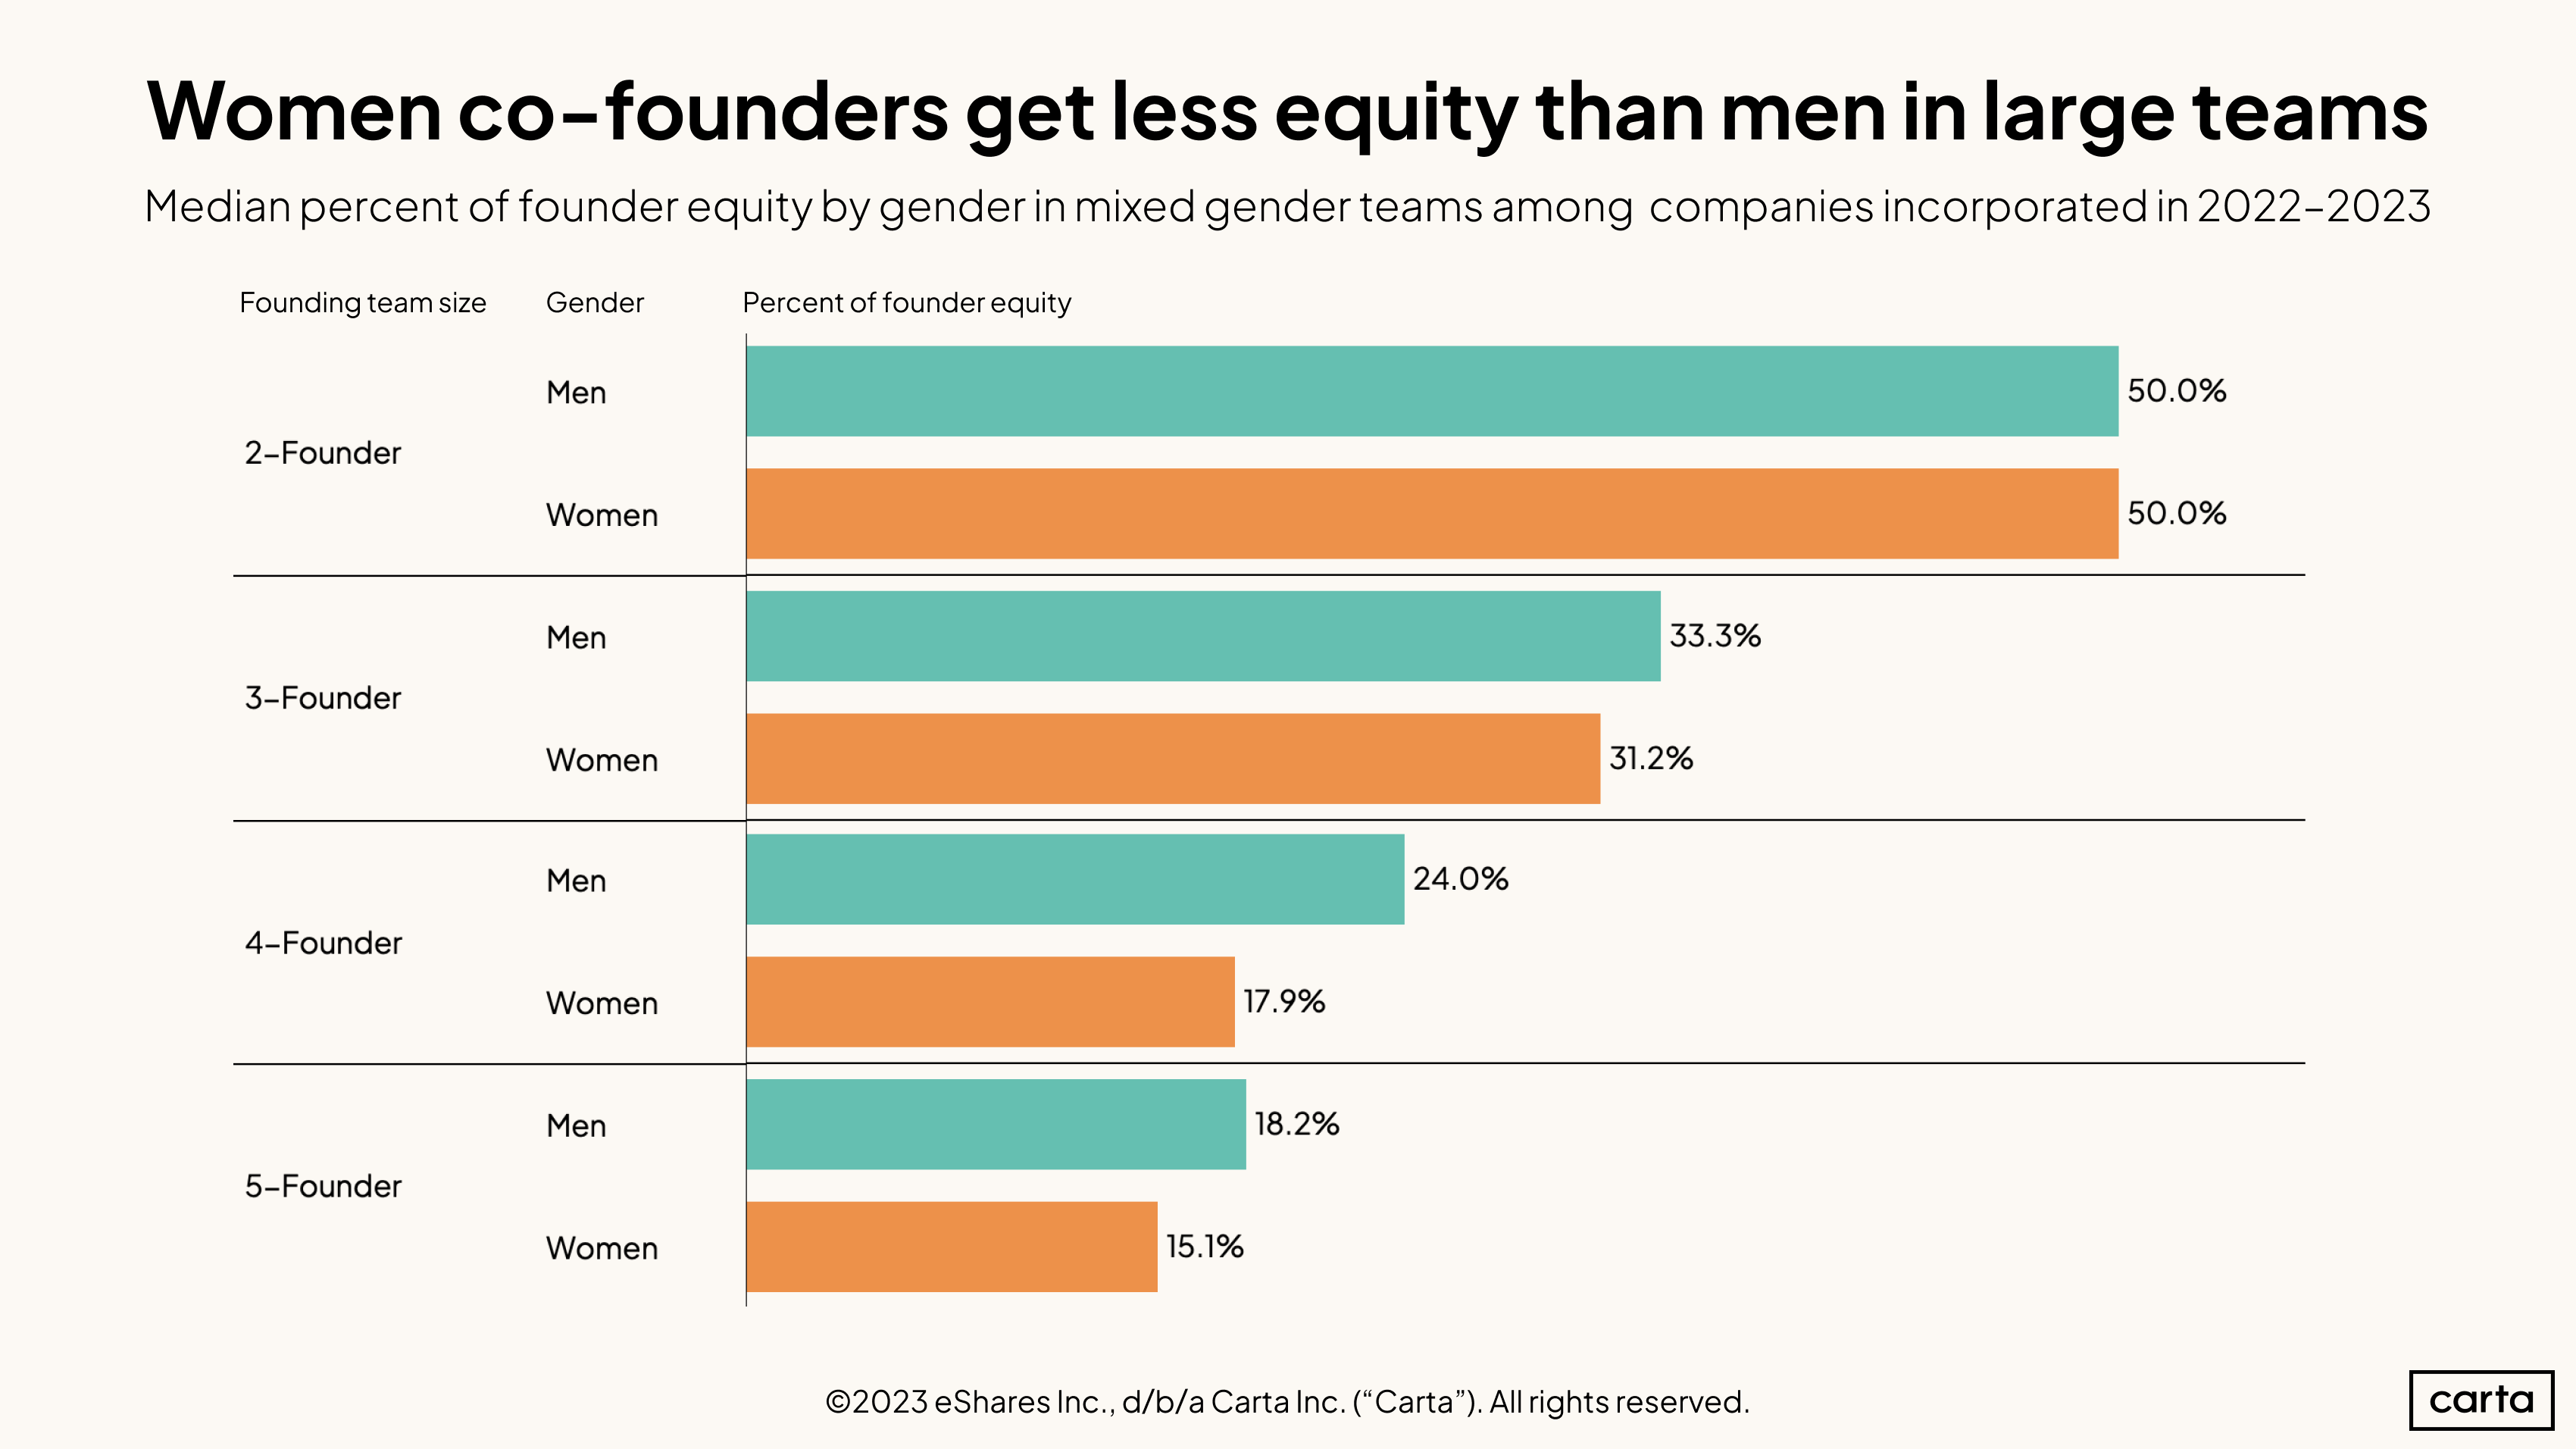
When women are part of founding teams, they often receive less equity than their co-founders who are men. The exception is teams of two, where founder equity is often split equally.
In teams with more than two founders, co-founders often prorated equity, rather than splitting equally among founders. In these cases, women tend to receive less equity than their counterparts who are men.
The makeup of larger teams is also noteworthy—there were very few four- and five-founder companies in the data set with more women than men.
Funding
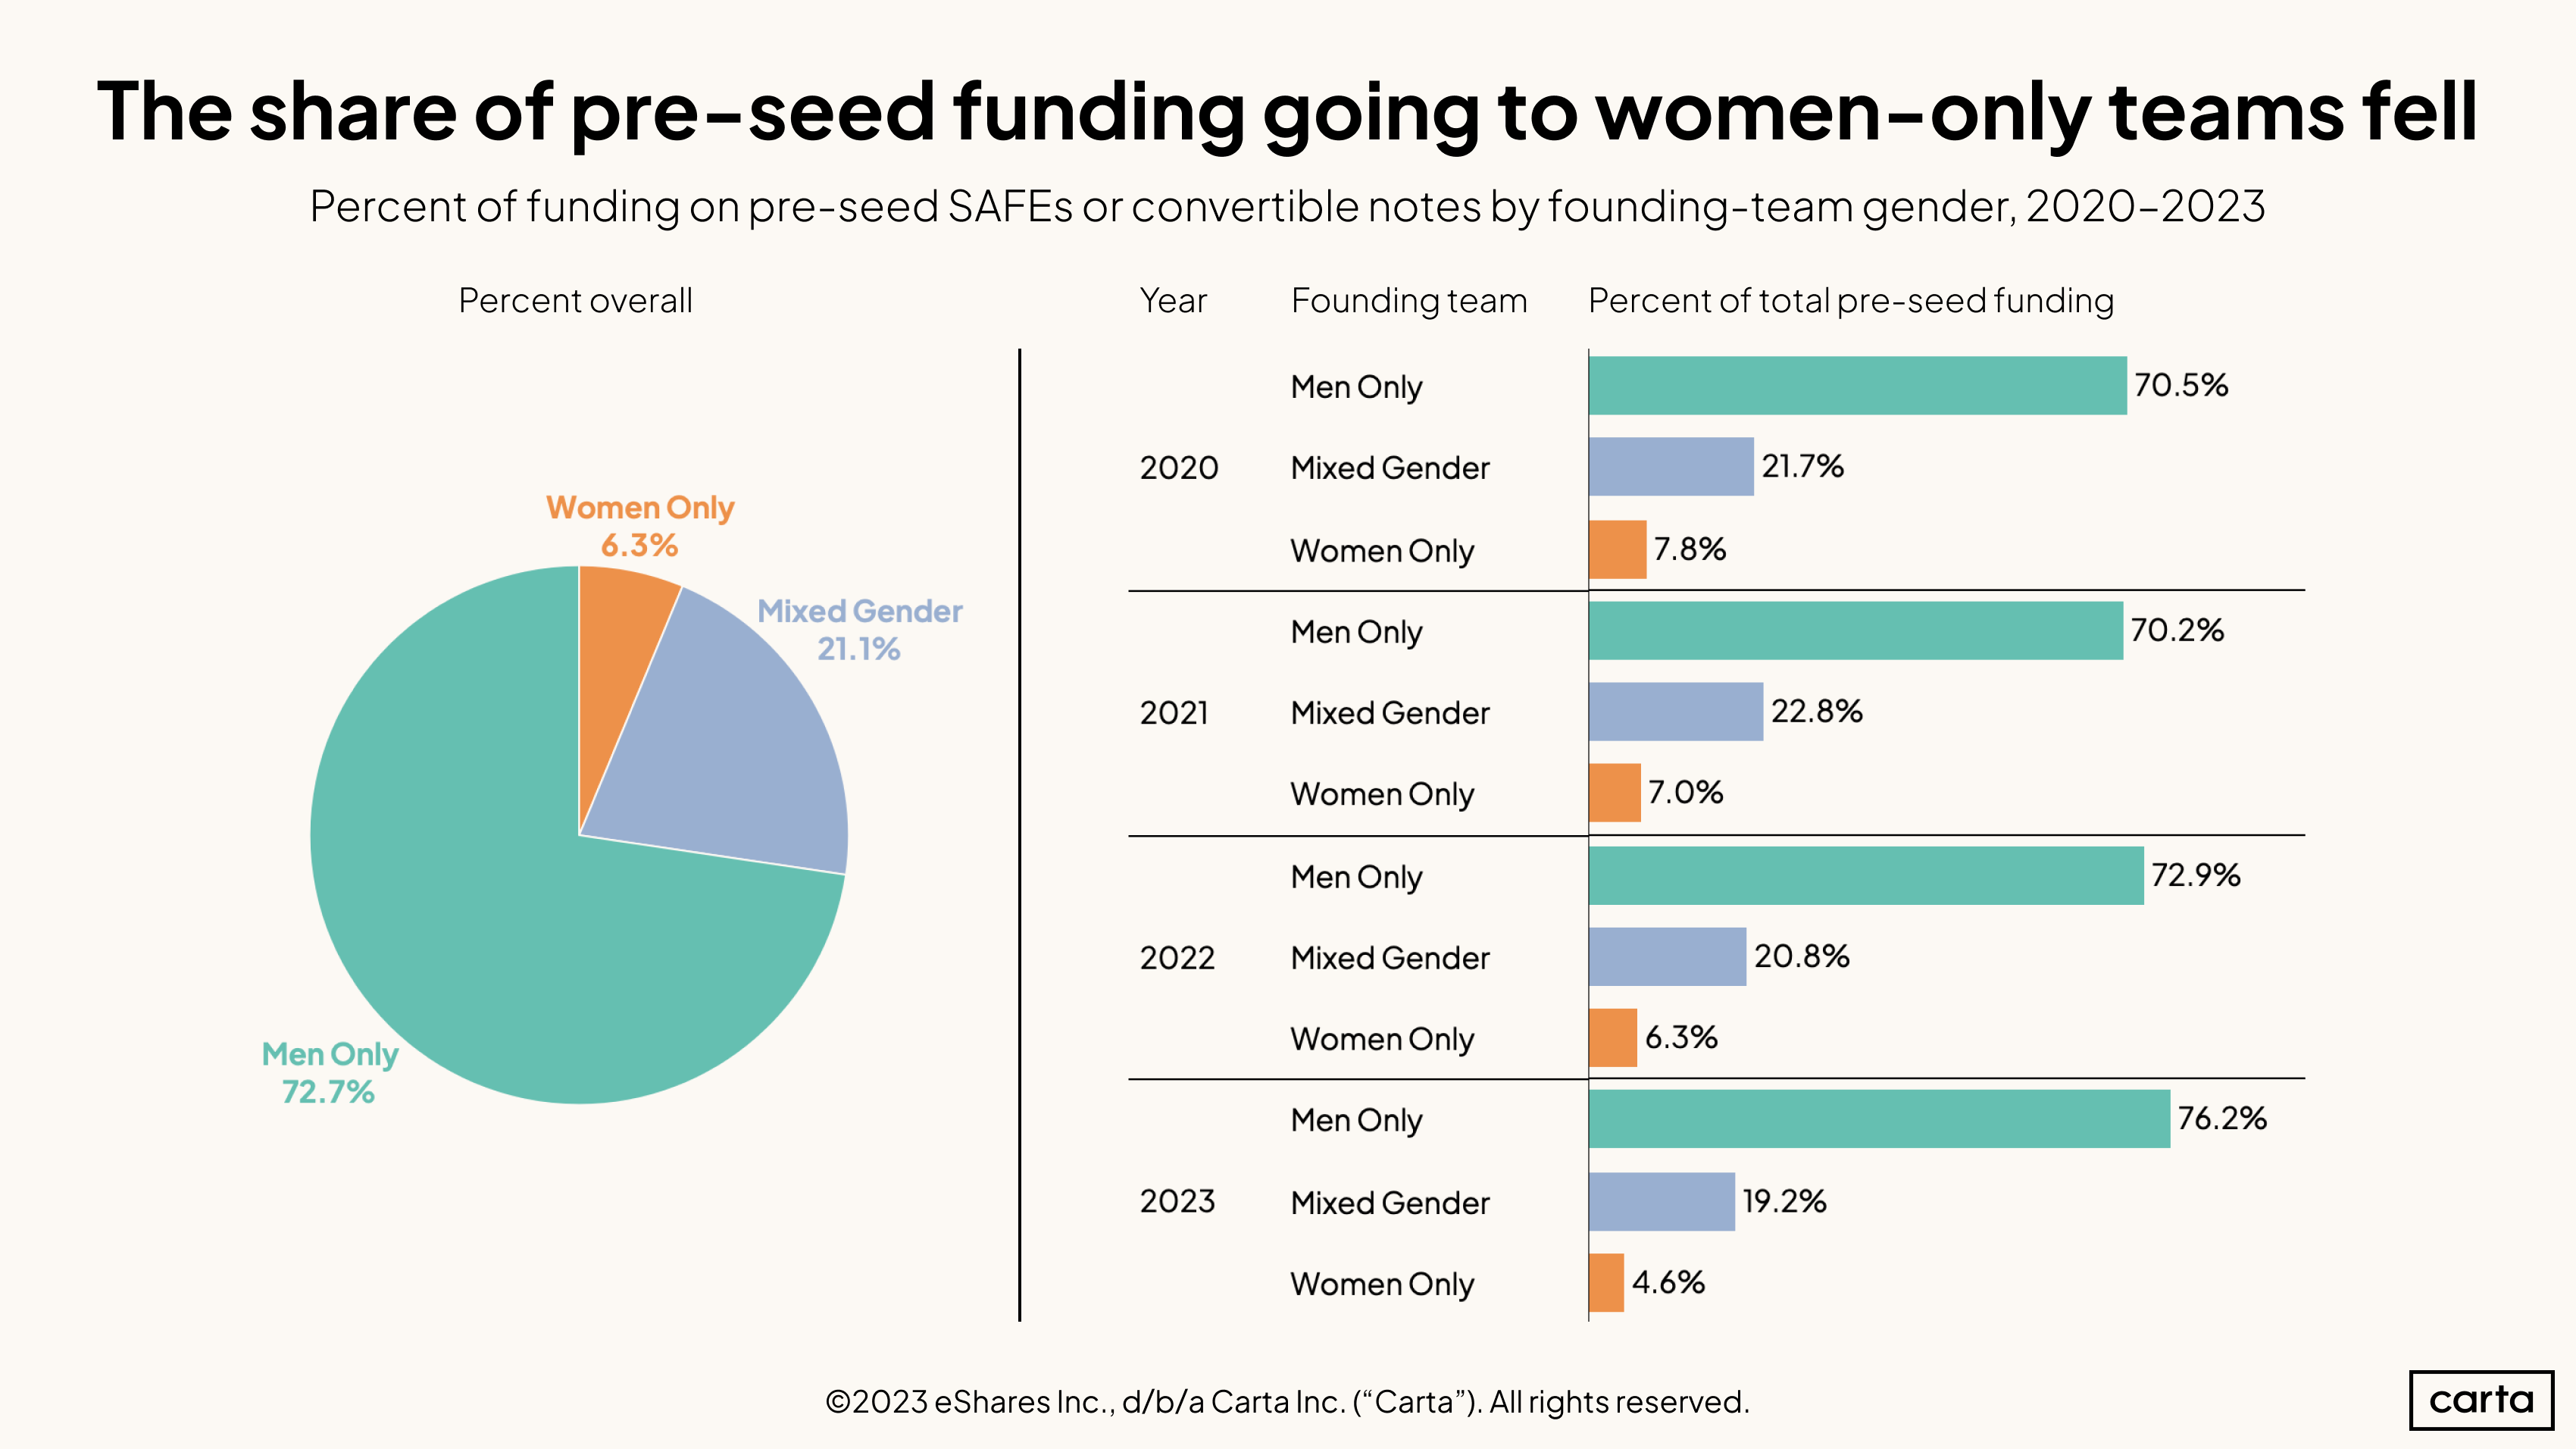
This year, 76.2% of the earliest-stage money—pre-seed SAFEs and convertible notes—went to men-only teams. This disparity is wider than in the previous three years.
The data here speaks to a dual barrier for early-stage founders who are women: They face difficulty joining co-founding teams—72.7% of founding teams at this stage did not include any women or non-binary individuals—and when women are present, the teams raise less money.
These disparities among the newest of companies speak to a continued pipeline problem in the startup ecosystem. The mid-stage and late-stage companies of tomorrow are being founded today, and they continue to be founded disproportionately by teams made up entirely of men.
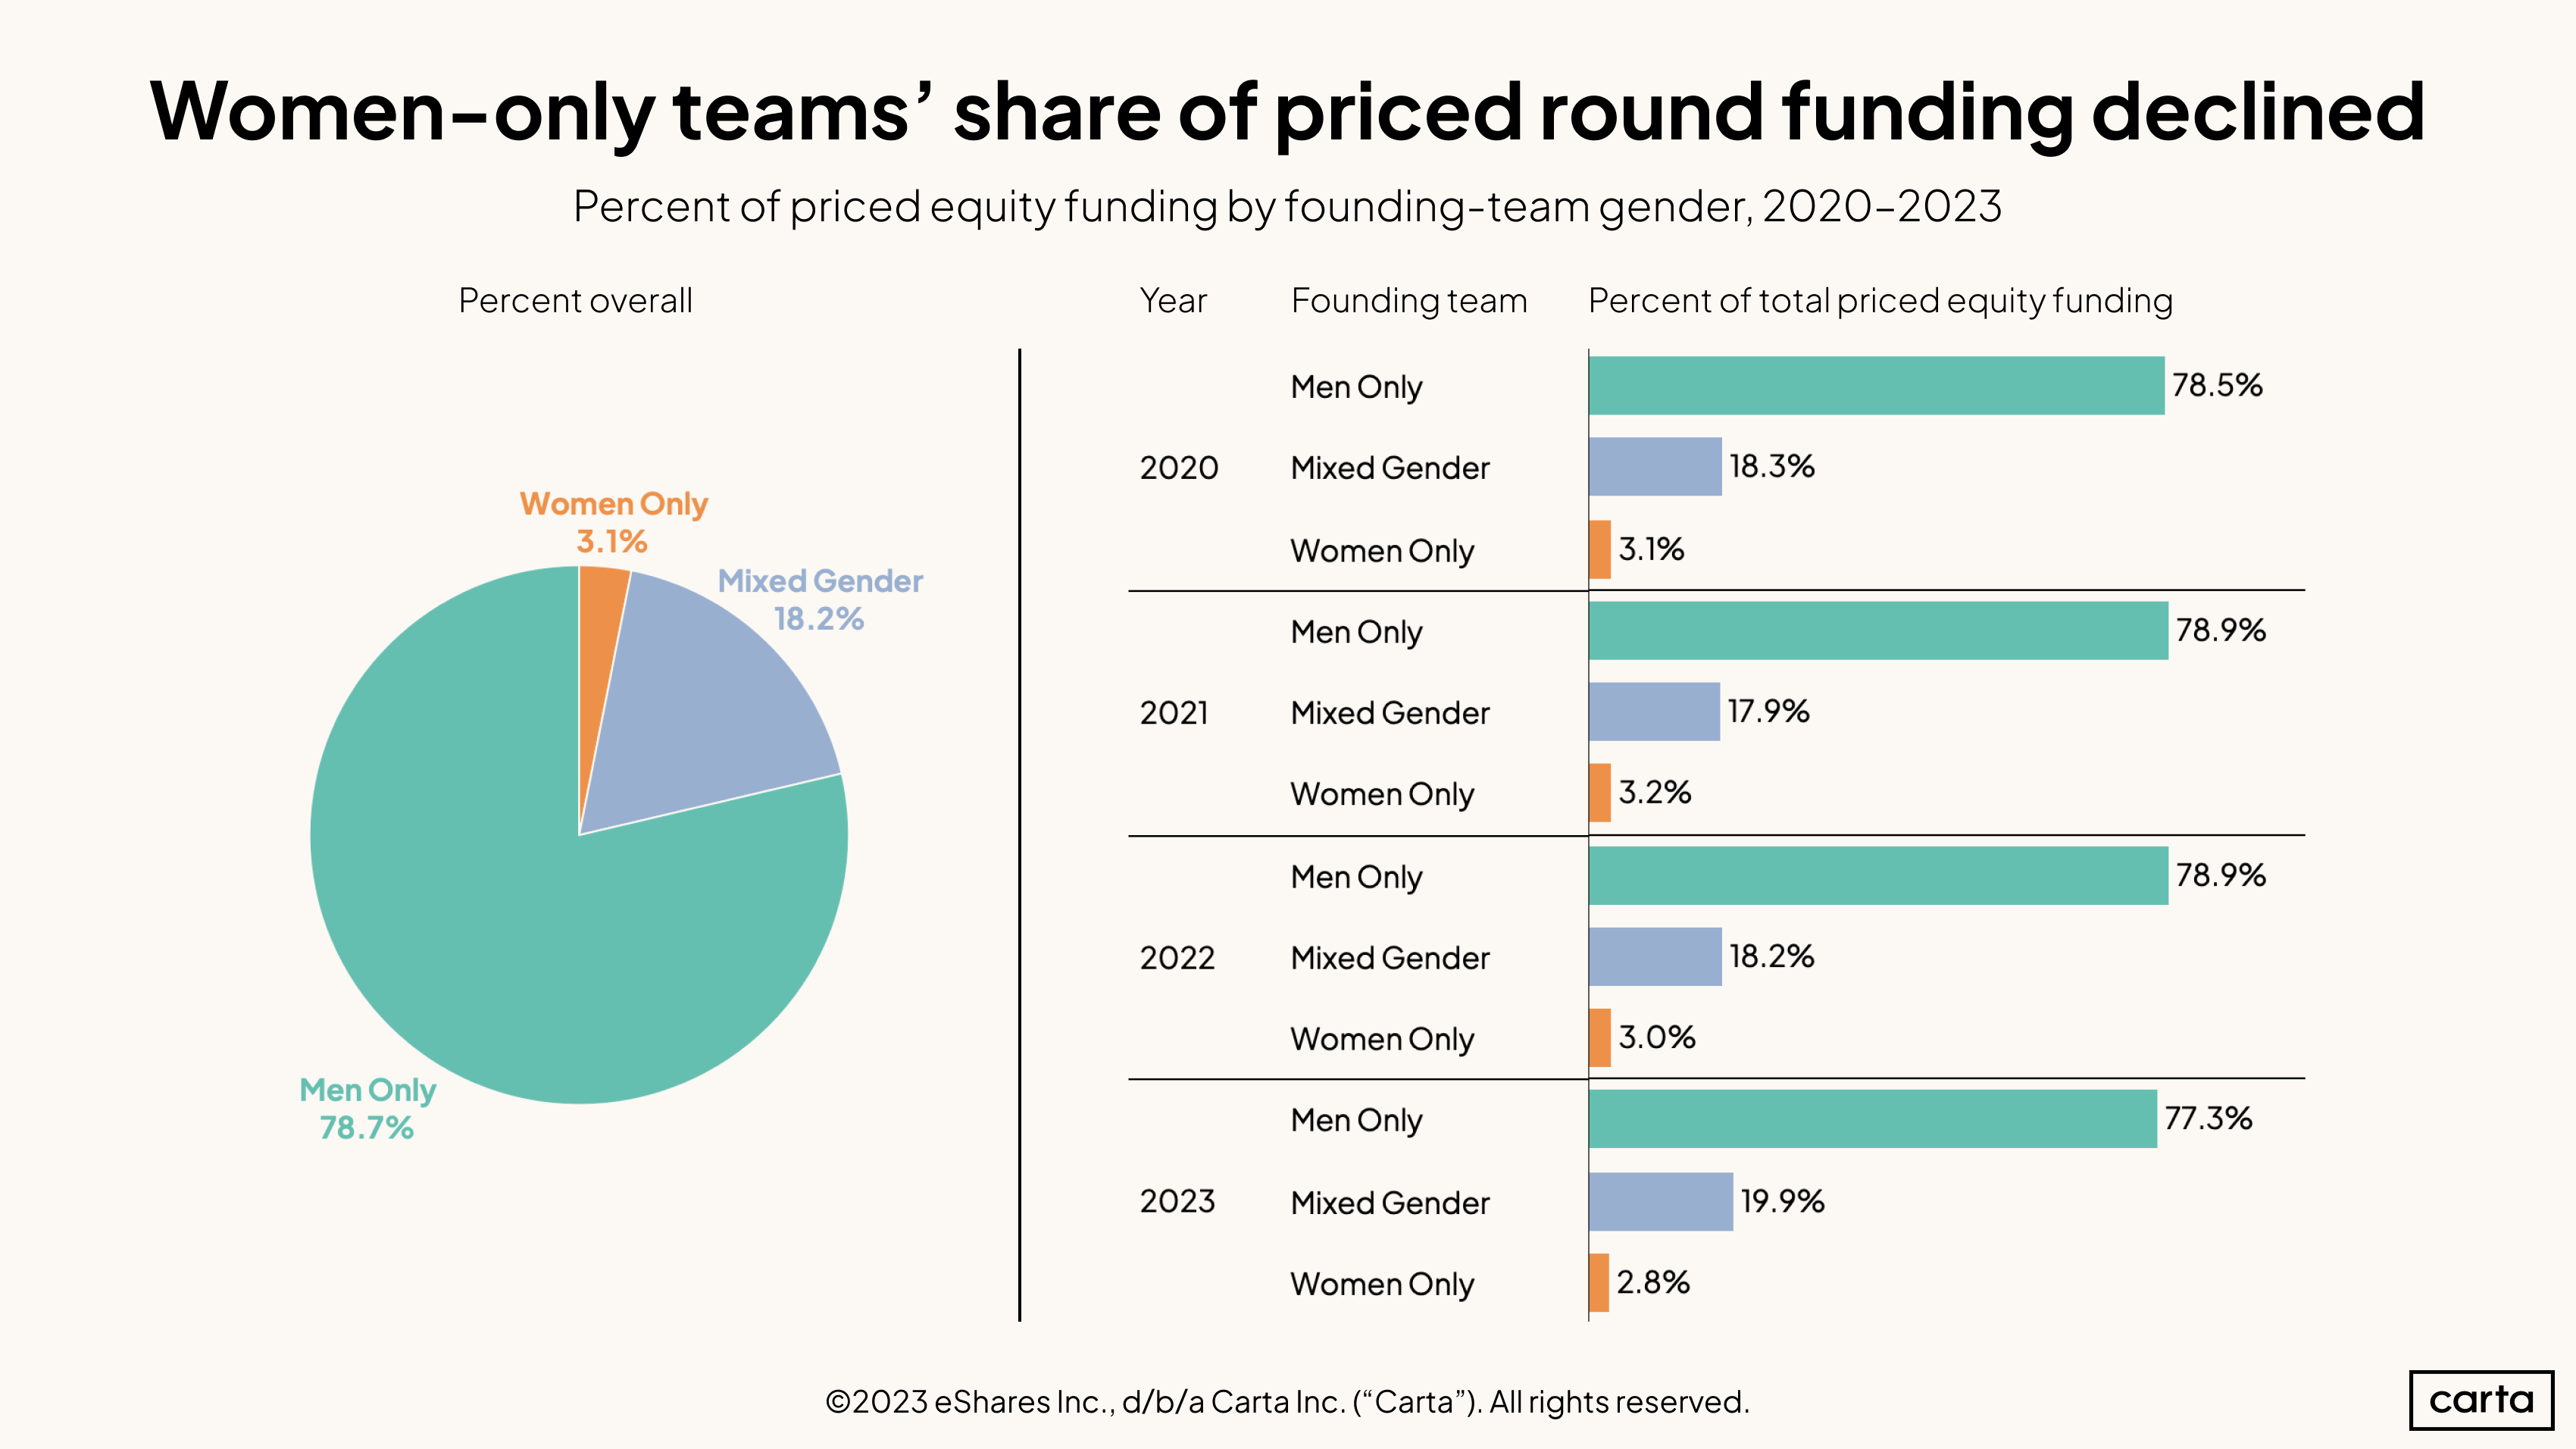
The same funding disparities affecting women-only teams in unpriced funding events remained in place for priced rounds.
Women-only teams raised only 2.8% of all venture funding this year, the first time in the past four years that figure has fallen below 3%. Mixed-gender funding teams saw a slight uptick in their proportion of funding raised, going from 18.2% last year to 19.9% in 2023.
Still, over the past four years combined, 78.7% of startups raising priced rounds did not have any women or non-binary individuals on their founding teams.
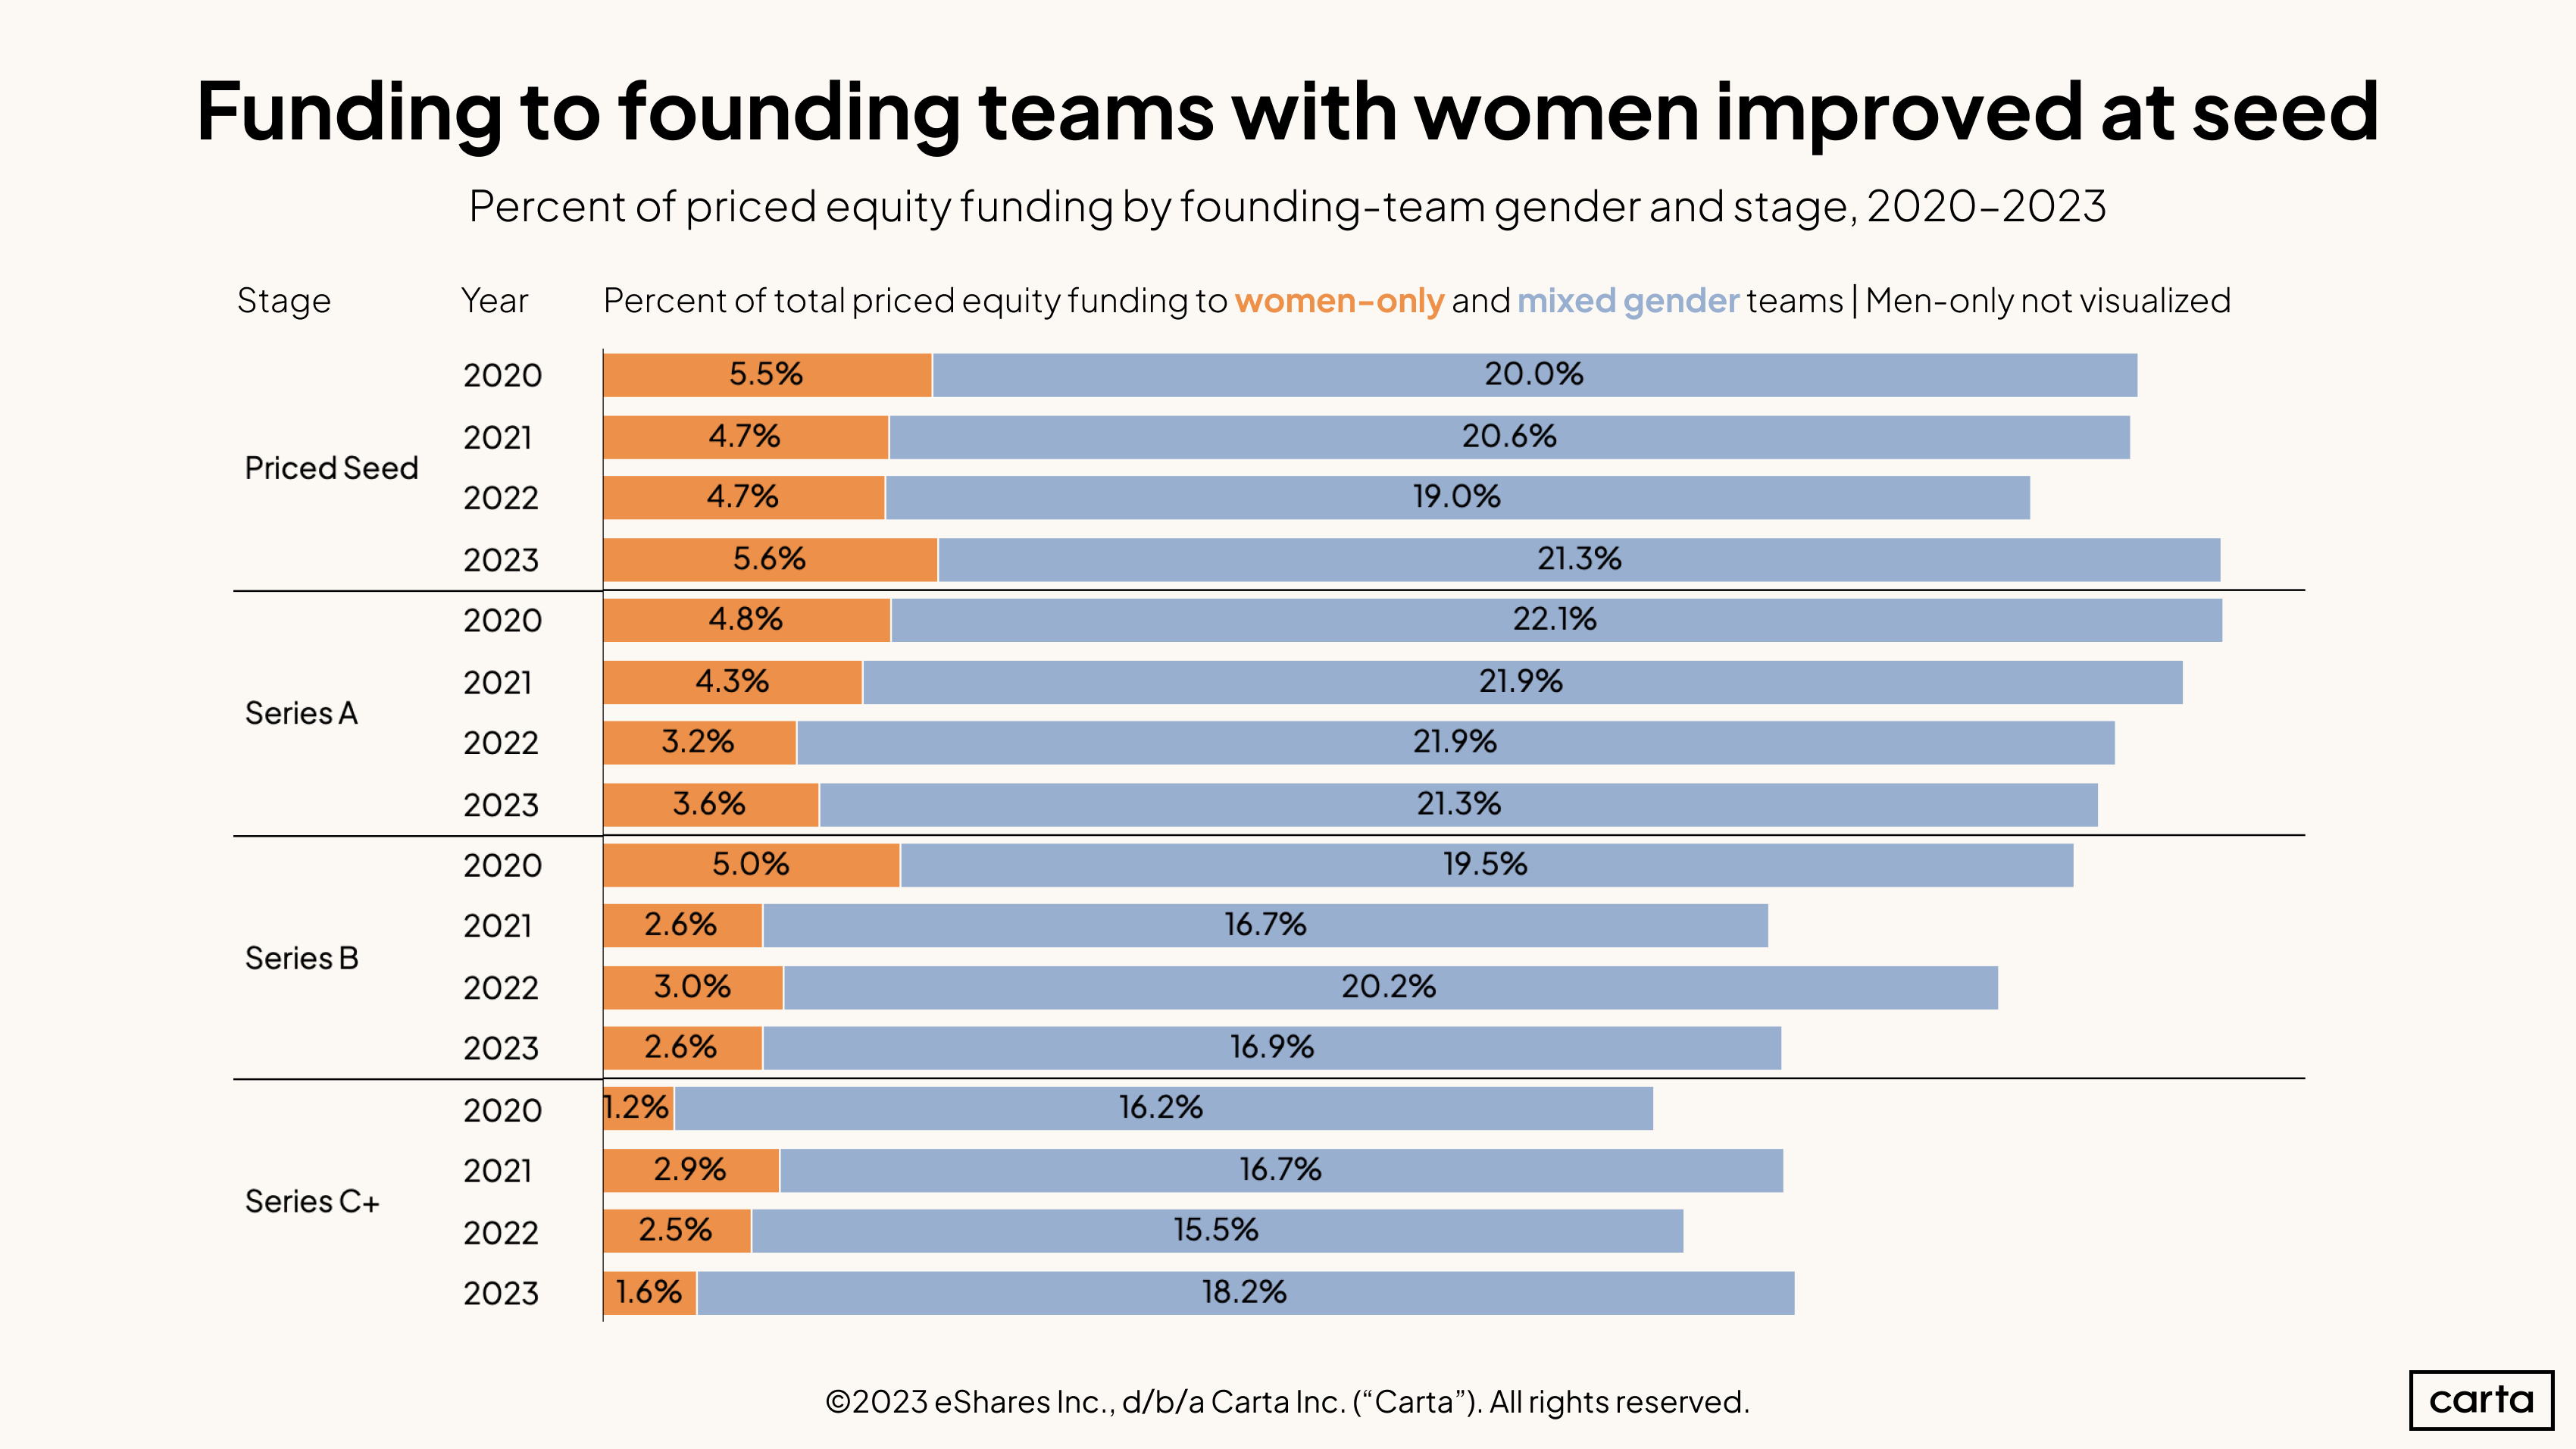
Although women-only founding teams raised a smaller percentage of capital in 2023 than in 2022 across all priced funding rounds, there were two areas of improvement. For priced seed rounds and Series C+ rounds, the percentage of funding raised by women-led and mixed-gender teams improved this year.
Still, 73.1% of funding for priced seed rounds went to founding teams made up entirely of men.
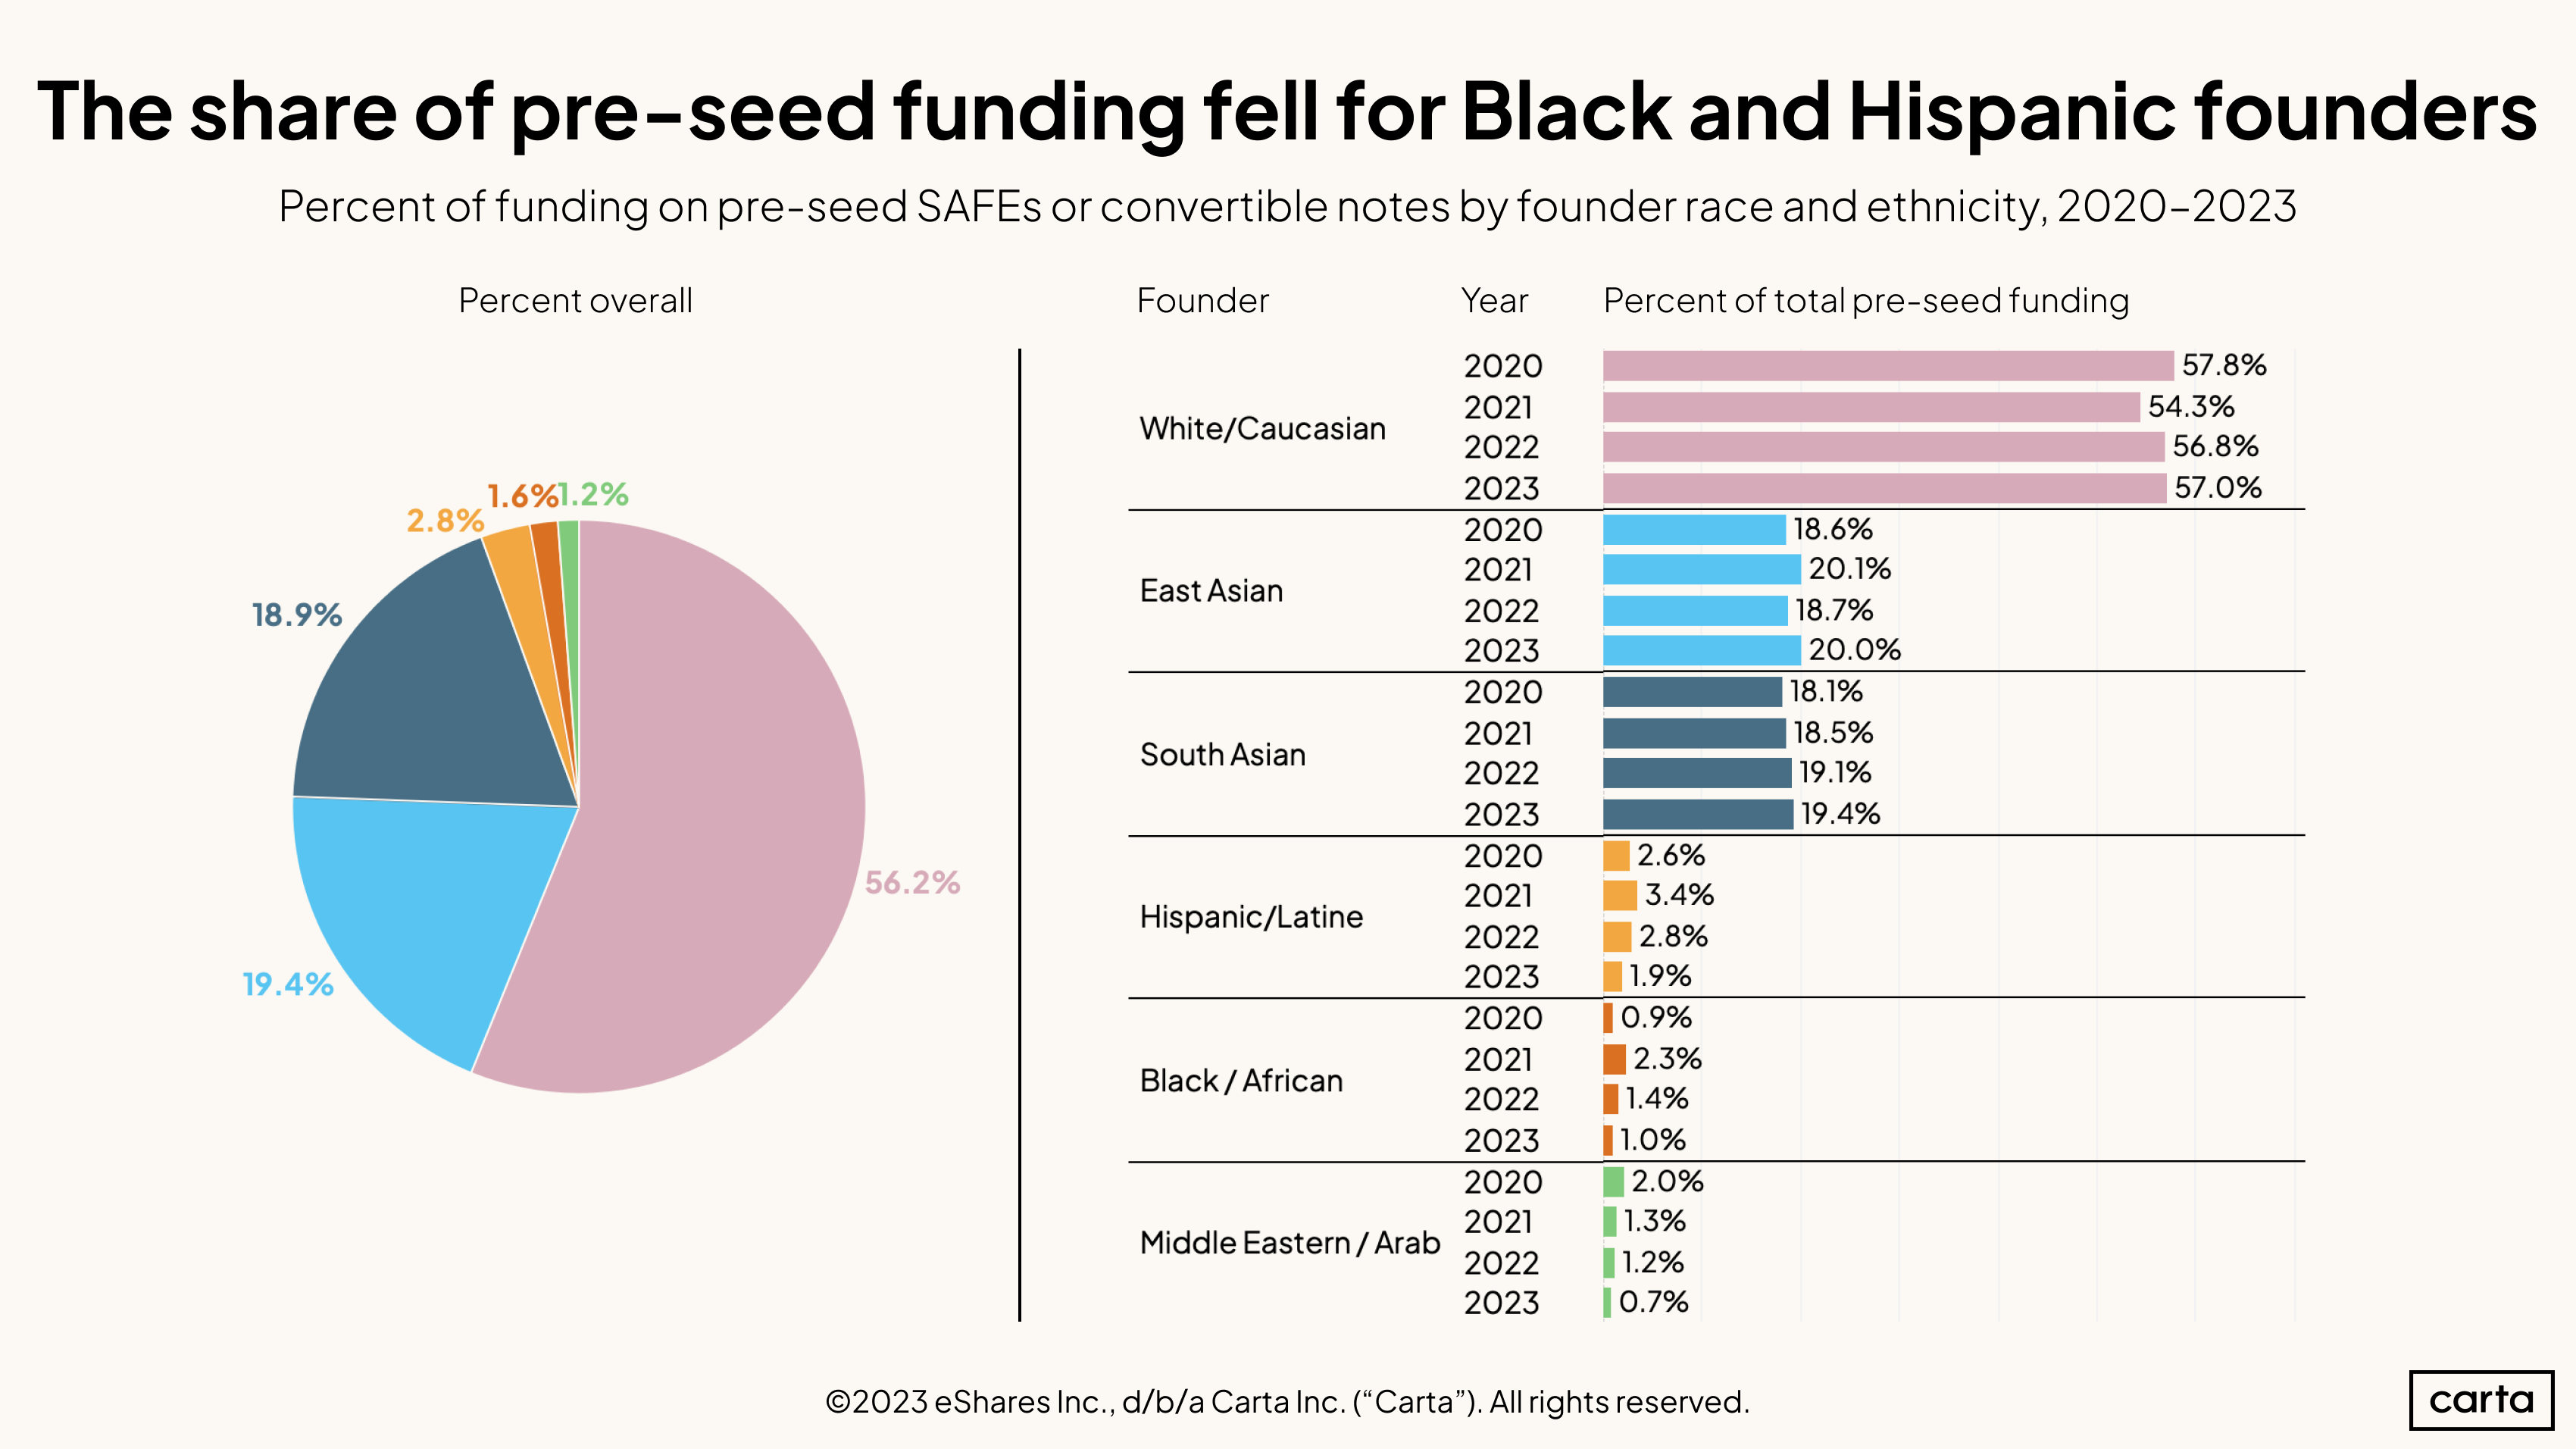
The percentage of pre-seed SAFE and convertible note funding that went to Black, Hispanic, and Middle Eastern/Arab founders fell this year. Black founders, while making up 1.6% of the founders in this group, received 1% of funding. While Hispanic founders made up 2.8% of founders raising pre-seed money, only 1.9% of funding went to them. Middle Eastern/Arab founders made up 1.2% of founders and received 0.7% of funding.
Looking at the U.S. overall, 18% of the labor force is Hispanic and 13% is Black, meaning these groups are underrepresented among founders. And those founders who are Black and Hispanic received less funding than their proportion in the data set.
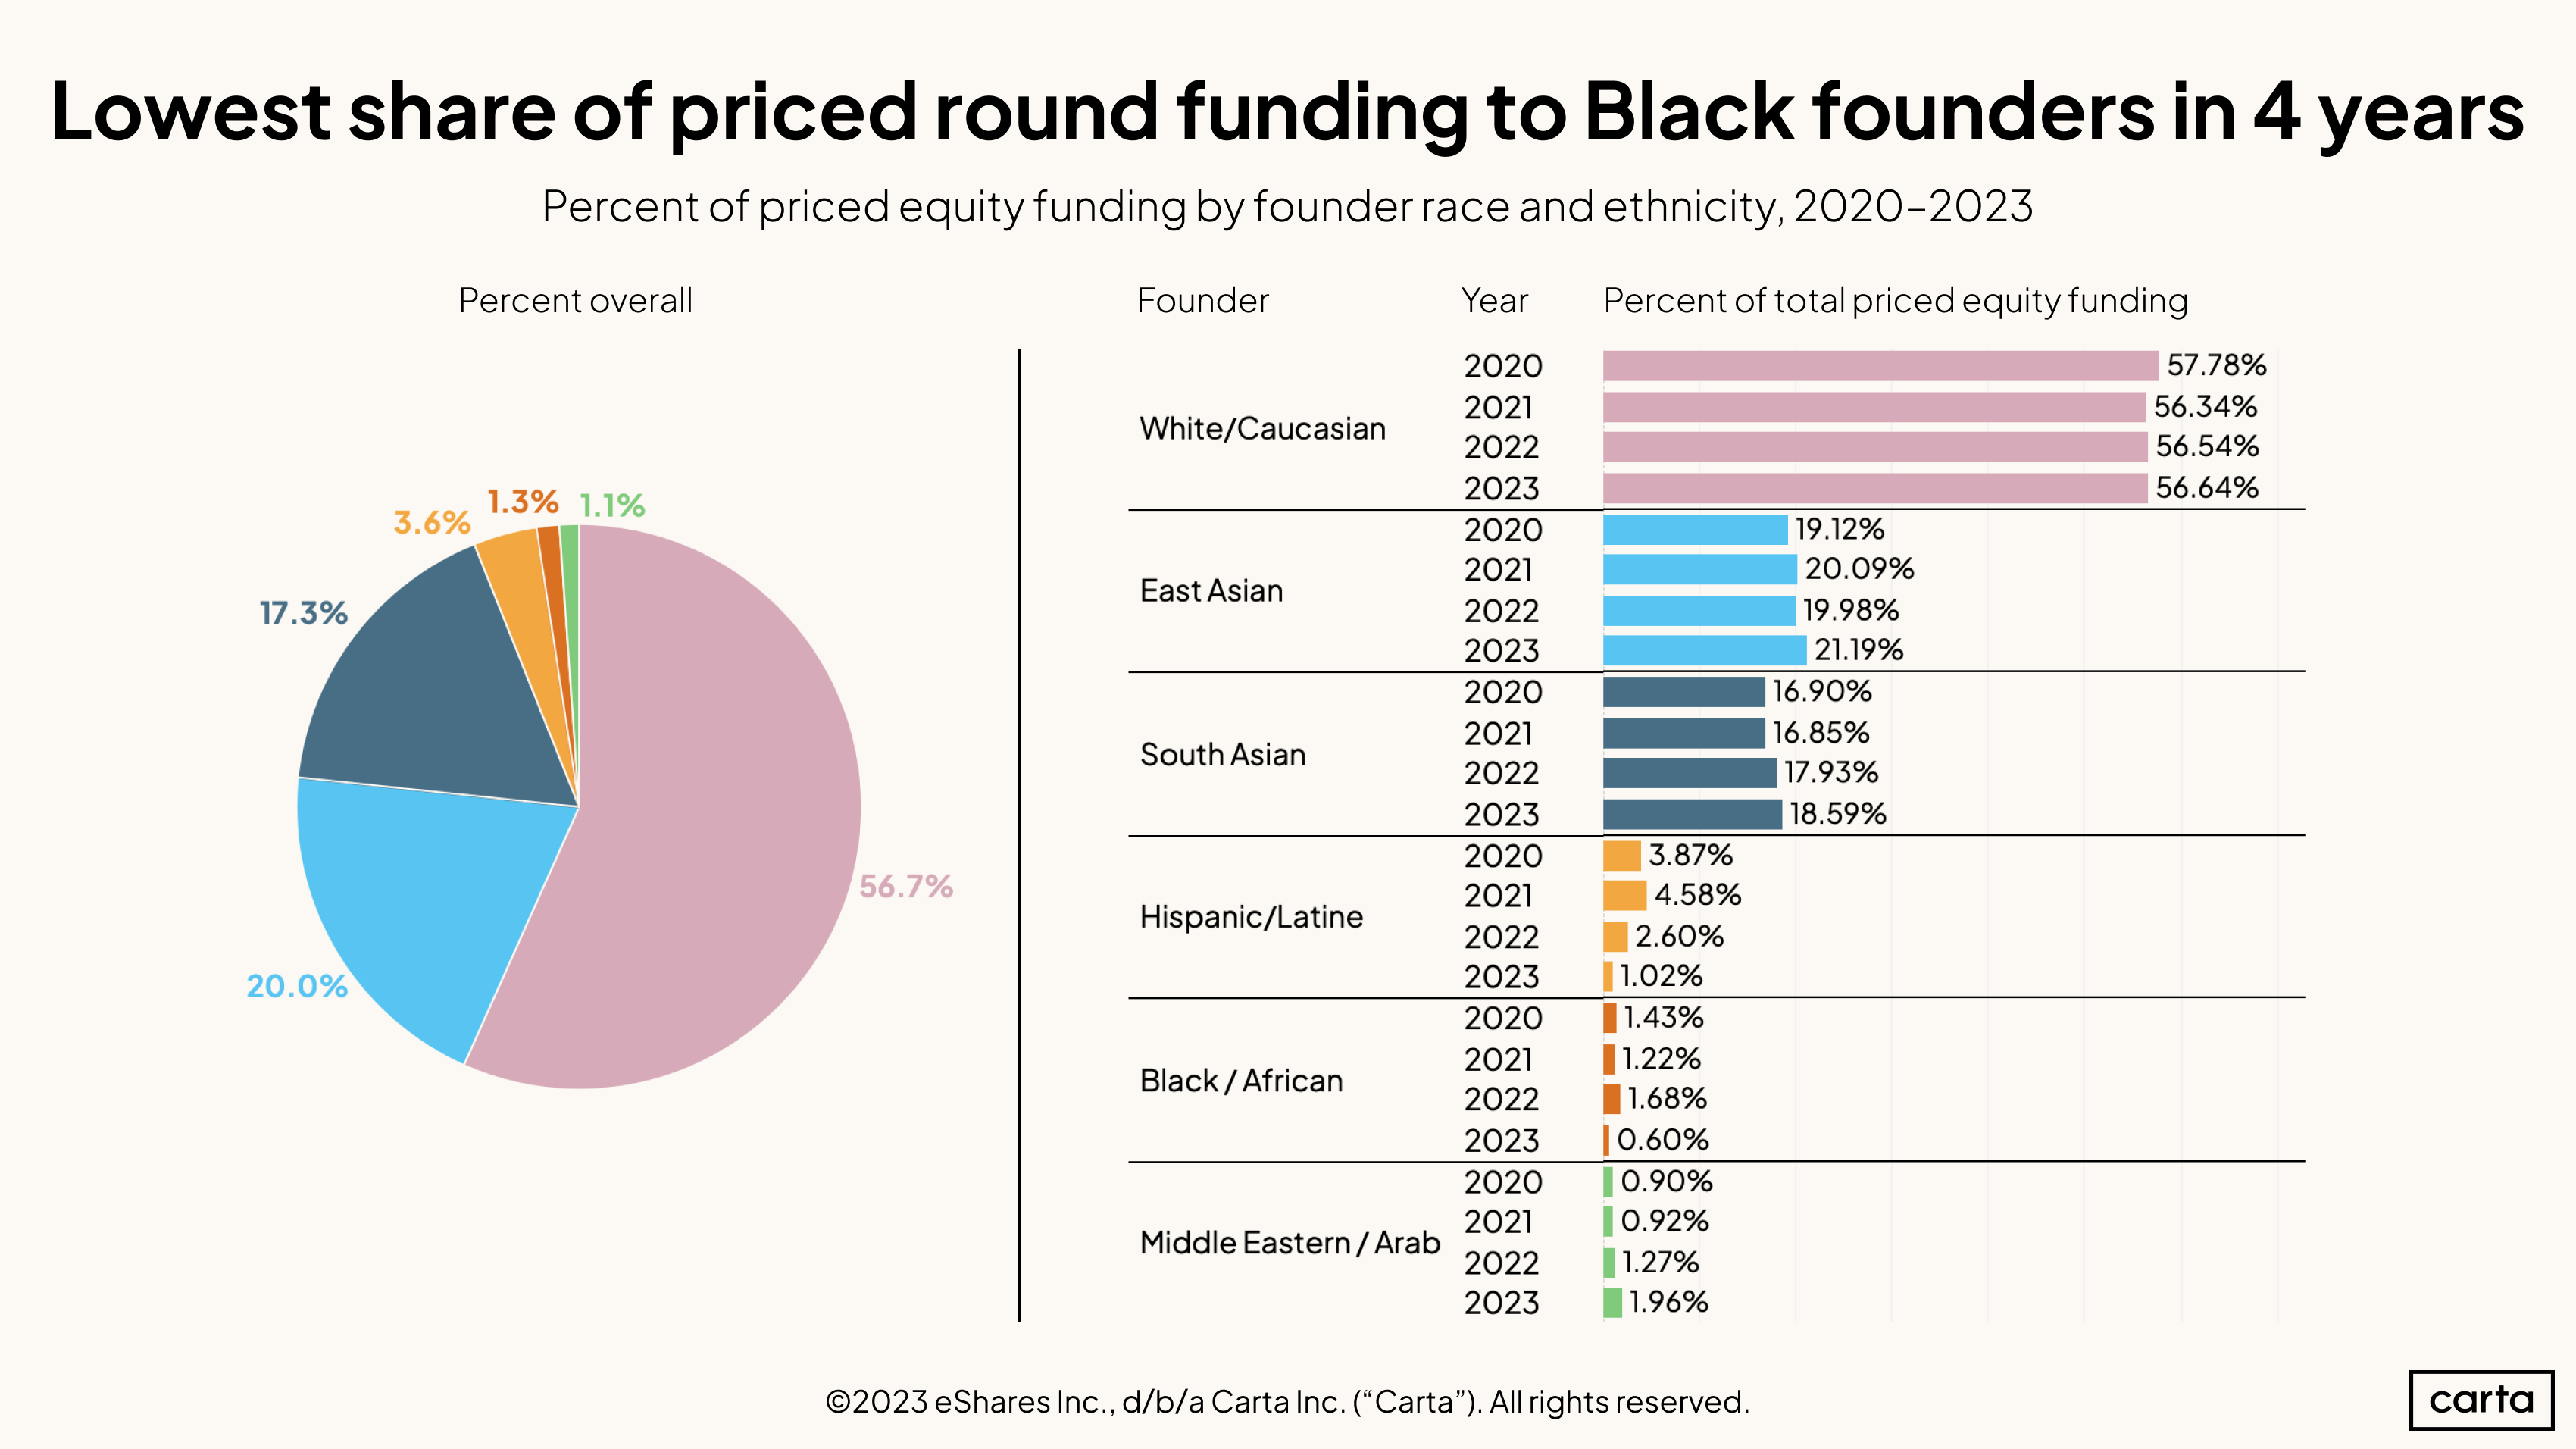
Only 0.6% of all dollars invested through priced venture rounds in 2023 went to companies with a Black founder, compared to 1.68% in 2022. Hispanic and Latine founders experienced a similar decline, with just 1.02% of VC raised in 2023 compared to 2.6% in 2022 and nearly 4.6% in 2021.
As is the case with pre-seed funding, both Black founders and Hispanic and Latine founders have historically received a far smaller share of venture capital than one might expect based on U.S. labor force demographics. The chronic underfunding of Black, Hispanic, and Latine founders only got worse in 2023.
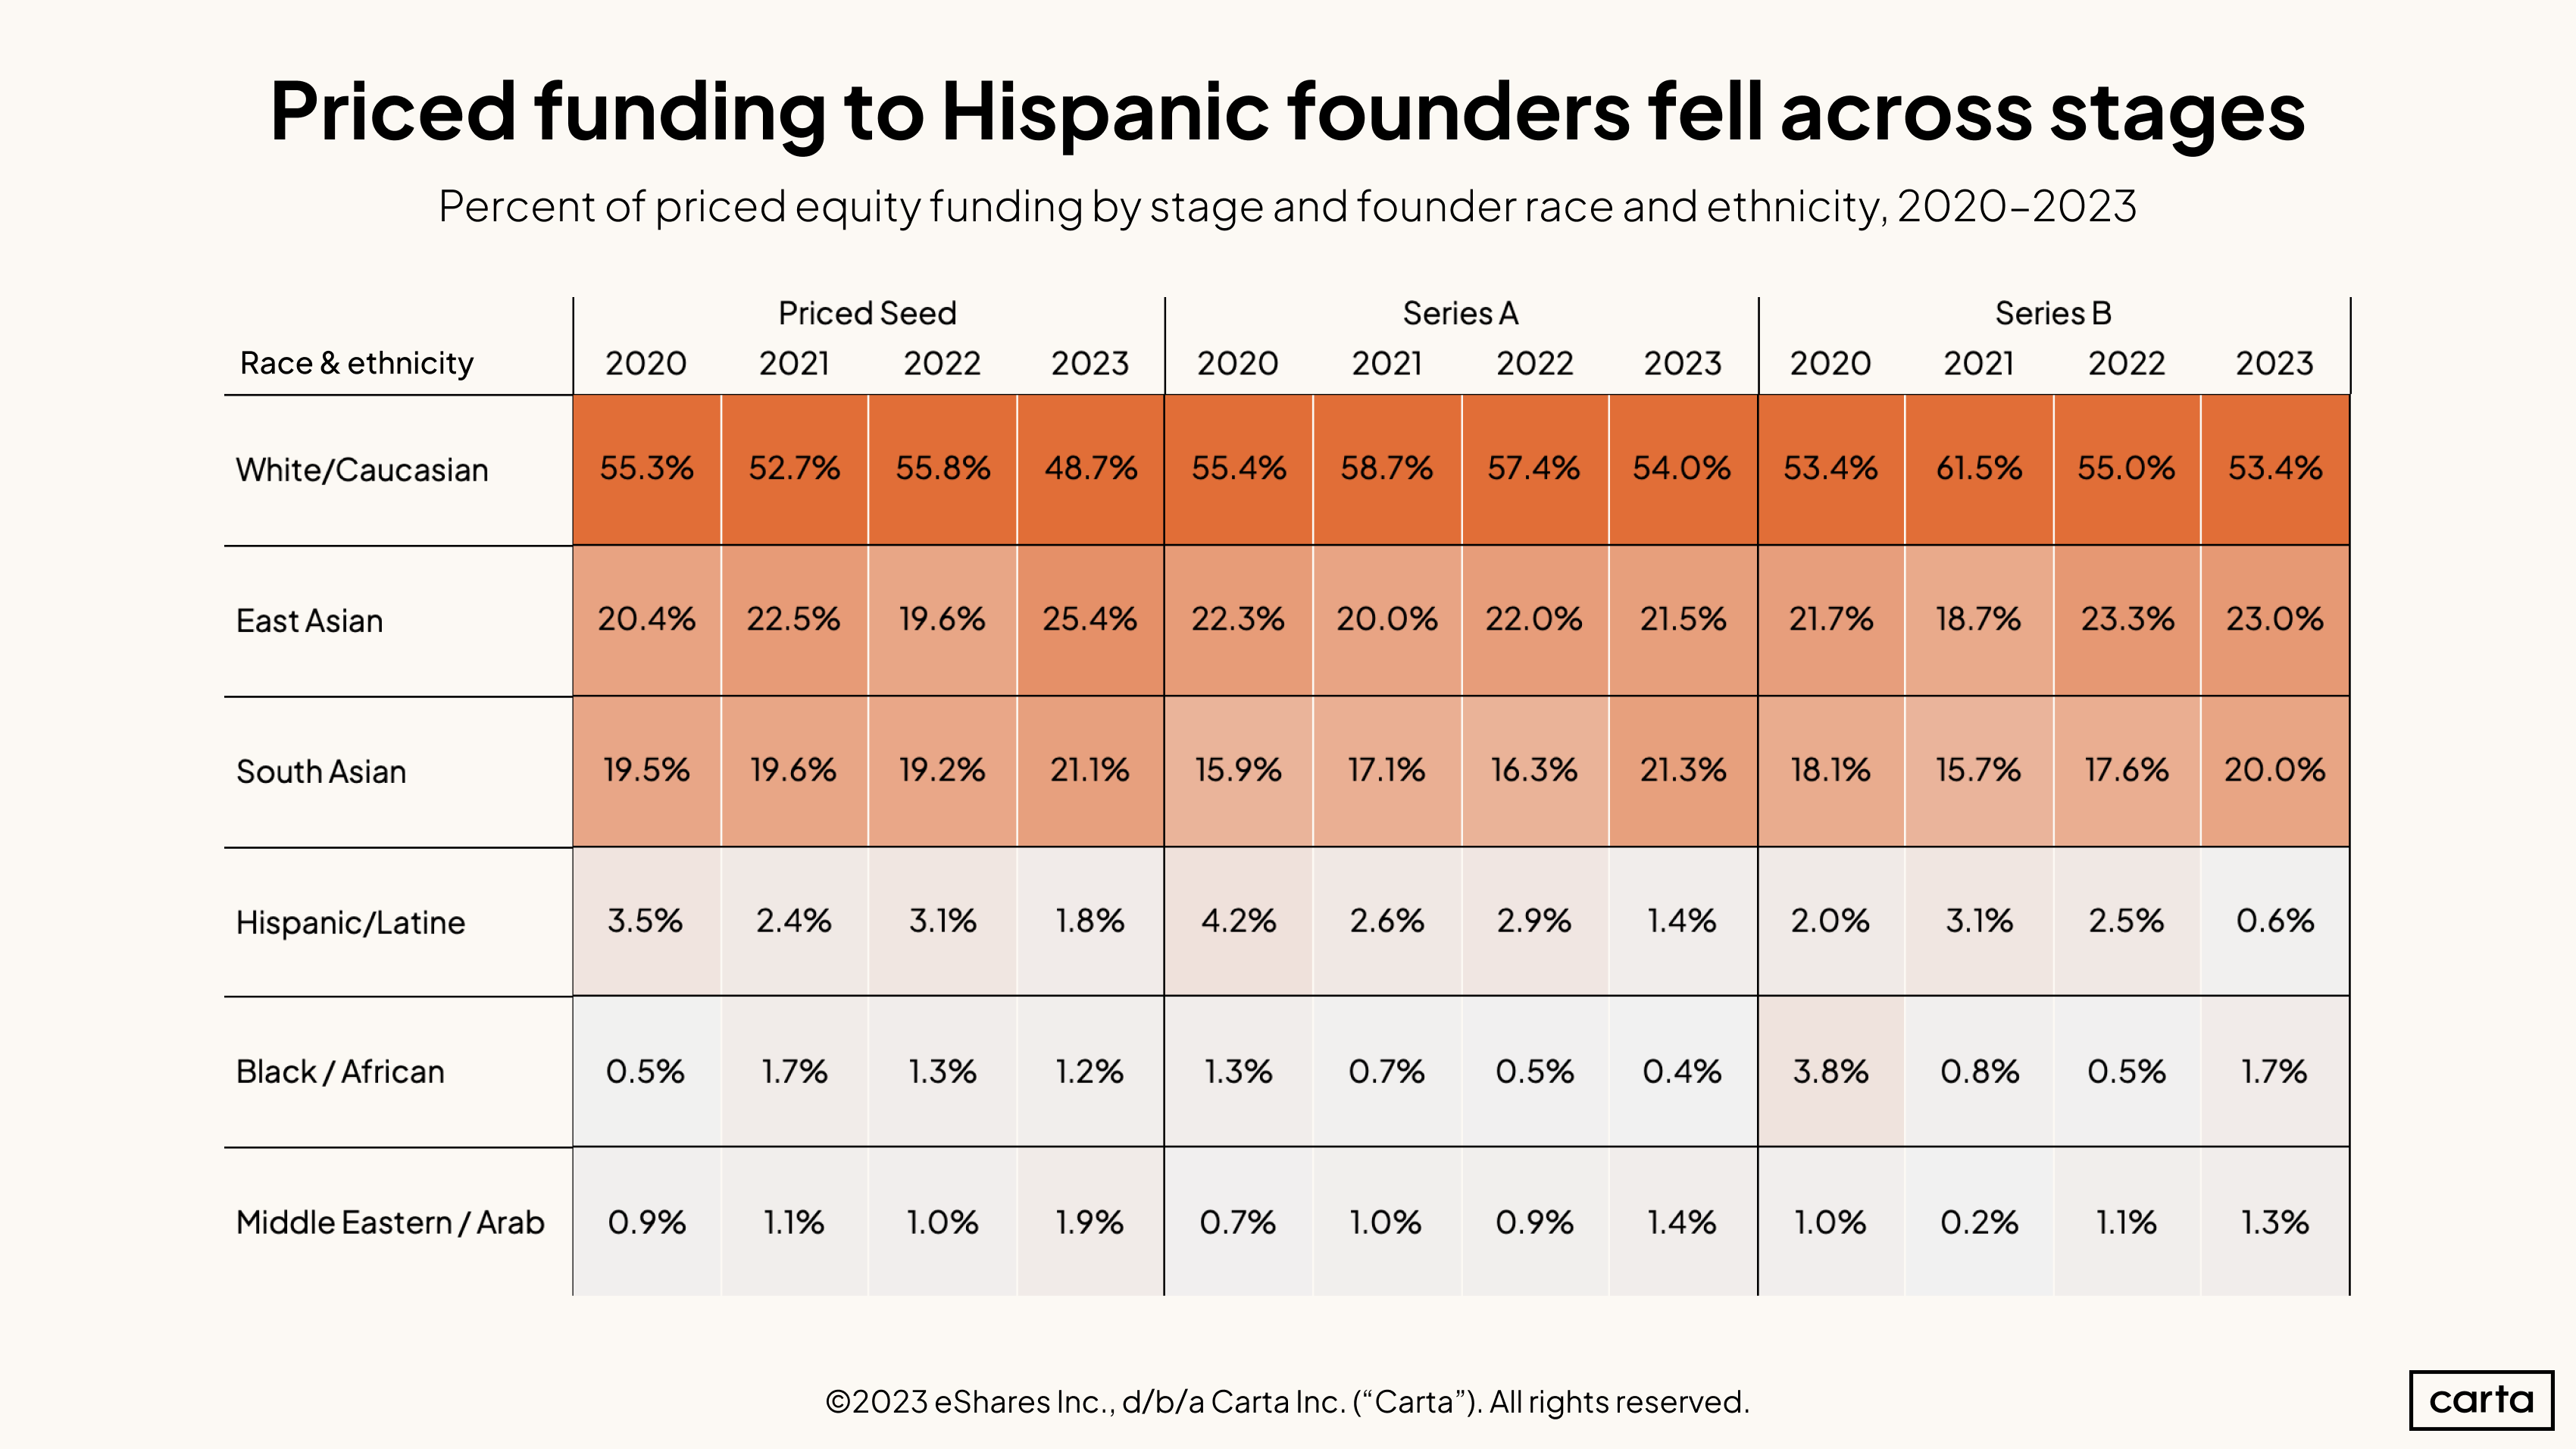
Investment in startups led by Hispanic founders declined significantly across seed, Series A, and Series B in 2023. The largest drop came at Series B, where the share of capital raised by Hispanic founders fell from 2.5% to 0.6%.
White founders raised 48.7% of overall seed funding in 2023, the lowest figure so far this decade by a substantial margin. Conversely, East Asian founders raised a much larger share of seed funding than in past years, climbing from 19.6% in 2022 to 25.4% in 2023.
South Asian founders raised a larger percentage of venture dollars in 2023 across all early stages than they did in 2022. The biggest gains were at Series A, where South Asian founders raised 21.3% of all venture capital put to work this year.
Methodology
The Annual Equity Report includes data from more than 1.5 million U.S.-based employee stakeholders who have been issued equity via the Carta platform and over 67,000 founders of corporations who manage their company equity on Carta. 215,685 Carta users have voluntarily submitted their demographic profile information for the purposes of aggregated, anonymized equity compensation analysis.
Sample sizes
We cover analyses only where we have sufficient data. From the point of view of ensuring anonymity, each data point must be backed by at least 10 entities (people or companies, typically) in order to be included. However, in most cases we have and require much more data than that to reach statistical significance or produce a legible pattern or trend.
Throughout this report, when discussing gender we only included men and women. This was because this year, there was not enough data regarding non-binary individuals to reach statistical significance. Gender indicated in the data is based on how individuals identified themselves.
Valuing equity
The notional value of an employee’s first equity grant, sometimes shortened to “equity value,” is calculated by multiplying the strike price by the total number of shares in the grant the employee was initially awarded in their role. It is different from the value that the employee may eventually be able to realize from the equity, which is largely driven by opportunities for liquidity and the price an employee is able to get when they sell.
This “equity value” allows us to compare the relative amounts that companies have offered to employees by demographics, geography, or job role and level. Because this number is generated when the equity is first granted, it allows us to compare equity compensation sooner than if we waited for the equity value to mature over time.
Equity granted at earlier company stages tends to have more uncertainty in its future value, which is reflected in lower strike prices in equity grants issued by early-stage companies. The notional value of equity as we are using it does not reflect any variance in the hypothetical possibility of upside between earlier- and later-stage companies (where the growth curve may be steeper the earlier one joins a company, but the attendant risk is likewise different). Nonetheless, we find this metric helpful to compare how companies are choosing to compensate different groups of employees by role, demographics, and location.
Race and ethnicity
Carta offers U.S.-based stakeholders a demographic profile page they can opt to fill out for the purposes of aggregated, anonymized equity compensation analysis. For people who hold multiple stakeholding roles on the Carta platform, their demographic information is attached to each role—such as employee and founder.
Eight percent of both employees and founders have self-reported their race and ethnicity data to date. Our historical demographic analyses will continue to change as this data becomes more complete each year.
“Hispanic & Latine” is an ethnic category that applies regardless of race; other races include only those who did not self-identify as Hispanic or Latine. We acknowledge that this does not fully represent intersectional identities.
We shorten “Black/African-American” to “Black,” and “Hispanic/Latine” to “Latine” for readability—though we know that those terms and the experiences of these groups aren’t identical. The category “East and Southeast Asian” is shortened to “East Asian” throughout the report for readability; this group includes those who the U.S. Census refers to as coming from the “Far East” or “Southeast Asia.”
Native Hawaiians and Pacific Islanders are included in “Other,” alongside people of Indigenous American and mixed backgrounds. This Other category is not visualized in many of the above charts as it is often a small sliver of the total data. As our dataset grows each year, we will look for opportunities to report on each of these groups.
Credits
Editorial: Kiley Roache, Kevin Dowd, Zoran Basich, Peter Walker
Data: Lucy Wang, Irvin Ding, Winston Van
Communications: Lauren O’Mahony, Tania Zaparaniuk, Jessica Capibaribe
Web: Alex Danoff
Leadership: Mita Mallick, Jane Alexander, Julia King
DISCLOSURE: This communication is on behalf of eShares, Inc. d/b/a Carta, Inc. (“Carta”). This communication is for informational purposes only, and contains general information only. Carta is not, by means of this communication, rendering accounting, business, financial, investment, legal, tax, or other professional advice or services. This publication is not a substitute for such professional advice or services nor should it be used as a basis for any decision or action that may affect your business or interests. Before making any decision or taking any action that may affect your business or interests, you should consult a qualified professional advisor. This communication is not intended as a recommendation, offer or solicitation for the purchase or sale of any security. Carta does not assume any liability for reliance on the information provided herein.
This study uses an aggregated and anonymized sample of Carta’s data. Companies that have contractually requested that we not use their data in anonymized and aggregated studies are not included in this analysis. This report contains links to articles or other information that may be contained on third-party websites. The inclusion of any hyperlink is not and does not imply any endorsement, approval, investigation, or verification by Carta, and Carta does not endorse or accept responsibility for the content, or the use, of such third-party websites. Carta assumes no liability for any inaccuracies, errors or omissions in or from any data or other information provided on such third-party websites.
All product names, logos, and brands are property of their respective owners in the U.S. and other countries, and are used for identification purposes only. Use of these names, logos, and brands does not imply affiliation or endorsement.
©2023 eShares, Inc. d/b/a Carta, Inc. (“Carta”). All rights reserved. Reproduction prohibited.