The headwinds battering the global economy caught up with the secondary market in Q3. Continued uncertainty over inflation, Russia’s war on Ukraine, rising interest rates, sinking stock prices, snarled supply chains, and the strength of the the U.S. dollar relative to other currencies combined to blunt investor confidence and slow secondary activity on Carta over the past three months, following several annual cycles of steady growth. The number of transactions completed in Q3 fell 51% compared to Q2.
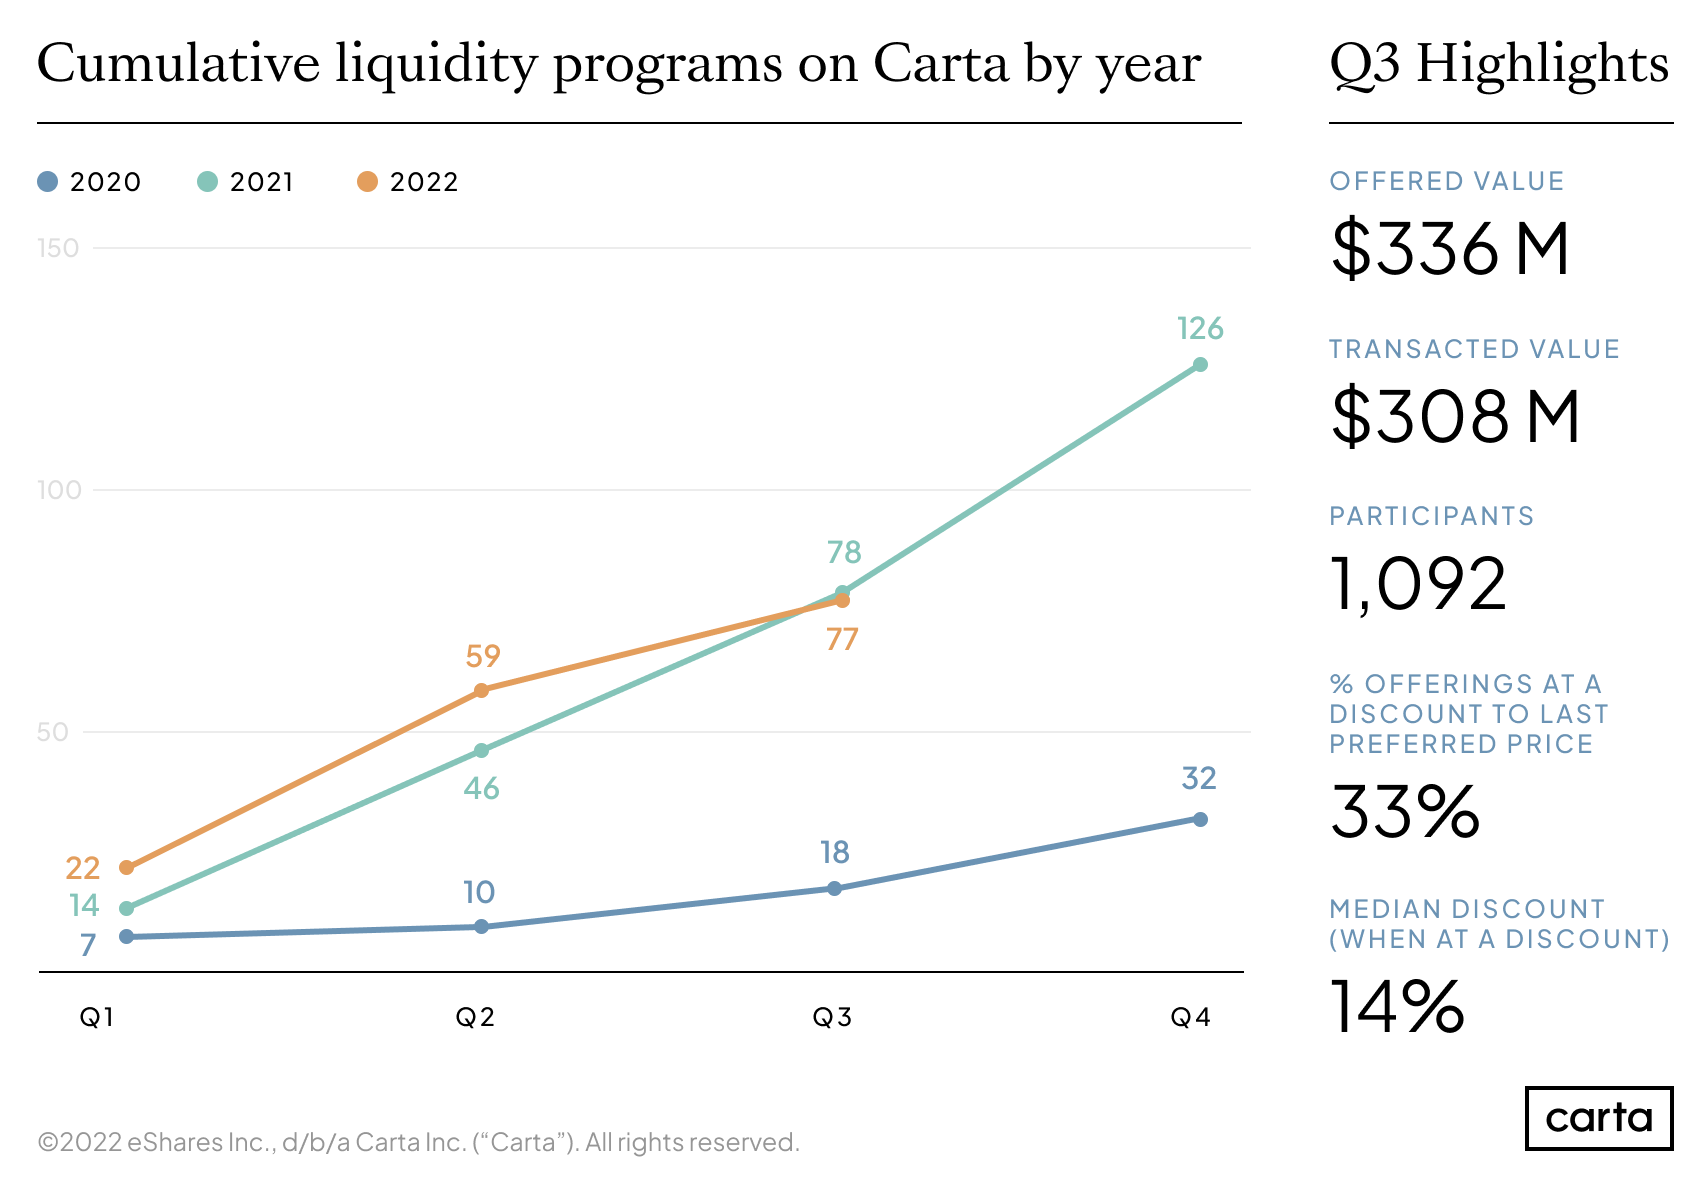
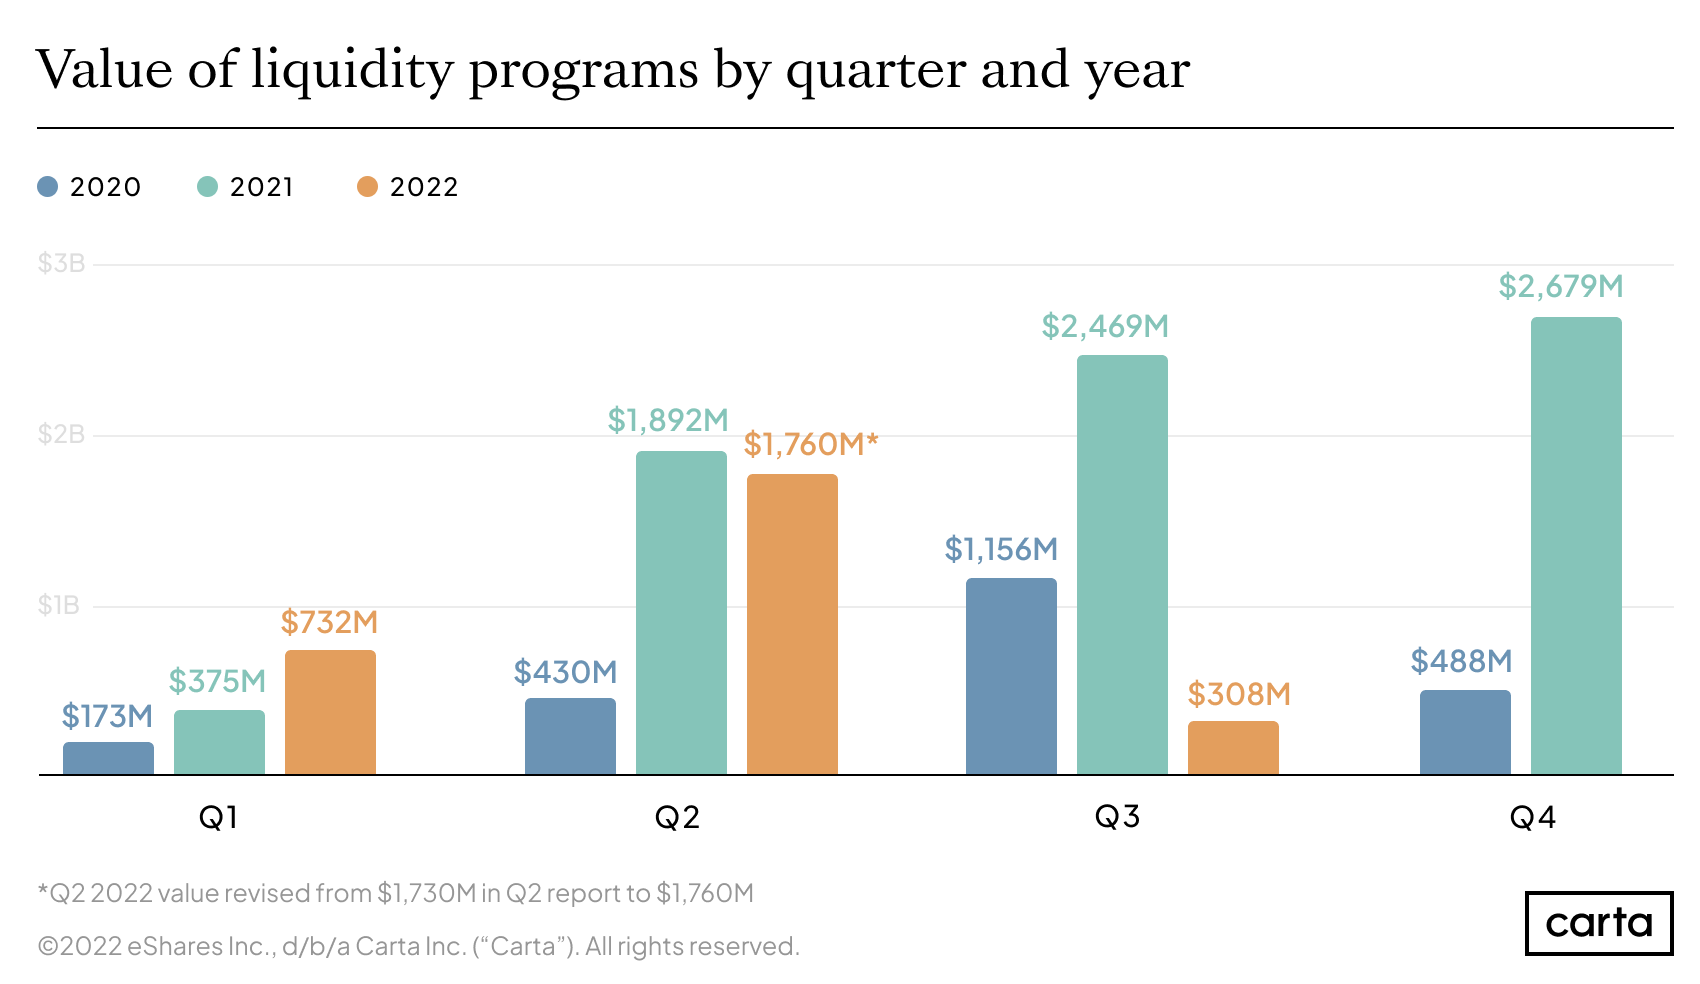
Nevertheless, total deal count for 2022 is roughly equivalent to the number of deals completed in the first three quarters of 2021. There have been 77 secondary transactions on Carta as of September 30 this year, with a combined value of $2.8 billion and involving more than 7,000 total buyers and sellers.
Markets have been volatile for most of the year. But earlier optimism that the economic impacts from that volatility might be short-lived is dwindling, replaced by a growing expectation among investors and companies that inflation, geopolitical disturbances, and high interest rates might linger well into next year.
Secondary deals are still getting done at fairly discounted valuations for quality private companies that demonstrate sustainable growth, large addressable markets, and long-term competitive moats. But overall activity has slowed and deal volumes have declined for two reasons. First, venture capitalists and other investors have taken a more cautious stance on investing in new startups in response to economic uncertainties. (Carta data shows that capital commitments to venture fund entities, a leading indicator of private company fundraising, fell in Q2 and declined further in Q3: As of October 28, 2022, capital commitments are down 71% quarter over quarter in Q3 and 84% year over year.) In addition, public market fluctuations and declining late-stage private valuations have created widening price expectations between buyers and sellers.
Potential buyers are seeking prices that correspond to lower valuations for comparable companies in the public markets, while some would-be sellers are hesitant to part with their holdings at a discount from their most recent post-money valuation. As a result, many companies seeking near-term secondary liquidity are choosing to delay transactions. Others are choosing to buy back shares in the absence of committed buyers in company-structured transactions.
Both sides remain tentative for now, but the balance of power has shifted in favor of buyers, owing in part to a building belief that inflated valuations of the past few years have reset.
Secondary deal volume, deal size, and seller participation may depend on how long investors and sellers believe the downturn will last.
The same trends restraining secondary activity have also stifled the public markets. While 2021 was the most lucrative year ever for global IPOs, all but one of the 50 U.S. tech companies to debut that year saw their prices dip by more than 20% after going public. That poor performance has left Wall Street on pace to log one of the worst years for IPO proceeds in three decades—and it’s caused investors to look more skeptically at prices in secondary deals.
Investors aren’t necessarily waiting for the broader market to return to its 2021 highs before ramping back up their secondary activity. Many are investing opportunistically now as they await more macroeconomic clarity. But they would like to feel more confident about the immediate future before dipping too far into their dry powder.
The Carta liquidity team is here to help you and your company navigate the evolving private markets. Write to us at company_coverage@cartacapitalmarkets.com.
Which companies are choosing liquidity?
Liquidity programs by stage
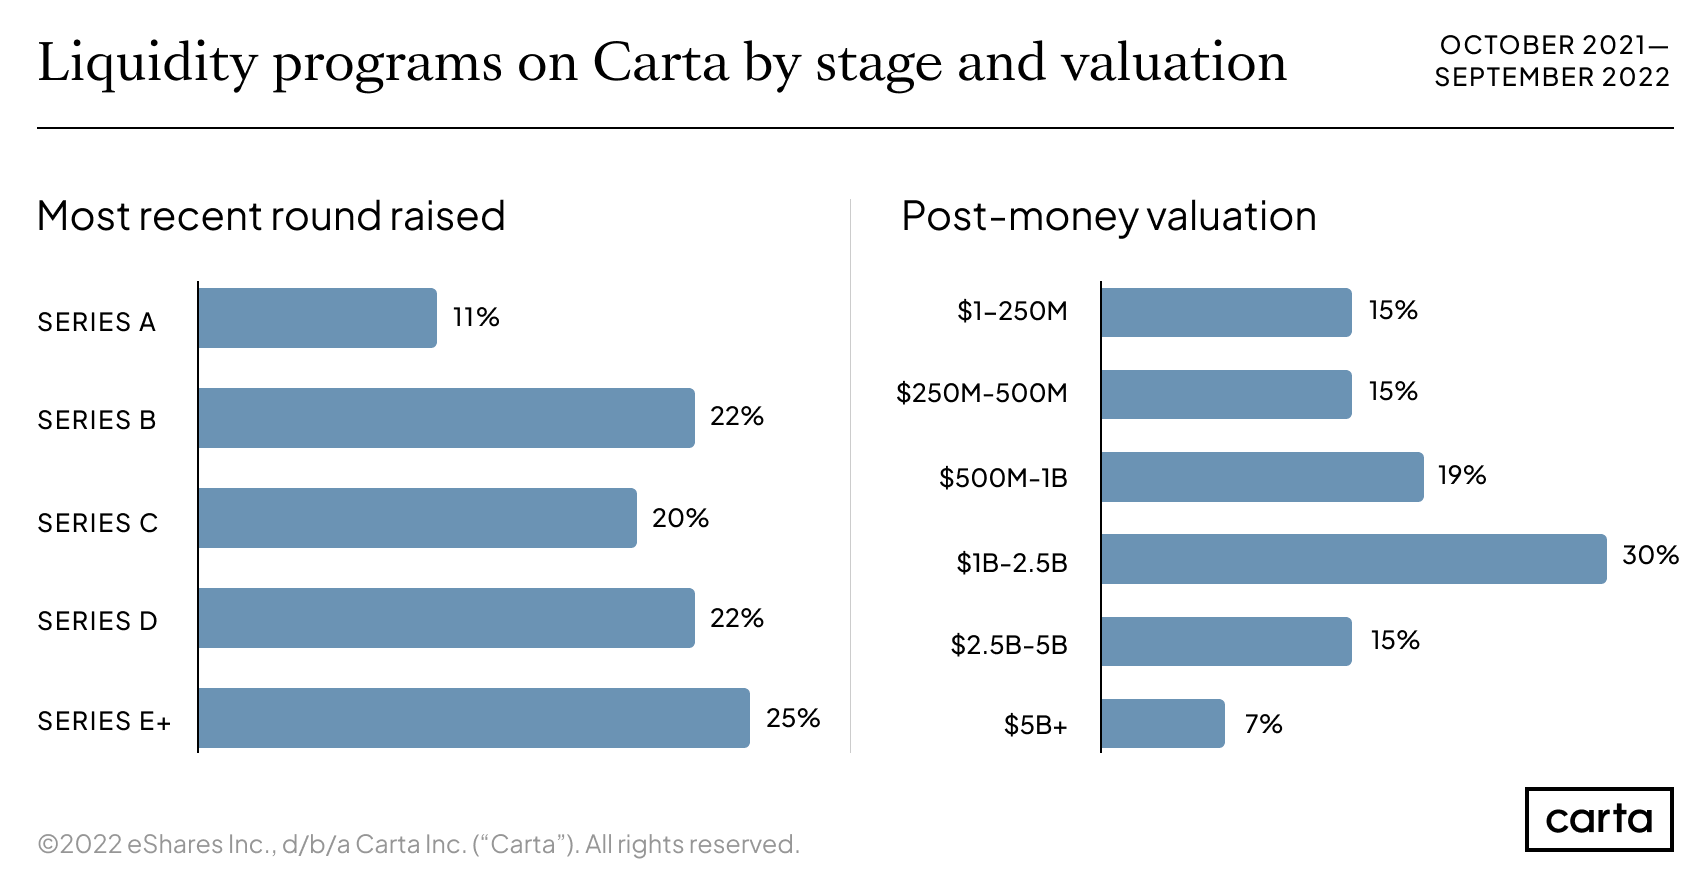
Among Carta cap table companies, late-stage companies have historically been the most active in terms of the number of secondary transactions they conduct. These more mature companies are more likely to have long-term shareholders who are hungry for liquidity. While companies at Series E or later continue to lead in number of transactions for the trailing 12 months, representing 25% of all transactions, this is a drop from 31% for the one-year period ending June 30, 2022.
Over the last several quarters, secondary activity shifted toward early-stage companies. So far this year, companies executing a secondary deal with Carta have been more likely to be coming off a Series B round than any other stage. This movement toward the earlier stages accelerated in Q3, with more transactions involving Series A companies than Series E+.
The distribution of programs by post-money valuation remained consistent with the prior one-year rolling period, with a median company valuation for companies seeking liquidity falling in the $1.0B–$2.5B range.
Liquidity transactions by valuation
Over the past 12 months, companies valued at $1B or higher accounted for 52% of all secondary transactions on Carta.
Looking at just Q3 2022, however, we find additional evidence of a shift toward earlier-stage companies transacting at lower valuations. More than a quarter of all secondary transactions in the past three months came from companies valued at $250M or less.
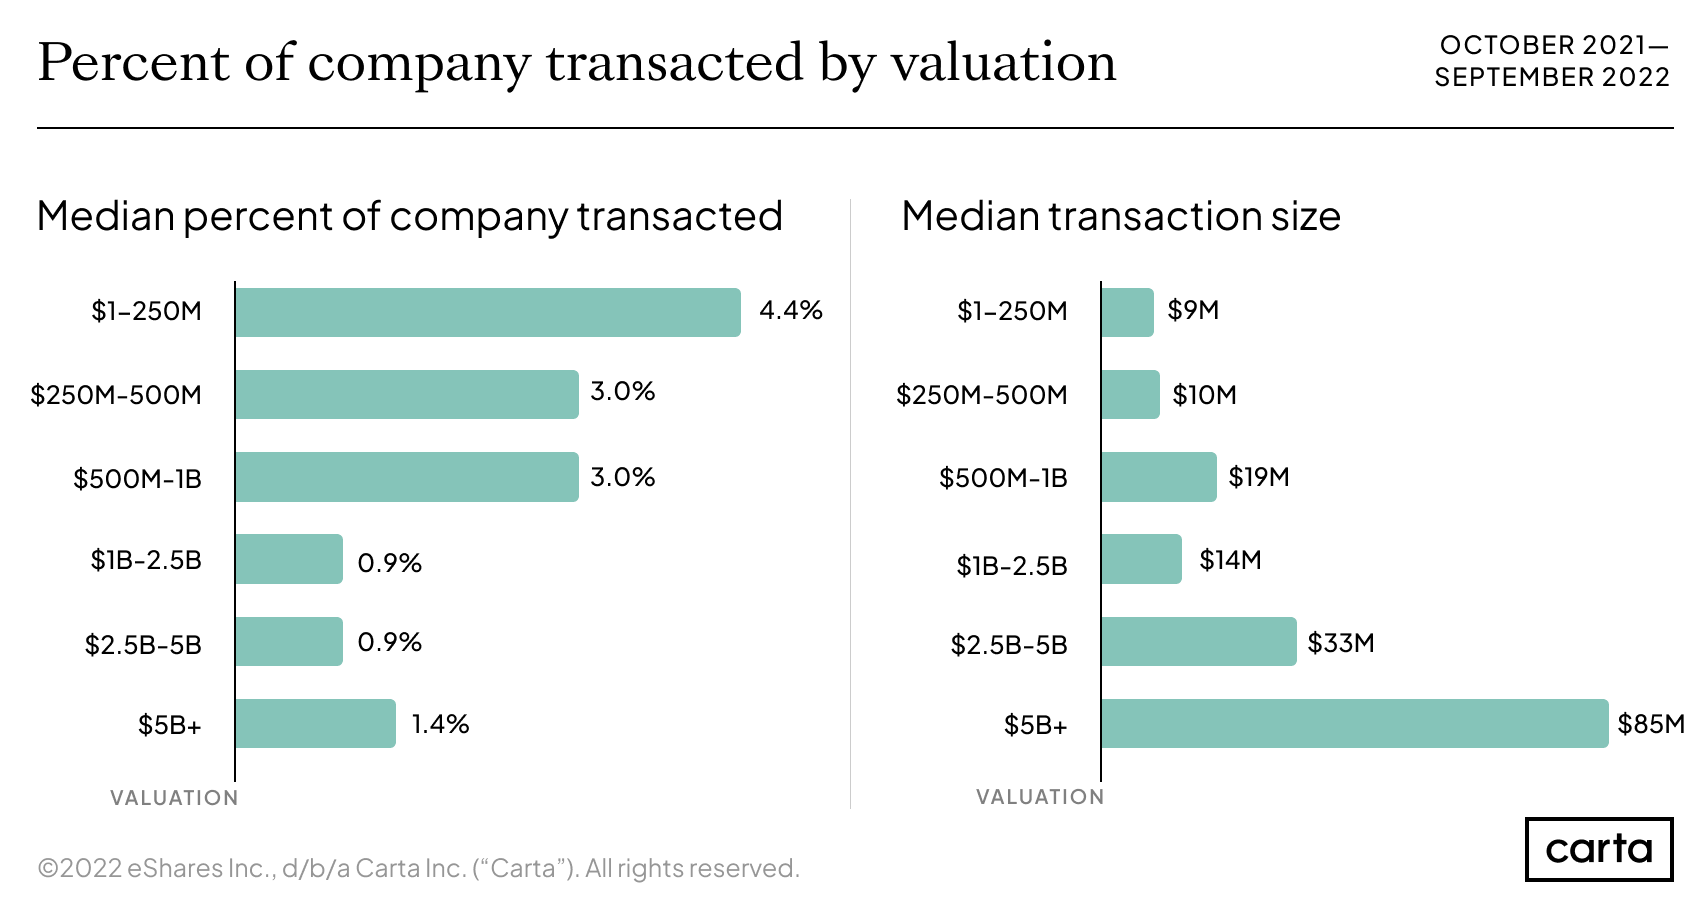
Companies valued at $5B or more had far and away the largest median transaction size over the past 12 months, at $85M. Among companies valued at less than $250M, the median amount of the company that changed hands was 4.4% in transactions over the last 12 months.
Companies worth more than $5B saw a higher median percent transacted than for companies valued between $1B and $5B over the past 12 months. This signals the growing liquidity needs for private companies as they mature past the timeframe that early investors expected for a public exit.
Which industries are using liquidity?
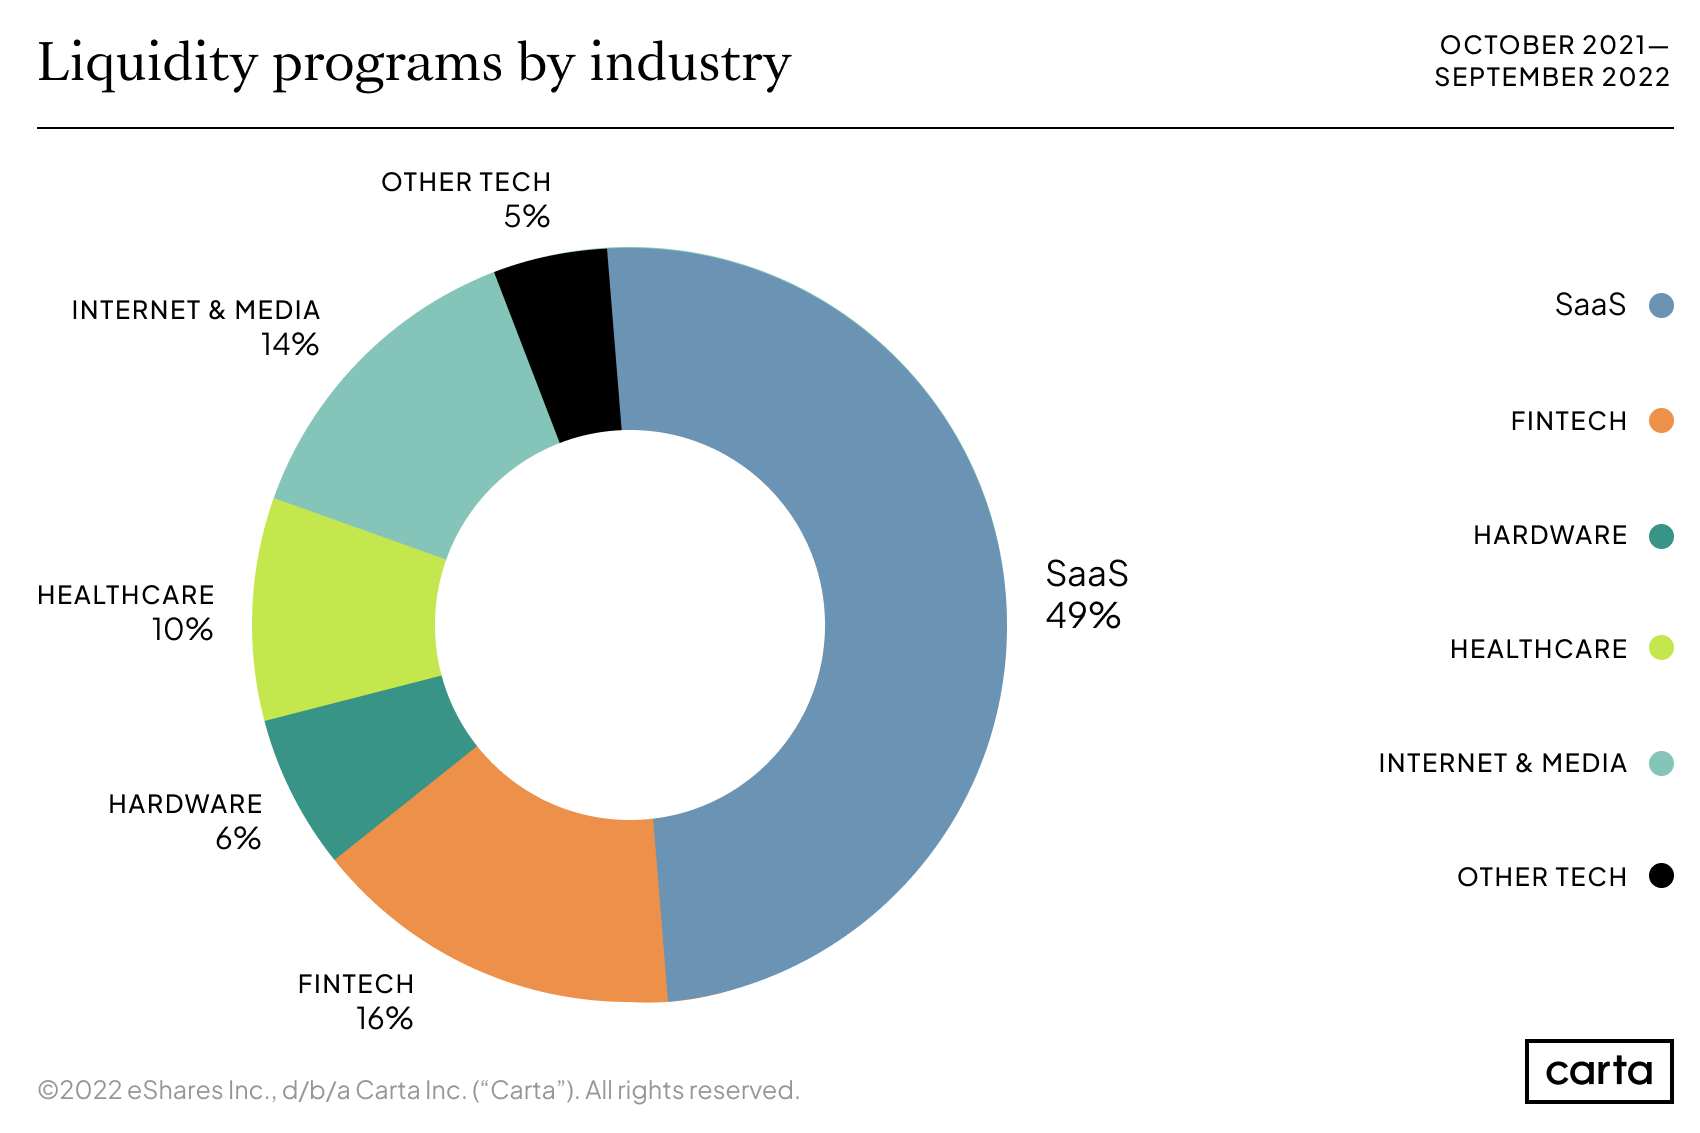
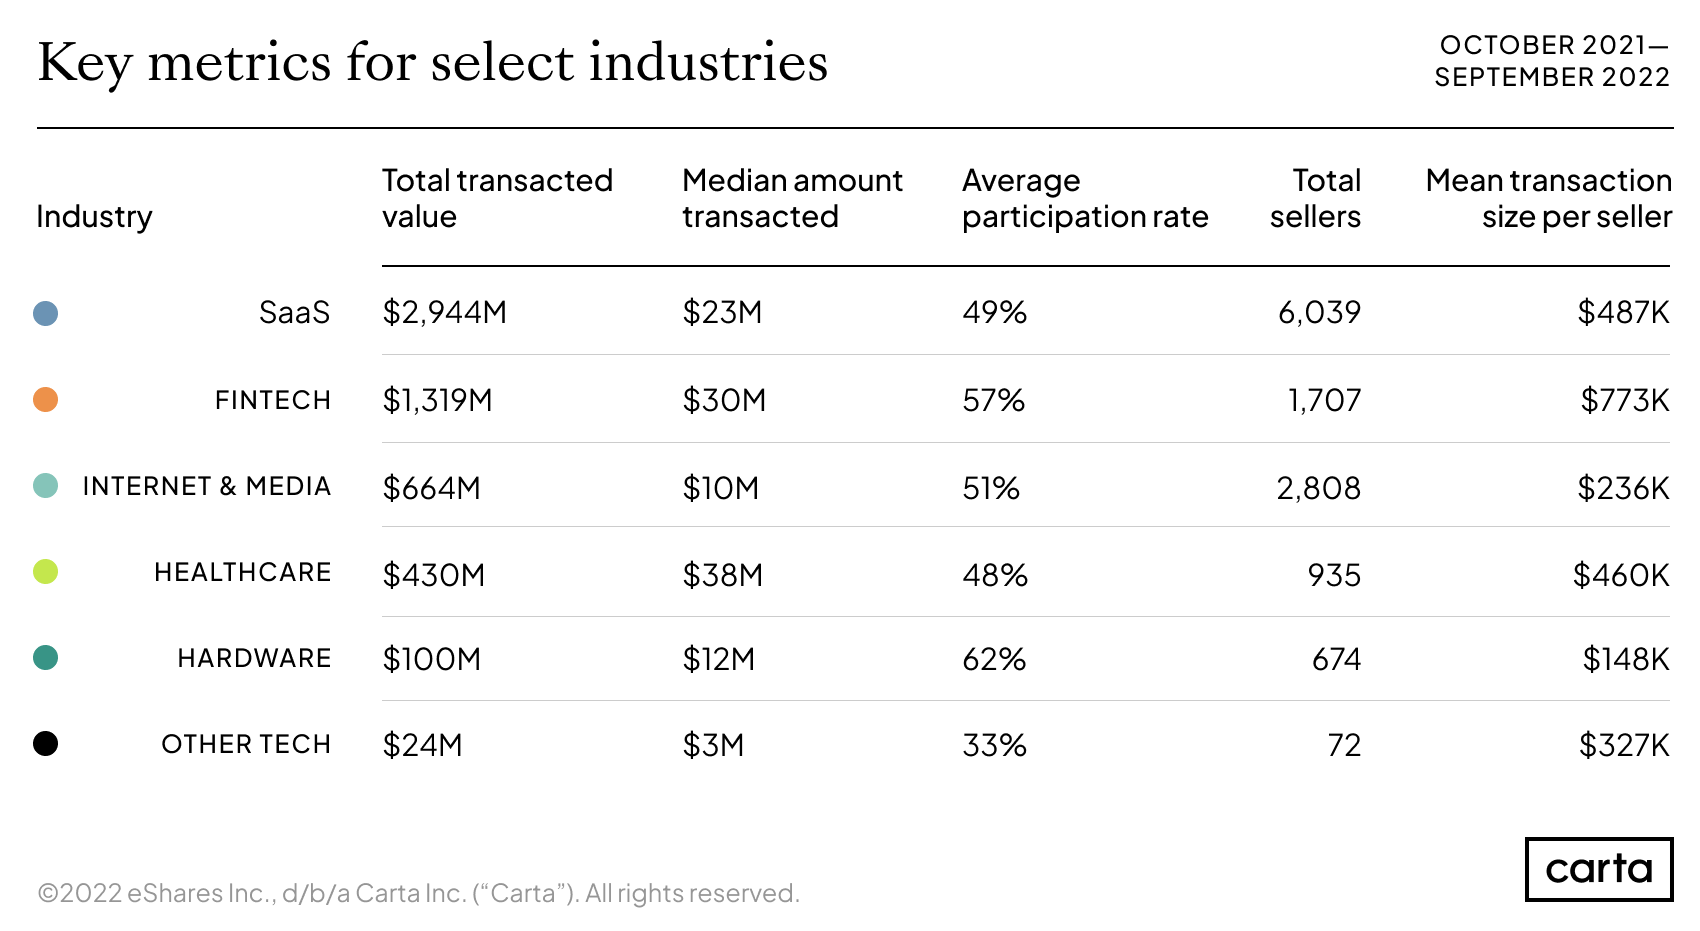
Secondary transactions remain most popular in the SaaS sector, which was home to nearly half of all liquidity programs and total sellers over the trailing 12 months as of September 30, 2022. SaaS includes various subsectors of the software as a service market (such as enterprise and marketing, security, ed tech, and internet of things, among other software subsectors) but excludes businesses that self-identify as fintech companies.
Overall participation by industry segment (in terms of number of secondaries transacted) is largely unchanged from the one-year period ending June 30, 2022.
Other industry highlights from the past 12 months include:
Healthcare saw the highest median transaction size, at $38M, followed by fintech at $30M.
The highest participation rate among eligible sellers was in hardware, at 62%. Fintech and internet & media were the only other sectors to surpass 50%.
The average transaction size per seller in fintech secondaries was $773,000, nearly 59% higher than any other industry.
How much value is changing hands?
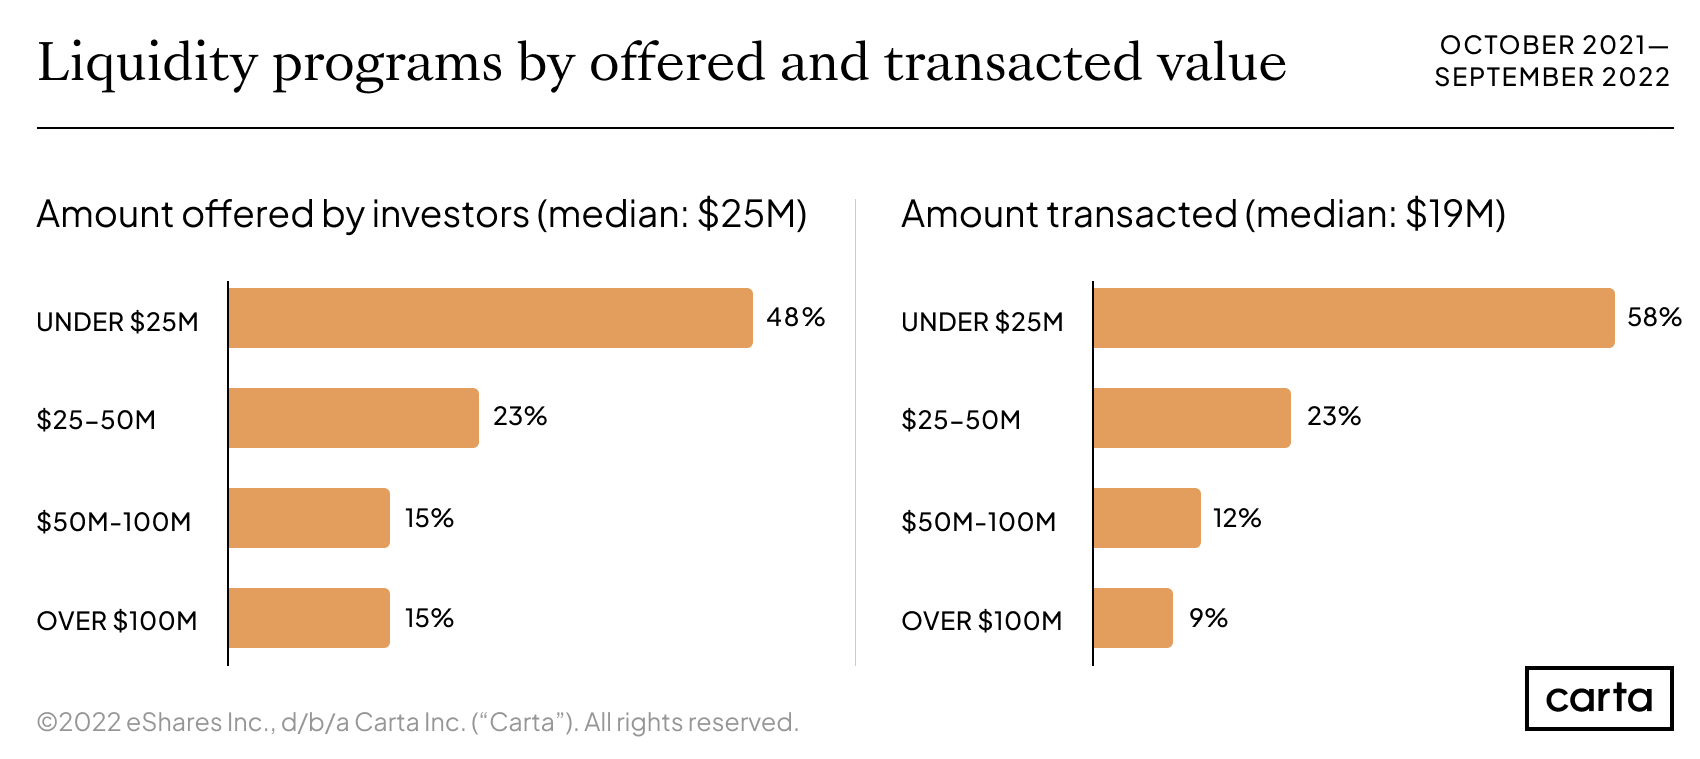
In line with broader market activity, the secondary market trended toward smaller transactions in Q3. As of June 30, the median amount offered the past one-year period was $35M. As of September 30, it was $25M. This subsequently led to a reduction in actual money transacted over the trailing 12 months from $24M in Q2 to $19M in Q3.
Deal sizes fell across all sectors over the past year, a clear indication of how the broader financial market has shifted from the roaring optimism of 2021 to the widespread caution of 2022. The SaaS industry looked like a potential exception in Q2, but the median transaction size fell back in line with general trends in Q3.
Subscription rates
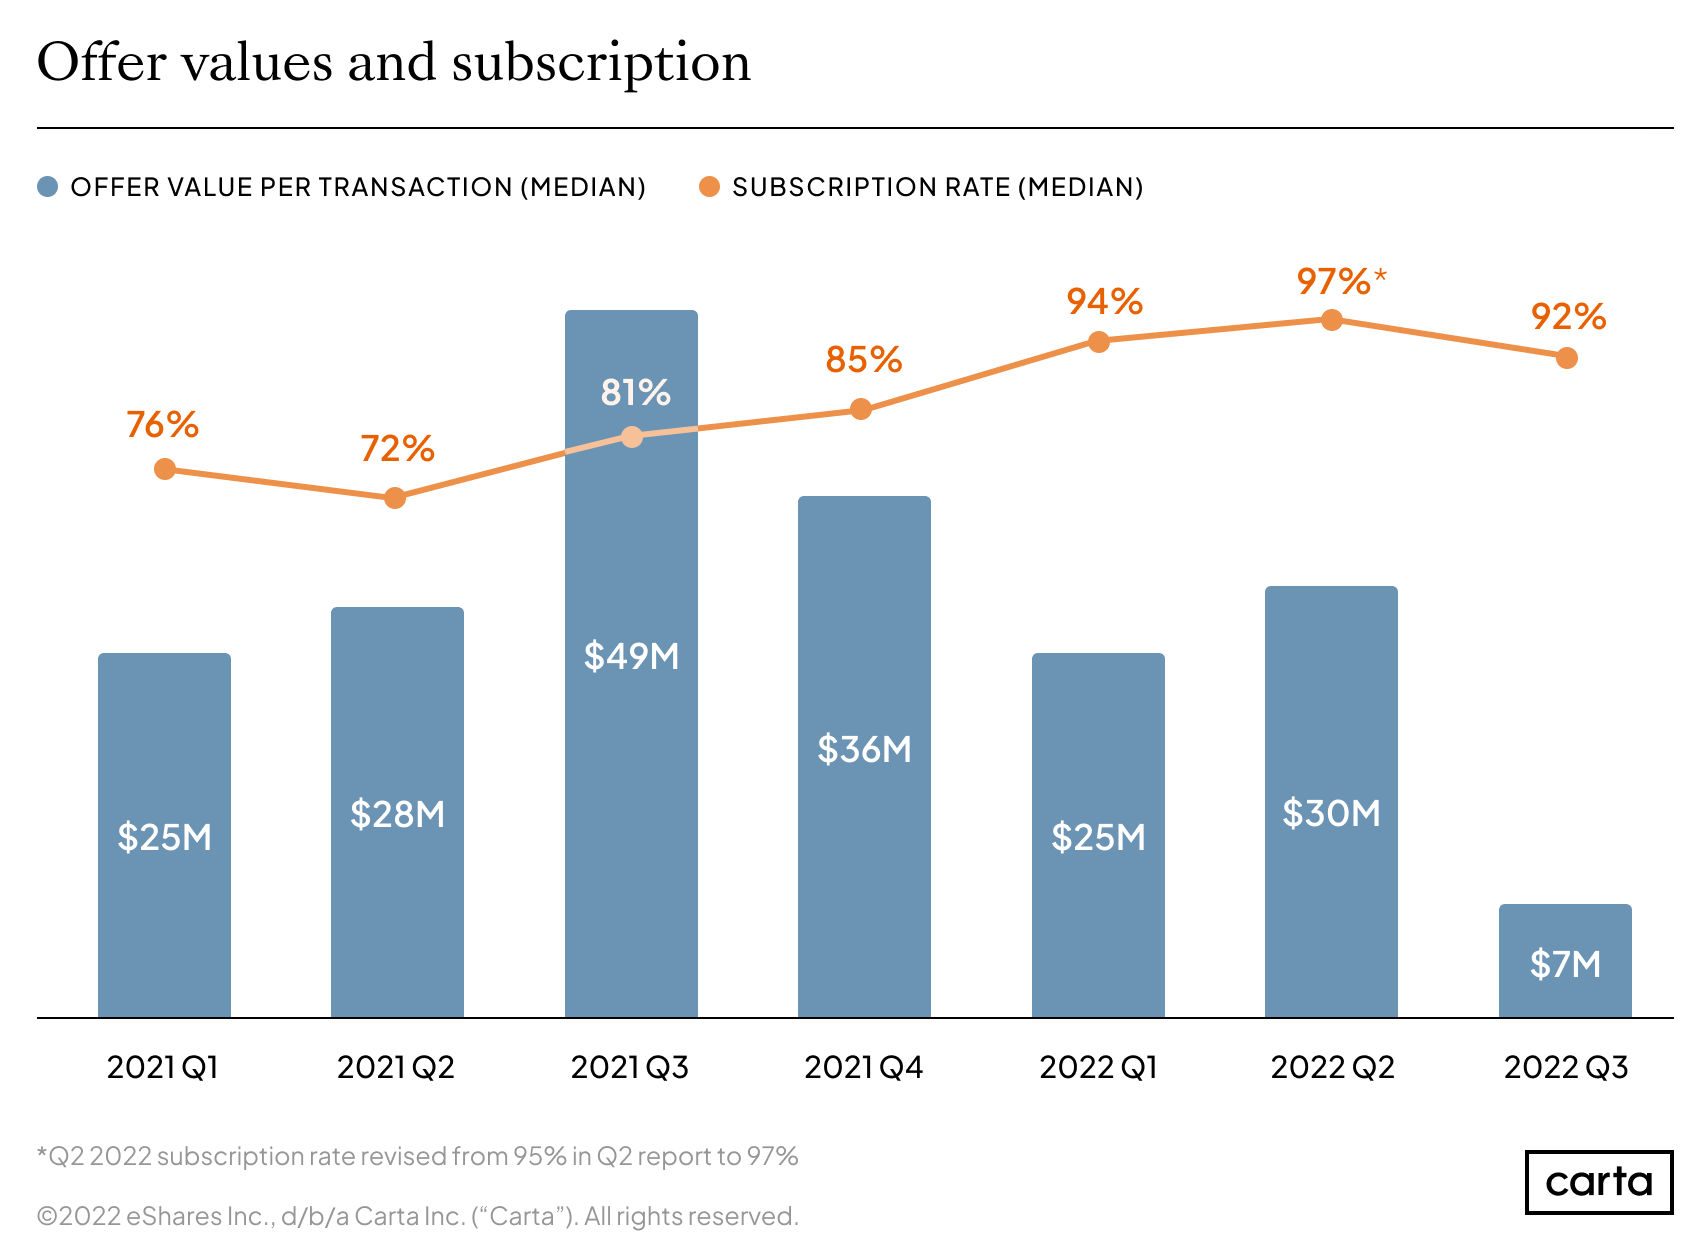
The median subscription rate dipped slightly in Q3: Half of secondary transactions on Carta saw sellers meet 92% or more of the demand from buyers—a decline of 5% from Q2. The subscription rate is still higher than any quarter prior to the start of 2022.
These relatively high subscription rates suggest it may be easier for buyers to acquire the shares they desire in 2022 than it has been in years past.
Who is choosing to sell equity?
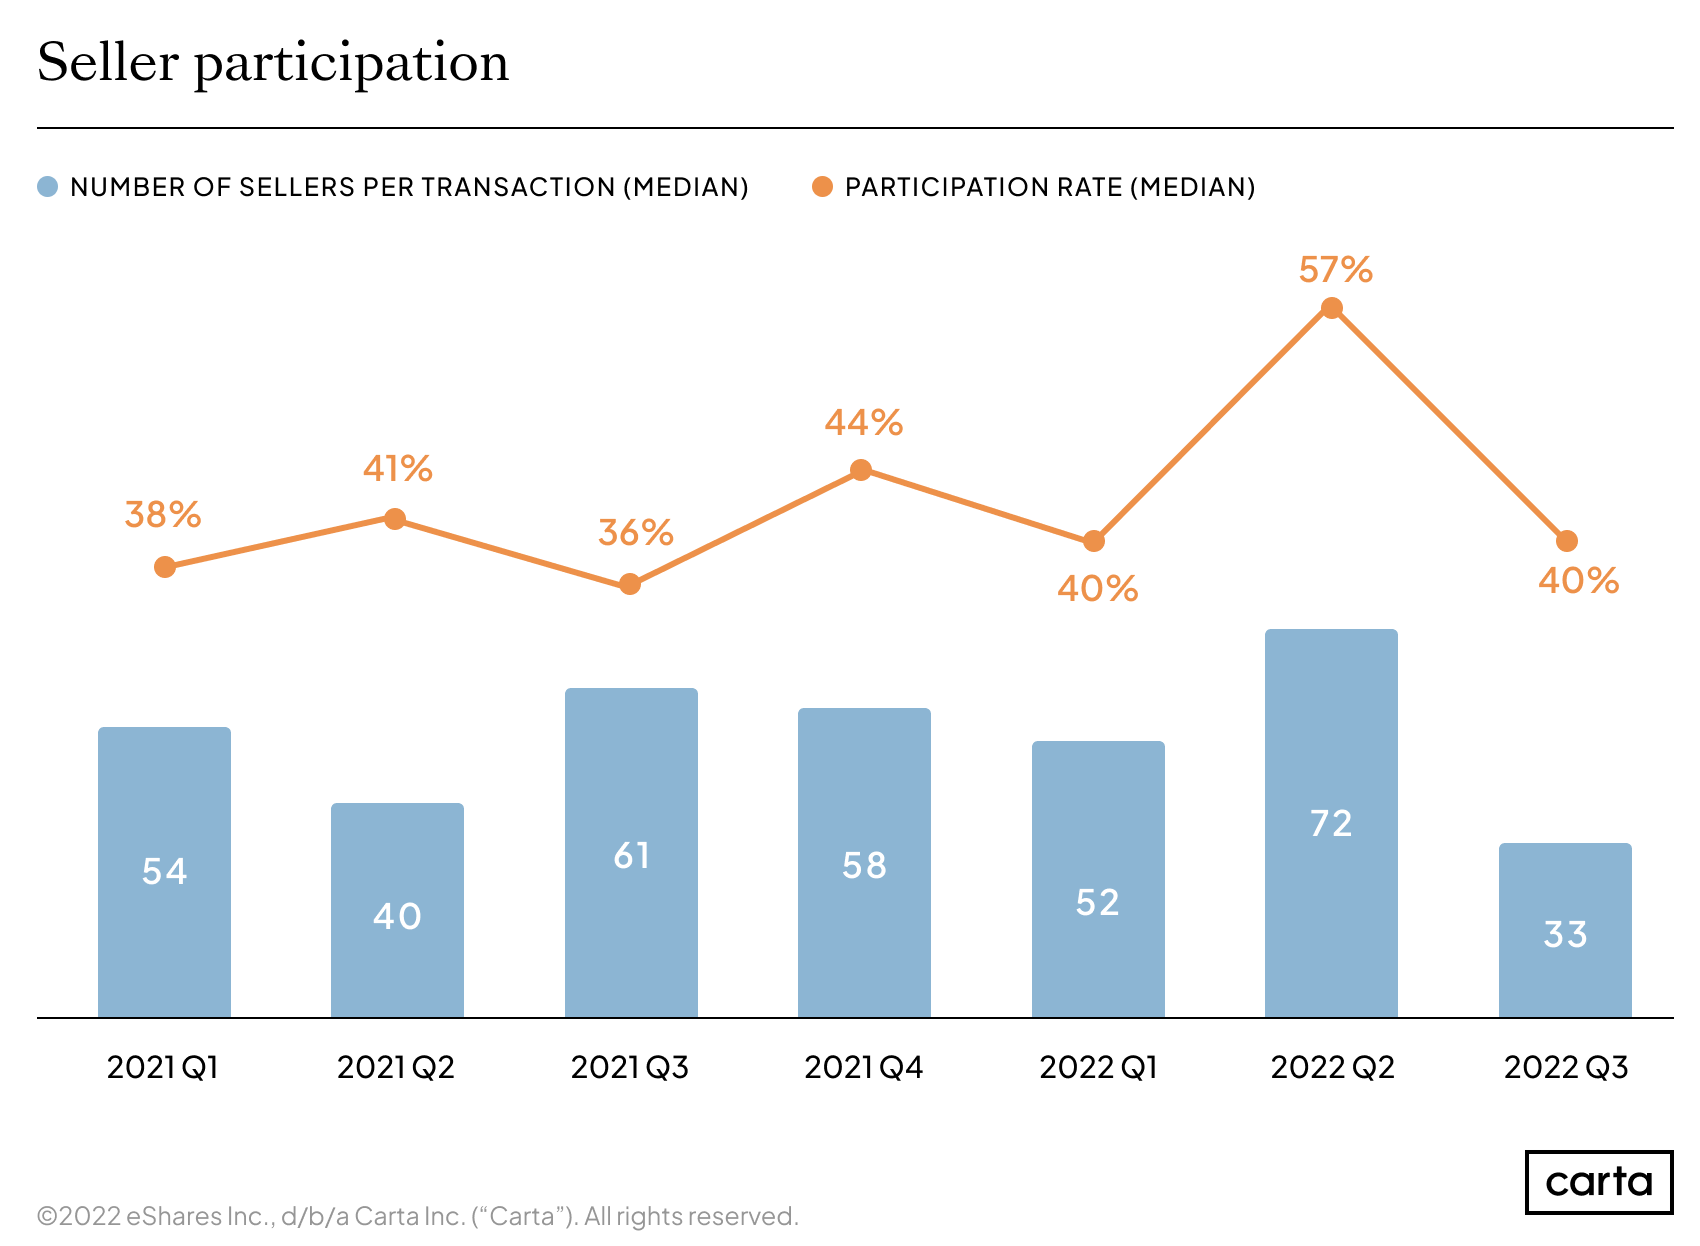
Although Q2 2022 saw both the median participation rate and the median number of sellers in a secondary transaction soar to new highs, those figures reversed in Q3, with the median seller count falling to its lowest point in the past two years. One cause could be that Q3 brought an increase in the percentage of secondary deals that involved all or mostly investors.
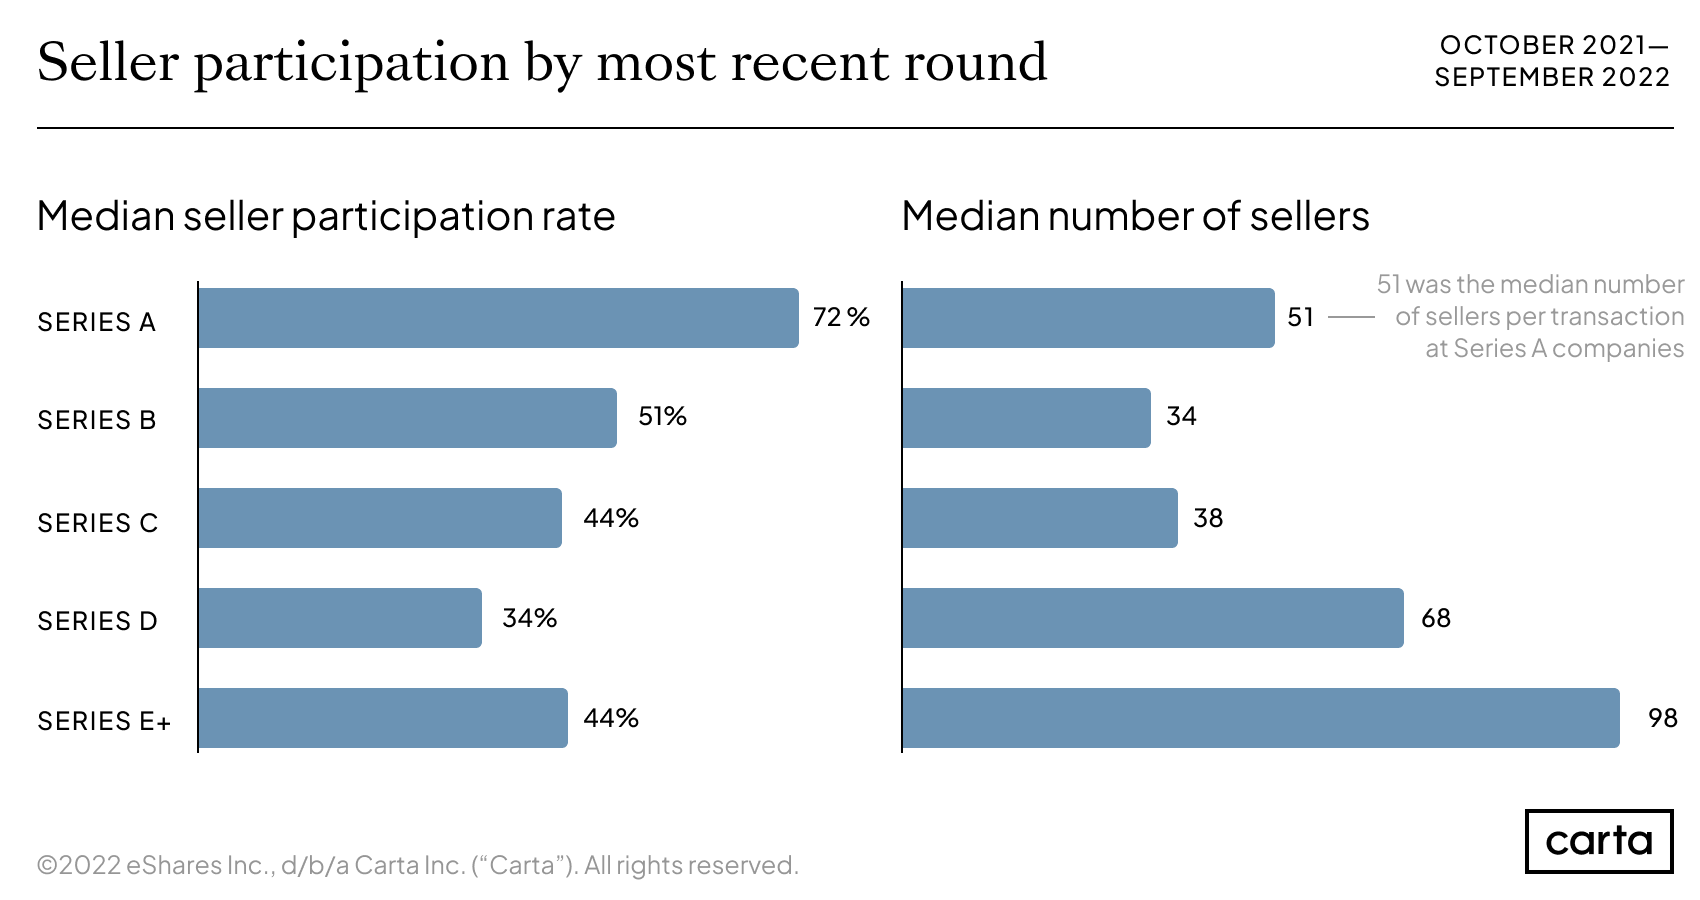
The median participation rate is far higher at Series A than at later stages, while the median number of sellers is highest at Series E+. This dynamic—more sellers, but a lower participation rate—demonstrates that the pool of eligible sellers is usually larger at later-stage companies. Some eligible shareholders may choose to hold onto their shares because they believe an IPO is imminent, once market conditions improve.
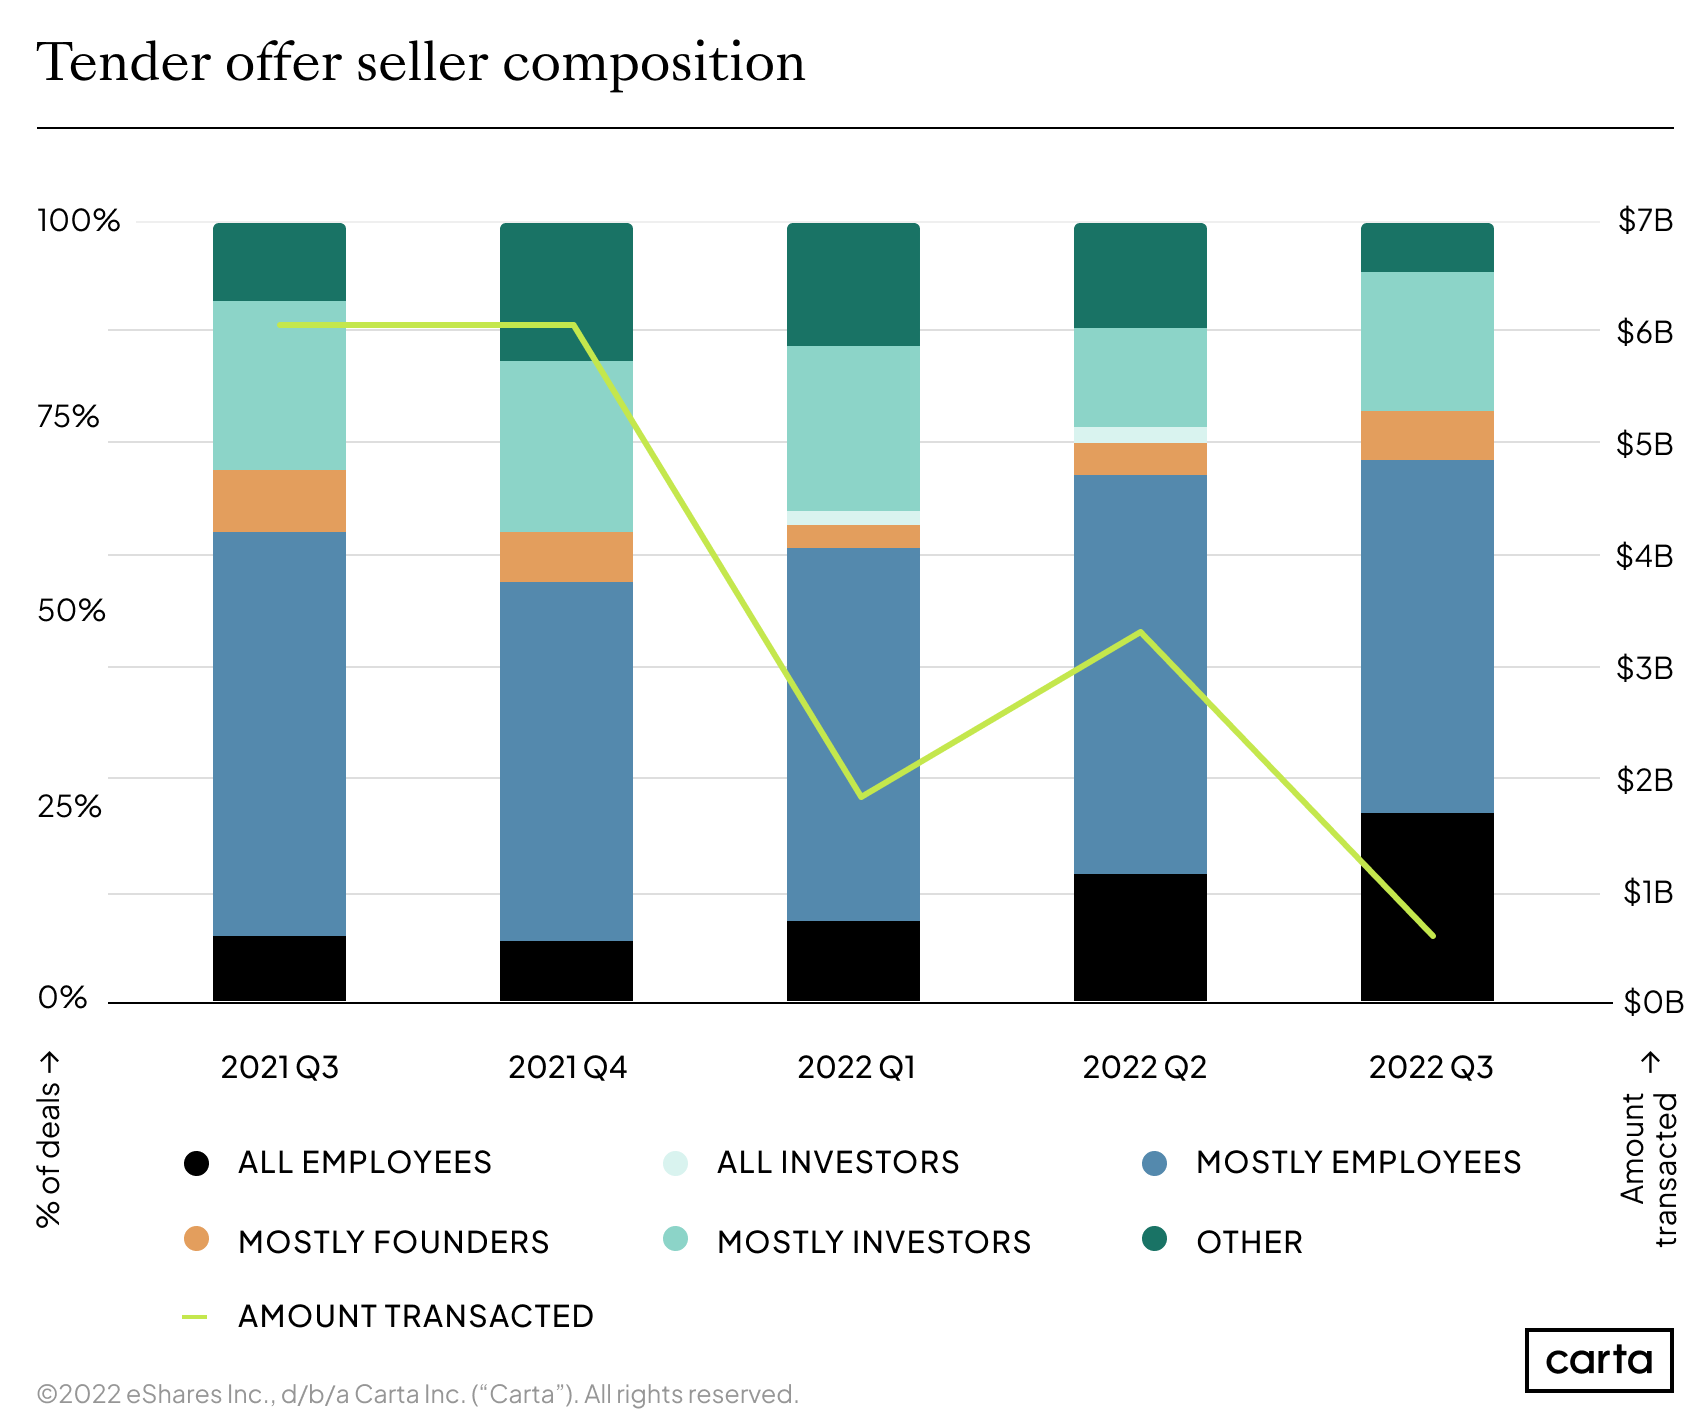
In most tender offers, the majority of sellers are employees. The percentage of tenders in which all sellers are employees has increased significantly year over year—and the percentage in which all sellers are outside investors has declined.
In some cases, companies are arranging secondary transactions as a benefit to longtime employees who are eager for liquidity—particularly companies that might have been planning an exit before the economic downturn of 2022. On the whole, tenders have grown more likely to include mostly or all employees over the past year.
You can also download this report as a PDF. For more data insights, sign up for Carta’s data newsletter.
Learn more about Carta’s liquidity programs at carta.com/liquidity or write to us at company_coverage@cartacapitalmarkets.com.
Methodology
Carta helps more than 32,000 primarily venture-backed companies and 2,100,000 security holders manage equity. Our liquidity report examines trends in secondary liquidity to promote transparency and to help investors, companies, and employees make informed decisions.
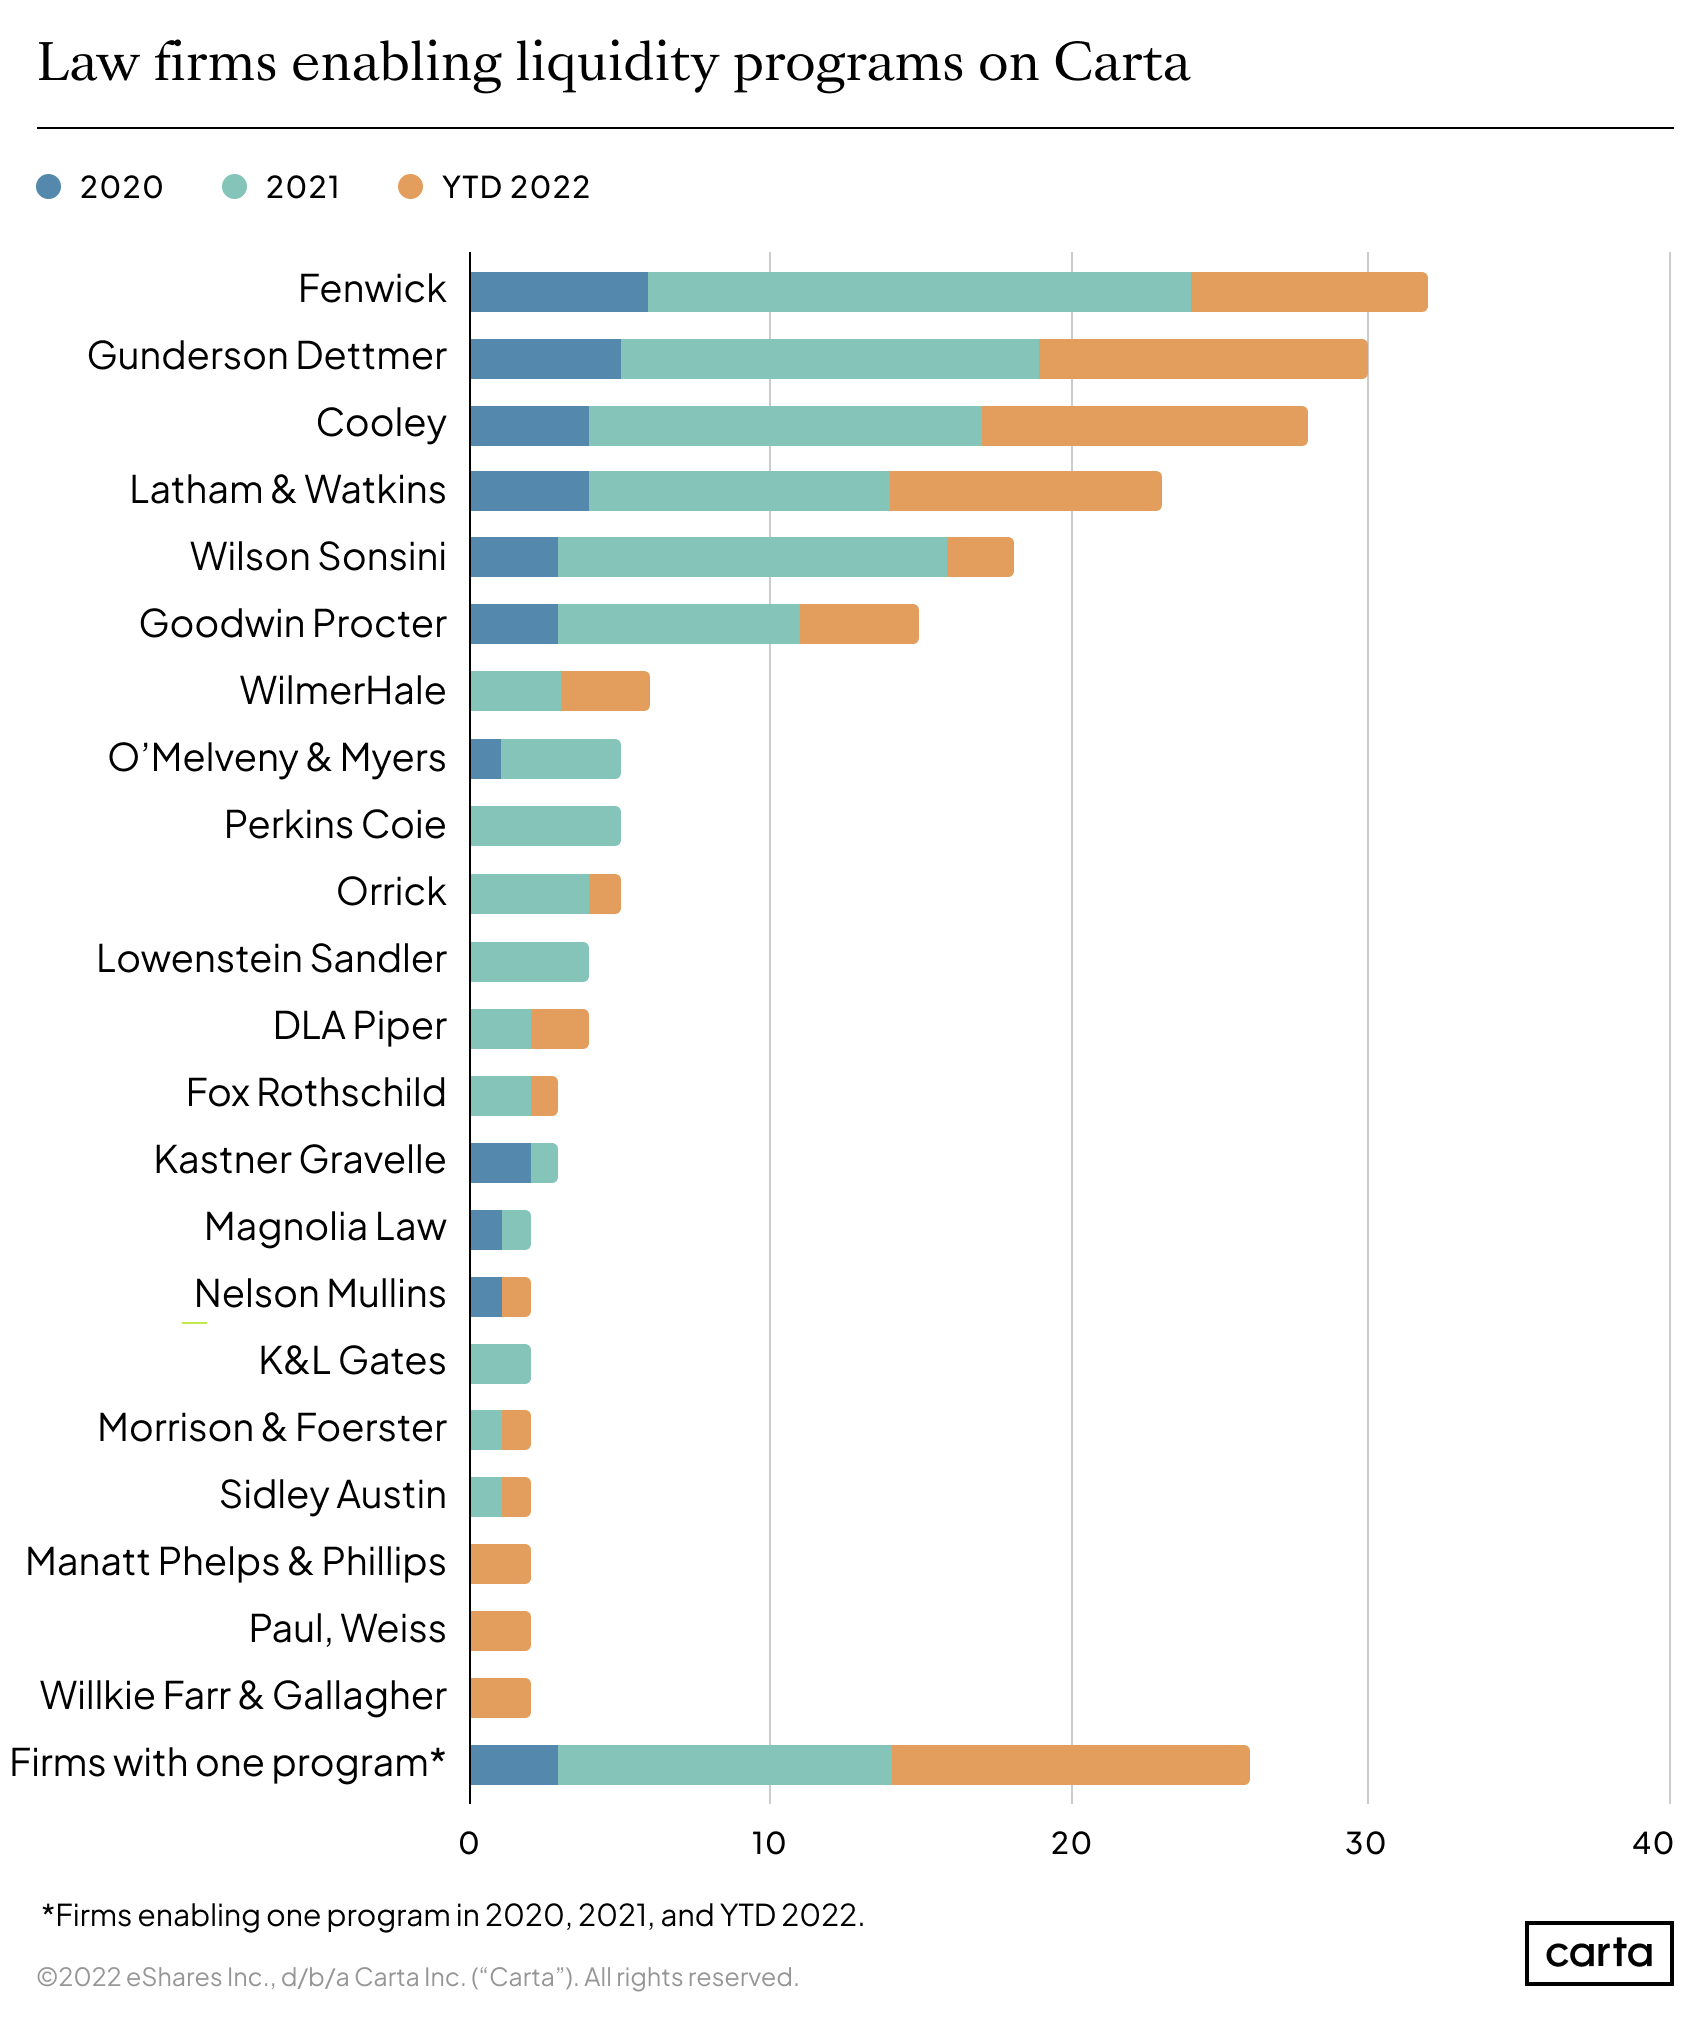
The data presented in this liquidity report includes snapshots as of September 30, 2022, of tender offers and other secondary trades conducted by Carta. With the exception of the list of law firms enabling liquidity programs, data used in this study is aggregated and anonymized.
Transactions are reported based on their settlement date. Historical data may change in future studies due to administrative lags for transactions to be recorded in Carta, or to reflect calculation updates and corrections. Industry groupings are based on self-reported industry information, which Carta completed and normalized for the purpose of this study.

DISCLOSURE: This publication contains general information only and eShares, Inc. dba Carta, Inc. (“Carta”), and its affiliates, are not, by means of this publication, rendering accounting, business, financial, investment, legal, tax, or other professional advice or services. This publication is not a substitute for such professional advice or services nor should it be used as a basis for any decision or action that may affect your business or interests. Before making any decision or taking any action that may affect your business or interests, you should consult a qualified professional advisor. This communication is not intended as a recommendation, offer or solicitation for the purchase or sale of any security. Carta does not assume any liability for reliance on the information provided herein. This report includes aggregate statistics of transactions on Carta, Inc. and CartaX. All product names, logos, and brands are property of their respective owners in the U.S. and other countries, and are used for identification purposes only. Use of these names, logos, and brands does not imply affiliation or endorsement. © 2022 eShares, Inc., dba Carta, Inc. (“Carta”). Carta Capital Markets, LLC, member FINRA/SIPC. All rights reserved.